Embed Size (px)
Citation preview
Federal Reserve Bank of New York
Staff Reports
Central Bank Dollar Swap Lines and Overseas Dollar Funding Costs
Linda S. Goldberg
Craig Kennedy
Jason Miu
Staff Report no. 429
January 2010
Revised February 2010
This paper presents preliminary findings and is being distributed to economists
and other interested readers solely to stimulate discussion and elicit comments.
The views expressed in the paper are those of the authors and are not necessarily
reflective of views at the Federal Reserve Bank of New York or the Federal
Reserve System. Any errors or omissions are the responsibility of the authors.
Central Bank Dollar Swap Lines and Overseas Dollar Funding Costs
Linda S. Goldberg, Craig Kennedy, and Jason Miu
Federal Reserve Bank of New York Staff Reports, no. 429
January 2010; revised February 2010
JEL classification: E44, F36, G32
Abstract
Following a scarcity of dollar funding available internationally to banks and financial
institutions, in December 2007 the Federal Reserve began to establish or expand
Temporary Reciprocal Currency Arrangements with fourteen foreign central banks. These
central banks had the capacity to use these swap facilities to provide dollar liquidity to
institutions in their jurisdictions. This paper presents the developments in the dollar swap
facilities through the end of 2009. The facilities were a response to dollar funding
shortages outside the United States during a period of market dysfunction. Formal
research, as well as more descriptive accounts, suggests that the dollar swap lines among
central banks were effective at reducing the dollar funding pressures abroad and stresses
in money markets. The central bank dollar swap facilities are an important part of the
toolbox for dealing with systemic liquidity disruptions.
Key words: banks, foreign exchange, swap, reciprocal currency arrangement, liquidity,
dollar
Goldberg, Kennedy, Miu: Federal Reserve Bank of New York. Corresponding author e-mail:
[email protected]. Stijn Claessens provided valuable discussant remarks at the Allied
Social Science Associations meetings, January 2010. The authors thank Adam Ashcraft, Chris
Burke, Richard Dzina, Steven Friedman, Michael Leahy, James McAndrews, Susan McLaughlin,
Patricia Mosser, and Anna Nordstrom for insights and extensive comments on related work. The
views expressed in this paper are those of the authors and do not necessarily reflect the position of
the Federal Reserve Bank of New York or the Federal Reserve System.
1
1. Introduction
The Reciprocal Currency Arrangements outstanding with foreign central banks (CB dollar swaps
hereafter), which began in December 2007 when the first swap lines of the crisis period were
established, were an important part of global policy cooperation that continued through the end
of 2009. In this article we provide an overview of the CB dollar swap facilities, show how they
changed in breadth and volume as funding conditions in the market and through these central
bank facilities evolved, and assess the economic research aimed at documenting the efficacy of
the CB dollar swaps. We conclude that the CB dollar swap facilities are an important part of a
toolbox for dealing with systemic liquidity disruptions.
We begin by providing context for the CB dollar swaps, examining the costs of U.S.
dollar funding in different locations. Section 2 focuses on the prices of dollars in private markets
and across tenors. Broad measures used to compare the relative cost of funds in private markets
versus through official liquidity facilities include the spread between the London Interbank Offer
Rate (LIBOR) and the Overnight Index Swap (OIS) rate, and foreign exchange (FX) swap
implied basis spreads, which reflect the cost of funding dollar positions by borrowing foreign
currency and then converting that foreign currency into dollars via an FX swap. Another piece of
evidence of disruptions to dollar markets is drawn from the intraday federal funds market. We
compare the average price of federal funds during morning hours with the average price over
afternoon trading. The differential cost was normally close to zero in the pre-crisis period
through August 2007, and thereafter evolved to reflect a substantial premium paid for federal
funds acquired in morning trading. This morning premium persisted through December 2008,
with highly elevated levels in the aftermath of the Lehman bankruptcy. Among alternative
explanations provided, we note this spread can be interpreted partially as a “Europe premium”
that evolved over the course of the crisis due to dollar demand by European banks that lacked a
natural dollar deposit base for meeting dollar funding needs.
Next, we provide a detailed overview of the CB dollar swap history (Section 3). In brief,
the Federal Reserve’s program for providing dollars to foreign markets evolved extensively since
it began in 2007, both with respect to the number of countries with swap agreements and with
respect to the amount of dollars made available abroad through these arrangements. The tenor of
2
funds made available through the dollar auctions also evolved over time, from initially being for
tenors of up to one month, then extended to tenors of up to three months, and then returned back
to primarily shorter tenor auctions. We show that, at the program’s peak, longer-term swaps
dominated the total amount outstanding. Net dollars outstanding through the CB dollar swaps
peaked at nearly $600 billion near the end of 2008, as banks hoarded liquidity over the year end,
with some of this demand for dollars unwinding in the post year-end period. Amounts
outstanding at the dollar swap facilities declined to under $100 billion by June 2009, to less than
$35 billion outstanding by October 2009, and to less than $1 billion at the program’s expiry on
February 1, 2010.1
We show the differential costs of accessing dollars at the numerous official liquidity
facilities, with the effective “all-in” cost of dollars at the various central banks deriving from the
specific facility designs and collateral policies. We also show that while funds through the dollar
swap facilities were competitively priced in the early stages of the crisis, as money market
functioning improved, the dollars acquired through overseas dollar swap facilities became
available at a higher rate relative to the Federal Reserve’s Term Auction Facility (TAF) and the
market rate for most borrowers. Dollar swap facility funds were typically priced close to 100
basis points higher than the dollars that banks, including some foreign banking organizations in
the United States, obtained at the TAF. Indeed with funds at the TAF priced below indicative
market rates for many banks, and with the minimum bid rate at the TAF the same as the rate of
interest on reserves, participation at TAF remained broad through much of 2009. By contrast, the
dollar auctions of other central banks had dollars priced above market rates that were available to
many banks. Overall, taking into account the consequences of the auction structures and
collateral considerations, we observe that the continued participation of some banks in the CB
dollar swap auctions through the first half of 2009 reflected persistent pockets of dollar market
supply shortages. This suggested continued credit tiering among banking counterparties and
potentially some self-selection of less creditworthy banks who continued to seek liquidity from
1 The February 1, 2010 expiration refers to the last day for the initiation of a swap, rather than the maturity. The Bank of Japan had a balance of $100 million in 29-day funds, initiated on January 14, 2010, that matures on February 12, 2010.
3
the central banks auctioning dollars.
We conclude this discussion of the dollar swap facilities with a discussion of the evidence
aimed at identifying the effects of the dollar swap facilities on liquidity conditions in financial
markets in the United States and abroad (Section 4). First, we discuss anecdotal accounts from
market participants – including dealers, brokers, and bank treasurers – who argue that the CB
dollar swaps contributed to improved conditions in markets. Second, we argue that despite the
overall improvement, there remained credit tiering in access to liquidity. One piece of suggestive
evidence comes from the Euro Interbank Offered Rate (EURIBOR) panel, which suggests that
FX swap implied basis spreads on dollars were quite different across banks with different
strength ratings. By comparing the interest cost of euros for stronger, more moderate, and lower
rated financial institutions in Europe, we conclude that the degree of credit tiering peaked in
November 2008 and remained elevated well into the third quarter of 2009. Third, we discuss the
key findings, as well as the limitations, of a range of relevant econometric studies. In brief, the
main methodology utilized is a type of event study which tracks the consequences for financial
variables of announcements about liquidity facilities, whether these pertain to amounts to be
offered, scope of access, or actual auction dates. Based on effects on financial market spreads,
the studies conclude that the TAF and CB dollar swaps have played important roles in bringing
down the cost of funds, especially when dollar liquidity conditions were most stressed. However,
while these results are compelling, we note the difficulty in using such studies as conclusive
metrics of market effects.
Section 5 concludes the paper with more forward-looking comments on the importance of
currency swap facilities as part of the toolbox for central banks dealing with crisis management
and resolution.
2. Pressures in Dollar Funding Markets
Before turning to the evolution of the dollar swap facilities, in this section we provide an
overview of the initial pressures in dollar funding markets, and the evolution over time of these
pressures. We consider some measures of the cost of funds across markets and tenors, showing
how these evolved over the period covered by the CB dollar swaps.
4
2.1. Demand for Dollars. To provide perspective on the pressures banks faced in the crisis
period, we begin with the issue of how many U.S. dollars foreign banks needed and how these
dollar needs were satisfied. In brief, both the high level of U.S. dollar-denominated assets that
European banks’ were exposed to, both on- and off-balance sheet, and their heavy reliance on
short-term, wholesale markets to fund these assets exacerbated the significant strains in funding
markets in 2008 and into 2009.
The foreign-currency exposures of European banks had grown significantly over the
decade preceding the crisis, with dollar exposures accounting for half of the growth in European
banks’ foreign exposures over the period from 2000 to 2007 (McGuire and von Peter 2009a).
European Union, United Kingdom, and Swiss banks’ on-balance sheet dollar exposures were
estimated to exceed $8 trillion in 2008. Prior to the crisis, this exposure was funded from money
market funds ($1 trillion), central banks ($500 billion), and the foreign exchange swap market
($800 billion), while the remainder was funded by interbank borrowing, flows from U.S.-based
affiliates, and other sources.2 Off-balance sheet exposures to other contingent lines of credit and
wholesale-funded conduits likely intensified the demand for dollars among European financial
institutions. European banks (and other non-U.S. banks) lack a dollar-denominated retail deposit
base and had grown increasingly reliant on wholesale funding sources to meet these expanding
U.S. dollar liquidity needs.
Nearly all of these funding sources came under extreme stress in Fall 2008 as escalating
credit and liquidity concerns evolved into a much broader systemic issue after the failure of
Lehman Brothers, as has already been well-documented. In particular, the offshore wholesale
market for dollars – i.e., the eurodollar market – and the FX swap market experienced
particularly heightened strains. These strains were evident in the commonly cited LIBOR-OIS
spread and the spread between the FX swap implied dollar funding cost and LIBOR (the FX
swap basis), both of which reached historically wide levels in September 2008.
2 See Baba, McCauley, and Ramaswamy (2009) and McGuire and Von Peter (2009a) on the exposure funding. On flows from U.S. affiliates, see Cetorelli and Goldberg (2008, 2009) and global bank liquidity management through internal capital markets.
5
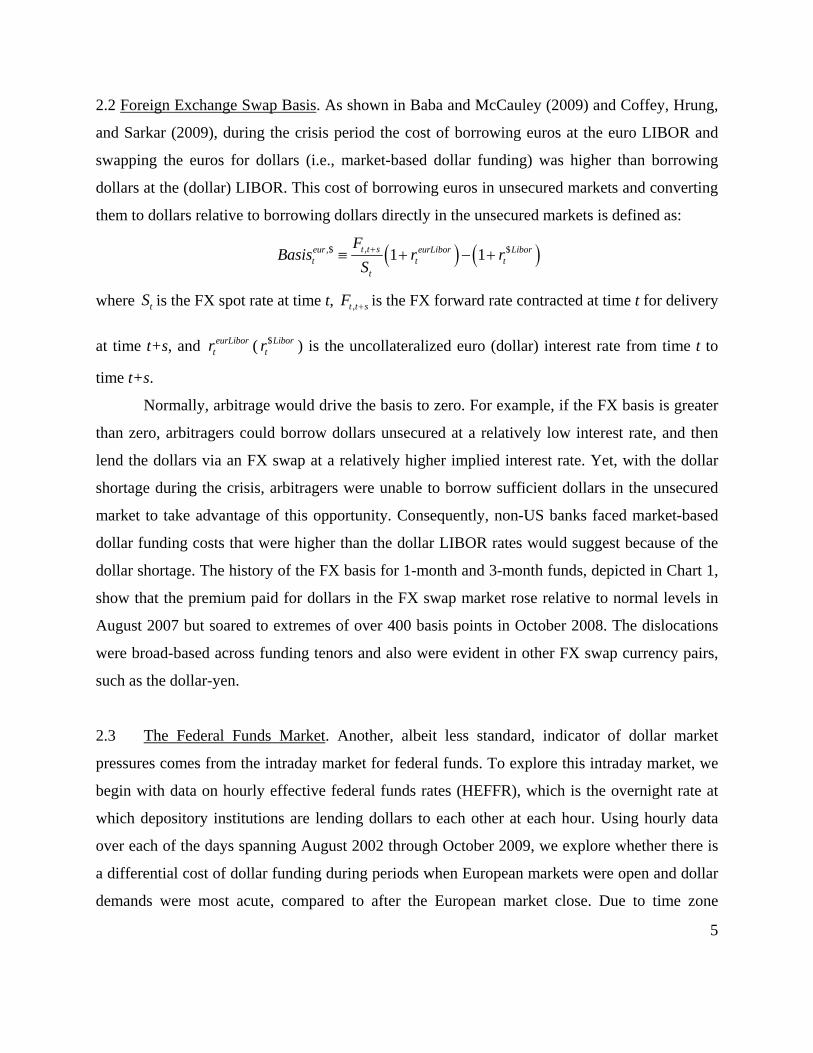
2.2 Foreign Exchange Swap Basis. As shown in Baba and McCauley (2009) and Coffey, Hrung,
and Sarkar (2009), during the crisis period the cost of borrowing euros at the euro LIBOR and
swapping the euros for dollars (i.e., market-based dollar funding) was higher than borrowing
dollars at the (dollar) LIBOR. This cost of borrowing euros in unsecured markets and converting
them to dollars relative to borrowing dollars directly in the unsecured markets is defined as:
,,$ $1 1t t seur eurLibor Libort t t
t
FBasis r r
S
where tS is the FX spot rate at time t, ,t t sF is the FX forward rate contracted at time t for delivery
at time t+s, and eurLibortr ( $Libor
tr ) is the uncollateralized euro (dollar) interest rate from time t to
time t+s.
Normally, arbitrage would drive the basis to zero. For example, if the FX basis is greater
than zero, arbitragers could borrow dollars unsecured at a relatively low interest rate, and then
lend the dollars via an FX swap at a relatively higher implied interest rate. Yet, with the dollar
shortage during the crisis, arbitragers were unable to borrow sufficient dollars in the unsecured
market to take advantage of this opportunity. Consequently, non-US banks faced market-based
dollar funding costs that were higher than the dollar LIBOR rates would suggest because of the
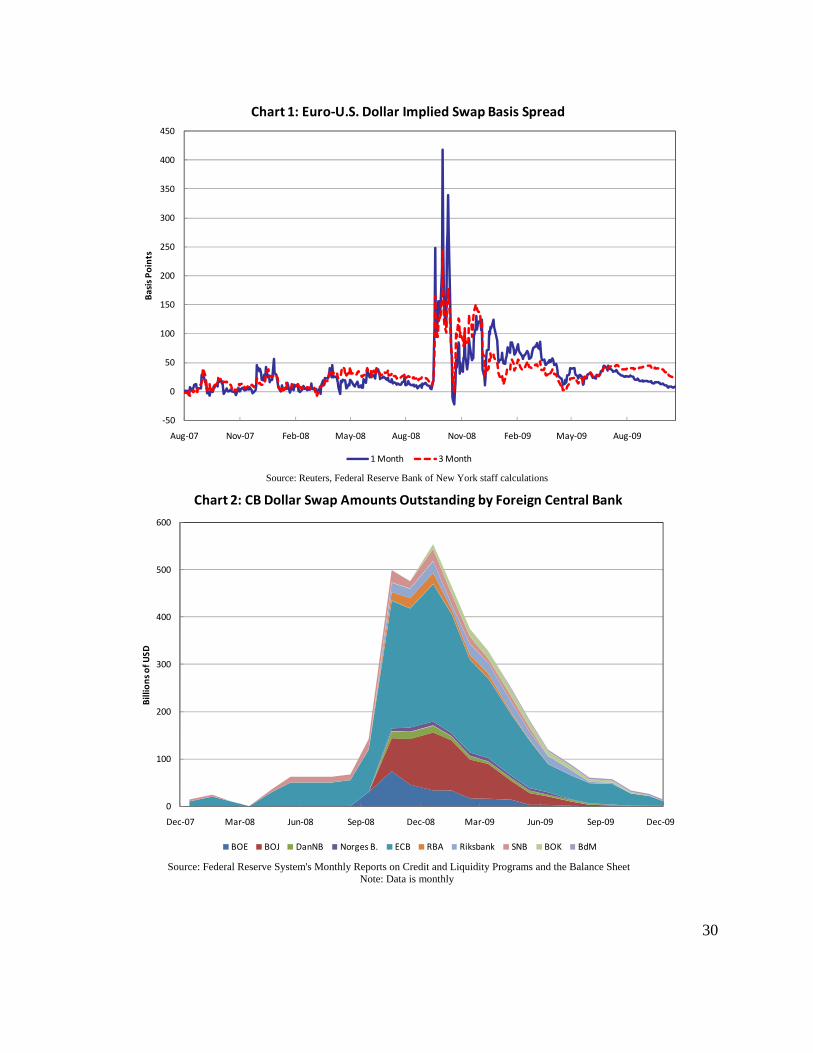
dollar shortage. The history of the FX basis for 1-month and 3-month funds, depicted in Chart 1,
show that the premium paid for dollars in the FX swap market rose relative to normal levels in
August 2007 but soared to extremes of over 400 basis points in October 2008. The dislocations
were broad-based across funding tenors and also were evident in other FX swap currency pairs,
such as the dollar-yen.
2.3 The Federal Funds Market. Another, albeit less standard, indicator of dollar market
pressures comes from the intraday market for federal funds. To explore this intraday market, we
begin with data on hourly effective federal funds rates (HEFFR), which is the overnight rate at
which depository institutions are lending dollars to each other at each hour. Using hourly data
over each of the days spanning August 2002 through October 2009, we explore whether there is
a differential cost of dollar funding during periods when European markets were open and dollar
demands were most acute, compared to after the European market close. Due to time zone
6
differences, European institutions participate in dollar funding markets before 1 PM Eastern
Standard Time. If there was a European premium to obtaining dollars, one would expect dollar
funding costs to be higher in the morning (earlier than 1pm), when European institutions were
participating, than in the afternoon (1pm and later).
When markets are functioning normally, the difference between the morning HEFFR
average and the afternoon HEFFR average should be small. The effective federal funds rate
should not change drastically in the same direction during the day consistently. Indeed, this is the
pattern seen in daily data over the six year interval from 2002 through July 2007. The difference
between the morning average and afternoon average hovered around zero basis points. By
contrast, after the beginning of the crisis, we observe that the difference between the morning
average and afternoon average became greater and was commonly positive. The morning
premium in the HEFFR was most striking in the post-Lehman period of late September 2008 and
early October 2008. This premium peaked in October 2008 and then abated in 2009.
One hypothesis is that a morning premium reflected a “Europe premium,” which arose
from a structural shortage of dollars. Of course, other factors also potentially played a significant
role in the deviations between morning and afternoon federal funds rates during the crisis. Most
notably was the tendency for U.S. banks to build a precautionary buffer of funding in the
morning, then lending these funds to the market in the afternoon as banks became more certain
of their actual funding needs.
3. Evolution of CB Dollar Swap Facilities
As pressures in the U.S. dollar funding markets built in late 2007 and through 2008, non-
U.S. banks began to report difficulty accessing dollars via the FX swap and other short-term
interbank funding markets. The Federal Reserve and foreign central banks engaged in expanded
discussions of means of addressing the disruptions in dollar funding markets and the more broad-
based dysfunction occurring in money markets. The idea of using a CB swap facility to address
money market dysfunction and to achieve broader financial stability contrasted with the goals of
most prior CB swap agreements, which had been primarily used as tools of foreign exchange
policy.
7
3.1. Main Developments in CB Swaps. Temporary reciprocal currency arrangements with the
European Central Bank (ECB) and the Swiss National Bank (SNB) were initially established in
December 2007. These arrangements allowed for the ECB and SNB to draw up to $20 billion
and $4 billion, respectively. The initial auctions were fully subscribed by the financial
institutions with access to the dollar operations held by those central banks. Despite an easing of
pressures in early 2008 after the introduction of these auctions, funding pressures and use of the
swap lines again escalated in March 2008 as Bear Stearns neared its acquisition by JPMorgan.
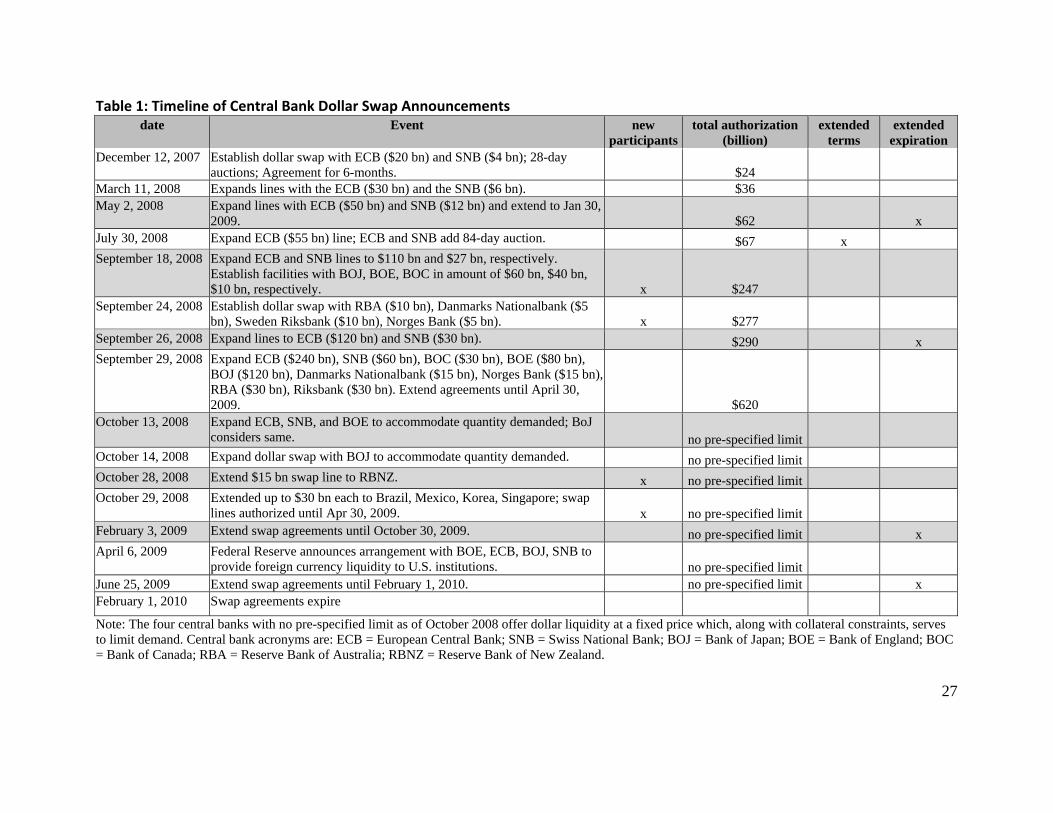
The sequence of developments in the Federal Reserve’s swap facilities with foreign
central banks are provided in the timeline of Table 1. Expansion of the dollars made available
through the swap facilities proceeded in stages, first by increasing the size of the lines and then
extending the tenors of auctions held by the ECB and SNB (through July 2008).
Ultimately, fourteen foreign central banks entered into swap arrangements with the
Federal Reserve. From an initial aggregate authorization of $24 billion in December 2007, the
amount grew to nearly $620 billion in the aftermath of the Lehman bankruptcy. The quantity was
soon uncapped for several central bank counterparts on October 13, 2008 as markets experienced
extreme pressures. The dramatic move to uncapped, “full allotment” auction formats was made
by the ECB, SNB, Bank of Japan (BOJ), and Bank of England (BOE). Under the full allotment
format, the Federal Reserve made dollars available to these four central banks in quantities not
subject to pre-specified limits. The foreign central banks, in turn, made dollar loans to financial
institutions within their jurisdictions and took on the related collateral and counterparty risks,
while the Federal Reserve was engaged in swap transactions only with the foreign central banks.
The swap lines were a coordinated effort among central banks to address elevated pressures in
global short-term U.S. dollar funding markets and to maintain overall market stability.
Chart 2 provides the contributions of different central banks to the overall size of swaps
outstanding by the Federal Reserve. Clearly, the ECB, the BOJ, and the BOE consistently made
up the majority of draw downs on the reciprocal currency arrangements. Peak CB dollar swap
balances according to the monthly balances published by the Federal Reserve indicate that the
ECB, the BOJ, and the BOE reached $291 billion (December 2008), $122 billion (December
2008), and $45 billion (November 2008) respectively. Overall use of the swap lines climbed
8
rapidly in October 2008, peaked in December 2008, and declined through the first half of 2009.
While the CB dollar swaps with foreign central banks differed primarily in size, the
foreign central banks also differed in the auction formats they used for distributing the U.S.
dollars. Each foreign central bank worked closely with the Federal Reserve to structure auctions
used for distributing the dollars to their domestic institutions. Structuring these auctions took into
account a variety of factors, including the central banks’ in-depth knowledge of domestic
funding markets and financial institutions and the existing operating guidelines of the central
bank with respect to accessing their liquidity facilities and acceptable collateral.
A variety of auction structures were possible, with several possible choices broadly
defined in the text box below. For example, auctions can be competitive or non-competitive.
Within the competitive auction classifications, pricing can either be at a single common price or
at multiple prices depending on the structure of bids. Though the non-competitive, fixed rate
auctions are fully allotted, the use of a higher spread to OIS and potential constraints on banks
availability of collateral may limit the demand for dollars.
Auction Types The broad definitions of auction formats and pricing are provided in the text box below. In general, auctions can have either competitive or non-competitive formats. Pricing conventions can be described as single price, multiple price, or fixed rate, full allotment.
Format Pricing Description competitive single price Bids are accepted from the highest interest rate bid
down, until the total auction size is allotted. All allocations are made at the lowest accepted bid rate.
multiple price Bids are accepted from the highest interest rate bid down, until the total auction size is allotted. All allocations are made at the respective bid rates of "winning" bidders.
non-competitive fixed rate, full allotment
Interest rate is fixed, and all bids received are satisfied subject to collateral requirements.
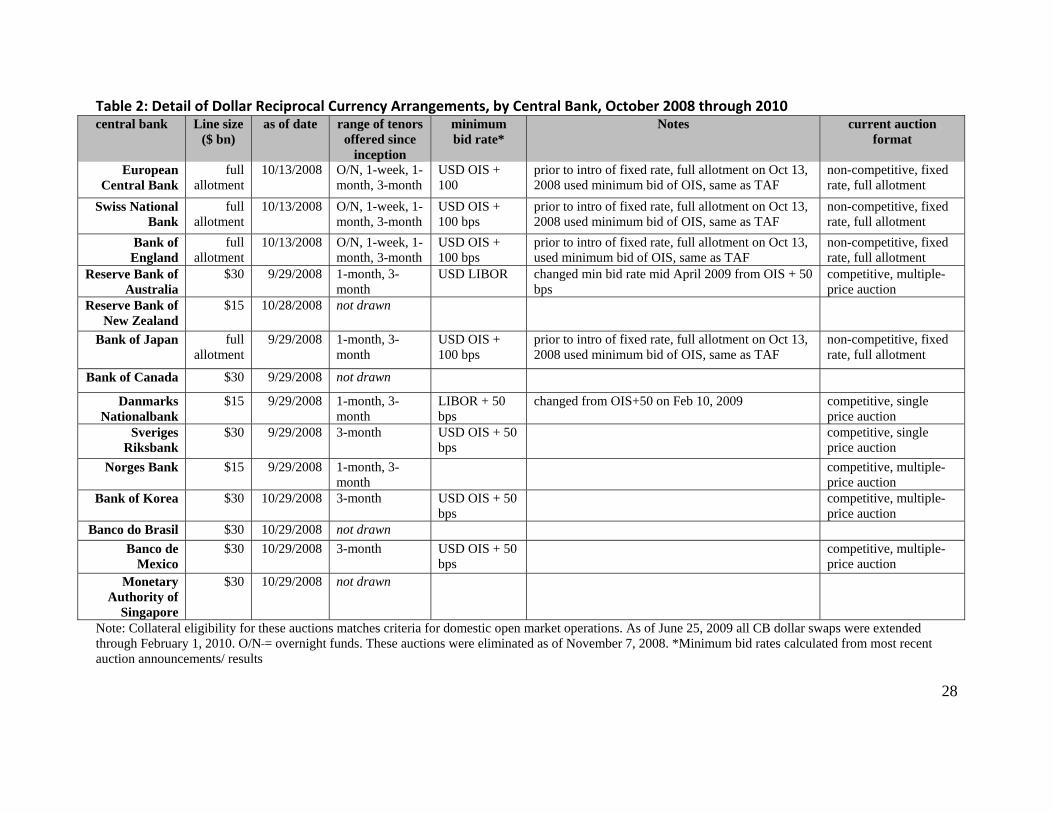
Table 2 presents broad details on the dollar auctions conducted by foreign central banks.
On the quantity side, as previously noted, after October 2008 four central banks did not have pre-
specified limits on the amounts that can be drawn, while ten other countries were authorized to
9
access up to $15 billion or $30 billion from the Federal Reserve. With the move to uncapped
quantities in October 2008, the ECB, BOJ, SNB, and BOE had fixed rate, full allotment auctions,
in which they provided dollars to their constituent depository institutions at a fixed interest rate
of approximately 100 basis points over OIS. This cost of funds implied that overseas extensions
of dollars were priced at a premium relative to the expected stance of U.S. monetary policy, over
the intervals that dollar swaps were extended. The BOE, ECB, and SNB coordinated their
auctions such that they used the same tender rate and held their auctions simultaneously. The
Danmarks Nationalbank and the Riksbank had single price, competitive auctions. The remaining
central banks that drew on the CB dollar swaps with the Federal Reserve established multiple-
price competitive auctions. Other central banks auctioned dollars competitively with minimum
bid rates ranging from OIS+50 basis points to LIBOR+50 basis points. Four of the fourteen
facilities were never drawn upon (Canada, New Zealand, Brazil, and Singapore).
In addition, on April 6, 2009, the FOMC announced that it established foreign-currency
swap facilities with the ECB, BOJ, SNB, and BOE. These facilities were designed to enable the
Federal Reserve to provide foreign currency liquidity to U.S. institutions should the need arise.
This facility essentially mirrored the existing U.S. dollar liquidity facility and was never drawn
on by the Federal Reserve. It expired concurrently with the dollar swaps on February 1, 2010.
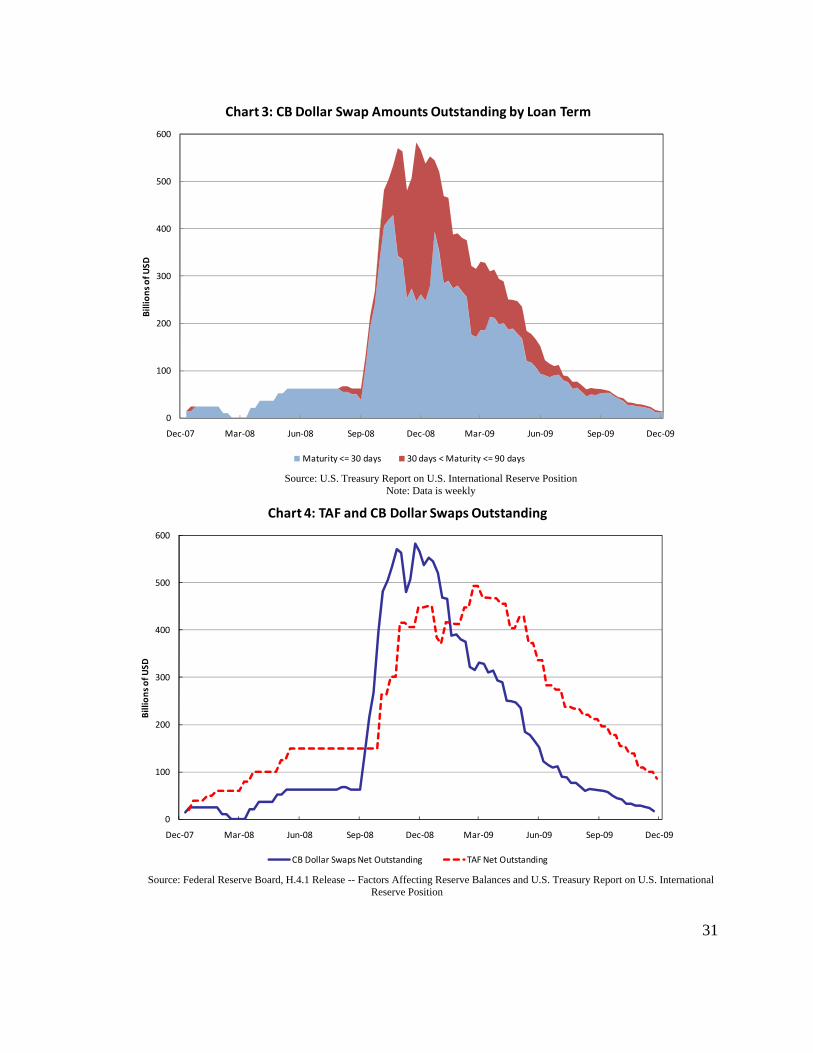
3.2. Evolution of Outstanding Balances and Tenors. In addition to changes in the terms and
quantities, the composition of loan tenors of dollars extended through the CB dollar swaps
evolved considerably over time (Chart 3). Clearly, the largest and most dramatic run-ups in use
of the dollar swaps occurred at the end of October 2008, as the size and scope of the CB dollar
swap facilities broadened rapidly in the context of escalating market tensions and the
approaching year end. Most of this expanded borrowing took place through 3-month operations,
the longest on offer, as liquidity available in the market quickly contracted to encompass only the
shortest tenors. Most of the demand came from the fixed rate, full allotment operations, which
constituted around 85 percent of outstanding swaps at December 31, 2008.
In part, the evolution of tenors shown in Chart 3 resulted from the changing offerings
from the various central banks. The initial auctions by the ECB and SNB, held between
December 2007 and July 2008, only provided 28-day funds. On July 30, 2008 the scope was
10
expanded to cover 3-month (84-day) funding, with a broader array of tenors including 1-week
and overnight introduced in October. The large discrete jumps in outstanding dollar balances
coincided with the first two full allotment 84-day dollar auctions on November 6, 2008 and
December 4, 2008; together these auctions accounted for an additional $129 billion and $114
billion, respectively. Financial institutions accumulated liquidity in advance of the 2008 year
end, but after this “risk event” participating banks partially unwound their outstanding balances
as their precautionary dollar needs declined. Net outstanding balances likewise declined when
these two operations matured on January 29, 2009 and February 26, 2009, respectively.
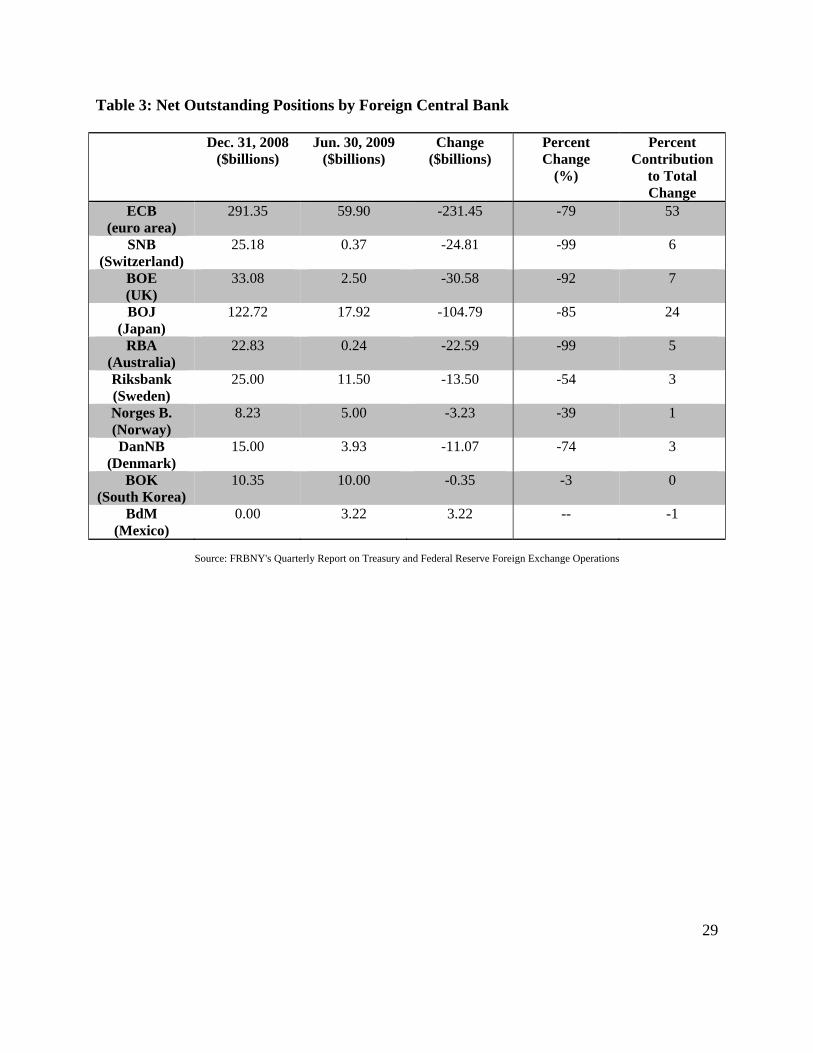
Table 3 shows how the demand for dollars unwound over the respective central bank
auctions, presenting the net outstanding positions by each foreign central bank with a the CB
dollar swap balance at 2008 year end and at the end of Q2 2009. In total, the CB dollar swap
outstanding declined by nearly $440 billion between December 31, 2008 and June 30, 2009. The
decline in position by the ECB ($231.45 billion) accounts for more than half of this total decline,
followed by reduced balances by the BOJ ($104.79 billion) and BOE ($30.58 billion). The
Banco de Mexico actually had increases in swap amounts outstanding, but this is due primarily
to the timing of its first auction in early 2009.
3.3. Relationship to the TAF. Of course, the dollar swaps with foreign central banks were only
one of the many dollar liquidity facilities established during the financial crisis. Indeed, the
auctions associated with the initial CB dollar swaps announced on December 12, 2007 were
coordinated with the TAF auctions in the United States, which provided the term funding to
eligible depository institutions in sound condition through periodic auctions.3 In the TAF, a
competitive, single price auction is used. The auction accepts bids at the highest interest rate
through successively lower rates. When necessary, bids at the lowest accepted interest rate would
be prorated. All participants whose bids have been accepted are awarded funds at the same
interest rate, which is the lowest interest rate at which bids were accepted, regardless of the rates
at which participants bid for funds. The TAF stop-out rate was also the fixed rate at which the
3 An overview of the initial conception and function of the TAF is provided in Armantier, Olivier, Sandra Krieger and James McAndrews 2008. “The Federal Reserve’s Term Auction Facility” Current Issues in Economics and Finance volume 14, number 5 (July).
11
ECB and SNB allotted funds at their CB dollar swap operations prior to the fixed rate, full
allotment structure.
The structure and functioning of the reciprocal currency arrangements are closely
intertwined with the TAF in that they would facilitate the extension of term dollar liquidity to
banks but in overseas jurisdictions. As we already noted, the schedules for the 28- and 84-day
dollar auctions conducted by the ECB, BOE, SNB, and BOJ largely coincided with the similar
tenor TAF operations. Unlike the fixed rate, full allotment structure of several of the foreign
central banks’ dollar auctions since October 2008, at the TAF auction a pre-determined fixed
supply of funds was offered at each pre-announced date.4 In practice, each TAF auction that
occurred since the auction sizes were increased to $150 billion on October 6, 2008 was
undersubscribed. Thus, the cost of dollars at these auctions fell to the minimum bid rate5.
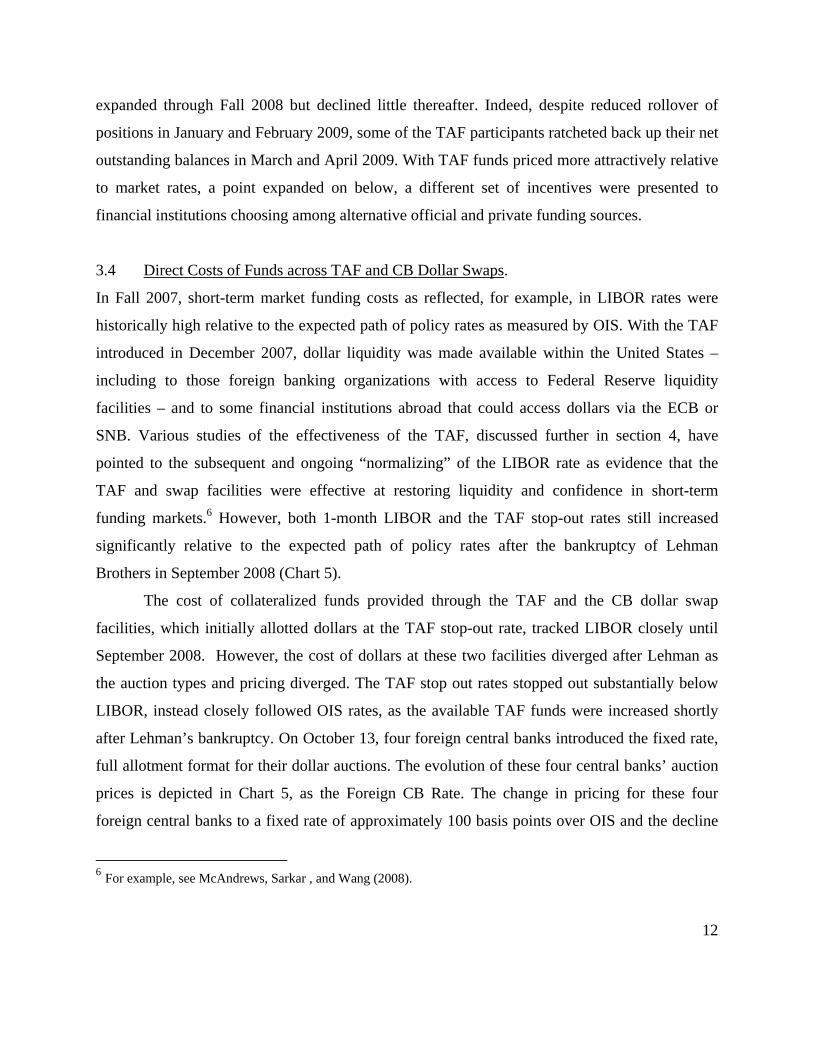
The text box below shows the basic schedule for a representative 28-day TAF auction
and swap between the ECB and Federal Reserve, with times indicated in Eastern Standard Time.
The typical sequence of events has the Federal Reserve conducting its TAF auction first but not
communicating the results until the ECB, SNB, BOE, and BOJ have held their operations for the
same tenor.
It is interesting to compare the outstanding balances at dollar swap facilities with the
pattern of demand observed at the TAF. As shown in Chart 4, TAF outstanding balances
4 http://atthebank.ny.frb.org/BankBusiness/facilities.shtml#taf 5 The minimum bid rate was OIS until the Federal Reserve cut rates to a range of 0 to 25 basis points in December 2008. Thereafter the minimum bid rate became the interest rate paid on excess reserves.
Representative 28- or 84-day U.S. dollar auction by Federal Reserve and ECB Monday: 10am - Federal Reserve releases minimum bid rate; 11am - TAF operation "opens" for bidding; 12:30 pm - TAF operation "closes" bidding. At 5:00pm, the FRBNY sends the ECB, BoJ, BoE and SNB the OIS rate to use in conducting their full-allotment tenders. Tuesday: ~3:45 am - bidding at ECB closes. ~5 am the ECB releases the results of operations. 10am – Federal Reserve releases results of TAF.
12
expanded through Fall 2008 but declined little thereafter. Indeed, despite reduced rollover of
positions in January and February 2009, some of the TAF participants ratcheted back up their net
outstanding balances in March and April 2009. With TAF funds priced more attractively relative
to market rates, a point expanded on below, a different set of incentives were presented to
financial institutions choosing among alternative official and private funding sources.
3.4 Direct Costs of Funds across TAF and CB Dollar Swaps.
In Fall 2007, short-term market funding costs as reflected, for example, in LIBOR rates were
historically high relative to the expected path of policy rates as measured by OIS. With the TAF
introduced in December 2007, dollar liquidity was made available within the United States –
including to those foreign banking organizations with access to Federal Reserve liquidity
facilities – and to some financial institutions abroad that could access dollars via the ECB or
SNB. Various studies of the effectiveness of the TAF, discussed further in section 4, have
pointed to the subsequent and ongoing “normalizing” of the LIBOR rate as evidence that the
TAF and swap facilities were effective at restoring liquidity and confidence in short-term
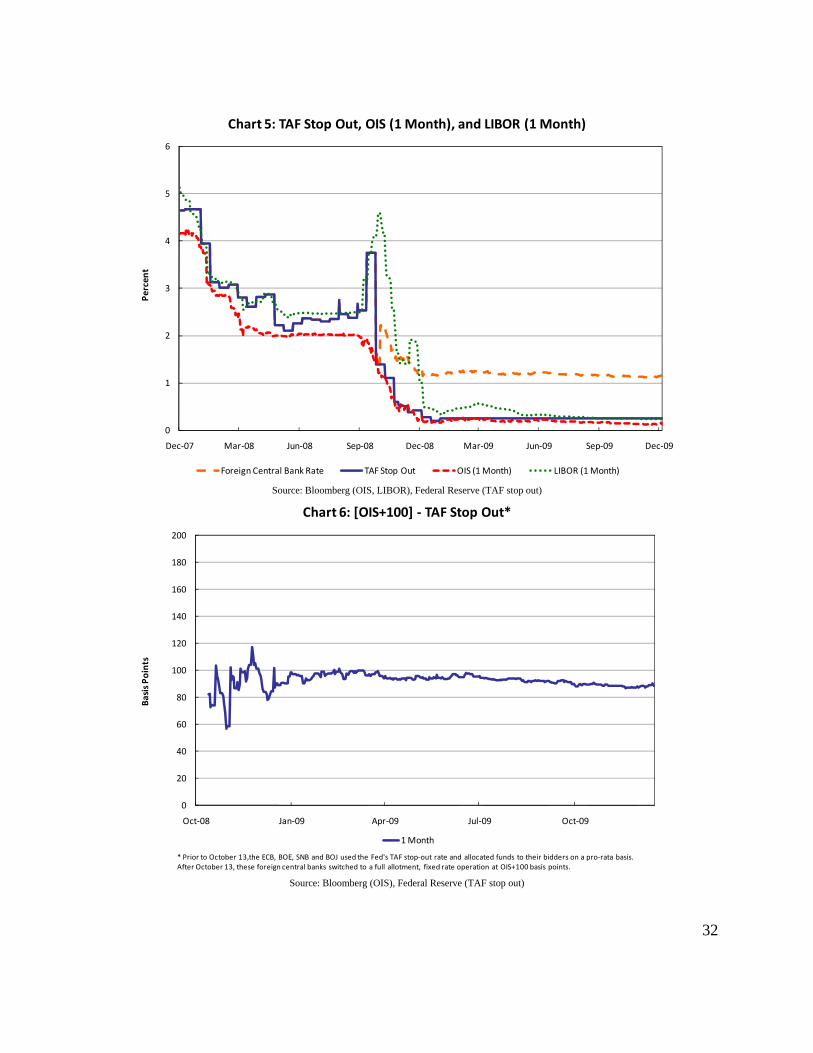
funding markets.6 However, both 1-month LIBOR and the TAF stop-out rates still increased
significantly relative to the expected path of policy rates after the bankruptcy of Lehman
Brothers in September 2008 (Chart 5).
The cost of collateralized funds provided through the TAF and the CB dollar swap
facilities, which initially allotted dollars at the TAF stop-out rate, tracked LIBOR closely until
September 2008. However, the cost of dollars at these two facilities diverged after Lehman as
the auction types and pricing diverged. The TAF stop out rates stopped out substantially below
LIBOR, instead closely followed OIS rates, as the available TAF funds were increased shortly
after Lehman’s bankruptcy. On October 13, four foreign central banks introduced the fixed rate,
full allotment format for their dollar auctions. The evolution of these four central banks’ auction
prices is depicted in Chart 5, as the Foreign CB Rate. The change in pricing for these four
foreign central banks to a fixed rate of approximately 100 basis points over OIS and the decline
6 For example, see McAndrews, Sarkar , and Wang (2008).
13
in TAF stop out rates made the cost of dollars from these foreign central bank swap facilities
available at a higher rate relative to funds at TAF (Chart 6). In part, the pricing of the fixed rate,
full allotment CB swap programs ensured that the facility was available to meet dollar funding
demands without hindering the eventual recovery of liquidity in the private eurodollar or foreign
exchange swap markets. This structure also reinforced the existence of the CB dollar swaps as
backstop liquidity facilities.
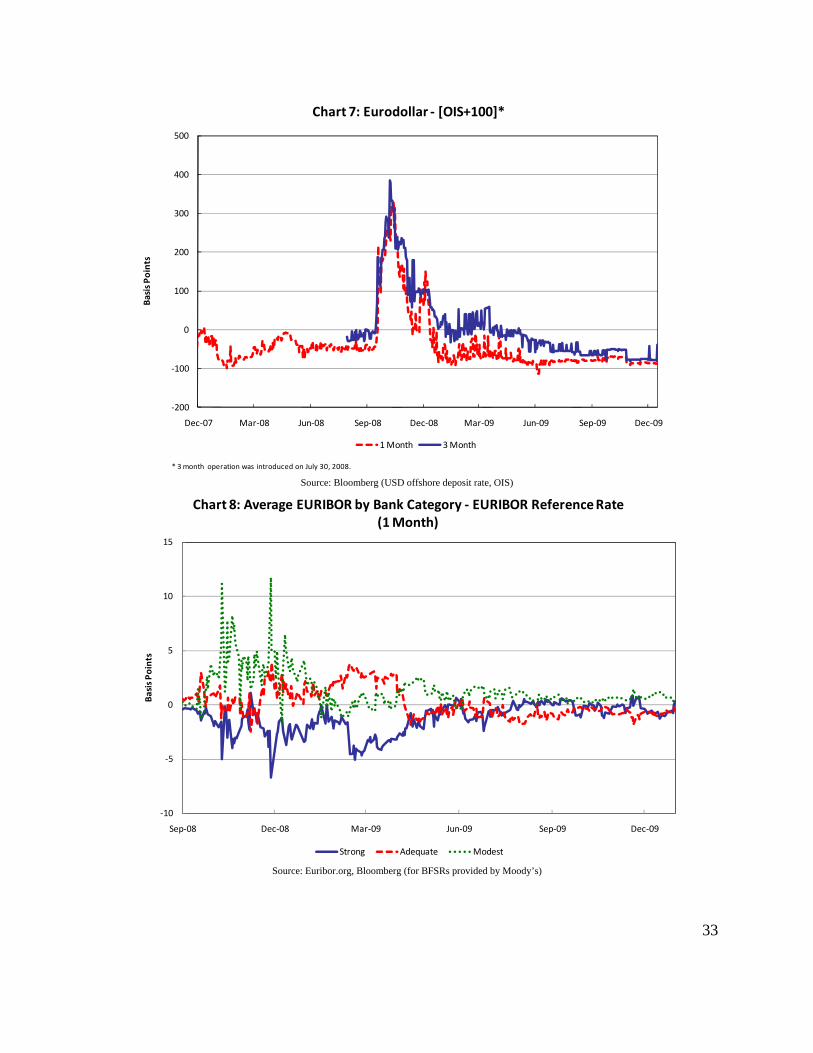
For some overseas depository institutions, despite the penalty rate on the swap facilities
relative to TAF, the swap facilities remained attractive as long as the cost of funds remained
advantageous relative to dollars obtainable in the market. That is, the swap facilities remained
attractive to a financial institution as long as its cost of borrowing in the market was more than
100 basis points over OIS. Chart 7 shows the spreads between 1-month and 3-month LIBOR
relative to the fixed rate of approximately OIS+100 basis points, with negative values indicating
when the average cost of private market dollar funds was cheaper than the funds available
through the central bank auction facility. As noted earlier, dollars obtained via the TAF and the
CB swap dollars were priced comparably to private market funds as measured by LIBOR prior to
September 2008. Thereafter, the swap funds were considerably cheaper than private market rates
during the height of the crisis as the spread between LIBOR and OIS widened dramatically.
However, by this measure only 3-month funds remained available more cheaply than private
markets from central bank sources (but still more expensive than through TAF) through the first
quarter of 2009. The CB dollar swap would still be attractive to those depository institutions that
had limited or no access to dollars near the LIBOR fixings. By contrast, the availability of
competitively priced TAF funds continued to keep demand for dollars higher and steadier
directly from the Federal Reserve. Private market costs of dollars as measured by LIBOR were
higher than the TAF.
3.5 Indirect Costs Associated with Collateral Requirements.7 Availability of eligible
collateral and the haircuts on different types of collateral influenced the effective cost of funds
and dollar demand at the respective dollar facilities. For example, there were additional haircuts
7 Sergio Grittini of the European Central Bank contributed valuable insights in this section.
14
for foreign exchange risks when banks pledge non-dollar denominated collateral at a foreign
central bank, adding to the cost of borrowing dollars. These collateral requirements in the United
States and abroad could have impinged on the choice of where to access dollars, for example
from foreign CBs or at the TAF, if a foreign-owned bank had an eligible affiliate in the United
States. 8
Availability of eligible collateral as a constraint on foreign participation in the TAF. In
order to participate in the TAF, a credit institution could pledge assets located in the United
States, or those located in an International Central Securities Depository (ICSD), such as
Euroclear Bank (Belgium) and Clearstream Banking Luxembourg.
However, a number of factors limit the availability of eligible collateral located in the
United States as well as in Europe, possibly constraining foreign participation in the TAF. Some
foreign banks’ portfolios of Federal Reserve-eligible assets located in the United States were
relatively small. Moreover, prudent liquidity management practices for some banks require that
part of those assets are left unencumbered to enable access to the discount window on short
notice and to enhance the company’s rating. In addition, the Federal Reserve applies stringent
eligibility criteria which limit the eligible pool of assets located in the ICSDs. Specifically, the
eligible assets included foreign government debt, German Jumbo Pfandbriefe, international
agency debt, foreign government agency debt, municipal bonds, and corporate bonds. Asset-
backed securities and bank loans were not eligible as collateral for the TAF when they are
located in Europe, while they are eligible when located in the United States. Furthermore, non-
US dollar-denominated instruments must have a market price from a recognized pricing source
and a AAA-rating, with the exception of government debt, for which the rating threshold is
lower (S&P BBB-, Moody’s Baa3). Finally, as in the case of assets located in the United States,
not all eligible assets located in Europe could be used to participate in the TAF due to the need to
leave a portion unencumbered or for other purposes (e.g., participating in the Eurosystem’s euro-
8 As discussed in BIS (2008), during the crisis several central banks widened, either temporarily or permanently, the range of eligible collateral and, in some cases, counterparties so as to facilitate an effective distribution of central bank funds. The Committee on Payment and Settlements of the BIS also explores the arrangements through which alternative central banks accept foreign collateral (BIS 2006).
15
providing operations).9
Furthermore, the US-based entity of the foreign banking group that would participate in
the TAF might be a different legal entity than the entity (e.g., EU-based) that owns the assets
deposited in the ICSDs. Meeting collateral requirements of the TAF would require one entity to
transfer the ownership title on the assets to the other entity via an intra-group transaction (e.g., a
repo or a bond lending operation). Also considering the potentially small amount of eligible and
usable assets located in the two ICSDs, some foreign banks reportedly decided not to invest
resources to address these legal and organizational issues and thus were unable to use the eligible
assets deposited in the ICSDs.
Haircuts affect the relative attractiveness of facilities. Different haircuts apply to
collateral accepted by the Federal Reserve and the ECB. For comparison purposes, we focus on
the subset of assets that is eligible in both operations. Assets located in the United States were
not eligible to be pledged at the operations carried out by the ECB, because the ECB requires
that the assets be deposited/registered (issued) in the European Economic Area10 and held and
settled in the euro area. In contrast, most of the assets in the ICSDs that are eligible to be used as
collateral in the TAF are also eligible for the ECB dollar facility.
The lendable value for these assets differed according to the central bank to which they
are pledged. In particular, the lendable value for a given amount of euro-denominated assets
located in an ICSD was typically higher in the 28-day TAF than in any ECB dollar auction. This
was mainly because the ECB applied significantly higher additional initial margins to account
for foreign exchange rate risk as part of its risk management framework than the Federal
Reserve. Specifically, the ECB’s additional haircuts were 10%, 12%, 17% and 20% for dollar
operations with duration of 1-, 7-, 28- and 84- days respectively, while the Federal Reserve’s
additional FX haircuts range from 2% to 5%, according to the residual maturity of the debt
9 Foreign-owned but globally-oriented banks reported that legal and operational issues could hinder the use of eligible assets deposited with the ICSDs. In particular, the one-off legal preparatory work that is needed to pledge these assets in the TAF could have initially delayed foreign bank participation in the TAF.
10 The European Economic Area (EEA) includes the 27 Member States of the European Union and Iceland, Liechtenstein and Norway.
16
instruments.11 As a result, there were two margins for haircuts: margins based on the security
type and an additional margin if the collateral is denominated in foreign currency.
The relationship between lendable values in the TAF and ECB dollar facility changed
when 84-day funds were considered. In fact, a bank would be able to borrow more against euro-
denominated assets located in an ICSD in the 84-day ECB dollar auctions than in the TAF. This
happens because, since July 30, 2008, the Federal Reserve introduced an additional collateral
requirement for advances of more than 28-days. Under this requirement, the total amount of term
primary credit and TAF credit with original or remaining term to maturity exceeding 28-days
extended to an individual depository institution could not exceed 75% of the lendable value of its
available collateral.12
11 For example, the lendable value for euro-denominated foreign government debt located in an ICSD at a 28-day TAF is between 85% and 92% of the assets’ market value, depending on the residual maturity of the debt instrument. The lendable value of the same instrument at the ECB dollar auction is instead between 76% and 83% of the assets’ market value, depending on the structure of the debt instrument (fixed or zero coupon) and its residual maturity. The lendable value of euro-denominated German Jumbo Pfandbriefe (another relevant asset class) at a 28-day TAF is between 85% and 92% of the assets’ market value, depending on the residual maturity, while the corresponding values at the ECB dollar auction are between 73% and 82%. 12 For example, this additional collateral requirement lowers the lendable value for euro-denominated foreign government debt and German Jumbo Pfandbriefe located in an ICSD at an 84-day TAF to between 64% and 69% of the assets’ market value, depending on the residual maturity of the debt instrument.
Collateral and haircuts at dollar auctions by Federal Reserve and ECB Define hFRS and hECB as the haircuts on comparable collateral, as applied by the Federal
Reserve and ECB. Define rTAF and rECB as the cost of funds at the US TAF and the ECB’s dollar swap facility. Define rm as the market rate on uncollateralized funds. For a bank with $1 of eligible
collateral, the cost of borrowing $1 is At the US TAF: 1 At the ECB dollar swap facility: 1 The total cost of $1 borrowed at the US TAF is below costs at the ECB provided that 1 1
An example. Assume hFRS = 0.36, hECB = 0.24. The inequality that must be satisfied for U.S. TAF to be cheaper than the ECB becomes 6.33 5.33 On May 11, 2009, with rECB = OIS+100 = 1.197 and rTAF = 0.25, rm < 6.3 percent.
17
Ceteris paribus, the differences in the haircut regimes reinforced the relative
attractiveness of the 28-day TAF compared to ECB dollar auctions, while they lower the relative
attractiveness of the 84-day TAF compared to the ECB dollar auctions. The haircut differences
across assets can be viewed in terms of a supplemental interest rate differential favoring the
TAF. If the lendable value for an asset was 64% at the TAF and 76% at the ECB dollar auction
(as is the case for foreign government bonds in 84-day operations), in May 2009 the bank would
have found it profitable to borrow at the ECB dollar auction at OIS+100 basis points instead of
the TAF at 0.25 percent only if, as shown in the box above, its private market funding costs were
over 6.3 percentage points.
4. Effects of the CB Swaps on Dollar Funding Markets
The implementation and expansion of the swap lines between the Federal Reserve and
the various foreign central banks have been described as significantly ameliorating the cost of
dollars shown in the LIBOR-OIS and FX basis spread levels, even if these costs remained
elevated by historical measures.13 In this section, we consider the evidence arising from
discussions with market participants, data on the cost of funds to different market segments, and
formal econometric studies.
4.1 Discussion with Market Participants. Liquidity conditions in the FX swap market
improved considerably following the height of market stresses in late 2008. The FX basis spread
narrowed from its widest level. Anecdotally, by late Spring 2009 bid-ask spreads for both euro-
dollar and dollar-yen FX forwards converged towards more typical levels, though trade sizes
remained a fraction of the typical trade size pre-crisis.
Market participants, including dealers, brokers, and bank treasurers, attributed these
improvements to several factors. First, the demand for dollar funding diminished as foreign 13 The Federal Reserve put in place numerous facilities to address the freezing of money markets including the Term Auction Facility (TAF), the Commercial Paper Funding Facility (CPFF), and the Asset-backed Commercial Paper Money Market Fund Liquidity Facility (AMLF) while the US Treasury Department implemented the temporary money market fund guarantee and the Temporary Liquidity Guarantee Program (TLGP). Similar efforts were undertaken globally by fiscal and monetary authorities.
18
banks continued to write down many of their dollar denominated credit-related assets, reducing
the value of assets that needed funding. Second, the availability of dollars for many of the
biggest suppliers of dollars to foreign banks in FX swaps (mostly large U.S. banks) began to
stabilize, making them more willing to supply dollars in exchange for foreign currency. Third,
global financial institutions became more conservative in their liquidity management practices,
in part in anticipation of tighter regulation, which may have reduced their reliance on short-term
cross-currency funding. These observations were consistent with the anecdotal reports that the
overall volume of activity in the FX swap market remained well below pre-crisis levels. Despite
the significant improvement, liquidity conditions in the FX swap market remained notably
impaired by historical measures through the Spring 2009.
Similarly, conditions in the eurodollar market showed nascent signs of improvement
beginning at the end of December 2008 after the authorized sizes of both the Federal Reserve’s
TAF and CB swap lines were increased. These improvements continued until a renewed sense of
concern of the financial sector emerged early in 2009. However, spillovers to the dollar funding
markets were more limited given the existence of a strong backstop provided by the CB dollar
swaps. After early March 2009, the process of “normalization” continued almost uninterrupted.
The entire LIBOR curve shifted lower and flattened, with the 3-month LIBOR to OIS spread
narrowing to levels prevailing before the bankruptcy of Lehman Brothers. Anecdotally, market
participants also reported increasing activity in tenors beyond 1-month, a significant
improvement from late 2008.
Expectations of future market conditions also improved, with the expected 3-month
LIBOR to OIS spread (as reflected in the spread between forward rate agreements and forward
OIS rates) narrowing significantly, the rates implied in the 2009 and 2010 Eurodollar futures
contracts declining significantly, and the implied rates for 3-month LIBOR fixings falling below
1 percent for all contracts through June 2010.
4.2 Tiering in Costs of Dollar Funds. Among the measures used for analysis of facility
effects is the FX swap basis, which is an average implied premium paid for dollar funds in the
FX swap market relative to LIBOR. However, it does not fully capture the fact that different
market participants likely have varying degrees of access to the unsecured markets – both in the
19
amounts and rates at which counterparties would be willing to lend. For example, if a given bank
can borrow euros at EURIBOR but can only borrow dollars at LIBOR + 20 basis points in the
unsecured markets, then the FX basis for that bank would be the implied USD funding cost vs.
(LIBOR + 20) rather than LIBOR, resulting in a smaller FX basis. This similarly applies to a
banks access to the euro unsecured cash markets used in calculating the implied USD funding
cost.
Our discussion of the FX basis emphasized that the first part of the transaction reflects
the cost of euros, in terms of interest rates by which euro-area companies acquire liquidity before
conversion into dollars via swap markets. However, the aggregate measure for eurLibortr is an
average across a range of institutions bidding for euros in private markets. As the crisis
intensified, our closer look at the underlying data reveals a pattern of deep and persistent implied
credit tiering within EURIBOR quotes. While broader market conditions may appear to have
returned to close to normal conditions in mid 2009 when measured by indicators such as LIBOR
to OIS spreads, anecdotes and this more detailed data show that credit tiering was still very much
in operation even after the CB dollar swaps were in effect and in the uncapped format. Credit
tiering within the euro borrowing market would likely extend to the cost of European banks
acquiring dollars through private swap transactions.
Some evidence on this point comes from panel data related to the EURIBOR, which is a
daily reference rate for the euro interbank market. Its panel consists of 43 major banks, nearly all
of them European. For comparison, LIBOR’s panel only consists of 16 banks. Each bank
submits the interest rate it believes one prime bank is quoting to another prime bank in the euro
market for tenors from 1 week to 1 year.14 The EURIBOR is calculated by averaging the middle
70 percent of the panel banks’ reported borrowing rates. Historical data is available for the panel
banks’ contribution to EURIBOR beginning in September 2008.15
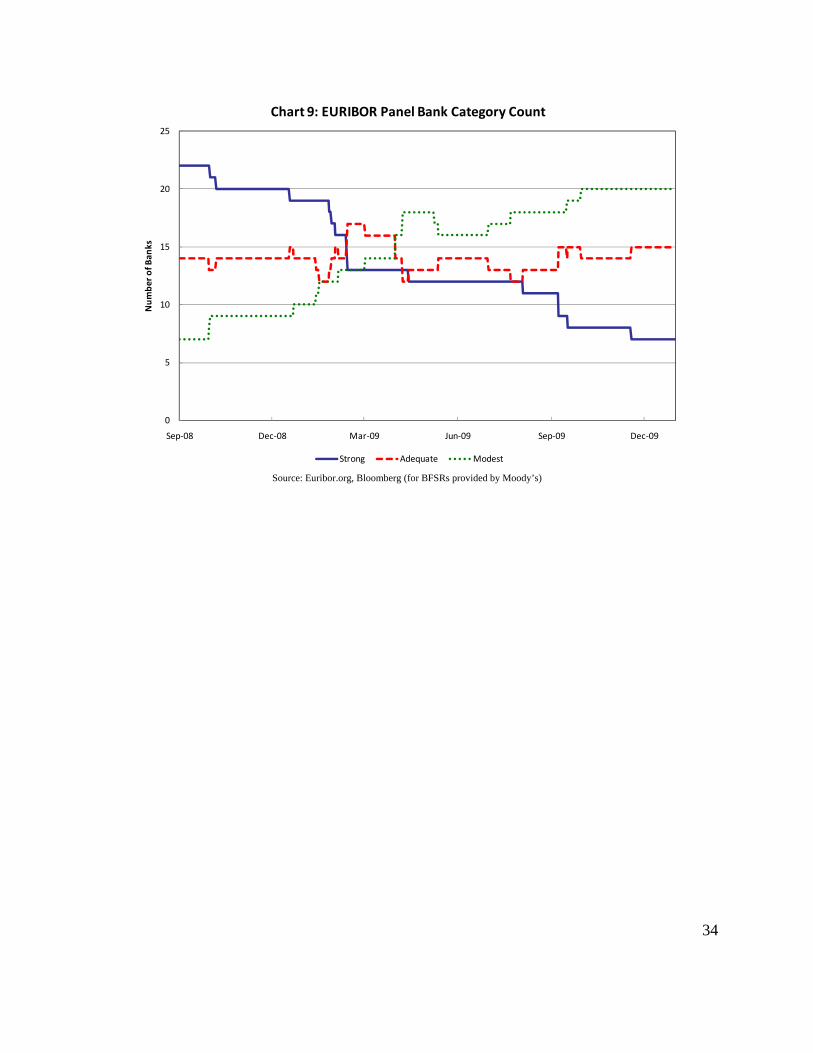
In order to check whether there was credit tiering in the euro lending market, we classify
each of the 43 banks at each date based on its Bank Financial Strength Rating (BFSR). A bank’s
BFSR, which is reported by Moody’s and ranges from A to E, is meant to reflect the bank’s
14 Tenors include 1 week, 2 weeks, 3 weeks, and every month from 1 to 12 months. 15 Historical data is available at http://www.euribor.org/html/content/euribor_data.html.
20
intrinsic soundness.16 Each bank was classified as stronger (B- or higher), adequate (C or C+), or
modest (C- or lower). We examined each bank category’s average borrowing rate relative to the
EURIBOR reference rate using a range of tenors. The results from this application are illustrated
in Chart 8, which shows each bank category’s average borrowing rate relative to the EURIBOR
reference rate using the 1-month tenor data. The construction is based on each bank’s BFSR on
each date (i.e., banks move between categories when a rating change warrants it) and the number
of banks in each category are shown in Chart 9.
Chart 8 shows that stronger banks, on average, were able to borrow euros on more
favorable terms than more modest or adequate banks during the crisis period. Credit tiering was
especially pronounced during late 2008 and early 2009, and peaked in late November 2008.
Although the chart only reflects 1 month tenor spreads, the borrowing rate spread between the
categories is similar for all maturities. The shorter tenors, such as 1 week, displayed smaller
spreads, interpreted as less credit tiering.
4.3 Econometric Analyses. In this section, we do not provide original econometric work but
instead interpret the econometric evidence that explores the role of the TAF and CB swaps in
bringing down the cost of funds, especially when dollar liquidity conditions were most stressed.
Formal econometric testing has identified some of the effects of the TAF and the CB dollar
swaps on market liquidity. In general, these studies begin with high frequency data (generally
daily) on financial market indicators – for example, LIBOR to OIS spreads or FX basis swaps –
and consider the effects of announcements and actual auction events. “Effectiveness” is
generally interpreted as a statistically significant and persistent decline in the cost of funds.
Another smaller direction of research considers the relationship between the CB swaps and the
impact on conditions in the last four markets (Brazil, Mexico, Korea, and Singapore) in which
dollar swaps with the Federal Reserve were announced.
The initial studies of the consequences of the liquidity facilities focused primarily on the
16 The rankings take five factors into consideration: franchise value, risk positions, regulatory environment, operational environment, and financial fundamentals. See http://www.moodys.com/cust/content/Content.ashx?source=StaticContent/Free%20Pages/Products%20and%20Services/Static%20Projects/GBRM/pdf/Global_Bank_Rating_Methodology-Brochure.pdf.
21
TAF, with the CB dollar swaps treated as a related arm of the liquidity facilities. Mishkin (2008)
originally argued that the TAF “may have had significant beneficial effects on financial
markets”, but this claim was met with skepticism by Taylor and Williams (2009), who focused
on the effects of the facilities introduced in the first phase of the crisis, specifically the period
from August 9, 2007 through March 20, 2008 and concluded that the TAF auctions (seven in
their sample) had no effect in reducing the three-month LIBOR to OIS spread. 17
A comprehensive study of the early response to the crisis by McAndrews, Sarkar and
Wang (2008) used more of an event study methodology, as in Taylor and Williams (2009), and
explored a broader events panel that included TAF as well as CB swap announcement dates and
auction dates. Also using the 3-month LIBOR over OIS spread, with the dependent variable
being changes not the (potentially nonstationary) level of the spread, TAF announcements as
well as actual TAF operations significantly reduced spreads. Noteworthy for our discussion of
the central bank swap facilities is that McAndrews, Sarkar and Wang distinguish between
domestic TAF and international (swap facility) announcements in econometric exercises. The
announcements along the international dimension of the liquidity facilities were the dominant
drivers of the overall announcement effects, both quantitatively and in terms of statistical
significance.18
17 Further, it uses the level (not the changes) of the LIBOR-OIS spread as the dependent variable in regressions, biasing the study results against finding a TAF effect. This period examined covered only the early stages of TAF (announced December 12, 2007) and dollar swaps with the ECB and SNB (see Table 1), with the variable of interest of the econometric work the spread between the 3-month LIBOR and the Fed’s overnight federal funds rate target. Other authors such as Wu (2008) and McAndrews, Sarkar and Wang (2008) took issue with the identification strategy of the Taylor and Williams analysis, noting, for example, that the study omitted the effects on spreads of facility announcements, only considered the actual auction events, and was performed on the level of the spreads not changes in spreads. In a similar type of study performed by Wu (2008), the econometric strategy was to separately examine the TAF’s effects on relieving financial institutions liquidity concerns and in reducing the counterparty risk premiums, and then quantifying the overall effects on strains in the interbank money market. Wu’s econometric specification assumed that the LIBOR to OIS spread would be permanently moved by the introduction of TAF (with a dummy variable introduced equal to 1 for days since December 12, 2007, the first TAF announcement date), concluding that the TAF significantly reduced the LIBOR-OIS spread. 18 Meyer and Sack (2008) and Deutsche Bank (2009) likewise found that TAF announcements and auctions reduce the LIBOR-OIS spread for a number of different specifications of the credit risk and VIX measures, although without the distinctions between domestic and international facility announcements.
22
Baba and Packer (2009) and Aizenman and Pasricha (2009) also directly focus on the
dollar swap facilities. Baba and Packer provide extensive details of the U.S. dollar auctions by
the European Central Bank, the Swiss National Bank, and the Bank of England in the period
between September 2007 and October 2008. In addition to examining LIBOR to OIS spreads,
Baba and Packer examine daily data for three FX swap pairs over the periods from August 2007
through September 2008, and for September 2008 through January 2009. The econometric
analysis focuses on whether the CB swaps affected counterparty specific risks and had common
effects component across all three FX swap bases. As in McAndrews et al. (2008), Baba and
Packer distinguish between announcement effects and consequences of the actual auctions. The
effects of the actual auctions are mixed and contingent on the maturities of funds supplied at the
auctions. Announcements about the auctions were permitted to differ, by time period, in their
effects on financial variables. The CB dollar auction variables reduced both the level and
volatility of the all spreads in the post-Lehman period, but mainly served to reduce volatility in
the earlier pre-Lehman period.
The analysis by Aizenman and Pasricha (2009) reached more mixed conclusions about
the effects of the announcements of the Federal Reserve’s swap arrangements with the central
banks of Brazil, Korea, Mexico, and Singapore. The authors treat these countries as all being in a
special emerging markets group that had swap arrangements with the United States. They find
that the credit default swap (CDS) spreads of these countries fell at the time the CB swap
facilities were announced, but so did the CDS spreads of other emerging market countries.
Indeed, the spreads of most emerging markets had started to decline even before the CB swap
arrangements were announced. Exchange rates responded significantly for the currencies of the
countries with these arrangements, on average appreciating when non-swap country currencies
depreciated, however these effects subsequently were reversed.
The general tenor of these few empirical studies of CB dollar swaps is supportive of a
role played by the dollar swap facilities on effecting financial variables. This role was achieved
through some combination of announcement effects or the actual operations. However, it is
important to point out that definitive statements about the consequences of any specific CB
dollar swap operation or announcement or facility remain difficult to quantify. The measured
effects may have been short term, without being measurably persistent. This type of result and
23
critique are common to empirical studies that examine the effects of news on high frequency
data. Thus, tests of long term consequences are notoriously difficult to conduct in light of the
highly volatile conditions and the many changes in facilities and operations over the life of the
swap facilities. Indeed, Baba and Packer (2009) acknowledge similar difficulties in evaluation,
noting that “these measures were widely welcomed by market participants and credited with
alleviating funding pressures in term funding markets. However, the increase in the dollar swap
lines to unlimited amounts occurred shortly after the adoption of many other measures by the
authorities to stabilize the financial system by reducing counterparty credit and liquidity risks…
with the combination of the {range of} measures …likely important in alleviating funding
pressures on non-US banks in particular.”
Benchmarks for what might have occurred in the absence of the facility are possible to
construct, and are speculative by definition. Overall though, the balance of market perceptions
and the carefully implemented empirical studies suggest that the central bank reciprocal swap
arrangements were a highly welcome and useful response to the dollar funding shortages in
international markets.
5. Conclusions
This paper has provided an overview of the evolution of the reciprocal currency
arrangements or dollar swap facilities that the Federal Reserve established with a range of
foreign central banks in 2007 and 2008, and exited by February 2010. In brief, the performance
of the CB swap facilities is tightly intertwined with the pricing and functioning of TAF auctions,
which was been another means of providing dollar liquidity to banks. Both the TAF and dollar
swap facilities have been effective at reducing dollar funding costs to domestic and foreign firms
and have been viewed as successful backstop facilities for depository institutions. Empirical
studies have pointed to the particular role played by the international facilities in influencing
financial markets. The large expansion of the Federal Reserve’s balance sheet that was
associated with the CB dollar swaps in 2008 Q4 occurred as global banks demanded term
funding to cover potential year-end shortages. These positions unwound significantly in 2009 Q1
as outstanding balances matured and were not rolled over, and continued to decline over the
course of 2009. Availability of dollars to foreign banks was associated with credit tiering across
24
these financial institutions that persisted, even if at a lower degree of severity, well into 2009.
Overall, we conclude that currency swap facilities have been an important part of the toolbox of
central banks for dealing with crisis management and resolution, beyond their more traditional
use in foreign exchange policy.
By way of final remarks, it is worth noting that while we have exclusively focused on the
Federal Reserve dollar swaps with foreign central banks, this type of facility also has been
implemented by other networks of European and Asian monetary authorities, including the
ASEAN group’s Chiang Mai initiative.19 The global network of swap facilities targeted
widespread dysfunction across markets, with central banks lending against the collateral
provided by their constituent financial institutions.
Extraordinary liquidity facilities such as the dollar swap lines are generally implemented
to address broad dysfunction in financial markets. However, in crisis periods broad market
dysfunction is often accompanied by significant credit tiering across financial firms. Such
tiering can persist for some time after the need for broad liquidity provision has receded. As a
crisis abates, a key challenge for policymakers is to identify when usage of liquidity support
becomes concentrated among “adversely selected” institutions who might continue to rely on
such liquidity facilities. The use of penalty rates in pricing such liquidity operations can assist
policymakers in making such judgments because penalty rates create economic incentives for
participants to exit these programs as the cost of market-based sources of funds returns to more
normal levels.
19 McGuire and von Peter (2009b, Figure 7) provides details.
25
References Aizenman, Joshua and Gurnain Kaur Pasricha (2009), “Selective Swap Arrangements and the Global Financial Crisis: Analysis and Interpretation,” NBER Working Paper # 14821(March). Armantier, Olivier, Sandra Krieger, and James McAndrews (2008), “The Federal Reserve’s Term Auction Facility,” Federal Reserve Bank of New York Current Issues in Economics and Finance volume 14 Number 5 (July). Baba, Naohiko and Frank Packer (2009), “From turmoil to crisis: Dislocations in the FX swap market before and after the failure of Lehman Brothers,” Journal of International Money and Finance. forthcoming. Baba, Naohiko, Robert N. McCauley, and Srichander Ramaswamy (2009), “US Dollar Market Funds and Non-US Banks,” BIS Quarterly Review. (March). Bank for International Settlements (2006), “Cross-Border Collateral Arrangements,” CPSS Publications No. 71 (January). Bank for International Settlements (2008), “Central Bank Operations in Response to the Financial Turmoil,” CGFS Publication no. 31 (July). Cetorelli, Nicola and Linda Goldberg (2008), “Banking Globalization and Monetary Transmission,” October 2009 revision of Federal Reserve Bank of New York Staff Report 157 (New York: Federal Reserve Bank of New York). Cetorelli, Nicola and Linda Goldberg (2009), “Global Banks and International Shock Transmission: Evidence from The Crisis,” Federal Reserve Bank of New York (December). Coffey, Niall, Warren B. Hrung, and Asani Sarkar (2009), “Capital Constraints, Counterparty Risk, and Deviations from Covered Interest Rate Parity,” Federal Reserve Bank of New York Staff Reports, no. 393 (September). Deutsche Bank (2009), “Are the Fed’s Programs Working?” Global Markets Research: Macro. McAndrews, James, Asani Sarkar and Zhenyu Wang. (2008), “The Effect of the Term Acution Facility on the London Inter-Bank Offer Rate,” Federal Reserve Bank of New York Staff Report no 335 (July). McGuire, Patrick and Goetz von Peter (2009a), “The US dollar shortage in global banking”, Bank for International Settlements Quarterly Review (March). McGuire, Patrick and Goetz von Peter (2009b), “The US dollar shortage in global banking and the International Policy Response,” Bank for International Settlements working paper 291
26
(October). Meyer, Laurence and Brian Sack (2008), “TAF and Liquidity Policies: Keeping Libor Down,” Macroeconomic Advisers, May 15. Frederic Mishkin (2008), “The Federal Reserve's Tools for Responding to Financial Disruptions,” speech at the Tuck Global Capital Markets Conference, February 15, 2008, available at http://www.federalreserve.gov/newsevents/speech/mishkin20080215a.htm. Taylor, John B. and John C. Williams. (2009), “A Black Swan in the Money Market” American Economic Journal: Macroeconomics, 1:1, 58-83. Wu, Tao (2008), “On the Effectiveness of the Federal Reserve’s New Liquidity Facilities” Federal Reserve Bank of Dallas working paper 0808 (May).
27
Table 1: Timeline of Central Bank Dollar Swap Announcements date Event new
participantstotal authorization
(billion) extended
terms extended
expiration December 12, 2007 Establish dollar swap with ECB ($20 bn) and SNB ($4 bn); 28-day
auctions; Agreement for 6-months. $24 March 11, 2008 Expands lines with the ECB ($30 bn) and the SNB ($6 bn). $36 May 2, 2008 Expand lines with ECB ($50 bn) and SNB ($12 bn) and extend to Jan 30,
2009. $62 x July 30, 2008 Expand ECB ($55 bn) line; ECB and SNB add 84-day auction. $67 x September 18, 2008 Expand ECB and SNB lines to $110 bn and $27 bn, respectively.
Establish facilities with BOJ, BOE, BOC in amount of $60 bn, $40 bn, $10 bn, respectively. x $247
September 24, 2008 Establish dollar swap with RBA ($10 bn), Danmarks Nationalbank ($5 bn), Sweden Riksbank ($10 bn), Norges Bank ($5 bn). x $277
September 26, 2008 Expand lines to ECB ($120 bn) and SNB ($30 bn). $290 x September 29, 2008 Expand ECB ($240 bn), SNB ($60 bn), BOC ($30 bn), BOE ($80 bn),
BOJ ($120 bn), Danmarks Nationalbank ($15 bn), Norges Bank ($15 bn), RBA ($30 bn), Riksbank ($30 bn). Extend agreements until April 30, 2009. $620
October 13, 2008 Expand ECB, SNB, and BOE to accommodate quantity demanded; BoJ considers same. no pre-specified limit
October 14, 2008 Expand dollar swap with BOJ to accommodate quantity demanded. no pre-specified limitOctober 28, 2008 Extend $15 bn swap line to RBNZ. x no pre-specified limitOctober 29, 2008 Extended up to $30 bn each to Brazil, Mexico, Korea, Singapore; swap
lines authorized until Apr 30, 2009. x no pre-specified limitFebruary 3, 2009 Extend swap agreements until October 30, 2009. no pre-specified limit x April 6, 2009 Federal Reserve announces arrangement with BOE, ECB, BOJ, SNB to
provide foreign currency liquidity to U.S. institutions. no pre-specified limitJune 25, 2009 Extend swap agreements until February 1, 2010. no pre-specified limit x February 1, 2010 Swap agreements expire
Note: The four central banks with no pre-specified limit as of October 2008 offer dollar liquidity at a fixed price which, along with collateral constraints, serves to limit demand. Central bank acronyms are: ECB = European Central Bank; SNB = Swiss National Bank; BOJ = Bank of Japan; BOE = Bank of England; BOC = Bank of Canada; RBA = Reserve Bank of Australia; RBNZ = Reserve Bank of New Zealand.
28
Table 2: Detail of Dollar Reciprocal Currency Arrangements, by Central Bank, October 2008 through 2010 central bank Line size
($ bn) as of date range of tenors
offered since inception
minimum bid rate*
Notes current auction format
European Central Bank
full allotment
10/13/2008 O/N, 1-week, 1-month, 3-month
USD OIS + 100
prior to intro of fixed rate, full allotment on Oct 13, 2008 used minimum bid of OIS, same as TAF
non-competitive, fixed rate, full allotment
Swiss National Bank
full allotment
10/13/2008 O/N, 1-week, 1-month, 3-month
USD OIS + 100 bps
prior to intro of fixed rate, full allotment on Oct 13, 2008 used minimum bid of OIS, same as TAF
non-competitive, fixed rate, full allotment
Bank of England
full allotment
10/13/2008 O/N, 1-week, 1-month, 3-month
USD OIS + 100 bps
prior to intro of fixed rate, full allotment on Oct 13, used minimum bid of OIS, same as TAF
non-competitive, fixed rate, full allotment
Reserve Bank of Australia
$30 9/29/2008 1-month, 3-month
USD LIBOR changed min bid rate mid April 2009 from OIS + 50 bps
competitive, multiple-price auction
Reserve Bank of New Zealand
$15 10/28/2008 not drawn
Bank of Japan full allotment
9/29/2008 1-month, 3-month
USD OIS + 100 bps
prior to intro of fixed rate, full allotment on Oct 13, 2008 used minimum bid of OIS, same as TAF
non-competitive, fixed rate, full allotment
Bank of Canada $30 9/29/2008 not drawn
Danmarks Nationalbank
$15 9/29/2008 1-month, 3-month
LIBOR + 50 bps
changed from OIS+50 on Feb 10, 2009 competitive, single price auction
Sveriges Riksbank
$30 9/29/2008 3-month USD OIS + 50 bps
competitive, single price auction
Norges Bank $15 9/29/2008 1-month, 3-month
competitive, multiple-price auction
Bank of Korea $30 10/29/2008 3-month USD OIS + 50 bps
competitive, multiple-price auction
Banco do Brasil $30 10/29/2008 not drawn
Banco de Mexico
$30 10/29/2008 3-month USD OIS + 50 bps
competitive, multiple-price auction
Monetary Authority of
Singapore
$30 10/29/2008 not drawn
Note: Collateral eligibility for these auctions matches criteria for domestic open market operations. As of June 25, 2009 all CB dollar swaps were extended through February 1, 2010. O/N = overnight funds. These auctions were eliminated as of November 7, 2008. *Minimum bid rates calculated from most recent auction announcements/ results
29
Table 3: Net Outstanding Positions by Foreign Central Bank
Dec. 31, 2008 ($billions)
Jun. 30, 2009 ($billions)
Change ($billions)
Percent Change
(%)
Percent Contribution
to Total Change
ECB (euro area)
291.35 59.90 -231.45 -79 53
SNB (Switzerland)
25.18 0.37 -24.81 -99 6
BOE (UK)
33.08 2.50 -30.58 -92 7
BOJ (Japan)
122.72 17.92 -104.79 -85 24
RBA (Australia)
22.83 0.24 -22.59 -99 5
Riksbank (Sweden)
25.00 11.50 -13.50 -54 3
Norges B. (Norway)
8.23 5.00 -3.23 -39 1
DanNB (Denmark)
15.00 3.93 -11.07 -74 3
BOK (South Korea)
10.35 10.00 -0.35 -3 0
BdM (Mexico)
0.00 3.22 3.22 -- -1
Source: FRBNY's Quarterly Report on Treasury and Federal Reserve Foreign Exchange Operations
30
Source: Reuters, Federal Reserve Bank of New York staff calculations
Source: Federal Reserve System's Monthly Reports on Credit and Liquidity Programs and the Balance Sheet
Note: Data is monthly
‐50
0
50
100
150
200
250
300
350
400
450
Aug‐07 Nov‐07 Feb‐08 May‐08 Aug‐08 Nov‐08 Feb‐09 May‐09 Aug‐09
Basis Points
Chart 1: Euro‐U.S. Dollar Implied Swap Basis Spread
1 Month 3 Month
0
100
200
300
400
500
600
Dec‐07 Mar‐08 Jun‐08 Sep‐08 Dec‐08 Mar‐09 Jun‐09 Sep‐09 Dec‐09
Billio
ns of USD
Chart 2: CB Dollar Swap Amounts Outstanding by Foreign Central Bank
BOE BOJ DanNB Norges B. ECB RBA Riksbank SNB BOK BdM
31
Source: U.S. Treasury Report on U.S. International Reserve Position
Note: Data is weekly
Source: Federal Reserve Board, H.4.1 Release -- Factors Affecting Reserve Balances and U.S. Treasury Report on U.S. International
Reserve Position
0
100
200
300
400
500
600
Dec‐07 Mar‐08 Jun‐08 Sep‐08 Dec‐08 Mar‐09 Jun‐09 Sep‐09 Dec‐09
Billions of U
SD
Chart 3: CB Dollar Swap Amounts Outstanding by Loan Term
Maturity <= 30 days 30 days < Maturity <= 90 days
0
100
200
300
400
500
600
Dec‐07 Mar‐08 Jun‐08 Sep‐08 Dec‐08 Mar‐09 Jun‐09 Sep‐09 Dec‐09
Billio
ns of USD
Chart 4: TAF and CB Dollar Swaps Outstanding
CB Dollar Swaps Net Outstanding TAF Net Outstanding
32
Source: Bloomberg (OIS, LIBOR), Federal Reserve (TAF stop out)
Source: Bloomberg (OIS), Federal Reserve (TAF stop out)
0
1
2
3
4
5
6
Dec‐07 Mar‐08 Jun‐08 Sep‐08 Dec‐08 Mar‐09 Jun‐09 Sep‐09 Dec‐09
Percen
t
Chart 5: TAF Stop Out, OIS (1 Month), and LIBOR (1 Month)
Foreign Central Bank Rate TAF Stop Out OIS (1 Month) LIBOR (1 Month)
0
20
40
60
80
100
120
140
160
180
200
Oct‐08 Jan‐09 Apr‐09 Jul‐09 Oct‐09
Basis Points
Chart 6: [OIS+100] ‐ TAF Stop Out*
1 Month
* Prior to October 13,the ECB, BOE, SNB and BOJ used the Fed's TAF stop‐out rate and allocated funds to their bidders on a pro‐rata basis. After October 13, these foreign central banks switched to a full allotment, fixed rate operation at OIS+100 basis points.
33
Source: Bloomberg (USD offshore deposit rate, OIS)
Source: Euribor.org, Bloomberg (for BFSRs provided by Moody’s)
‐200
‐100
0
100
200
300
400
500
Dec‐07 Mar‐08 Jun‐08 Sep‐08 Dec‐08 Mar‐09 Jun‐09 Sep‐09 Dec‐09
Basis Points
Chart 7: Eurodollar ‐ [OIS+100]*
1 Month 3 Month
* 3 month operation was introduced on July 30, 2008.
‐10
‐5
0
5
10
15
Sep‐08 Dec‐08 Mar‐09 Jun‐09 Sep‐09 Dec‐09
Basis Points
Chart 8: Average EURIBOR by Bank Category ‐ EURIBOR Reference Rate(1 Month)
Strong Adequate Modest
34
Source: Euribor.org, Bloomberg (for BFSRs provided by Moody’s)
0
5
10
15
20
25
Sep‐08 Dec‐08 Mar‐09 Jun‐09 Sep‐09 Dec‐09
Number of Banks
Chart 9: EURIBOR Panel Bank Category Count
Strong Adequate Modest