Embed Size (px)
Citation preview

DECISION OF THERESERVE BANK ORGANIZATION COMMITTEE
DETERMINING THE FEDERAL RESERVE DISTRICTSAND THE LOCATION OF FEDERAL RESERVE
BANKS UNDER FEDERAL RESERVE ACTAPPROVED DECEMBER 23, 1913
APRIL 2, 1914
WITH STATEMENT OF THE COMMITTEEIN RELATION THERETO
APRIL 10, 1914
WASHINGTONGOVERNMENT PRINTING OFFICE
Digitized for FRASER Federal Reserve Bank of St. Louis

DECISION OF THE RESERVE BANK ORGANIZATION COMMIT-TEE DETERMINING THE FEDERAL RESERVE DISTRICTSAND THE LOCATION OF THE FEDERAL RESERVE BANKS.
[Under the Federal Reserve Act approved December 23, 1913.]
The Federal Reserve Act directs the Reserve Bank OrganizationCommittee to "designate not less than eight nor more than twelvecities to be known as Federal reserve cities"; to "divide the conti-nental United States, excluding Alaska, into districts, each districtto contain only one of such Federal reserve cities and to apportionthe districts "with due regard to the convenience and customarycourse of business." The act provides that the districts may notnecessarily be coterminous with any State or States.
In determining the reserve districts and in designating the citieswithin such districts where Federal Reserve banks shall be severallylocated, the organization committee has given full consideration tothe important factors bearing upon the subject. The committeeheld public hearings in eighteen of the leading cities from the Atlan-tic to the Pacific and from the Great Lakes to the Gulf, and was ma-terially assisted thereby in determining the districts and the reservecities.
Every reasonable opportunity has been afforded applicant cities tofurnish evidence to support their claims as locations for FederalReserve banks.
More than 200 cities, through their clearing-house associations,chambers of commerce, and other representatives, were heard. Ofthese, thirty-seven cities asked to be designated as the headquartersof a Federal Reserve bank.
The majority of the organization committee, including its chairmanand the Secretary of Agriculture, were present at all hearings, andstenographic reports of the proceedings were made for more deliberateconsideration. Independent investigations were, in addition, madethrough the Treasury Department, and the preference of each bankas to the location of the Federal Reserve bank with which it desiredto be connected was ascertained by an independent card ballotaddressed to each of the 7,471 national banks throughout the coun-try which had formally assented to the provisions of the Federalreserve act.
Among the many factors which governed the committee in deter-mining the respective districts and the selection of the cities whichhave been chosen were:
First. The ability of the member banks within the district to pro-vide the minimum capital of $4,000,000 required for the Federal
3
Digitized for FRASER Federal Reserve Bank of St. Louis
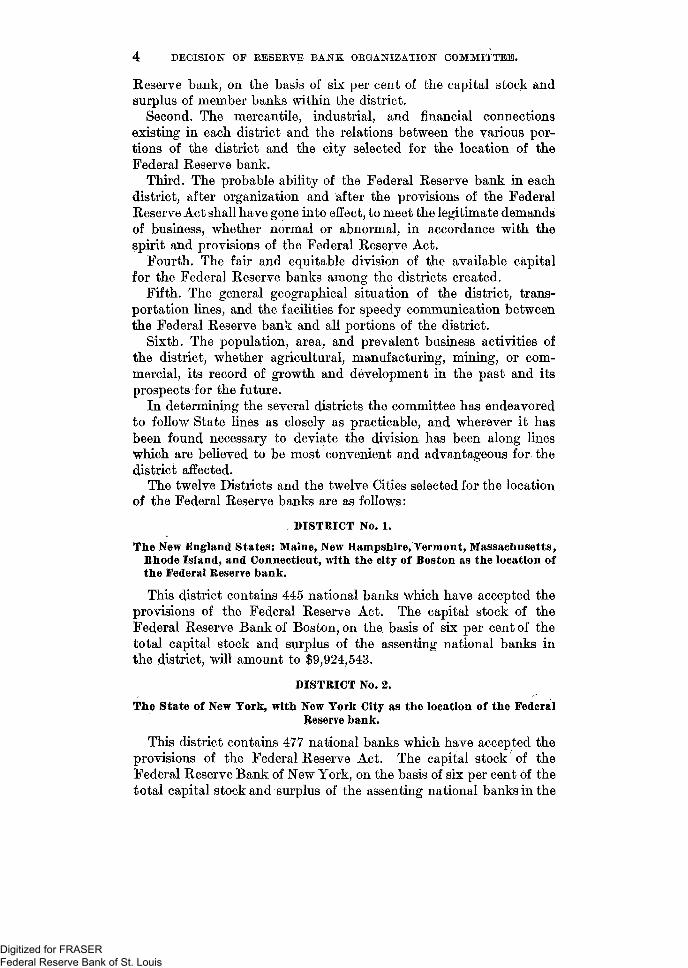
4 DECISION OF RESERVE BANK ORGANIZATION COMMITTEE.
Reserve bank, on the basis of six per cent of the capital stock andsurplus of member banks within the district.
Second. The mercantile, industrial, and financial connectionsexisting in each district and the relations between the various por-tions of the district and the city selected for the location of theFederal Reserve bank.
Third. The probable ability of the Federal Reserve bank in eachdistrict, after organization and after the provisions of the FederalReserve Act shall have gone into effect, to meet the legitimate demandsof business, whether normal or abnormal, in accordance with thespirit and provisions of the Federal Reserve Act.
Fourth. The fair and equitable division of the available capitalfor the Federal Reserve banks among the districts created.
Fifth. The general geographical situation of the district, trans-portation lines, and the facilities for speedy communication betweenthe Federal Reserve bank and all portions of the district.
Sixth. The population, area, and prevalent business activities ofthe district, whether agricultural, manufacturing, mining, or com-mercial, its record of growth and development in the past and itsprospects for the future.
In determining the several districts the committee has endeavoredto follow State lines as closely as practicable, and wherever it hasbeen found necessary to deviate the division has been along lineswhich are believed to be most convenient and advantageous for thedistrict affected.
The twelve Districts and the twelve Cities selected for the locationof the Federal Reserve banks are as follows:
DISTRICT No. 1.
The New England States: Maine, New Hampshire, Vermont, Massachusetts,Rhode Island, and Connecticut, with the city of Boston as the location ofthe Federal Reserve bank.
This district contains 445 national banks which have accepted theprovisions of the Federal Reserve Act. The capital stock of theFederal Reserve Bank of Boston, on the basis of six per cent of thetotal capital stock and surplus of the assenting national banks inthe district, will amount to $9,924,543.
DISTRICT No. 2.
The State of New York, with New York City as the location of the FederalReserve bank.
This district contains 477 national banks which have accepted theprovisions of the Federal Reserve Act. The capital stock of theFederal Reserve Bank of New York, on the basis of six per cent of thetotal capital stock and surplus of the assenting national banks in the
Digitized for FRASER Federal Reserve Bank of St. Louis

DECISION OF RESERVE BANK ORGANIZATION COMMITTEE. 5
district, will amount to $20,621,608; and if there be added six percent of the capital stock and surplus of the State banks and trustcompanies which have applied for membership up to April 1, 1914,the total capital stock will be $20,687,608.
DISTRICT No. 8.
The States of New Jersey and Delaware and all that part of Pennsylvanialocated east of the western boundary of the following counties: McKean,Elk, Clearfield, Cambria, and Bedford, with the Federal Reserve bank inthe city of Philadelphia.
This district contains 757 national banks which have accepted theprovisions of the Federal Reserve Act. The capital stock of theFederal Reserve Bank of Philadelphia, on the basis of six per centof * the total capital stock and surplus of the assenting nationalbanks in the district, will amount to $12,488,138; and if there beadded six per cent of the capital stock and surplus of the State banksand trust companies which have applied for membership up toApril 1, 1914, the total capital stock will be $12,500,738.
DISTRICT No. 4.
The State of Ohio; all that part of Pennsylvania lying west of district No. 3;the counties of Marshall, Ohio, Brooke, and Hancock, in the State of WestVirginia; and all that part of the State of Kentucky located east of thewestern boundary of the following counties: Boone, Grant, Scott, Wood-ford, Jessamine, Garrard, Lincoln, Pulaski, and McCreary; with the cityof Cleveland, Ohio, as the location of the Federal Reserve bank.
This district contains 767 national banks which have accepted theprovisions of the Federal Reserve Act. The capital stock of the FederalReserve Bank of Cleveland, on the basis of six per cent of the totalcapital stock and surplus of the assenting national banks in the dis-trict, will amount to $12,007,384; and if there be added six per cent ofthe capital stock and surplus of the State banks and trust companieswhich have applied for membership up to April 1, 1914, the totalcapital stock will be $12,100,384.
DISTRICT No. 5.
The District of Columbia, and the States of Maryland, Tirginia, NorthCarolina, South Carolina, and all of West Virginia except the counties ofMarshall, Ohio, Brooke, and Hancock, with the Federal Reserve banklocated in the city of Richmond, Ya.
This district contains 475 national banks which have accepted theprovisions of the Federal Reserve Act. The capital stock of the FederalReserve Bank of Richmond, on the basis of six per cent of the totalcapital stock and surplus pf the assenting national banks in the dis-trict, will amount to $6,303,301; and if there be added six per cent ofthe capital stock and surplus toi the State banks and trust companieswhich have applied for membership up to April 1, 1914, the totalcapital stock will be $6,542,713.
Digitized for FRASER Federal Reserve Bank of St. Louis
DECISION OF EESEKVE BANK OKGANIZATION COMMITTEE.
DISTRICT "No. 6.
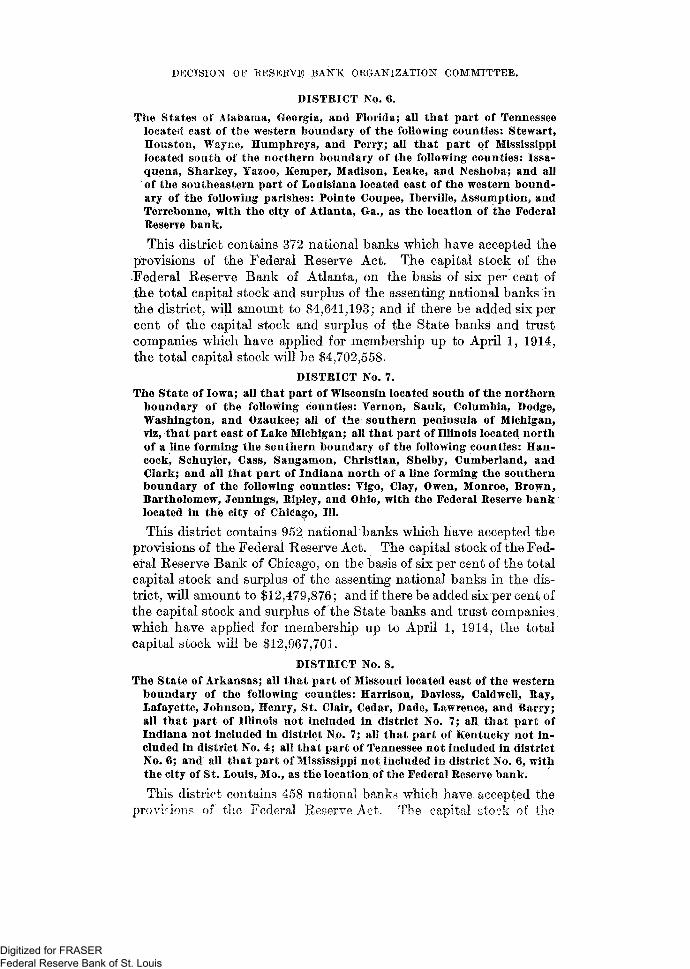
Tlie States of Alabama, Georgia, and Florida; all that part of Tennesseelocated east of the western boundary of the following counties: Stewart,Houston, Wayne, Humphreys, and Perry; all that part of Mississippilocated south of the northern boundary of the following counties: Issa-quena, Sharkey, Yazoo, Kemper, Madison, Leake, and Neshoba; and allof the southeastern part of Louisiana located east of the western bound-ary of the following parishes: Pointe Coupee, Iberville, Assumption, andTerrebonne, with the city of Atlanta, Ga., as the location of the FederalReserve bank.
This district contains 372 national banks which have accepted theprovisions of the Federal Reserve Act. The capital stock of theFederal Reserve Bank of Atlanta, on the basis of six per cent ofthe total capital stock and surplus of the assenting national banks inthe district, will amount to $4,641,193; and if there be added six percent of the capital stock and surplus of the State banks and trustcompanies which have applied for membership up to April 1, 1914,the total capital stock will be $4,702,558.
DISTRICT No. 7.The State of Iowa; all that part of Wisconsin located south of the northern
boundary of the following counties: Yernon, Sauk, Columbia, Dodge,Washington, and Ozaukee; all of the southern peninsula of Michigan,viz, that part east of Lake Michigan; all that part of Illinois located northof a line forming the southern boundary of the following counties: Han-cock, Schuyier, Cass, Sangamon, Christian, Shelby, Cumberland, andClark; and all that part of Indiana north of a line forming the southernboundary of the following counties: Yigo, Clay, Owen, Monroe, Brown,Bartholomew, Jennings, Ripiey, and Ohio, with the Federal Reserve banklocated in the city of Chicago, 111.
This district contains 952 national "banks which have accepted theprovisions of the Federal Reserve Act. The capital stock of the Fed-eral Reserve Bank of Chicago, on the basis of six per cent of the totalcapital stock and surplus of the assenting national banks in the dis-trict, will amount to $12,479,876; and if there be added six per cent ofthe capital stock and surplus of the State banks and trust companies,which have applied for membership up to April 1, 1914, the totalcapital stock will be $12,967,701.
DISTRICT No. 8.The State of Arkansas; all that part of Missouri located east of the western
boundary of the following counties: Harrison, Daviess, Caldweli, Ray,Lafayette, Johnson, Henry, St. Clair, Cedar, Dade, Lawrence, and Barry;all that part of Illinois not included in district No. 7; all. that part ofIndiana not included in district No. 7; all that part of Kentucky not in-cluded in district No. 4; all that part of Tennessee not included in districtNo. 6; and all that part of Mississippi not included in district No. 6, withthe city of St. Louis, Mo., as the location of the Federal Reserve bank.
This district contains 458 national banks which have accepted theprovisions of the Federal Keserve Act. The capital stock of the
Digitized for FRASER Federal Reserve Bank of St. Louis

DECISION OF KESEKVE BANK ORGANIZATION COMMITTEE. 7
Federal Reserve Bank of St. Louis, on the basis of six per cent of thetotal capital stock and surplus of the assenting national banks inthe district, will amount to $4,990,761; and if there bemadded six percent of the capital stock and surplus of the State banks and trustcompanies which have applied for membership up to April 1, 1914,the total capital stock will be $6,367,006.
DISTRICT No. 9.
The States of Montana, North Dakota, South Dakota, Minnesota; all thatpart of Wisconsin not included in district No. 7, and all that part of Mich-igan not included in district No. 1, with the city of Minneapolis, Minn., asthe location of the Federal Reserve hank.
This district contains 687 national banks, which have accepted theprovisions of the Federal Reserve Act. The capital stock of the Fed-eral Reserve Bank of Minneapolis, on the basis of six per cent of thetotal capital stock and surplus of the assenting national banks in thedistrict, will amount to $4,702,925.
DISTRICT No. 10.
The States of Kansas, Nebraska, Colorado, and Wyoming; ail that part ofMissouri not included in district No. 8; all that part of Oklahoma north ofa line forming the southern boundary of the following counties: Ellis,Dewey, Blaine, Canadian, Cleveland, Pottawatomie, Seminole, Okfuskee,Mclntosh, Muskogee, and Sequoyah; and all that part of New Mexiconorth of a line forming the southern boundary of the following counties:McKinley, Sandovai, Santa Fe, San Miguel, and Union, with the city ofKansas City, Mo., as the location of the Federal Reserve bank.
This district contains 836 national banks which have accepted thoprovisions of the Federal Keserve Act. The capital stock of theFederal Reserve Bank of Kansas City, on the basis of six per cent ofthe total capital stock and surplus of the assenting national banks inthe district, will amount to $5,590,015; and if there be added six percent of the capital stock and surplus of the State banks and trustcompanies which have applied for membership up to April 1, 1914,the total capital stock will be $5,600,977.
DISTRICT No. 11.
The State of Texas; all that part of New Mexico not included in district No.10; all that part of Oklahoma not included in district No. 10; all that partof Louisiana not included in district No. 6; and the following counties inthe State of Arizona: Pima, Graham, Greenlee, Cochise, and Santa Cruz,with the city of Dallas, Tex., as the location of the Federal Reserve bank.
This district contains 731 national banks which have accepted theprovisions of the Federal Keserve Act. The capital stock of theFederal Reserve Bank of Dallas; on the basis of six per cent of the totalcapital stock and surplus of the assenting national banks in thedistrict, will amount to $5,540,020; and if there be added six per cent
Digitized for FRASER Federal Reserve Bank of St. Louis
8 DECISION OF KESEKVE BANK ORGANIZATION COMMITTEE.
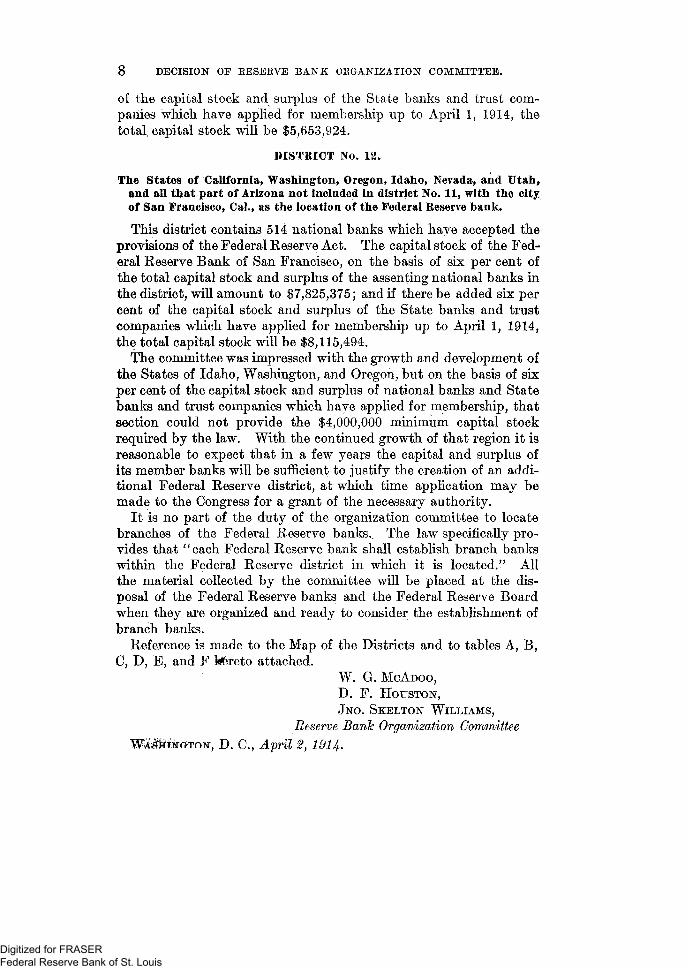
of the capital stock and surplus of the State banks and trust com-panies which have applied for membership up to April 1, 1914, thetotal/capital stock will be $5,653,924.
DISTRICT No. 12.
The States of California, Washington, Oregon, Idaho, Nevada, and Utah,and all that part of Arizona not included in district No. 11, with the city:of San Francisco, Cal., as the location of the Federal Reserve bank.
This district contains 514 national banks which have accepted theprovisions of the Federal Reserve Act. The capital stock of the Fed-eral Reserve Bank of San Francisco, on the basis of six per cent ofthe total capital stock and surplus of the assenting national banks inthe district, will amount to $7,825,375; and if there be added six percent of the capital stock and surplus of the State banks and trustcompanies which have applied for membership up to April 1, 1914,the total capital stock will be $8,115,494.
The committee was impressed with the growth and development ofthe States of Idaho, Washington, and Oregon, but on the basis of sixper cent of the capital stock and surplus of national banks and Statebanks and trust companies which have applied for membership, thatsection could not provide the $4,000,000 minimum capital stockrequired by the law. With the continued growth of that region it isreasonable to expect that in a few years the capital and surplus ofits member banks will be sufficient to justify the creation of an addi-tional Federal Reserve district, at which time application may bemade to the Congress for a grant of the necessary authority.
It is no part of the duty of the organization committee to locatebranches of the Federal Reserve banksv The law specifically pro-vides that "each Federal Reserve bank shall establish branch bankswithin the Federal Reserve district in which it is located." Allthe material collected by the committee will be placed at the dis-posal of the Federal Reserve banks and the Federal Reserve Boardwhen they are organized and ready to consider the establishment ofbranch banks.
Reference is made to the Map of the Districts and to tables A, B,C, D, E, and F Mreto attached.
W. G. MOADOO,D. F. HOUSTON,JNO. SKELTON WILLIAMS,
Reserve Bank Organization Committee/ n . C, April 2,
Digitized for FRASER Federal Reserve Bank of St. Louis

Map showing theLocation of the Twelve
Federal Reserve BanKsand the Boundaries of the
Twelve Federal Reserve Districtsas determined by the
Reserve BanK Organization Committee
•8
iWoQ
6QO
K
Digitized for FRASER Federal Reserve Bank of St. Louis

TABLM A,—Showing iuhenpitms to iioek of federal resefve bariksby national tari&i, S'iaie banks, and trust companies? with area and population of eachdistrict.
fPAET 1.1
Dis-trictNo.
Federal reserve cities.
Districts.
Land areain square
miles.1Popula-tion.1-
National banks March 4,1914.
Num-ber ofbanks.
Capital andsurplus.
6 per centsubscription,
Including State banks and trust com-panies that have applied for mem-bership up to April 1,1914.
Num-ber of
banks.Capital and
surplus.6 per cent
subscription.
BostonNew YorkPhiladelphiaClevelandRichmondAtlantaChicago....St. LouisMinneapolis..Kansas City, Mo..DallasSan/Francisco
61,97647,65440,44972,693
152,931233,821171,306
194,767433,281
,450,831430,329683,852
6,552,6819,113,6147,932,0658,326,6688,519,3108,677,288
12,348,7678,747,6625,195,8865,671,0515,797,9705,089,304
477757767475372952458687£36731514
$165,409,043343,693.437203,135,631200,123,060105,055,02377.353,221
207,997,94183,179,34878.382.08193.166,91292.333,673
130,422,921
$9,924,54320.621.60612.488,13812,007,3846.303.3014.641.193
12.479,8764,990,7614.702,9255,590,0155,540,0207.825.375
445478758769484382967469687839737529
$165,409,043344.793.437208,345,631201,673,060109,045,22378,375,971216,128,363
-106,116,76478.382.08193.349.61294,232,073135.258,231
Total 2,973, 91,972,266 7,471 1,785.252,291 107,115,137 7,544 1,831,109,489
$9,924,54320.687.60612,500,73812,100,3846.542,7134,702.558
12,967,7016.367,0064.702.9255.600,9775.653,9248.115.494
109,866,569
1 United States census of 1910.
Digitized for FRASER Federal Reserve Bank of St. Louis
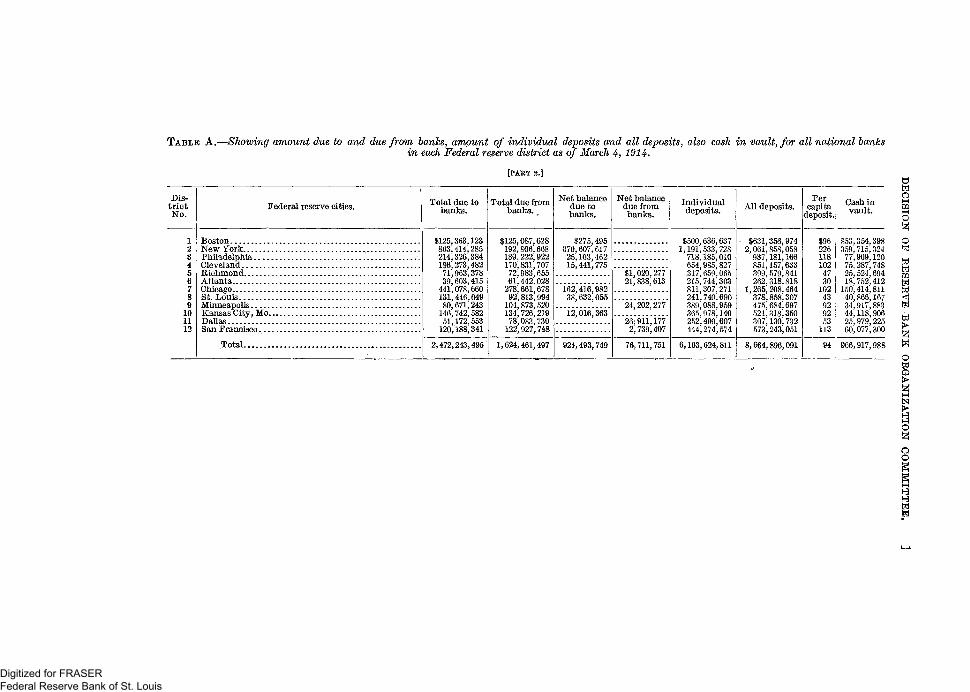
TABLE A.—Showing amount due to and due from hanks, amount of individual deposits and all deposits, also cash in vault, for all national hanksin each Federal reserve district as of March 4, 1914.
[PART 2.j
Dis-trictNo.
Federal reserve cities. Total due tobanks.
Total due frombanks.
Net balancedue tobanks.
Net balancedue frombanks.
Individualdeposits. All deposits.
Percapita
deposit.Cash invault.
oM
wM
oo
02•fei
w
wo
BostonNew YorkPhiladelphia .Cleveland........Richmond........AtlantaChicagoSt. LouisMinneapolisKansas City, Mo.Dallas.San Francisco
$125,363,123863,414,285214,326,384186,273,48271,963,37839,603,415441,078,660131,446,04980,671,243146,742,58251,172,553120,188,341
$125,087,628192,806,668189,222,922170,831,70772,983,65561,442,028278,661,67892,813,994104,873,520134,726,21978,083,730122,927,748
$275,495670,607,61725,103,46215,441,775
162,416,98238,632,055
$1,020,27721,838,613
12,016,36324,202,277
26,911,1772,739,407
$500,1,191,
718,654,317,215,811,241,389,365,252,444,
636,637533,728185,010985,827659,065744,303307,271740,690088,959978,140490,607274,574
$631,356,9742,061,858,058
937,181,166851,157,633399,579,841262,318,818
1,265,208,464378,858,307475,684,697521,318,350307,130,732573,243,051
Total. 2,472,243,495 1,624,461,497 924,493,749 76,711,751 6,103,624,811 8,664,896,091
226118102473010243929253113
$53,359,77,75,25,18,
1.50,40,34,44,25,60.
354,398715,324909,120287,748524,694752,412414,811866,167917,883118,906979,225077,300
94 966,917,988
6H1—i
O
ao
Digitized for FRASER Federal Reserve Bank of St. Louis
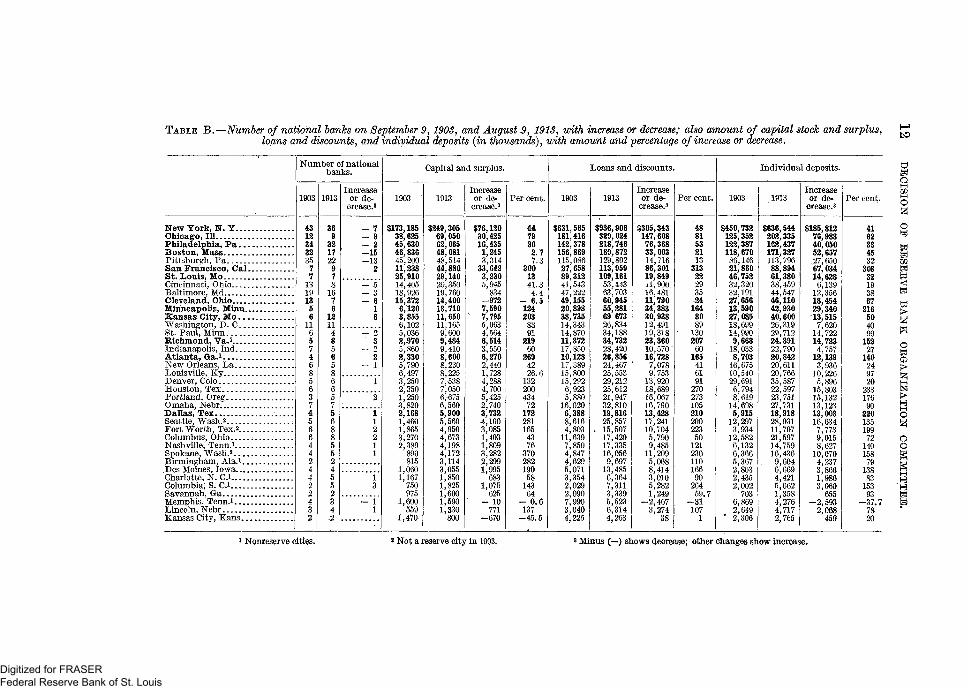
TABLE B.—Number of national banks on September 9, 1903, and^ August 9, 1913, with increase or decrease; also amount of capital stock and surplus,loans and discounts, and individual deposits (in thousands), with amount and percentage of increase or decrease.
Number of nationalbanks.
1903 1913Increase
or de-crease.3
Capital and surplus.
1903 1913Increaseor de- Per cent.
Loans and discounts.
1903 1913Increaseor de-crease.3
Per cent.
Individual deposits.
1903 1913Increaseor de-
crease.3Per cent.
saMUlM
o
02
w
o
gCS3
o
oog
1
Hew York, U. Y... .Chicago, 111Philadelphia, Pa . . .Boston, MassPittsburgh, PaSan Francisco, Cal.St. Louis, MoCincinnati, OhioBaltimore, MdCleveland, OhioMinneapolis, Minn..Kansas City, Mo...Washington, D. C...St. Paul, MinnRichmond, Va.1Indianapolis, Ind....Atlanta, Ga.iNew Orleans, LaLouisville, KyDenver, Colo.Houston, TexPortland, OregOmaha, NebrDallas, TexSeattle, Wash.2Fort Worth, TexA..Columbus, Ohio.....Nashville, Term.1Spokane, Wash.2Birmingham, Ala.i..Des Moines, IowaCharlotte, N. C.iColumbia; S. C.i..Savannah, Ga .,Memphis, Tenn.iLincoln, Nebr ,Kansas City, Kans,..
$173,18538,62545,63046,83645,20011,23825,91014,40518,92615,3726,1203,8556,1025,0362,9705,8602,3305,7906,4973,2502,3501,2503,8202,1681,4601,8653,2702,389
890815
1,0601,167
750975
1,600559
1,470-
$249,30569,05062,06548,08148,51444,88029,14020,35019,76014,40013,71011,65011,1659,6009,4849,4108,6008,2308,2257,5387,0506,6756,5605,9005,5604,9504,6734,1984,1723,1143,0551,8501,8251,6001,5901,330
800
$76,12030,42516,4351,2453,31433,6423,2305,945834
-9727,5907,7955,0634,5646,5143,5506,2702,4401,7284,2884,7005,4252,7403,732-4,1003,0851,4031,8093,2822,2991,995683
l,07f)" 625- 10771
—670
4479362.77.3
3001341.34.4
- 6.51242038391219602694226.61322004347217228116543763702821905814364
- 0.6137-45.5
$631,565181,416142,378156,869115,08627,65889,31241,54347,22249,15520,89838,73514,34314,87011,37217,85010,12817/38915,80015,2926,9235,88016,0206,3888,6164,80311,6397,8504,8474,6295,0713,3542,0292,0907,9903,0404,225
$936,908329,024218,746189,872129,802113,959109,16153,44363,70360,94555,28169 67326,83434,18834,73228,42026,85624,46725,55329,21225,61221,94732,81019,81625,857
- 15,50717,42917,33516,0569,697
13,4856,3647,3113,3395,5236,3144,263
$305,343147,60876,36833,00314,71686,30119,84911,900.16,48111,79034,38330,93812,49119,31823,36010,570'16,7287,0789,75313,92018,68916,06716,79013,42817,24110,7045,7909,48511,2095,0688,4143,0105,2821,249
-2,4673,274
38
4881532113313222935241648089
• 13020760165416191270273105210200223501212301101669026459.7
-311071
$450,732125,352122,387118,670
86,14621,86046,75232,32032,19127,65613,59027,08518,69914,9909,688
18,0338,703
16,67510,54029,6916,7948,619
14,6085,915
12,2973,934
12,5826,1326,3665,3672,8032,4352,002
7036,8692,649
" 2,306
$636,544202,335182,437171,327113,79688,89461,38038.45944,54746,11042,93040,60026,31929,71224,39122,79020,84220,61120,76635,58722,59723,75127,73118,91828,93111,70721,59714,75916,4369,6046,6694,4215,0621,3584,2764,7172,765
$185,81276,98340,05052,657,27,65067,03414,6286,139
12,35618,45429,34013,5157,620
14,72214,7234,757
12,1393,936
10,2265,896
15,80315,13213,12313,00316,6347,7739,0158,627
10,0704,2373,8661,9863,060
655-2 ,593
2,068459
4162334532
30832193867
216504099
15227
140249720
23317690
22013519972
14015879
13883
15393
- 3 7 . 77820
1 Nonreserve cities, 2 Not a reserve city in 1903. 3 Minus (—) shows decrease; other changes show increase.
Digitized for FRASER Federal Reserve Bank of St. Louis
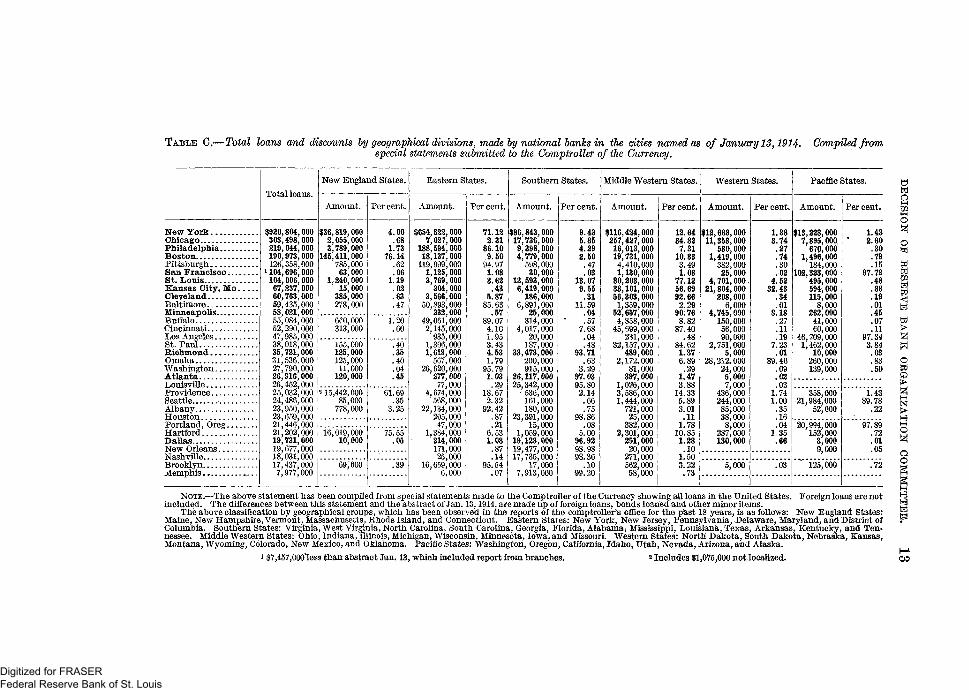
TABLE 0.—Total loans and discounts by geographical divisions, made by national banks in the cities named as of January 13,1914. Compiled fromspecial statements submitted to the Comptroller of the Currency.
Total loans.
New England States.
Amount. Percent.
Eastern States.
Amount. Per cent,
Southern States.
Amount. Per cent.
Middle Western States.
Amount. Per cent.
Western States.
Amount. Per cent.
Pacific States.
Amount. Percent.
gso
tei
W
WoQ
MIS]
1—4
ooo
K
S
New York.Chicago.. . .Philadelphia.. .BostonPittsburghSan Francisco. . .St. LouisKansas City, MoClevelandBaltimoreMinneapolisBuffalo..Cincinnati . . . . . . .Los AngelesSt. PaulRichmondOmahaWashingtonAtlantaLouisville.. . .Providence.SeattleAlbanyHoustonPortland, OregHartford..Dallas. . .New OrleansNashvi l le . . . . . . . . . .BrooklynxvLemphis «...
§920,303,219,190,126,
U04,104,67,60,59,58,55,52,47,
804,000498,000044,000973,000358,000696,000006,000237,000763,000435,000021,000
$36,819,0002,055,0003,789,000
145,411,000785,00063,000
1,240,00015,000385,000278,000
4.00.681.7376.14.62.061.19.02.63.47
38,35,31,27,26;26,
084,000290,000985,000
660,000313,000
1.20.60
25,2423,2321,2119,19,18,17,7,
018,000721,000536.000790,000916,000452,000
155,000125,000125,00011,000120,000
.40
.35
.40
.04
.45
032,000486,000950,000659,000446,000202,000731,000677,000031,000437,000977,000
U5,442,00085,000
778,000
61.69.35
3.25
16,019,00010,000
75.55.05
69,000
$654,822,0007,027,000
188,594,00018,137,000
119,999,0001,125,0003,769,000
304,0003,566,000
50,893,000332,000
49,061,0002,145,000
935,0001,306,0001,619,000
567,00026,620,000
277,00077,000
4,674,000568,000
22,134,000205,00047,000
1,384,000214,000171,00025,000
16,659,0006,000
71.122.31
86.109.50
94.971.08
5.8785.63
.5789.074.101.953.434.531.79
95.791.03
.2918.672.32
92.42.87.21
6.531.08.87.14
95.54.07
$86,843,00017,736,0009,398,0004,779,000
598,00030,000
13,593,0006,419,000
186,0006,891,000
25,000314,000
4,017,00020,000
187,00033,473,000
200,000915,000
26,117,00025,342,000
536,000161,000180,000
23,391,00015,000
1,059,00019,123,00019,477,00017,735,000
17,0007,913,000
9.435.854.292.50.47.03
13.079.55.31
11.59.04.57
7.68.04.48
93.71.63
3.2997.0395.802.14.66.75
98.86.08
5.0096.9298.9898.36
.1099.20
$116,424,000257,427,00016,013,00019,731,0004,410,0001,130,000
80,208,00038,101,00056,303,0001,359,000
52,657,0004,858,000
45,699,000231,000
32,157,000489,000
2,172.00081,000
397,0001,026,0003,586,0001,444,000
721,00025,000
382,0002,301,000
251,00020,000
271,000562,00058,000
12.6484.827.31
10.333.491.08
77.1256.6992.662.29
90.768.82
87.40.48
84.62.1.376.89
.291.473.88
14.335.893.01.11
1.7810.851.28.10
1.503.22.73
$12,668,00011,358,000
580,0001,419,000
382,00025,000
4,701,00021,804,000
208,0006,000
4,745,000150,00056,00090,000
2,751,0005,000
28,212.00024,0005,0007,000
436,000244,00085,00038,0008,000
287,000130 000
1.383.74.27.74.30.02
4.5232.43
.34
.018.18.27.11.19
7.23.01
89.46.09.02.03
1.741.00.35.16.04
1.35
$13,228,0007,895,000
670,0001,496,000
184,000102,323,000
495,000594,000115,000
8,000262,00041,00060,000
46,709,0001,462,000
10,000260,000139,000
358,00021,984,000
52,000
20,994,000152,000
3,0009,000
5,000 125,000
1.432.60
.30
.79
.1597.73
.19
.01
.45
.07
.1197.343.84.03.83.50
1.4389.78
.22
97.89.72.01.05
.72
NOTE.—The above statement has been compiled from special statements made to the Comptroller of the Currency showing all loans in the United States. Foreign loans are notincluded. The differences between this statement and the abstract of Jan. 13,1914, are made up of foreign loans, bonds loaned and other minor items.
The above classification by geographical groups, which has been observed in the reports of the comptroller's office for the past 18 years, is as follows: New England States:Maine, New Hampshire, Vermont, Massachusetts, Rhode Island, and Connecticut. Eastern States: New York, New Jersey, Pennsylvania,' Delaware, Maryland, and District ofColumbia. Southern States: Virginia, West Virginia, North Carolina, South Carolina, Georgia, Florida, Alabama, Mississippi, Louisiana, Texas, Arkansas, Kentucky, and Ten-nessee. Middle Western States: Ohio, Indiana, Illinois, Michigan, Wisconsin, Minnesota, Iowa, and Missouri. Western States: North Dakota, South Dakota, Nebraska, Kansas,Montana, Wyoming, Colorado, New Mexico, and Oklahoma. Pacific States: Washington, Oregon, California, Idaho, Utah, Nevada, Arizona, and Alaska.
* $7,457,000less than abstract Jan. 13, which included report from branches. 2 Includes $1,075,000 not localized.
Digitized for FRASER Federal Reserve Bank of St. Louis

TABLE D.—Showing banh and trust company credit balances with the national banhs in some of the principal cities of the United States; also showingamounts loaned by the national banhs in the same cities to their correspondent banhs; also bought paper and collateral loans to noncustomers of thelending banhs, securities owned, and cash reserve in vaults, as of dates named.
Cities.
Amount ondeposit fromall banks and
trust com-panies through-out the United
States/Feb.14,1914.
Amount loanedto all banks
and trust com-panies on billspayable, and
rediscounts, in-cluding indi-
rect loans withguarantee of
directors, etc.,Jan. 13,1914.
Per centloaned
banks Jan.13,1914,to bankdepositsFeb. 14,
1914.
Bought paper,stock-exchange
loans, etc.,made by na-
tional banks tononcustomers
throughout theUnited States,Jan. 13,1914,
Bonds and se-curities (exclu-sive of bonds
for circulation)held by na-
tional banks,Jan. 13,1914.
Reserve invaults (specie
and legaltenders),
Jan. 13,1914.
Kew York . . . .C h i c a g o . . . . . .Philadelphia.BostonSt. Louis
Pittsburgh.. .Kansas City, Mo.San Francisco i . .AlbanyCleveland..CincinnatiMinneapolisBaltimoreOmahaLos AngelesSt. PaulHoustonLouisvilleBuffaloRichmondPortland, Oreg . . . .SeattleNew OrleansDallas ,NashvilleWashington...At lantaBrooklynMemphisProvidenceHartford
$742,386,939278,824,567173,584,68797,136,156
— 90,430,968
$59,107,39925,663,7066,859,2433,695,480
—14,271,230
7.969.203.953.80
-15.78
$263,803,61829,716,83038,289,40847,402,893
— 16,840,657
$165,827,53331,734,64737,837,52919,958,0136,326,699
.,382,363,317—79,314,345
54,835,43845,859,18839,528,28036,746,82032,593,28231,316,86427,421,90418,533,95916,290,13116,002,06912,616,55311,750,49911,388,53610,970,0688,427,6747,518,8657,229,4706,237,3575,536,7195,516,7054,436,9744,017,8112,377,8361,983,787
835,334
109,597,058— 710,415
18,844,0993,296,431
276,0521,163,5511,955,8162,620,5042,404,8155,768,7621,374,958
792,5941,865,6782,204,727
109,5571,629,449
572,100602,937
1,134,1021,385,6871,158,6221,714,076
892,61210,000
496,006125,000
7.92— .89
34.367.19.70
3.176.008.378.04
31.128.444.95
14.7918.76
.9614.856.798.02
15.7022.2120.9131.0720.12
.2520.866.30
396,053,406•—16,808,600
4,869,20413,850,4321,815,0456,177,6577,675,6672,449,3294,989,0933,507,8782,267,638
12,637,3371,685,9481,879,8333,298,0054,257,5281,574,0593,064.2951,234,109
587,558489,888
3,266,983865,180
4,124,955458,088
13,518,8909,850,001
261,684,421— 37,565,648
4,035,11717,859,3698,340,9386,684,800
13,281,3173,649,7499,120,9022,675,0025,212,1868,036,1661,366,5325,525,095
13,297,7732,444,6395,437,0324,937,6615,587,2331,293,061
91,6329,790,8231,408,3505,684,913
128,0816,336,4691,367,390
$313,586,12888,732,48043,280,79832,661,707
— 26,880,206505,141,319
—24,301,1818,703,544
18,683,8134,756,442
10,025,5468,859,6307,365,8498,715,3114,596,7028,178,0936,425,8363,596,0443,322,6044,471,7882,276,4515,387,3744,654,5242,830,7692,546,9271,164,9304,053,1931,855,4274,322,5371,189,7211,804,6141,348,465
The cities included in the above list are all either central reserve or reserve cities, except the cities of Buffalo, N. Y.; Providence, B . I.; Hartford, Conn.; Richmond, Va.;Atlanta, Ga., Memphis and Nashville, Tenn., which are not reserve cities.
1 Does not include loans and deposits from banks, in other cities, of branches of Bank of California, N. B. A.
Digitized for FRASER Federal Reserve Bank of St. Louis

TABLE E.—Statement showing population, capital and surplus, individual deposits, and loans and discounts of all national hanks, as of March 4, 1914,in the 37 cities which ashed to be designated as Federal reserve cities.
Location. PoDula-tion.i
Numberof banks.
Capital andsurplus.
Percapita.
Individualdeposits.
$176,088,004771,724,999184,643,39240,479,02539,154,84321,853,183120,260,0884,331,39442,553,45128,491,40225,705,8664,578,5736,398,13824,348,9121,443,16120,430,5749,995,561
x 6,115,19710,109,9307,511,21616,857,832211,558,24761,685,92545,453,53235,788,14240,415,21027,258,86934,124,2724,439,21218,551,84711,629,15825,013,95195,756,48429,498,64622,595,27716,156,83011,103,182
Percapita.
$26816111972108120225104768620113524315722917516022657509790150167162220160101201159317230124109155120
Loans anddiscounts.
Percapita.
1. Boston2. New York3. Philadelphia.....4. Cleveland . .5. Cincinnati,6. Columbus7. Pittsburgh8. Wheeling.9. Baltimore
10. Washington11. Richmond12. Charlotte13. Columbia14. Atlanta15. Savannah16. Louisville17. Birmingham18. Montgomery19. Chattanooga20. Memphis..21. New Orleans22. Chicago23. St. Louis24. Minneapolis......25. St. Paul26. Kansas City, Mo27. Omaha28. Denver29. -Lincoln30. Dallas31. Fort Worth32. Houston33. San Francisco...34. Seatt le. . .35. Portland..36. Spokane37. Salt Lake Ci ty . . .
670,5854,766,8831,549,008
560,663363,591181,511533,90541,641
558,485331,069127,62834,01426,319
154,83965,064
223,928132,68538,13644,604
131,105339,075
2,185,283687,029301,408214,744248,381124,096213,38143,97392,10473,31278,800
416,912237,194207,214104,40292,777
$47,896,000248,505,00062,215,00014,400,00020,350,0004,685,500
46,714,000. 1,700,00019,205,72011,365,0009,314,3921,850,0001,887,5008,600,0001,600,0008,280,0003,300,0002,515,0002,975,0002,140,0006,730,000
69,050,00029,140,00013,710,0009,887,081
11,660,0006,570,0007,545,0001,330,0005,900,0004,275,0007,125,000
45,185,0005,596,5006,780,0004,175,0003,482,500
$7152402556258840343473547256243725
6616203142454647533532645890
10823324037
$200,480,9341,082,272,650232,906,82262,588,73555,761,63817,169,907124,568,2314,915,61360,312,95325,405,55435,593,0446,785,0577,322,26226,038,7313,244,93827,999,42710,449,2745,658,21311,565,5197,014,35917,285,254335,820,233102,138,74457,973,49137,437,91366,205,05432,848,39728,022,3776,066,19218,622,56412,632,40825,923,087120,287,60823,948,33820,173,77413,985,08411,791,043
$299227153112153952331181087727919927816850125791482595351154149192174267265131138202172329288101- 97134127
i United States census of 1910.
Digitized for FRASER Federal Reserve Bank of St. Louis

TABLE F.—Statement showing population, capital and surplus, individual deposits, and loans and discounts of all reporting banks (National, State,savings, and loan and trust companies), as of June 4,1913, in the 37 cities which ashed to be designated as Federal reserve cities.
Location.
1.2.3.4.5.6.7.8.9.
10.11.12.13.14.15.16.17.18.19.20.21.
24.25.26.27.28.29.30.31.32.33.34.35.
BostonITew YorkPhiladelphiaClevelandCincinnatiColumbusPittsburghWheelingBaltimoreWashingtonRichmondCharlotteColumbiaAtlantaSavannahLouisvilleBirminghamMontgomeryChattanoogaMemphisNew OrleansChicagoSt. LouisMinneapolisSt. PaulKansas City, Mo.OmahaDenverLincoln .. .DallasFort WorthHouston...SanFranciscpSeattle.Portland
37. Salt Lake City.,
Popula-tion.*
670,585766,883549,008560,663363,591181,511533,90541,641
558,485331,069127,62834,01426,319
154,83965,064
223,928132,68538,13644,604
131,105339,075185,283
.687,029301,408214,744248,381124,096213,38143,97392,10473,31278,800
416,912237,194207,214104,40292, 777
Numberof banksand trust
com-panies.
60142100353921831155362679
281618119
10221988443320301431151318134532221818
Capital andsurplus.
$100,779,114563,221,701177,448,74141,635,10031,813,1077,099,000
130,037,1454,949,393
47,952,46929,161,73116,810,9552,680,0002,365,318
15.313,4488,129,605
15,100,2976,685,6203,396,7624,294,1147,346,214
20,532,500151,882,559
^72,222,50020,731,39111,260,845
-17,415,5008,165,000
11,489,5512,042,0009,997,0006,667,724
13,599,10073,623,32511,567,02012,097,7187,660,8767,838,696
Percapita.
$150. 118
114748739
2431188588
131788998
1256750899656
105685270655346
10890
17217648587384
Individualdeposits.
$661,950,2542,866,351,069
592,533,612271,693,21798,178,79430,498,790
350,298,87218,845,965
190,679,44072,552,23635,371,1266,616,6425,894,711
28,371,03220,622,52341,437,59923,182,6086,018,942
15,166,95023,343,84170,854,415
con Ana QQOOo<6, fttfo, aaa-205,443,737
78,258,93040,490,496
—66,562,43128,038,69457,371,1717,253,010
24,808,89114,375,27426,551,714
313,153,94267,527,32556,805,14025,821,75133,623,153
Percapita.
$987601382484270168656452341219277194223183316185174157340179209oia
-299260189268
~~~226269165269196329752285274-249362
Loans anddiscounts.
$561,625,6272,306,503,682413,298,566188,499,40388,845,79124,186,704291,668,67816,802,317118,912,25363,012,06650,004,5729,242,9368,511,38433,494,03528,061,70038,701,07921,494,7057,756,14116,355,76024,442,32164,845,722690,799,087
—233,385,65582,720,05642,322,46591,686,871
-—34,989,69941,365,1438,696,24027,517,33816,861,83132, 775,530281,447,42448,963,00744,132,64423,235,69730,676,029
Percapita. Q
Bo
$803483266336244133547405213190393271326216431172162204366186194315
—-339274197370
--282194198299231415675206213223330
§
w>WoQ>
ao
3Htel
1 United States census of 1910.
Digitized for FRASER Federal Reserve Bank of St. Louis
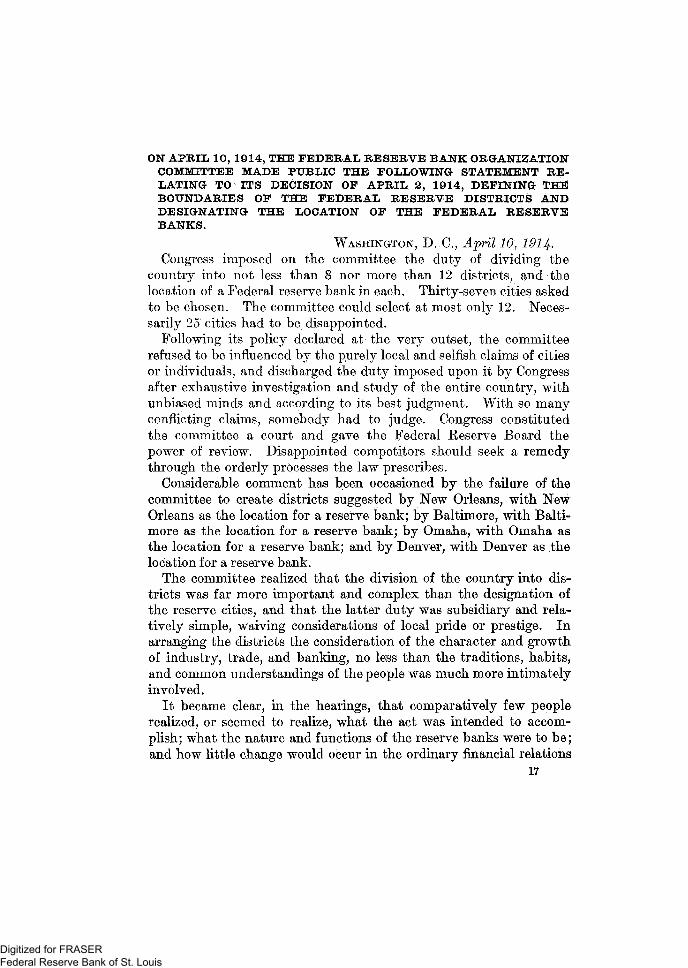
ON APRIL 10, 1914, THE FEDERAL RESERVE BANK ORGANIZATIONCOMMITTEE MADE PUBLIC THE FOLLOWING STATEMENT RE-LATING TO ITS DECISION OF APRIL 2, 1914, DEFINING THEBOUNDARIES OF THE FEDERAL RESERVE DISTRICTS ANDDESIGNATING THE LOCATION OF THE FEDERAL RESERVEBANKS.
WASHINGTON, D..C, April 10; 1914,Congress imposed on the committee the duty of dividing the
country into not less than 8 nor more than 12 districts, and thelocation of a Federal reserve bank in each. Thirty-seven cities askedto be chosen. The committee could select at most only 12. Neces-sarily 25 cities had to be disappointed.
Following its policy declared at the very outset, the committeerefused to be influenced by the purely local and selfish claims of citiesor individuals, and discharged the duty imposed upon it by Congressafter exhaustive investigation and study of the entire country, withunbiased minds and according to its best judgment. With so manyconflicting claims, somebody had to judge. Congress constitutedthe committee a court and gave the Federal Reserve Board thepower of review. Disappointed competitors should seek a remedythrough the orderly processes the law prescribes.
Considerable comment has been occasioned by the failure of thecommittee to create districts suggested by New Orleans, with NewOrleans as the location for a reserve bank; by Baltimore, with Balti-more as the location for a reserve bank; by Omaha, with Omaha asthe location for a reserve bank; and by Denver, with Denver as thelocation for a reserve bank.
The committee realized that the division of the country into dis-tricts was far more important and complex than the designation ofthe reserve cities, and that the latter duty was subsidiary and rela-tively simple, waiving considerations of local pride or prestige. Inarranging the districts the consideration of the character and growthof industry, trade, and banking, no less than the traditions, habits,and common understandings of the people was much more intimatelyinvolved.
It became clear, in, the hearings, that comparatively few peoplerealized, or seemed to realize, what the act was intended to accom-plish; what the nature and functions of the reserve banks were to be;and how little change would occur in the ordinary financial relations
17
Digitized for FRASER Federal Reserve Bank of St. Louis

18 STATEMENT OF RESERVE BANK ORGANIZATION COMMITTEE.
of the communities, the business establishments, and the individualbanks.
Critics of the decision of the committee reveal misunderstandingin these directions, and either do not know, or appear n,ot to know,that the Federal reserve banks are bankers' banks and not ordinarycommercial banks; that they are to hold the reserves and to clearthe checks of member banks, make rediscounts for them, and engagein certain open-market operations. As a matter of fact, the ordinaryevery-day banking relations of the community, of business men,and of banks will not be greatly modified or altered. The purposeof the system is to remove artificiality, promote normal relations,and create better conditions under which everybody will transactbusiness.
Every city can continue to do business with individuals, firms, orcorporations, within its own limits, or in its own region, or in anyother part of the Union or the world in which it has heretofore donebusiness.
Reserves are to be held in a new way and in new places, so far asthis act controls them, but banking and business generally will nomore be confined within districts than heretofore, and it is simplymisleading for any city or individual to represent that the future ofa city will be injuriously affected by reason of its failure to securea Federal reserve bank. Every city which has the foundations forprosperity and progress will continue to grow and expand, whether ithas such a reserve bank or not, and well-informed bankers, especially,are aware of this.
The facts which the committee had to consider will throw light onits decision in reference to these cities.
NEW ORLEANS7 CLAIMS.
New Orleans selected a district extending from New Mexico to theAtlantic Ocean, including all of Texas, Louisiana, Mississippi,Alabama, Florida, Georgia, and that part of Tennessee south of thaTennessee River.
It was represented by Texas that it would do great violence to hertrade to connect her with New Orleans. It was claimed, and evidencewas submitted in support of the claim, that her trade was with herown cities or with Kansas City and St. Louis. In a poll of the banksof Texas made by the Comptroller of the Currency, 212 banks ex-pressed a first choice, 121 a second choice, and 30 a third choice forDallas. No bank in Texas expressed a first choice for New Orleans,only 4 a second choice, and 44 a third choice. The whole Stateprotested against being related to New Orleans.
The banks of Alabama generally desired to be connected eitherwith Birmingham or Atlanta, only three expressing a first choice for
Digitized for FRASER Federal Reserve Bank of St. Louis

STATEMENT OF RESERVE BANK ORGANIZATION COMMITTEE. 19
New Orleans. The banks of Georgia desired to be connected withAtlanta, none expressing a first or second choice for New Orleans,and only 12 a third choice. They represented that it would do vio-lence to them to be connected with a city to the west and claimedthat their relations were mainly with Atlanta or cities to the north-east. Of 44 banks in Florida 19 gave Atlanta as their first choice,19 as their second choice, and 5 as their third choice. Only 5 ex-pressed a first preference for New Orleans, and these were in thewestern corner, 4 a second choice, and 3 a third choice. No bank inTennessee expressed *a first or second choice for New Orleans, andonly 2 a third choice, while 7 expressed a first choice for Atlanta, 14a second choice, and 13 a third choice. Generally speaking, the onlybanks which desired to be connected with New Orleans and expresseda first preference for her were 25 of the 26 banks reporting in Lou-isiana, and 19 of the 32 in Mississippi. On a poll made from thecomptroller's office of all banks expressing their preference as to thelocation for a Federal reserve city, 124 expressed a first preference forAtlanta, 232 for Dallas, and only 52 for New Orleans. The views ofthe bankers were supported by chambers of commerce, other businessorganizations, and by many business men.
It will thus be seen that if the committee was to give weight to theviews of business men and bankers in the section of the countryaffected, to consider the opposition of the States of Texas, Alabama,Georgia, Florida, and Tennessee, and to be guided by economic con-siderations, it could not have designated New Orleans as the locationfor a reserve bank to serve either the western or the eastern part ofthe district that city asked for. The course of business is not fromthe Atlantic seaboard toward New Orleans, nor largely from the Stateof Texas to that city, and if Dallas and Atlanta had been related toNew Orleans a better grounded complaint could and would have beenlodged by them against the committee's decision than that made byNew Orleans.
Some of the banking statistics which the committee had to considerthrow light on the problem^ It should be borne in mind that thecommittee could consider primarily only the statistics with referenceto assenting banks. In this section of the country, as in most others,the assenting banks Were the national banks. In March, 1914, thecapital stock and surplus, loans and discounts, and individual depositsof the national banks in the three cities named, as shown by the swornreports to the Comptroller qf the Currency, were as follows:
Atlanta . . . . . . . . „.DallasNew Orleans.. „..
Capital andsurplus.
$8,600,0005,900,0006,730,000
Loans anddiscounts.
$26,038,00018,622,00017,285,000
Individualdeposits.
$24,348,00018,551,00016,857,00a
Digitized for FRASER Federal Reserve Bank of St. Louis

2 0 STATEMENT OF RESERVE BANK ORGANIZATION COMMITTEE.
Even more significant are the statistics of growth from September,1904, to March, 1914.
CAPITAL AND SURPLUS.
Atlanta <Dallas . . . . . . . .New Orleans.... „
September,1904.
$2,410,0002,676,0006,250,000
March, 1914.
$8,600,0005,900,0006,730,000
Percentageof
increase.
256120
8
LOANS AND DISCOUNTS.
Atlanta . . . . . . .DallasNew Orleans.
$10,329,0007,653,000
20,088,000
$26,038,00018,622,00017,285,000
152143
Decrease 13
INDIVIDUAL DEPOSITS.
At lanta . . . . . . .Dallas..New Orleans.,
$9,931,0007,157,000
19,425,000
$24,348,00018,551,00016,857,000
145159
Decrease 13
The loans and discounts in the national banks of New Orleans atthe time of the report, March 4, 1914, were less than those of thenational banks of either Atlanta or Dallas.
While the committee could not figure on the resources of other thanassenting banks which are in this section, the national banks, thefollowing statistics of all reporting banks, including national banks,State banks, and trust companies, as of June 4, 1913, were regardedas significant and were given consideration:
Atlanta reported capital stock and surplus $15,313,000, or $98 percapita; Dallas $9,997,000, or $108 per capita; and New Orleans$20,532,000, or $60 per capita. Individual deposits, per capita,Atlanta, $183; Dallas, $269; New Orleans, $209.
The loans and discounts for all reporting banks for the three citieswere as follows: Atlanta, $33,494,000, or $216 per capita; Dallas,$27,517,000, or $299 per capita; New Orleans, $64,845,000, or $194per capita.
The committee found that the total loans and discounts made bynational banks in the cities named in the 13 Southern States onJanuary 13, 1914, were as follows:
Atlanta. $26,117,000Dallas . 19,123,000New Orleans „ 19,477,000
while the total loans made by the national banks of Dallas throughoutthe entire United States on the date mentioned exceeded the loansmade by the national banks of New Orleans.
Special reports, made under oath to the Comptroller of the Currencyalso show that on February 14, 1914, the credit balances of the banks
Digitized for FRASER Federal Reserve Bank of St. Louis

STATEMENT OF RESERVE BATs K ORGANIZATION" COMMITTEE* 2 1
and trust companies in the 13 Southern States with the nationalbanks of Dallas exceeded in amount the credit balances of all banksand trust companies in these same States with the national banks ofNew Orleans.
In view of the comparisons and criticisms from New Orleans inconnection with the designation of Dallas, Atlanta, and Richmond,and the omission of New Orleans and Baltimore, the following tableis instructive:
National bank statistics for States of Texas, Virginia, Maryland, Georgia, Louisiana,and Mississippi as of March 4,1914.
[According to sworn reports made to the Comptroller of the Currency.]
Area(squaremiles).
Popula-tion, cen-sus 1910.
Capital andsurplus.
Individualdeposits.
Loans anddiscounts.
State of Texas (including Dallas)State of Virginia (including Richmond).State of Maryland (including Balti-
more)State of Georgia (including Atlanta). . .State of Louisiana (including New
Orleans).State of Mississippi
265,78042,450
12,21059,475
48,72046,810
3,896,5422,061,612
1,295,3462,609,121
1,656,3881,797,114
$76,785,58429; 732,696
28,267,42024,479,735
12,128,8665,168,192
1197,663,33890,887,858
83,217,37651,382,061
32,000,52117,045,324
$215,114,326107,410,063
91,326,94261,852,579
34,804,35413,669,200
From the above statement it will be seen that in each item, capitaland surplus, individual deposits, and loans and discounts, the nationalbanks of Virginia, including Richmond, largely surpass the nationalbanks of Maryland, including Baltimore.
The capital and surplus of the national banks of the State of Vir-ginia are 60 per cent greater than the capital and surplus of thenational banks of the States of Louisiana and Mississippi combined,including the city of New Orleans, while the loans and discounts bythe national banks of Virginia are more than three times as great asthe loans and discounts in the national banks of Louisiana, includ-ing New Orleans.
While the capital and surplus of the national banks of Georgialargely exceed the combined capital and surplus of the national banksof the States of both Mississippi and Louisiana, the loans and dis-counts made by the national banks of Georgia exceed by $13,000,000the loans and discounts of all the national banks of Louisiana andMississippi combined, including the city of New Orleans.
The capital an-d surplus of the national banks of Texas amount tofour times as much as the capital and surplus of the national banks ofthe States of Louisiana and Mississippi combined, and the individualdeposits in the national banks of Texas also amount to about fourtimes as much as the individual deposits of all national banks inLouisiana and Mississippi, the only States from which New Orleansreceived as much as half a dozen votes as first choice for the locationfor a Federal reserve bank.
Digitized for FRASER Federal Reserve Bank of St. Louis

2 2 STATEMENT OF RESEKVE BANK ORGANIZATION COMMITTEE.
KANSAS CITY DISTRICT.
The region' in the middle and far West presented problems ofdifficulty. Careful consideration was given to the claims of Omaha,Lincoln, Denver, and Kansas City, which conflicted in this region.Denver asked for a district which included Idaho, Montana, Utah,Wyoming, Colorado, New Mexico, and the eastern two-thirds of Ari-zona and Texas, Kansas and Nebraska west of the one-hundredthmeridian, and the Deadwood portion of South Dakota. The districtgave approximately-the minimum capital provided by law. Of theterritory included in this district Montana unanimously requested tobe connected with Minneapolis or Chicago, saying that she had littleor no trade relations with Denver. Idaho desired to go to Portlandor San Francisco; Arizona preferred San Francisco, and the greaterpart of New Mexico asked for Kansas. City. Western Texas,Kansas, and Nebraska unanimously protested against going to Den-ver. Kansas desired Kansas City; Nebraska preferred Omaha orLincoln; and Texas wanted either a Texas city or Kansas City or St.Louis.
In the poll of banks, Denver received 136 first-choice votes, ofwhich 112 were from Colorado and 12 from Wyoming. With Mon-tana, Idaho, Arizona, Texas, Kansas, and Nebraska in. opposition,it was clearly impossible to make a district with Denver as the loca-tion of a bank. Part of the territory asked to be assigned to SanFrancisco and the other part to Minneapolis or Kansas City.
Omaha asked for a district embracing western Iowa, all of Nebraska,part of South Dakota, part of Kansas, Colorado, Utah, Wyoming,Idaho, and Montana. All but eight of the banks in South Dakotainsisted upon being connected with Minneapolis; Iowa desired to goto Chicago; Kansas practically unanimously voted for Kansas City;Montana protested against any other connection than Minneapolisor Chicago. The preferences of the other States have already beenindicated.
Of the 218 banks which expressed a first preference for Omaha, 181were from Nebraska. The committee had to consider the State ofOklahoma and part of Missouri in connection with this region, andin district No. 10, 497 banks expressed a first preference for KansasCity; western Missouri, Oklahoma, and Kansas, and part of NewMexico, especially asked for this connection. Thirty-seven banks inColorado gave Kansas City as second choice and 26 gave Omaha.
It seemed impossible to serve the great section from KansasCity to the mountains in any other way than by creating a districtwith Kansas City as the headquarters, or to provide for the north-western section except by creating a district with Minneapolis asheadquarters. The only other thing that could have been donewith Nebraska under the conditions which presented themselves
Digitized for FRASER Federal Reserve Bank of St. Louis

STATEMENT OF RESERVE BANK ORGANIZATION COMMITTEE. 2 3
was to relate her to Chicago, and this seemed,to be inadvisable inthe circumstances. The Kansas City banks serve a very distinctiveterritory and will serve it more satisfactorily than St. Louis couldhave done. The relations of that territory on the whole are muchmore largely with Kansas City than with any other city in theMiddle West with which it could have been connected. It will,of course, be recognized by those who are informed that of thefour cities Kansas City is the most dominant banking and businesscenter. The following statistics as of March, 1914, will throw lighton the situation:
Kansas CityOmaha.DenverLincoln .
Capital andsurplus.
$11,660,0006,570,0007,545,0001,330,000
Loans anddiscounts.
$66,205,00032,848,00028,022,0006,066,000
Individual-deposits.
$40,415,00027,258,00034,124,0004,439,000
The statistics of growth during the nine years from September,1904, to March, 1914, are significant:
CAPITAL AND SURPLUS.
Kansas City.OmahaDenverLincoln
September,1904.
$3,900,0003,880,0003,325,000
768,000
March, 1914.
$11,660,0006,570,0007,545,0001,330,000
Percentageof increase.
199
12773
Kansas CityOmahaDenver.Lincoln
Kansas City.. .Omaha.DenverLincoln..
LOANS AND DISCOUNTS.
$35,598,00016,218,00014,146,000
. 3,820,000
$66,205,00032,848,00028,022,0006,066,000
INDIVIDUAL DEPOSITS.
$30,730,00015,728,00027,798,0003,283,000
140,415,00027,258,00034,124,0004,439,000
861029858
31732235
The loans and discounts of all reporting banks and trust com-panies in Kansas City on June 4, 1913, amounted to $91,686,000,exceeding by about $7,000,000 the total loans and discounts of allbanks and trust companies in the cities of Omaha, Denver, andLincoln combined.
The loans and discounts of the national banks alone in KansasCity also exceeded the sum total of the loans and discounts of allnational banks in the cities of Omaha and Denver combined.
The great preponderance in the movement of trade in districtNo. 10 is to the east. In order to place the Federal reserve bank for
Digitized for FRASER Federal Reserve Bank of St. Louis
2 4 STATEMENT OF RESERVE BANK ORGANIZATION COMMITTEE.
that region in Denver it would have been necessary to disregardthese facts and the opposition and earnest protests of banks, bothnational and State, throughout the district.
THE RICHMOND DISTRICT.
The committee named as cities for the location of Federal reservebanks New York, Chicago, Philadelphia, St. Louis, Boston, andCleveland. In population these are the six largest cities in theUnited States; their geographical situation and all other considera-tions fully justified their selection.
San Francisco and Minneapolis were the first choice of the greatmajority of the national banks in their respective sections, andtheir financial, industrial, and commercial relations and other factorsentitled them to be chosen. Their selection appears to have evokedno criticism, but to have received general approval. Conditionsrelating-to the Kansas City? Dallas, and Atlanta districts have beendealt with.
For the territory from eastern Georgia to the Pennsylvania line,the committee, after fully considering all the facts, decided to createa district with the Federal reserve bank at Richmond. SouthCarolina and North Carolina had protested against being connected^with a bank to the south or west. They said that their course oftrade was northeast. It seemed undesirable to place a bank in theextreme northeastern corner or at Baltimore, not only because ofits proximity to Philadelphia, but also because the industrial andbanking relations of the greater part of the district were more inti-mate with Richmond than with either Washington or Baltimore.The States of Maryland, Virginia, West Virginia, North and SouthCarolina, and the District of Columbia had to be considered. NorthCarolina, South Carolina, and Virginia preferred to be connectedwith Richmond. West Virginia was divided in its preferences;Maryland and the District of Columbia, of course, desired Baltimoreor Washington. In the poll of banks made directly by the comp-troller's office, Richmond received more first-choice ballots than anyother city in the district—167 against 128 for Baltimore, 35 for Pitts-burgh, 28 for Columbia, S. C, 37 for Cincinnati, and 25 for Washing-ton, D. C. Of the remaining 21 votes, 19 were for Charlotte, N. C,and 2 for New York. Leaving out the States of Maryland and Vir-ginia, Richmond received from the rest of the district three timesas many first-choice votes as were cast for Baltimore.
District No. 5 is composed of the States of Maryland, Virginia, WestVirginia (except four counties), North and South Carolina, and theDistrict of Columbia. These States have always been closely boundtogether commercially and financially and their business dealings arelarge and intimate. The reports made to the Comptroller of the Cur-
Digitized for FRASER Federal Reserve Bank of St. Louis
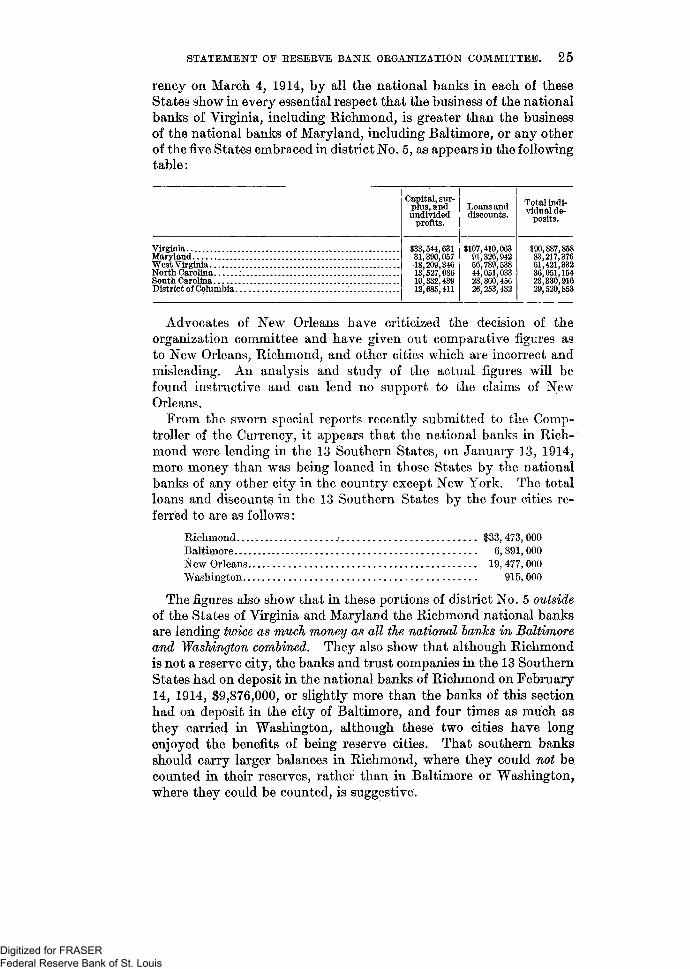
STATEMENT OF RESEKVE BANK ORGANIZATION COMMITTEE. 2 5
rency on March 4, 1914, by all the national banks in each of theseStates show in every essential respect that the business of the nationalbanks of Virginia, including Richmond, is greater than the businessof the national banks of Maryland, including Baltimore, or any otherof the five States embraced in district No. 5, as appears in the followingtable:
Capital, sur-plus, andundivided
profits.
Loans anddiscounts.
Total indi-vidual de-
VirginiaMarylandWest Virginia-.North CarolinaSouth CarolinaDistrict of Columbia
$33,544,63131,390,05718,209,34613,527,08610,332,43912,685,411
$107,410,06391,326,94256,789,53844,051,03328,860,45626,253,432
•190,887,85883,217,37661,421,33236,051,15423,330,91629,520,853
Advocates of New Orleans have criticized the decision of theorganization committee and have given out comparative figures asto New Orleans, Richmond, and other cities which are incorrect andmisleading. An analysis and study of the actual figures will befound instructive and can lend no support to the claims of NewOrleans.
From the sworn special reports recently submitted to the Comp-troller of the Currency, it appears that the national banks in Rich-mond were lending in the 13 Southern States, on January 13, 1914,more money than was being loaned in those States by the nationalbanks of any other city in the country except New York. The totalloans and discounts in the 13 Southern States by the four cities re-ferred to are as follows:
Richmond.... .° $33,473,000Baltimore 6,891,000New Orleans 19, 477, 000Washington 915, 000
The figures also show that in these portions of district No. 5 outsideof the States of Virginia and Maryland the Richmond national banksare lending twice as much money as all the national hanks in Baltimoreand Washington combined. They also show that although Richmondis not a reserve city, the banks and trust companies in the 13 SouthernStates had on deposit in the national banks of Richmond on February14, 1914, $9,876,000, or slightly more than the banks of this sectionhad on deposit in the city of Baltimore, and four times as much asthey carried in Washington, although these two cities have longenjoyed the benefits of being reserve cities. That southern banksshould carry larger balances in Richmond, where they could not becounted in their reserves, rather than in Baltimore or Washington,where they could be counted, is suggestive.
Digitized for FRASER Federal Reserve Bank of St. Louis
2 6 STATEMENT OF RESERVE BANK ORGANIZATION COMMITTEE.
The figures show that the capital and surplus of all reportingbanks—national, State, and savings, and trust companies—percapita, in Richmond, as of June 4, 1913, was $131; in Baltimore, $85;in Washington, $88; and in New Orleans, $60, while the loans anddiscounts made by all banks and trust companies in Richmond, onthe same date, amounted to $393 per capita, against $190 in Washing-ton, $213 in Baltimore, and $194 in New Orleans.
The amount of money which banks and trust companies in thevarious "parts of the country carried on deposit with Richmond, a non-reserve city, on February 14, 1914) amounted to $10,970,000, ornearly twice as much as the balances carried by outside banks withthe national banks of Washington, which on the same day amountedto $5,516,000, and one and one-half times as much as they carriedon the same day with the national banks of New Orleans, a reservecity.
The statistics furnished the organization committee show that onMarch 4, 1914, the capital and surplus of the national banks of Rich-mond, per capita, amounted to more than twice as much as the capitaland surplus, per capita, of the national banks of either Baltimore orWashington, and three and a half times as much as New Orleans,while the individual deposits of the national banks of Richmondamounted to $201 per capita, against $86 for Washington and $76for Baltimore and $50 for New Orleans. The loans and discountsin the national banks of Richmond on the same date were reportedat $279 per capita, against $77 for Washington, $108 for Balti-more and $51 for New Orleans.
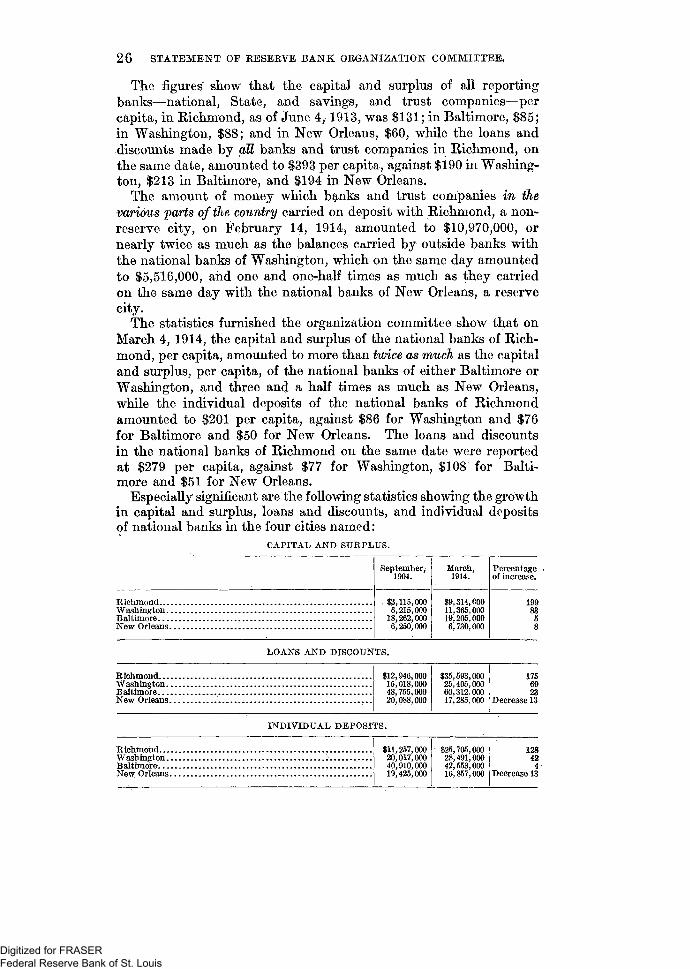
Especially significant are the following statistics showing the growthin capital and surplus, loans and discounts, and individual depositsof national banks in the four cities named:
Richmond
BaltimoreNew Orleans
CAPITAL AND SURPLUS.
September,1904.
. $3,115,0006,215,000
18,262,0006,250,000
March,1914.
$9,314,00011,365,00019,205,0006,730,000
Percentageof increase.
1998358
LOANS AND DISCOUNTS.
RichmondWashington..BaltimoreNew Orleans.
$12,15,48,20,
946,018,755,088,
000000000000
$3525
593405
60,31217 285
,000,000.000,000
1756923
Decrease 13
INDIVIDUAL DEPOSITS.
RichmondWashington..BaltimoreNew Orleans.
$11,257,00020,017,00040,910,00019,425,000
' $25,28,42,16,
705,491553857,
000000000000
128424
Decrease 13
Digitized for FRASER Federal Reserve Bank of St. Louis
STATEMENT OF RESERVE BANK ORGANIZATION COMMITTEE. 2 7
In other words, the figures show that the national banks of Rich-mond were lending on March 4, 1914, twice as much money as allthe national banks in the city of New Orleans, and 40 per cent morethan all the national banks of Washington.
In the original decision of the committee the various economicand other factors which entered into and determined the committee'saction were enumerated and need not be repeated here. Thisstatement is made for the purpose of disclosing some of the detailswhich influenced the Committee's findings.
o
Digitized for FRASER Federal Reserve Bank of St. Louis