Embed Size (px)
Citation preview
F E D E R A L R E S E R V E
BULLETINOCTOBER 1954
BOARD OF GOVERNORS
OF THE FEDERAL RESERVE SYSTEI
WASHINGTON
Digitized for FRASER http://fraser.stlouisfed.org/ Federal Reserve Bank of St. Louis
FEDERAL RESERVE BULLETINVOLUME 40 October 1954 NUMBER 10
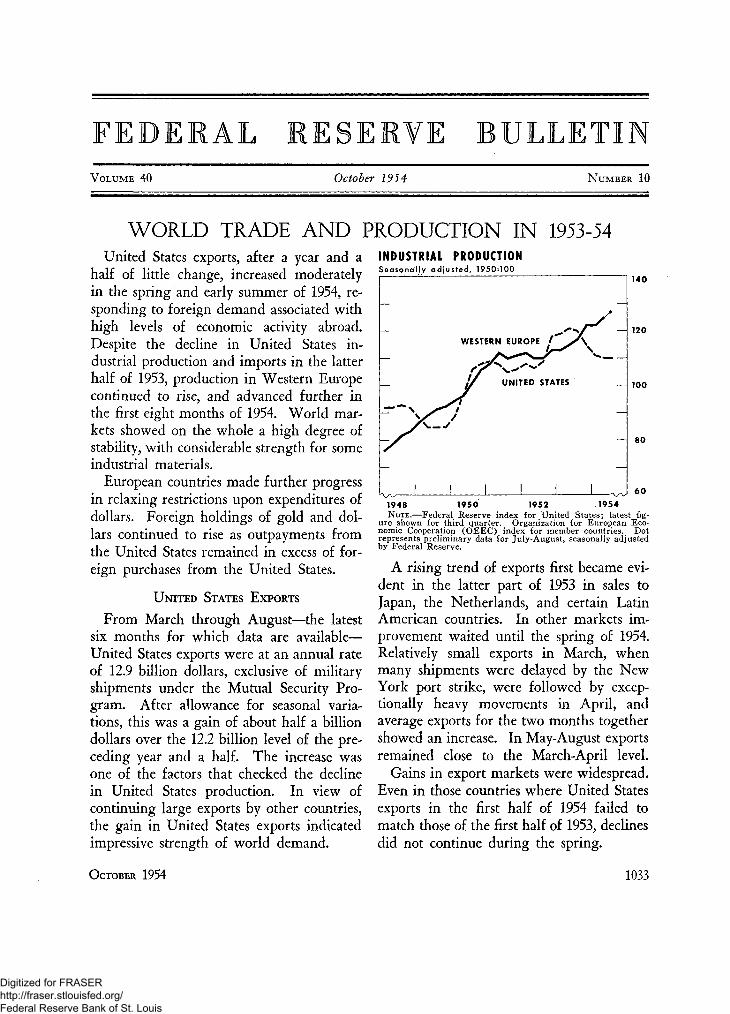
WORLD TRADE AND PRODUCTION IN 1953-54United States exports, after a year and a
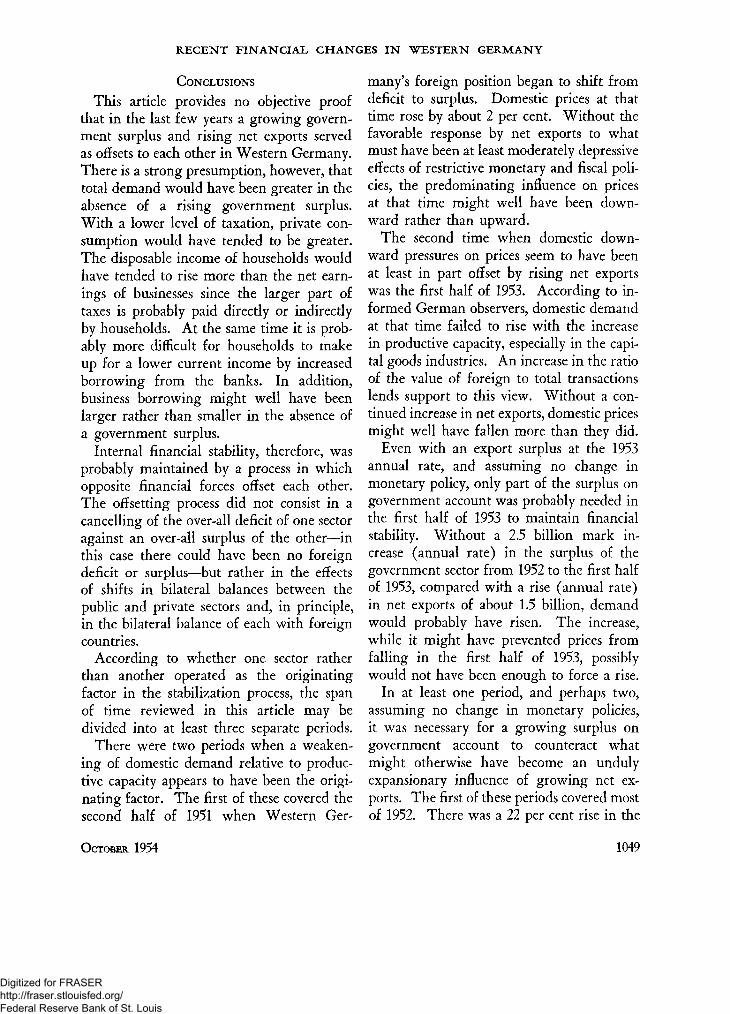
half of little change, increased moderatelyin the spring and early summer of 1954, re-sponding to foreign demand associated withhigh levels of economic activity abroad.Despite the decline in United States in-dustrial production and imports in the latterhalf of 1953, production in Western Europecontinued to rise, and advanced further inthe first eight months of 1954. World mar-kets showed on the whole a high degree ofstability, with considerable strength for someindustrial materials.
European countries made further progressin relaxing restrictions upon expenditures ofdollars. Foreign holdings of gold and dol-lars continued to rise as outpayments fromthe United States remained in excess of for-eign purchases from the United States.
UNITED STATES EXPORTS
From March through August—the latestsix months for which data are available—United States exports were at an annual rateof 12.9 billion dollars, exclusive of militaryshipments under the Mutual Security Pro-gram. After allowance for seasonal varia-tions, this was a gain of about half a billiondollars over the 12.2 billion level of the pre-ceding year and a half. The increase wasone of the factors that checked the declinein United States production. In view ofcontinuing large exports by other countries,the gain in United States exports indicatedimpressive strength of world demand.
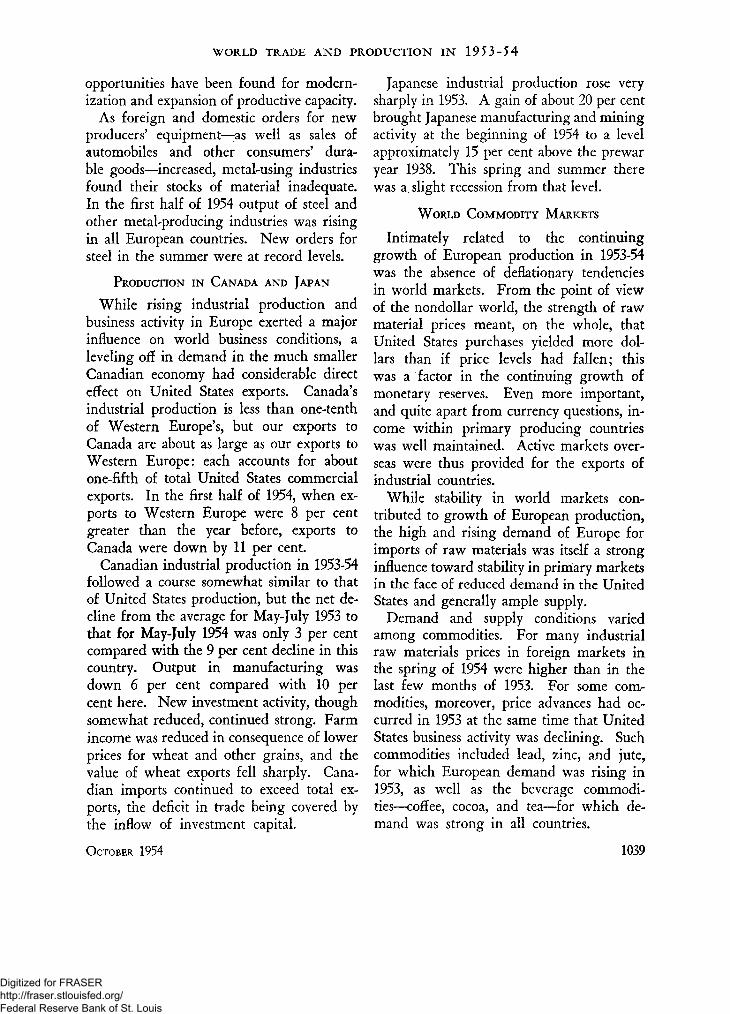
INDUSTRIAL PRODUCTIONSeasonally adjusted, 1950=100
WESTERN EUROPE /
UNITED STATES
140
120
100
80
601948 1950 1952 1954NOTE.—Federal Reserve index for United States; latest fig-
ure shown for third quarter. Organization for European Eco-nomic Cooperation (OEEC) index for member countries. Dotrepresents preliminary data for July-August, seasonally adjustedby Federal Reserve.
A rising trend of exports first became evi-dent in the latter part of 1953 in sales toJapan, the Netherlands, and certain LatinAmerican countries. In other markets im-provement waited until the spring of 1954.Relatively small exports in March, whenmany shipments were delayed by the NewYork port strike, were followed by excep-tionally heavy movements in April, andaverage exports for the two months togethershowed an increase. In May-August exportsremained close to the March-April level.
Gains in export markets were widespread.Even in those countries where United Statesexports in the first half of 1954 failed tomatch those of the first half of 1953, declinesdid not continue during the spring.
OCTOBER 1954 1033
Digitized for FRASER http://fraser.stlouisfed.org/ Federal Reserve Bank of St. Louis
WORLD TRADE AND PRODUCTION IN 1953-54
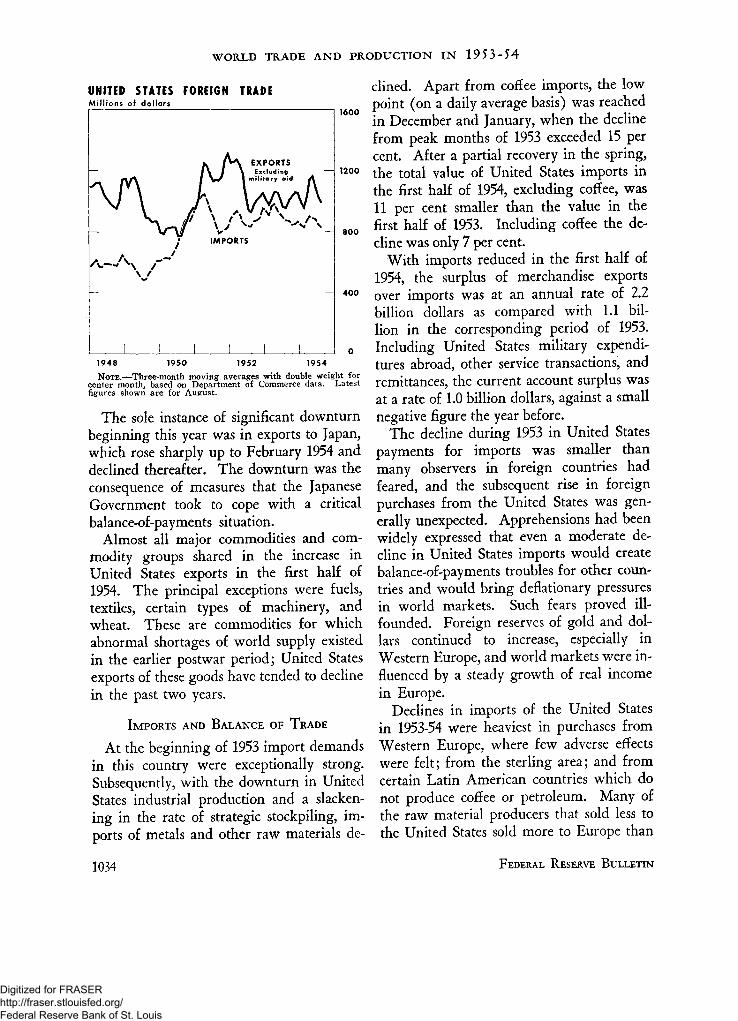
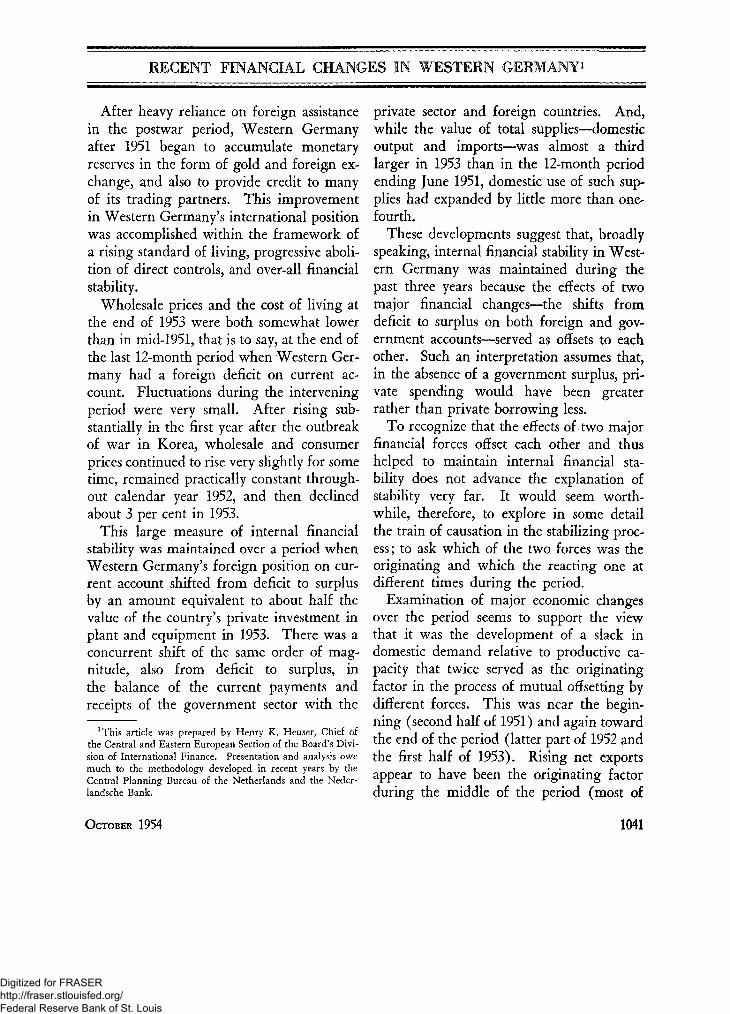
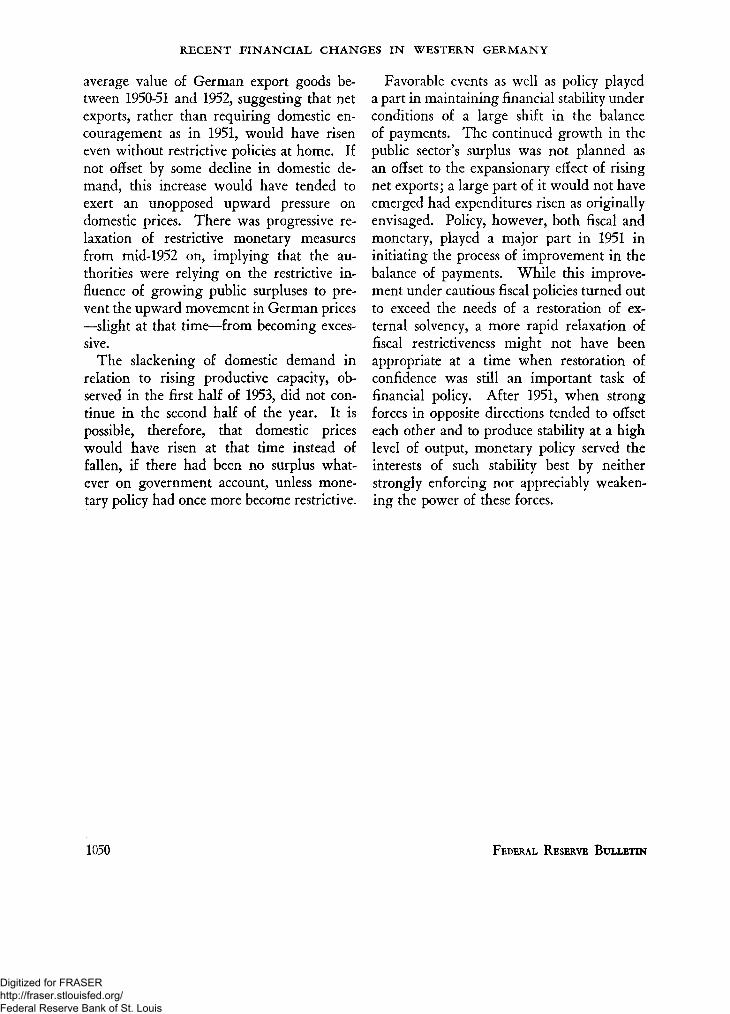
UNITED STATES FOREIGN TRADEMillions of dollars
V
I W 1 military aid A
V —IMPORTS
—
I 1 1
1600
— 1200
— 800
400
1948 1950 1952 1954NOTE.—Three-month moving averages with double weight for
center month, based on Department of Commerce data. Latestfigures shown are for August.
The sole instance of significant downturnbeginning this year was in exports to Japan,which rose sharply up to February 1954 anddeclined thereafter. The downturn was theconsequence of measures that the JapaneseGovernment took to cope with a criticalbalance-of-payments situation.
Almost all major commodities and com-modity groups shared in the increase inUnited States exports in the first half of1954. The principal exceptions were fuels,textiles, certain types of machinery, andwheat. These are commodities for whichabnormal shortages of world supply existedin the earlier postwar period; United Statesexports of these goods have tended to declinein the past two years.
IMPORTS AND BALANCE OF TRADE
At the beginning of 1953 import demandsin this country were exceptionally strong.Subsequently, with the downturn in UnitedStates industrial production and a slacken-ing in the rate of strategic stockpiling, im-ports of metals and other raw materials de-
clined. Apart from coffee imports, the lowpoint (on a daily average basis) was reachedin December and January, when the declinefrom peak months of 1953 exceeded 15 percent. After a partial recovery in the spring,the total value of United States imports inthe first half of 1954, excluding coffee, was11 per cent smaller than the value in thefirst half of 1953. Including coffee the de-cline was only 7 per cent.
With imports reduced in the first half of1954, the surplus of merchandise exportsover imports was at an annual rate of 2.2billion dollars as compared with LI bil-lion in the corresponding period of 1953.Including United States military expendi-tures abroad, other service transactions, andremittances, the current account surplus wasat a rate of 1.0 billion dollars, against a smallnegative figure the year before.
The decline during 1953 in United Statespayments for imports was smaller thanmany observers in foreign countries hadfeared, and the subsequent rise in foreignpurchases from the United States was gen-erally unexpected. Apprehensions had beenwidely expressed that even a moderate de-cline in United States imports would createbalance-of-payments troubles for other coun-tries and would bring deflationary pressuresin world markets. Such fears proved ill-founded. Foreign reserves of gold and dol-lars continued to increase, especially inWestern Europe, and world markets were in-fluenced by a steady growth of real incomein Europe.
Declines in imports of the United Statesin 1953-54 were heaviest in purchases fromWestern Europe, where few adverse effectswere felt; from the sterling area; and fromcertain Latin American countries which donot produce coffee or petroleum. Many ofthe raw material producers that sold less tothe United States sold more to Europe than
1034 FEDERAL RESERVE BULLETIN
Digitized for FRASER http://fraser.stlouisfed.org/ Federal Reserve Bank of St. Louis

WORLD TRADE AND PRODUCTION IN 1953-54
before. In some cases this meant replacingdollar earnings with earnings of sterling orof other nondollar currencies. In view ofthe strength of sterling in international ex-change markets, pressures to maximize netearnings of dollars were not so heavy as inearlier years.
ADDITIONS TO FOREIGN RESERVES
At mid-1954 the gold reserves and officialand private holdings of dollars of foreigncountries (excluding the U.S.S.R.) and ofinternational institutions totaled 27.4 billiondollars, as compared with 22.6 billion twoyears earlier. The increase in 1953-54 was2.4 billion dollars, the same as the yearbefore. Net transfers from the UnitedStates in 1953-54 amounted to 1.7 billiondollars, compared with 2.1 billion in thepreceding twelve-month period, but ad-ditions to foreign reserves of gold from newproduction and other sources greatly ex-ceeded those of the previous year.
In the first half of 1954 foreign gains ofgold and dollars from transactions with theUnited States were considerably smaller thanin earlier half-year periods. They neverthe-less amounted, as shown in the table, to morethan 600 million dollars—an annual rate ofalmost 1.3 billion dollars.
United States military expenditures forgoods and services to be used abroad ortransferred to other nations were 1.2 billiondollars in the first half of 1954, only slightlymore than in the corresponding period of1953. An increase in payments for offshoreprocurement in Europe was offset by a de-cline in military expenditures in Japan.Changes in private service transactions andremittances were relatively small. The prin-cipal factors altering the current accountbalance were the decline in payments forcommercial imports and the rise in exports.
Another significant change in the over-
UNITED STATES BALANCE OF PAYMENTS AND INCREASE IN
FOREIGN GOLD RESERVES AND DOLLAR HOLDINGS
[In billions of dollars]
Item
Payments from United States:Merchandise imports1
Services and remittances1
Military expendituresGovt. economic aid and loans (net)U. S. private direct investment (net)
Total
Foreign payments to United States:Merchandise exports2
Private investment incomeOther exports of services2
Total
Balance available for increase in foreignassets, etc.:
Unidentified transactionsNet repayments to private U. S. creditors
and repatriation of foreign securitiesMiscellaneous foreign assets in U. S
Foreign U. S. dollar holdings3
Gold purchased from U. S
Increase in foreign gold reserves anddollar holdings:
From transactions with United StatesGold entering reserves from other sources...
Totals
January-June
1954 v
5.271.661.20
.62
.36
9 .10
6.36.86
1.43
.8.64
+ .46
- . 0 1
- . 2 9+ .13
+ .56+ .06
+ .63+ .38
+1.01
1953
5.681.721.161.02
.42
10.00
6.23.83
1.40
8.46
+1.55
+ .12
+ .27+ .02
+ .40+ .73
+ 1.13+ .12
+1.25
P Preliminary.1 Excluding military expenditures, shown separately.2 Excluding military transfers under aid programs (1954, 1.82
billion dollars; 1953, 2.66 billion).3Federal Reserve data, including holdings of international
institutions. Dollar holdings include holdings of short-term U. S.Government securities and also certain long-term U. S. Govern-ment securities held for foreign official accounts.
NOTE.—Department of Commerce data, except dollar holdingsand gold entering foreign reserves from sources other than trans-actions with the United States. Details may not add to totalsbecause of rounding. The current account balance (on goods,services, and remittances) may be derived by deducting the firstthree items of "payments from United States" from total "foreignpayments to United States."
all balance of payments was a decline of 400million dollars in the net outflow of Govern-ment aid and loans. There was also a smalldecline in the outflow of United States pri-vate capital for direct investment abroad.The balance of funds from these sources andfrom current account transactions, availablefor additions to foreign official gold reserves,for additions to foreign official and privateassets in the United States, and for repay-ment of foreign debts to private persons inthe United States or repatriation of foreignsecurities, amounted to about 450 million
OCTOBER 1954 1035
Digitized for FRASER http://fraser.stlouisfed.org/ Federal Reserve Bank of St. Louis
WORLD TRADE AND PRODUCTION IN 1953-54
dollars, as against 1,550 million in the firsthalf of 1953.
In the first half of 1953 part of the verylarge balance of funds had been absorbed,as the table on the preceding page shows, bya substantial flow of repayments and repatria-tion of securities. In the first half of 1954, onthe other hand, net movements of UnitedStates short-term and portfolio capital wereoutward, providing additional funds to for-eigners. Thus net acquisitions of dollar hold-ings and of gold from the United States inthe first half of 1954 amounted, as notedabove, to about 600 million dollars. Goldentering foreign reserves from other sourcesamounted to about 400 million, so that thetotal gain for the half year reached 1 billiondollars. Since midyear there have been fur-ther additions to foreign reserves.
RELAXATION OF EXCHANGE CONTROLS
The marked improvement in reserve posi-tions of foreign countries, particularly inEurope, has had two major consequences.In conjunction with the maintenance ofstable price levels, it has given Europeangovernments and central banks a wider mar-gin of freedom to allow expansion of in-ternal demand without risk of balance-of-payments crises, and it has brought a gradualrelaxation of trade and exchange controls.
A notable development in the field of ex-change controls occurred in March 1954,when the United Kingdom simplified its con-trols over transfers of foreign-held sterlingamong foreigners. "Transferable sterling"still cannot be paid to or used directly by per-sons in the dollar area, but its other uses areno longer limited by British regulations. Be-sides normal trade purchases in nondollarcountries and purchases in London of suchdollar commodities as copper, zinc, sugar,and coffee, these uses now include capitaltransfers among nondollar countries, and the
purchase of dollar funds in free markets out-side the sterling countries. Throughout thespring and summer the free exchange ratefor transferable sterling against dollars waswithin 2 per cent of the dollar rate forAmerican-held (convertible) sterling.
Western Germany, Belgium, and theNetherlands have established somewhat sim-ilar arrangements for foreign use of their cur-rencies. They have also relaxed restrictionson the withdrawal of foreign long-term in-vestments. American and Swiss holders, likeothers, may now withdraw in their own cur-rency from the Netherlands or Belgium theproceeds of securities liquidated in thosecountries. Blocked accounts in Germanywere replaced in September 1954 by "liberal-ized capital accounts," which have wider useswithin Germany and may be converted at of-ficial rates into other currencies except dollars.
Residents of these continental countriesnow have considerable freedom to make in-vestments abroad. Residents of the UnitedKingdom have recently been allowed greaterlatitude to invest in Canada.
In the field of trade and exchange controlsaffecting imports, where liberalization ofintra-European and intra-sterling area trans-actions was far advanced by mid-1953, thegradual removal of quotas and other directrestrictions on imports of dollar goods wasaccelerated in 1954. Among recent ac-tions of this kind were those of Sweden inSeptember and Italy in August. Switzer-land, Belgium, the Netherlands, and SouthAfrica are still in the lead among Europeanand sterling area countries in this respect.
In the United Kingdom, imports of mostraw materials and foodstuffs from the dollararea have been completely freed from con-trols, but manufactured goods, though morefreely admitted than in 1951, are still subjectto discriminatory restriction. In Germany,on the other hand, many types of dollar
1036 FEDERAL RESERVE BULLETIN
Digitized for FRASER http://fraser.stlouisfed.org/ Federal Reserve Bank of St. Louis
WORLD TRADE AND PRODUCTION IN 1953-54
manufactures are admitted freely, while im-ports of foodstuffs and of some materialsare still under direct control.
Germany, Italy, and Japan still make con-siderable use of bilateral trade agreementswith raw-material-producing countries. Un-der present conditions these agreements ap-pear to be employed not so much for thepurpose of economizing on dollar expendi-ture as for obtaining reciprocal advantagesin exporting.
In those countries which have gone thefarthest in removing old restrictions on dol-lar transactions, important new fields havebeen opened up for competition by UnitedStates exporters. At the same time theloosening of controls has benefited indus-tries abroad that depend upon importedmaterials and equipment that they arenow free to buy in the most advantageousmarkets. It has stimulated greater efficiencyin those industries which must compete in-creasingly at home and abroad with prod-ucts of the United States and other nations.
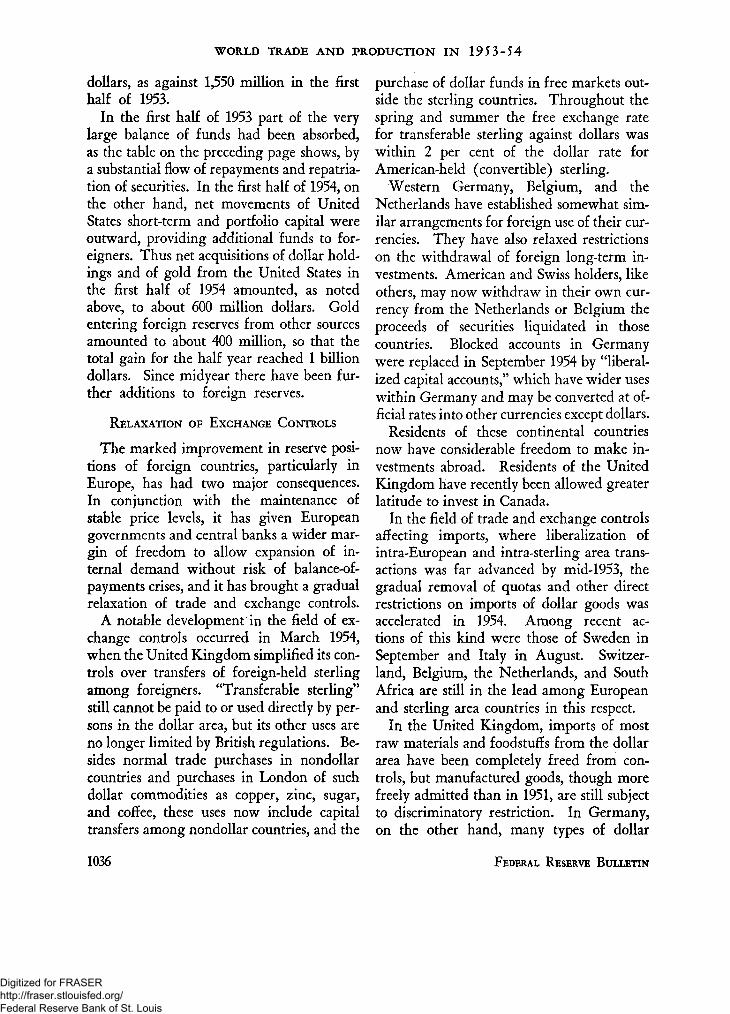
WORLD EXPORTSBillions of U. S. dollars, annual rates
OEEC EUROPETO OUTSIDE-
LATIN AMERICA
JAPAN
I I 1
OUTER STERLINGAREA
OTHERS
CANADA
1 I I
15
10
1950 1952 1954 1950 1952 1954
NOTE.—Based on data from Department of Commerce,Dominion Bureau of Statistics (Canada), OEEC, and Inter-national Monetary Fund. OEEC exports shown are those ofmember countries to all others, including dependencies. Outersterling area excludes sterling OEEC members: United King-dom, Ireland, and Iceland. Latest figures shown are for firsthalf of 1954.
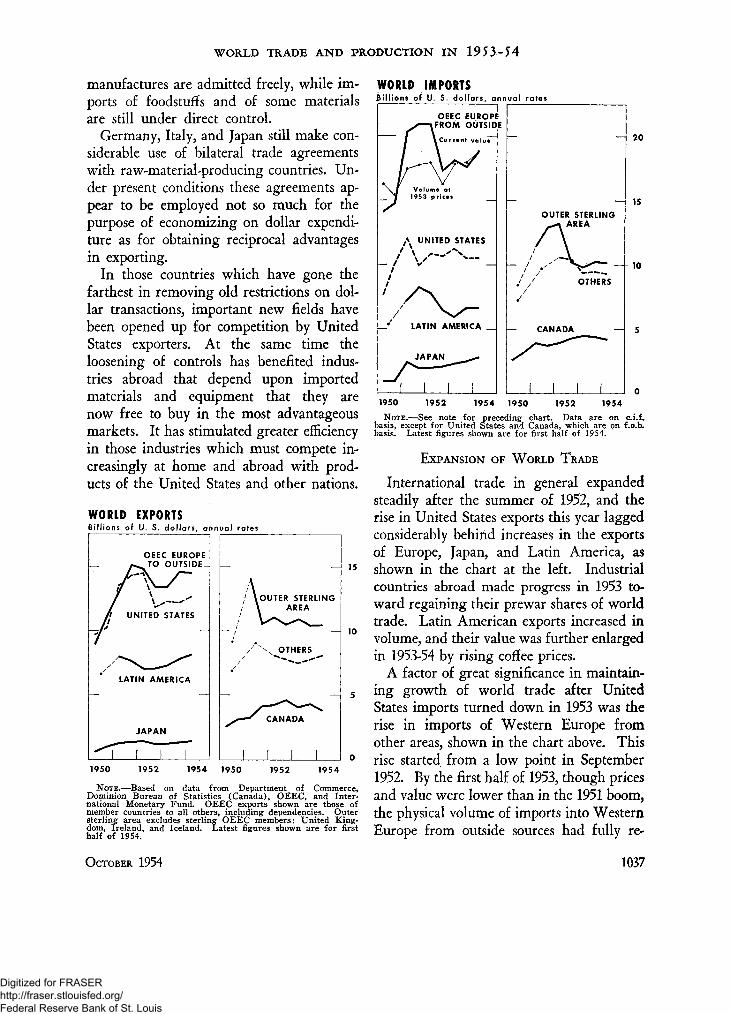
WORLD IMPORTSBillions of U. S. dollars, annual rates
OEEC EUROPEFROM OUTSIDE
UNITED STATES
_ ' LATIN AMERICA _
JAPAN
OUTER STERLINGAREA
OTHERS
— CANADA
1 I (
20
15
10
1950 1952 1954 1950 1952 1954NOTE.—See note for preceding chart. Data are on c.i.f.
basis, except for United States and Canada, which are on f.o.b.basis. Latest figures shown are for first half of 1954.
EXPANSION OF WORLD TRADE
International trade in general expandedsteadily after the summer of 1952, and therise in United States exports this year laggedconsiderably behind increases in the exportsof Europe, Japan, and Latin America, asshown in the chart at the left. Industrialcountries abroad made progress in 1953 to-ward regaining their prewar shares of worldtrade. Latin American exports increased involume, and their value was further enlargedin 1953-54 by rising coffee prices.
A factor of great significance in maintain-ing growth of world trade after UnitedStates imports turned down in 1953 was therise in imports of Western Europe fromother areas, shown in the chart above. Thisrise started from a low point in September1952. By the first half of 1953, though pricesand value were lower than in the 1951 boom,the physical volume of imports into WesternEurope from outside sources had fully re-
OCTOBER 1954 1037
Digitized for FRASER http://fraser.stlouisfed.org/ Federal Reserve Bank of St. Louis
WORLD TRADE AND PRODUCTION IN 1953-54
gained the 1951 level. By the first half of1954 there was a further increase of 5 percent in volume and 3 per cent in value.
Another source of increasing demand inworld trade in the latter part of 1953 wasJapan. Unlike the increase in European im-ports, the financing of which caused no seri-ous difficulties, the 25 per cent rise in Japa-nese imports during 1953 led to drains onJapan's reserves of dollars and sterling, whichwere also showing the effect of a decline inUnited States military expenditures in Japan.Late in 1953 the Japanese Governmentadopted new policies of import control andinternal stabilization. Import purchaseswere cut back considerably and import ar-rivals declined after March 1954. The finan-cial stabilization program was apparentlysuccessful in halting the inflation of pricesand costs which previously had been retard-ing exports and overstimulating imports.
EUROPEAN INDUSTRIAL PRODUCTION
The rise in European imports from mid-1952 to mid-1954 reflected increasing needsbased on rising consumption, replenishmentof business inventories, and expansion of pri-vate investment. Over the two years indus-trial production advanced by about 7 percent a year.
The purchasing power of European con-sumers was enlarged by rising money in-comes while prices of finished goods re-mained stable. Moderately rising hourlywage costs were offset by increasing pro-ductivity and by the availability of importedmaterials at prices substantially lower thanin 1951. There was progressive relaxationof governmental controls affecting prices orpurchases in domestic trade. Saving fromcurrent incomes was generally much higherthan in 1951 and earlier postwar years.
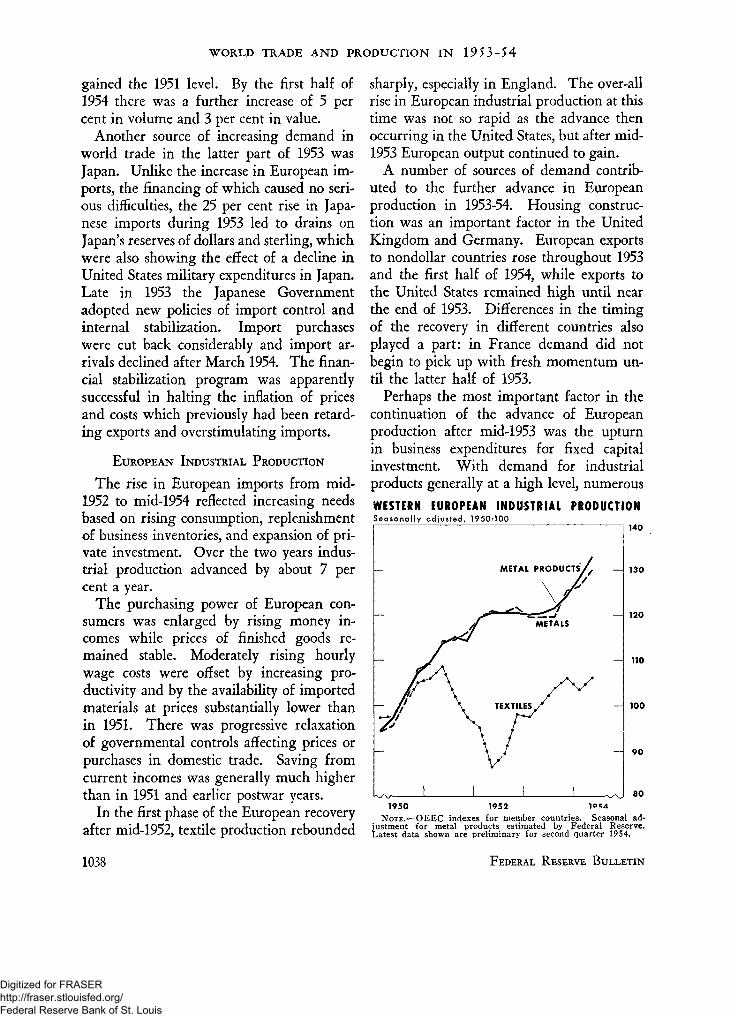
In the first phase of the European recoveryafter mid-1952, textile production rebounded
sharply, especially in England. The over-allrise in European industrial production at thistime was not so rapid as the advance thenoccurring in the United States, but after mid-1953 European output continued to gain.
A number of sources of demand contrib-uted to the further advance in Europeanproduction in 1953-54. Housing construc-tion was an important factor in the UnitedKingdom and Germany. European exportsto nondollar countries rose throughout 1953and the first half of 1954, while exports tothe United States remained high until nearthe end of 1953. Differences in the timingof the recovery in different countries alsoplayed a part: in France demand did notbegin to pick up with fresh momentum un-til the latter half of 1953.
Perhaps the most important factor in thecontinuation of the advance of Europeanproduction after mid-1953 was the upturnin business expenditures for fixed capitalinvestment. With demand for industrialproducts generally at a high level, numerous
WESTERN EUROPEAN INDUSTRIAL PRODUCTIONSeasonally adjusted, 1950000
_L
140
130
120
110
100
9 0
80
1950 19521952NOTE.—OEEC indexes for member countries. Seasonal ad-
justment for metal products estimated by Federal Reserve.Latest data shown are preliminary for second quarter 1954.
1038 FEDERAL RESERVE BULLETIN
Digitized for FRASER http://fraser.stlouisfed.org/ Federal Reserve Bank of St. Louis
WORLD TRADE AND PRODUCTION IN 1953-54
opportunities have been found for modern-ization and expansion of productive capacity.
As foreign and domestic orders for newproducers' equipment—-as well as sales ofautomobiles and other consumers' dura-ble goods—increased, metal-using industriesfound their stocks of material inadequate.In the first half of 1954 output of steel andother metal-producing industries was risingin all European countries. New orders forsteel in the summer were at record levels.
PRODUCTION IN CANADA AND JAPAN
While rising industrial production andbusiness activity in Europe exerted a majorinfluence on world business conditions, aleveling off in demand in the much smallerCanadian economy had considerable directeffect on United States exports. Canada'sindustrial production is less than one-tenthof Western Europe's, but our exports toCanada are about as large as our exports toWestern Europe: each accounts for aboutone-fifth of total United States commercialexports. In the first half of 1954, when ex-ports to Western Europe were 8 per centgreater than the year before, exports toCanada were down by 11 per cent.
Canadian industrial production in 1953-54followed a course somewhat similar to thatof United States production, but the net de-cline from the average for May-July 1953 tothat for May-July 1954 was only 3 per centcompared with the 9 per cent decline in thiscountry. Output in manufacturing wasdown 6 per cent compared with 10 percent here. New investment activity, thoughsomewhat reduced, continued strong. Farmincome was reduced in consequence of lowerprices for wheat and other grains, and thevalue of wheat exports fell sharply. Cana-dian imports continued to exceed total ex-ports, the deficit in trade being covered bythe inflow of investment capital.
OCTOBER 1954
Japanese industrial production rose verysharply in 1953. A gain of about 20 per centbrought Japanese manufacturing and miningactivity at the beginning of 1954 to a levelapproximately 15 per cent above the prewaryear 1938. This spring and summer therewas a slight recession from that level.
WORLD COMMODITY MARKETS
Intimately related to the continuinggrowth of European production in 1953-54was the absence of deflationary tendenciesin world markets. From the point of viewof the nondollar world, the strength of rawmaterial prices meant, on the whole, thatUnited States purchases yielded more dol-lars than if price levels had fallen; thiswas a factor in the continuing growth ofmonetary reserves. Even more important,and quite apart from currency questions, in-come within primary producing countrieswas well maintained. Active markets over-seas were thus provided for the exports ofindustrial countries.
While stability in world markets con-tributed to growth of European production,the high and rising demand of Europe forimports of raw materials was itself a stronginfluence toward stability in primary marketsin the face of reduced demand in the UnitedStates and generally ample supply.
Demand and supply conditions variedamong commodities. For many industrialraw materials prices in foreign markets inthe spring of 1954 were higher than in thelast few months of 1953. For some com-modities, moreover, price advances had oc-curred in 1953 at the same time that UnitedStates business activity was declining. Suchcommodities included lead, zinc, and jute,for which European demand was rising in1953, as well as the beverage commodi-ties—coffee, cocoa, and tea—for which de-mand was strong in all countries.
1039
Digitized for FRASER http://fraser.stlouisfed.org/ Federal Reserve Bank of St. Louis

WORLD TRADE AND PRODUCTION IN 1953-54
PRICES IN SELECTED COMMODITY MARKETS
[U. S. cents per pound]
Commodity (and market)
Prices higher in April-June 1954than in April-June 1953:
Coffee (New York)Cocoa (British W. Africa)Tea (Ceylon)
Tobacco (Turkey)Crude petroleum (Venezuela).Newsprint (Sweden) ,
Zinc (London)....Lead (London)....Jute (Pakistan). . .Cotton (Pakistan).
Prices lower in April-June 1954than in April-June 1953:
Copper (London)Tin (Malaya)Rubber (Malaya)Wood pulp (Sweden).
Wool (Australia)Sugar (Cuba)Copra (Philippines)Wheat (Canada)
April-June1954
875061
601195
5.9
9.912.01038
30.48920.58.0
713.36.7
2183
Oct.-Dec.1953
603251
60*195
5.6
9.411.71034
29.67618.97.6
813.28.6
2196
April-June1953
563049
50160
5.5
31.59022.68.2
763.558.0
2213
1 Cents per barrel.2 Cents per bushel.NOTE.—Averages of monthly data published by International
Monetary Fund. Jute and cotton averages for April-June 1954partly estimated by Federal Reserve.
Foreign growers' prices for raw cottonwere relatively low in 1953, but strengthenedearly in 1954 when it became clear thatEuropean stocks were no longer being re-duced and that European consumption wasbeing maintained at a relatively high level.
For certain other commodities, potentiallyin very heavy supply, prices weakened dur-ing the greater part of 1953 but advancedmoderately in the first half of 1954. In thecase of copper, rising European consumptionand replenishment of stocks were accom-panied by curtailment of production—inChile from October 1953 onward and in theUnited States somewhat later. In the caseof rubber, most of the decline in UnitedStates consumption was offset by curtail-ment of synthetic rubber output when lowprices made natural rubber more attractive.
Prices for wool and certain agriculturalproducts were also lower in the spring of
1954 than they had been a year earlier. Eu-ropean consumption of wool in 1953-54 wasat a very high level but was not rising. TheCuban sugar price was influenced by ex-panding production of sugar in other coun-tries. The supply situation for copra andcoconut oil eased considerably in 1954.Wheat continued to be heavily in surplussupply on world markets.
5-5 INFLUENCE OF THE BALANCE OF PAYMENTS
For countries that depend greatly on for-eign trade, domestic expansion always bringsthe risk of a worsened balance of payments.Gold and foreign exchange reserves give pro-tection against this risk, and may thereforesupport expansion. When reserves are notfully adequate for all contingencies, sup-port of the same kind may be given by abalance-of-payments situation in which re-serves are increasing. This, in general, wasthe case in Western Europe in 1953-54.
In such a situation, governments and cen-tral banks were able to relax foreign tradecontrols and could allow a steady growth ofdomestic incomes. The consequent growthof demand for imports presented no seriousdanger. Since opportunities were availablefor more efficient use of resources, growth ofreal income was rapid. Europe's purchasesof imports were large, and provided an ele-ment of strength in world markets.
The large flow of dollar payments fromthe United States in recent years, by con-tributing to the maintenance of a favorablebalance-of-payments situation for Europe,has proved to be a basic influence towardstability and growth in world trade and pro-duction. Against this background, the in-crease in United States exports this spring,responding to world demand, was a sign ofincreased strength in the world economy.
1040 FEDERAL RESERVE BULLETIN
Digitized for FRASER http://fraser.stlouisfed.org/ Federal Reserve Bank of St. Louis
REGENT FINANCIAL CHANGES IN WESTERN GERMANY1
After heavy reliance on foreign assistancein the postwar period, Western Germanyafter 1951 began to accumulate monetaryreserves in the form of gold and foreign ex-change, and also to provide credit to manyof its trading partners. This improvementin Western Germany's international positionwas accomplished within the framework ofa rising standard of living, progressive aboli-tion of direct controls, and over-all financialstability.
Wholesale prices and the cost of living atthe end of 1953 were both somewhat lowerthan in mid-1951, that is to say, at the end ofthe last 12-month period when Western Ger-many had a foreign deficit on current ac-count. Fluctuations during the interveningperiod were very small. After rising sub-stantially in the first year after the outbreakof war in Korea, wholesale and consumerprices continued to rise very slightly for sometime, remained practically constant through-out calendar year 1952, and then declinedabout 3 per cent in 1953.
This large measure of internal financialstability was maintained over a period whenWestern Germany's foreign position on cur-rent account shifted from deficit to surplusby an amount equivalent to about half thevalue of the country's private investment inplant and equipment in 1953. There was aconcurrent shift of the same order of mag-nitude, also from deficit to surplus, inthe balance of the current payments andreceipts of the government sector with the
1This article was prepared by Henry K. Heuser, Chief ofthe Central and Eastern European Section of the Board's Divi-sion of International Finance. Presentation and analysis owemuch to the methodology developed in recent years by theCentral Planning Bureau of the Netherlands and the Neder-landsche Bank.
private sector and foreign countries. And,while the value of total supplies—domesticoutput and imports—was almost a thirdlarger in 1953 than in the 12-month periodending June 1951, domestic use of such sup-plies had expanded by little more than one-fourth.
These developments suggest that, broadlyspeaking, internal financial stability in West-ern Germany was maintained during thepast three years because the effects of twomajor financial changes—the shifts fromdeficit to surplus on both foreign and gov-ernment accounts—served as offsets to eachother. Such an interpretation assumes that,in the absence of a government surplus, pri-vate spending would have been greaterrather than private borrowing less.
To recognize that the effects of two majorfinancial forces offset each other and thushelped to maintain internal financial sta-bility does not advance the explanation ofstability very far. It would seem worth-while, therefore, to explore in some detailthe train of causation in the stabilizing proc-ess; to ask which of the two forces was theoriginating and which the reacting one atdifferent times during the period.
Examination of major economic changesover the period seems to support the viewthat it was the development of a slack indomestic demand relative to productive ca-pacity that twice served as the originatingfactor in the process of mutual offsetting bydifferent forces. This was near the begin-ning (second half of 1951) and again towardthe end of the period (latter part of 1952 andthe first half of 1953). Rising net exportsappear to have been the originating factorduring the middle of the period (most of
OCTOBER 1954 1041
Digitized for FRASER http://fraser.stlouisfed.org/ Federal Reserve Bank of St. Louis
RECENT FINANCIAL CHANGES IN WESTERN GERMANY
1952) and perhaps once more at the very end(second half of 1953).
In the last few years monetary policy wasapplied in a manner to meet three differenttypes of conditions. When, as in 1950-51,it was imperative to restrain domestic de-mand in an effort to maintain external sol-vency, monetary policy was restrictive. Asthe need for restriction began to recede inmid-1952, monetary policy responded with agradual reduction in the cost of central bankcredit. Finally, with the further restrictive
effects of growing government surplusesabout balanced by the expansionary forces ofrising net exports during much of 1953,monetary policy remained largely neutral,permitting internal financial stability to bemaintained by existing forces.
NOTE ON METHOD
In examining the factors that may havebeen responsible for the shifts in the dis-tribution of Western Germany's rising out-put among the domestic private sector, the
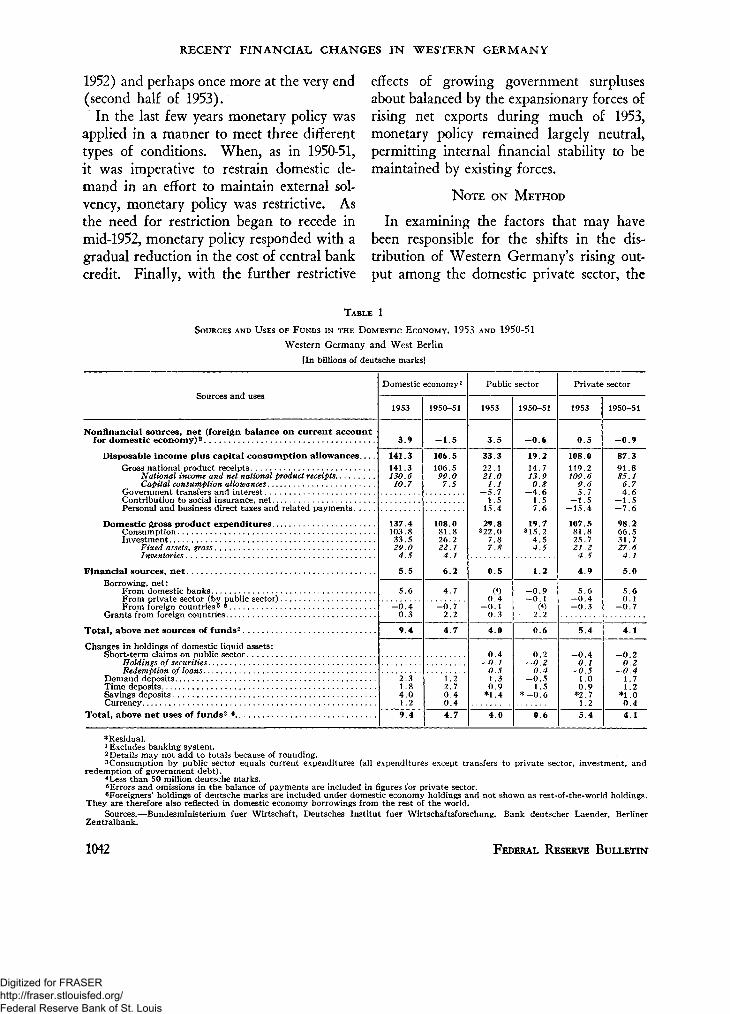
TABLE 1
SOURCES AND USES OF FUNDS IN THE DOMESTIC ECONOMY, 1953 AND 1950-51
Western Germany and West Berlin
[In billions of deutsche marks]
Sources and usesDomestic economy1
1953 1950-51
Public sector
1953 1950-51
Private sector
1953 1950-51
Nonfinancial sources, net (foreign balance on current accountfor domestic economy)2
3.9 -1 .5 3.5 -0 .6 0 . 5 -0.9
Disposable income plus capital consumption allowances...Gross national product receipts
National income and net national product receiptsCapital consumption allowances
Government transfers and interestContribution to social insurance, netPersonal and business direct taxes and related payments . . . .
Domestic gross product expendituresConsumptionInvestment
Fixed assets, grossInventories
141.3141.3130.610.7
106.5106.599.07.5
Financial sources, net. ..
137.4103.833.529.04.5
5.5
108.081.826.222.14.1
6.2
33.322.121.01.1
-5.71.5
15.4
29.8322.0
7.87.8
19.214.713.90.8
-4 .61.57.6
19.7315.2
4.54.5
0.5 1.2
108.0119.2109.6
9.65.7
-1.5-15.4
107.581.825.721.24.5
4.9
87.391.885.1
6.74.6
— 1.5- 7 . 6
98.266.531.727.64.1
5.0Borrowing, net:
From domestic banksFrom private sector (by public sector) .From foreign countries 5 6
Grants from foreign countries
5 . 6 4.7
- 0 . 40.3
-0 .72.2
()0.4
-0.10.3
-0.9-0.1
5.6-0 .4-0.3
Total, above net sources of funds2
Changes in holdings of domestic liquid assets:Short-term claims on public sector
Holdings of securitiesRedemption of loans
Demand depositsTime depositsSavings depositsCurrency
Total, above net uses of funds2 6
9.4 4.7 4.0 0.6 5.4
5.60.1
-0.7
4.1
2.31.84.01.2
1.22.70.40.4
0.4-0.10.51.30.9
*1.4
0.2-0.2
0.4-0 .5
1.5*-0.6
-0.40.1
-0.51.00.9
*2.71.2
-0 .20.2
-0.41.71.2
*1.00.4
9.4 4 .7 4.0 0 6 5.4 4 . 1
*Residual.1 Excludes banking system.2 Details may not add to totals because of rounding.3 Consumption by public sector equals current expenditures (all expenditures except transfers to private sector, investment, andredemption of government debt).4Less than 50 million deutsche marks.
^Errors and omissions in the balance of payments are included in figures for private sector.foreigners' holdings of deutsche marks are included under domestic economy holdings and not shown as rest-of-the-world holdings.
They are therefore also reflected in domestic economy borrowings from the rest of the world.Sources.—Bundesministerium fuer Wirtschaft, Deutsches Institut fuer Wirtschaftsforschung, Bank deutscher Laender, Berliner
Zentralbank.
1042 FEDERAL RESERVE BULLETIN
Digitized for FRASER http://fraser.stlouisfed.org/ Federal Reserve Bank of St. Louis
RECENT FINANCIAL CHANGES IN WESTERN GERMANY
public sector, and exports, this analysis makesuse of an experimental technique. The un-derlying principle of this technique is an at-tempt to trace simultaneously, but as separatequantities, the development of incomes, bor-rowings, and liquid assets. This is accom-plished by means of a statistical frameworkthat combines national accounts and mone-tary information in consistent statements, asin Tables 1 and 2.
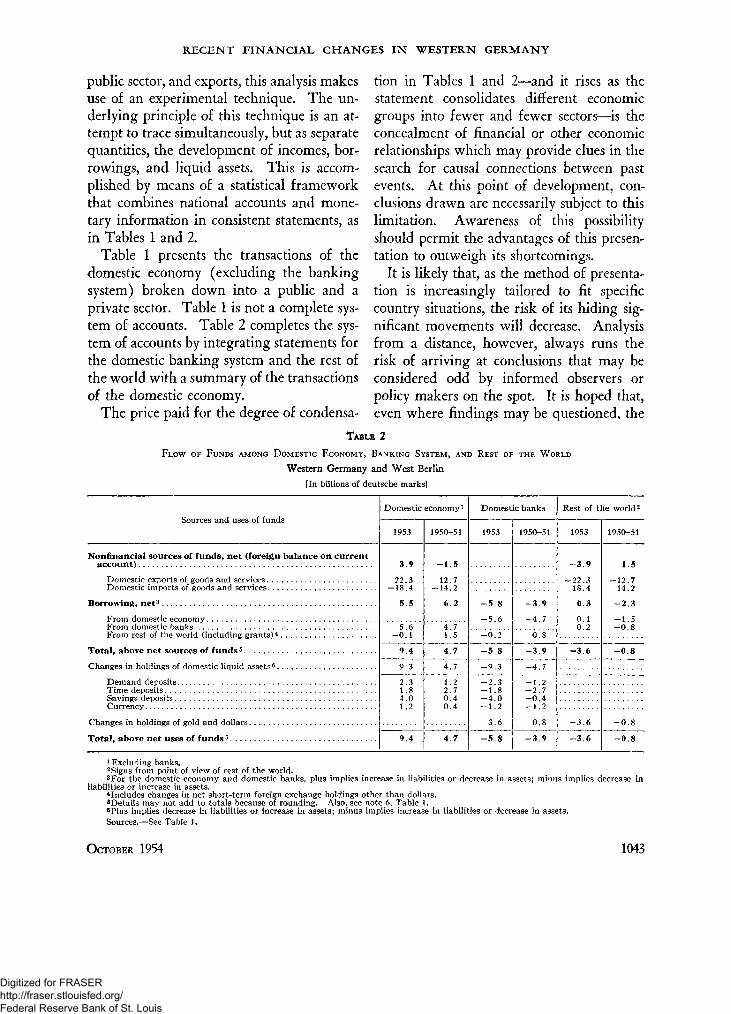
Table 1 presents the transactions of thedomestic economy (excluding the bankingsystem) broken down into a public and aprivate sector. Table 1 is not a complete sys-tem of accounts. Table 2 completes the sys-tem of accounts by integrating statements forthe domestic banking system and the rest ofthe world with a summary of the transactionsof the domestic economy.
The price paid for the degree of condensa-
tion in Tables 1 and 2—and it rises as thestatement consolidates different economicgroups into fewer and fewer sectors—is theconcealment of financial or other economicrelationships which may provide clues in thesearch for causal connections between pastevents. At this point of development, con-clusions drawn are necessarily subject to thislimitation. Awareness of this possibilityshould permit the advantages of this presen-tation to outweigh its shortcomings.
It is likely that, as the method of presenta-tion is increasingly tailored to fit specificcountry situations, the risk of its hiding sig-nificant movements will decrease. Analysisfrom a distance, however, always runs therisk of arriving at conclusions that may beconsidered odd by informed observers orpolicy makers on the spot. It is hoped that,even where findings may be questioned, the
TABLE 2
FLOW OF FUNDS AMONG DOMESTIC ECONOMY, BANKING SYSTEM, AND REST OF THE WORLD
Western Germany and West Berlin
[In billions of deutsche marks]
Sources and uses of funds
Nonfinancial sources of funds, net (foreign balance on currentaccount) .
Domestic exports of goods and servicesDomestic imports of goods and services
Borrowing, net3 . . .
From domestic economyFrom domestic banksFrom rest of the world (including grants)4
Total, above net sources of funds 5
Changes in holdings of domestic liquid assets6
Demand depositsTime depositsSavings deposits . .Currency
Changes in holdings of gold and dollars
Total, above net uses of funds5 . . .
Domestic economy1
1953
3 9
22 3— 18 4
5 . 5
5.6- 0 . 1
9 . 4
9 . 3
2 31.84.01.2
9 . 4
1950-51
— 1 5
12 7— 14 2
6 . 2
4 . 71.5
4 . 7
4 . 7
1 22 .70 . 40 . 4
4 . 7
Domestic banks
1953
- 5 . 8
-5 .6
-6.2- 5 . 8
- 9 . 3
—2 3-1 .8-4 .0-1 .2
3.6
-5.8
1950-51
- 3 . 9
-4 .7
0.8' '
- 3 . 9
-4 .7
— 1 2- 2 . 7- 0 . 4- 1 . 2
0.8
- 3 . 9
Rest of the world2
1953
- 3 9
—22 318.4
0.3
0.10.2
- 3 . 6
- 3 . 6
- 3 . 6
1950-51
1 5
— 12 714.2
- 2 . 3
- 1 . 5- 0 . 8
- 0 . 8
- 0 . 8
- 0 . 8
1 Excluding banks.2Signs from point of view of rest of the world.3For the domestic economy and domestic banks, plus implies increase in liabilities or decrease in assets; minus implies decrease in
liabilities or increase in assets.4 Includes changes in net short-term foreign exchange holdings other than dollars.8Details may not add to totals because of rounding. Also, see note 6, Table 1.6Plus implies decrease in liabilities or increase in assets; minus implies increase in liabilities or decrease in assets.Sources.—See Table 1.
OCTOBER 1954 1043
Digitized for FRASER http://fraser.stlouisfed.org/ Federal Reserve Bank of St. Louis
RECENT FINANCIAL CHANGES IN WESTERN GERMANY
route by which they were reached may never-theless be of interest to those more familiarwith the sequence of events.
From a time analysis standpoint, the rele-vant comparisons are between two separateperiods: 1950-51 as approximately the last 12months when Western Germany and WestBerlin had a deficit on foreign account, and1953 as the most recent 12-month period forwhich the material essential for a financialanalysis is available.
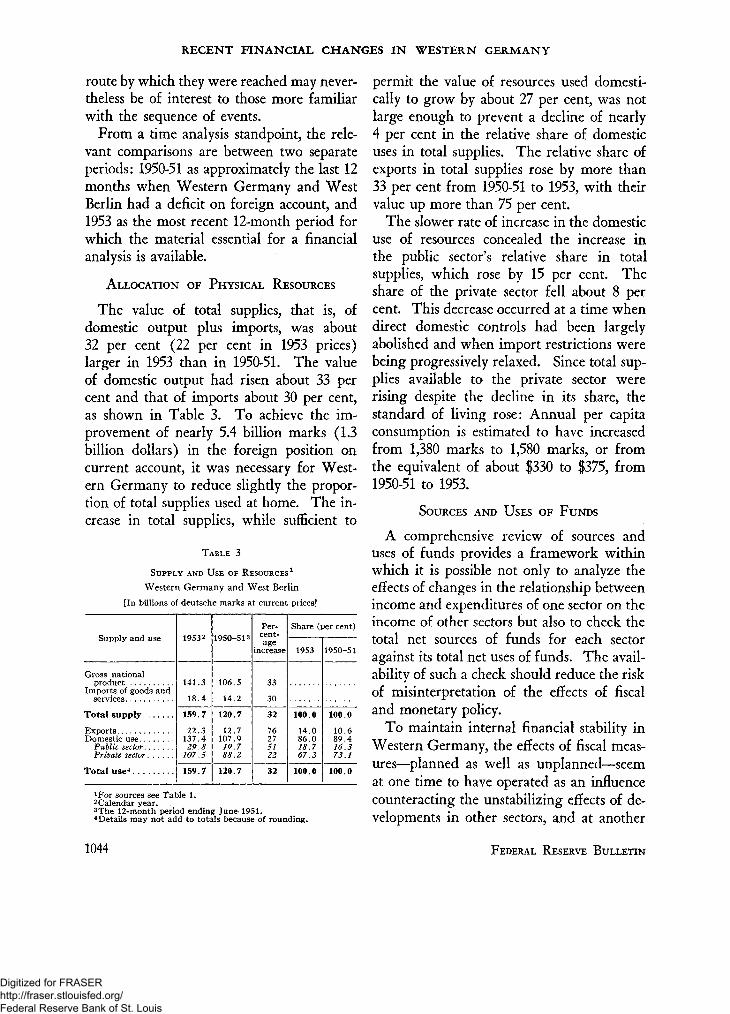
ALLOCATION OF PHYSICAL RESOURCES
The value of total supplies, that is, ofdomestic output plus imports, was about32 per cent (22 per cent in 1953 prices)larger in 1953 than in 1950-51. The valueof domestic output had risen about 33 percent and that of imports about 30 per cent,as shown in Table 3. To achieve the im-provement of nearly 5.4 billion marks (1.3billion dollars) in the foreign position oncurrent account, it was necessary for West-ern Germany to reduce slightly the propor-tion of total supplies used at home. The in-crease in total supplies, while sufficient to
TABLE 3
SUPPLY AND USE OF RESOURCES1
Western Germany and West Berlin
[In billions of deutsche marks at current
Supply and use
Gross nationalproduct
Imports of goods andservices
Total supply
ExportsDomestic use
Public sectorPrivate sector
Total use4
1953 2
141.3
18.4
159.7
22.3137.429.8
107.5
159.7
1950-513
106.5
14.2
120.7
12.7107.910.788.2
120.7
Per-cent-age
increase
33
30
32
76275122
32
prices]
Share (per cent)
1953
100.0
14.086.018.767.3
100.0
1950-51
100.0
10.689.416.373.1
100.0
xFor sources see Table 1.2 Calendar year.3The 12-month period ending June 1951.4Details may not add to totals because of rounding.
permit the value of resources used domesti-cally to grow by about 27 per cent, was notlarge enough to prevent a decline of nearly4 per cent in the relative share of domesticuses in total supplies. The relative share ofexports in total supplies rose by more than33 per cent from 1950-51 to 1953, with theirvalue up more than 75 per cent.
The slower rate of increase in the domesticuse of resources concealed the increase inthe public sector's relative share in totalsupplies, which rose by 15 per cent. Theshare of the private sector fell about 8 percent. This decrease occurred at a time whendirect domestic controls had been largelyabolished and when import restrictions werebeing progressively relaxed. Since total sup-plies available to the private sector wererising despite the decline in its share, thestandard of living rose: Annual per capitaconsumption is estimated to have increasedfrom 1,380 marks to 1,580 marks, or fromthe equivalent of about $330 to $375, from1950-51 to 1953.
SOURCES AND USES OF FUNDS
A comprehensive review of sources anduses of funds provides a framework withinwhich it is possible not only to analyze theeffects of changes in the relationship betweenincome and expenditures of one sector on theincome of other sectors but also to check thetotal net sources of funds for each sectoragainst its total net uses of funds. The avail-ability of such a check should reduce the riskof misinterpretation of the effects of fiscaland monetary policy.
To maintain internal financial stability inWestern Germany, the effects of fiscal meas-ures—planned as well as unplanned—seemat one time to have operated as an influencecounteracting the unstabilizing effects of de-velopments in other sectors, and at another
1044 FEDERAL RESERVE BULLETIN
Digitized for FRASER http://fraser.stlouisfed.org/ Federal Reserve Bank of St. Louis
RECENT FINANCIAL CHANGES IN WESTERN GERMANY
time to have stood in need of being at leastpartly offset themselves. In the final anal-ysis, however, it would seem that the re-luctance with which fiscal policy respondedto unplanned surpluses with reduction intaxes stood general financial policy in goodstead. Restrictive fiscal policies in the pastmay well have furthered the progressivestrengthening of general confidence by theirvery cautiousness.
Monetary policy, especially in the latterpart of the period, when market forces wereoffsetting each other and resulting in high-level equilibrium at home and solvencyabroad, appears to have neither strongly en-forced nor appreciably weakened any spe-cific financial trend.
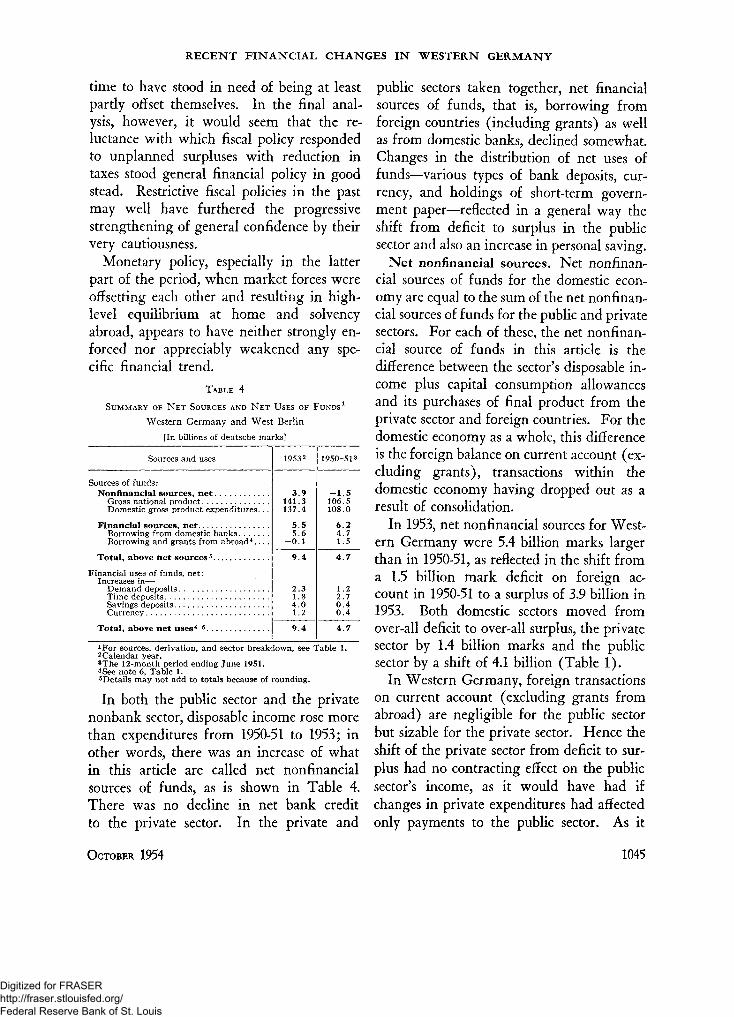
TABLE 4
SUMMARY OF N E T SOURCES AND N E T USES OF FUNDS1
Western Germany and West Berlin
[In billions of deutsche marks]
Sources and uses
Sources of funds:Nonfinancial sources, net
Gross national productDomestic gross product expenditures. . .
Financial sources, netBorrowing from domestic banksBorrowing and grants from abroad 4 . . . .
Total, above net sources5
Financial uses of funds, net:Increases in—
Demand depositsTime depositsSavings depositsCurrency
Total, above net uses4 5
19532
3.9141.3137.4
5.55.6
- 0 . 1
9.4
2.31.84.01.2
9 . 4
1950-513
- 1 . 5106.5108.0
6.24.71.5
4.7
1.22.70.40.4
4 . 7
1For sources, derivation, and sector breakdown, see Table 1.2 Calendar year.3The 12-month period ending June 1951.4See note 6, Table 1.6Details may not add to totals because of rounding.
In both the public sector and the privatenonbank sector, disposable income rose morethan expenditures from 1950-51 to 1953; inother words, there was an increase of whatin this article are called net nonfinancialsources of funds, as is shown in Table 4.There was no decline in net bank creditto the private sector. In the private and
public sectors taken together, net financialsources of funds, that is, borrowing fromforeign countries (including grants) as wellas from domestic banks, declined somewhat.Changes in the distribution of net uses offunds—various types of bank deposits, cur-rency, and holdings of short-term govern-ment paper—reflected in a general way theshift from deficit to surplus in the publicsector and also an increase in personal saving.
Net nonfinancial sources. Net nonfinan-cial sources of funds for the domestic econ-omy are equal to the sum of the net nonfinan-cial sources of funds for the public and privatesectors. For each of these, the net nonfinan-cial source of funds in this article is thedifference between the sector's disposable in-come plus capital consumption allowancesand its purchases of final product from theprivate sector and foreign countries. For thedomestic economy as a whole, this differenceis the foreign balance on current account (ex-cluding grants), transactions within thedomestic economy having dropped out as aresult of consolidation.
In 1953, net nonfinancial sources for West-ern Germany were 5.4 billion marks largerthan in 1950-51, as reflected in the shift froma 1.5 billion mark deficit on foreign ac-count in 1950-51 to a surplus of 3.9 billion in1953. Both domestic sectors moved fromover-all deficit to over-all surplus, the privatesector by 1.4 billion marks and the publicsector by a shift of 4.1 billion (Table 1).
In Western Germany, foreign transactionson current account (excluding grants fromabroad) are negligible for the public sectorbut sizable for the private sector. Hence theshift of the private sector from deficit to sur-plus had no contracting effect on the publicsector's income, as it would have had ifchanges in private expenditures had affectedonly payments to the public sector. As it
OCTOBER 1954 1045
Digitized for FRASER http://fraser.stlouisfed.org/ Federal Reserve Bank of St. Louis
RECENT FINANCIAL CHANGES IN WESTERN GERMANY
was, the private sector's shift to surplus wasthe result of an improvement of 5.4 billionmarks in the sector's balance with foreigncountries and a change of about 4 billionfrom surplus to deficit in the balance withthe public sector.
On the other hand, the shift from deficitto surplus for the public sector, since it im-pinged directly only on the domestic econ-omy, tended to have a restraining effect onthe private sector's disposable income. Cur-rent revenues in the form of taxes and re-lated payments rose by nearly 14 billionmarks against increased purchases of goodsand services of 10 billion.
Monetary and fiscal policies. Keepingdomestic demand in check was not, exceptat the beginning, a necessary aim of mone-tary policy during the larger part of theperiod under consideration. In an effort tocorrect the balance-of-payments difficultieswhich had resulted primarily from inventorypurchases after the outbreak of the KoreanWar, credit was tightened from the fall of1950 to the early spring of 1951 through arise in the discount rate, higher reserve re-quirements, and ceilings on short-term loans.From May 1952 until mid-1953, however, thediscount rate was lowered four times andreserve requirements were reduced threetimes. The decline in the private sector'sdemand relative to its disposable income isnot readily explained by changes in monetarypolicy, except that the previous rigorous useof monetary policy gave confidence that thisinstrument of public financial policy wouldbe used, if necessary, to safeguard the valueof the mark. Monetary policy in this waycontributed to the climate of financial con-fidence so essential in fostering a flow ofprivate savings.
Fiscal operations on the other hand appearto have played an important role in keeping
domestic demand in check. Gross receiptsof the public sector were about 55 per centgreater in 1953 than in 1950-51, comparedwith an estimated increase of about 33per cent in the value of national output. Therise in gross receipts resulted in part froman increase in taxation enacted in July 1951;in part it was brought about by an increasein taxable income and transactions as na-tional output grew. In 1953 taxes werereduced but the change probably did notaffect receipts until the last quarter of theyear.
There is no certainty as to the amountsby which private consumption or investmentmight have risen had not the increase inprivate disposable income been restrained bytaxation. Consumption would almost cer-tainly have been somewhat greater, and prob-ably investment also. Balance, instead of asurplus, on government account would havetended to result in a greater demand some-where—either the public sector would haveraised its expenditures to the level of its reve-nues and thus increased its own demand forresources, or a reduction in tax collectionsdown to the level of public expenditureswould have led to an increase in the demandof the private sector. The restraint on de-mand exerted by fiscal policy may havebeen greater, especially toward the end ofthe period, than was required for the main-tenance of internal financial stability. Buthad there been no restrictive effects of fiscalpolicy during 1951 and 1952, monetary policywould have been confronted by a far differ-ent task.
Net financial sources. For the domesticeconomy, net borrowing from the banksand net borrowing from abroad (includinggrants and short-term capital movements)are designated in this article as financialsources of funds; for individual sectors, long-
1046 FEDERAL RESERVE BULLETIN
Digitized for FRASER http://fraser.stlouisfed.org/ Federal Reserve Bank of St. Louis

RECENT FINANCIAL CHANGES IN WESTERN GERMANY
term borrowing from each other is shownwith financial sources in Table 1, but changesin short-term lending between nonbank sec-tors are shown with other uses of funds foracquiring liquid assets.
The private sector's net borrowing fromdomestic banks expanded as much in 1953as in 1950-51. The shift from deficit to sur-plus on private nonfinancial account was notassociated with a lower level of net borrow-ing from the banks, as might have been thecase had business borrowers not expected acontinued upturn of domestic economic ac-tivity. In the public sector the main changesin net financial sources were the lower levelof foreign aid and the related decrease inthe flow of funds from the public sector tothe commercial banks.
The shift from deficit to surplus for theprivate sector of the Western Germaneconomy hides the decrease in saving by busi-nesses which is estimated to have occurredbetween 1950-51 and 1953 (Table 5). Itwould have been surprising, therefore, ifprivate net borrowing from the banks hadbeen less in 1953 than in 1950-51, in view ofprobably optimistic expectations in 1953 as awhole. Gross bank loans to the private sectorin 1953 exceeded the level in 1950-51 by aboutthe estimated increase in private investment.
Total domestic net borrowing from thebanks was greater in 1953 than in 1950-51but this was due entirely to a decline in pub-lic funds put at the disposal of the commer-cial banks from nearly one billion marks in1950-51 to virtually zero in 1953—largelybecause the flow to the Federal Governmentof Marshall aid counterpart funds, formerlypassed on to the banks for limited periods,had declined to an amount far below itsvolume in 1950-51.
The principal change in nonbank netfinancial sources, that is, in long-term bor-
rowing by sectors from each other andfrom foreign countries (including foreigngrants) was a decline in foreign aid. Forthe public sector this decline was made uponly in part by a small increase in its long-term borrowing from the private sector.
Saving and investment. The public sec-tor provided much the greater part of theincrease in total saving required to offsetthe expansionary impact of rising net exportsand domestic investment (Table 5). Savingby all public agencies (excess of revenue fromtaxation and similar current receipts overexpenditures for all current purposes) isestimated to have been about 10 billion marksin 1953 as compared with slightly more than3 billion in 1950-51.
Private saving rose by 2.5 billion markscompared with the 7 billion increase in publicsaving. More than half of the estimatedincrease in saving by households appears tohave been offset by lower retained earningsby businesses. The share of households innational income was considerably larger in
TABLE 5
N E T SAVING AND INVESTMENT ACCOUNT
Western Germany and West Berlin
[In billions of deutsche marks]
Item
Net saving, total1
Public sector2
Private sector2
Business**Households*
Net investment, total
Fixed assetsPublicPrivate
Inventor ies . .Foreign balance (export surplus + ) • • • •
1953
26.7
10.216.69.07.6
26.7
18.36.7
11.64.53.9
1950-51
17.2
3.214.112.71.4
17.2
14.63.7
10.94.1
- 1 . 5
1 Details may not add to totals because of rounding.2 Difference between disposable income and consumption. See
Table 1 for basic figures.3 Ratio between saving by businesses and saving by households
as estimated for Western Germany by the Deutsches Institut fuerWirtschaftsforschung was applied to total private saving for West-ern Germany and West Berlin as estimated from material ofBundesministerium fuer Wirtschaft and Deutsches Institut fuerWirtschaftsforschung.
Sources.—See Table 1.
OCTOBER 1954 1047
Digitized for FRASER http://fraser.stlouisfed.org/ Federal Reserve Bank of St. Louis
RECENT FINANCIAL CHANGES IN WESTERN GERMANY
1953 than in 1950-51, a development whichhelped to raise personal saving as nationalincome grew. On the other hand, businesssaving appears to have been adversely affectedin 1953 by the tendency of wage costs torise and of producers' gross returns to fallor at least to rise less.
Net financial uses of funds. Nonfinancialsources of funds less expenditures plus netfinancial sources as used in this article areequal to net changes in liquid asset holdings,that is, to net changes in demand and timeand savings deposits, currency, and short-term lending between sectors. Changes inthese liquid assets are designated as net finan-cial uses.
In Western Germany the changes from1950-51 to 1953 in net financial uses offunds as defined in this article reflected ina rough general way the shift from deficitto surplus in the public sector as well as thehigher level of saving by the householdgroup of the private sector. Total depositsof public authorities, including an estimatedchange in their savings deposits, rose by 3.6billion marks in 1953, compared with anestimated increase of around 0.4 billion in1950-51. A large part of the increase inpublic deposits is reported to have repre-sented funds made available by the Germanauthorities to the occupation forces but notspent. Total savings deposits, which in 1950-51 rose by only 0.4 billion marks, increasedby 4.0 billion in 1953.
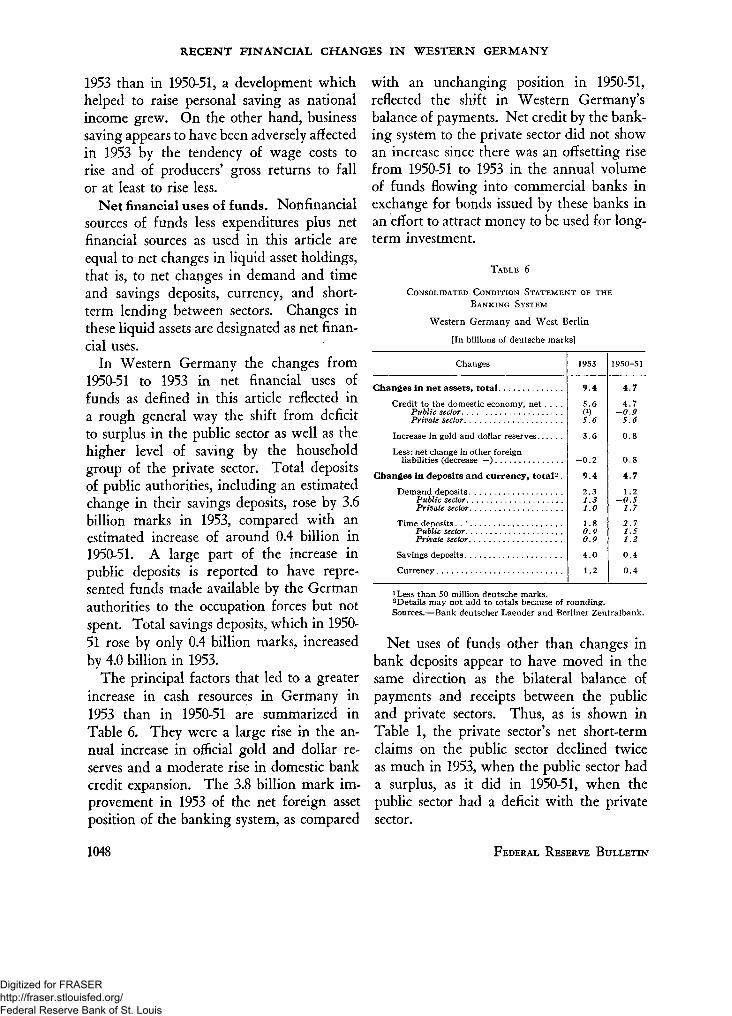
The principal factors that led to a greaterincrease in cash resources in Germany in1953 than in 1950-51 are summarized inTable 6. They were a large rise in the an-nual increase in official gold and dollar re-serves and a moderate rise in domestic bankcredit expansion. The 3.8 billion mark im-provement in 1953 of the net foreign assetposition of the banking system, as compared
with an unchanging position in 1950-51,reflected the shift in Western Germany'sbalance of payments. Net credit by the bank-ing system to the private sector did not showan increase since there was an offsetting risefrom 1950-51 to 1953 in the annual volumeof funds flowing into commercial banks inexchange for bonds issued by these banks inan effort to attract money to be used for long-term investment.
TABLE 6
CONSOLIDATED CONDITION STATEMENT OF THE
BANKING SYSTEM
Western Germany and West Berlin
[In billions of deutsche marks]
Changes
Changes in net assets, total
C r e d i t t o t h e d o m e s t i c e c o n o m y , n e t . . . .Public sector. . . .Private sector
Increase in gold and dollar reserves
Less: net change in other foreignliabilities (decrease —)
Changes in deposits and currency, total2 .
Demand depositsPublic sectorPrivate sector
Time deposits. . ' iPublic sector .Private sector
Savings deposits . . . .
Currency
1953
9 4
5 . 6
5.6
3 . 6
—0 2
9 . 4
2.31.31 0
1.80 90 9
4 . 0
1.2
1950-51
4 7
4.7-0.9
5.6
0 . 8
0 8
4 . 7
1.2-0.5
1 7
2 . 71.51 2
0 . 4
0 . 4
1Less than 50 million deutsche marks.2 Details may not add to totals because of rounding.Sources.—Bank deutscher Laender and Berliner Zentralbank.
Net uses of funds other than changes inbank deposits appear to have moved in thesame direction as the bilateral balance ofpayments and receipts between the publicand private sectors. Thus, as is shown inTable 1, the private sector's net short-termclaims on the public sector declined twiceas much in 1953, when the public sector hada surplus, as it did in 1950-51, when thepublic sector had a deficit with the privatesector.
1048 FEDERAL RESERVE BULLETIN
Digitized for FRASER http://fraser.stlouisfed.org/ Federal Reserve Bank of St. Louis
RECENT FINANCIAL CHANGES IN WESTERN GERMANY
CONCLUSIONS
This article provides no objective proofthat in the last few years a growing govern-ment surplus and rising net exports servedas offsets to each other in Western Germany.There is a strong presumption, however, thattotal demand would have been greater in theabsence of a rising government surplus.With a lower level of taxation, private con-sumption would have tended to be greater.The disposable income of households wouldhave tended to rise more than the net earn-ings of businesses since the larger part oftaxes is probably paid directly or indirectlyby households. At the same time it is prob-ably more difficult for households to makeup for a lower current income by increasedborrowing from the banks. In addition,business borrowing might well have beenlarger rather than smaller in the absence ofa government surplus.
Internal financial stability, therefore, wasprobably maintained by a process in whichopposite financial forces offset each other.The offsetting process did not consist in acancelling of the over-all deficit of one sectoragainst an over-all surplus of the other—inthis case there could have been no foreigndeficit or surplus—but rather in the effectsof shifts in bilateral balances between thepublic and private sectors and, in principle,in the bilateral balance of each with foreigncountries.
According to whether one sector ratherthan another operated as the originatingfactor in the stabilization process, the spanof time reviewed in this article may bedivided into at least three separate periods.
There were two periods when a weaken-ing of domestic demand relative to produc-tive capacity appears to have been the origi-nating factor. The first of these covered thesecond half of 1951 when Western Ger-
many's foreign position began to shift fromdeficit to surplus. Domestic prices at thattime rose by about 2 per cent. Without thefavorable response by net exports to whatmust have been at least moderately depressiveeffects of restrictive monetary and fiscal poli-cies, the predominating influence on pricesat that time might well have been down-ward rather than upward.
The second time when domestic down-ward pressures on prices seem to have beenat least in part offset by rising net exportswas the first half of 1953. According to in-formed German observers, domestic demandat that time failed to rise with the increasein productive capacity, especially in the capi-tal goods industries. An increase in the ratioof the value of foreign to total transactionslends support to this view. Without a con-tinued increase in net exports, domestic pricesmight well have fallen more than they did.
Even with an export surplus at the 1953annual rate, and assuming no change inmonetary policy, only part of the surplus ongovernment account was probably needed inthe first half of 1953 to maintain financialstability. Without a 2.5 billion mark in-crease (annual rate) in the surplus of thegovernment sector from 1952 to the first halfof 1953, compared with a rise (annual rate)in net exports of about 1.5 billion, demandwould probably have risen. The increase,while it might have prevented prices fromfalling in the first half of 1953, possiblywould not have been enough to force a rise.
In at least one period, and perhaps two,assuming no change in monetary policies,it was necessary for a growing surplus ongovernment account to counteract whatmight otherwise have become an undulyexpansionary influence of growing net ex-ports. The first of these periods covered mostof 1952. There was a 22 per cent rise in the
OCTOBER 1954 1049
Digitized for FRASER http://fraser.stlouisfed.org/ Federal Reserve Bank of St. Louis
RECENT FINANCIAL CHANGES IN WESTERN GERMANY
average value of German export goods be-tween 1950-51 and 1952, suggesting that netexports, rather than requiring domestic en-couragement as in 1951, would have riseneven without restrictive policies at home. Ifnot offset by some decline in domestic de-mand, this increase would have tended toexert an unopposed upward pressure ondomestic prices. There was progressive re-laxation of restrictive monetary measuresfrom mid-1952 on, implying that the au-thorities were relying on the restrictive in-fluence of growing public surpluses to pre-vent the upward movement in German prices—slight at that time—from becoming exces-
sive.The slackening of domestic demand in
relation to rising productive capacity, ob-served in the first half of 1953, did not con-tinue in the second half of the year. It ispossible, therefore, that domestic priceswould have risen at that time instead offallen, if there had been no surplus what-ever on government account, unless mone-tary policy had once more become restrictive.
Favorable events as well as policy playeda part in maintaining financial stability underconditions of a large shift in the balanceof payments. The continued growth in thepublic sector's surplus was not planned asan offset to the expansionary effect of risingnet exports; a large part of it would not haveemerged had expenditures risen as originallyenvisaged. Policy, however, both fiscal andmonetary, played a major part in 1951 ininitiating the process of improvement in thebalance of payments. While this improve-ment under cautious fiscal policies turned outto exceed the needs of a restoration of ex-ternal solvency, a more rapid relaxation offiscal restrictiveness might not have beenappropriate at a time when restoration ofconfidence was still an important task offinancial policy. After 1951, when strongforces in opposite directions tended to offseteach other and to produce stability at a highlevel of output, monetary policy served theinterests of such stability best by neitherstrongly enforcing nor appreciably weaken-ing the power of these forces.
1050 FEDERAL RESERVE BULLETIN
Digitized for FRASER http://fraser.stlouisfed.org/ Federal Reserve Bank of St. Louis
MEMBER BANK EARNINGS, FIRST HALF OF 19541
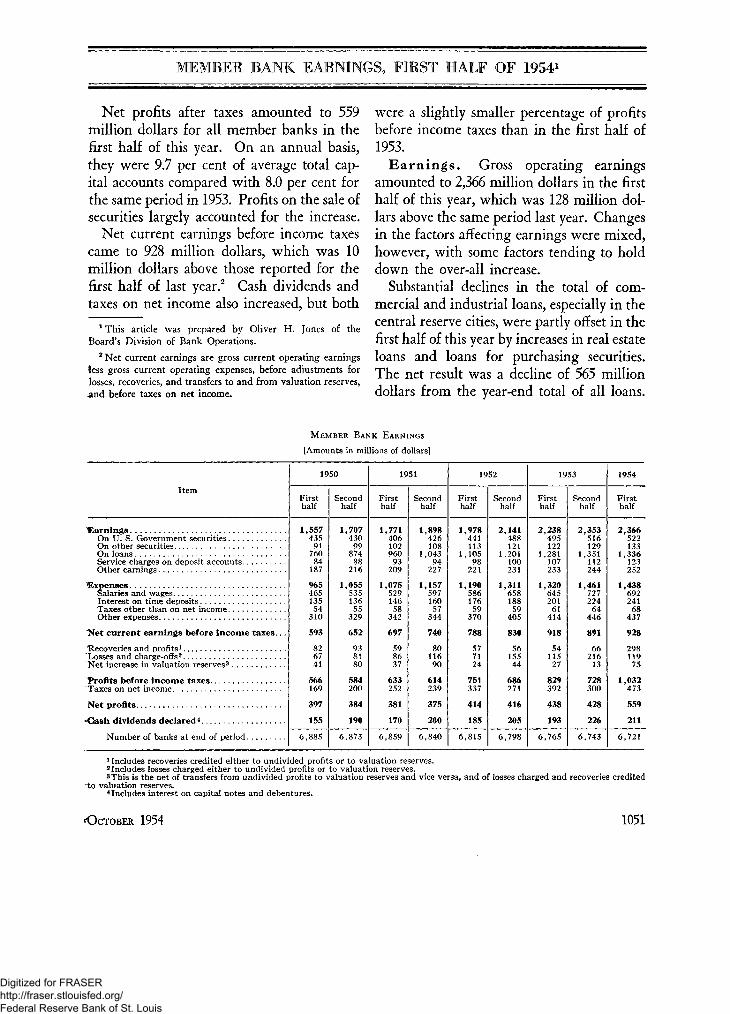
Net profits after taxes amounted to 559million dollars for all member banks in thefirst half of this year. On an annual basis,they were 9.7 per cent of average total cap-ital accounts compared with 8.0 per cent forthe same period in 1953. Profits on the sale ofsecurities largely accounted for the increase.
Net current earnings before income taxescame to 928 million dollars, which was 10million dollars above those reported for thefirst half of last year.2 Cash dividends andtaxes on net income also increased, but both
1 This article was prepared by Oliver H. Jones of theBoard's Division of Bank Operations.
2 Net current earnings are gross current operating earningsless gross current operating expenses, before adjustments forlosses, recoveries, and transfers to and from valuation reserves,and before taxes on net income.
were a slightly smaller percentage of profitsbefore income taxes than in the first half of1953.
E a rn i ngs . Gross operating earningsamounted to 2,366 million dollars in the firsthalf of this year, which was 128 million dol-lars above the same period last year. Changesin the factors affecting earnings were mixed,however, with some factors tending to holddown the over-all increase.
Substantial declines in the total of com-mercial and industrial loans, especially in thecentral reserve cities, were partly offset in thefirst half of this year by increases in real estateloans and loans for purchasing securities.The net result was a decline of 565 milliondollars from the year-end total of all loans.
MEMBER BANK EARNINGS
[Amounts in millions of dollars]
Item
1950
Firsthalf
Secondhalf
1951
Firsthalf
Secondhalf
1952
Firsthalf
Secondhalf
Firsthalf
Secondhalf
Firsthalf
EarningsOn U. S. Government securitiesOn other securitiesOn loansService charges on deposit accountsOther earnings
^ExpensesSalaries and wagesInterest on time depositsTaxes other than on net incomeOther expenses
'Net current earnings before income taxes...
•Recoveries and profits1
Losses and charge-offs2
Net increase in valuation reserves3
Profits before income taxes
Taxes on net income
Net profits
"Gash dividends declared4
Number of banks at end of period
1,557435
9176084
187
96546513554
310
593
826741
566
169
397
155
1,707430
99874
88216
1,05553513655
329
652
938180
584200
384
190
1,77140610296093
209
1,07552914658
342
697
598637
633
252
381
170
1,898426108
1,04394
227
1,15759716057
344
740
8011690
614
239
375
200
1,978441113
1,10598
221
1,19058617659
370
788
577124
751
337
414
185
2,141488121
1,201100231
1,31165818859
405
830
5615544
686
271
416
205
2,238495122
1 ,281107233
1,320645201
61414
918
5411527
829
392
438
193
2,353516129
1,351112244
1,461727224
64446
891
66216
13
728300
428
226
6,885 6,873 6,859 6,840 6,815 6,798 6,765 6,743
2,366522133
1,336123252
1,438692241
68437
928
298119
75
1,032
473
559
2116,721
1 Includes recoveries credited either to undivided profits or to valuation reserves.2Includes losses charged either to undivided profits or to valuation reserves.3This is the net of transfers from undivided profits to valuation reserves and vice versa, and of losses charged and recoveries credited
"to valuation reserves.4 Includes interest on capital notes and debentures.
OCTOBER 1954 1051
Digitized for FRASER http://fraser.stlouisfed.org/ Federal Reserve Bank of St. Louis
MEMBER BANK EARNINGS, FIRST HALF OF 1954
At the same time holdings of United StatesGovernment securities continued the expan-sion begun during the last half of 1953, ris-ing by 509 million dollars. In addition toshifts from loans to investments in UnitedStates Government securities, there was asignificant extension in the average maturityof holdings of Government securities. In-vestments in other types of securities, includ-ing State and local government securities,increased 820 million dollars. The combinedtotal of loans and investments rose 764 mil-lion dollars above the preceding year-end.
An ample supply of reserve funds sup-ported the greater volume of loans and in-vestments handled during the first half ofthe year. As the average rate of return onloans and United States Government securi-ties rose only slightly, the higher level ofgross operating earnings reflected the in-creased volume of loans and investments.The average rate of return was 4.68 per centon loans and 2.00 per cent on United StatesGovernment securities in the first half of thisyear as compared with rates of 4.62 per centand 1.97 per cent in the first half of last year.
Expenses. Gross operating expenses were1,438 million dollars in the first half of 1954.This was 118 million dollars or about 9 percent above the same period last year. Salariesand wages continued to be the major expenseitem, accounting for about 48 per cent oftotal expenses compared with 49 per centlast year.
A rise of 40 million dollars in the amountof interest paid on time deposits was dueboth to the larger volume and the higheraverage rate of interest paid. The averagevolume of time deposits was about 3 billiondollars larger than during the first half of1953, and the average rate of interest paidwas 1.30 per cent as compared with 1.18 percent in the first half of last year.
Profits, recoveries, losses, and transfersto reserves. During the first six months ofthis year, profits from the sale of securitiesamounted to 246 million dollars. Total re-coveries and profits rose 244 million dollarsabove the same period last year to a totalof 298 million dollars, of which 83 per centrepresented profits on the sale of securities.Losses and charge-offs were 119 million dol-lars, an increase of 4 million dollars. Valu-ation reserves were increased by 75 milliondollars; this was 48 million dollars morethan the increase in the first half of 1953.
Nonoperating profit, recovery, and lossitems, together with transfers to and fromvaluation reserves, changed from a net lossof 88 million dollars in the first half of 1953to a net recovery of 104 million dollars inthe first half of this year. The increase innet profits after taxes between the two pe-riods was largely due to the shift from lossesto profits on security sales.
Taxes and net profits. Profits before in-come taxes were 1,032 million dollars, 24per cent greater than in the first half of1953, and provisions for income taxes were21 per cent higher. Net profits after taxesaggregated 559 million dollars, exceedingthe figure for the first six months of 1953by 121 million.
Cash dividends. Thirty-eight per centof net profits after taxes was distributed asdividends in the first half of this year. The211 million dollars paid in dividends repre-sented an annual yield of about 3.7 per centon average total capital accounts comparedwith 3.5 per cent in the first half of 1953,.when cash dividends amounted to 44 percent of net profits.
Details of earnings and expenses for thefirst half of 1954 and both halves of 1953are shown on page 1118 of this BULLETIN.
1052 FEDERAL RESERVE BULLETIN:
Digitized for FRASER http://fraser.stlouisfed.org/ Federal Reserve Bank of St. Louis
LAW DEPARTMENTAdministrative interpretations of banking laws, new regulations issued by the
Board of Governors, and other similar material
Foreign Banking CorporationsAmendments to Regulation K
The Board of Governors of the Federal ReserveSystem, effective September 29, 1954, amended sec-tions XI and XV of Regulation K entitled "Bank-ing Corporations Authorized to Do Foreign Bank-ing Business under the Terms of Section 25(a) ofthe Federal Reserve Act" commonly known asEdge Act Corporations, so as to broaden the powersto raise funds through the sale of their notes ordebentures if such corporations are not engaged inthe business of receiving deposits. The amend-ment also increases the amount of credit that sucha corporation can extend to a single borrower. Thetext of the amendment to Regulation K is asfollows:
AMENDMENT TO REGULATION K
Issued by the Board of Governors of the FederalReserve System
Effective September 29, 1954, Regulation K ishereby amended in the following respects:
1. By adding the following new subsection (c)after subsection (b) of section XI, and reletteringthe present subsection (c) to (d):
(c) Notwithstanding subsections (a) and (b) ofthis section, a corporation may, at its option, com-ply with the following requirements in lieu of thosestated in said subsections (a) and (b):
(1) The corporation shall not engage, eitherwithin the United States or abroad, in the busi-ness of receiving deposits.
(2) Loans or other credits acquired or guaran-teed by the corporation shall have a maturity ofnot more than 5 years at the time they are so ac-quired or guaranteed: Provided, however, That thislimitation shall not apply (i) to a loan or othercredit, or any scheduled installment of a loan orcredit, maturing within 10 years, but the aggregateamount of loans or credits or installments of loansor credits excepted under this clause (i) shall notexceed 100 per cent of the corporation's capital andsurplus; or (ii) to other loans or credits, or sched-
uled installments of loans or credits, maturingwithin 10 years to the extent that they are securedor covered by unconditional guaranties, commit-ments or agreements to take over or purchase madeby the United States or by any department or estab-lishment of, or corporation wholly owned by, theUnited States.
(3) The corporation shall carry on its businessin accordance with sound financial policies includ-ing, among other considerations, a proper regardto the relationship between its assets and the maturi-ties of its obligations, so as to give reasonable as-surance that the corporation will be in a positionto pay its obligations as they mature.
(4) All obligations of any kind, regardless ofmaturity or payee, issued by the corporation shallcontain a provision, or shall be issued under anagreement, which shall provide that the corporationwill not, during the time any such obligations re-main outstanding—
(/) Issue any obligations if immediately there-after the assets of the corporation, excludingnotes, drafts, bills of exchange and other evi-dences of indebtedness that are in default as toeither principal or interest, would be less than110 per cent of the aggregate principal amountof all obligations of the corporation;
(ii) Mortgage, pledge or otherwise subject anyof its assets to any lien or charge to secure anyindebtedness for borrowed money or to secureany other obligation of the corporation, unlesseach person holding any of the corporation's un-secured obligations, which would remain out-standing after such transaction, eithef grants hisconsent or is provided with security substantiallyequivalent in value to that provided by suchmortgage, pledge, lien or charge;
(///') Sell, lease, assign or otherwise dispose ofall or substantially all its assets; or
(iv) Declare or pay any dividend (other thana dividend payable in stock of the corporation)or authorize or make any other distribution onany stock of the corporation otherwise than out
'OCTOBER 1954 1053
Digitized for FRASER http://fraser.stlouisfed.org/ Federal Reserve Bank of St. Louis

LAW DEPARTMENT
of the earned surplus of the corporation as de-termined in accordance with generally acceptedaccounting principles.2. By adding the following sentence at the end
of the first paragraph of section XV:In the case of a corporation which does not en-gage, either within the United States or abroad,in the business of receiving deposits, the limita-tions contained in this paragraph regarding thetotal liabilities of one borrower (1) shall be in-creased from 10 per cent to 20 per cent, and (2)shall not apply to the extent that the liabilitiesare secured or covered by unconditional guaran-ties, commitments or agreements to take over orto purchase, made by the United States or by anydepartment or establishment of, or corporationwholly owned by, the United States.
LegislationCorrection of Obsolete References
The Act of Congress approved September 3, 1954(Public Law 779—83d Congress) amended variousstatutes and certain titles of the United States Codeprincipally for the purpose of correcting obsoletereferences. Among such amendments were thefollowing, amending sections 9 and 22(f) of theFederal Reserve Act and section 5144(d) of theRevised Statutes of the United States:
SEC. 21. Paragraph (d) of section 5144 of theRevised Statutes, as amended (12 U. S. C, sec.61 (d)), is amended by striking out the reference"5209 of the Revised Statutes, as amended (U. S. C,title 12, sec, 592)," and in lieu thereof inserting"1005 of title 18, United States Code", so that suchparagraph will read as follows:
"(d) Every officer, director, agent, and employeeof every such holding company affiliate shall besubject to the same penalties for false entries inany book, report, or statement of such holdingcompany affiliate as are applicable to officers, direc-tors, agents, and employees of member banks undersection 1005 of Title 18, United States Code; and".
* # #
SEC. 27. The sixth paragraph of section 9 of theFederal Reserve Act as amended (12 U. S. C, 324),is amended by striking out, in the second sentenceof such paragraph, the reference "section fifty-twohundred and nine of the Revised Statutes", and inlieu thereof inserting "sections 334, 656, and 1005of Title 18, United States Code", so that such para-graph will read as follows:
"All banks admitted to membership under au-thority of this section shall be required to complywith the reserve and capital requirements of thisAct and to conform to those provisions of law im-posed on national banks which prohibit such banksfrom lending on or purchasing their own stockywhich relate to the withdrawal or impairment oftheir capital stock, and which relate to the paymentof unearned dividends. Such banks and the offi-cers, agents, and employees thereof shall also besubject to the provisions of and to the penaltiesprescribed by sections 334, 656, and 1005 of Title 18,United States Code, and shall be required to makereports of condition and of the payment of divi-dends to the Federal Reserve bank of which theybecome a member. Not less than three of such re-ports shall be made annually on call of the FederalReserve bank on dates to be fixed by the Board ofGovernors of the Federal Reserve System. Failureto make such reports within ten days after the datethey are called for shall subject the offending bankto a penalty of $100 a day for each day that it failsto transmit such report; such penalty to be collectedby the Federal Reserve bank by suit or otherwise.Such reports of condition shall be in such formand shall contain such information as the Board ofGovernors of the Federal Reserve System may re-quire and shall be published by the reporting banksin such manner and in accordance with such regu-lations as the said Board may prescribe.".
SEC. 28. Subsection (f) of section 22 of the Fed-eral Reserve Act, as amended (12 U. S. C, 503),.is amended by inserting, after "thereof,", where itappears in such subsection, the words "or any ofthe provisions of sections 217, 218, 219, 220, 655,.1005, 1014, 1906, or 1909 of Title 18, United StatesCode,", so that such subsection will read as follows:
"(f) If the directors or officers of any memberbank shall knowingly violate or permit any of theagents, officers, or directors of any member bank toviolate any of the provisions of this section or regu-lations of the board made under authority thereof,,or any of the provisions of sections 217, 218, 219,.220, 655, 1005, 1014, 1906, or 1909 of Title 18^United States Code, every director and officer par-ticipating in or assenting to such violation shall beheld liable in his personal and individual capacityfor all damages which the member bank, its share-holders, or any other persons shall have sustained inconsequence of such violation.".
1054 FEDERAL RESERVE BULLETIN;
Digitized for FRASER http://fraser.stlouisfed.org/ Federal Reserve Bank of St. Louis
CURRENT EVENTS AND ANNOUNCEMENTS
Federal Reserve Meetings
The Federal Advisory Council held a meeting inWashington on September 19-21, 1954, and metwith the Board of Governors of the Federal ReserveSystem on September 21.
A meeting of the Presidents of the Federal Re-serve Banks was held in Washington on September20 and 21, and on September 22 the Presidentsmet with the Board of Governors of the FederalReserve System.
On September 22 a meeting of the Federal OpenMarket Committee was held.
Appointments of Branch Directors
On October 4, 1954, the Board of Governors ofthe Federal Reserve System announced the appoint-ment of Mr. John A. Hannah, President, MichiganState College, East Lansing, Michigan, as a directorof the Detroit Branch of the Federal Reserve Bankof Chicago for the term ending December 31, 1954.He succeeded Mr. C. M. Hardin, Dean of Agricul-ture, Michigan State College, East Lansing, Michi-gan, who resigned. Mr. Hannah formerly servedas a director of the Detroit Branch from January 1,1951 to March 13, 1953, when he resigned to be-come Assistant Secretary of Defense.
On October 6, 1954, the Federal Reserve Bankof San Francisco appointed Mr. R. S. Hanson, Vice
President and Cashier, The First National Bank ofLogan, Logan, Utah, as a director of the Salt LakeCity Branch of the Federal Reserve Bank of SanFrancisco for the term ending December 31, 1954.Mr. Hanson succeeded Mr. James W. Collins,Chairman of the Board, Tracy-Collins Trust Com-pany, Salt Lake City, Utah, deceased.
Admission of State Bank to Membership in theFederal Reserve System
The following State bank was admitted to mem-bership in the Federal Reserve System during theperiod August 16, 1954 to September 15, 1954:
VirginiaRichmond—The Bank of Virginia.
Tables Published Annually and Semiannually, withLatest BULLETIN Reference
Semiannually Issue PageBanking offices:
Analysis of changes in number of. . . Aug. 1954 903On, and not on, Federal Reserve Par
List, number of Aug. 1954 904
Annually
Earnings and expenses:Federal Reserve Banks Feb. 1954 208-209Member banks:
Calendar year May 1954 524-534First half of year Oct. 1954 1118
Insured commercial banks May 1954 535Banks and branches, number of, by class
and State May 1954 536-537Operating ratios, member banks Aug. 1954 900-902
OCTOBER 1954 1055
Digitized for FRASER http://fraser.stlouisfed.org/ Federal Reserve Bank of St. Louis
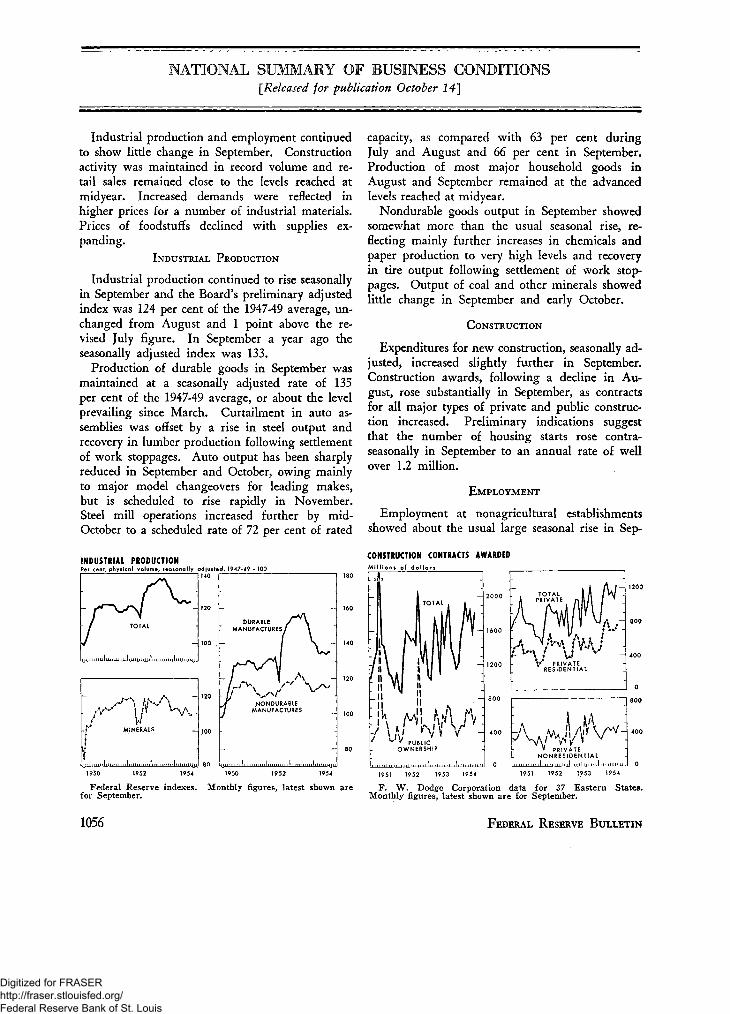
NATIONAL SUMMARY OF BUSINESS CONDITIONS{Released for publication October 14]
Industrial production and employment continuedto show little change in September. Constructionactivity was maintained in record volume and re-tail sales remained close to the levels reached atmidyear. Increased demands were reflected inhigher prices for a number of industrial materials.Prices of foodstuffs declined with supplies ex-panding.
INDUSTRIAL PRODUCTION
Industrial production continued to rise seasonallyin September and the Board's preliminary adjustedindex was 124 per cent of the 1947-49 average, un-changed from August and 1 point above the re-vised July figure. In September a year ago theseasonally adjusted index was 133.
Production of durable goods in September wasmaintained at a seasonally adjusted rate of 135per cent of the 1947-49 average, or about the levelprevailing since March. Curtailment in auto as-semblies was oflset by a rise in steel output andrecovery in lumber production following settlementof work stoppages. Auto output has been sharplyreduced in September and October, owing mainlyto major model changeovers for leading makes,but is scheduled to rise rapidly in November.Steel mill operations increased further by mid-October to a scheduled rate of 72 per cent of rated
INDUSTRIAL PRODUCTION
capacity, as compared with 63 per cent duringJuly and August and 66 per cent in September.Production of most major household goods inAugust and September remained at the advancedlevels reached at midyear.
Nondurable goods output in September showedsomewhat more than the usual seasonal rise, re-flecting mainly further increases in chemicals andpaper production to very high levels and recoveryin tire output following settlement of work stop-pages. Output of coal and other minerals showedlittle change in September and early October.
CONSTRUCTION
Expenditures for new construction, seasonally ad-justed, increased slightly further in September.Construction awards, following a decline in Au-gust, rose substantially in September, as contractsfor all major types of private and public construc-tion increased. Preliminary indications suggestthat the number of housing starts rose contra-seasonally in September to an annual rate of wellover 1.2 million.
EMPLOYMENT
Employment at nonagricultural establishmentsshowed about the usual large seasonal rise in Sep-
CONSTRUCTION CONTRACTS AWARDEDMillions of dollo
RESIDENTIAL
PRIVATENONRESIDENTIAL
0
800
Federal Reserve indexes. Monthly figures, latest shown arefor September.
F. W. Dodge Corporation data for 37 Eastern States.Monthly figures, latest shown are for September.
1056 FEDERAL RESERVE BULLETIN
Digitized for FRASER http://fraser.stlouisfed.org/ Federal Reserve Bank of St. Louis
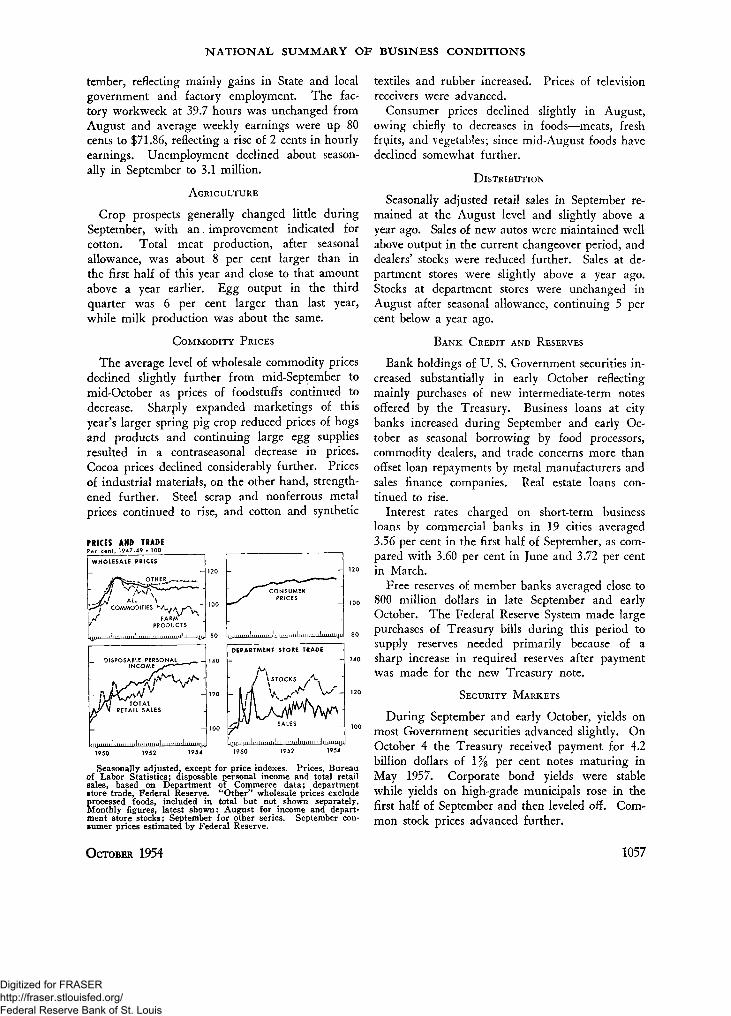
NATIONAL SUMMARY OF BUSINESS CONDITIONS
tember, reflecting mainly gains in State and localgovernment and factory employment. The fac-tory workweek at 39.7 hours was unchanged fromAugust and average weekly earnings were up 80cents to $71.86, reflecting a rise of 2 cents in hourlyearnings. Unemployment declined about season-ally in September to 3.1 million.
AGRICULTURE
Crop prospects generally changed little duringSeptember, with an, improvement indicated forcotton. Total meat production, after seasonalallowance, was about 8 per cent larger than inthe first half of this year and close to that amountabove a year earlier. Egg output in the thirdquarter was 6 per cent larger than last year,while milk production was about the same.
COMMODITY PRICES
The average level of wholesale commodity pricesdeclined slightly further from mid-September tomid-October as prices of foodstuffs continued todecrease. Sharply expanded marketings of thisyear's larger spring pig crop reduced prices of hogsand products and continuing large egg suppliesresulted in a contraseasonal decrease in prices.Cocoa prices declined considerably further. Pricesof industrial materials, on the other hand, strength-ened further. Steel scrap and nonferrous metalprices continued to rise, and cotton and synthetic
PRICES AND TRADE
WHOLESALE PRICES
RETAIL SALES
| | ,,
20
100
80
140
120
100
-^ ^ • • • • — . — -
/ " " " "CONSUMER^yT/ PRICES
-1JAM 1 11111,
DEPARTMENT STOR
1 \ STOCKS
' X T SALES
~rjmimn nun Ilimillll
I U[)]
: TRADE
,/v:| M m m m | „„.,
Seasonally adjusted, except for price indexes. Prices, Bureauof Labor Statistics; disposable personal income and total retailsales, based on Department of Commerce data; departmentstore trade, Federal Reserve. "Other" wholesale prices excludeprocessed foods, included in total but not shown separately.Monthly figures, latest shown: August for income and depart-ment store stocks; September for other series. September con-sumer prices estimated by Federal Reserve.
textiles and rubber increased. Prices of televisionreceivers were advanced.
Consumer prices declined slightly in August,owing chiefly to decreases in foods—meats, freshfruits, and vegetables; since mid-August foods havedeclined somewhat further.
DISTRIBUTION
Seasonally adjusted retail sales in September re-mained at the August level and slightly above ayear ago. Sales of new autos were maintained wellabove output in the current changeover period, anddealers' stocks were reduced further. Sales at de-partment stores were slightly above a year ago.Stocks at department stores were unchanged inAugust after seasonal allowance, continuing 5 percent below a year ago.
BANK CREDIT AND RESERVES
Bank holdings of U. S. Government securities in-creased substantially in early October reflectingmainly purchases of new intermediate-term notesoffered by the Treasury. Business loans at citybanks increased during September and early Oc-tober as seasonal borrowing by food processors,commodity dealers, and trade concerns more thanoffset loan repayments by metal manufacturers andsales finance companies. Real estate loans con-tinued to rise.
Interest rates charged on short-term businessloans by commercial banks in 19 cities averaged3.56 per cent in the first half of September, as com-pared with 3.60 per cent in June and 3.72 per centin March.
Free reserves of member banks averaged close to800 million dollars in late September and earlyOctober. The Federal Reserve System made largepurchases of Treasury bills during this period tosupply reserves needed primarily because of asharp increase in required reserves after paymentwas made for the new Treasury note.
SECURITY MARKETS
During September and early October, yields onmost Government securities advanced slightly. OnOctober 4 the Treasury received payment for 4.2billion dollars of 1% per cent notes maturing inMay 1957. Corporate bond yields were stablewhile yields on high-grade municipals rose in thefirst half of September and then leveled off. Com-mon stock prices advanced further.
OCTOBER 1954 1057
Digitized for FRASER http://fraser.stlouisfed.org/ Federal Reserve Bank of St. Louis
FINANCIAL, INDUSTRIAL, AND COMMERCIAL STATISTICSUNITED STATES
PAGE
Member bank reserves, Reserve Bank credit, and related items 1061-1062
Federal Reserve Bank rates; margin requirements; reserve requirements 1062-1063
Reserves and deposits of member banks 1064
Federal Reserve Bank statistics 1065-1067
Regulation V: guaranteed loans, fees, and rates 1067-1068
Bank debits and deposit turnover; Postal Savings System 1068
Money in circulation 1069
Consolidated statement of the monejtary system; deposits and currency 1070
All banks in the United States, by classes 1071-1073
All commercial banks in the United States, by classes 1074-1075
Weekly reporting member banks 1076-1077
Commercial paper and bankers' acceptances 1078
Life insurance companies; savings and loan associations 1079
Government corporations and credit agencies 1080-1081
Security prices and brokers' balances 1082
Money rates; bank rates on business loans; bond and stock yields 1083
Treasury finance 1084-1089
New security issues 1090
Business finance 1091-1092
Real estate credit statistics 1093-1095
Statistics on short- and intermediate-term consumer credit 1096-1098
Business indexes 1099-1108
Merchandise exports and imports 1108
Department store statistics 1109-1113
Consumer and wholesale prices 1114-1115
Gross national product, national income, and personal income 1116-1117
Member Bank Earnings 1118
List of tables published in BULLETIN annually or semiannually,with references for latest data 1055
Tables on the following pages include the principal statistics of current significance relating tofinancial and business developments in the United States. The data relating to Federal ReserveBanks, member banks of the Federal Reserve System, and department store trade, and the consumercredit estimates are derived from regular reports made to the Board; index numbers of productionare compiled by the Board on the basis of material collected by other agencies; figures for goldstock, money in circulation, Treasury finance, and operations of Government credit agencies areobtained from statements of the Treasury; the remaining financial data and other series on businessactivity are obtained largely from other sources. Back figures through 1941 for banking andmonetary tables, together with descriptive text, may be obtained from the Board's publication,Banking and Monetary Statistics; back figures for many other tables may be obtained from earlierBULLETINS.
OCTOBER 1954 1059
Digitized for FRASER http://fraser.stlouisfed.org/ Federal Reserve Bank of St. Louis
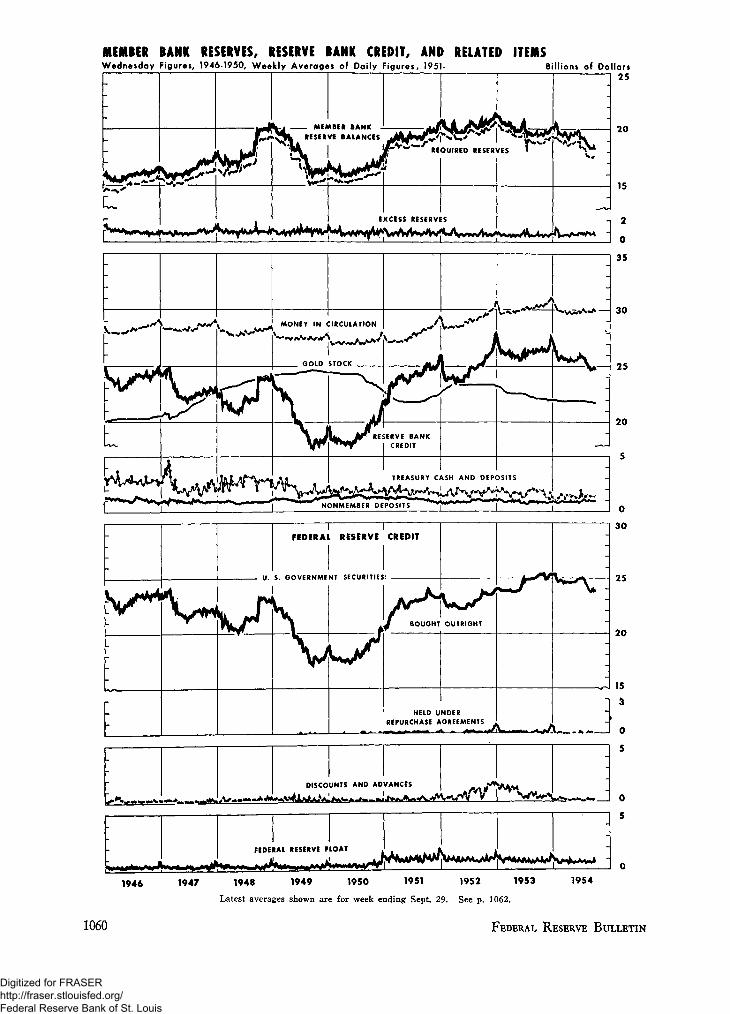
MEMBER BANK RESERVES, RESERVE BANK CREDIT, AND RELATED ITEMSWednesday Figures, 1946-1950, Weekly Averages of Daily Figures, )95)- Billions of Dollars
25
* » V * ^ ^
15
0
35
— 30
*— 25
20
-
-
MONEY IN (
GOLD
\
V
:IRCULATION
5TOCK
A1 JT
»ERVE BANKCREDIT
TREASURY C
NONMEMBER DEPOSITS "^
I J~—
\SH AND DEP(3SITS
0
30
1946 1947 1948 1949 1950 1951 1952 1953 1954
Latest averages shown are for week ending Sept. 29. See p. 1062.
1060 FEDERAL RESERVE BULLETIN
Digitized for FRASER http://fraser.stlouisfed.org/ Federal Reserve Bank of St. Louis
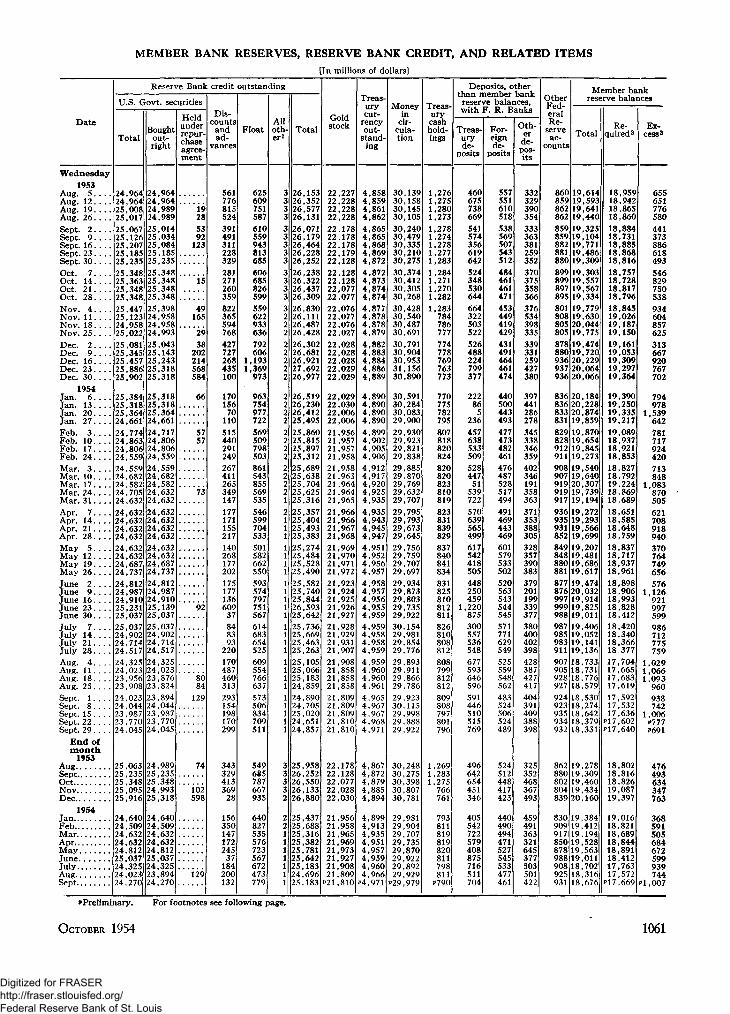
MEMBER BANK RESERVES, RESERVE BANK CREDIT, AND RELATED ITEMS[In millions of dollars]
Date
Reserve Bank credit outstanding
U.S. Govt. securities
TotalBought
out-right
Heldunderrepur-chaseagree-ment
Dis-countsandad-
vances
FloatAlloth-er
Total
Goldstock
Treas-urycur-
rencyout-
stand-ing
Moneyin
cir-cula-tion
Treas-urycashhold-ings
Deposits, otherthan member bankreserve balances,with F. R. Banks
Treas-uryde-
posits
For-eignde-
posits
Oth-er
de-pos-its
OtherFed-eralRe-
serveac-
counts
Member bankreserve balances
TotalRe- Ex-
cess2
Wednesday
1953Aug. 5Aug. 12Aug. 19Aug. 26
Sept. 2Sept. 9Sept. 16Sept. 23Sept. 30. . . .
Oct. 7Oct. 14Oct. 21Oct. 28
Nov. 4 . . . .Nov. 11Nov. 18. . . .Nov. 25
Dec. 2Dec. 9Dec. 16Dec. 23Dec. 30
1954Jan. 6Jan. 13Jan. 20Jan. 27
Feb. 3Feb. 10Feb. 17Feb. 24
Mar. 3Mar. 1 0 . . . .Mar. 17Mar. 24Mar. 31
Apr. 7Apr. 1 4 . . . .Apr. 21Apr. 28
May 5May 12May 19. . . .May 26
June 2 . . . .June 9 . . . .June 16 . . . .June 2 3 . . . .June 3 0 . . . .
July 7 . . . .July 14July 21July 2 8 . . . .
Aug. 4Aug. 1 1 . . . .Aug. 18Aug. 25
Sept. 1Sept. 8 . . . .Sept. 1 5 . . . .Sept. 22Sept. 29
End ofmonth
1953AugSeptOctNovDec
1954JanFebMarAprMayJuneJulyAugSept
24,96424,96425,00825,017
25,06725,12625,20725,18525,235
25,34825,36325,34825,348
25,44725,12324,95825,022
25,08125,34525,45725,88625,902
25,38425,31825,36424,661
24,77424.86324,80624,559
24,55924,68224,58224,70524,632
24,63224,63224,63224,632
24,63224,63224,68724,737
24,81224,98724,91025,23125,037
25,03724,90224,71424,517
24,32524,02323,95623,908
24,02324,04423,98723,77024.045
25,06325,23525,34825,09525,916
24,64024,50924,63224,63224,81225,03724,32524,02324,270
24,96424,96424,98924,989
25,01425,03425,08425,18525,235
25,34825,34825,34825,348
25,39824,95824,95824,993
25,04325,14325,24325,31825,318
25,31825,31825.36424,661
24,71724,80624,80624,559
24,55924,68224,58224,63224.632
24,63224,63224,63224,632
24,63224,63224,68724,737
24,81224,98724,91025,13925,037
25,03724,90224,71424,517
24,32524,02323,87623,824
23,89424,04423,98723,no24,045
24,98925,23525,34824,99325,318
24,64024,50924,63224,63224,81225,03724,32523,89424,270
1928
5392123
15
49165
29
38202214568584
66
73
92
8084
129
74
102598
129
561776815524
391491311228329
281271260359
822365594768
427727268435100
17015670110
515440291249
267411265349147
177171155217
140268177202
17517713660937
848393220
170487460313
293154198170299
34332941336928
15635014717224537184200132
625609751587
610559943813685
606685826599
559622933636
792606
1,1931,369973
963754977722
569509798503
861543855569535
546599704533
501582662550
593574797751567
614683654525
609554766637
573506834709511
549685787667935
640827535576723567672473779
26,15326,35226,57726,131
26,07126,17926,46426,22826,252
26,23826,32226,43726,309
26,83026,11126,48726,428
26,30226,68126,92127,69226,977
26,51926,23026,41225,495
25,86025,81525,89725,312
25,68925,638.5,70425,62525,316
25,35725,40425,49325,383
25,27425,48425,52825,490
25,58225,74025,84426,59325,642
25,73625,66925,46325,263
25,10525,06625,18324,859
24,890.4,70525,02024,65124,857
25,95826,25226,55026,13326,880
25,43725,68825,31625,38225,78125,64225,18324,69625.183
22,22722,22822,22822,228
22,17822,17822,17822,17922,128
22,12822,12822,07722,077
22,07622,07722,07622,027
22,02822,02822,02822,02922,029
22,02922,03022,00622,006
21,95621,95721,95721,958
21,95821,96321,96421,96421,965
21,96621,96621,96721,968
21,96921,97021,97121,972
21,92321,92421,92521,92621,927
21,92821,92921,93121,907
21,90821,85821,85821,858
21,80921,80921.80921,81021,810
22,17822,12822,07722,02822,030
956958965969973927908809810
4,8584,8594,8614,862
4,8654,8654,8684,8694,872
4,8724,8734,8744,874
4,8774,8784,8784,879
4,8824,8834,8844,8864,889
4,8904,8904,8904,890
4,8994,9024,9054,906
4,9124,9174,9204,9254,935
4,9354,9434,9454,947
4,9514,9524,9564,957
4,9584,9574,9564,9554,959
4,9594,9584,9584,959
4,9594,9604,9604,961
4,9654,9674,9674,9684,971
4,8674,8724,8794,8854,894
899913935951957959960966971
30,13930,15830,14530,105
30,24030,47930,33530,21030,275
30,37430,41230,30530,268
30,42830,54030,48730,691
30,79130,90430,95331,15630,890
30,59130,28430,08329,900
29,93029,92329,82129,838
29,88529,87029,76929,63229,707
29,79529,79329,67329,645
29,75629,75929,70729,697
29,93429,87329,80329,73529,922
30,15429,98129,85429,776
29,89329,91129,86629,786
29,92330,11529,99829,88829,922
30,24830,27530,39830,80730,781
29,98129,90429,70729,73529,87029,92229,89229,929P29.979
,276,275,280,273
,278,274,278,277,283
,284,271,270,282
1,283784786777
774778769763773
770775782795
807818820824
820820823810819
823831839829
837840841834
831825810812811
826810808812
808799812812
809808797801796
1,2691,2831,275766761
793811819819820811798811
460675738669
541574356619642
524348530644
664322503522
526488224799377
222865
236
457638533509
52844751
539722
570639565499
617542418505
448250459
1,220875
300557536548
677593646596
591446510515769
496642654451346
405542722579408875716511704
557551610518
538569507543512
484461461471
453449419429
431491464461474
440500443493
477473482461
476487528517494
491469443469
601579533502
520563543544545
571771629549
525559548562
483524506524489
524512448417423
440490494471527545533477461
332329390354
333363381259352
370375358366
376534398335
339331259427380
397441286278
345338346359
402346191358363
371353388305
328357390383
379201199339377
380400402398
428387427417
391409388398
325352468367493
459491363321645377503501422
860 19,614859862862
859859882881880
899899897895
801808805805
878880
19,59319,64119,440
19,32519,10419,77119,48619,309
19,30319,55719,56719,334
19,77919,63020,04419,775
19,47419,720
936 20,229937936
20,06420,066
836 20,184836 20,228833 20,874831
829828912911
908 19,540
19,859
19,87019,65419,84519,273
907919919917
936935931852
849848
19,64020,30719,73919,194
19,27219.29319,56619,699
19,20719,481
880 19,686881
877876997
19,617
19,47420,03219,914
999 19,825988
987985983911
907905928927
924923935934932
862880802804839
830909917850878988908925931
19,011
19,40619,05219,14119,136
18,73318,73118,77618,579
18,53018,27418,64218,37918,331
19,27819,30919,46019,43420,160
19,38419,41219,19419,52819,56319,01118,70218,31618,676
18,95918,94218,86518,860
18,88418,73118,88518,86818,816
18,75718,72818,81718,796
18,84519,02619,18719,150
19,16119,05319,30919,29719,364
19,39019,25019,33519,217
19,08918,93718,92118,853
18,82718,79219,22418,86918,689
18,65118,58518.64818,759
18,83718,71718,93718,961
18,89818,90618,99318,82818,412
18,42018,34018,36618.377
17,70417,66517,68317,619
17,59217,53217,63617,60217,640
18,80218,81618,82619,08719,397
19,01618,82118,68918,84418,89118,41217,76317,57217,669
655651776580
441373886618493
546829750538
934604857625
313667920767702
794978
1,539642
781717924420
713848
1,083870505
621708918940
370764749656
5761,126921997599
986712775759
1,0291,0661,093960
938742
1,006P777P691
476493634347763
368591505684672599939744,007
* Preliminary. For footnotes see following page.
OCTOBER 1954 1061
Digitized for FRASER http://fraser.stlouisfed.org/ Federal Reserve Bank of St. Louis
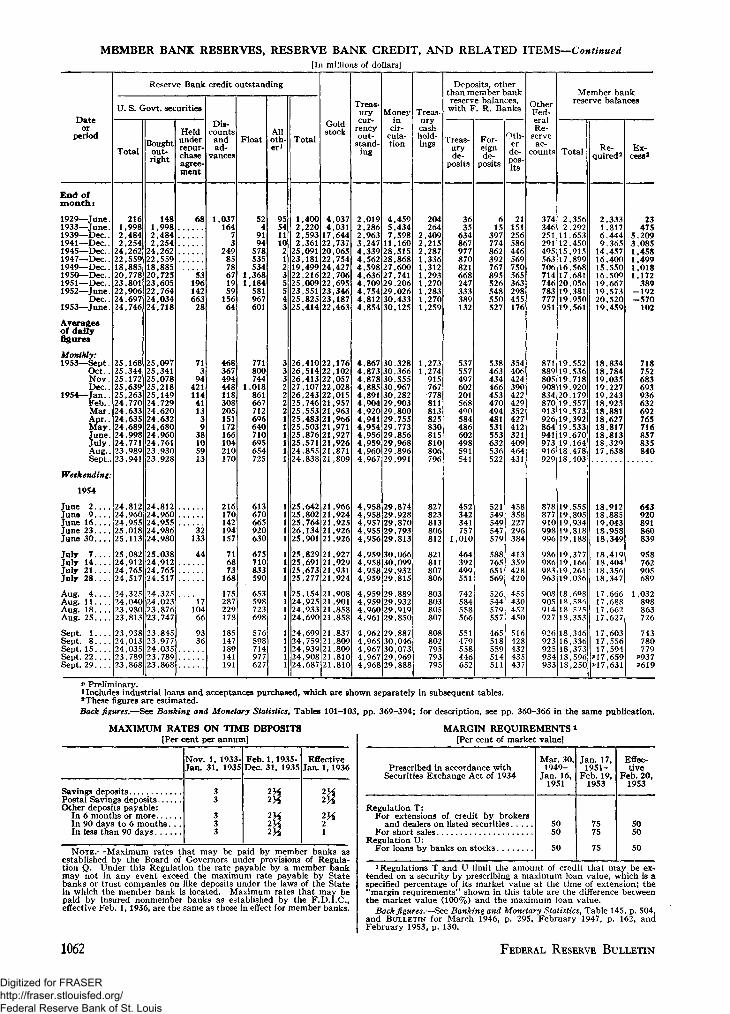
MEMBER BANK RESERVES, RESERVE BANK CREDIT, AND RELATED ITEMS—Continued[In millions of dollars]
Dateor
period
Reserve Bank credit outstanding
U. S. Govt. securities
TotalBought
out-right
Heldunderrepur-chaseagree-ment
Dis-countsandad-
vances
FloatAlloth- Total
Goldstock
Treas-urycur-
rencyout-
stand-ing
Moneyin
cir-cula-tion
Treas-urycashhold-ings
Deposits, otherthan member bankreserve balances,with F. R. Banks
Treas-uryde-
posits
3635
634867977870821668247333389132
537557497602201568490584486602498591541
452342341757
1,010
464392499551
742584558566
551479558446652
For-eignde-
posits
615
397774862392767895526548550527
538463434466453470494481531553632536522
521549549547579
588765651569
526544579557
465518559514511
Oth-erde-pos-its
OtherFed-eralRe-
serveac-
counts
Member bankreserve balances
Total Re-quired2
Ex-
End ofmonth:
1929—June.1933—June.1939—Dec..1941—Dec..1945—Dec.1947—-Dec..1949—Dec..1950—Dec.1951—Dec.1952—June.
Dec.1953—June.
Averagesof dailyfigures
Monthly:1953—Sept
Oct..Nov.Dec.
1954—Jan..Feb..Mar.
May".June.July.Aug..Sept..
Weekending:
1954
2161,9982,4842,25424,26222,55918,88520,77823,80122,90624,69724,746
25,16825.34425.17225,63925,26324,77024,63324,63524,68924,99824,77123,98923,941
24,81224,96024,95525,01825,113
25,08224,91224,76524,517
24,32524,04023,98023,813
1481,9982,4842,25424,26222,55918,88520,72523,60522,76424,03424,718
25,09725,34125,07825,21825,14924,72924.62024,63224,68024,96024,76123,93023,928
24,81224,96024,95524,98624,980
25,03824,91224,76524,517
24,325
68
5319614266328
71394
42111441133938105913
32133
44
Sept. 1.Sept. 8.Sept. 15.Sept. 22.Sept. 29.
23,93824,01324,03523,78923,868
24,02323,87623,747
23,84523,97724,03523,78923,868
1710466
9336
1,03716473
249857867195915664
468367494448118308205151172166104210170
216170142194157
716873168
175287229178
185147189141191
5249194578535534
1,3681,184581967601
771800744
1,018861667712696640710695654725
613670665920630
675710833590
653598723698
576598714977627
1,4002,2202,5932,36125,09123,181
25,00923,55125,82525,414
4,0374,03117,64422,73720,06522,754
19,499 24,42722,216 22,706
22,69523,34623,18722,463
2,0192,2862,9633,2474,339 284,562
4,4595,4347,59811,160
,51528,86827,60027,741
709 29.206,026
30,43330,125
44,4444,854
754 29812
26,410 2226,514 2226,41327,10726,24325,746 2125,55325,483 2125,50325,876 2125,57124,85524,838 21
,176,102
22,05722,02822,015
,95721,963
,96621,971
,92721,92621,871
,809
4,8674,8734,4,8854,8914,4,4,9414,4,4,4,4,967
878 30
904 29920 29
954 29956 29959 29960 29
30.32830.366
.55530.96730,282
,903,800
29,755,773,856,968,896
29,991
25,64225,80225,764 2126,134 2125,901
21,96621,924
,925,926
21,926
4,958 294,958 294,9574,4,956,955 29
,874,928
29,870,793
29,813
25,829 2125,69125,673 2125,277 21
,92721,929
,931,924
4,9594,958 304.958 294.959 29
30,066,099,932,815
25,15424,24,933 2124,
21,908,901,858,858
4,4,959 294,4,961
,889,932,919
29,850
24,699 2124,75924,939 2124,90824,687
,83721,809
,80921,81021,810
4,9624,965 304,967 304,9674,968
29,887,046,073
29,96929,888
204264
2,4092,2152,2871,3361,3121,2931,2701,2831,2701,259
1,2731,274915767778811813825830815810806796
827823813806812
821811807806
803803805807
808802795793795
21151256586446569750565363298455176
354406424390422429352427412321409464431
458358227296384
413359428420
430452
516428432435437
374346251291495563706714
2,3562,29211.65312.45015,91517,89916.56817,681
746 20.056783777951
871889805908834870913926864941973
878877
19,38119.95019,561
19,55219,53619,71819,92020.17919,55719,57319,39219.53319,67019,16418,47818,403
19.55519,805
2,3331.8176,4449,36514,45716,40015.55016.50919.66719,57320,52019,459
18,83418,78419,03519.22719,24318,92518,88118,62718,81718,81318,32917,638
23475
5,2093,0851,4581,4991,0181,172389
-192-570102
718752683693936632692765716857835840
910 19,934998996
986986983963
905914
926923925934933
19,81819,188
19,37719,16619,26119,036
18.6Q818,1818,353
18,34618,33618,37318,59618,250
18,91218,88519,04318,95818,349
18,41918,40418,35618,347
17,66617,68817.66217,627
17,60317,55617,594
P17,659P17.631
643920891860839
958762905689
1,032898863726
743780779
P937
P Preliminary.1 Includes industrial loans and acceptances purchased, which are shown separately in subsequent tables.2 These figures are estimated.Back figures.—See Banking and Monetary Statistics, Tables 101-103, pp. 369-394; for description, see pp. 360-366 in the same publication.
MAXIMUM RATES ON TIME DEPOSITS[Per cent per annum]
Nov. 1, 1933-Jan. 31, 1935
Savings depositsPostal Savings depositsOther deposits payable:
In 6 months or moreIn 90 days to 6 months. . .In less than 90 days
Dec. 31, 1935 Jan. 1,1936Feb. 1,1935- Effective
NOTE.—Maximum rates that may be paid by member banks asestablished by the Board of Governors under provisions of Regula-tion Q. Under this Regulation the rate payable by a member bankmay not in any event exceed the maximum rate payable by Statebanks or trust companies on like deposits under the laws of the Statein which the member bank is located. Maximum rates that may bepaid by insured nonmember banks as established by the F.D.I.C.,effective Feb. 1, 1936, are the same as those in effect for member banks.
MARGIN REQUIREMENTS »[Per cent of market value]
Prescribed in accordance withSecurities Exchange Act of 1934
Regulation T:For extensions of credit by brokers
and dealers on listed securitiesFor short sales
Regulation U:For loans by banks on stocks
Mar. 30,1949-
Jan. 16,1951
5050
50
Jan. 17,1951-
Feb. 19,1953
7575
75
Effec-tive
Feb. 20,1953
5050
50
1 Regulations T and U limit the amount of credit that may be ex-tended on a security by prescribing a maximum loan value, which is aspecified percentage of its market value at the time of extension; the"margin requirements" shown in this table are the difference betweenthe market value (100%) and the maximum loan value.
Back figures.—See Banking and Monetary Statistics, Table 145, p. 504,and BULLETIN for March 1946, p. 295, February 1947, p. 162, andFebruary 1953, p. 130.
1062 FEDERAL RESERVE BULLETIN
Digitized for FRASER http://fraser.stlouisfed.org/ Federal Reserve Bank of St. Louis
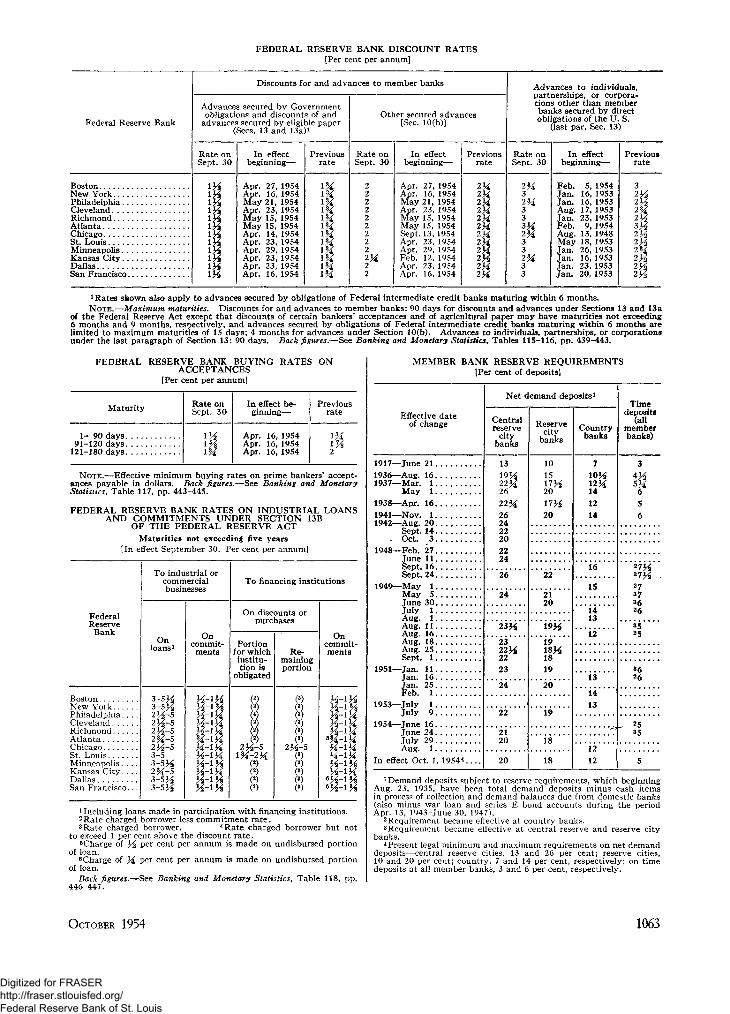
FEDERAL RESERVE BANK DISCOUNT RATES[Per cent per annum]
Federal Reserve Bank
Discounts for and advances to member banks
Advances secured by Governmentobligations and discounts of and
advances secured by eligible paper(Sees. 13 and 13a)1
Rate onSept. 30
In effectbeginning—
Previousrate
Other secured advances[Sec. 10(b)]
Rate onSept. 30
In effectbeginning—
Previousrate
Advances to individuals,partnerships, or corpora-tions other than memberbanks secured by directobligations of the U. S.
(last par. Sec. 13)
Rate onSept. 30
In effectbeginning—
Previousrate
BostonNew York.. .,Philadelphia. ,ClevelandRichmondAtlantaChicagoSt. Louis . . . .Minneapolis. .Kansas City.DallasSan Francisco
Apr. 27,Apr. 16,May 21,Apr. 23,May 15,May 15,Apr. 14,Apr. 23,Apr. 29,Apr. 23,Apr. 23,Apr. 16,
195419541954195419541954195419541954195419541954
222222222
2
Apr. 27,Apr. 16,May 21,Apr. 23,May 15.May 15,Sept. 13,Apr. 23.Apr. 29,Feb. 12,Apr. 23,Apr. 16,
195419541954195419541954195419541954195419541954
3
V3
T2H33
Feb. 5,Jan. 16,Jan. 16,Aug. 17,Jan. 23,Feb. 9,Aug. 13,May 18,Jan. 26,Jan. 16,Jan. 23,Jan. 20,
195419531953195319531954194819531953195319531953
1 Rates skown also apply to advances secured by obligations of Federal intermediate credit banks maturing within 6 months.NOTE.—Maximum maturities. Discounts for and advances to member banks: 90 days for discounts and advances under Sections 13 and 13a
of the Federal Reserve Act except that discounts of certain bankers' acceptances and of agricultural paper may have maturities not exceeding6 months and 9 months, respectively, and advances secured by obligations of Federal intermediate credit banks maturing within 6 months arelimited to maximum maturities of 15 days; 4 months for advances under Section 10(b). Advances to individuals, partnerships, or corporationsunder the last paragraph of Section 13: 90 days. Back figures.—See Banking and Monetary Statistics, Tables 115-116, pp. 439-443.
FEDERAL RESERVE BANK BUYING RATES ONACCEPTANCES
[Per cent per annum]
Maturity
1- 90 days91-120 days
121-180 days
Rate onSept. 30
1V2
\%
In effect be-ginning—
Apr. 16, 1954Apr. 16, 1954Apr. 16, 1954
Previousrate
IMIK
NOTE.—Effective minimum buying rates on prime bankers' accept-ances payable in dollars. Back figures.—See Banking and MonetaryStatistics, Table 117, pp. 443-445.
FEDERAL RESERVE BANK RATES ON INDUSTRIAL LOANSAND COMMITMENTS UNDER SECTION 13B
OF THE FEDERAL RESERVE ACTMaturities not exceeding five years
[In effect September 30. Per cent per annum]
FederalReserve
Bank
BostonNew YorkPhiladelphiaClevelandRichmondAtlantaChicagoSt. LouisMinneapolis. . . .Kansas C i t y . . . .DallasSan Francisco...
To industrial orcommercialbusinesses
Onloans1
3-5343-5^2^-5234-52H~52%-52^-53-53-5K2H-s3-5 y23-534
Oncommit-
ments
34-1M
To financing institutions
On discounts orpurchases
Portionfor whichinstitu-tion is
obligated
4(2) 4
Re-mainingportion
• /̂2 J
Oncommit-ments
^-134H-iHM-iH34-1HX-iX
H-iHM-iKX-iX34-1H
6 3 4 - i ^6 K - i ^
1 Including loans made in participation with financing institutions.2Rate charged borrower less commitment rate.3 Rate charged borrower. 4Rate charged borrower but not
to exceed 1 per cent above the discount rate.5Charge of 3^ per cent per annum is made on undisbursed portion
of loan.6Charge of }£ per cent per annum is made on undisbursed portion
of loan.Back figures.—See Banking and Monetary Statistics, Table 118, pp.
446-447.
MEMBER BANK RESERVE REQUIREMENTS[Per cent of deposits]
Effective dateof change
1917—June 211936—Aug. 161937—Mar. 1
May 11938—Apr. 161941—Nov. 11942—Aug. 20
Sept. 14- Oct. 3
1948—Feb. 27June 11Sept. 16Sept. 24
1949_May 1May 5June 30July 1 . . . . . .Aug. 1 . . .Aug. 11Aug. 16Aug. 18Aug. 25Sept. 1
1951—Jan. 11Jan. 16Jan. 25Feb. 1
1953_july 1July 9
1954—June 16June 24July 29Aug. 1
In effect Oct. 1, 19544....
Net demand deposits 1
Centralreserve
citybanks
13
22f|2622*4262422202224
26
24
23X
2322H2223
24
22
2120
20
Reservecity
banks
1015
20 2
20
22
2120
19X
19
1819
20
19
18
18
Countrybanks
7
ioxa*1214
16
15
1413
12
13
1413
1212
Timedeposits
(allmemberbanks)
3
5 j |656
271^
27373626
3525
362 6
. 2535
5
1 Demand deposits subject to reserve requirements, which beginningAug. 23, 1935, have been total demand deposits minus cash itemsin process of collection and demand balances due from domestic banks(also minus war loan and series E bond accounts during the periodApr. 13, 1943-June 30, 1947).
2 Requirement became effective at country banks.3 Requirement became effective at central reserve and reserve city
banks.4 Present legal minimum and maximum requirements on net demand
deposits—central reserve cities, 13 and 26 per cent; reserve cities,10 and 20 per cent; country, 7 and 14 per cent, respectively; on timedeposits at all member banks, 3 and 6 per cent, respectively.
OCTOBER 1954 1063
Digitized for FRASER http://fraser.stlouisfed.org/ Federal Reserve Bank of St. Louis
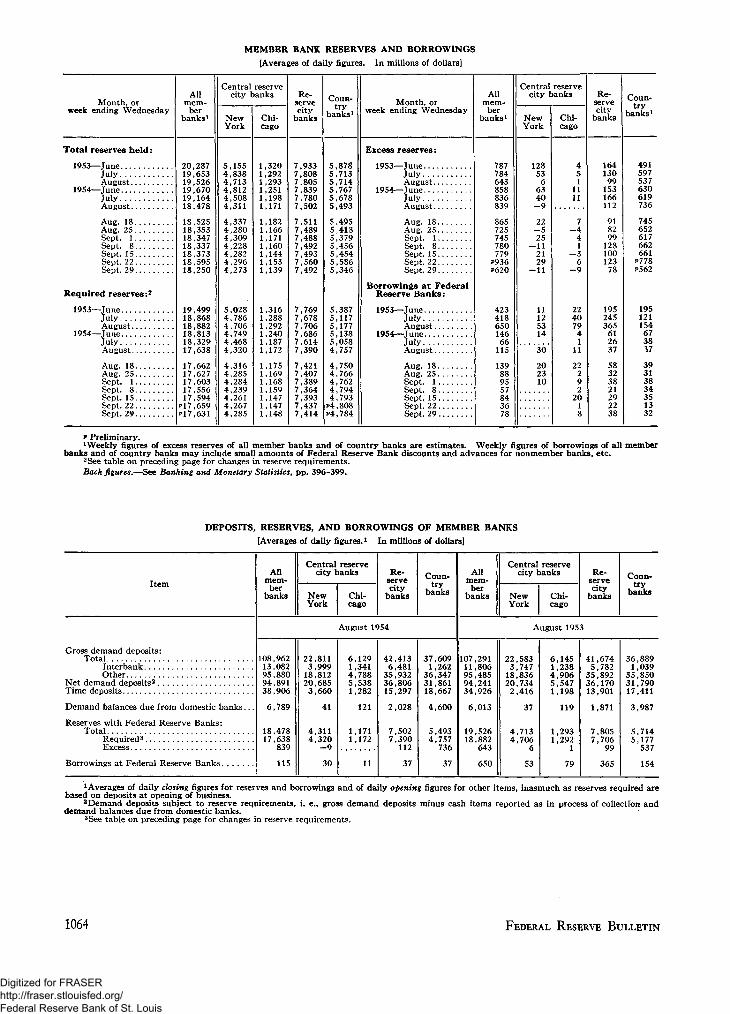
MEMBER BANK RESERVES AND BORROWINGS[Averages of daily figures. In millions of dollars]
Month, orweek ending Wednesday
Allmem-ber
banks i
20,28719,65319,52619,67019,16418,478
18,52518,35318,34718,33718,37318,59518,250
19,49918,86818,88218,81318,32917,638
17,66217,62717,60317,55617,594
P17.659P17.631
Central reservecity banks
NewYork
5.1554,8384,7134,8124,5084,311
4,3374,2804,3094,2284,2824,2964,273
5,0284,7864,7064,7494,4684,320
4,3164,2854,2844,2394,2614,2674,285
Chi-cago
1,3201,2921,2931,2511,1981,171
1,1821,1661,1711,1601,1441,1531,139
'.
1,3161,2881,2921,2401,1871,172
1,1751,1691,1681,159t ,1471,1471,148
Re-
servecitybanks
7,9337,8087,8057,8397,7807,502
7,5117,4897,4887,4927,4937,5607,492
7,7697,6787,7067,6867,6147,390
7,4217,4077,3897,3647,3937,4377,414
Coun-try
banks1
5,8785,7135,7145,7675,6785,493
5,4955,4135,3795,4565,4545,5865,346
5,3875,1175,1775,1385,0584,757
4,7504.7664,7624,7944,793
P4.808P4.784
Month, orweek ending Wednesday
Allmem-
berbanks1
787784643858836839
865725745780779
P936P620
423418650146
66115
139889557843678
Central reservecity banks
NewYork
12853
66340
—9
22—525
- 1 12129
- 1 1
11125314
30
202310
Chi-cago
451
1111
7- 4
41
- 36
- 9
224079
41
11
22292
2018
Re-servecity
banks
164130
99153166112
918299
128100123
78
195245365
612637
58323821292238
Coun-try
banks i
Total reserves held:
1953—JuneJulyAugust
1954—JuneJulyAugust
Aug. 18Aug. 25Sept. 1Sept. 8Sept. 15Sept. 22 . . . .Sept. 29
Required reserves:2
1953—JuneJulyAugust
1954—JuneJulyAugust
Aug. 18Aug. 25Sept. 1Sept. 8Sept. 15Sept. 22Sept. 29
Excess reserves:
1953—JuneJulyAugust
1954—JuneJulyAugust
Aug. 18Aug. 25Sept. 1Sept. 8Sept. 15Sept. 22Sept. 29
Borrowings at FederalReserve Banks:
1953—June...JulyAugust
1954—JuneJulyAugust
Aug. 18Aug. 25Sept. 1Sept. 8Sept. 15Sept. 22Sept. 29
491597537630619736
745652617662661
P778P562
195121154673817
39313834351332
* Preliminary.1 Weekly figures of excess reserves of all member banks and of country banks are estimates. Weekly figures of borrowings of all member
banks and of country banks may include small amounts of Federal Reserve Bank discounts and advances for nonmember banks, etc.2See table on preceding page for changes in reserve requirements.Back figures.—See Banking and Monetary Statistics, pp. 396-399.
DEPOSITS, RESERVES, AND BORROWINGS OF MEMBER BANKS[Averages of daily figures.l In millions of dollars]
ItemAll
mem-ber
banks
Central reservecity banks
NewYork
Chi-cago
Re-servecity
banks
Coun-try
banks
Allmem-ber
banks
Central reservecity banks
NewYork
Chi-cago
Re-servecity
banks
Coun-try
banks
August 1954 August 1953
Gross demand deposits:Total
InterbankOther
Net demand deposits2
Time deposits
Demand balances due from domestic banks...
Reserves with Federal Reserve Banks:Total
Required3
Excess
Borrowings at Federal Reserve Banks
10813959438
6
1817
,962,082,880,891,906
,789
,478,638839
115
22,8113,999
18,81220,6853,660
41
4,3114,320
—9
30
6,1291,3414,7885,5381,282
121
1,1711,172
11
42,4136,481
35,93236,80615,297
2,028
7,5027,390
112
37
37,6091,262
36,34731,86118,667
4,600
5,4934,757
736
37
107,29111,80695,48594,24134,926
6,013
19,52618,882
643
650
22,5833,747
18,83620,7342,416
37
4,7134,706
6
53
6,1451,2384,9065,5471,198
119
1,2931,292
1
79
41,6745,782
35,89236,17013,901
1,871
7,8057,706
99
365
36,8891,039
35,85031,79017,411
3,987
5,7145,177
537
154
1 Averages of daily closing figures for reserves and borrowings and of daily opening figures for other items, inasmuch as reserves required arebased on deposits at opening of business.
2Demand deposits subject to reserve requirements, i. e., gross demand deposits minus cash items reported as in process of collection anddemand balances due from domestic banks.
3See table on preceding page for changes in reserve requirements.
1064 FEDERAL RESERVE BULLETIN
Digitized for FRASER http://fraser.stlouisfed.org/ Federal Reserve Bank of St. Louis
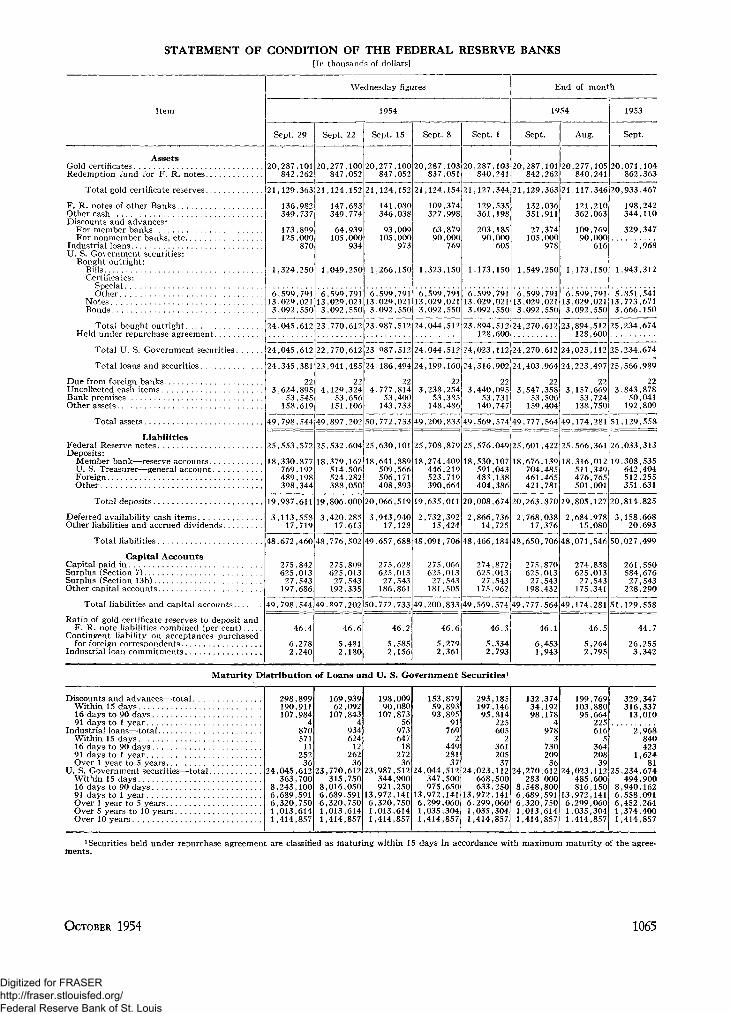
STATEMENT OF CONDITION OF THE FEDERAL RESERVE BANKS[In thousands of dollars]
Item
Wednesday figures
1954
Sept. 29 Sept. 22 Sept. 15 Sept. 8 Sept. 1
End of month
1954
Sept. Aug.
1953
Sept.
AssetsGold certificatesRedemption fund for F. R. notes
Total gold certificate reserves
F. R. notes of other BanksOther cashDiscounts and advances:
For member banksFor nonmember banks, etc
Industrial loansU. S. Government securities:
Bought outright:BillsCertificates:
SpecialOther
NotesBonds
Total bought outrightHeld under repurchase agreement.
Total U. S. Government securities.
Total loans and securities
Due from foreign banksUncoltected cash itemsBank premisesOther assets
Total assets. .
LiabilitiesFederal Reserve notesDeposits:
Member bank—reserve accountsU. S. Treasurer—general accountForeignOther
Total deposits.
Total liabilities.
20,287,101842,262
20,277,100 20847,052
,277,100847,052
3,287,103837,051
20,287,103840,241
20,287,101842,262
20,277,105840,241
20,071,104862,363
21,129,363
136,982349,737
173,899125,000
870
1,324,250
21,124,152
147,683349,774
64,939105,000
934
1,049,250
21,124,152
141,080346,038
93,009105,000
973
1,266,150
21,124,154 21,127,344 21,129,363 21,117,346 20,933,467
109,374327,998
63,87990,000
769
1,323,150
129,535361,198
203,18590,000
605
1,173,150
132,036351,911
27,374105,000
978
1,549,250
121,210362,063
109,76990,000
616
1,173,150
198,242344,110
329,347
' "2,968
1,943,312
6,599,79113,029,0213,092,550
6,599,79113,029,0213,092,550
029,0216,599,791
13,029,0213,092,550
13,599,791,029,021,092,550
6,59913,0293,092
6,599,79113,029,0213,092,550
13,851,541,773,671,666,150
24,045,612 23,770,612 23,987,512 24,044,512 23 894,512128,600
24,270,612 23,894,512128,600
25,234,674
24,045,612 22,770,612 23,987,512 24,044,512 24,023,112 24,270,612 24,023,112 25,234,674
24,345,381
223,624,895
53,545158,619
23,941,485
224,129,324
53,656151,106
24,186,494
224,777,814
53,400143,733
24,199,160 24,316,902
223,238,254
53,385148,486
22,440,09553,731140,747
24,403,964
223,547,
53,159
24,223,497
223,157,669
53,724138,750
25,566,989
22,843,87850,041192,809
49,798,544 49,897,202 50,772,733 49,200,833 49,569,574 49,777,564 49,174,281 51,129,558
25,553,572
18,330,877769,192489,198398,344
25,532,604 25,630,101 25,708,879
18,379514.524!388
162506282050
18,641,889509,566506,171408,893
18,274446523390
25,576,049
18,530,107591,043483,138404,386
25,601,422
18,676,139704,485461,465421,781
26,033,313
18,316511.476.501,
19,308,535642,404512,255351,631
Deferred availability cash itemsOther liabilities and accrued dividends
19,987,611
3,113,55817,719
19,806,000 20,066,519 19,635,011
3,42017
,943,94017,128
2,732,15,
20,008,674
2,866,73614,725
20,263,870
2,768,03817,376
19,805,127
2,68415
978080
20,814,825
,158,66820,693
48,672,460 48,776,502 49,657,688 48,091,706 48,466,184 48,650,706 48,071,546
Capital AccountsCapital paid inSurplus (Section 7)Surplus (Section 13b)Other capital accounts
Total liabilities and capital accounts
Ratio of gold certificate reserves to deposit andF. R. note liabilities combined (per cent)
Contingent liability on acceptances purchasedfor foreign correspondents
Industrial loan commitments
275,842625,01327,543
197,686
275,809625,01327,543
192,335
275,628625,013
27,543186,861
275,066625,013
27,543181,505
274,872625,013
27,543175,962
275,870625,013
27,543198,432
274,838625,013
27,543175,341
50,027,499
261,550584,67627,543
228,290
49,798,544 49,897,202 50,772,733 49,200,833 49,569,574 49,777,564 49,174,281 51,129,558
6,2782,240
5,4812,180
5,5852,156
46.6
5,2792,361
46.3
5,3342,793
6,4531,943
46.5
5,2642,795
44.7
26,2553,342
Maturity Distribution of Loans and U. S. Government Securities1
Discounts and advances—totalWithin 15 days16 days to 90 days91 days to 1 year
Industrial loans—totalWithin 15 days16 days to 90 days91 days to 1 yearOver 1 year to 5 years
U. S. Government securities—totalWithin 15 days16 days to 90 days91 days to 1 yearOver 1 year to 5 yearsOver 5 years to 10 yearsOver 10 years
298190107
24,045363
8,2436,6896,3201,0131,414
,899,911,984
487057111
25236
,612,700,100,591,750,614,857
169,93962,092107,843
493462412
26236
23,770,612315,750,016,050
6,689.5916,320,7501,013,6141,414,857
198,00990,080107,873
5697364718
27236
23,987,512344,900921,250
13,972,141320,750013,614414,857
153,87959,89393,895
917692
44928137
24,044,512347,500975,650
13,972,1416,299,060,035,304,414,857
293,185197,14695,814
2256052
36120537
24,023,112668,500633,250972,141299,060035,304414,857
132,37434,19298,178
49783
73020936
24,270,612283,000,548,800689,591320,750013,614414,857
199,769103,88095,664
2256165
36420839
24,023,112485,600816,150
13,972,1416,299,060035,304414,857
25
329,347316,33713,010
"2,968840423
1,62481
,234,674494,900,940,162,558,091,452,264,374,400,414,857
1 Securities held under repurchase agreement are classified as maturing within 15 days in accordance with maximum maturity of the agree-ments.
OCTOBER 1954 1065
Digitized for FRASER http://fraser.stlouisfed.org/ Federal Reserve Bank of St. Louis
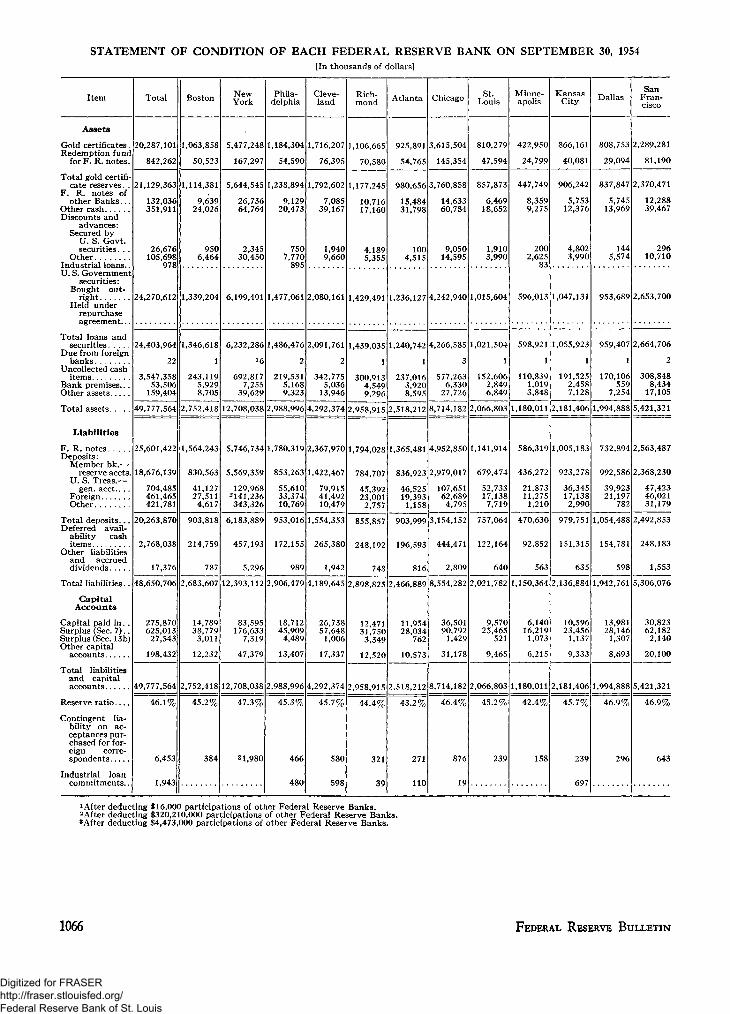
STATEMENT OF CONDITION OF EACH FEDERAL RESERVE BANK ON SEPTEMBER 30, 1954[In thousands of dollars]
Item Total Boston NewYork
Phila-delphia
Cleve-land
Rich-mond Atlanta Chicago St.
LouisMinne-apolis
KansasCity Dallas
SanFran-cisco
Assets
Gold certificates.Redemption fund
for F. R. notes.
Total gold certifi-cate reserves. .
F. R. notes ofother Banks.. .
Other cashDiscounts and
advances:Secured by
U. S. Govt.securities. . .
OtherIndustrial loans..U. S. Government
securities:Bought out-
rightHeld under
repurchaseagreement...
Total loans andsecurities
Due from foreignbanks
Uncollected cashitems
Bank premises.. .Other assets
Total assets
Liabilities
F. R. notesDeposits:
Member bk.—reserve accts.
U. S. Treas.—gen. acct.. . .
ForeignOther
Total deposits...Deferred avail-
ability cashitems
Other liabilitiesand accrueddividends
Total liabilities. .
CapitalAccounts
Capital paid in. .Surplus (Sec. 7) . .Surplus (Sec. 13b)Other capital
accounts
Total liabilitiesand capitalaccounts
20,287,101
842,262
1,063,858
50,523
5,477,248
167,297
1,184,304
54,590
1,716,207
76,395
1,106,665
70,580
925,891
54,765
3,615,504
145,354
810,279
47,594
422,950
24,799
866,161
40,081
808,753
29,094
2,289,281
81,190
21,129.363
132,036351,911
26,676105,698
978
24,270,612
1,114,381
9,63924,026
9506,464
5,644,545
26,73664,764
2,34530,450
1,339,204 6,199,491
1,238,894
9,12920,473
7507,770895
1,477,061
1,792,602
7,08539,167
1,9409,660
1,177,245
10,71617,160
4,1895,355
980.656
15,48431,798
1004,515
3,760,858
14,63360,784
9,05014,595
857,873
6,46918,652
1,9103,990
2,080,161 1,429,491 1,236,127 4,242,940 1,015,604
447,749
8,3599,275
2002,625
83
596,013
906,242
5,75312,376
4,8023,990
837,847
5,74513,969
1445,574
2,370,471
12,28839,467
29610,710
1,047,131 953,689 2,653,700
24,403,964
22
3,547,35853,506159,404
1,346,618
1
243,1195,9298,705
6,232,286
16
692,8177,255
39,629
1,486,476
2
219,5315,1689,323
2,091,761
2
342,7755,036
13,946
1,439,035
300,9134,5499,296
1,240,742 4,266,585
1
237,0163,9208,595
577,2636,330
27,726
1,021,504
1
152,6062,8496,849
598,921
1
110,8391,0193,848
1,055,923
1
191,5252,4587,128
959,407
1
170,106559
7,254
2,664,706
2
308,8488,434
17,10549,777,564 2,752,418 12,708,038 2,988,996 4,292,374 2,958,915 2,518,212 8,714,182
25,601,422
18,676,139
704,485461,465421,781
,564,243
830,563
41,12727,511
4,617
5,746,734
5,569,359
129,9682141,236343,326
1,780,319 2,367,970 1,794,028
853,263
55,61033,37410,769
1,422,467
79,91541,49210,479
784,707
45,39223,001
2,757
1,365,481
836,923
46,52519,393
1,158
4,952,850
2,979,017
107,65162,689
4,795
2,066,803
1,141,914
679,474
52,73317,1387,719
1,180,011 2,181,406 1,994,888 5,421,321
586,319
436,272
21,87311,275
1,210
1,005,183
923,278
36,34517,1382,990
732,894 2,563,487
992,586 2,368,230
39,92321,197
782
47,42346,02131,179
20,263,870
2,768,038
17,376
903,818
214,759
787
6,183,889
457,193
5,296
953,016
172,155
989
1,554,353
265,380
1,942
855,857
248,192
748
903,999 3,154,152
196,593
816
444,471
2,809
757,064
122,164
640
470,630
92,852
563
979,751
151,315
635
1,054,488 2,492,853
154,781
598
248,183
1,553
48,650,706
275,870625,013
27,543
198,432
2,683,607
14,78938,779
3,011
12,232
12,393,112
83,595176,633
7,319
47,379
2,906,479 4,189,645 2,898,825 2,466,889 8,554,282
18,71245,909
4,489
13,407
26,73857,648
1,006
17,337
12,47131,7503,349
12,520
11,95428,034
762
10,573
36,50190,792
1,429
31,178
2,021,782
9,57025,465
521
9,465
1,150,364 2,136,884
6,14016,2191,073
6,215
10,59623,456
1,137
9,333
1,942,761
13,98128,146
1,307
8,693
5,306,076
30,82362,1822,140
20,100
49,777,564 2,752,418 12,708,038 2,988,996 4,292,374 2,958,915 2,518,212 8,714,182 2,066,803 1,180,011
Reserve ratio
Contingent lia-bility on ac-ceptances pur-chased for for-eign corre-spondents
Industrial loancommitments..
46.1%
6,453
1,943
45.2%
384
47.3%
31,980
45.3%
466
480
45.7%
580
598
44.4%
321
39
43.2%
271
110
46.4%
876
19
45.2%
239
42.4%
158
2,181,406
45.7%
239
697
1,994,888 5,421,321
46.9%
296
46.9%
643
1 After deducting £16,000 participations of other Federal Reserve Banks.2After deducting $320,210,000 participations of other Federal Reserve Banks.3After deducting $4,473,000 participations of other Federal Reserve Banks.
1066 FEDERAL RESERVE BULLETIN
Digitized for FRASER http://fraser.stlouisfed.org/ Federal Reserve Bank of St. Louis
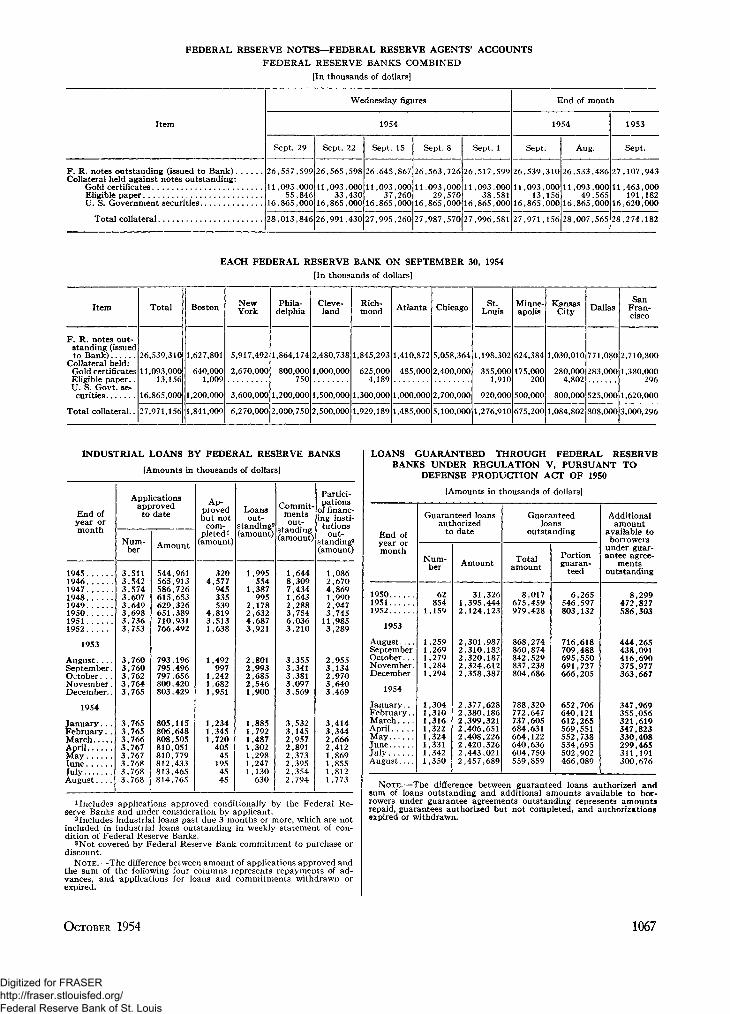
FEDERAL RESERVE NOTES—FEDERAL RESERVE AGENTS' ACCOUNTS
FEDERAL RESERVE BANKS COMBINED
[In thousands of dollars]
Item
Wednesday figures
1954
Sept. 29 Sept. 22 Sept. 15 Sept. 8 Sept. 1
End of month
1954
Sept. Aug.
1953
Sept.
27,107,943
11,463,000191,182
16,620,000
F. R. notes outstanding (issued to Bank).Collateral held against notes outstanding:
Gold certificatesEligible paperU. S. Government securities
Total collateral
26,557,599 26,565,598 26,645,867 26,563,726 26,517,599 26,539,310 26,533,486
11,093,00055,846
16,865,000 16
11,093,00033,430
,865,000
11,093,C37,260
16,865,000 16
093,00029,570
,865,000
11,093,00013,156
16,865.000
11,093,00049,565
16,865,000
28,013,846 26,991,430 27,995,260 27,987,570 27,996,581 27,971,156 28,007,565 28,274,182
EACH FEDERAL RESERVE BANK ON SEPTEMBER 30, 1954
[In thousands of dollars]
Item
F. R. notes out-standing (issuedto Bank)
Collateral held:Gold certificatesEligible paper..U. S. Govt. se-curities
Total collateral..
Total
26,539,310
11,093,00013,156
16,865,000
27,971,156
Boston
1,627,801
640,0001,009
1,200,000
1,841,009
NewYork
5,917,492
2,670,000
Phila-delphia
800,000750
3,600,000 1,200,000
6,270,000 2,000,750 2,500,000
Cleve-land
1,864,174 2,480,738
1,000,000
Rich-mond
1,845,293
625,0004,189
1,929,189
Atlanta
1,500,000 1,300,000 1,000,000 2,700,000
Chicago
1,410,872 5,058,364
485,000 2,400,000
1,485,000 5,100,000
St.Louis
1,198,302 624,384
355,0001,910
920,000 500,000
1,276,910 675,200
Minne-apolis
175,000200
KansasCity Dallas
1,030,010 771,080 2,710,800
280,000 283,000 1,380,0004,802 296
800,000 525,000 1,620,000
1,084,802 808,000 3,000,296
SanFran-cisco
INDUSTRIAL LOANS BY FEDERAL RESERVE BANKS
[Amounts in thousands of dollars]
End ofyear ormonth
19451946194719481949195019511952
1953
Augus t . . . .September.October. . .November.December..
1954
January. . .February. .MarchAprilMayTuneJulyAugus t . . . .
Applicationsapprovedto date
Num-ber
3,5113,5423,5743,6073,6493,6983,7363,753
3,7603,7603,7623,7643,765
3,7653,7653,7663,7673,7673,7683,7683,768
Amount
544,961565,913586,726615,653629,326651,389710,931766,492
793,196795,496797,656800,420803,429
805,115806,648808,505810,051810,779812,433813,465814,765
Ap-provedbut not
com-pleted1
(amount)
3204,577
945335539
4,8193,5131,638
1,492997
1,2421,6821,951
1,2341,3451,720
40545
1954545
Loansout-
standing2
(amount)
1,995554
1,387995
2,1782,6324,6873,921
2,8012,9932,6852,5461,900
1,8851,7921,4871,3021,2981,2471,130
630
Commit-mentsout-
standing(amount)
1,6448,3097,4341,6432,2883,7546,0363,210
3,3553,3413,3813,0973,569
3,5323,1452,9572,8912,3732,3952,3542,794
Partici-pations
of financ-ing insti-
tutionsout-
standing3
(amount)
1,0862,6704,8691,9902,9473,745
11,9853,289
2,9553,1342,9703,6403,469
3,4143,3442,6662,4121,8691,8551,8121,773
1 Includes applications approved conditionally by the Federal Re-serve Banks and under consideration by applicant.
2 Includes industrial loans past due 3 months or more, which are notincluded in industrial loans outstanding in weekly statement of con-dition of Federal Reserve Banks.
3Not covered by Federal Reserve Bank commitment to purchase ordiscount.
NOTE.—The difference between amount of applications approved andthe sum of the following four columns represents repayments of ad-vances, and applications for loans and commitments withdrawn orexpired.
LOANS GUARANTEED THROUGH FEDERAL RESERVEBANKS UNDER REGULATION V, PURSUANT TO
DEFENSE PRODUCTION ACT OF 1950
[Amounts in thousands of dollars]
End ofyear ormonth
195019511952
1953
AugustSeptemberOctober. . .November.December.
1954
January. . .February..M a r c h . . . .AprilMayJuneJulyAugust. . . .
Guaranteed loansauthorized
to date
Num-ber
:
62854
1,159
1,2591,2691,2791,2841,294
1,3041,3101,316L.3221,324L ,3311,3421,350
Amount
31,3261,395,4442,124,123
2,301,9872,310,1822,320,1872,324,6122,358,387
2,377,6282,380,1862,399,3212,406,6512,408,2262,420,3262,443,0212,457,689
Guaranteedloans
outstanding
Totalamount
8,017675,459979.428
868,274860,874842,529837,238804,686
788,320772,647737,605684,631664,122640,636604,750559,859
Portionguaran-
teed
6,265546,597803,132
716,618709,488695,550691,727666,205
652,706640,121612,265569,551552,738534,695502,902466,089
Additionalamount
available toborrowers
under guar-antee agree-
mentsoutstanding
8,299472,827586,303
444,265438,091416,690375,977363,667
347,969355,056321,619347,823330,408299,465311,191300,676
NOTE.—-The difference between guaranteed loans authorized andsum of loans outstanding and additional amounts available to bor-rowers under guarantee agreements outstanding represents amountsrepaid, guarantees authorized but not completed, and authorizationsexpired or withdrawn.
OCTOBER 1954 1067
Digitized for FRASER http://fraser.stlouisfed.org/ Federal Reserve Bank of St. Louis
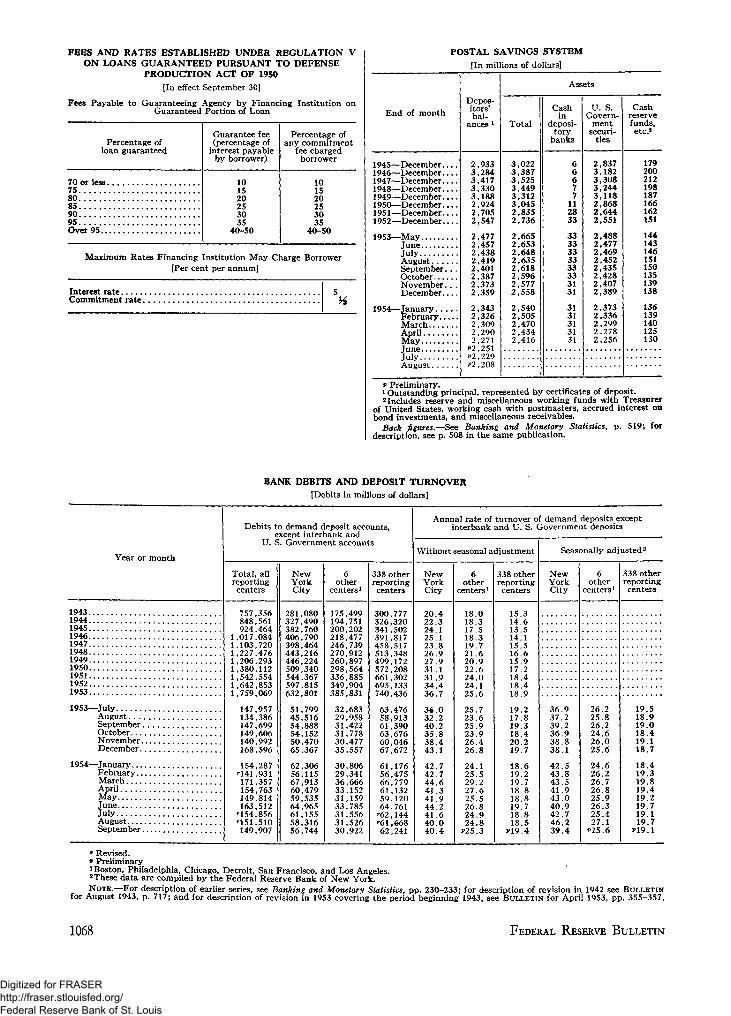
FEES AND RATES ESTABLISHED UNDER REGULATION VON LOANS GUARANTEED PURSUANT TO DEFENSE
PRODUCTION ACT OF 1950[In effect September 30]
Fees Payable to Guaranteeing Agency by Financing Institution onGuaranteed Portion of Loan
Percentage ofloan guaranteed
70 or less7580859095Over 95
Guarantee fee(percentage of
interest payableby borrower)
101520253035
40-50
Percentage ofany commitment
fee chargedborrower
101520253035
40-50
Maximum Rates Financing Institution May Charge Borrower[Per cent per annum]
Interest rateCommitment rate.
POSTAL SAVINGS SYSTEM[In millions of dollars]
End of month
1945—December..1946—December..1947—December..1948—December..1949—December..1950—December..1951—December..1952—December..
1953—MayJ u n e . . . . . . .JulyA u g u s t . . . .September.OctoberNovember.December..
1954—January...February..,MarchAprilMay
TulvAugust
Depos-itors'bal-
ances l
2,9333,2843,4173,3303,1882,9242,7052,547
2,4772,4572,4382,4192,4012,3872,3732,359
2,3432,3262,3092,2902,271
J>2,251
P2.2O8
Assets
Total
3,0223,3873,5253,4493,3123,0452,8352,736
2,6652,6532,6482,6352,6182,5962,5772,558
2,5402,5052,4702,4342,416
Cashin
deposi-tory
banks
66677
112833
3333333333333131
3131313131
U. S.Govern-
mentsecuri-
ties
2,8373,1823,3083,2443,1182,8682,6442,551
2,4882,4772,4692,4522,4352,4282,4072,389
2,3732,3362,2992,2782,256
Cashreservefunds,
etc.'
179200212198187166162151
144143146151150135139138
136139140125130
p Preliminary.1 Outstanding principal, represented by certificates of deposit.2 Includes reserve and miscellaneous working funds with Treasurer
of United States, working cash with postmasters, accrued interest onbond investments, and miscellaneous receivables.
Back figures.—See Banking and Monetary Statistics, p. 519; fordescription, see p. 508 in the same publication.
BANK DEBITS AND DEPOSIT TURNOVER[Debits in millions of dollars]
Year or month
1943194419451946,1947194819491950195119521953
1953—JulyAugustSeptember. . . .OctoberNovemberDecember
1954—JanuaryFebruaryMarchAprilMayJuneJulyAugustSeptember
Debits to demand deposit accounts,except interbank and
U. S. Government accounts
Total, allreportingcenters
757,356848,561924,464
1,017,0841,103,7201,227,4761,206,2931,380,1121,542,5541,642,8531,759,069
147,957134,386147,699149,606140,992168,596
154,287'141,931171,357154,763149,814163,512
'154,856'151,510149,907
NewYorkCity
281,080327,490382,760406,790398,464443,216446,224509,340544,367597,815632,801
51,79945,51654,88854,15250,47065,367
62,30656,11567,91360,47959,53564,96561,15558,31656,744
6other
centers1
175,499194,751200,202218,477246,739270,912260,897298,564336,885349,904385,831
32,68329,95831,42231,77830,47735,557
30,80629,34136,66633,15231,15933,78531,55631,52630,922
338 otherreportingcenters
300,777326,320341,502391,817458,517513,348499,172572,208661,302695,133740,436
63,47658,91361,39063,67660,04667,672
61,17656,47566,77961,13259,12064,761
'62,144'61,66862,241
Annual rate of turnover of demand deposits exceptinterbank and U. S. Government deposits
Without seasonal adjustment
NewYorkCity
20.422.324.125.123.826.927.931.131.934.436.7
36.032.240.235.838.443.1
42.742.744.641.341.944.241.640.040.4
6other
centers1
18.018.317.518.319.721.620.922.624.024.125.6
25.723.625.923.926.426.8
24.125.529.227.625.526.824.924.8
P25.3
338 otherreportingcenters
15.314.613.514.115.516.615.917.218.418.418.9
19.217.819.318.420.219.7
18.619.219.718.818.819.718.818.5
P19.4
Seasonally adjusted2
NewYorkCity
36.937.239.236.938.838.1
42.543.843.541.943.040.942.746.239.4
6other
centers1
26.225.826.224.626.025.6
24.626.226.726.825.926.325.427.1
P25.6
338 otherreportingcenters
19.518.919.018.419.118.7
18.419.319.819.419.219.719.119.7
P19.1
«• Revised.P Preliminaryi Boston, Philadelphia, Chicago, Detroit, San Francisco, and Los Angeles.2These data are compiled by the Federal Reserve Bank of New York.NOTE.—For description of ear l ier----- --- "---1*-- --•-» " °- ••for August 1943,
are compnea Dy tne federal Reserve Bank ot New York.description of earlier series, see Banking and Monetary Statistics, pp. 230-233; for description of revision in 1942 see BULLETINp. 717; and for description of revision in 1953 covering the period beginning 1943, see BULLETIN for April 1953, pp. 355-357.
1068 FEDERAL RESERVE BULLETIN
Digitized for FRASER http://fraser.stlouisfed.org/ Federal Reserve Bank of St. Louis
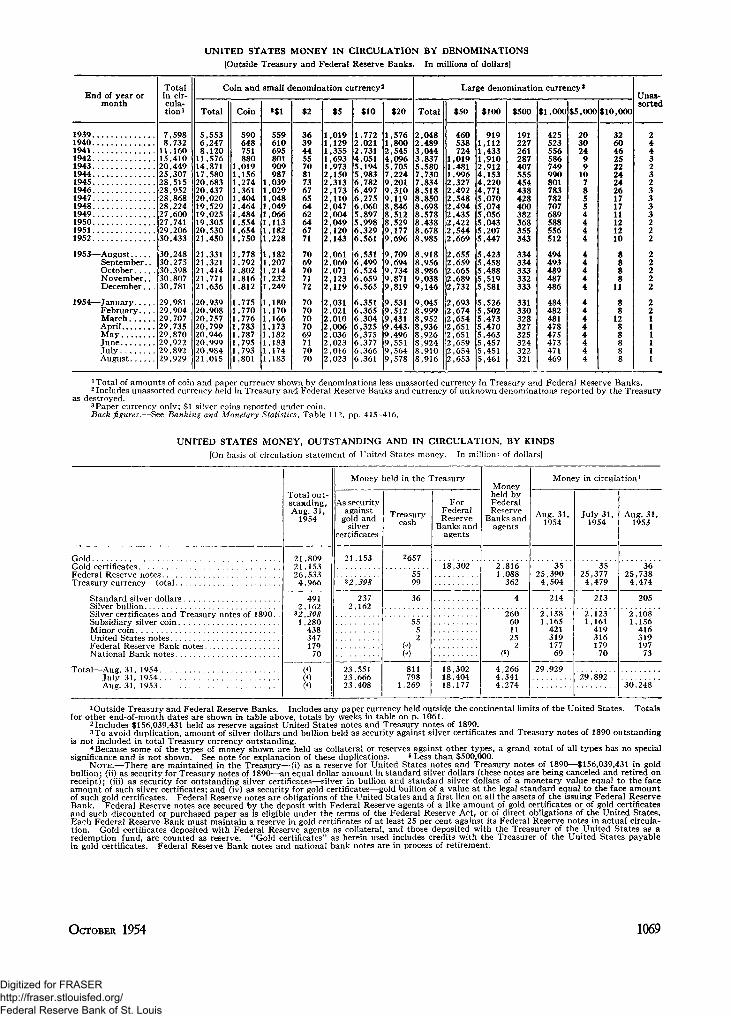
UNITED STATES MONEY IN CIRCULATION BY DENOMINATIONS[Outside Treasury and Federal Reserve Banks. In millions of dollars]
End of year ormonth
Totalin cir-cula-tion1
Coin and small denomination currency2
Total Coin *$1 $5 $10 $20
Large denomination currency3
Total $50 $100 $500 $1,000 $5,000 $10,000
Unas-sorted
19391940194119421943194419451946194719481949195019511952
1953—AugustSeptemberOctober. . ,NovemberDecember.
1954—January.. ,February..MarchAprilMayJuneJulyAugust....
7,5988,73211,16015,41020,44925,30728,51528,95228,86828,22427,60027,74129,20630,433
30,24830,27530,39830,80730,781
29,98129,90429,70729,73529,87029,92229,89229,929
5,5536,2478,12011,57614,87117,58020,68320,43720,02019,52919,02519,30520,53021,450
21,33121,32121,41421,77121,636
20,93920,90820,75720,79920,94620,99920,98421,015
590648751880
1,0191,1561,2741,3611,4041,4641,4841,5541,6541,750
1,7781,7921,8021,8161,812
1,7751,7701,7761,7831,7871,7951,7931,801
559610695801909987
1,0391,029,048,049,066,113,182,228
,182,207,214,232,249
,180,170,166,173
1,1821,1831,1741,183
3639445570817367656462646771
7069707172
7070707069717070
,019,129,355,693,973
2,1502,313,173
2,1102,0472,004,049,120
2,143
2,0612,0602,0712,1232,119
2,0312,0212,0102,0062,0362,0232,0162,023
1,7722,0212,7314,0515,1945,9836,7826,4976,2756,0605,8975,9986,3296,561
6,5316,4996,5246,6596,565
6,3516,3656.3046,3256,3756,3776,3666,361
1,5761,8002,5454,0965,7057,2249,2019,3109,1198,8468,5128,5299,1779,696
9,7099,6949,7349,8719,819
9,5319,5129,4319,4439,4969,5519,5649,578
2,0482,4893,044
837580730
7,8348,5188,8508,6988,5788,4388,6788,985
8,9188,9568,9869,0389,146
9,0458,9998,9528,9368,9268,9248,9108,916
460538724
1,0191,4811,9962,3272,4922,5482,4942,4352,4222,5442,669
2,6552,6592,6652,6892,732
2,6932,6742,6542,6512,6512,6592,6542,653
9191,1121,4331,9102,9124,1534,2204,7715,0705,0745,0565,0435,2075,447
5,4235,4585,4885,5195,581
5265,5025,4735,4705,4635,4575,4515,461
191227261287407555454438428400382368355343
334334333332333
331330328327325324322321
425523556586749990801783782707689588556512
494493489487486
484482481478475473471469
203024991078554444
44444
4444444
3260462522242426171711121210
888811
8812888
1 Total of amounts of coin and paper currency shown by denominations less unassorted currency in Treasury and Federal Reserve Banks.2 Includes unassorted currency held in Treasury and Federal Reserve Banks and currency of unknown denominations reported by the Treasury
as destroyed.3Paper currency only; $1 silver coins reported under coin.Back figures.—See Banking and Monetary Statistics, Table 112, pp. 415-416.
UNITED STATES MONEY, OUTSTANDING AND IN CIRCULATION, BY KINDS[On basis of circulation statement of United States money. In millions of dollars]
GoldGold certificatesFederal Reserve notesTreasury currency—total
Standard silver dollarsSilver bullionSilver certificates and Treasury notes of 1890. .Subsidiary silver coinMinor coinUnited States notesFederal Reserve Bank notesNational Bank notes
Total—Aug. 31, 1954July 31, 1954Aug. 31, 1953
Total out-standing,Aug. 31,
1954
21,80921,15326,5334,966
4912,162
*2,3981,280
438347179
70
(4)(4)(4)
Money held in the Treasury
As securityagainst
gold andsilver
certificates
21,153
' "s'2,398' '
2372,162
23,55123,66623,408
Treasurycash
2657
5599
36
5 5 "52
(5)(5)
811798
1,269
ForFederalReserve
Banks andagents
18,302
18,30218,40418,177
Moneyheld byFederalReserve
Banks andagents
2,8161,088
362
4
2606011252
(5)
4,2664,3414,274
Money in circulation1
Aug. 31,1954
3525,3904,504
214
2,1381,165
42131917769
29,929
July 31,1954
3525,3774,479
213
2,1231,161
41931617970
29,892
Aug. 31,1953
3625,7384,474
205
2,1081,156
41631919773
30,248
1 Outside Treasury and Federal Reserve Banks. Includes any paper currency held outside the continental limits of the United States. Totalsfor other end-of-month dates are shown in table above, totals by weeks in table on p. 1061.
2 Includes $156,039,431 held as reserve against United States notes and Treasury notes of 1890.3To avoid duplication, amount of silver dollars and bullion held as security against silver certificates and Treasury notes of 1890 outstanding
is not included in total Treasury currency outstanding.
bullion; (ii) as security for Treasury notes of 1890—an equal dollar amount in standard silver dollars (these notes are being canceled and retired onreceipt); (iii) as security for outstanding silver certificates—silver in bullion and standard silver dollars of a monetary value equal to the faceamount of such silver certificates; and (iv) as security for gold certificates—gold bullion of a value at the legal standard equal to the face amountof such gold certificates. Federal Reserve notes are obligations of the United States and a first lien on all the assets of the issuing Federal ReserveBank. Federal Reserve notes are secured by the deposit with Federal Reserve agents of a like amount of gold certificates or of gold certificatesand such discounted or purchased paper as is eligible under the terms of the Federal Reserve Act, or of direct obligations of the United States.Each Federal Reserve Bank must maintain a reserve in gold certificates of at least 25 per cent against its Federal Reserve notes in actual circula-tion. Gold certificates deposited with Federal Reserve agents as collateral, and those deposited with the Treasurer of the United States as aredemption fund, are counted as reserve. "Gold certificates" as herein used includes credits with the Treasurer of the United States payablein gold certificates. Federal Reserve Bank notes and national bank notes are in process of retirement.
OCTOBER 1954 1069
Digitized for FRASER http://fraser.stlouisfed.org/ Federal Reserve Bank of St. Louis
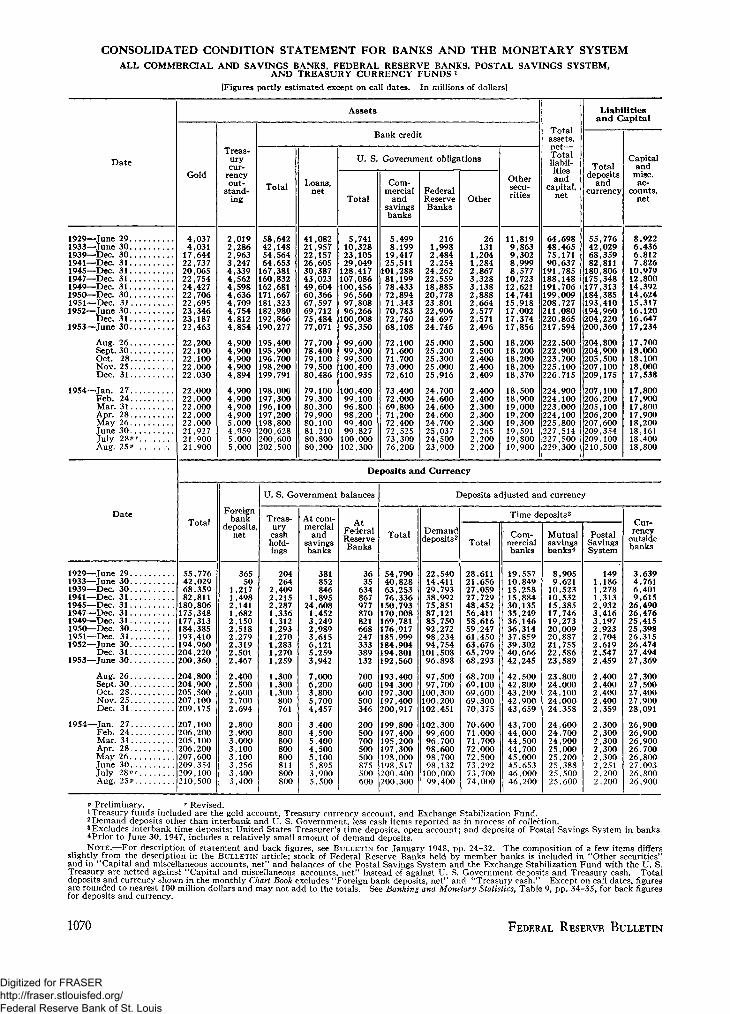
CONSOLIDATED CONDITION STATEMENT FOR BANKS AND THE MONETARY SYSTEMALL COMMERCIAL AND SAVINGS BANKS, FEDERAL RESERVE BANKS. POSTAL SAVINGS SYSTEM,
AND TREASURY CURRENCY FUNDS 1
[Figures partly estimated except on call dates. In millions of dollars]
Date
Assets
Gold
Treas-urycur-
rencyout-
stand-ing
Bank credit
Total Loans,net
U. S. Government obligations
Total
Com-mercial
andsavingsbanks
FederalReserveBanks
Other
Othersecu-rities
Totalassets,net—Totalliabil-itiesand
capital,net
Liabilitiesand Capital
Totaldeposits
andcurrency
Capitaland
misc.ac-
counts,net
1929—June 291933—June 301939—Dec. 301941—Dec. 311945—Dec. 311947—Dec. 311949—Dec. 311950—Dec. 301951—Dec. 311952—June 30
Dec. 311953—June 30
Aug. 26Sept. 30Oct. 28Nov. 25Dec. 31
1954—Jan. 27Feb. 24Mar. 31Apr. 28May 26June 30July 28Pf
Aug. 25P
4,0374,031
17,64422,73720,06522,75424,42722,70622,69523,34623,18722,463
22,20022,10022,10022,00022,030
22,00022,00022,00022,00022,00021,92721.90021,900
2,0192,2862,9633,2474,3394,5624,5984,6364,7094,7544,8124,854
4,9004,9004,9004,9004,894
4,9004,9004,9004,9005,0004,9595,0005,000
58,64242,14854,56464,653167,381160,832162,681171,667181,323182,980192,866190,277
195,400195,900196,700198,200199,791
198,00C197,300196,100197,200198,800200,628200,600202,500
41,08221,95722,15726,60530,38743,02349,60460,36667,59769,71275,48477,071
77,70078,40079,10079,50080,486
79,10079,30080,30079,90080,10081,21080,80080,200
5,74110,32823,10529,049128,417107,086100,45696,56097,80896,266100,00895,350
99,60099,30099,500100,400100,935
100,40099,10096,80098,20099,40099,827100,000102,300
5,4998,19919,41725,511101,28881,19978,43372,89471,34370,78372,74068,108
72,10071,60071,70073,00072,610
73,40072,00069,80071,20072,40072,52573,30076,200
2161,9982,4842,254
24,26222,55918,88520,77823,80122,90624,69724,746
25,00025,20025,30025,00025,916
24,70024,60024,60024,60024,70025,03724,50023,900
26131
1,2041,2842,8673,3283,1382,8882,6642,5772,5712,496
2,5002,5002,4002,4002,409
2,4002,4002,3002,3002,3002,2652,2002,200
11,8199,8639,3028,9998,57710,72312,62114,74115,91817,00217,37417,856
18,20018,20018,20018,20018,370
18,50018,90019,00019,20019,30019,59119,80019,900
64,69848,46575,17190,637191,785188,148191,706199,009208,727211,080220,865217,594
222,500222,900223,700225,100226,715
224,900224,100223,000224,100225,800227,514227,500229,300
55,77642,02968,35982,811180,806175,348177,313184,385193,410194,960204,220200,360
204,800204,900205,500207,100209,175
207,100206,200205,100206,200207,600209,354209,100210,500
8,9226,4366,8127,826
10,97912,80014,39214,62415,31716,12016,64717,234
17,70018,00018,10018,00017,538
17,80017,90017,80017,90018,20018,16118,40018,800
Date
Deposits and Currency
TotalForeign
bankdeposits,
net
U. S. Government balances
Treas-urycashhold-ings
At com-mercial
andsavingsbanks
AtFederalReserveBanks
Deposits adjusted and currency
Total Demanddeposits2
Time deposits3
TotalCom-
mercialbanks
Mutualsavingsbanks*
PostalSavingsSystem
Cur-rencyoutsidebanks
1929—June 29...1933—June 30...1939—Dec. 30...1941—Dec. 31. ..1945—Dec. 31...1947—Dec. 31...1949—Dec. 31...1950—Dec. 30. ..1951—Dec. 31...1952—June 30. ..
Dec. 31...1953—June 30...
Aug. 26...Sept. 30. ..Oct. 28...Nov. 25...Dec. 31...
1954—Jan. 27...Feb. 24. ..Mar. 31...Apr. 28...M a y 26...June 30...July 2%pr.Aug. 25P. .
55,77642,02968,35982,811180,806175,348177,313184,385193,410194,960204,220200,360
204,800204,900205,500207,100209,175
207,100206,200205,100206,200207,600209,354209,100210,500
36550
1,217498
2,1411,6822,1502,5182,2792,3192,5012,467
2,4002,5002,6002,7002,694
2,8002,9003,0003,1003,1003,2563,4003,400
204264
2,4092,2152,287,336,312,293,270,283,270,259
,300,300,300800761
800800800800800811800800
381852846
1,89524,6081,4523,2492,9893,6156,1215,2593,942
7,0006,2003,8005,7004,457
3,4004,5005,4004,5005,1005,8953,9005,500
3635
634867977870821668247333389132
700600600500346
200500700500500875500600
54,79040,82863,25376,336
150,793170,008169,781176,917185,999184,904194,801192,560
193,400194.300197,300197,400200,917
199,800197,400195,200197,300198,000198,517200,400200,300
22,54014,41129,79338,99275,85187,12185,75092,27298,23494,754101,50896,898
97,50097,700100,300100,200102,451
102,30099,60096,70098,60098,70098,132100,00099,400
28,61121,65627,05927,72948,45256,41158,61659,24761,45063,67665,79968,293
68,70069,10069,60069,30070,375
70,60071,00071,70072,00072,50073,29273,70074,000
19,55710,84915,25815,88430,13535,24936,14636,31437,85939,30240,66642,245
42,50042,80043,20042,90043,659
43,70044,00044,50044,70045,00045,65346,00046,200
8,9059,62110,52310,53215,38517,74619,27320,00920,88721,75522,58623,589
23,80024,00024,10024,00024,358
24,60024,70024,90025,00025,20025,38825,50025,600
1491,1861,2781,3132,9323,4163,1972,9232,7042,6192,5472,459
2,4002,4002,4002,4002,359
2.3002,3002,3002,3002,3002,2512,2002,200
3,6394,7616,4019,615
26,49026,47625,41525,39826,31526,47427,49427,369
27,30027,50027,40027,90028,091
26,90026,90026,90026.70026,80027,09326,80026,900
P Preliminary. r Revised.1 Treasury funds included are the gold account, Treasury currency account, and Exchange Stabilization Fund.2Demand deposits other than interbank and U. S. Government, less cash items reported as in process of collection.3Excludes interbank time deposits; United States Treasurer's time deposits, open account; and deposits of Postal Savings System in banks.4Prior to June 30, 1947, includes a relatively small amount of demand deposits.NOTE.—For description of statement and back figures, see BULLETIN for January 1948, pp. 24-32. The composition of a few items differs
slightly from the description in the BULLETIN article; stock of Federal Reserve Banks held by member banks is included in "Other securities"and in "Capital and miscellaneous accounts, net" and balances of the Postal Savings System and the Exchange Stabilization Fund with the U. S.Treasury are netted against "Capital and miscellaneous accounts, net" instead of against U. S. Government deposits and Treasury cash. Totaldeposits and currency shown in the monthly Chart Book excludes "Foreign bank deposits, net" and "Treasury cash." Except on call dates, figuresare rounded to nearest 100 million dollars and may not add to the totals. See Banking and Monetary Statistics, Table 9, pp. 34-35, for back figuresfor deposits and currency.
1070 FEDERAL RESERVE BULLETIN
Digitized for FRASER http://fraser.stlouisfed.org/ Federal Reserve Bank of St. Louis
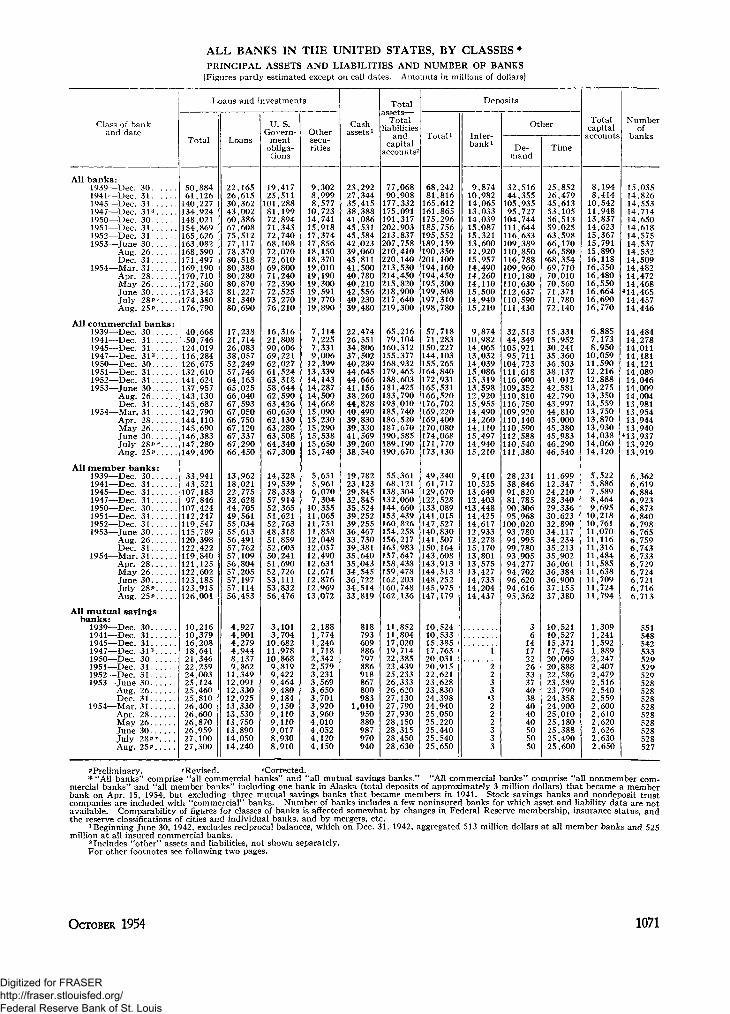
ALL BANKS IN THE UNITED STATES, BY CLASSES *PRINCIPAL ASSETS AND LIABILITIES AND NUMBER OF BANKS
[Figures partly estimated except on call dates. Amounts in millions of dollars]
Class of bankand date
All banks :1939—Dec. 301941—Dec. 311945—Dec. 311947—Dec. 3131950—Dec. 301951—Dec. 311952—Dec. 311953—June 30
Aug. 26Dec. 31
1954—Mar. 31Apr. 28May 26June 30July 28*"-Aug. 25P
All commercial banks:1939—Dec. 301941—Dec. 31.1945—Dec. 311947—Dec. 3131950—Dec. 301951—Dec. 311952—Dec. 311953—June 30
Aug. 26 . .Dec. 31
1954—Mar. 31Apr. 28May 26June 30J u l y 28pr....Aug. 25P
All member banks:1939—Dec. 301941—Dec. 311945—Dec. 311947—Dec. 311950—Dec. 301951—Dec. 311952—Dec. 311953—June 30
Aug. 26Dec. 31
1954—Mar. 31Apr. 28May 26June 30July 28PAug. 25P
All mutual savings
1939—Dec. 301941—Dec 311945—Dec. 311947—Dec. 31 3
1950—Dec. 301951—Dec. 31. . . . . .1952—Dec. 311953—June 30
Aug. 26Dec. 31
1954—Mar. 31Apr. 28May 26June 30July 28prAug. 25P
Loans and investments
Total
50,88461,126
140,227134,924148,021154,869165,626163,082168,590171,497169,190170,710172,560173,343174,380176,790
40,66850,746
124,019116,284126,675132,610141,624137,957143,130145,687142,790144,110145,690146,383147,280149,490
33,94143,521
107,18397,846
107,424112,247119,547115,789120,398122,422119,840121,125122,602123,185123,915126,001
10,21610,37916,20818,64121,34622^25924,00325,12425,46025,81026,40026,60026,87026,95927,10027,300
Loans
22,16526,61530,36243,00260,38667,60875,51277,11778,37080,51880,38080,28080,87081,22781,34080,690
17,23821,71426,08338,05752,24957,74664,16365,02566,04067,59367,05066,75067,12067,33767,29066,450
13,96218,02122,77532,62844,70549,56155,03455,61356,49157,76257,10956,80457,20557,19757,11456,453
4,9274,9014,2794,9448 1379,862
11,34912,09112,33012,92513,33013,53013,75013,89014,05014,240
U. S.Govern-
mentobliga-tions
19,41725,511
101,28881,19972,89471,34372,74068,10872,07072,61069,80071,24072,39072,52573,27076,210
16,31621,80890,60669,22162,02761,52463,31858,64462,59063,42660,65062,13063,28063,50864,34067,300
14,32819,53978,33857,91452,36551,62152,76348,31851,85952,60350,24151,69052,72653,11153,83256,476
3,1013,704
10,68211,97810 8689,8199,4229,4649,4809,1849,1509,1109,1109,0178,9308,910
Othersecu-rities
9,3028,9998,577
10,72314,74115,91817,37417,85618,15018,37019,01019,19019,30019,59119,77019,890
7,1147,2257,3319,006
12,39913,33914,14314,28714,50014,66815,09015,23015,29015,53815,65015,740
5,6515,9616,0707,304
10,35511,06511,75111,85812,04812,05712,49012,63112,67112,87612,96913,072
2,1881,7741,2461,7182 3422,5793,2313,5693,6503,7013,9203,9604,0104,0524,1204,150
Cashassetsl
23,29227,34435,41538,38841,08645,53145,58442,02339,06045,81141,50040,78040,21042,55640,23039,480
22,47426,55134,80637,50240,28944,64544,66641,15638,26044,82840,49039,83039,33041,56939,26038,540
19,78223,12329,84532,84535,52439,25239,25536,46733,73039,38135,64035,04334,54536,72234,51433,819
818793609886797886918867800983
1,010950880987970940
Totalassets—
Totalliabilities
andcapital
accounts2
77,06890,908
177,332175,091191,317202,903213,837207,758210,410220,140213,530214,450215,820218,900217,640219,300
65,21679,104
160,312155,377168,932179,465188,603181,425183,790193,010185,740186,520187,670190,585189,190190,670
55,36168,121
138,304132,060144,660153,439160,826154,258156,217163,983157,647158,438159,478162,203160,748162,136
11,85211,80417,02019,71422 38523,43925,23326,33326,62027,13027,79027,93028,15028,31528,45028,630
Deposits
Total i
68,24281,816
165,612161,865175,296185,756195,552189,159190,350201,100194,160194,450195,300199,508197,310198,780
57,71871,283
150,227144,103155,265164,840172,931165,531166,520176,702169,220169,400170,080174,068171,770173,130
49,34061,717
129,670122,528133,089141,015147,527140,830141,507150,164143,608143,913144,513148,252145,975147,179
10,52410,53315,38517,76320 03120,91522,62123,62823,83024,39824,94025,05025,22025,44025,54025,650
Inter-bank i
9,87410,98214,06513,03314,03915,08715,32113,60012,92015,95714,49014,26014,11015,50014,94015,210
9,87410,98214,06513,03214,03915,08615,31913,59812,92015,95514,49014,26014,11015,49714,94015,210
9,41010,52513,64012,403
«13,44814,42514,61712,93312,27815,17013,80113,57513,42714,73314,20414,437
1
2233
*3222333
Other
De-mand
32,51644,355
105,93595,727
104,744111,644116,633109,389110,850116,788109,960110,180110,630112,637110,590111,430
32,51344,349
105,92195,711
104,723111,618116,600109,352110,810116,750109,920110,140110,590112,588110,540111,380
28,23138,84691,82081,78590,30695,968
100,02093,78094,99599,78093,90594,27794,70296,62094,61695,362
36
1417222633374038404040505050
Time
25,85226,47945,61353,10556,51359,02563,59866,17066,580
"68,35469,71070,01070,56071,37171,78072,140
15,33115,95230,24135,36036,50338,13741,01242,58142,79043,99744,81045,00045,38045,98346,29046,540
11,69912,34724,21028,34029,33630,62332,89034,11734,23435,21335,90236,06136,38436,90037,15537,380
10,52110 52715,37117,74520,00920,88822,58623,58923,79024,35824,90025,01025,18025,38825,49025,600
Totalcapital
accounts
8,1948,414
10,54211,94813,83714,62315,36715,79115,89016,11816,35016,48016,55016,66416,69016,770
6,8857,1738,950
10,05911,59012,21612,88813,27513,35013,55913,75013,87013,93014,03814,06014,120
5,5225,8867,5898,4649,695
10,21810,76111,07011,11611,31611,48411,58511,63811,70911,72411,794
1,3091,2411,5921,8892 2472,4072,4792,5162,5402,5592,6002,6102,6202,6262,6302,650
Numberof
banks
15,03514,82614,55314,71414,65014,61814,57514,53714,53214,50914,48214,47214,468
414,46514,45714,446
14,48414,27814,01114,18114,12114,08914,04614,00914,00413,98113,95413,94413,940
413,93713,92913,919
6,3626,6196,8846,9236,8736,8406,7986,7656,7596,7436,7336,7296,7246,7216,7166,713
551548542533529529529528528528528528528528528527
*> Preliminary. r Revised. "Corrected.* "All banks" comprise "all commercial banks" and "all mutual savings banks." "All commercial banks" comprise "all nonmember com-
mercial banks" and "all member banks" including one bank in Alaska (total deposits of approximately 3 million dollars) that became a memberbank on Apr. 15, 1954, but excluding three mutual savings banks that became members in 1941. Stock savings banks and nondeposit trustcompanies are included with "commercial" banks. Number of banks includes a few noninsured banks for which asset and liability data are notavailable. Comparability of figures for classes of banks is affected somewhat by changes in Federal Reserve membership, insurance status, andthe reserve classifications of cities and individual banks, and by mergers, etc.
1 Beginning June 30, 1942, excludes reciprocal balances, which on Dec. 31, 1942, aggregated 513 million dollars at all member banks and 525million at all insured commercial banks.
2 Includes "other" assets and liabilities, not shown separately.For other footnotes see following two pages.
OCTOBER 1954 1071
Digitized for FRASER http://fraser.stlouisfed.org/ Federal Reserve Bank of St. Louis
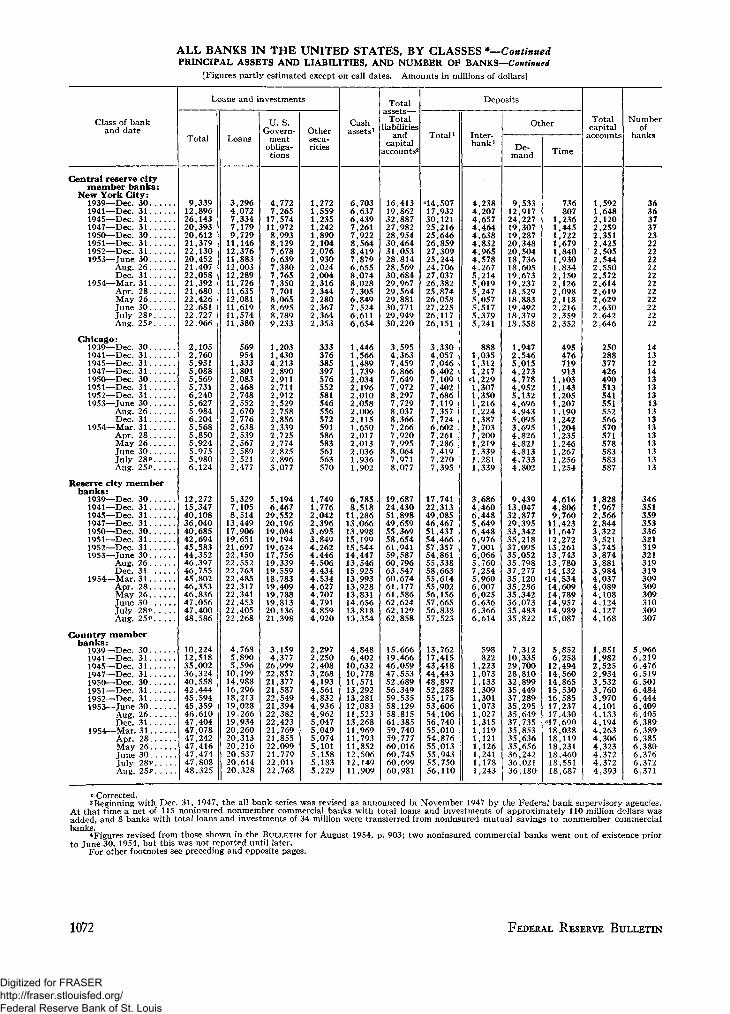
ALL BANKS IN THE UNITED STATES, BY CLASSES *—ContinuedPRINCIPAL ASSETS AND LIABILITIES, AND NUMBER OF BANKS—Continued
[Figures partly estimated except on call dates. Amounts in millions of dollars]
Class of bankand date
Loans and investments
Total Loans
U. S.Govern-
mentobliga-tions
Othersecu-rities
Cashassets1
Totalassets—
Totalliabilities
andcapital
accounts5
Deposits
Total i Inter-bank i
Other
De-mand Time
Totalcapital
accounts
Numberof
banks
Central reserve citymember banks:
New York City:1939—Dec. 301941—Dec. 311945—Dec. 311947—Dec. 311950—Dec. 301951—Dec. 311952—Dec. 311953—June 30
Aug. 26Dec. 31
1954—Mar. 31Apr. 28May 26June 30July 28PAug. 25P
Chicago:1939—Dec. 301941—Dec. 311945—Dec. 311947—Dec. 311950—Dec. 301951—Dec. 311952—Dec. 311953—June 30
Aug. 26Dec. 31
1954—Mar. 31Apr. 28May 26June 30July 28PAug. 25P
Reserve city memberbanks:
1939—Dec. 301941—Dec. 311945—Dec. 311947—Dec. 311950—Dec. 301951—Dec. 311952—Dec. 311953—June 30
Aug. 26Dec. 31
1954—Mar. 31Apr. 28May 26June 30July 28?Aug. 25?
Country memberbanks:
1939—Dec. 301941—Dec. 311945—Dec. 311947—Dec. 311950—Dec. 301951—Dec. 311952—Dec. 311953—June 30
Aug. 26Dec. 31
1954—Mar. 31Apr. 28May 26June 30July 28PAug. 25P
9,33912,89626,14320,39320,61221,37922,13020,45221,40722,05821,39221,68022,42622,68122,72722,966
2,1052,7605,9315,0885,5695,7316,2405,6275,9846,2045,5685,8505,9245,9755,9806,124
272,347108I040,685,694,583,352,397,755,802,353,836,056,400,586
10,22412,51835,00236,32440,55842,44445,59445,35946,61047,40447,07847,24247,41647,47447,80848,325
3,2964,0727,3347,1799,72911,14612,37611,88312,00312,28911,72611,63512,08111,61911,57411,380
569954
1,3331,8012,0832,4682,7482,5522,6702,7762,6382,5392,5672,5892,5212,477
5,3297,1058,514
13,44917,90619,65121,69722,15022,55222,76322,48522,31722,34122,45322,40522,268
4,7685,8905,596
10,19914,98816,29618,21319,02819,26619,93420,26020,31320,21620,53720,61420,328
4,7727,265
17,57411,9728,9938,1297,6786,6397,3807,7657,3507,7018,0658,6958,7899,233
1,2031,4304,2132,8902,9112,7112,9122,5292,7582,8562,3392,7252,7742,8252,8963,077
5,1946,46729,55220,19619,08419,19419,62417,75619,33919,55918,78319,40919,78819,81320,13621,398
3,1594,37726,99922,85721,37721,58722,54921,39422,38222,42321,76921,85522,09921,77922,01122,768
1,2721,5591,2351,2421,8902,1042,0761,9302,0242,0042,3162,3442,2802,3672,3642,353
333376385397576552581546556572591586583561563570
1,7491,7762,0422,3963,6953,8494,2624,4464,5064,4344,5344,6274,7074,7914,8594,920
2,2972,2502,4083,2684,1934,5614,8324,9364,9625,0475,0495,0745,1015,1585,1835,229
6,7036,6376,4397,2617,9228,5648,4197,8796,6558,0748,0287,3056,8497,5246,6116,654
1,4461,5661,4891,7392,0342,1962,0102,0582,0062,1151,6502,0172,0132,0361,9361,902
6,7858,51811,28613,06613,99815,19915,54414,44713,54615,92513,99313,92813,83114,65613,81813,354
4,8486,40210,63210,77811,57113,29213,28112,08311,52313,26811,96911,79311,85212,50612,14911,909
16,41319,86232,88727,98228,95430,46431,05328.81428,56930,68429,96729,56429,88130,77129,94930,220
3,5954,3637,4596,8667,6497,9728,2977,7298,0378,3667,2667,9207,9958,0647,9718,077
19,68724,43051,89849,65955,36958,65461,94159,58760,79663,54760,67461,17761,58662,62462,12962,858
15,66619,46646,05947,55352,68956,34959,53558,12958,81561,38559,74059,77760,01660,74560,69960,981
=14,50717,93230,12125,21625,64626,85927,30925,24424,70627,03726,38225,87426,05827,22526,11726,151
3,3304,0577,0466,402,109
7,4027,6867,1197,3577,7246,6027,2617,2867,4197,2707,395
17,74122,31349,08546,46751,43754,46657,35754,86155,33858,66355,61455,90256,15657,66556,83857,523
13,76217,41543,41844,44348,89752,28855,17553,60654,10656,74055,01054,87655,01355,94355,75056,110
4,2384,2074,6574,4644,6384,8324,9654,5784,2675,2145,0195,2475,0575,5175,3795,241
8881,0351,3121,217
"1,2291,3071,3501,2161,2241,3871,7031,2001,2191,3391,2811,339
3,6864,4606,4485,6496,4486,9767,0016,0665,7607,2545,9606,0076,0256,6366,3666,614
598822
1,2231,0731,1331,3091,3011,0731,0271,3151,1191,1211,1261,2411,1781,243
9,53312,91724,22719,30719,28720,34820,50418,73618,60519,67319,23718,52918,88319,49218,37918,558
1,9472,5465,0154,2734,7784,9525,1324,6964,9435.0953,6954,8264,8214,8134,7334,802
9,43913,04732,87729,39533,34235,21837,09535,05235,79837,27735,12035,28635,34236,07335,48335,822
7,31210,33529,70028,81032,89935,44937,28935,29535,64937,73535,85335,63635,65636,24236,02136,180
736807
1,2361,4451,7221,6791,8401,9301,8342,1502,1262,0982,1182,2162,3592,352
495476719913
1,1031,1431,2051,2071,1901,2421,2041,2351,2461,2671,2561,254
4,6164,8069,76011,42311,64712,27213,26113,74313,78014,132'14,53414,60914,78914,95714,98915,087
5,8526,25812,49414,56014,86515,53016,58517,23717,430=17,69018,03818,11918,23118,46018,55118,687
1,5921,6482,1202,2592,3512,4252,5052,5442,5502,5722,6142,6192,6292,6302,6422,646
250288377426490513541551552566570571578583583587
1,8281,9672,5662,8443,3223,5213,7453,8743,8813,9844,0374,0894,1084,1244,1274,168
1,8511,9822,5252,9343,5323,7603,9704,1014,1334,1944,2634,3064,3234,3724,3724,393
36363737232222222222222222222222
14131214131313131313131313131313
346351359353336321319321319319309309309310309307
5,9666,2196,4766,5196,5016,4846,4446,4096,4056,3896,3896,3856,3806,3766,3726,371
c Corrected.3 Beginning with Dec. 31, 1947, the all bank series was revised as announced in November 1947 by the Federal bank supervisory agencies.
At that time a net of 115 noninsured nonrnember commercial banks with total loans and investments of approximately 110 million dollars wasadded, and 8 banks with total loans and investments of 34 million were transferred from noninsured mutual savings to nonmember commercialbanks.
4 Figures revised from those shown in the BULLETIN for August 1954, p. 903; two noninsured commercial banks went out of existence priorto June 30, 1954, but this was not reported until later.
For other footnotes see preceding and opposite pages.
1072 FEDERAL RESERVE BULLETIN
Digitized for FRASER http://fraser.stlouisfed.org/ Federal Reserve Bank of St. Louis
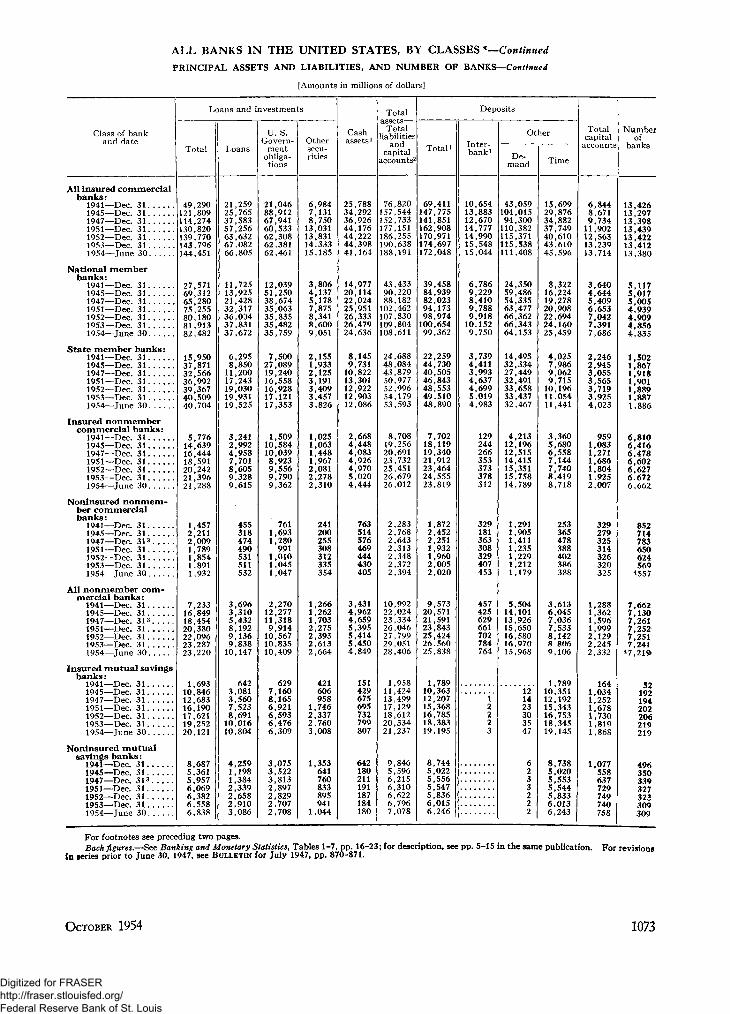
ALL BANKS IN THE UNITED STATES, BY CLASSES *—ContinuedPRINCIPAL ASSETS AND LIABILITIES, AND NUMBER OF BANKS—Continued
[Amounts in millions of dollars]
Class of bankand date
All insured commercialbanks:
1941—Dec. 311945—Dec. 311947—Dec. 311951—Dec. 311952—Dec. 311953—Dec. 311954—June 30
National memberbanks:
1941—Dec. 311945—Dec. 311947—Dec. 311951—Dec. 311952—Dec. 311953—Dec. 311954—June 30
State member banks:1941—Dec. 311945—Dec. 311947—Dec. 311951—Dec. 311952—Dec. 311953—Dec. 311954—June 30
Insured nonmembercommercial banks:
1941—Dec. 311945—Dec. 311947—Dec. 311951—Dec. 311952—Dec. 311953—Dec. 311954—June 30
Noninsured nonmem-ber, commercialbanks:
1941—Dec. 311945—Dec. 311947—Dec. 3131951—Dec. 311952—Dec. 311953—Dec. 311954—June 30
All nonmember com-mercial banks:
1941—Dec. 311945—Dec. 311947—Dec. 3131951—Dec. 311952—Dec. 311953—Dec. 311954—June 30
Insured mutual savingsbanks:
1941—Dec. 31
1947—Dec! 31.'.'.'.'..1951—Dec. 311952—Dec. 311953—Dec. 311954—June 30
Noninsured mutualsavings banks:
1941—Dec. 311945—Dec. 311947—Dec. 313
1951—Dec. 311952—Dec. 311953—Dec. 311954—June 30
Loans and investments
Total
49,290121,809114,274130,820139,770143,796144,451
27,57169,31265,28075,25580,18081,91382,482
15,95037,87132,56636,99239,36740,50940,704
5,77614,63916,44418,59120,24221,39621,288
1,4572,2112,0091,7891,8541,8911,932
7,23316,84918,45420,38022,09623,28723,220
1,69310,84612,68316,19017,62119,25220,121
8,6875,3615,9576,0696,3826,5586,838
Loans
21,25925,76537,58357,25663,63267.08266,805
11,72513,92521,42832,31736,03437,83137,672
6,2958,85011,20017,24319,03019,93119,525
3,2412,9924,9587,7018,6059,3289,615
455318474490531511532
3,6963,3105,4328,1929,1369,838
10,147
6423,0813,5607,5238,69110,01610,804
4,2591,1981,3842,3392,6582,9103,086
U. S.Govern-
mentobliga-tions
21,04688,91267,94160,53362,30862,38162,461
12,03951,25038,67435,06335,83535,48235,759
7,50027,08919,24016,55816,92817,12117,353
1,50910,58410,0398,9239,5569,7909,362
7611,6931,280991
1,0101,0451,047
2,27012,27711,3189,91410,56710,83510,409
6297,1608,1656,9216,5936,4766,309
3,0753,5223,8132,8972,8292,7072,708
Othersecu-rities
6,9847,1318,75013,03113,83114.33315,185
3,8064,1375,1787,8758,3418,6009,051
2,1551,9332,1253,1913,4093,4573,826
1,0251,0631,4481,9672,0812,2782,310
241200255308312335354
1,2661,2621,7032,2752,3932,6132,664
421606958
1,7462,3372,7603,008
1,353641760833895941
1,044
Cashassets1
Totalassets-
Totalliabilities
andcapital
accounts2
25,78834,29236,92644,17644,22244,39841,164
14,97720,11422,02425,95126,33326,47924,636
8,1459,731
10,82213,30112,92212,90312,086
2,6684,4484,0834,9264,9705,0204,444
763514576469444430405
3,4314,9624,6595,3955,4145,4504,849
151429675695732799807
642180211191187184180
76,820157,544152,733177,151186,255190,638188,191
43,43390,22088,182102,462107,830109,804108,611
24,68848,08443,87950,97752,99654,17953,593
8,70819,25620,69123,73225,45126,67926,012
2,2832,7682,6432,3132,3482,3722,394
10,99222,02423,33426,04627,79929,05128,406
1,95811,42413,49917,12918,61220,33421,237
9,8465,5966,2156,3106,6226,7967,078
Deposits
Total i
69,411147,775141,851162,908170,971174,697172,048
39,45884,93982,02394,17398,974100,65499,362
22,25944,73040,50546,84348,55349,51048,890
7,70218,11919,34021,91223,46424,55523,819
1,8722,4522,2511,9321,9602,0052,020
9,57320,57121,59123,84325,42426.56025,838
1,78910,36312,20715,36816,78518,38319,195
8,7445,0225,5565,5475,8366,0156,246
Inter-bank1
10,65413,88312,67014,77714,99015,54815,044
6,7869,2298,4109,7889,918
10.1529,750
3,7394,4113,9934,6374,6995.0194,983
129244266353373378312
329181363308329407453
457425629661702784764
Other
De-mand
43,059104,01594,300110,382115,371115,538111,408
24,35059,48654,33563,47766,36266,34364,153
14,49532,33427,44932,49133,65833,43732,467
4,21312,19612,51514,41515,35115,75814,789
1,2911,9051,4111,2351,2291,2121,179
5,50414,10113,92615,65016,58016,97015,968
121423303547
Time
15,69929,87634,88237,74940,61043.61045,596
8,32216,22419,27820,90822,69424,16025,459
4,0257,9869,0629,71510,19611,05411,441
3,3605,6806,5587,1447,7408.4198,718
253365478388402386388
3,6136,0457,0367,5338,1428 8069,106
1,78910,35112,19215,34316,75318,34519,145
8,7385,0205,5535,5445,8336,0136,243
Totalcapital
accounts
6,8448,6719,73411,90212,56313.23913,714
3,6404,6445,4096,6537,0427,3917,686
2,2462,9453,0553,5653,7193,9254,023
9591,0831,2711,6861,8041,9252,007
329279325314326320325
Numberof
banks
13,42613,29713,39813,43913,42213.41213,380
5,1175,0175,0054,9394,9094,8564,835
1,5021,8671,9181,9011,8891,8871,886
6,8106,4166,4786,6026,6276.6726,662
852714783650624569
4557
1,2881,3621,5961,9992,1292,2452,332
1641,0341,2521,6781,7301,8191,868
1,077558637729749740758
777777
4 7
,662,130,261,252,251,241,219>
52192194202206219219
496350339327323309309
For footnotes see preceding two pages.Back figures.—See Banking and Monetary Statistics, Tables 1-7, pp. 16-23; for description, see pp. 5-15 in the same publication. For revisions
in series prior to June 30, 1947, see BULLETIN for July 1947, pp. 870-871.
OCTOBER 1954 1073
Digitized for FRASER http://fraser.stlouisfed.org/ Federal Reserve Bank of St. Louis
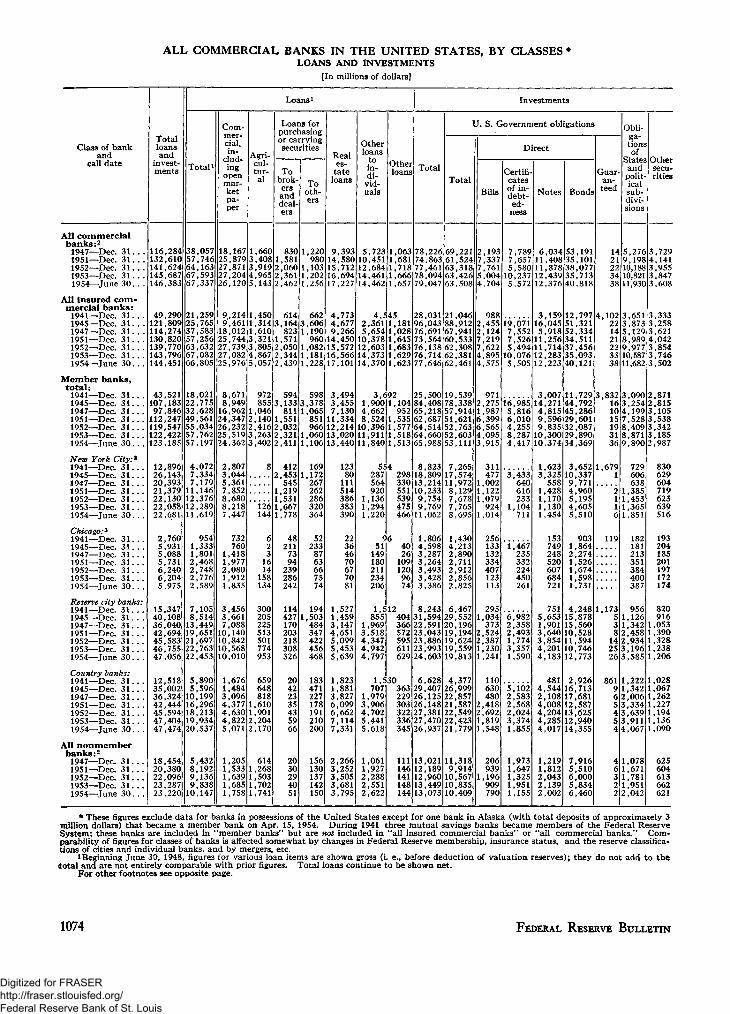
ALL COMMERCIAL BANKS IN THE UNITED STATES, BY CLASSES •LOANS AND INVESTMENTS
[In millions of dollars]
Class of bankand
call date
All commercialbanks:2
1947—Dec. 3 1 . . .1951—Dec. 31 . . .1952—Dec. 31 . ...1953—Dec. 3 1 . . .1954—June 30. . .
All Insured com-mercial banks :
1941—Dec. 3 1 . . .1945—Dec. 3 1 . . .1947—Dec. 31 . . .1951—Dec. 31 . . .1952—Dec. 31 . . .1953—Dec. 31 . . .1954—June 3 0 . . .
Member banks,total:
1941—Dec# 31 . . ,1945—Dec. 31 . . .1947—Dec. 3 1 . . .1951—Dec. 31 . . .1952—Dec. 31 . . .1953—Dec. 3 1 . . .1954—June 3 0 . . .
New York City:3
1941 T)ec 31»• 7 ^ A, A^f%^.\^% KJ A, • • *
194 5 T")er "51A. 7^T«J X—'tV*« *_/ A • • •
1947—Dec. 31 . . .1951—Dec. 31 . . .1952—Dec. 31 . . .1953—Dec. 31 . . .1954—June 3 0 . . .
Chicago:3
1941—Dec. 31 . . .1945—Dec. 3 1 . . .1947—Dec. 31 . . .1951—Dec. 31 . . .1952—Dec. 31 . . .1953—Dec. 3 1 . . .1954—June 3 0 . . .
Reserve city banks:1941 Dec. 3 1 . . .1945—Dec! 31.'.'.1947—Dec. 31 . . .1951—Dec. 31 . . .1952—Dec. 31 . . .1953—Dec. 31 . . .1954—June 3 0 . . .
Country banks:1941—£)ec 311945—Dec". 31! . !1947—Dec. 31 . . .1951—Dec. 31 . . .1952—Dec. 3 1 . . .1953—Dec. 31 . . .1954—June 30. . .
All nonmemberbanks:2
1947—Dec. 31. . .1951—Dec. 31. . .1952—Dec. 31. . .1953—Dec. 3 1 . . .1954—June 3 0 . . .
Totalloansand
invest-ments
116,284132,610141,624145,687146,383
49,290121,809114,274130,820139,770143,796144,451
43,521107,18397,846
112,247119,547122,422123,185
12,89626,14320,39321,37922,13022,05822,681
2,7605,9315,0885,7316,2406,2045,975
15,34740,10836,04042,69445,58346,75547,056
12,51835,00236,32442,44445,59447,40447,474
18,45420,38022,09623,28723,220
Loans1
Total i
38,05757,74664,16367,59367,337
21,25925,76537,58357,25663,63267,08266,805
18,02122,77532,62849,56155,03457,76257,197
4,0727 3347,179
11,14612,37612,28911,619
9541,3331,8012,4682,7482,7762,589
7 1058,514
13,44919,65121,69722,76322,453
5 8905,596
10,19916,29618,21319,93420,537
5,4328,1929,1369,838
10,147
Com-mer-cial,in-
clud-ing
openmar-ketpa-per
18,16725,87927,87127,20426,120
9,2149,461
18,01225,74427,73927,08225,976
8,6718,949
16,96224,34726,23225,51924,362
2,8073,0445,3617,8528,6808,2187,447
732760
1,4181,9772,0801,9121,835
3 4563,6617,088
10,14010,84210,56810,010
1,6761,4843,0964,3774,6304,8225,071
1,2051,5331,6391,6851,758
Agri-cul-tur-al
1,6603,4083,9194,9655,143
1,4501,3141,6103,3213,8054,8675,057
972855
1,0462,1402,4163,2633,402
8
' *126144
623
1614
158134
300205225513501774953
659648818
1,6101,9012,2042,170
6141,2681,5031,7021,741
Loans forpurchasingor carryingsecurities
Tobrok-ersanddeal-ers
8301,5812,0602,3612,462
6143,164
8231,5712,0502,3442,439
5943,133
8111,5512,0322,3212,411
4122 453
'5451,2191,5311,6671,778
48211
7394
239286242
114427170203218308326
20422335435966
2030294051
Tooth-ers
1,220980
1,1031,2021,256
6623,6061,190
9601,0821,1811,228
5983,3781,065
851966
1,0601,106
1691 172
*267262286320364
52233
8763667574
1941,503
484347422456468
183471227178191210200
156130137142150
Reales-
tateloans
9,39314,58015,71216,69417,227
4,7734,6779,266
14,45015,57216,56617,101
3,4943,4557,130
11,33412,21413,02013,440
12380
111514386383390
22364670677081
1 5271,4593,1474,6515,0995,4535,639
1,8231,8813,8276,0996,6627,1147,331
2,2663,2523,5053,6813,795
Otherloans
toin-di-
vid-uals
5,72310,45112,68414,46114,462
4 , i2,3615,654
10,37812,60314,37314,370
3,<1,9004,6628,524
10,39611,91111,840
5^287564920
1,1361,2941,220
S51
149180211234206
1 f855
1,9693,5184,3474,9424,797
1 ,"707
1,9793,9064,7025,4415,618
1,0611,9272,2882,5512,622
Otherloans
1,0631,6811,7181,6661,657
451,1811,0281,6451,6831,6291,623
921,104
9521,5351,5771,5181,513
4298330551539475466
64026
109120
9674
12404366572595611629
30363229303322336345
111146141148144
Investments
Total
78,22674,86377,46178,09479,047
28,03196,04376,69173,56476,13876,71477,646
25,50084,40865,21862,68764,51464,66065,988
8,823L8,80913,21410,2339,7549,769
11,062
1,8064,5983,2873,2643,4933,4283,386
8 24331,59422,59123,04323,88623,99324,603
6,62829,40726,12526,14827,38127,47026,937
13,02112,18912,96013,44913,073
U. S. Government obligations
Total
69,22161,52463,31863,42663,508
21 04688,91267,94160,53362,30862,38162,461
19,53978,33857,91451,62152,76352,60353,111
7,26517 57411^9728,1297,6787,7658,695
1,4304,2132,8902,7112,9122,8562,825
6 46729,55220,19619,19419,62419,55919,813
4 37726,99922,85721,58722,54922,42321,779
11,3189,914
10,56710,83510,409
Direct
Bills
2,1937,3377,7615,0044,704
9882,4552,1247,2197,6224,8954,575
9712,2751,9876,3996,5654,0953,915
311477
1,0021,1221,079
9241,014
256133132334407123113
2951,034
3732,5242,3871,2301,241
110630480
2,4182,6921,8191,548
206939
1,196909790
Certifi-catesof in-debt-ed-ness
7,7897,6575,580
10,2375,572
19,0717,5527,5265,494
10,0765,505
16,9855,8166,0104,2558,2874,417
3 433'640616233
1,104711
1,467235332224450261
6,9822,3582,4931,7743,3571,590
5,1022,5832,5682,0243,3741,855
1,9731,6471,3251,9511,155
Notes
6,03411,40811,87812,43912,376
3,15916,0455,918
11,25611,71412.28312,223
3,00714,2714,8159,5969,835
10,30010,374
1,6233 325
'5581,4281,1701,1301,454
153749248520607684721
7515,6531,9013,6403,8544,2014,183
4814,5442,1084,0084,2044,2854,017
1,2191.8122,0432,1392,002
Bonds
53,19135,10138,07735,71340,818
12 79751,32152,33434,51137,45635,09340,121
11,72944,79245,28629,60132,08729,89034,369
3,65210 3379^7714,9605,1954,6055,510
9031,8642,2741,5261,6741,5981,731
4 24815,87815,56010,52811,59410,74612,773
2 92616,71317,68112,58713,62512,94014,355
7,9165,5106,0005,8346,460
Guar-an-teed
4 t
3,1
1421223438
102221421223338
J32161015193136
1,670
1
1
"l116
L19
L73538
142526
561965454
46322
Obli-ga-tionsof
Statesandpolit-icalsub-divi-sions
5,2769,19810,18810,82111,930
3,6513,8735,1298,9899,97710,58711,682
3,0903,2544,1997,5288,4098,8719,890
729606638
1,3851,4531,3651,851
182181213351384400387
9561,1261,3422,4582,9343,1963,585
1 2221,3422,0063,3343,6393,9114,067
1,0781,6711,7811,9512,042
Othersecu-rities
3,7294,1413,9553,8473,608
3 3333,2583,6214,0423,8543,7463,502
2 8712,8153,1053,5383,3423,1852,987
830629604719623639516
193204185201197172174
820916
1,0531,3901,3281,2381,206
1,0281,0671,2621,2271,1941,1361,090
625604613662621
* These figures exclude data for banks in possessions of the United States except for one bank in Alaska (with total deposits of approximately 3million dollars) that became a member bank on Apr. 15, 1954. During 1941 three mutual savings banks became members of the Federal ReserveSystem; these banks are included in "member banks" but are not included in "all insured commercial banks" or "all commercial banks." Com-parability of figures for classes of banks is affected somewhat by changes in Federal Reserve membership, insurance status, and the reserve classifica-tions of cities and individual banks, and by mergers, etc.
1 Beginning June 30, 1948, figures for various loan items are shown gross (i. e., before deduction of valuation reserves); they do not add to thetotal and are not entirely comparable with prior figures. Total loans continue to be shown net.
For other footnotes see opposite page.
1074 FEDERAL RESERVE BULLETIN
Digitized for FRASER http://fraser.stlouisfed.org/ Federal Reserve Bank of St. Louis
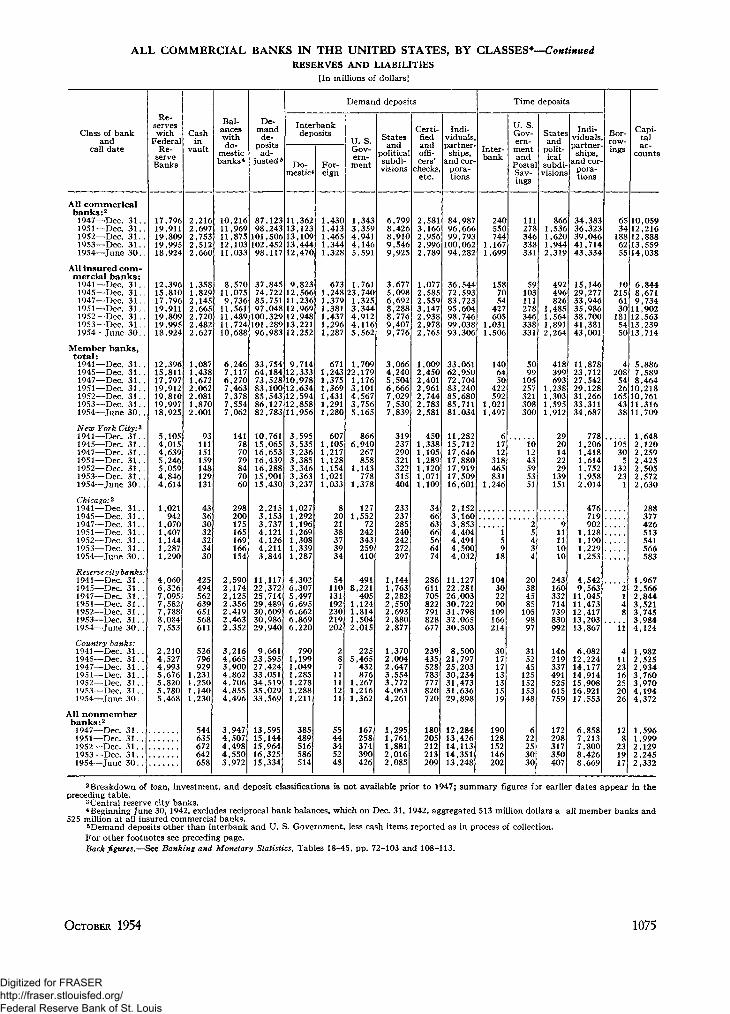
ALL COMMERCIAL BANKS IN THE UNITED STATES, BY CLASSES*—ContinuedRESERVES AND LIABILITIES
[In millions of dollars]
Class of baand
call date
All commeribanks:2
1947—Dec.1951—Dec.1952—Dec.1953—Dec.1954—June
nk
ca l
3 1 . .3 1 . .3 1 . .31. .30. .
All insured com-mercial banks:
1941—Dec.1945—Dec.1947—Dec.1951—Dec.1952—Dec.1953—Dec.1954—June
31. .31. .3 1 . .31. .31. .31. .30. .
Member banks,total:1941—Dec.1945—Dec.1947—Dec.1951—Dec.1952—Dec.1953—Dec.1954—June
31. .31. .31. .31. .31. .3 1 . .30 . .
New York City:*1941—-Dec.1945—Dec.1947—Dec.1951—Dec.1952—Dec.1953—Dec.1954—June
Chicago:*1941—Dec.1945—£)ec>1947—Dec.1951—Dec.1952—Dec.1953—Dec.1954—June
3 1 .3 1 . .3 1 . .3 1 . .31. .3 1 . .30. .
31. .31. .31. .3 1 . .3 1 . .31. .30. .
Reserve city banks:1941—Dec.1945—Dec.1947—Dec.1951—Dec.1952—Dec.1953—Dec.1954—June
31. .3 1 . .3 1 . .3 1 . .3 1 . .31 . .30 . .
Country banks:1941—Dec.1945—Dec.1947—Dec.1951—Dec.1952—Dec.1953—Dec.1954—June
3 1 . .3 1 . .31. .3 1 . .31. .31. .30. .
All n o n m e m b e rbanks : 2
1947—.£)ec<1951—Dec#1952—Dec.1953—/Dec#1954—June
313131. .3130
Re-serveswith
FederalRe-
serveBanks
1719191918
12151719191918
12151719191918
5445544
1
11111
4677787
2445555
,796,911,809,995,924
,396,810,796,911,809,995,924
,396,811,797,912,810,997,925
,105,015,639,246059846
,614
021942070407144287290
060326095582788084553
210527993676820780468
Cashin
vault
22222
1122222
1112212
1111
,216,697,753,512,660
,358,829,145,665,720,482,627
,087,438,672,062,081,870,001
93111151159148129131
43363032323430
425494562639651568611
526796929231250140230
544635672642658
Bal-anceswithdo-
mesticbanks4
1011111211
811
911111110
6767777
2222222
3434444
3 ,4 ,4 ,4 ,3 ,
,216,969,875,103,033
,570,075,736,561,489,724,688
,246,117,270,463378
,554,062
141787079847060
298200175165169166154
590174125356419463352
216665900862706855496
947507498550972
De-mand
de-posits
ad-justed6
8798
10110298
37748597
100101
96
33647383858682
10151616161515
2334443
11222529303029
9232733343533
1315151615
,123,243,506,452,117
,845,722,751,048,329,289,983
,754,184,528,100,543,127,783
,761,065,653,439,288,901,430
,215,153,737,121,126,211,844
,117,372,714,489,609,986,940
,661,595,424,051,519,029,569
595144964325334
Interbankdeposits
Do-mestic4
1113131312
9121112121312
9121012121211
3333333
1111111
4656666
111111
,362,123,109,444,470
,823,566,236,969,948,221,252
,714,333,978,634,594,858,956
,595,535,236,385,346,363,237
,027,292,196,269,308,339,287
,302,307,497,695,662,869,220
790,199,049,285,278,288,211
385489516586514
1111]1
111111
for-eign
1,4301,4131,4651,3441,328
6731,2481,3791,3811,4371,296L ,287
671,243,375,369,431,291,280
607,105,217,128,154,021,033
8202138373934
54110131192230219202
287
11111211
5544345248
Demand deposits
U. S.Gov-ern-ment
13445
123
13445
122
13435
6
1
1
1
8
1112
5
111
,343,359,941,146,591
,761,740,325,344,912,116,562
,709,179,176101567
,756,165
866940267858143778378
127552
72242343259410
491221405124814504015
225465432876267216362
167258374390426
Statesand
politicasubdi-visions
68899
3568899
3456777
1122222
1223344
1,1,1 ,2 ,2 ,
,799,426,910,546,925
,677,098,692,288,776,407,776
,066,240,504666
,029,530,839
319237290321322315404
233237285240242272297
144763282550693880877
370004647554772063261
295761881016085
Certi-fiedandoffi-cers'
checksetc.
23222
1223222
1222222
111111
,581,166,956,996,789
,077,585,559,147,938,978,765
,009,450,401,961,744,783,581
450,338,105,289,120,071,109
34666366566474
286611705822791828677
239435528783777820720
180205212213209
Indi-vidualspartner-
ships,and cor-
pora-tions
849699
10094
36728395989993
33627283858581
11151717171716
2334444
11222630313230
8212530313129
12 ,1 3 ,14,14 ,1 3 ,
,987,666,793,062,282
,544,593,723,604,746,038,306
,061950704
,240680711034
282712646880919509601
152160853404491500032
127281003722798065503
500797203234473636898
284426113351248
Inter-bank
11
11
11
1
240550744
,167,699
1587054
427605
,031,506
1406450
422592
,021,497
61712
318465831
,246
159
18
104302290
109166214
30171713131519
190128152146202
Time deposits
U. S.Gov-ern-mentand
PostalSav-ings
111278346338331
59103111278346338331
5099
105257321308300
101243595351
25434
20384585
1059897
315245
125152153148
622253030
Statesand
polit-ical
subdi-visions
8661,5361,6201,9442,319
492496826
1,4851,5641,8912,264
418399693
1,2381,3031,5951,912
2920142229
139151
911111010
243160332714739830992
146219337491525615759
172298317350407
Indi-vidualspartner
ships,and cor-
pora-tions
3436394143
15293335384143
11232729313334
111112
1111
49
1111121313
6121414151617
6778 ,8
,383,323,046,714,334
,146,277,946,986,700,381,001
878712542128266311687
778206418614752958014
476719902128190229253
542563045473417203867
082224177914908921553
858213800426669
Bor-row-ings
6534
1886255
10215
6130
1815450
4208
5426
1654338
19530
5132
231
2148
ii
4112316252026
128
231917
Capi-talac-
counts
1012121314
689
11121313
578
10101111
1222222
1223334
1223344
11222
,059,216,888,559,038
,844,671,734,902,563,239,714
,886,589,464,218,761,316,709
648120259425505572630
288377426513541566583
967566844521745984124
982525934760970194372
596999129245332
2 Breakdown of loan, investment, and deposit classifications is not available prior to 1947; summary figures for earlier dates appear in thepreceding table.
3 Central reserve city banks.4 Beginning June 30, 1942, excludes reciprocal bank balances, which on Dec. 31, 1942, aggregated 513 million dollars a all member banks and
525 million at all insured commercial banks.5Demand deposits other than interbank and U. S. Government, less cash items reported as in process of collection.For other footnotes see preceding page.Back figures.—See Banking and Monetary Statistics, Tables 18-45, pp. 72-103 and 108-113.
OCTOBER 1954 1075
Digitized for FRASER http://fraser.stlouisfed.org/ Federal Reserve Bank of St. Louis
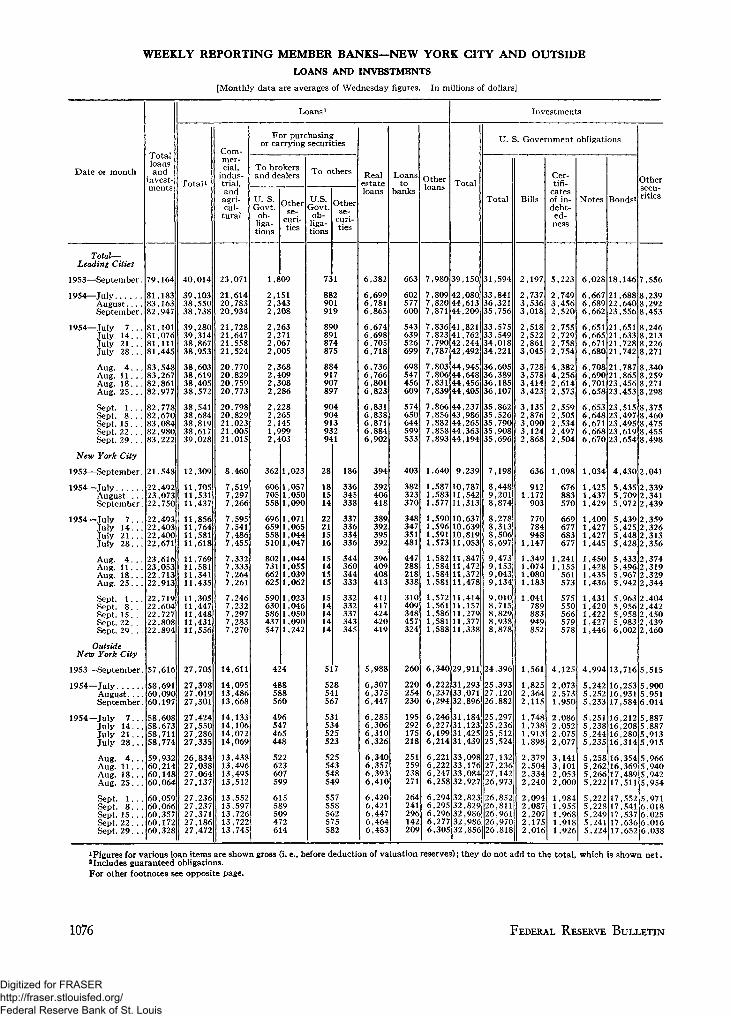
WEEKLY REPORTING MEMBER BANKS—NEW YORK CITY AND OUTSIDELOANS AND INVESTMENTS
[Monthly data are averages of Wednesday figures. In millions of dollars]
Date or month
Totalloansand
invest-ments
Loansl
Total i
Com-mer-cial,
indus-trial,andagri-cul-tural
For purchasingor carrying securities
To brokersand dealers
U. S.Govt.
ob-liga-tions
Otherse-
curi-ties
To others
U.S.Govt.ob-liga-tions
Otherse-
curi-ties
Realestateloans
Loansto
banksOtherloans
Investments
Total
U. S. Government obligations
Total Bills
Cer-tifi-
catesof in-debt-ed-ness
Notes Bonds2
Othersecu-rities
Total—Leading Cities
1953—September.
1954—JulyAugust . . . .September.
1954—July 1...July 14 . . .July 21 . . .July 2 8 . . .
Aug. 4 . . .Aug. 11. . .Aug. 18. . .Aug. 25 . . .
Sept. 1. . .Sept. 8...Sept. 15. ..Sept. 22 . . .Sept. 29. ..
New York City
1953—September.
1954—JulyAugust. . . .September.
1954—July 7 . . .July 14. . .July 21 . . .July 2 8 . . .
Aug. 4 . . .Aug. 1 1 . . .Aug. 18. . .Aug. 2 5 . . .
Sept. 1...Sept. 8...Sept. 15. ..Sept. 22 ...Sept. 29. ..
OutsideNew York City
1953—September.
1954—JulyAugust....September.
1954—July 7 . . .July 14. . .July 2 1 . . .July 2 8 . . .
Aug. 4...Aug. 11. ..Aug. 18. ..Aug. 25...
Sept. 1.Sept. 8.Sept. 15. ..Sept. 22...Sept. 29. ..
79,164
81,18383,16382,947
81,10181,07681,11181,445
83,54883,26782,86182,977
82,77882,67083,08482,98083,222
21,548
22,49223,07322,750
22,49322,40322,40022,671
23,61623,05322,71322,913
22,71922,60422,72722,80822,894
57,616
58,69160,09060,197
58,60858,67358,71158,774
59,93260,21460,14860,064
60,05960,06660,35760,17260,328
40,014
39,10338,55038,738
39,28039,31438,86738,953
38,60338,61938,40538,572
38,54138,68438,81938,61739,028
12,309
11,70511,53111,437
11,85611,76411,58111,618
11,76911,58111,34111,435
11,30511,44711,44811,43111,556
27,705
27,39827,01927,301
27,42427,55027,28627,335
26,83427,03827,06427,137
27,23627,23727,37127,18627,472
23,071
21,61420,78320,934
21,72821,64721,55821,524
20,77020,82920,75920,773
20,79820,82921,02321,00521,015
8,460
7,5197,2977,266
7,5957,5417,4867,455
7,3327,3337,2647,261
7,270
14,611
14,09513,48613,668
14,13314,10614,07214,069
13,43813,49613,49513,512
13,55213,59713,72613,72213,745
1,809
2,1512,3432,208
2,2632,2712,0672,005
2,3682,4092,3082,286
2,2282,2652,1451,9992,403
362 1,023
606 1,057705558
696659558510
731662625
590630586437547
1,0501,090
1,0711,0651,0441,047
1,0441,0551,0391,062
1,0231,0461,0501,0901,242
424
488588560
496547465448
522623607599
615589509472614
731
882901919
890891874875
884917907897
904904913932941
186
336345338
337336334336
344360344333
332332337343345
517
528541567
531534525523
525543548549
557558562575582
6,382
6,6996,7816,865
6,6746,6986,7056,718
6,7366,7666,8016,823
6,8316,8386,8716.8846,902
394
392406418
389392395392
396409408413
411417424420419
5,988
6,3076,3756,447
6,2856,3066,3106,326
6,3406,3576,3936,410
6,4206,4216,4476,4646,483
602577600
543639526699
698547456609
574650644599533
403
382323370
348347351481
447288218338
310409348457324
260
220254230
19529217218
251259238271
26424129614:209
7,980 39,150
7,809 42,0807,820 44,6137,871 44,209
7,836 41,8217,823 41,7627,790 42,2447,787 42,492
7,803 44,9457,806 44,648
44,4567,839 44,405
7,866 44,2377,856 43,986
44,2657,858 44,3637,893 44,194
1,640
,587,583,577
9,239
10,78711,54211,313
590 10,63710,63910,81911,053
,596,591,573
,582 11,847584 11,472
11,37211,478
,584,581
,572,561
11,41411,15711,27911,377
1,588 11,338
1,5861,581
6,340 29,911
6,222 31,29333,07132,896
6,2376,294
6,2466,2276,1996,214
6,2216,2226,2476, 258 32
31,18431,12331,42531,439
33,09833,17633,084
,927
6,294 326,2956,2966,276,305
,82332,82932,98632,98632,856
31,594
33,84136,32135,756
33,57533,54934,01834,221
36,60536,38936,18536,107
35,86235,52635,79035,90835,696
7,198
8,4489,2018,874
8,2788,3138,5068,697
9,4739,1539,0439,134
9,0108,7158,8298,9388,878
24,396
25,39327,12026,882
25,29725,23625,51225,524
27,13227,23627,14226,973
26,85226,81126,96126,97026,818
2,197
2,7373,5363,018
2,5182,5222,8613,045
3,7283,5783,4143,423
3,1352,8763,0903,1242,868
636
9121,172903
770784948
1,147
1,3491,0741,0801,183
1,041789883949852
1,561
1,8252,3642,115
1,7481,7381,9131,898
2,3792,5042,3342,240
2,0942,0872,2072,1752,016
5,223
2,7493,4562,520
2,7552,7292,7582,754
4,3824,2562,6142,573
2,5592,5052,5342,4972,504
1,098
676883570
669677683677
1,2411,155561573
575550566579578
4,125
2,0732,5731,950
2,0862,0522,0752,077
3,1413,1012,0532,000
1,9841,9551,9681,9181,926
6,028
6,6676,6896,662
6,6516,6656,6716,680
6,7086,6906,7016,658
6,6536,6486,6716,6686,670
1,034
1,4251,4371,429
1,4001,4271,4271,445
1,4501,4281,4351,436
1,4311,4201,4221,4271,446
4,994
5,2425,2525,233
5,2515,2385,2445,235
5,2585,2625,2665,222
5,2225,2285,2495,2415,224
18,146 7,556
688 821,22,64023, 556 8
,2398,292,453
21,65121,63321,72821,742
21,78721,86523,45623,453
23,51523,49723,49523,61923,654
8,2468,2138,2268,271
8,3408,2598,2718,298
8,3758,4608,4758,4558,498
4,430 2,041
5,4355,70925,972
2,339,341
2,439
5,4395,5,448 25,,428 2
2,359,326,313,356
5,4335,496 25,9675,942
2,374,319
2,3292,344
963 25,5,9565,5,9836,002
13,716
,4042,442,450
2,4392,460
5,515
16,25316,93117,584 6
5,9005,951,014
16,21216,208 516,280 516,314 5
5,887,887,913,915
16,354 516,36917,489 517,511
,9665,940,942
5,954
17,55217,54117,53717,63617,652
5,9716,0186,0256,0166,038
figures for various loan items are shown gross (i. e., before deduction of valuation reserves); they do not add to the total, which is shown net.2 Includes guaranteed obligations.For other footnotes see opposite page.
1076 FEDERAL RESERVE BULLETIN
Digitized for FRASER http://fraser.stlouisfed.org/ Federal Reserve Bank of St. Louis
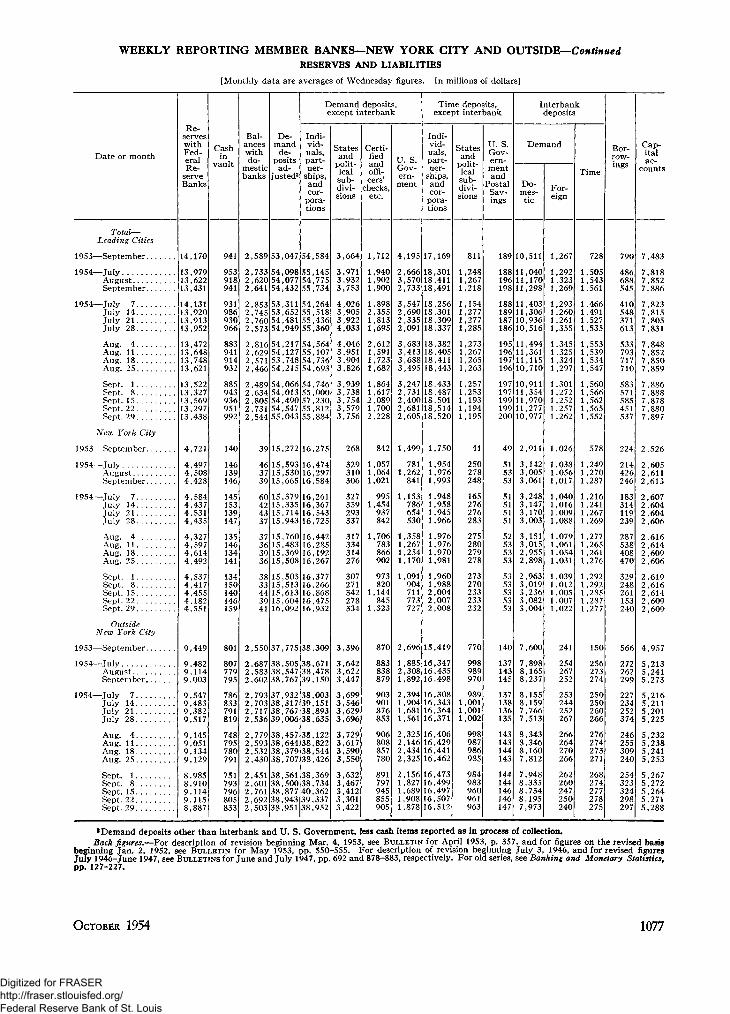
WEEKLY REPORTING MEMBER BANKS—NEW YORK CITY AND OUTSIDE—ContinuedRESERVES AND LIABILITIES
[Monthly data are averages of Wednesday figures. In millions of dollars]
Date or month
Re-serveswithFed-eralRe-
serveBanks
Cashin
vault
Bal-anceswithdo-
mesticbanks
De-mand
de-posits
ad-justed3
Demand deposits,except interbank
Indi-vid-uals,part-ner-
ships,andcor-
pora-tions
Statesand
polit-icalsub-divi-sions
Certi-fiedandoffi-cers'
checks,etc.
U. S.Gov-ern-ment
Time deposits,except interbank
Indi-vid-uals,part-ner-
ships,andcor-
pora-tions
Statesand
polit-icalsub-divi-sions
U. S.Gov-ern-mentand
PostalSav-ings
Interbankdeposits
Demand
Do-mes-tic
For-eign
Time
Bor-row-ings
Cap-italac-
counts
Total-Leading Cities
1953—September
1954—JulyAugustSeptember
1954—July 7July 14July 21July 28
Aug. 4Aug. 11Aug. 18Aug. 25
Sept. 1Sept. 8Sept.-15Sept. 22
Sept. 29
New York City
1953—September
1954—JulyAugustSeptember
1954—July 7July 14July 21July 28Aug. 4Aug. 11Aug. 18Aug. 25
Sept. 1Sept. 8Sept. 15Sept. 22Sept. 29
OutsideNew York City
1953—September
1954—JulyAugustSeptember
1954—July 7July 14July 21July 28
Aug. 4Aug. 11Aug. 18Aug. 25
Sept. 1Sept. 8Sept. 15Sept. 22Sept. 29
14,170
13,97913,62213,431
14,13113,92013,91313,952
13,47213,64813,74813,621
13,52213,32713,56913,29713,438
4,721
4,4974,5084,428
4,5844,4374,5314,435
4,3274,5974,6144,492
4,5374,4174,4554,1824,551
9,449
9,4829,1149,003
9,5479,4839,3829,517
9,1459,0519,1349,129
8,9858,9109,1149,1158,887
941
953918941
931986930966
883941914932
885943936951992
140
146139146
145153139147
135146134141
134150140146159
801
807779795
786833791819
748795780791
751793796805833
2,589 53,047 54,584
733 54,098 55,14554,77555,734
2,2,620 542,641
,07754,432
853 53 ,31153,652
760 54,48154,949 55
2,2,7452,2,573
54,26455,51855,436
,360
54,217 54629 54,127
53,748 5454,215
2,8162,2,5712,466
,56455,107
,73654,693
54,066 542,634 54,013
54,490 5754,547
2,544 55,043
2,489 ,74655,000
,23055,81255,884
15,272
15,59315,53015,665
15,37915,33515,71415,943
15,76015,48315,36915,508
15,50515,51315,61315,60416,092
16,275
16,47416,29716,584
16,26116,36716,54316,725
16,44216,28516,19216,267
16,37716,26616,86816,47516,932
2,550 37,775 38,309
2,6872,5832,602
2,7932,7032,7172,536
505 3838,38,54738,767
,67138,47839,150
37,93238,31738,76739,006 38
38,003,151
38,893,635
2,7792,5932,5322,430 38,707 38
38,45738,644 3838,379 38
38,122,822,544,426
2,4512,6012,7612,6922,503
38,56138,500 3838,877 4038,943 3938,951
38,369,734,362,337
38,952
3,664
3,9713,9323,753
4,0263,9053,9224,033
4,0463,9513,9043,826
3,9393,7383,7543,5793,756
268
329310306
327359293337
317334314276
307271342278334
3,396
3,6423,6223,447
3,6993,5463,6293,696
3,7293,6173,5903,550
3,6323,4673,4123,3013,422
1,712
1,9401,9021,900
1,52,3551,8131,695
2,6121,5911,7231,682
1,8641,6172,0891,7002,228
842
1,0571,0641,021
9951,454937842
1,706783866902
973820
1,144845
1,323
870
883838879
903901876853
906808857780
891797945855905
4,195
2,6663,5702,733
3,5472,6902,3352,091
3,6833,4133,6883,495
3,2472,7312,4002,6812,605
1,499
7811,262841
1,153786654530
1,3581,2671,2541,170
1,091904711773727
2,696
1 ,8852,3081,892
2,3941,9041,6811,561
2,3252,1462,4342,325
2,1561,8271,6891,9081,878
17,169
18,30118,41118,491
18,25618,30118,30918,337
18,38218,40518,41118,443
18,43318,48718,50118,51418,520
1,750
1,9541,9761,993
,948,958,945,966
,976,976,970
1,981
1,9601,9882,0042,0072,008
15,419
16,34716,43516,498
16,30816,34316,36416,371
16,40616,42916,44116,462
16,47316,49916,49716,50716,512
811
1,2481,2671,218
1,1541,2771,2771,285
1,2731,2671,2651,263
1,2571,2531,1931,1941,195
41
250278248
165276276283
275280279278
273270233233232
770
998989970
9891,0011,0011,002
998987986985
984983960961963
189
188196198
188189187186
195196197196
197197199199200
49
137143145
137138136135
143143144143
144
147
10,511
11,04011,17011,298
11,40311,30610,93610,516
11,49411,36111,11510,710
10,91111,35411,97011,27710,977
2,911
3,1423,0053,061
3,2483,1473,1703,003
3,1513,0152,9552,898
2,9633,0193,2363,0823,004
7,600
7,8988,1658,237
8,1558,1597,7667,513
8,3438,3468,1607,812
7,9488,3358,7348,1957,973
1,267
,292,323,269
,293,260,261,355
1,3451,3251,3241,297
1,3011,2721,2521,2571,262
1,026
1,0381,0561,017
1,0401,0161,0091,088
1,0791,0611,0541,031
1,0391,0121,0051,0071,022
254267252
253244252267
266264270266
262260247250240
728
1,505,543,561
,466,491,527,535
,553,539,534,547
,560,566,562
1,5651,552
1,2491,2701,287
1,2161,2411,2671,269
1,2771,2651,2611.276
1,2921,2921,2851,2871,277
256273274
250250260266
276274273271
268274277278275
486688545
548371613
533793717710
583571585451537
224
214426
183314119239
287538408470
329248261153240
566
272262299
227234252374
246255309240
254323324298297
7,483
7,8187,8527,886
7,8237,8157,8057,831
7,8487,8527,8507,859
7,8867,8887,8787,8807,897
2,526
2,6052,6112,613
2,6072,6042,6042,606
2,6162,6142,6092,606
2,6192,6162,6142,6092,609
4,957
5,2135,2415,273
5,2165,2115,2015,225
5,2325,2385,2415,253
5,2675,2725,2645,2715,288
* Demand deposits other than interbank and U. S. Government, less cash items reported as in process of collection.Back figures.—For description of revision beginning Mar. 4, 1953, see BULLETIN for April 1953, p. 357, and for figures on the revised basis
beginning Jan. 2, 1952, see BULLETIN for May 1953, pp. 550-555. For description of revision beginning July 3, 1946, and for revised figuresJuly 1946-June 1947, see BULLETINS for June and July 1947, pp. 692 and 878-883, respectively. For old series, see Banking and Monetary Statistics,pp. 127-227.
OCTOBER 1954 1077
Digitized for FRASER http://fraser.stlouisfed.org/ Federal Reserve Bank of St. Louis
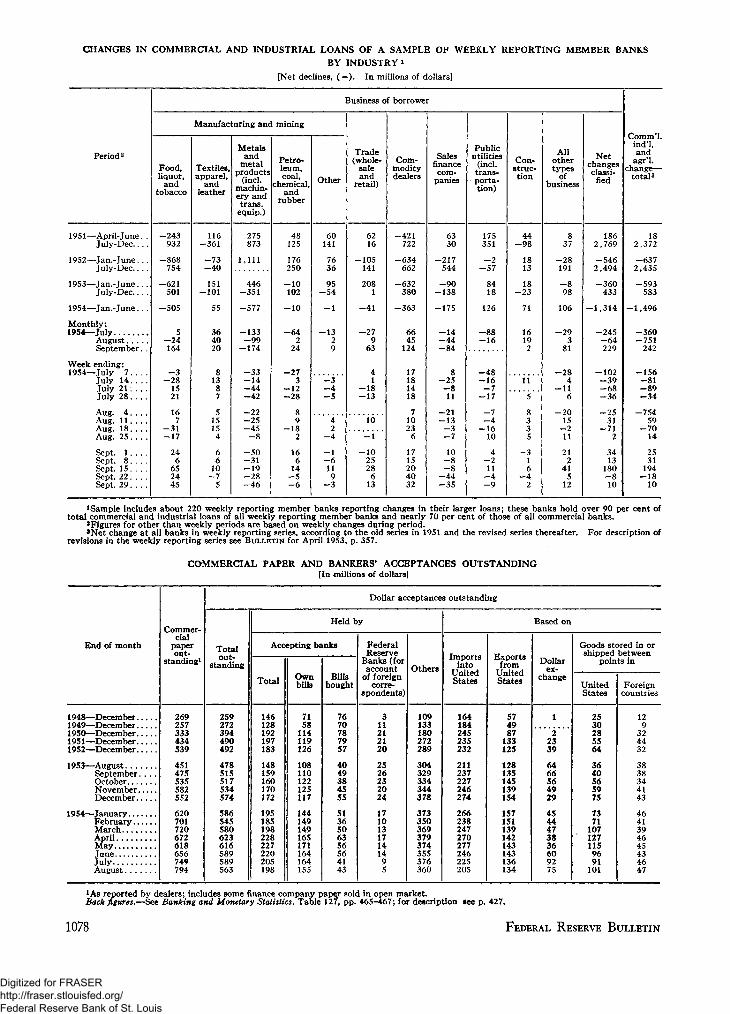
CHANGES IN COMMERCIAL AND INDUSTRIAL LOANS OF A SAMPLE OF WEEKLY REPORTING MEMBER BANKS
BY INDUSTRY1
[Net declines, (—). In millions of dollars]
Period2
1951—April-June. .July-Dec
1952—Jan.-June. ..July-Dec
1953—Jan.-June. ..July-Dec.. . .
1954—Jan.-June. . .
Monthly:1954—July
AugustSeptember. .
Week ending:1954—July 7
July 14July 21: . . .July 28
Aug. 4Aug. 11Aug. 18Aug. 25
Sept. 1Sept. 8 . . . .Sept. 15Sept. 22Sept. 29
Business of borrower
Manufacturing and mining
Food,liquor,
andtobacco
-243932
-868754
-621501
-505
5- 2 4164
- 3- 2 8
1521
167
- 3 1- 1 7
246
652445
Textiles,apparel,
andleather
116-361
- 7 3- 4 0
151-101
55
364020
81387
515154
66
10- 7
5
Metalsand
metalproducts
(incl.machin-ery andtrans,
equip.)
275873
1,111
446-351
-577
-133- 9 9
-174
-33- 1 4- 4 4- 4 2
- 2 2- 2 5- 4 5
- 8
- 5 0- 3 1- 1 9- 2 8- 4 6
Petro-leum,coal,
chemical,and
rubber
48125
176250
- 1 0102
- 1 0
- 6 42
24
- 2 73
- 1 2- 2 8
89
- 1 82
166
14- 5- 6
Other
60141
7636
95- 5 4
- 1
- 1 329
- 3- 4- 5
42
- 4
- 1- 6119
- 3
Trade(whole-
saleand
retail)
6216
- 1 0 5141
2081
- 4 1
- 2 79
63
41
- 1 8- 1 3
10
- 1
- 1 02528
613
Com-moditydealers
- 4 2 1722
- 6 3 4662
- 6 3 2380
- 3 6 3
6645
124
17181418
71023
6
1715204032
Salesfinance
com-panies
6330
- 2 1 7544
- 9 0- 1 3 8
- 1 7 5
- 1 4- 4 4- 8 4
8- 2 5
- 811
- 2 1- 1 3
- 3- 7
10- 8- 8
- 4 4- 3 5
Publicutilities
(incl.trans-porta-tion)
175351
- 2- 5 7
8418
126
- 8 8- 1 6
- 4 8- 1 6
- 7- 1 7
- 7- 4
— 1610
4- 211
- 4- 9
Con-struc-tion
44- 9 8
1813
18- 2 3
71
16192
11
5
8335
- 316
- 42
Allothertype9
ofbusiness
837
- 2 8191
- 898
106
- 2 93
81
- 2 84
- 1 16
- 2 015
- 211
212
415
12
Netchangesclassi-
fied
1862,769
-5462,494
-360433
-1 ,314
-245- 6 4229
-102- 3 9- 6 8- 3 6
- 2 531
- 7 12
3413
180- 810
Comm'I.ind'l,and
agr'l.change—
totals
182,372
-6372,435
-593583
-1 ,496
-360-751
242
-156- 8 1- 8 9- 3 4
-75459
- 7 014
2531
194- 1 8
10
1 Sample includes about 220 weekly reporting member banks reporting changes in their larger loans; these banks hold over 90 per cent oftotal commercial and industrial loans of all weekly reporting member banks and nearly 70 per cent of those of all commercial banks.
2Figures for other than weekly periods are based on weekly changes during period.'Net change at all banks in weekly reporting series, according to the old series in 1951 and the revised series thereafter. For description of
revisions in the weekly reporting series see BULLETIN for April 1953, p. 357.
COMMERCIAL PAPER AND BANKERS' ACCEPTANCES OUTSTANDING[In millions of dollars)
End of month
1948—December1949—December1950—December1951—December1952—December
1953—AugustSeptember... .OctoberNovemberDecember
1954—JanuaryFebruaryMarch
MayJuneJulyAugust
Commer-cial
paperout-
standing1
269257333434539
451475535582552
620701720672618656749794
Dollar acceptances outstanding
Totalout-
standing
259272394490492
478515517534574
586545580623616589589563
Held by
Accepting banks
Total
146128192197183
148159160170172
195185198228227220205198
Ownbills
7158
114119126
108110122125117
144149149165171164164155
Billsbought
7670787957
4049384555
5136506356564143
FederalReserve
Banks (foraccount
of foreigncorre-
spondents)
311212120
2526232024
17101317141495
Others
109133180272289
304329334344378
373350369379374355376360
Based on
Importsinto
UnitedStates
164184245235232
211237227246274
266238247270277246225205
Exportsfrom
UnitedStates
574987
133125
128135145139154
157151139142143143136134
Dollarex-
change
1
22339
6466564929
4544473836609275
Goods stored in orshipped between
points in
UnitedStates
2530285564
3640565975
7371
1071271159691
101
Foreigncountries
129
324432
3838344143
4641394645434647
*As reported by dealers; includes some finance company paper sold in open market.Back figures.—See Banking and Monetary Statistics, Table 127, pp. 465-467; for description see p. 427.
1078 FEDERAL RESERVE BULLETIN
Digitized for FRASER http://fraser.stlouisfed.org/ Federal Reserve Bank of St. Louis
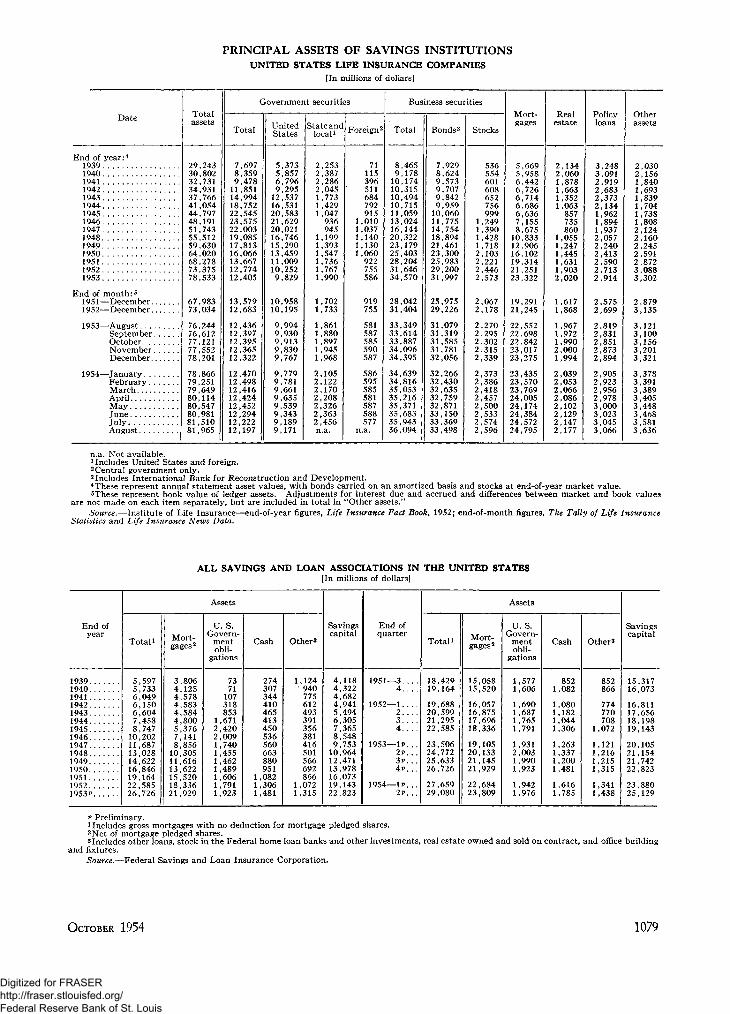
PRINCIPAL ASSETS OF SAVINGS INSTITUTIONSUNITED STATES LIFE INSURANCE COMPANIES
[In millions of dollars]
End of1939.1940.19411942.19431944.19451946.19471948.19491950.1951.1952 .1953.
End of1951-
Date
year:4
month:5
—December1952—December
1953—AlienistSeptemberOctoberNovemberDpcemher
1954—TannarvFebruary . .MarchApril
JulyAugust
Totalassets
2930
3437414448
555964687378
6773
7676777778
7879798080808181
,243,802,731,931,766,054,797,191,743,512,630,020,278,375,533
,983,034
,244,612,121,552,201
,866,251,649,114,547,981,510965
Government securities
Total
7,6978,3599,478
11,85114,99418,75222,54523,57522,00319,08517,81316,06613,66712,77412,405
13,57912,683
12,43612,39712,39512,36512,322
12,47012,49812,41612,42412,45212,29412,22212,197
UnitedStates
5,3735,8576,7969,295
12,53716,53120,58321,62920,02116,74615,29013,45911,00910,2529,829
10,95810,195
9,9949,9309,9139,8309,767
9,7799,7819,6619,6359,5399,3439,1899,171
State anclocal1
2,2532,3872,2862,0451,7731,4291,047
936945
1,1991,3931,5471,7361,7671,990
1,7021,733
1,8611,8801,8971,9451,968
2,1052,1222,1702,2082,3262,3632,456n.a.
Foreign2
71115396511684792915
1,0101,0371,1401,1301,060
922755586
919755
581587585590587
586595585581587588577
n.a.
Business securities
Total
89
1010101011131620732528
34
7831
3333333434
343435
353S3536
,465,178,174,315,494,715,059,024,144,322,179,403,204,646,570
,042,404
,349,614,887,096,395
,639,816,053,216,371,683,943,094
Bonds3
789999
10111418712325?931
29
313131313?
373?373?32333333
,929,624,573,707,842,959,060,775,754,894,461,300,983,200,997
,975,226
,079,319,585,781,056
,266,430,635,759,871,150,369,498
Stocks
111122
2
72
2227
7
7
2722
536554601608652756999
,249,390,428,718,103,221,446,573
,067,178
,270,295,302,315,339
,373,386,418,457,500533
,574,596
Mort-gages
5,6695,9586,4426,7266,7146,6866 6367,1558 675
10,83312 90616,10219,31421,25123,322
19,29121,245
22,55222,69822,84223,01723,275
23,43523,57023,76924,00524,17424,38424,57224,795
Realestate
221111
111112
11
11121
7
222
22
,134,060878
,663352
,063857735860
,055,247,445,631,903,020
,617,868
,967,972,990,000,994
,039,053,066,086,102,129,147,177
Policyloans
337
2
2
1129
22
2
92
9
7
27
779
73333
,248,091,919,683373
,134962
,894937
,057240
,413,590,713,914
,575,699
,819,831,851,873,894
,905,923,956,978,000,023,045,066
Otherassets
2,0302,156L 8401,693L 8391,704
7.3 X1,8082 1242,1602 2452,5912,8723 0883,302
2 - 879
•x
~\
7
3
13
33
M35
,121,100,156,201,321
378,391389
,405,448468
,581,636
n.a. Not available.1 Includes United States and foreign.2Central government only.3 Includes International Bank for Reconstruction and Development.4These represent annual statement asset values, with bonds carried on an amortized basis and stocks at end-of-year market value.5These represent book value of ledger assets. Adjustments for interest due and accrued and differences between market and book values
are not made on each item separately, but are included in total in "Other assets."Source.—Institute of Life Insurance—end-of-year figures, Life Insurance Fact Book, 1952; end-of-month figures, The Tally of Life Insurance
Statistics and Life Insurance News Data.
ALL SAVINGS AND LOAN ASSOCIATIONS IN THE UNITED STATES[In millions of dollars]
End ofyear
193919401941194219431944194519461947194819491950195119521953?
Assets
Total1
5,5975,7336,0496,1506,6047,4588,747
10,20211,68713,02814,62216,84619,16422,58526,726
Mort-gages2
3,8064,1254,5784,5834,5844,8005,3767,1418,856
10,30511,61613,62215,52018,33621,929
U. S.Govern-
mentobli-
gations
7371
107318853
1,6712,4202,0091,7401,4551,4621,4891,6061,7911,923
Cash
274307344410465413450536560663880951
1,0821,3061,481
Others
1,124940775612493391356381416501566692866
1,0721,315
Savingscapital
4,1184,3224,6824,9415,4946,3057,3658,5489,753
10,96412,47113,97816,07319,14322,823
End ofquarter
1951—3. . . .4
1952—123 . . . .4. . . .
1953—1P...2 P . . .3 P . . .4 P . . .
1954—1 P . . .2 P . . .
Assets
Total i
18,42919,164
19,68820,59921,29522,585
23,50624,77225,63326,726
27,65929,080
Mort-gages2
15,05815,520
16,05716,87517,69618,336
19,10520,13321,14521,929
22,68423,809
U. S.Govern-
mentobli-
gations
1,5771,606
1,6901,6871,7651,791
1,9312,0031,9901,923
1,9421,976
Cash
8521,082
1,0801,1821,0441,306
1,2631,3371,2001,481
1,6161,785
Others
852866
774770708
1,072
1,1211,2161,2151,315
1,3411,438
Savingscapital
15,31716,073
16,81117,65618,19819,143
20,10521,15421,74222,823
23,88025,129
P Preliminary.1 Includes gross mortgages with no deduction for mortgage pledged shares.2Net of mortgage pledged shares.3 Includes other loans, stock in the Federal home loan banks and other investments, real estate owned and sold on contract, and office building
and fixtures.Source.—Federal Savings and Loan Insurance Corporation.
OCTOBER 1954 1079
Digitized for FRASER http://fraser.stlouisfed.org/ Federal Reserve Bank of St. Louis
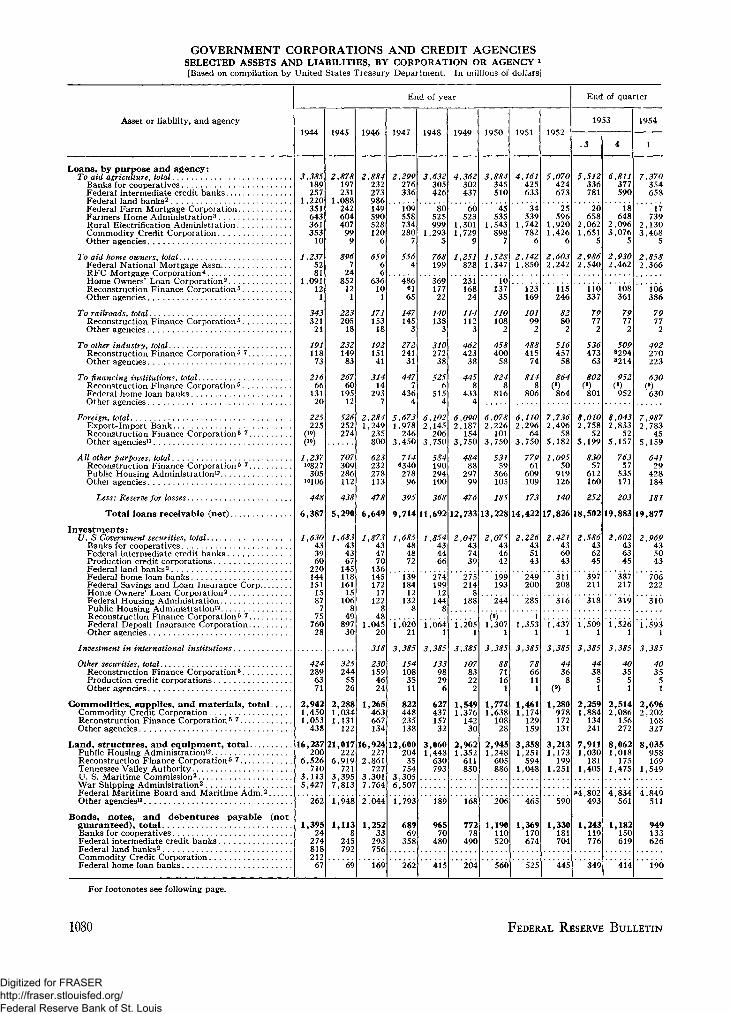
GOVERNMENT CORPORATIONS AND CREDIT AGENCIESSELECTED ASSETS AND LIABILITIES, BY CORPORATION OR AGENCY *•[Based on compilation by United States Treasury Department. In millions of dollars]
Asset or liability, and agency
End of year
1944 1945 1946 1947 1948 1949 1950 1952
End of quarter
1953 1954
Loans, by purpose and agency:To aid agriculture, total
Banks for cooperativesFederal intermediate credit banksFederal land banks2
Federal Farm Mortgage Corporation..Farmers Home Administration3
Rural Electrification Administration. .Commodity Credit CorporationOther agencies
To aid home owners, totalFederal National Mortgage AssnRFC Mortgage Corporation4
Home Owners' Loan Corporation2
Reconstruction Finance Corporation5.Other agencies
To railroads, totalReconstruction Finance Corporation5. .Other agencies
To other industry, totalReconstruction Finance Corporation 5 7 .Other agencies
To financing institutions, totalReconstruction Finance Corporation5.Federal home loan banksOther agencies
Foreign, totalExport-Import BankReconstruction Finance Corporation5 7 .Other agencies11
All other purposes, totalReconstruction Finance Corporation 5 7 .Public Housing Administration12
Other agencies
Less: Reserve for losses
Total loans receivable (net).
Investment in international institutions.
Other securities, totalReconstruction Finance Corporation 5 .Production credit corporationsOther agencies
Commodities, supplies, and materials, total.Commodity Credit CorporationReconstruction Finance Corporation 5 7
Other agencies
Land, structures, and equipment, totalPublic Housing Administration12
Reconstruction Finance Corporation5 7
Tennessee Valley AuthorityU. S. Maritime Commission2
War Shipping Administration2
Federal Maritime Board and Maritime Adm.2.Other agencies13
3,385189257
1,220351643361353
10
1,2375281
1,09112
1
343321
21
19111873
21666
13120
225225
0°)(10)
2,878197231
1,088242604407
999
8967
24852
121
223205
18
23214983
26760
19512
526252274
Investments:U. S Government securities, total
Banks for cooperativesFederal intermediate credit banksProduction credit corporationsFederal land banks2
Federal home loan banksFederal Savings and Loan Insurance CorpHome Owners' Loan Corporation2
Federal Housing AdministrationPublic Housing Administration12
Reconstruction Finance Corporation5 7
Federal Deposit Insurance CorporationOther agencies
1,237"827
305
"106
448
6,387
1,630433960
220144151
1587
775
76028
707309286112
438
5,290
1,683434367
145118161
15106
849
89730
4242896371
2,9421,4501,053
438
325244
5526
2,2881,0341,131
122
2,884232273986149590528120
6
65966
636101
171153
18
19215141
31414
2937
2,2841,249
235800
623232278113
478
6,649
1,873434770
13614517217
1228
481,045
20
318
2301594624
1,265463667134
2,299276336
3,632305426
4,362302437
3,8345510
4,161425633
5,070424673
5,512336781
6,811377590
7,370354658
109558734280
7
5564
80525999
1,2935
60523
1,3011,729
9
45535
1,543898
7.
34539
1,742782
6
25596
1,9201,426
6
20658
2,0621,651
5
18648
2,0963,076
5
17739
2,1303,468
5
768 1,251199 828
1,528 2,142 2,6031,347 ,850 2,242
2,986 2,930 2,8582,540 2,462 2,366
4866165
147145
3
27224131
4477
4364
5,6731,978
2463,450
7146340278
96
395
9,714
1,685484872
36917722
140138
3
31027238
5256
5154
6,1022,145
2063,750
584190294100
368
23116824
114112
3
462423
38
4458
4334
6,0902,187
1543,750
48488
29799
476
1013735
110108
2
458400
58
8248
816
123169
10199
2
488415
74
8148
806
115246
82802
516457
58
864
864
110337
79772
53647363
802(9)801
108361
79772
50982948214
P52
952
106386
79772
492270223
630(9)630
11,692 12,733
1,854434466
2,047437439
6,0782,226
1013,750
53159
366
105
185
13,228
2,075434642
6,1102,296
643,750
77961
609109
173
7,7362,496
585,182
1,09550
919126
140
14,422 17,826
2,226435143
2,421436043
8,0102,758
525,199
83057
612
160
252
18,502
2,586436245
8,0432,833
525,157
76357
535
171
203
19,883
2,602436345
7,9872,783
455,159
64129
428
184
181
19,877
2,969435043
16,237 21,017 16200
6,526710
3,1135,427
2226,919
7213,3957,813
,924227
2,861727
3,3017,764
13918412
132
1,02021
3,385
1541083511
822448235138
12,600204
35754
3,3056,507
27419912
144
1,0641
3,385
1339829
6
62743715732
3,0601,448
630793
275214
188
199193
249200
311208
397211
387217
706222
244 285 316 319 310
1,205
1
3,385
1078322
21,5491,376
14230
2,9621,352
611830
()1,307
1
3,385
71161
1,7741,638
10828
2,9451,248
605886
1,3531
3,385
7866111
1,4611,174
129159
3,3581,251
5941,048
1,4371
3,385
1,280978172131
3,2131,173
1991,251
1,5091
3,385
4438
51
2,2591,884
134241
7,9111,030
1811,405
1,5261
3,385
4035
51
2,5142,086
156272
8,0621,018
1751,475
1,593
1
3,385
4035
51
2,6962,202
168327
8,035958169
1,549
Bonds, notes, and debentures payableguaranteed), totalBanks for cooperativesFederal intermediate credit banksFederal land banks2
Commodity Credit CorporationFederal home loan banks
(not
262
1,39524
27481821267
1,948
1,1138
245792
2,044
1,25233
293756
1,793
68969
358
189
96570
480
168
77278
490
206
1,190110520
465
1,369170674
590
1,330181704
P 4 , 8 0 2493
1,243119776
4,834561
1,182150619
4,849511
949133626
69 169 262 415 204 560 445 349 414 190
For footonotes see following page.
1080 FEDERAL RESERVE BULLETIN
Digitized for FRASER http://fraser.stlouisfed.org/ Federal Reserve Bank of St. Louis
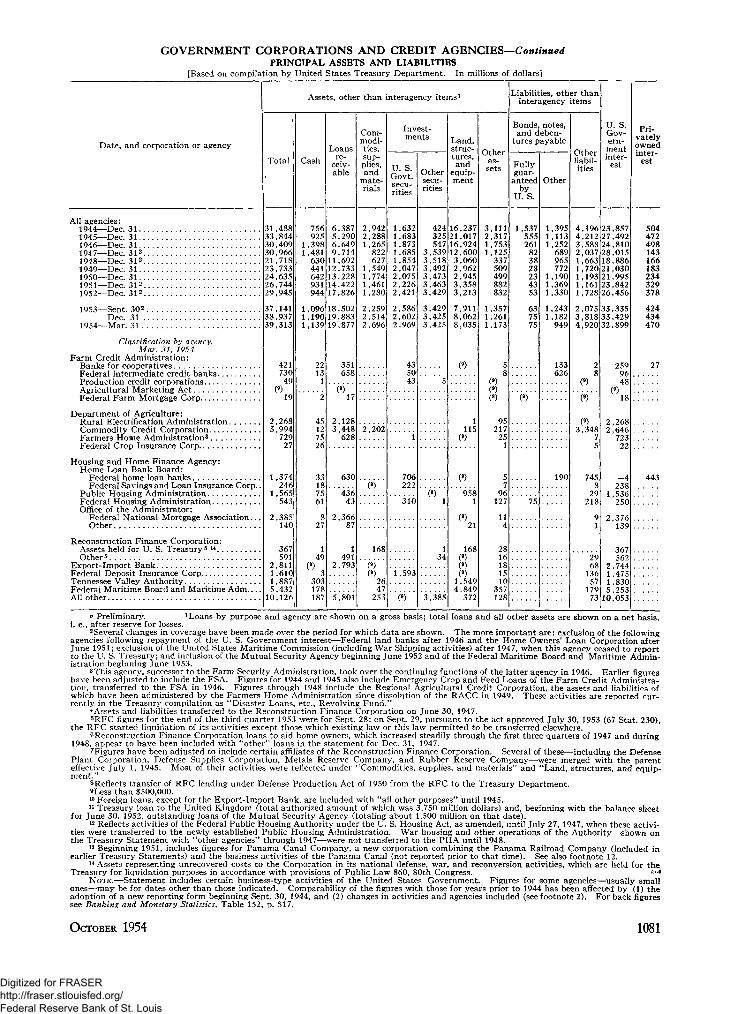
GOVERNMENT CORPORATIONS AND CREDIT AGENCIES—ContinuedPRINCIPAL ASSETS AND LIABILITIES
[Based on compilation by United States Treasury Department. In millions of dollars]
Date, and corporation or agency
Assets, other than interagency items1
Total Cash
Loansre-
ceiv-able
Com-modi-ties,sup-plies,and
mate-rials
Invest-ments
U. S.Govt.secu-rities
Othersecu-rities
Land,struc-tures,and
equip-ment
Otheras-sets
Liabilities, other thaninteragency items
Bonds, notes,and deben-
tures payable
Fullyguar-
anteedby
U. S.
Other
Otherliabil-ities
U. S.Gov-ern-mentinter-
est
Pri-vatelyownedinter-
est
All agencies:1944—Dec. 311945—Dec. 311946—Dec. 311947—Dec. 312
1948—Dec. 312
1949—Dec. 311950—Dec. 311951—Dec. 312
1952—Dec. 312
1953—Sept. 302
Dec. 311954—Mar. 31
Classification bv agency,Mar. 31, 1954
Farm Credit Administration:Banks for cooperativesFederal intermediate credit banksProduction credit corporationsAgricultural Marketing ActFederal Farm Mortgage Corp
31,48833,84430,40930,96621,71823,73324,63526,74429,945
37,14138,93739,313
42173049
756925
1,3981,481
6,387290
6,6499,714
630 11,69212,73313,22814,42217,826
441642931944
1,0961,1901,139
18,50219,88319,877
351658
2,9422,2881,265822627
1,5491,7741,4611,280
2,2592,5142,696
1,6321,6831,8731,6851,8542,0472,0752,2262,421
2,5862,6022,969
424 16,237325 21,017547
3,5393,5183,4923,4733,4633,429
3,4293,4253,425
16,92412,600
,0602,9622,9453,3583,213
7,9118,0628,035
3,1112,3171,7531,125
337509499882832
1,3571,2611,173
1,537555261823828234353
6375
1,3951,1131,252689965772
1,1901,3691,330
1,2431,182949
133626
4,1964,2123,5882,0371,6631,720 211,1931,1611,728 26
23,85727,49224,81028,01518,886
,03021,99523,842
,456
2,0753,8184,920
Department of Agriculture:Rural Electrification AdministrationCommodity Credit CorporationFarmers Home Administration3
Federal Crop Insurance Corp
Housing and Home Finance Agency:Home Loan Bank Board:
Federal home loan banksFederal Savings and Loan Insurance Corp.
Public Housing AdministrationFederal Housing AdministrationOffice of the Administrator:
Federal National Mortgage Association..Other
Reconstruction Finance Corporation:Assets held for U. S. Treasury 5 "Other 5
Export-Import BankFederal Deposit Insurance CorpTennessee Valley AuthorityFederal Maritime Board and Maritime Adm...All other
2,2685,994
72927
1,374246
1,565543
2,3
367591
2,8111,6101,15,432
10,126
27
303178187
17
2,1283,448
6282,202
1115
630
43643
2,36687
1491
2,793
706222
310
168
9581
168
5,801
2647
253
1,593
3,385
()1,5494,849372
95217251
57
96127
114
2816181510
357128
190
75
()3,348
75
745
29218
29681365717973
33,33533,42932,899
2599648
2,2682,646
72322
-4238
1,536250
2,376139
367562
2,7441,4751,8305,25310,053
504472498143166183234329378
424434470
27
p Preliminary. 1 Loans by purpose and agency are shown on a gross basis; total loans and all other assets are shown on a net basis,i. e., after reserve for losses.
2Several changes in coverage have been made over the period for which data are shown. The more important are: exclusion of the followingagencies following repayment of the U. S. Government interest—Federal land banks after 1946 and the Home Owners' Loan Corporation afterJune 1951; exclusion of the United States Maritime Commission (including War Shipping activities) after 1947, when this agency ceased to reportto the U. S. Treasury; and inclusion of the Mutual Security Agency beginning June 1952 and of the Federal Maritime Board and Maritime Admin-istration beginning June 1953.
3 This agency, successor to the Farm Security Administration, took over the continuing functions of the latter agency in 1946. Earlier figureshave been adjusted to include the FSA. Figures for 1944 and 1945 also include Emergency Crop and Feed Loans of the Farm Credit Administra-tion, transferred to the FSA in 1946. Figures through 1948 include the Regional Agricultural Credit Corporation, the assets and liabilities ofwhich have been administered by the Farmers Home Administration since dissolution of the RACC in 1949. These activities are reported cur-rently in the Treasury compilation as "Disaster Loans, etc., Revolving Fund."
4 Assets and liabilities transferred to the Reconstruction Finance Corporation on June 30, 1947.5RFC figures for the end of the third quarter 1953 were for Sept. 28; on Sept. 29, pursuant to the act approved July 30, 1953 (67 Stat. 230),
the RFC started liquidation of its activities except those which existing law or this law permitted to be transferred elsewhere.6Reconstruction Finance Corporation loans to aid home owners, which increased steadily through the first three quarters of 1947 and during
1948, appear to have been included with "other" loans in the statement for Dec. 31, 1947.7Figures have been adjusted to include certain affiliates of the Reconstruction Finance Corporation. Several of these—including the Defense
Plant Corporation, Defense Supplies Corporation, Metals Reserve Company, and Rubber Reserve Company—were merged with the parenteffective July 1, 1945. Most of their activities were reflected under "Commodities, supplies, and materials" and "Land, structures, and equip-ment."
8Reflects transfer of RFC lending under Defense Production Act of 1950 from the RFC to the Treasury Department.9Less than $500,000.10 Foreign loans, except for the Export-Import Bank, are included with "all other purposes" until 1945.11 Treasury loan to the United Kingdom (total authorized amount of which was 3,750 million dollars) and, beginning with the balance sheet
for June 30. 1952, outstanding loans of the Mutual Security Agency (totaling about 1,500 million on that date).12 Reflects activities of the Federal Public Housing Authority under the U. S. Housing Act, as amended, until July 27, 1947, when these activi-
ties were transferred to the newly established Public Housing Administration. War housing and other operations of the Authority—shown onthe Treasury Statement with "other agencies" through 1947—were not transferred to the PHA until 1948.
13 Beginning 1951, includes figures for Panama Canal Company, a new corporation combining the Panama Railroad Company (included inearlier Treasury Statements) and the business activities of the Panama Canal (not reported prior to that time). See also footnote 12.
14 Assets representing unrecovered costs to the Corporation in its national defense, war, and reconversion activities, which are held for theTreasury for liquidation purposes in accordance with provisions of Public Law 860, 80th Congress. P••**
NOTE.—Statement includes certain business-type activities of the United States Government. Figures for some agencies—usually smallones—may be for dates other than those indicated. Comparability of the figures with those for years prior to 1944 has been affected by (1) theadoption of a new reporting form beginning Sept. 30, 1944, and (2) changes in activities and agencies included (see footnote 2). For back figuressee Banking and Monetary Statistics, Table 152, p. 517.
OCTOBER 1954 1081
Digitized for FRASER http://fraser.stlouisfed.org/ Federal Reserve Bank of St. Louis
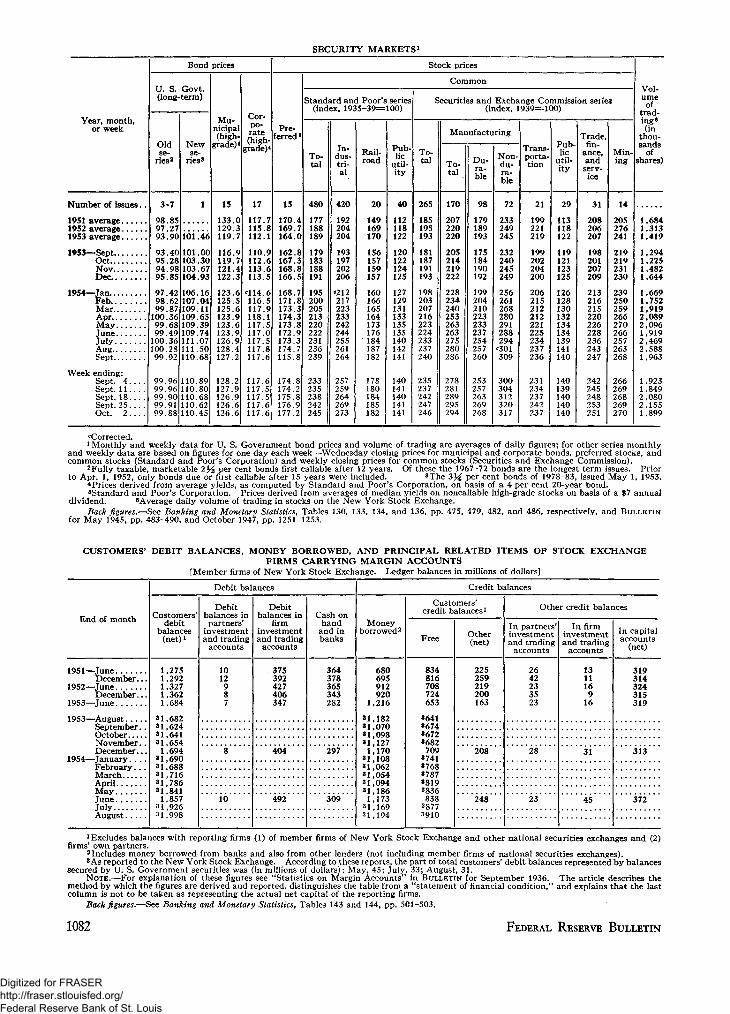
SECURITY MARKETS1
Year, month,or week
Number of issues..
1951 average1952 average1953 average
1953—SeptOctNovDec
1954—jan
FebMarApr.MayJuneJulyAugSept
Week ending:Sept. 4Sept. 11Sept. 18Sept. 2 5 . . . .Oct. 2
Bond
U. S. Govt.(long-term)
Oldse-
ries2
3-7
98.8597.2793.90
93.4095.2894 9895.85
97.4298 6299.87
100 3699.6899 49
100 36100.2899.92
99.9699.9699.9099.9199.88
Newse-
ries3
1
101.00103.30103.67104.93
106.16107 04109.11109 65109.39109 74111.07111.50110.68
110.89110.80110.68110.62110.45
prices
Mu-nicipal(high-
grade)*
15
133.0129.3119.7
116.9119.7121.4122.3
123.6125.5125.6123 9123.6123 9126.9128.4127.2
128.2127.9126.9126.6126.6
Cor-po-rate(high-
grade)4
17
117.7115.8112.1
110.9112.6113.6113.5
"114.6116 5117.9118 1117.5117 0117.5117.8117.6
117.6117.5117.5117.6117.6
Stock prices
Pre-ferred*
15
170.4169.7164.0
162.8167.3168.8166.5
168.7171.8173.3174.3173.8172 9173.3174.7115.8
174.8174.2175.8176.9177.2
Common
Standard and Poor's series(index. 1935-39=100)
To-tal
480
177188189
179183188191
195200205213220222231236239
233235238242245
In-dus-tri-al
420
192204204
193197202206
"212217223233242244255261264
257259264269273
Rail-road
20
149169170
156157159157
160166165164173176184187182
178180184185182
Pub-lic
util-ity
40
112118122
120122124125
127129131133135135140142141
140141140141141
Securities and Exchange Commissi(index. 1939—100)
To-tal
265
185195193
181187191193
198203207216223224233237240
235237242247246
Manufacturing
To-tal
170
207220220
205214219222
228234240253263263275280286
278281289295294
Du-ra-ble
98
179189193
175184190192
199204210223233237254257260
253257263269268
Non-du-ra-ble
72
233249245
232240245249
256261268280291288294
"301309
300304312320317
Trans-porta-tion
21
199221219
199202204200
206215212212221225234237236
231234237242237
Pub-lic
util-ity
29
113118122
119121123125
126128130132134134139141140
140139140140140
on series
Trade,fin-
ance,and
serv-ice
31
208206207
198201207209
213216215220226228236243247
242245248253251
Min-ing
14
205276241
219219231230
239250259266270266257263268
266269268269270
Vol-umeof
trad-ing6
(inthou-sands
ofshares)
1,6841,3131,419
1,2941,2251,482
.644
1,6691,7521,9192,0892,0961,9192,4692,5881,963
1,9231,8492,0802,1551,899
cCorrected.1 Monthly and weekly data for U. S. Government bond prices and volume of trading are averages of daily figures; for other series monthly
and weekly data are based on figures for one day each week—Wednesday closing prices for municipal and corporate bonds, preferred stocks, andcommon stocks (Standard and Poor's Corporation) and weekly closing prices for common stocks (Securities and Exchange Commission).
2Fully taxable, marketable 2% per cent bonds first callable after 12 years. Of these the 1967-72 bonds are the longest term issues. Priorto Apr. 1, 1952, only bonds due or first callable after 15 years were included. 3The 3 ^ per cent bonds of 1978-83, issued May 1, 1953.
4 Prices derived from average yields, as computed by Standard and Poor's Corporation, on basis of a 4 per cent 20-year bond.5Standard and Poor's Corporation. Prices derived from averages of median yields on noncallable high-grade stocks on basis of a $7 annual
dividend. 6Average daily volume of trading in stocks on the New York Stock Exchange.Back figures.—See Banking and Monetary Statistics, Tables 130, 133, 134, and 136, pp. 475, 479, 482, and 486, respectively, and BULLETIN
for May 1945, pp. 483-490, and October 1947, pp. 1251-1253.
CUSTOMERS' DEBIT BALANCES, MONEY BORROWED, AND PRINCIPAL RELATED ITEMS OF STOCK EXCHANGEFIRMS CARRYING MARGIN ACCOUNTS
[Member firms of New York Stock Exchange. Ledger balances in millions of dollars]
End of month
1951—JuneDecember...
1952—JuneDecember...
1953—June
1953—AugustSeptember. .OctoberNovember..December...
1954—January.. . .February . . .MarchAprilMayJuneJulyAugust
Debit balances
Customers'debit
balances(net)i
1,2751.2921,3271,3621,684
31.68231,62431,64131,654
1.69431,69031,68831,71631,78631,841
1,85731,92631,998
Debitbalances in
partners'investmentand trading
accounts
1012987
8
10
Debitbalances in
firminvestmentand trading
accounts
375392427406347
404
492
Cash onhand
and inbanks
364378365343282
297
309
Credit balances
Moneyborrowed2
680695912920
1,216
31,18231,07031,09831,127
1,17031,10831,06231,05431,09431,186
1,17331,16931,194
Customers'credit balances1
Free
834816708724653
364136743672*682709
37413 7683 78738193836838
38773910
Other(net)
225259219200163
208
248
Other credit balances
In partners'investmentand trading
accounts
2642233523
28
23
In firminvestmentand trading
accounts
1311169
16
31
45
In capitalaccounts
(net)
319314324315319
313
372
1 Excludes balances with reporting firms (1) of member firms of New York Stock Exchange and other national securities exchanges and (2)firms' own partners.
2Includes money borrowed from banks and also from other lenders (not including member firms of national securities exchanges).3As reported to the New York Stock Exchange. According to these reports, the part of total customers' debit balances represented by balances
secured by U. S. Government securities was (in millions of dollars): May, 45; July, 33; August, 31.NOTE.—For explanation of these figures see "Statistics on Margin Accounts" in BULLETIN for September 1936. The article describes the
method by which the figures are derived and reported, distinguishes the table from a "statement of financial condition," and explains that the lastcolumn is not to be taken as representing the actual net capital of the reporting firms.
Back figures.—See Banking and Monetary Statistics, Tables 143 and 144, pp. 501-503.
1082 FEDERAL RESERVE BULLETIN
Digitized for FRASER http://fraser.stlouisfed.org/ Federal Reserve Bank of St. Louis
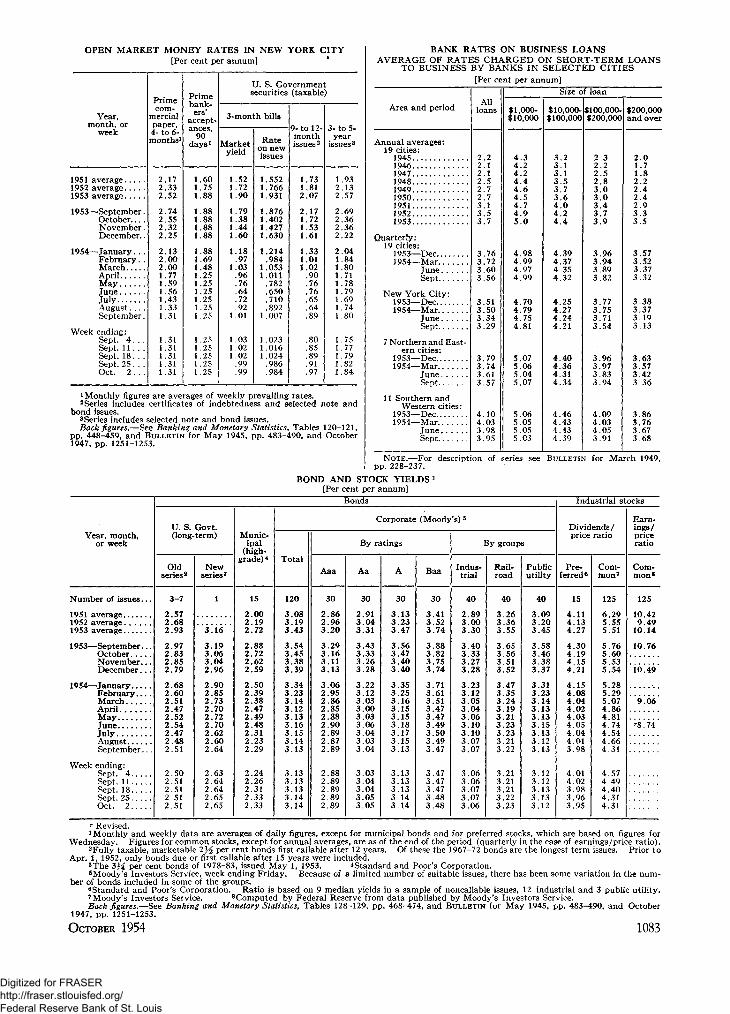
OPEN MARKET MONEY RATES IN NEW YORK CITY[Per cent per annum]
Year,month, or
week
1951 average1952 average1953 average
1953—September.OctoberNovember.December..
1954—January...February. .MarchAprilMayJuneJulyAugust.. . .September.
Week ending:Sept. 4 . . .Sept. 11. . .Sept. 18. . .Sept. 2 5 . . .Oct. 2 . . .
Primecom-
mercialpaper,4- to 6-months1
2.172.332.52
2.742.552.322.25
2.132.002.001.771.591.561.431.331.31
1.311.311.311.311.31
Primebank-
ers'accept-ances,
90days1
111
1
]
1\111
1.601.751.88
L .88L .88L .88L.88
1.88L.691.48.25
L .251.25.25
L .25.25
.25
.25
.25
.25
.25
U. S. Governmentsecurities (taxable)
3-month bills
Marketyield
1
\\\
L.52L.721.90
L .79L.38L.44L.60
L.18.97
1.03.96.76.64.72.92
L .01
.03
.02L.02.99.99
Rateon newissues
1.5521.7661.931
1.8761.4021.4271.630
1.214.984
1.0531.011
.782
.650
.710
.8921.007
1.0231.0161.024
.986
.984
9- to 12-monthissues2
1L .73L.812.07
' .17L.72L .53L .61
L33L.01L.02.90.76.76.65.64.89
.80
.85
.89
.91
.97
3- to 5-year
issues3
1.932.132.57
2.692.362.362.22
2.041.841.801.711.781.791.691.741.80
1.751.771.791.821.84.
1 Monthly figures are averages of weekly prevailing rates.2Series includes certificates of indebtedness and selected note and
bond issues.3 Series includes selected note and bond issues.Back figures.—See Banking and Monetary Statistics, Tables 120-121,
pp. 448-459, and BULLETIN for May 1945, pp. 483-490, and October1947, pp. 1251-1253.
BANK RATES ON BUSINESS LOANSAVERAGE OF RATES CHARGED ON SHORT-TERM LOANS
TO BUSINESS BY BANKS IN SELECTED CITIES[Per cent per annum]
Area and period
Annual averages:19 cities:194519461947194819491950195119521953
Quarterly:19 cities:
1953—Dec1954—Mar
JuneSept
New York City:1953—Dec1954—Mar
JuneSept
7 Northern and East-ern cities:
1953—Dec1954—Mar
JuneSept
11 Southern andWestern cities:
1953—Dec1954—Mar
JuneSept
Allloans
2.22.12.12.52.72.73.13.53.7
3.763.72
.60
.56
3.513.503.343.29
3.793.743.613.57
4.104.033.983.95
Size of loan
$1,000-$10,000
4.34.24.24.44.64.54.74.95.0
4.984.994.974.99
4.704.794.754.81
5.075.065.045.07
5.065.055.055.03
$10,000- $100,000-$100,000
3.23.13.13.53.73.64.04.24.4
4.394.374.354.32
4.254.274.244.21
4.404.364.314.34
4.464.434.434.39
$200,000
2.32.22.52.83.03.03.43.73.9
3.963.943.893.82
3.773.753.713.54
3.963.973.833.94
4.094.034.053.91
$200,000and over
2.01.71.82.22.42.42.93.33.5
3.573.523.373.32
3.383.373.193.13
3.633.573.423.36
3.863.763.673.68
NOTE.—For description of series see BULLETIN for March 1949,pp. 228-237.
BOND AND STOCK YIELDS i[Per cent per annum]
Year, month,or week
Number of issues...
1951 average1952 average1953 average
1953—September...OctoberNovember...December...
1954—JanuaryFebruaryMarchAprilMayJuneJulyAugustSeptember...
Week ending:Sept. 4Sept. 11Sept. 18Sept. 25Oct. 2
Bonds
U. S. Govt.(long-term)
Oldseries2
3-7
2.572.682.93
2.972.832.852.79
2.682.602.512.472.522.542.472.482.51
2.502.512.512.512.51
Newseries^
1
3.16
3.193.063.042.96
2.902.852.732.702.722.702.622.602.64
2.632.642.642.652.65
Munic-ipal
(high-grade) 4
15
2.002.192.72
2.882.722.622.59
2.502.392.382.472.492.482.312.232.29
2.242.262.312.332.33
Corporate (Moody's) 5
Total
120
3.083.193.43
3.543.453.383.39
3.343.233.143.123.133.163.153.143.13
3.133.133.133.143.14
By ratings
Aaa
30
2.862.963.20
3.293.163.113.13
3.062.952.862.852.882.902.892.872.89
2.882.892.892.892.89
Aa
30
2.913.043.31
3.433.333.263.28
3.223.123.033.003.033.063.043.033.04
3.033.043.043.053.05
A
30
3.133.233.47
3.563.473.403.40
3.353.253.163.153.153.183.173.153.13
3.133.133.133.143.14
Baa
30
3.413.523.74
3.883.823.753.74
3.713.613.513.473.473.493.503.493.47
3.473.473.473.483.48
By groups
Indus-trial
40
2.893.003.30
3.403.333.273.28
3.233.123.053.043.063.103.103.073.07
3.063.063.073.073.06
Rail-road
40
3.263.363.55
3.653.563.513.52
3.473.353.243.193.213.233.233.213.22
3.213.213.213.223.23
Publicutility
40
3.093.203.45
3.583.463.383.37
3.313.233.143.133.133.153.133.123.13
3.123.123.133.133.12
Industrial stocks
Dividends/price ratio
Pre-ferred 6
15
4.114.134.27
4.304.194.154.21
4.154.084.044.024.034.054.044.013.98
4.014.023.983.963.95
Com-mon7
125
6.295.555.51
5.765.605.535.54
5.285.295.074.864.814.744.544.664.31
4.574.494.404.314.31
Earn-ings/priceratio
Com-mon*
125
10.429.49
10.14
10.76
10.49
9.06
r8.74
r Revised.1 Monthly and weekly data are averages of daily figures, except for municipal bonds and for preferred stocks, which are based on figures for
Wednesday. Figures for common stocks, except for annual averages, are as of the end of the period (quarterly in the case of earnings/price ratio).2Fully taxable, marketable 2% per cent bonds first callable after 12 years. Of these the 1967-72 bonds are the longest term issues. Prior to
Apr. 1, 1952, only bonds due or first callable after 15 years were included.3The 3M per cent bonds of 1978-83, issued May 1, 1953. *Standard a n d Poor's Corporation.6Moody's Investors Service, week ending Friday. Because of a limited number of suitable issues, there has been some variation in the num-
ber of bonds included in some of the groups.6Standard and Poor's Corporation. Ratio is based on 9 median yields in a sample of noncallable issues, 12 industrial and 3 public utility.7Moody's Investors Service. 8Computed by Federal Reserve from data published by Moody's Investors Service.Back figures.—See Banking and Monetary Statistics, Tables 128-129, pp. 468-474, and BULLETIN for May 1945, pp. 483-490, and October
1947, pp. 1251-1253.
1083OCTOBER 1954
Digitized for FRASER http://fraser.stlouisfed.org/ Federal Reserve Bank of St. Louis
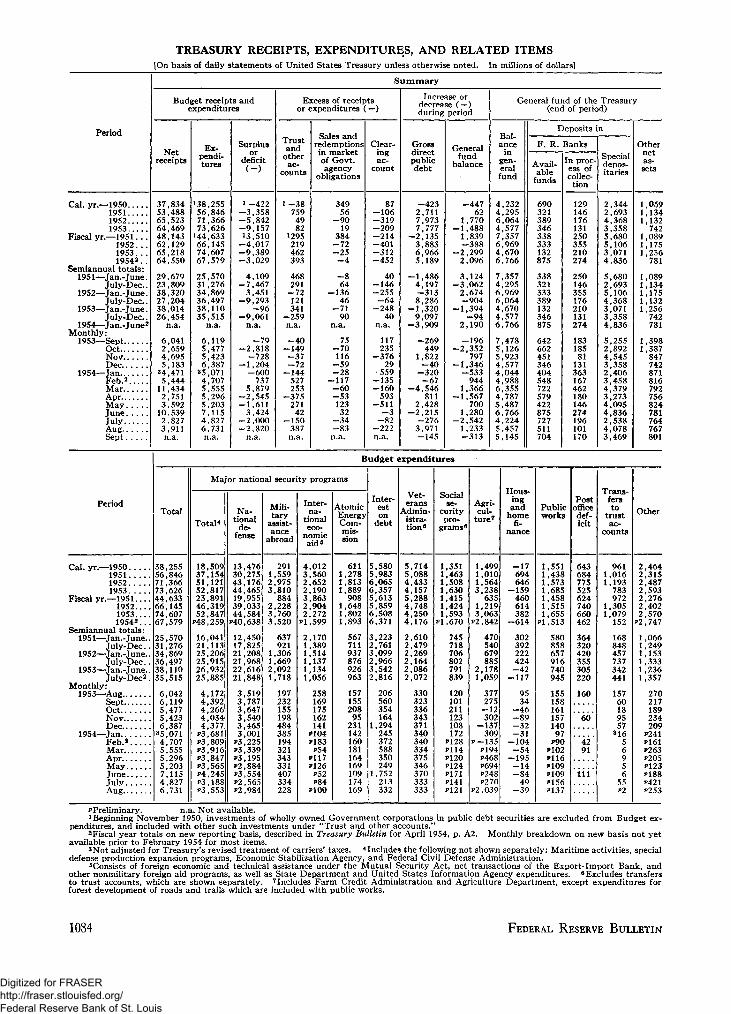
TREASURY RECEIPTS, EXPENDITURES, AND RELATED ITEMS[On basis of daily statements of United States Treasury unless otherwise noted. In millions of dollars]
Period
Cal. yr.—1950195119521953
Fiscal yr.—1951. . .1952.. .1953. . .19542. .
Semiannual totals:1951—Jan.-June.
July-Dec..1952—Jan.-June.
July-Dec..1953—Jan.-June.
July-Dec..1954—Jan.-June2
Monthly:1953—Sept
OctNov.Dec
1954—JanFeb.2
MarAprMayJuneJulyAugSept
Period
Cal. yr.—1950195119521953
Fiscal yr.—1951....1952... .1953.. . .19542...
Semiannual totals:1951—Jan.-June..
July-Dec. .1952—Jan.-June..
July-Dec. .1953—Jan.-June..
July-Dec2.Monthly:
1953—AugSeptOctNov, , .Dec
1954—JanFeb.2
MarAprMayJuneJulyAug
Summary
Budget receipts andexpenditures
Netreceipts
37,83453,48865,52364,46948,14362,12965,21864,550
29,67923,80938,32027,20438,01426,454
n.a.
6,0412,6594,6955,183
34,4715,444
11,4342,7513,592
10,5392,8273,911n.a.
Ex-pendi-tures
138,25556,84671,36673,626
144,63366,14574,60767,579
25,57031,27634,86936,49738,11035.515
n.a.
6,1195,4775,4236,387
35,0714,7075,5555,2965,2037,1154,8276,731n.a.
Surplusor
deficit(-)
1-422-3,358-5,842-9,15713,510
-4,017-9,389-3,029
4,109-7,467
3,451-9,293
-96-9,061
n.a.
- 7 9-2,818
-728-1,204
-600737
5,879-2,545-1,611
3,424-2,000-2,820
n.a.
Excess of receiptsor expenditures (—)
Trustand
otherac-
counts
i -387594982
1295219462393
468291
-72121341
-259n.a.
- 4 0-149-37-72
-144527253
-37527142
-150387n.a.
Sales andredemptionsin marketof Govt.agency
obligations
34956
- 9 019
384-72- 2 5
- 4
- 864
-13646
- 7 190
n.a.
75- 7 0116
- 5 9- 2 8
-117- 6 0- 5 312332
- 3 4- 8 3n.a.
Clear-ingac-
count
87-106-319-209-214-401-312-452
40-146-255- 6 4
-24840
n.a.
117235
-37629
559-135-160
593-511
- 3-82
-222n.a.
Increase ordecrease (—)during period
Grossdirectpublicdebt
-4232,7117,9737,777
-2,1353,8836,9665,189
-1,4864,197-3138,286
-1,3209,097
-3,909
-269449
1,822- 4 0
-320-67
-4,546811
2,428-2,215
-2763,971-145
Generalfund
balance
-44762
1,770-1,488
1,839-388
-2,2992,096
3,124—3,062
2,674-904
-1,394- 9 4
2,190
-196-2,352
797-1,346
-533944
1,366-1,567
7001,280
-2,5421,233-313
General fund of the Treasury(end of period)
Bal-ance
ingen-eralfund
4,2324,2956,0644,5777,3576,9694,6706,766
7,3574,2956,9696,0644,6704,5776,766
7,4785,1265,9234,5774,0444,9886,3554,7875,4876,7664,2245,4575,145
Deposits in
F. R. Banks
Avail-able
funds
690321389346338333132875
338321333389132346875
642662451346404548722579422875727511704
In proc-ess ofcollec-
t ion
129146176131250355210274
250146355176210131274
183185
81131363167462180146274196101170
Specialdepos-itaries
2,3442,6934,3683,3585,6805,1063,0714,836
5,6802,6935,1064,3683,0713,3584,836
5,2552,8924,5453,3582,4063,4584,3793,2734,0954.8362,5384,0783,469
Othernetas-sets
1,0691,1341,132
7421,0891,1751,256
781
1,0891,1341,1751,1321,256
742781
1,3981,387
847742871816792756824781764767801
Budget expenditures
Total
38,25556,84671,36673,62644,63366,14574,60767,579
25,57031,27634,86936,49738,11035,515
6,0426,1195,4775,4236,387
35,0714,7075,5555,2965,2037,1154,8276,731
Major national security programs
Total*
18,50937,15451,12152,81725,89146,31952,847
P48.259
16,04121,11325,20625,91526,93225,885
4,1724,3924,2664,0344,377
P3,681P3.809P3.916P3.847P3,565P4.245P3.188P3.553
Na-tional
de-fense
13,47630,27543,17644,46519,95539,03344,584
P40.638
12,45017,82521,20821,96822,61621,848
3,5193,7873,6473,5403,4653,001
P 3 , 2 2 5P3.339P3,195P2.884P 3 , 554P2.565P 2 , 9 8 4
Mili-tary
assist-ance
abroad
2911,5592,9753,810
8842,2283,7603,520
637921
1,3061,6692,0921,718
197232155198484385194321343331407334228
Inter-na-
tionaleco-
nomicaid*
4,0123,5602,6522,1903,8632,9042,272
P I . 5 9 9
2,1701,3891,5141,1371,1341,056
258169175162141
*104P183
P54P117P126P52P84
P100
AtomicEnergyCom-mis-sion
6111,2781,8131,889
9081,6481,8021.893
567711937876926963
15715520895
231142160181164169109174169
Inter-eston
debt
5,5805,9836,0656,3575,6135,8596,5086,371
3,2232,7613,0992,9663,5422,816
206560354164
1,294245372588350249
1,752213332
Vet-erans
Admin-istra-tion*
5,7145,0884,4334,1575,2884,7484,2504,176
2,6102,4792,2692,1642,0862,072
330323336343371340340334375346370333333
Socialse-
curitypro-
grams8
1,3511,4631,5081,6301,4151,4241,593
Pl.670
745718706802791839
120101211123108172
P128P114P120P124P171P141P121
Agri-cul-
ture7
1,4991,0101,5643,238
6351,2193,063
P2.842
470540679885
2,1781,059
377275
-12302
-137309
P - 1 3 5P194P468P694P248P27O
P2.039
Hous-ingand
homefi-
nance
- 1 7694646
-159460614382
-614
302392222424
—42-117
9534
—46- 8 9-32- 3 1
-104- 5 4
-195- 1 4- 8 4
49-39
Publicworks
p
1,5511,4381,573L.6851,4581,5151,655L,513
580858657916740945
155158161157140
97P90
P102P116P109P109P156*>137
Postofficedef-icit
643684775525624740660462
364320420355305220
160
60
" 4 2 *91
'in'
Trans-fersto
trustac-
counts
9611,0161,193
783972
1,3051,079
152
168848457737342441
15760189557
31656956
55P2
Other
2,4642,3152,4872,5932,2762,4022,570
P2.747
1,0661,2491,1531,3331,2361,357
270217189234209
P241P161P263P205P123P188P421P253
pPreliminary. n.a. Not available.1 Beginning November 1950, investments of wholly owned Government corporations in public debt securities are excluded from Budget ex-
penditures, and included with other such investments under "Trust and other accounts."2Fiscal year totals on new reporting basis, described in Treasury Bulletin for April 1954, p. A2. Monthly breakdown on new basis not yet
available prior to February 1954 for most items.3Not adjusted for Treasury's revised treatment of carriers' taxes. 4 Includes the following not shown separately: Maritime activities, special
defense production expansion programs, Economic Stabilization Agency, and Federal Civil Defense Administration.5Consists of foreign economic and technical assistance under the Mutual Security Act, net transactions of the Export-Import Bank, and
other nonmilitary foreign aid programs, as well as State Department and United States Information Agency expenditures. 6 Excludes transfersto trust accounts, which are shown separately. 7 Includes Farm Credit Administration and Agriculture Department, except expenditures forforest development of roads and trails which are included with public works.
1084 FEDERAL RESERVE BULLETIN
Digitized for FRASER http://fraser.stlouisfed.org/ Federal Reserve Bank of St. Louis
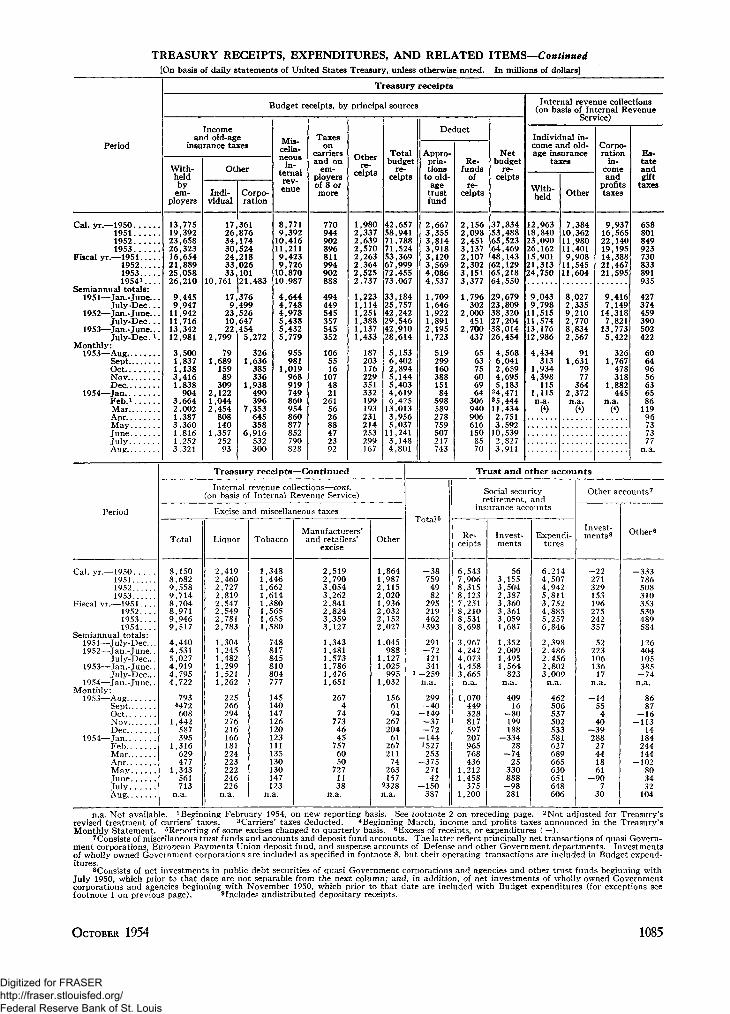
TREASURY RECEIPTS, EXPENDITURES, AND RELATED ITEMS—Continued[On basis of daily statements of United States Treasury, unless otherwise noted. In millions of dollars]
Period
Cal. yr.—1950195119521953
Fiscal yr.—1951 . . .19521953 . .19541 . . .
Semiannual totals:1951—Jan.-June...
July D e c . . .1952—Jan.-June...
July-Dec.. .1953—Jan.-June...
July-Dec.1 .Monthly:
1953—AugSeptOctNovDec
1954—janFeb.iMar.AprM a yJuneJulyAug
Period
Cal. yr.—1950195119521953 . . .
Fiscal yr.—195119521953. . . .1954
Semiannual totals:1951—July-Dec...1952—Jan.-June..
July-Dec..1953—Jan.-June..
July-Dec..1954—Jan.-June..
Monthly:1953—Aug
Sept.Oct.NovDec.
1954—JanFebMar. . .AprMayJuneTulvAug
Treasury receipts
Budget receipts, by principal sources
Incomeand old-age
insurance taxes
With-heldby
em-ployers
13,77519,39223,65826,32316,65421,88925,05826,210
9,4459,947
11,94211,71613,34212,981
3,5001,8371,1383,4161,838
9043,6642,0021 3873,3601,8161 2523,321
Other
Indi-vidual
17 ,26,34,30,24,3 3 ,3 3 ,
10,761
17,9,
23,10,22,
2,799
791,689
15989
3092,1221,0442,454
808140
1,357252
93
Corpo-ration
36187617452421802610121,483
376499526647454
5,272
3261,636
385336
1,938490396
7,353645358
6,916532300
Mis-cella-
in-ternal
enue
8,7719,392
10,41611,2119,4239,726
10,87010,987
4,6444,7484,9785,4385,4325,779
955981
1,019968919749860954860877852790828
Taxeson
carriersand on
em-ployersof 8 ormore
770944902896811994902888
494449545357545352
1065516
1074821
261562688472392
•A4.U —
re-ceipts
L9802,3372,6392,5702,2632,3642,5252.737
1,2231,1141,251L,388[,137,433
187203176229351332199193231214253299167
Totalbudget
re-ceipts
42,65758,94171,78871,52453,36967,99972,45573,067
33,18425,75742,24229,54642,91028,614
5,1536,4022,8945,1445,4034,6196,425
13,0133,9565,037
11,2413 1484,801
Treasury receipts—Continued
Internal revenue collections—cont.(on basis of Internal Revenue Service)
Total
8,1508,6829,5589,7148,7048,9719,9469,517
4,4404,5315,0274,9194,7954,722
793H72608
1,442587395
1 316629477
1,343561713
n.a.
Excise4 and miscellaneous taxes
Liquor
2,4192,4602,7272,8192,5472,5492,7812,783
1,3041,2451,4821,2991,5211,262
225266294276216166181224223222246226
n.a.
Tobacco
1,3481,4461,6621,6141,3801,5651,6551,580
748817845810804777
145140147126120123111135130130147123
n.a.
Manufacturers'and retailers'
excise
2,5192,7903,0543,2622,8412,8243,3593,127
1,3431,4811,5731,7861,4761,651
2674
74773
4645
7576050
7271138
n.a.
Other
11??1222
1
11
1
,864987115070936
,032,152,027
,045988
,127,025995
,032
1566194
?6720461
267211
74263157
n.a.
Deduct
Appro-pria-tions
to old-age
trustfund
2,6673,3553,8143,9183,1203,5694,0864,537
1,7091,6461,9221,8912,1951,723
519299160388151
84598589278759507217743
Re-funds
ofre-
ceipts
2,1562,0982,4513,1372,1072,3023,1513,377
1,796302
2,000451
2,700437
656375606964
306940906616150
8570
Netbudget
re-ceipts
37,83453,48865,52364,46948,14362,12965,21864,550
29,67923,80938,32027,20438,01426,454
4,5686,0412,6594,6955,183
24,47135,44411,4342 7513,592
10,5392 8273,911
Internal revenue collec(on basis of Internal Re
Service)
Individual in-come and old-age insurance
taxes
With-held
12,96318,84023,09026,16215,90121,31324,750
9,0439,798
11,51511,57413,17612,986
4,434313
1,9344,398
1151,115n.a.
(4)
Other
7,10,11 ,11,9,
It ,11 ,
8,2,9,2,8,2,
1
2
384362980401908S4S604
027335210770834567
91631
7977
364372
n.a.ro
Corpo-ration
in-comea n d
profitstaxes
9,93716,56522,14019,19514,38821,46721,595
9,4167,149
14,3187,821
13,7735,422
3261,767
478318
1,882445
n.a.(4)
tionsvenue
Es-tateandgift
taxes
658801849923730833891935
427374459390502422
60649656636586
11996737377
n.a.
Trust and other accounts
l
- 3 87594982
295219462
1393
291-72121341
-259n.a.
299—40
-149- 3 7- 7 2
-144!527253
-375271
42-150
387
Social securityretirement, and
insurance accounts
Re-ceipts
6,5437,9068,3158,1237,2518,2108,5318,698
3,9674,2424,0734,4583,665
n.a.
1,070449328817597207965768436
1,2121,458
3751,200
Invest-ments
563,1553,5042,3873,3603,3613,0591,687
1,3522,0091,4951,564
823n.a.
40916
- 8 0199188
-33428
- 7 425
330888
- 9 8281
Expendi-tures
6,2144,5074,9425,8113,7524,8855,2576,846
2,3982,4862,4562,8023,009
n.a.
462506537502533581627689665630651648606
Other accounts7
Invest-ments8
- 2 2271329153196275242357
5222310613617
n.a.
- 1 455
440
- 3 928827441861
- 9 07
30
Others
-333786508310353530489584
126404105385
- 7 4n.a.
8687
— 16- 1 1 3
14184244144
- 1 0 2803432
104
reasury sreasury's
n.a. Not available. lBeginning February 1954, on new reporting basis. See footnote 2 on preceding page. 2 N o t adjusted for T:revised t rea tment of carriers' taxes. 3 Carriers ' taxes deducted. 4 Beginning March, income and profits taxes announced in the TiMonthly Statement . 5Reporting of some excises changed to quarterly basis. 6Excess of receipts, or expenditures (—).
7Consists of miscellaneous trust funds and accounts and deposit fund accounts. The latter reflect principally net transactions of quasi Govern-ment corporations, European Payments Union deposit fund, and suspense accounts of Defense and other Government depar tments . Investmentsof wholly owned Government corporations are included as specified in footnote 8, but their operating transactions are included in Budget expend-itures.
8Consists of net investments in public debt securities of quasi Government corporations and agencies and other t rust funds beginning withJuly 1950, which prior to tha t date are not separable from the next column; and, in addition, of net investments of wholly owned Governmentcorporations and agencies beginning with November 1950, which prior to tha t date are included with Budget expenditures (for exceptions seefootnote 1 on previous page). 9Includes undistributed depositary receipts.
OCTOBER 1954 1085
Digitized for FRASER http://fraser.stlouisfed.org/ Federal Reserve Bank of St. Louis

TREASURY CASH INCOME, OUTGO, AND BORROWINGDERIVATION OF CASH RECEIPTS FROM AND PAYMENTS TO THE PUBLIC
[On basis of daily statements of United States Treasury and Treasury Bulletin. In millions of dollars]
Period
Cal. yr.—1950195119521953
Fiscal yr.—195119521953... .19547...
Semiannual totals:1951—Jan.-June. .
July-Dec.. .1952—Jan.-June. .
July-Dec.. .1953—Jan.-June. .
July-Dec7.Monthly:
1953—SeptOctNovDec
1954—JanFeb. i,MarAprMayJuneJulyAugSept
Cash operating income, other than debt
Net Budgetreceipts
Totalnet
receipts
37,83453,48865,52364,46948,14362,12965,21864,550
29,67923,80938,32027,20438,01426,454
6,0412,6594,6955,183
84,4715,444
11,4342,7513,592
10,5392,8273,911n.a.
Less:Non-cash1
171222184275256138210n.a.
1645877
107104171
43104
8051
n.a.n.a.n.a.n.a.n.a.n.a.n.a.n.a.
Plus: Trustacct. receipts
Total
7,0018,5828,7078,5967,7968,8078,9329,152
4,2344,3494,4584,2484,6833,913
482378839627237993824479
1,2301,445
4191,224n.a.
Less:Non-cash 2
>,211>,508>,649>,3471,244:1,7051,595n.a.
1,2101,2981,4061,2431,351
996
10778
133391855n.a.n.a.n.a.n.a.n.a.n.a.n.a.n.a.
Equals:Cash
operat-ing
income
42,45159,33871,39670,44053,43968,09371,34471,781
32,53726,79941,29330,10441,24129,199
6,3732,9505,3965,3394,6026,529
12,2603,0364,882
11,2652,9565,3755,280
Cash operating outgo, other than debt
Budget expenditures
Total
38,25556,84671,36673,62644,63366,14574,60767,579
25,57031,27634,86936,49738,11035,515
6,1195,4775,4236,387
«5,O714,7075,5555,2965,2037,1154,8276,731
n.a.
Less: Noncash
Accru-als topublic3
503567734575477710694509
196371338396298277
21- 1408272168
194376703857
Intra-Govt.trans.4
2,3072,6252,8072,5852,3602,8372,774n.a.
1,2791,3461,4881,3191,4561,129
10891
133483897n.a.n.a.n.a.n.a.n.a.n.a.n.a.n.a.
Plus: Tr. acct.expenditures
Total
6,9234,3974,8255,9743,9454,9525,1696,716
1,7442,6532,2982,5272,6423,332
451604636549427411601810568604660526n.a.
Less:Non-cash s
65902834
1385
31n.a.
828
—432
- 236
41- 3
3- 1 2
8n.a.n.a.n.a.n.a.n.a.n.a.n.a.n.a.
Plus:
Exch.Stabi-liza-tion
Fund 6
-262- 2 6
38- 8 2- 1 3
9- 2 8
-109
- 1 3- 1 3
2216
- 4 4- 3 8
11
- 6 0- 1 2
- 3 913
—33
- 3 116
-112
Clear-ing ac-count
- 8 7106319209214401312452
- 4 0146255
64248
- 4 0
-117-235
376- 2 9
-559135160
- 5 9 3511
382
222n.a.
Equals:Cash
operat-ing
outgo
41.96958,03472,98076,52945,80467,95676,56171,933
25,70032,33435,62237,35739,20337,326
6,2945,7596,2586,2944,7495,3006,2325,3036,2286,8815,1427,7885,364
Netcash
operat-ing in-come
oroutgo
4821,304
- 1 , 5 8 3- 6 , 0 9 0
7,635137
-5 ,217-152
6,839-5 ,534
5,671-7 ,254
2,038-8 ,128
78-2 ,809
-862-956-1471,2286,028
-2 ,267-1 ,347
4,384-2 ,186-2 ,412
- 8 4
n.a. Not available. * Represents principally interest paid to Treasury by Government agencies and repayment of capital stock and paid-in surplus by quasi Government corporations. 2 Represents principally interest on investments in U. S. Government securities, payroll deduc-tions for Government employees' retirement accounts, and transfers shown as Budget expenditures.
3 Represents principally excess of interest accruals over payments on savings bonds and Budgetary expenditures involving issuance of Federalsecurities; the latter include mostly armed forces leave bonds and notes issued to the International Bank and Monetary Fund, which are treatedas noncash expenditures at the time of issuance and cash expenditures at the time of redemption.
4 Represents principally noncash items shown under trust account receipts (described in footnote 2); also includes small adjustments fornoncash interest reflected in noncash Budget receipts (see footnote 1) and in noncash trust account expenditures (see footnote 5).
8Represents principally repayments of capital stock and paid-in surplus by quasi Government corporations, as well as interest receipts bysuch corporations on their investments in the public debt (negative entry). «Cash transactions between Intl. Monetary Fund and ExchangeStabilization Fund. (See footnote 3.) 7Beginning February 1954, on new reporting basis. See footnote 8 on following page.
8Not adjusted for Treasury's revised treatment of carriers' taxes.
DERIVATION OF CASH BORROWING FROM OR REPAYMENT OF BORROWING TO THE PUBLIC
Period
Cal. yr.—1950195119521953
Fiscal yr.—19511952195319548
Semiannual totals:1951—Jan.-June. . .
July-Dec.. . .1952—Jan.-June. . .
July-Dec.. . .1953—Jan.-June. . .
July-Dec.. . .1954—Jan.-Juneo..
Monthly:1953—Sept.
OctNov.Dec
1954_j a nFeb. 6 . .MarAprM a y . . .JuneJulyAugSept
In -
crease,or de-creasegross
dir. pub.debt
—4232 7117,9737 777
-2 ,1353,8836,9665,189
-1 ,4864,197-3138,286
- 1 , 3 2 09,097
-3 ,909
—269449
1,822—40
-320—67
-4 ,546811
2,428—2,215
—2763,971-145
Plus: Cashissuance oisecurities of
Federal agencies
Guar-anteed
—61812221016
729
513
38
- 224
6
2g2
— 12
311
—6161
Non-guar-
anteed
35537
-102- 3
374- 8 8- 3 2
- 2 5 0
- 1 351
-13937
- 6 966
n.a.
75—72108
- 6 1- 2 7
- 1 2 6- 8 9— 74
74
—21
44
Less: Noncash debt transactions
Net inv.in Fed.sec. by
Govt. agen.& tr. funds
943,4183,8332,5403,5573,6363,3012,101
2,0141,4042,2321,6011,700
840n.a.
71—76240150
—4677
- 2 035
380815
- 8 4312
- 4 0
Accruals <
Int. on sav.bonds and
Treas. bills
602718770591638779719524
301417361409308283241
22
41837317
9204476713958
,o public1
Payts. inform of
Fed. sec.
163- 1 2 5
- 7 466
— 149- 7 9
394
- 9 2- 3 3- 4 5- 2 9
343263
— 12— 1— 15911
- 138
- 1 432
— 130
- 1 7111
Equals:Net cashborrow-ing, orrepayt.(-)of
borrow-ing-929
—1,2423,3534,601
-5 ,795-5252,9182,248
-3 ,7142,472
-2 ,9986,351
-3 ,4338,034
n.a.
-274457
1,659—391-386-284
-4 ,662699
2,046—3,104
—3563,645-229
Detai s of net cash borrowing from orA / \ r t r - _ . A_ _ 4_t t_ i"_<>
repayment v —; oi
Directmktable.& conv.issues3
—2,6491,9995,77854,829
-3,9431,639
«5,2942,483
-1,1843,183
-1,5447,322
«-2,0286,857n.a.
—931—51
1,647- 7 0
— 178— 74
-4 ,304838
2,144—2,779
—853,678-113
Savingsbonds(issueprice)
751— 1,191
-406*— 344
-467-717
6-103-381
-758-432-285-121
518-362
- 1 9
—90—36—22—41—92
187532
5—57
— 13733
- 4 4
uorrowing to tne puDiic*
Savingsnotes
1,021— 1,099- 1 , 7 8 4
248- 6 5 7
- 1 , 2 0 9- 2 , 1 6 4
628
- 8 4 5- 2 5 5- 9 5 5- 8 2 9
- 1 , 3 3 51,583- 9 5 5
662618
—53— 167
- 7 3—71
—310—82
— 152—267
—88—64
- 1 0 1
PostalSav. Sys.
specialissues
—250—997— 113— 162
- 1 , 0 9 3- 1 5 5- 1 0 0—239
- 9 2 3- 7 4- 8 1- 3 2- 6 8- 9 4
- 1 4 5
— 16—7
—36— 18— 12—37- 3 7—21—22— 16
7- 7- 8
O t h e r 4
19846
—12230
365- 8 2
- 9- 2 4 3
- 551
- 1 3 411
- 2 050
n.a.
101—67123
—95—31
— 120- 8 6—67
7115
—545
36
n.a. Not available.1 Differs from "accruals to the public" shown in preceding table, principally because adjustments to Exchange Stabilization Fund are included.2Includes redemptions of tax anticipation securities and savings notes used in payment of taxes.3Most changes in convertible Series B investment bonds, 1975-80, reflect exchanges of, or conversions into, marketable issues and thus cancel
out in this column. An exception was the sale for cash of about 300 million dollars in June 1952.4 Includes cash issuance in the market of obligations of Government corporations and agencies and some miscellaneous debt items.sExcludes exchanges of savings bonds into marketable bonds, in the amount of 417 million dollars, of which 409 million represents issue price.6 Beginning February 1954, on new reporting basis. See footnote 8 on following page. This table is based on Treasury daily statement,
which differs from monthly budget statement.
1086 FEDERAL RESERVE BULLETIN,
Digitized for FRASER http://fraser.stlouisfed.org/ Federal Reserve Bank of St. Louis
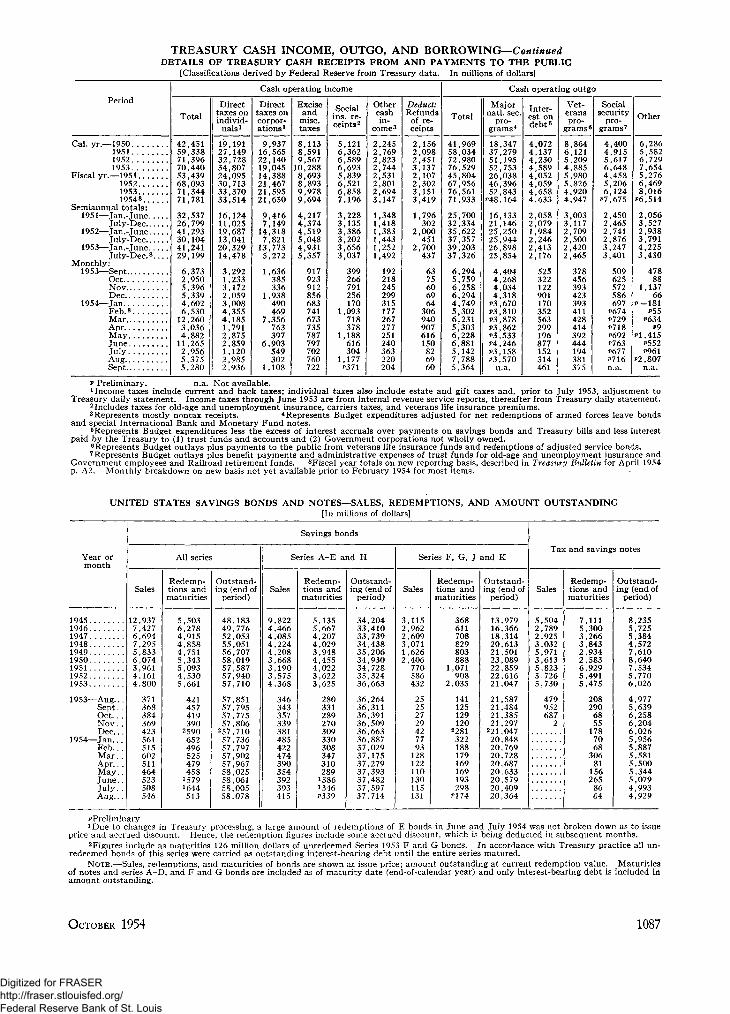
TREASURY CASH INCOME, OUTGO, AND BORROWING—ContinuedDETAILS OF TREASURY CASH RECEIPTS FROM AND PAYMENTS TO THE PUBLIC
[Classifications derived by Federal Reserve from Treasury data. In millions of dollars]
PeriodCash operating income
TotalDirect
taxes onindivid-
uals1
Directtaxes oncorpor-ations1
Exciseand
misc.taxes
Socialins. re-ceipts2
Othercashin-
come3
Deduct:Refunds
of re-ceipts
Cash operating outgo
TotalMajor
natl. sec.pro-
grams4
Inter-est ondebts
4,0724,1374,2304,5894,0524,0594,6584,633
2,0582,0791,9842,2462,4132,176
525322122901170352563299196877152314461
Vet-eranspro-
grams6
8,8646,1215,2094,8855,9805,8264,9204,947
3,0033,1172,7092,5002,4202,465
378456393423393411428414392444194381375
Socialsecurity
pro-grams7
4,4004,9155,6176,6484,4585,2066,124
P7.675
2,4502,4652,7412,8763,2473,401
509625572586697
P674P729P718P692P763P677P716n.a.
Other
Cal. yr.—1950195119521953
Fiscal yr.—19511952195319548...
Semiannual totals:1951—Jan.-June..
July-Dec...1952—Jan.-June..
July-Dec...1953—Jan.-June..
July-Dec.8,Monthly:
1953—SeptOctNovDec
1954—JanFeb.sMarAprMayJuneJulyAugSept
42,45159,33871,39670,44053,43968,09371,34471,781
32,53726,79941,29330,10441,24129,199
6,3732,9505,3965,3394,6026,53012,2603,0364,88211,2652,9565,3755,280
19,19127,14932,72834,80724,09530,71333,37033,514
16,12411,02519,68713,04120,32914,478
3,2921,2333,1722,0593,008355185791
2,875859
1,1202,9852,936
9,93716,56522,14019,04514,38821,46721,59521,650
9,4167,14914,3187,82113,7735,272
1,636385336
1,938490469
7,356763397
6,903549302
1,108
8,1138,5919,56710,2888,6938,8939,9789,694
4,2174,3744,5195,0484,9315,357
917923912856683741673735787797702760722
5,1216,3626,5896,6935,8396,5216,8587,196
3,2283,1353,3863,2023,6563,037
399266791256170
1,093718378
1,188616304
1,17737
2,2452,7692,8232,744
,531,801,694
3,147
,348,418,383,443,252,492
192218245299315177267277251240363220204
2,1562,0982,4513,1372,1072,3023,1513,419
1,796302
2,000451
2,700437
6375606964
306940907616150826960
41,96958,03472,98076,52945,80467,95676,56171,933
25,70032,33435,62237,35739,20337,326
6,2945,7596,2586,2944,7495,3026,2315,3036,2286,8815,1427,7885,364
1837,51,52,26,46,52,
P48,
347279195753038396843164
16,13321,14625,25025,94426,89825,854
4,4044,2684,0344,318
P3,670P3,810P3,878P3,862P3.533P4.246P3,158P3.57On.a.
6,2865,5826,7297,6545,2766,4698,016P6.514
2,0563,5272,9383,7914,2253,430
47888
1,13766
p-181P55
P634P9
PI.415P552P961
P2,807n.a.
P Preliminary. n.a. Not available.income taxes include current and back taxes; individual taxes also include estate and gift taxes and, prior to July 1953, adjustment to
Treasury daily statement. Income taxes through June 1953 are from internal revenue service reports, thereafter from Treasury daily statement.2 Includes taxes for old-age and unemployment insurance, carriers taxes, and veterans life insurance premiums.3Represents mostly nontax receipts. 4Represents Budget expenditures adjusted for net redemptions of armed forces leave bonds
and special International Bank and Monetary Fund notes.5Represents Budget expenditures less the excess of interest accruals over payments on savings bonds and Treasury bills and less interest
paid by the Treasury to (1) trust funds and accounts and (2) Government corporations not wholly owned.6Represents Budget outlays plus payments to the public from veterans life insurance funds and redemptions of adjusted service bonds.7 Represents Budget outlays plus benefit payments and administrative expenses of trust funds for old-age and unemployment insurance and
Government employees and Railroad retirement funds. 8Fiscal year totals on new reporting basis, described in Treasury Bulletin for April 1954p. A2. Monthly breakdown on new basis not yet available prior to February 1954 for most items.
UNITED STATES SAVINGS BONDS AND NOTES—SALES, REDEMPTIONS, AND AMOUNT OUTSTANDING[In millions of dollars]
Year ormonth
194519461947194819491950195119521953
1953—Aug...Sept . .Oct.. .Nov. .Dec.. .
1954—Jan.. .Feb.. .Mar . .Apr.. .May. .June. .Ju ly . .Aug...
Savings bonds
All series
Sales
12,9377,4276,6947,2955,8336,0743,9614,1614,800
371368384369423561515602511464523508546
Redemp-tions andmaturities
5,5036,2784,9154,8584,7515,3435,0934,5305,661
421457419390
2590652496525479458
1579!644513
Outstand-ing (end of
period)
48,18349,77652,05355,05156,70758,01957,58757,94057,710
57,85157,79557,77557,806
257,71057,73657,79757,90257,96758,02558,06158,00558,078
Series A-E and H
Sales
9,8224,4664,0854,2244,2083,6683,1903,5754,368
346343357339381485422474390354392393415
Redemp-tions andmaturities
5,1355,6674,2074,0293,9484,4554,0223,6223,625
280331289270309330308347310289
1386!346P339
Outstand-ing (end of
period)
34,20433,41033,73934,43835,20634,93034,72835,32436,663
36,26436,31136,39136,50936,66336,88737,02937,17537,27937,39337,48237,59737,714
Series F, G, J and K
Sales
3,1152,9622,6093,0711,6262,406
770586432
25252729427793
128122110130115131
Redemp-tions andmaturities
368611708829803888
1,071908
2,035
141125129120
2281322188179169169193298
P174
Outstand-ing (end of
period)
13,97916,36618,31420,61321,50123,08922,85922,61621,047
21,58721,48421,38521,297
221,04720,84820,76920,72820,68720,63320,57920,40920,364
Tax and savings notes
Sales
5,5042,7892,9253,0325,9713,6135,8233,7265,730
479952687
2
Redemp-tions andmaturities
7,1115,3003,2663,8432,9342,5836,9295,4915,475
208290
6855
1787068
30681
156265
8664
Outstand-ing (end of
period)
8,2355,7255,3844,5727,6108,6407,5345,7706,026
4,9775,6396,2586,2046,0265,9565,8875,5815,5005,3445,0794,9934,929
if E bonds in June and July 1954 was not broken down as to issue
OCTOBER 1954 1087
Digitized for FRASER http://fraser.stlouisfed.org/ Federal Reserve Bank of St. Louis
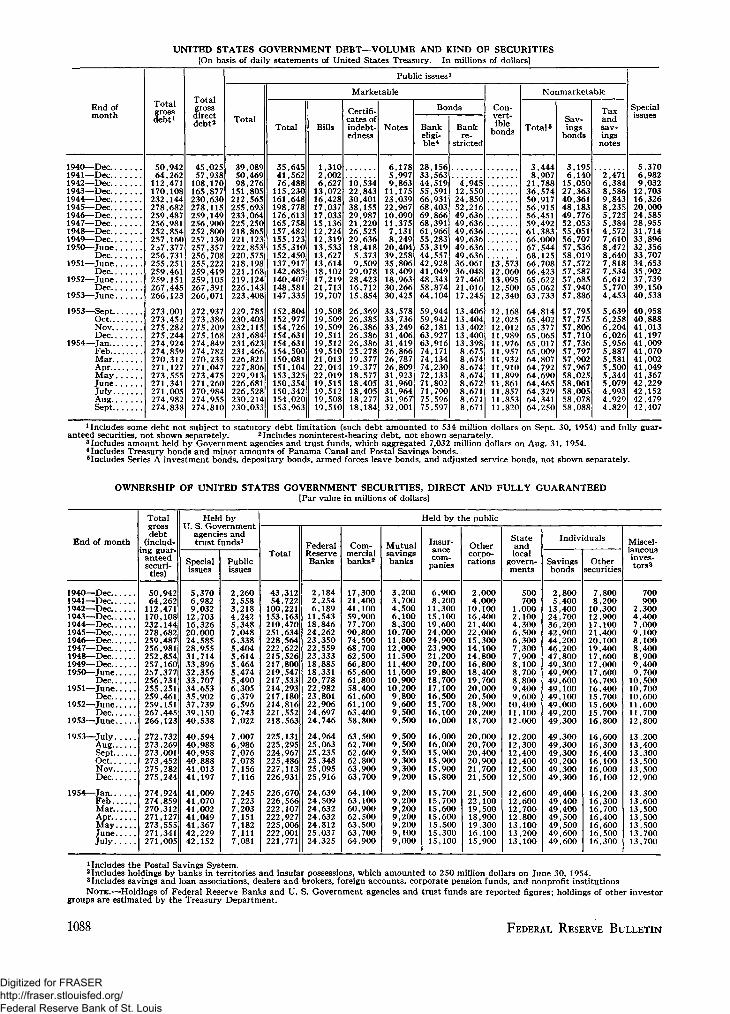
UNITED STATES GOVERNMENT DEBT—VOLUME AND KIND OF SECURITIES[On basis of daily statements of United States Treasury. In millions of dollars]
End ofmonth
1940—Dec1941—Dec1942—Dec1943—Dec1944—Dec1945—Dec1946—Dec1947—Dec1948—Dec1949—Dec1950—June
Dec1951—June
Dec1952—June
Dec1953—June
1953—Sept..OctNovDec
1954—JanFebMarAprMayJuneJulyAugSept
Totalgrossdebt1
50,94264,262
112,471170,108232,144278,682259,487256,981252,854257,1602o7,377256,731255,251259,461259,151267,445266,123
273,001273,452275,282275,244274,924274,859270,312271,127273,555271,341271,005274,982274,838
Totalgrossdirectdebt 2
45,02557,938
108,170165,877230,630278,115259,149256,900252,800257,130257,357256,708255,222259,419259,105267,391266,071
272,937273,386275,209275,168274,849274,782270,235271,047273,475271,260270,984274,955274,810
Public issues3
Total
39,08950,46998,276
151,805212,565255,693233,064225,250218,865221,123222,853220,575218,198221,168219,124226,143223,408
229,785230,403232,115231,684231,623231,466226,821227,806229,913226,681226,528230,214230,033
Marketable
Total
35,64541,56276,488
115,230161,648198,778176,613165,758157,482155,123155,310152,450137,917142,685140,407148,581147,335
152,804152,977154,726154,631154,631154,500150,081151,104153,325150,354150,342154,020153,963
Bills
1,3102,0026,627
13,07216,42817,03717,03315,13612,22412,31913,53313,62713,61418,10217,21921,71319,707
19,50819,50919,50919,51119,51219,51021,01322,01422,01919,51519,51219,50819,510
Certifi-cates ofindebt-edness
10,53422,84330,40138,15529,98721,22026,52529,63618,4185,3739,509
29,07828,42316,71215,854
26,36926,38526,38626,38626,38625,27819,37719,37718,57718,40518,40518,27718,184
Notes
6,1785,9979,863
11,17523,03922,96710,09011,3757,1318,249
20,40439,25835,80618,40918,96330,26630,425
33,57833,73633,24931,40631,41926,86626,78726,80931,92331,96031,96431,96732,001
Bonds
Bankeligi-ble*
28,15633,56344,51955,59166,93168,40369,86668,39161,96655,28353,31944,55742,92841,04948,34358,87464,104
59,94459,94262,18163,92763,91674,17174,13474,23072,13371,80271,79075,59675,597
Bankre-
stricted
4,94512,55024,85052,21649,63649,63649,63649,63649,63649,63636,06136,04827,46021,01617,245
13,40613,40413,40213,40013,3988,6758,6748,6748,6748,6728,6718,6718,671
Con-vert-ible
bonds
'ii!57312,06013,09512,50012,340
12,16812,02512,01211,98911,97611,95711,93211,91011,89911,86111,85711,85311,820
Nonmarketable
Total«
3,4448,907
21,78836,57450,91756,91556,45159,49261,38366,00067,54468,12566,70866,42365,62265,06263,733
64,81465,40265,37765,06565,01765,00964,80764,79264,69064,46564,32964,34164,250
Sav-ings
bonds
3,1956,140
15,05027,36340,36148,18349,77652,05355,05156,70757,53658,01957,57257,58757,68557,94057,886
57,79557,77557,80657,71057,73657,79757,90257,96758,02558,06158,00558,07858,088
Taxandsav-ingsnotes
2,4716,3848,5869,8438,2355,7255,3844,5727,6108,4728,6407,8187,5346,6125,7704,453
5,6396,2586,2046,0265,9565,8875,5815,5005,3445,0794,9934,9294,829
Specialissues
5,3706,9829,032
12,70316,32620,00024,58528,95531,71433,89632,35633,70734,65335,90237,73939,15040,538
40,95840,88841,01341,19741,00941,07041,00241,04941,36742,22942,15242,47942,407
1 Includes some debt not subject to statutory debt limitation (such debt amounted to 534 million dollars on Sept. 30, 1954) and fully guar-anteed securities, not shown separately. 2 Includes noninterest-bearing debt, not shown separately.
3Includes amount held by Government agencies and trust funds, which aggregated 7,032 million dollars on Aug. 31, 1954.4 Includes Treasury bonds and minor amounts of Panama Canal and Postal Savings bonds.5Includes Series A investment bonds, depositary bonds, armed forces leave bonds, and adjusted service bonds, not shown separately.
OWNERSHIP OF UNITED STATES GOVERNMENT SECURITIES, DIRECT AND FULLY GUARANTEED[Par value in millions of dollars]
End of month
1940—Dec1941—Dec1942—Dec1943—Dec1944—Dec1945—Dec1946—Dec1947—Dec1948—Dec1949—Dec1950—June
Dec1951—June
Dec1952—June
Dec1953—June
1953—JulyAugSeptOctNovDec
1954—JanFebMarAprMayJuneJuly
Total
grossdebt(includ-
ing guar-anteedsecuri-ties)
50,94264,262
112,471170,108232,144278,682259,487256,981252,854257,160267,377256,731255,251259,461259,151267,445266,123
21'2,732273,269273,001273,452275,282275,244
274,924274,859270,312271,127273,555271,341271,005
Held byU. S. Government
agencies andtrust funds1
Specialissues
5,3706,9829,032
12,70316,32620,00024,58528,95531,71433,89632,35633,70734,65335,90237,73939,15040,538
40,59440,98840,95840,88841,01341,197
41,00941,07041,00241,04941,36742,22942,152
Publicissues
2,2602,5583,2184,2425,3487,0486,3385,4045,6145,4645,4745,4906,3056,3796,5966,7437,022
7,0076,9867,0767,0787,1567,116
7,2457,2237,2037,1517,1827,1117,081
Held by the public
Total
43,31254,722
100,221153,163210,470251,634228,564222,622215,526217,800219,547217,533214,293217,180214,816221,552218,563
225,131225,295224,967225,486227,113226,931
226,670226,566222,107222,927225,006222,001221,771
FederalReserveBanks
2,1842,2546,189
11,54318,84624,26223,35022,55923,33318,88518,33120,77822,98223,80122,90624,69724,746
24,96425,06325,23525,34825,09525,916
24,63924,50924,63224,63224,81225,03724,325
Com-mercialbanks2
17,30021,40041,10059,90077,70090,80074,50068,70062,50066,80065,60061,80058,40061,60061,10063,40058,800
63,50062,70062,60062,80063,90063,700
64,10063,10060,90062,50063,50063,70064,900
Mutualsavingsbanks
3,2003,7004,5006,1008,300
10,70011,80012,00011,50011,40011,60010,90010,2009,8009,6009,5009,500
9,5009,5009,5009,3009,3009,200
9,2009,2009,2009,2009,2009,1009,000
Insur-ancecom-
panies
6,9008,200
11,30015,10019,60024,00024,90023,90021,20020,10019,80018,70017,10016,50015,70016,10016,000
16,00016,00015,90015,90015,90015,800
15,70015,70015,60015,60015,50015,30015,100
Othercorpo-rations
2,0004,000
10,10016,40021,40022,00015,30014,10014,80016,80018,40019,70020,00020,50018,90020,20018,700
20,00020,70020,40020,90021,70021,500
21,50022,10019,50018,90019,30016,10015,900
Stateandlocal
govern-ments
500700
1,0002,1004,3006,5006,3007,3007,9008,1008,7008,8009,4009,600
10,40011,10012,000
12,20012,30012,40012,40012,50012,500
12,60012,60012,70012,80013,10013,20013,100
Individuals
Savingsbonds
2,8005,400
13,40024,70036,20042,90044,20046,20047,80049,30049,90049,60049,10049,10049,00049,20049,300
49,30049,30049,30049,20049,30049,300
49,40049,40049,40049,50049,50049,60049,600
Othersecurities
7,8008,200
10,30012,90017,10021,40020,10019,40017,60017,00017,60016,70016,40015,70015,60015,70016,800
16,60016,30016,40016,10016,00016,100
16,20016,30016,70016,40016,60016,50016,300
Miscel-laneousinves-tors 3
700900
2,3004,4007,0009,1008,1008,4008,9009,4009,700
10,50010,70010,60011,60011,70012,800
13,20013,40013,30013,50013,50012,900
13,30013,60013,50013,50013,50013,70013,700
1 Includes the Postal Savings System.2Includes holdings by banks in territories and insular possessions, which amounted to 250 million dollars on June 30, 1954.3 Includes savings and loan associations, dealers and brokers, foreign accounts, corporate pension funds, and nonprofit institutionsNOTE.—Holdings of Federal Reserve Banks and U. S. Government agencies and trust funds are reported figures; holdings of other investor
groups are estimated by the Treasury Department.
1088 FEDERAL RESERVE BULLETIN
Digitized for FRASER http://fraser.stlouisfed.org/ Federal Reserve Bank of St. Louis
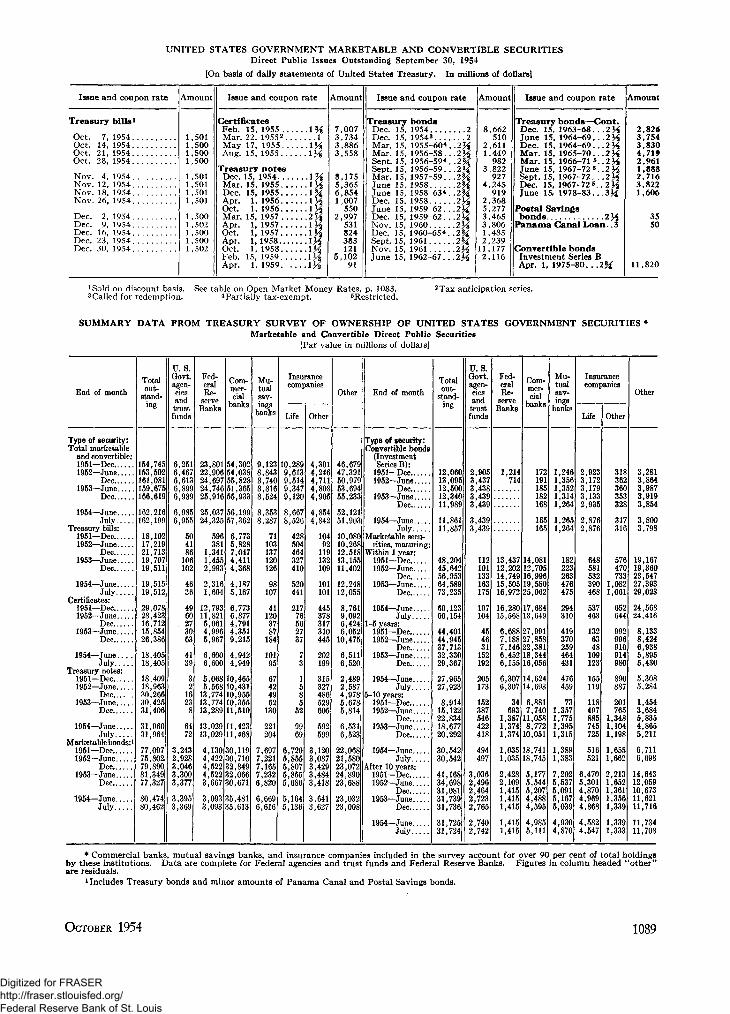
UNITED STATES GOVERNMENT MARKETABLE AND CONVERTIBLE SECURITIESDirect Public Issues Outstanding September 30, 1954
[On basis of daily statements of United States Treasury. In millions of dollars]
Issue and coupon rate Amount Issue and coupon rate Amount Issue and coupon rate Amount Issue and coupon rate Amount
Treasury bills1
Oct. 7,1954Oct. 14, 1954Oct. 21, 1954Oct. 28, 1954
Nov. 4, 1954Nov. 12, 1954Nov. 18, 1954Nov. 26, 1954
Dec. 2, 1954Dec. 9, 1954Dec. 16, 1954Dec. 23, 1954Dec. 30, 1954
1,5011,5001,5001,500
501501501501
CertificatesFeb. 15, 1955 1%Mar. 22, 19552 1May 17, 1955 \V%Aug. 15, 1955 1H
Treasury notesDec. 15, 1954 \y%Mar. 15, 1955 1"Dec. 15, 1955 \\
1,5001,5021,5001,5001,502
Apr.Oct.
1956 13, 1956 13Mar. 15, 1957 2%
Apr. 1,1957 13Oct. 1, 1957Apr. 1,1958 }Oct. 1,1958 1}Feb. 15, 1959 13Apr. 1, 1959 3
7,0073,7343,8863,558
8,1755,3656,8541,007
5502,997
531824383121
5,10291
TreasuryDec. 15,Dec. 15,Mar. 15,Mar. 15,Sept. 15,Sept. 15,Mar. 15,June 15,June 15,Dec. 15,June 15,Dec. 15,Nov. 15,Dec. 15,Sept. 15,Nov. 15,June 15,
bonds1954195431955-60*.. 21956-58. . .21956-59*..21956-59...21957-59... 21958 21958-63*..21958 2j1959-62... 21959-62... 21960 231960-65*. .21961 21961 21962-67. ,.2
8,662510
2,6111,449
9823,822
9274,245
9192,3685,2773,4653,8061,4852,239
11,1772,116
Treasury bonds—Cont.Dec. 15, 1963-68. . .2HJune 15, 1964-69.Dec. 15, 1964-69.Mar. 15, 1965-70.Mar. 15, 1966-71 s
June 15, 1967-72 «Sept. 15, 1967-72. . .2HDec. 15, 1967-72 *.. 2HJune 15, 1978-83...3M
Postal Savingsbonds 2}$
Panama Canal Loan. .3
Convertible bondsInvestment Series BApr. 1, 1975-80... 2M
2,8263,7543,8304,71f2,9611,8882,7163,8221,606
3550
11,820
^old on discount basis. See table on Open Market Money Rates, p. 1083. 2Tax anticipation series.3 Called for redemption. 4Partially tax-exempt. 6Restricted.
SUMMARY DATA FROM TREASURY SURVEY OF OWNERSHIP OF UNITED STATES GOVERNMENT SECURITIES •Marketable and Convertible Direct Public Securities
[Par value in millions of dollars]
End of month
Type of security:Total marketable
and convertible:1951—Dec1952—June
Dec1953—June
Dec
1954—JuneJ u ly
Treasury bills:1951—Dec1952—June
Dec1953—June
Dec
1954—JuneJuly
Certificates:1951—Dec1952—June
Dec1953—June
Dec
1954—June.. . .July
Treasury notes:1951—Dec1952—June
Dec1953—June
Dec
1954—JuneJuly
Marketable bonds:1
1951—Dec1952—June
Dec1953—June
Dec
1954—JuneJuly
Totalout-
stand-ing
154153161159166
162162
1817211919
1919
2928161526
1818
1818303031
3131
,745,502,081,675,619
,216,199
,102,219,713,707,511
,515,512
078423712854386
405405
409963266425406
960964
77,09775798177
8080
802890349327
474462
U.S.Govt.agen-ciesand
trustfunds
6,2516,4676,6136,8996,989
6,9856,955
504186
106102
4636
4960273063
4139
32
1623
8
6472
3,2432,9283,0463,3003,377
3,3953,369
Fed-eralRe-
serveBanks
2322242425
2524
112
21
1211545
66
55
131313
1313
44,4,4,3,
3 ,3,
801906697
,746,916
,037325
596381341455993
316604
793821061996967
600600
068568774774289
029029
130422522522667
093093
Com-mer-cial
banks
5454555155
5657
65744
45
66449
44
1010101011
1111
30,30,32,32,30,
35,35,
302038828365933
199362
773828047411368
187167
773877791351215
942949
465431955355510
423468
119710849066671
481613
Mu-tualsav-ings
banks
98888
88
77776
66
,123,843,740,816,524
,353,287
71103137120126
98107
411203787
184
10195
67424962
130
221204
697221165232820
669616
1CS
c
g
65555
55
Insurancecompanies
Life
,289,613,514,347,120
,667,526
428504464327410
520441
21776562737
73
1585
52
9969
,720,855,807,855,686
,164,136
Other
4,3014,2464,7114,8084,905
4,8544,842
10492
119132109
101101
445378317310445
202199
315327486529605
592599
3,1203,0873,4293,4843,418
3,6413,627
Other
4647505355
5251
1010121311
1212
8966
10
66
22455
66
22,21,23,24,23,
2323,
679391979694233
121903
080268518155402
248055
761092424052475
511520
489587978678814
531523
068580072890688
032008
End of month
Type of security:Convertible bonds
(InvestmentSeries B):
1951—Dec1952—June
Dec1953—ju n e
Dec
1954—JuneJuly .•;.'.•;
Marketable secu-rities, maturing:
Within 1 year:1951—Dec1952—June
Dec1953—June
Dec
1954—JuneJuly
1-5 years:1951—Dec1952—June
Dec1953—June
Dec
1954—JuneJuly
5-10 years:1951—Dec1952—June
Dec1953—June
Dec
1954—JuneJuly
After 10 years:1951—Dec1952—June
Dec1953—June
Dec
1954—JuneJuly
Totalout-
stand-ing
1213121211
1111
48455664
060,095,500340989
861857
204642953589
73,235
6060
4444373229
2727
815221820
3030
4134313131
3131
123154
401945713330367
965923
914122834677292
542542
168698081739736
725724
U.S.Govt.agen-ciesand
trustfunds
2,9053,4373,4383 4393,439
3 4393^439
112101133163175
107104
454631
152192
205173
152387546422418
494497
3,0362,4962,4642,7232,765
2,7402,742
Fed-eralRe-
serveBanks
1
1312141516
1615
67766
66
111
11
22111
11
,214714
,437,202,749,505,972
,280,568
,688,188,146,452,155
,307,307
34693
,387,374,374
,035,035
,428,109,415,415,415
,415,415
Com-mer-cial
banks
1412161925
1718
2727221816
1414
6,7,
11,8,
10,
18,18,
5,5,5,4,4,
4,5,
172191185182168
165165
081705996580062
684649
991858381344056
624693
881740058772051
741745
177544207488595
985111
Mu-tualsav-ings
banks
11111
11
1111
11
75555
44
,246,356,352,314,264
,265,264
182223263476475
294310
419370259464431
476459
73,357,775,395,315
,389,383
,202,537,091,167,039
.930,870
Insurancecompanies
Life
23332
22
65444
44
,923,172,179,133,935
,876,876
648581532390468
537463
1326348
109123
155119
118497885745725
516521
470301870969868
582547
Other
11
111
11
21111
11
318362360353328
317316
576470733
,082,061
652644
992996910914980
890887
201765
,348,104,198
,655,662
,213,652,361,356,339
,339,333
0
33333
33
1919232729
2424
88655
55
13545
66
1412101111
1111
ther
,281,864,987,919,854
800,798
,167,360,547,393,023
,568,416
,133,424,938,895,430
,308,284
,454,684,835,865,211
,711,698
,643,059,673,621,716
,734,708
* Commercial banks, mutual savings banks, and insurance companies included in the survey account for over 90 per cent of total holdingsby these institutions. Data are complete for Federal agencies and trust funds and Federal Reserve Banks. Figures in column headed "other"are residuals.
1 Includes Treasury bonds and minor amounts of Panama Canal and Postal Savings bonds.
OCTOBER 1954 1089
Digitized for FRASER http://fraser.stlouisfed.org/ Federal Reserve Bank of St. Louis

NEW SECURITY ISSUES ]
[Estimates, in millions of dollars]
Year ormonth
Gross proceeds, all issuers2
Total
Noncorporate
U.S.Govern-ments
Fed-eral
agency
Stateandmu-nici-pal
Other«
Corporate
Total
Bonds
TotalPub-licly
offered
Pri-vatelyplaced
Pre-ferredstock
Com-monstock
Proposed uses of net proceeds,all corporate issuers6
New capital
Total
903420762
1,040647408753
1,347
3,8895,1156,6515,5584,990
7,1208,7168,495
325753577429
1,438
544439660486652859727338
Newmoney7
681325569
868474308657
1,080
3,2794,5915,9294,6064,006
6,5318,1807,960
270691550406
1,413
531410590471614812684304
Mis-cel-
lane-ouspur-poses
Re-tire-ment
ofbankdebt,etc.s
Re-tire-ment
ofsecu-rities
193819391940
19411942194319441945
19461947194819491950
195119521953
1953—Aug...Sept..Oct.. .Nov..Dec.
1954—Jan...Feb...Mar..Apr...May..June..July ..Aug. .
5,9265,6876,564
15,15735,43844,51856,31054,712
18,68519,94120,25021,11019,893
21,26526,92928,824
1,4532,5992,2913,5062,736
1,6551,386
1̂ 9474,3862,438
••1,9701,219
2,4802,3322,517
11,46633,84642,81552,42447,353
10,21710,58910,32711,8049,687
9,77812,57713,957
8531,3201,0702,610
561515602511
2,669
508546
11513
109
38121
506
357
21630
110459106
76
7180
123
1,1081,1281,238
956524435661795
1,1572,3242,6902,9073,532
3,1894,1215,558
260476483411777
399414522735783855'280227
695024
305
97224756
451156132282
446237306
436602757
1231
6315426
2,1552,1642,677
2,6671,0621,1703,2026,011
6,9006,5777,0786,0526,361
7,7419,5348,898
336768603459
1,478
571456726628850
1,0571,057439
2,0441,9792,386
2,389917990
2,6704,855
4,8815,0355,9734,8904,920
5,6917,6017,083
263676375353
1,385
462366513408647808920364
1,3531,2761,628
1,578506621
1,8923,851
3,0192,8882,9632,4342,360
2,3643,6453,856
11044915395
1,057
284178226216424343714166
691703758
811411369778
1,004
1,8622,1473,0102,4552,560
3,3263,9573,228
153226222258327
178188286192224465206198
8698183
167112124369758
1,126761492424631
838564489
744183743
2027691101301314946
2587108
1103456163397
891778614736811
1,2121,3691,326
65482106951
9063144111731188729
72619
28352747133
231168234315364
21569174
1441387349134
379356488637620
226 363537535
5562282325
1329701638474234
1,2061,6951,854
1,583396789
2,3894,555
2,8681,352307401
1,271
486664260
54122226
1895312918318231694
Proposed uses of net proceeds, by major groups of corporate issuers
Year ormonth
Manufacturing
Totalnetpro-ceeds
Newcap-ital*
Retire-ments 10
Commercial andmiscellaneous
Totalnetpro-ceeds
Newcap-ital"
Retire-ments 10
Transportation
Totalnetpro-ceeds
Newcap-ital '
Retire-ments 10
Public utility
Totalnetpro-ceeds
Newcap-ital '
Retire-ments 10
Communication
Totalnetpro-ceeds
Newcap-ital '
Retire-ments 10
Real estateand financial
Totalnetpro-ceeds
Newcap-ital*
Retire-ments10
194819491950195119521953
1953—August....September.October...November.December.
1954—January...February..March.. . .AprilMayJuneJulyAugust
2,1801,3911,1753,0663,9732,218
461325699
418
13452
10786
204305415113
2,1261,3471,0262,8463,7122,128
441315393
409
11851
10779
19628441296
5444
149221261
90
212
16
403338538518536542
19194925104
5026688644886076
310474462512502
17184725100
4825627242843156
748795806490983589
1532363288
6543585820377843
784609437758553
1532363284
6536574620375443
56111965322536
25
2,1502,2762,6082,4122,6262,972
97242356245200
276269362309501442295156
2,0052,0431,927
2̂ 5392,905
97241350
191
275269316237328
165102
144233682858867
46731736012954
891567395605753874
3089135
890517314600747871
3088135
608
2673026409327
587593739515508
1,561
123243804547
125188512615919119
557558639449448
1,536
122242774546
1251882725636115
3035100666024
251971304
r Revised.1 Estimates of new issues sold for cash in the United States.2 Gross proceeds are derived by multiplying principal amounts or number of units by offering price.3 Includes issues guaranteed. 4 Issues not guaranteed.5Includes foreign government; International Bank; and domestic eleemosynary and other nonprofit.^Estimated net proceeds are equal to estimated gross proceeds less cost of flotation, i.e., compensation to underwriters, agents, etc., and
expenses.7 Includes proceeds for plant and equipment and working capital.includes proceeds for the retirement of mortgages and bank debt with original maturities of more than one year. Proceeds for retirement
of short-term bank debts are included under the uses for which the bank debt was incurred.9Includes all issues other than those for retirement of securities."•Retirement of securities only.Source.—Securities and Exchange Commission.
1090 FEDERAL RESERVE BULLETIN
Digitized for FRASER http://fraser.stlouisfed.org/ Federal Reserve Bank of St. Louis
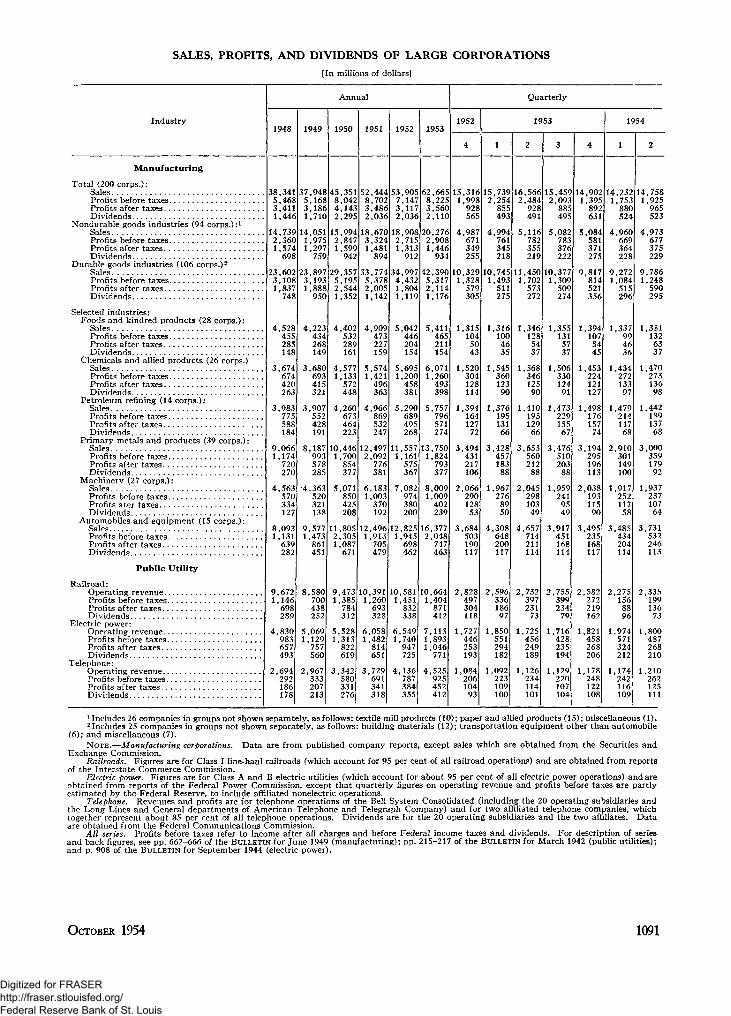
SALES, PROFITS, AND DIVIDENDS OF LARGE CORPORATIONS[In millions of dollars]
Industry
Manufacturing
Total (200 corps.):SalesProfits before taxesProfits after taxesDividends
Nondurable goods industries (94 corps.):1
SalesProfits before taxesProfits after taxesDividends
Durable goods industries (106 corps.)2
Sales . . . .Profits before taxesProfits after taxes.Dividends
Selected industries:Foods and kindred products (28 corps.):
SalesProfits before taxesProfits after taxesDividends
Chemicals and allied products (26 corps.)SalesProfits before taxesProfits after taxesDividends
Petroleum refining (14 corps.):Sales . . .Profits before taxesProfits after taxesDividends
Primary metals and products (39 corps.):Sales . .Profits before taxesProfits after taxes. .Dividends
Machinery (27 corps.):SalesProfits before taxesProfits ater taxesDividends
Automobiles and equipment (15 corps.):SalesProfits before taxes . .Profits after taxesDividends
Public Utility
Railroad:Operating revenueProfits before taxesProfits after taxesDividends
Electric power:Operating revenueProfits before taxesProfits after taxesDividends
Telephone:Operating revenueProfits before taxesProfits after taxesDividends
1948
38,3415,4683,4111,446
14,7392,3601,574
698
23,6023,1081,837
748
4,528455285148
3,674674420263
3,983775588184
9,0661,174
720270
4,563570334127
8,0931,131
639282
9,6721,146
698289
4,830983657493
2,694292186178
1949
37531
1411
2331
4
3
3
8
4
91
8
S1 ,
9 ,
,948,168,186,710
,05197S
,297759
,897,193,8889S0
,??S43496R149
6806 9 3415S?1
9 0 7ss94 9 8191
18799 3S78?8S
363S?0391138
S774738614S1
S80700438252
0601 9 07S7S 6 0
9 6 73 3 39 0 7213
Annual
1950
45842
1591
29521
4
41
4
101
5
1191
01
S1
3,
,351,042,143,295
,994847
,599949
,357,195,544,3S9
,409S399 8 9161
S77133572448
9 6 06731649 9 3
446700RS4377
0718 SO49 S?08
80S30 S087671
47338S784312
S?83 1 38 9 96 1 9
3 4 9S 8 0331276
1951
52832
1831
33521
4
S1
4
197
61
1?1
101
61 ,
3,
,444,702,486,036
,670394
,481894
,774,378,005,14?
,9094739 9 7159
S744 9 1496363
9 6 68 6 9S39947
4970 9 ?776381
18300,337019?
4 9 6Q13705470
3919 6 06 9 3328
OSS4 8 98146S1
7?96 9 1341318
1952
53732
1891
34411
s
S1
s
111
7
1?1
101
61 ,
4
,905,147,117,036
,90871 S
,3139 1 9
,997,432,804,119
,0494469 0 4154
60S9 0 0458381
9Q06 8 040 S9 6 8
SS7161S7S367
0 8 9974380?00
87S0 4 S698469
5814S18 3 9338
S407400477?S
136787384355
1953
62832
2091
42521
s
61
s
131
81
169
101
71 ,1
4
,665,225,560,110
,276,908,446934
,390,317,114,176
41146 S911154
0719 6 0493398
757796S71?74
7 SO8?4793377
0 0 90 0 94 0 97.30
3770 4 8747463
664404871412
1138Q3046771
S9S99 S45?412
1952
151
4
101
1
1
1
3
?
3
9
1
1
4
,316,998928565
,9876713499SS
,329,32857930 S
31S104
SO43
570304128114
3041641 9 7
79
404431917106
066?001 9 8
S3
684SO 3190117
8 9 8407304118
7974469 S31 0 3
0 8 49 0 6104
93
152
4
101
t
1
1
3
1
4
?
1
1
1
,739,254855493
,994761345218
,745,493511?7S
,316100
4635
S4S360123
90
,37610S131
66
,4984S7183
88
,067776
8 0SO
308648200117
S063 3 61 8 6
97
8S0SSI? 0 41 8 9
0 0 ???3100100
162
5
111
1
1
1
3
?
4
9
1
1
Quarterly
1953
2
,566,484928491
,116782355219
,450,702573?79
3461?8
S437
S68346125
90
41010S1 9 0
66
6S3S60? 1 ?
88
04 S?0810340
6S7714211114
739,307931
73
7?S4 S 6? 4 0180
1?69 3 4114101
152
5
101
1
1
1
3
1
3
9
1
1
3
,459,093885495
,082783376222
,377,309509?74
3SS131
5737
S06330124
91
473? ? 0155
67
476S10203
88
oso?41
OS40
0174S1168114
7SS3 0 09 3 4
79
7164 9 89 3 S194
1 9 0220107104
141
5
9
1
1
1
3
9
,3
9
1
1
4
.902,395892631
,08458137197S
,8178145213S6
304107
5445
4S3224121127
408176157
74
1047 0 S196113
03810,311S
0 0
4 0 S7 3 S168117
S89?7?219162
8914S8? 6 89 0 6
1789 4 817?108
141
4
91
t
1
1
9
1
3
9 ,
1
1 ,
1954
1
,232,753880524
960660364998
272084515706
3370 04636
434? 7 9133
07
470?14147
68
010301140100
017?,s?117
S8
48 S434204114
9 7 S1S6
8896
074S71,3?49 1 ?
174? 4 9116109
141
4
91
1
1
1
3
1
3
9
1
1
2
,758,925965523
,973677375990
,786,24859090S
,3-SI137,
6337
470?73136
08
44?1 8 0137
68
000.359170
0 ?
037237107
64
7315.3?74611.3
3 3 S1 0 0136
73
8004879 6 8210
9 1 0262175111
1 Includes 26 companies in groups not shown separately, as follows: textile mill products (10); paper and allied products (15); miscellaneous (1).2Includes 25 companies in groups not shown separately, as follows: building materials (12); transportation equipment other than automobile
(6); and miscellaneous (7).NOTE.—Manufacturing corporations. Data are from published company reports, except sales which are obtained from the Securities and
Exchange Commission.Railroads. Figures are for Class I line-haul railroads (which account for 95 per cent of all railroad operations) and are obtained from reports
of the Interstate Commerce Commission.Electric power. Figures are for Class A and B electric utilities (which account for about 95 per cent of all electric power operations) and are
obtained from reports of the Federal Power Commission, except that quarterly figures on operating revenue and profits before taxes are partlyestimated by the Federal Reserve, to include affiliated nonelectric operations.
Telephone. Revenues and profits are for telephone operations of the Bell System Consolidated (including the 20 operating subsidiaries andthe Long Lines and General departments of American Telephone and Telegraph Company) and for two affiliated telephone companies, whichtogether represent about 85 per cent of all telephone operations. Dividends are for the 20 operating subsidiaries and the two affiliates. Dataare obtained from the Federal Communications Commission.
All series. Profits before taxes refer to income after all charges and before Federal income taxes and dividends. For description of seriesand back figures, see pp. 662-666 of the BULLETIN for June 1949 (manufacturing); pp. 215-217 of the BULLETIN for March 1942 (public utilities);and p. 908 of the BULLETIN for September 1944 (electric power).
OCTOBER 1954 1091
Digitized for FRASER http://fraser.stlouisfed.org/ Federal Reserve Bank of St. Louis

PROFITS, TAXES, AND DIVIDENDS OFUNITED STATES CORPORATIONS
[Quarterly estimates at seasonally adjustedrates. In billions of dollars]
Year orquarter
1939194119431945
19461947194819491950
195119521953
1953—1234
1954—121. . .
Profitsbeforetaxes
6.417.024.619.0
22.629.532.826.240.0
41.237.239.4
42.441.940.932.5
34.534.5
In-cometaxes
1.47.6
14.110.7
9.111.312.510.417.8
22.520.021.1
22.722.521.917 A
17.017.0
Profitsaftertaxes
5.09.4
10.58.3
13.418.220.315.822.1
18.717.218.3
19.719.519.015.1
17.517.5
Cashdivi-dends
3.84.54.54.7
5.86.57.27.59.2
9.19.19.4
9.19.39.59.6
9.69.6
annual
Undis-tributedprofits
1.24.96.03.6
7.711.713.08.3
12.9
9.68.18.9
10.610.29.55.5
7.97.9
i Preliminary estimates by Council of EconomicAdvisers.
Source.—Department of Commerce.
NET CHANGE IN OUTSTANDING CORPORATE SECURITIES *
[Estimates, in millions of dollars]
Year orquarter
1945
19461947.. .19481949..1950
195119521953
1953—2. . .3 . . .4 . . .
1954—1. . .2. . .
Newissues
6,457
7,1806,8827,5706,7317,224
9,04810,6799,594
2,9321,8672,465
2,7002,858
All types
Retire-ments
6
4?113
2??
1
,906
798,523,683,875,501
,772, 7S1,335
607530584
977,139
Netchange
-449
2.38?4543
677
211
11
,887,856,724
,277Q?7
,?SQ
,325,337,882
,724,719
Bonds
Newissues
4,924
4,7215,0155,9384,8674,806
5,6827,3446,705
2,0961,3271,789
1,6191,863
and notes
Retire-ments
5
3?112
2?1
,996
625,011,283,583,802
,105403
,820
458417464
758847
Netchange
-1,072
1,0963,0044,6553,2842,004
3,5774,9404,885
1,638910
1,325
8621,016
Newissues
1
?1112
33?
1
,533
,4SQ867
,632864
,418
,3663,3 S
,889
836540676
,081995
Stocks
Retire-ments
910
1,173512400292698
666348514
148113119
219292
Netchange
11111
27?
623
?86, 355,23257?.
,77,0
,700,98737.S
687427557
862703
1 Reflects cash transactions only. As compared with data shown on p. 1090, newissues exclude foreign and include investment company offerings, sales of securitiesheld by affiliated companies or RFC, special offerings to employees, and also newstock issues and cash proceeds connected with conversions of bonds into stocks. Re-tirements include the same types of issues, and also securities retired with internalfunds or with proceeds of issues for that purpose shown on p. 1090.
Source.—Securities and Exchange Commission.
CURRENT ASSETS AND LIABILITIES OF UNITED STATES CORPORATIONS *[Estimates, in billions of dollars]
End of yearor quarter
Networkingcapital
Current assets
Total CashU. S.Gov-
ernmentsecurities
Notes and accts.receivable
U. S.Govt.2 Other
Inven-tories Other
Current liabilities
Total
Notes and accts.payable
U. S.Govt.3 Other
Federalincome
taxliabilities
Other
1939194119431945
19461947194819491950
19511952
1953—34
1954—12
24.532.342.151.6
56.262.168.672.481.7
86.590.1
93.592.6
92.994.1
54.572.993.897.4
108.1123.6133.0133.1161.5
179.1186.2
191.0189.7
183.3178.7
10.813.921.621.7
22.825.025.326.528.1
30.030.6
30.030.7
27.828.7
2.24.0
16.421.1
15.314.114.816.819.7
20.720.4
20.621.5
19.716.8
.0
.65.02.7
22.127.421.923.2
.7 30.038.342.443.0
1.1 55.7
2.72.8
2.72.6
2.82.4
58.864.7
66.965.0
63.262.9
18.025.627.626.3
37.644.648.945.355.1
64.965.4
68.367.5
67.365.3
.4
.4
.3
.4
.7
.6
.6
.4
.7
2.12.4
2.42.4
2.52.6
30.040.751.645.8
51.961.564.460.779.8
92.696.1
97.597.1
90.484.6
.0
.82.2
.9
21.925.624.124.8
.1 31.537.639.337.5
.4 47.9
1.32.3
2.52.2
2.52.4
53.657.8
57.557.3
53.952.0
1.27.1
16.610.4
8.510.711.59.3
16.7
21.317.7
17.918.7
14.911.6
6.97.28.79.7
11.813.213.514.014.9
16.518.3
19.618.9
19.118.6
1 Excludes banks and insurance companies. 2 Receivables from and payables to U. S. Government do not include amounts offset againsteach other on corporations' books. Source.—Securities and Exchange Commission.
BUSINESS EXPENDITURES ON NEW PLANT AND EQUIPMENT *[Estimates, in millions of dollars]
Year
19391945. . . .
19461947194819491950
1951195219531954*
Total
5,5128,692
14,84820,61222,05919,28520,605
25,64426,49328.39126,687
Manu-factur-
ing
1,9433,983
6,7908,7039,1347,1497,491
10,85211,63212.27611,332
Min-ing
326383
427691882792707
929985
1.0111,008
Rail-roads
280548
583889
1,3191,352L ,111
1,4741,396I 312
851
Trans-porta-tion
otherthanrail
365574
9231 2981,285
8871,212
1,4901,5001.4641,405
Publicutili-ties
520505
7921 5392,5433,1253,309
3,6643,8874.5484,274
Com-muni-
cations
302321
8171,3991,7421,3201,104
1,3197,7.7,
Other»
1,7762,378
4,5166 0935 1544,6605,671
5,916094778818
Quarter
1952—4
1953—12 .34 .
1954—i23*44. . .
Total
7 206
6,3397 2897 0987 666
6,2406,9186,9806,549
Manu-factur-
ingandmin-ing
3 490
2,9723 4263 2103 680
2,8643,1983,2553,022
Trans-porta-
tionind.rail-
roads
728
650725686717
608600559490
Publicutili-ties
1 150
9251 1581 2191 246
9101,1081,1791,078
Allother*
1 839
1,7921 9791 9842 023
1,8592,0131,9871,960
Corporate and noncorporate business, excluding agriculture. 2 Includes trade, service, finance, and construction.3 Includes communications and other. 4Anticipated by business.Sources.—Department of Commerce and Securities and Exchange Commission.
1092 FEDERAL RESERVE BULLETIN
Digitized for FRASER http://fraser.stlouisfed.org/ Federal Reserve Bank of St. Louis
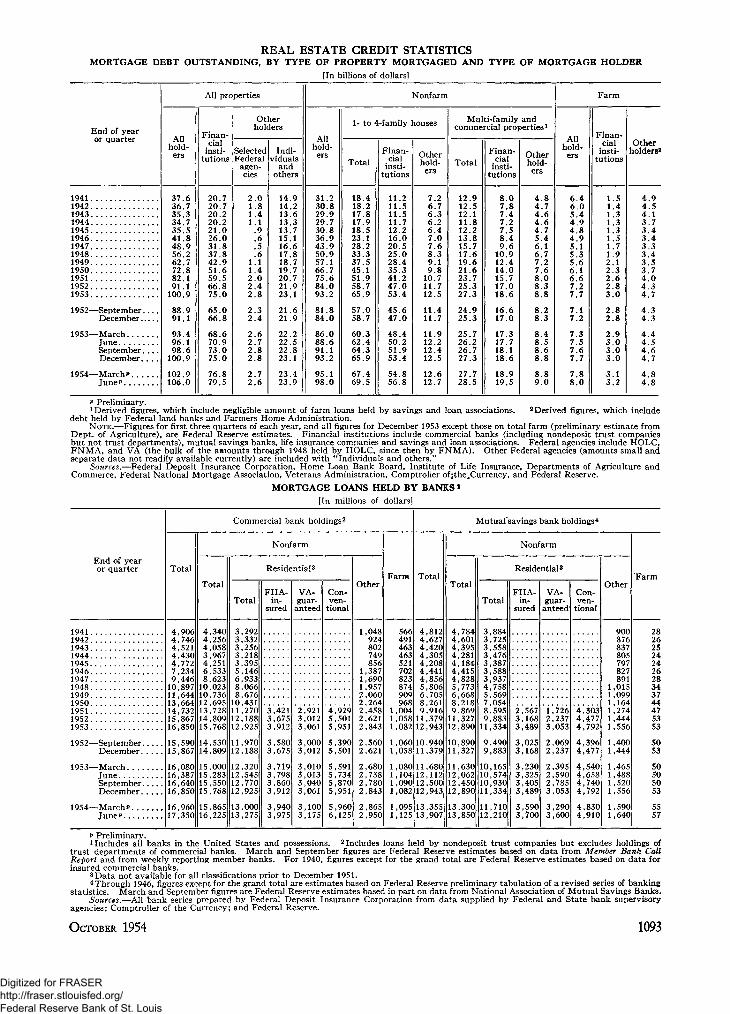
REAL ESTATE CREDIT STATISTICSMORTGAGE DEBT OUTSTANDING, BY TYPE OF PROPERTY MORTGAGED AND TYPE OF MORTGAGE HOLDER
[In billions of dollars]
End of yearor quarter
1 9 4 1 • .194219431944194519461947194819491950195119521953
1952—SeptemberDecember
1953—MarchJuneSeptember.. . .December. . . .
1954—MarchPJune?
All properties
Allhold-ers
37 636.735.334.735.541 848.956 262.772 882.191 1
100.9
88.991.1
93.496.198.6
100.9
102.9106.0
Finan-cial
insti-tutions
20 720.720.220.221.026.031.837 842.951 659.566 875.0
65.066.8
68.670.973.075.0
76.879.5
Otherholders
SelectedFederal
agen-cies
2 01.81.41.1
.9
.6
.5
.61.11 42.02 42 . 8
2.32.4
2.62.72.82.8
2.72 . 6
Indi-viduals
andothers
14 914.213.613.313.715.116.617 818.719.720.721 923.1
21.621.9
22.222.522.823.1
23.423.9
Allhold-ers
31 230.829.929.730.836.943.950.957.166.775.684 093.2
81.884.0
86.088.691.193.2
95.198.0
^onfarm
1- to 4-family houses
Total
18.418.217.817.918.523.128.233.337.545.151.958.765.9
57.058.7
60.362.464.365.9
67.469.5
Finan-cial
insti-tutions
11.211.511.511.712.216.020.525.028.435.341.247.053.4
45.647.0
48.450.251.953.4
54.856.8
Otherhold-ers
7 .26.76.36.26.47.07.68.39.19.8
10.711.712.5
11.411.7
11.912.212.412.5
12.612.7
Multi-family andcommercial properties1
Total
12 912.512.111.812.213.815.717.619.621.623.725.327.3
24.925.3
25.726.226.727.3
27.728.5
Finan-cial
insti-tutions
8 07.87.47.27.58.49.6
10.912.414.015.717.018.6
16.617.0
17.317.718.118.6
18.919.5
Otherhold-ers
4 84.74.64.64.75.46.16.77.27.68.08.38 . 8
8.28.3
8.48.58.68.8
8.89 . 0
Farm
Allhold-ers
6 46.05.44 94.84 95.15 35.66 16.67 27.7
7.17.2
7.37.57.67.7
7.88 . 0
Finan-cial
insti-tutions
L.4i.3
31.3
S7
1 92.12 32.62 83 . 0
2.82.8
2.93.03.03.0
3.13 . 2
Otherholders2
4 94.54.13.73.43 43.33 43.53 74.04 34 7
4.34.3
4.44.54.64.7
4 84.8
p Preliminary.1 Derived figures, which include negligible amount of farm loans held by savings and loan associations. 2 Derived figures, which include
debt held by Federal land banks and Farmers Home Administration.NOTE.—Figures for first three quarters of each year, and all figures for December 1953 except those on total farm (preliminary estimate from
Dept. of Agriculture), are Federal Reserve estimates. Financial institutions include commercial banks (including nondeposit trust companiesbut not trust departments), mutual savings banks, life insurance companies and savings and loan associations. Federal agencies include HOLC,FNMA, and VA (the bulk of the amounts through 1948 held by HOLC, since then by FNMA). Other Federal agencies (amounts small andseparate data not readily available currently) are included with "Individuals and others."
Sources.—Federal Deposit Insurance Corporation, Home Loan Bank Board, Institute of Life Insurance, Departments of Agriculture andCommerce, Federal National Mortgage Association, Veterans Administration, Comptroller ofithe^Currency, and Federal Reserve.
MORTGAGE LOANS HELD BY BANKS *
19411942.194319441945.19461947.1948.19491950.19511952.1953
End of yearor quarter
1952—SeptemberDecember
1953—MarrhTuneSeptemberDecember
1954—MarrhPJune?
Total
4,9064,7464,5214 4304,7727,2349,446
10,89711,64413,66414,73215,86716,850
15,59015,867
16,08016,38716,64016,850
16,96017,350
Total
4,3404,2564,0583,9674,2516,5338,623
10,02310,73612,69513,72814,80915,768
14,53014,809
15,00015,28315,55015,768
15,86516,225
[In millions of
Commercial bank holdings2
Total
3,2923,3323,2563,2183,3955,1466,9338,0668,676
10,43111,27012,18812,925
11,97012,188
12,32012,54512,77012,925
13,00013,275
Nonfarm
Residential^
FHA-in-
sured
333
33
3333
33
67SQ1?
,580,675
719798
,860,912
940,975
VA-guar-
anteed
'2*9213,0123,061
3,0003,012
3,0103,0133,0403,061
3,1003,175
Con-ven-
tional
4
s55
555
S6
Q ? Q
5019S1
,390,501
SQ1734
,870,951
960,125
Other
1,048924802749856
1,3871,6901,9572,0602,2642,4582,6212,843
2,5602,621
2,6802,7382,7802,843
2,8652,950
dollars]
Farm
111
11
111
11
56649146346352170?8238749099680040580 8 ?
,060,058
080104
,090,082
09 S,125
Total
4,8124,6274,4204,3054,2084,4414,8565,8066,7058,2619,916
11,37912,943
10,94011,379
11,68012,11212,50012,943
13,35513,907
Total
4,7844,6014,3954,2814,1844,4154,8285,7736,6688,2189,869
11,32712,890
10,89011,327
11,63012,06212,45012,890
13,30013,850
Mutual savings bank holdings4
Total
3,8843,7253,5583,4763,3873,5883,9374,7585,5697,0548,5959,883
11,334
9,4909,883
10,16510,57410,93011,334
11,71012,210
]Vonfarm
Residential 3
FHA-in-
sured
ry
33
33
3333
33
S67168489
025168
?30
405489
S90700
VA-guar-
anteed
1,7262,2373,053
2,0692,237
2,3952,5902,7853,053
3,2903,600
Con-ven-
tional
444
44
4444
44
3034777 9 ?
396477
540658740792
830910
Other
111111
11
1111
11
9008768378057978?7891
,0150Q9
,164?74444SS6
,400,444
465488
,520,556
5Q0,640
Farm
28262524242628343744475353
5053
50505053
5557
P Preliminary.includes all banks in the United States and possessions. 2 Includes loans held by nondeposit trust companies but excludes holdings of
trust departments of commercial banks. March and September figures are Federal Reserve estimates based on data from Member Bank CallReport and from weekly reporting member banks. For 1940, figures except for the grand total are Federal Reserve estimates based on data forinsured commercial banks.
3 Data not available for all classifications prior to December 1951.4 Through 1946, figures except for the grand total are estimates based on Federal Reserve preliminary tabulation of a revised series of banking
statistics. March and September figures are Federal Reserve estimates based in part on data from National Association of Mutual Savings Banks.Sources.—All bank series prepared by Federal Deposit Insurance Corporation from data supplied by Federal and State bank supervisory
agencies; Comptroller of the Currency, and Federal Reserve.
OCTOBER 1954 1093
Digitized for FRASER http://fraser.stlouisfed.org/ Federal Reserve Bank of St. Louis
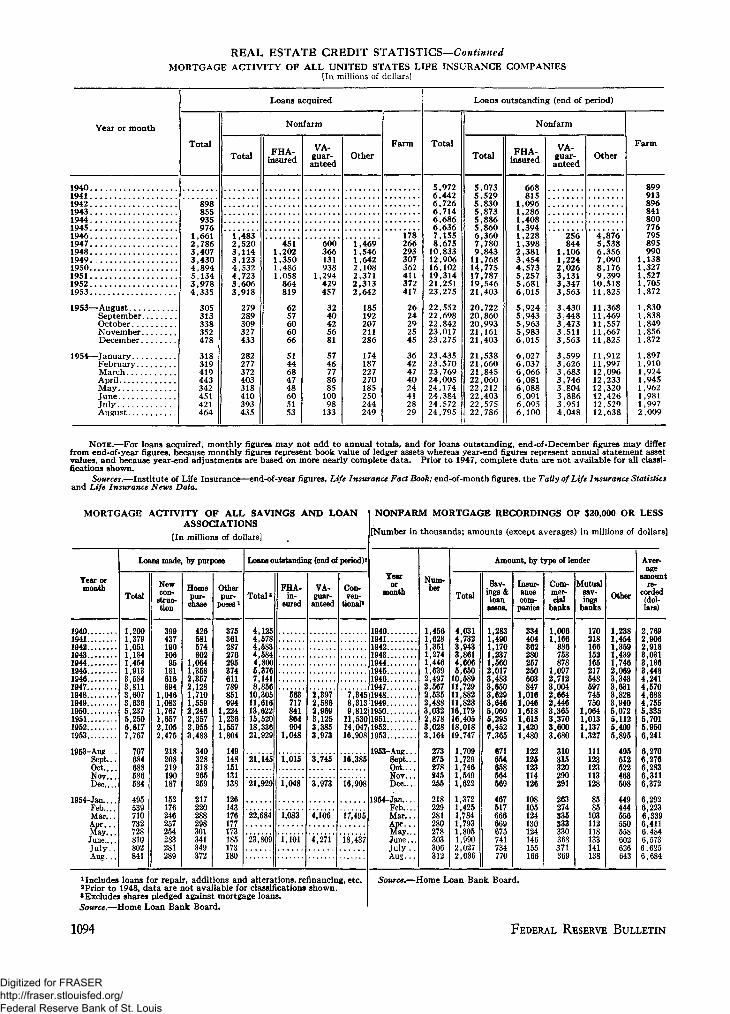
REAL ESTATE CREDIT STATISTICS—ContinuedMORTGAGE ACTIVITY OF ALL UNITED STATES LIFE INSURANCE COMPANIES
[In millions of dollars]
Year or month
19401941194219431944194519461947194819491950195119521953
1953—AugustSeptember . . . .OctoberNovemberDecember .
1954—January . .FebruaryMarch
May. . .June..JulyAugust
Loans acquired
Total
898855935976
1,6612,7863,4073,4304,8945,1343,9784,335
305313338352478
318319419443342451421464
Nonfarm
Total
1,4832,5203,1143,1234,5324,7233,6063,918
279289309327433
282277372403318410393435
FHA-insured
4511,2021,3501,4861,058
864819
6257606066
5144684748605153
VA-guar-anteed
600366131938
1,294429457
3240425681
5746778685
10098
133
Other
1,4691,5461,6422,1082,3712,3132,642
185192207211286
174187227270185250244249
Farm
178266293307362411372417
2624292545
3642474024412829
Loans outstanding (end of period)
Total
5,9726,4426,7266,7146,6866,6367,1558,675
10,83312,90616,10219,31421,25123,275
22,55222,69822,84223,01723,275
23,43523,57023,76924,00524,17424,38424,57224,795
Nonfarm
Total
5,0735,5295,8305,8735,8865,8606,3607,7809,843
11,76814,77517,78719,54621,403
20,72220,86020,99321,16121,403
21,53821,66021,84522,06022,21222,40322,57522,786
FHA-insured
668815
1,0961,2861,4081,3941,2281,3982,3813,4544,5735,2575.6816,015
5,9245,9435,9635,9836,015
6,0276,0376,0666,0816,0886,0916,0956,100
VA-guar-anteed
256844
1,1061,2242,0263,1313,3473,563
3,4303,4483,4733,5113,563
3,5993,6263,6833,7463,8043,8863,9514,048
Other
4,8765,5386,3567,0908,1769,399
10,51811,825
11,36811,46911,55711,66711,825
11,91211,99712,09612,23312,32012,42612,52912,638
Farm
899913896841800776795895990
1
,138,327,527,705,872
1,830,838
1,849,856,872
,897,910
L.9241,945
,9621,9811,9972,009
NOTE.—For loans acquired, monthly figures may not add to annual totals, and for loans outstanding, end-of-December figures may differfrom end-of-year figures, because monthly figures represent book value of ledger assets whereas year-end figures represent annual statement assetvalues, and because year-end adjustments are based on more nearly complete data. Prior to 1947, complete data are not available for all classi-fications shown.
Sources.—Institute of Life Insurance—end-of-year figures, Life Insurance Fact Book; end-of-month figures, the Tally of Life Insurance Statisticsand Life Insurance News Data.
M O R T G A G E J
Year ormonth
194019411942 . ..19431944194519461947194819491950195119521953
1953-Aug ..Sept...Oct... .Nov.. .Dec....
1954-Jan.Feb....Mar...Apr. . .MayJune....Ju ly . .Aug...
ACTIVITY OF ALL SAVINGS AND LOANASSOCIATIONS
[In millions of dollars]
Loans made
Total
1,2001,3791 0511 1841,4541,9133,5843,8113,6073,6365,2375 2506,6177,767
707684688586584
495539710732728810802841
Newcon-
struc-tion
39943719010695
181616894
1,0461,0831,7671 6572,1052,475
218208219190187
152176246257254283281289
by purpose
Homepur-chase
426581574802
1,0641,3582,3572,1281,7101,5592,2462 3572.9553,488
340328318265259
217220288298301341349372
Otherpur-
poses1
375361287276295374611789851994
1,2241 2361,5571,804
149148151131138
126143176177173185173180
Loans outstanding (end of period)2
Total*
4,1254,5784 5834,5844,8005,3767,1418,856
10,30511,61613,62215 52018,33621,929
21,145
21,929
22,684
23,809
FHA-in-
sured
563717841864904
1,048
1,015
1,048
1,083
1,101
VA-guar-
anteed
2,3972,5862,9693 1253,3853.973
3,745
3,973
4,106
4,271
Con-ven-
tional'
7,3458,3139,812
11 53014,04716,908
16,385
16,908
17,495
18,437
1 Includes loans for repair, additions and alterations, refinancing, etc.2Prior to 1948, data are not available for classifications shown.3 Excludes shares pledged against mortgage loans.Source.—Home Loan Bank Board,
NONFARM MORTGAGE RECORDINGS OF $20,000 OR
[Number in thousands; amounts (except averages) in millions of
Yearor
month
19401941194219431944 . .1945ig461947194819491950195119521953
1953-Aug...Sept...Oct....Nov. . .D e c . . .
1954-Jan....Feb....Mar...Apr. . .May.June...July . .Aug.. .
Num-ber
1,4561,6281,3511,2741,4461,6392,4972,5672,5352,4883,0322 8783,0283,164
273275278845255
218229281280278303306312
Amount, by type of lender
Total
4,0314,7323 9433,8614,6065,650
10,58911,72911,88211,82816,17916 40518,01819,747
J 7ftQ1,7291,7461,5491,622
1,3721,4251,7841,7931,8051,990> 0272,086
Sav-ings &loan
assns.
1,2831,4901 1701,2371,5602,0173,4833,6503,6293,6465,0605 2956,4527,365
671654658564569
467517666669675741734770
Insur-ancecom-
panies
334404362280257250503847
1,0161,0461,6181 6151,4201,480
122125123114126
108105124130124146155166
Com-mer-cial
banks
1,0061,166
886753878
1,0972,7123,0042,6642,4463,3653 3703,6003.680
310315320290291
263274335333330368371369
Mutualsav-ings
banks
170218166152165217548597745750
1,0641 0131,1371,327
111123123113128
8585
103112118133141138
Other
1,2381,4541 3591,4391,7462,0693,3433,6313,8283,9405,0725 1125,4095,895
495512522468508
449444556550558602626643
LESS
dollars]
Aver-age
amountre-
corded(dol-lars)
2,7692,9062 9183,0313,1863,4484,2414,5704,6884,7555,3355 7015.9506,241
6,2706,2766,2836,3116,372
6,2926,2236,3396,4116 4846,5736,6256,684
Source.—Home Loan Bank Board.
1094 FEDERAL RESERVE BULLETIN
Digitized for FRASER http://fraser.stlouisfed.org/ Federal Reserve Bank of St. Louis
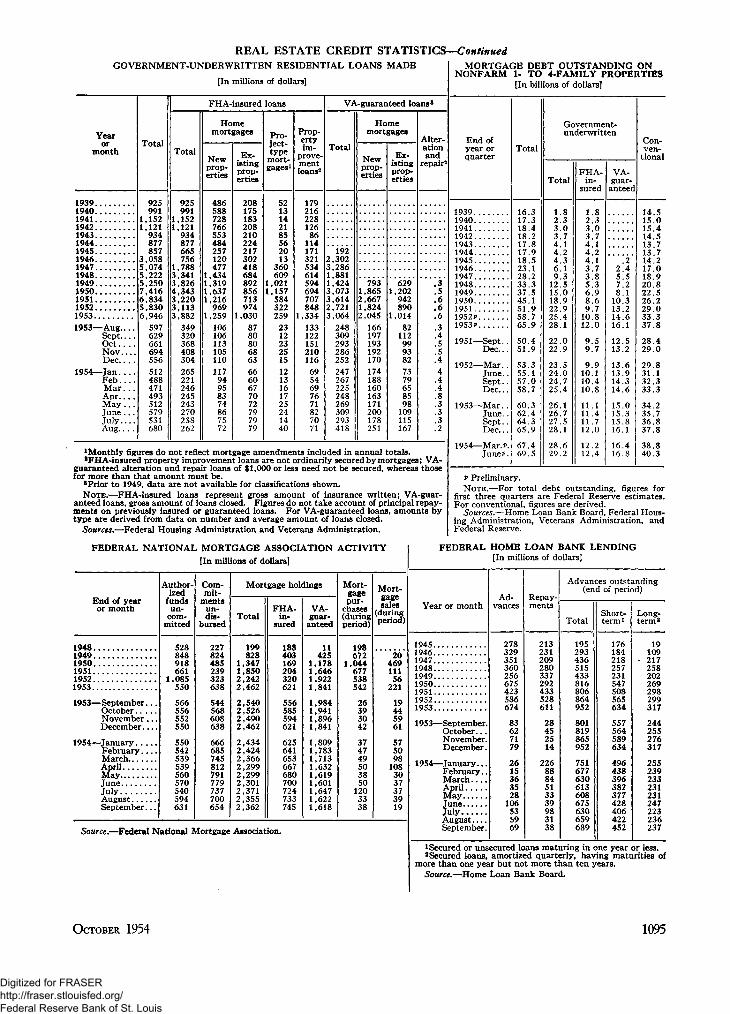
REAL ESTATE CREDIT STATISTICS—ContinuedGOVERNMENT-UNDERWRITTEN RESIDENTIAL LOANS
Yearor
month
1939194019411942194319441945194619471948194919501951195219531953—Aug....
SeptOctN o v . . .Dec.. . .
1954—JanF e b . . . .Mar. . .A p r . . . .M a y . . .June . . .Ju ly . . . .Aug.. . .
Total
925991
1,1521,121
934877857
3,0585,0745,2225,2507,4166,8345,8306,946
597629661694556
512488471493512579531680
[In millions of dollars]
FHA-insured loans
Total
925991
1,1521,121
934877665756
1,7883,3413,8264,3433,2203,1133,882
349320368408304
265221246245243270238262
Homemortgages
Newprop-erties
486588728766553484257120477
1,4341,3191,6371,216
9691,259
106106113105110
11794958374867572
Ex-istingprop-erties
208175183208210224217302418684892856713974
1,0308780806863
6660677072797979
Pro-ject-type
mort-gages1
5213142185562013
360609
1,0211,157
584322259
2312232515
1213161725241440
Prop-ertyim-
prove-mentloans2
179216228126
86114171321534614594694707848
1,334133122151210116
6954697671827071
MADE
VA-guaranteed loans8
Total
1922,3023,2861,8811,4243,0733,6142.7213,064
248309293286252
247267225248269309293418
Homemortgages
Newprop-erties
7931,8652,6671,8242,045
166197193192170
174188160163171200178251
1 Monthly figures do not reflect mortgage amendments included in annual t
Ex-istingprop-erties
6291,202
942890
1,01482
112999382
7379658598
109115167
otals.aFHA-insured property improvement loans are not ordinarily secured by mortgages
guaranteed alteration and repair loans of $1,000 or lesfor more than that amount must be.
•Prior to 1949, data are notNOTE.—FHA-insurec loans
available for ch
s neea ilot De secured,
issifications shown.represent gross amount of
Alter-ationand
repair2
. 3
. 5
. 6
. 6
. 6
.3
.4
.5
.5
.4
4.4.4.8.3.3.3.2
; VA-wnereas tnose
insurance written: VA-guar-anteed loans, gross amount of loans closed. Figures do not take account of principal repay-ments on previously insured or guaranteed loans. For VA-guaranteed loanstype are derived from data on number and average amount of loans closed.
Sources.—Federal Housing Administration and Veterans Administration.
, amounts by
MORTGAGE DEBT OUTSTANDINGNONFARM
End ofyear orquarter
19391940194119421943194419451946194719481949195019511952P1953?
1951—Sept..Dec.. .
1952—Mar. .June..Sept. .Dec...
1953—Mar. .June..Sept. .Dec...
1954—Mar. P.JuneP.
1- TOON
4-FAMILY PROPERTIES[In billions of dollars]
Total
16 317 318 418 217 817 918 523 128 233 337 545 151 958 765.9
50.451.9
53.355.157.058.7
60.362.464.365.9
67.469.5
P Preliminarv.NOTE.—For total
Government-underwritten
Total
1 82 33 03 74 14 24 36 19 3
12 515 018 922 925 428.1
22.022.9
23.524.024.725.4
26.126.727.528.1
28.629.2
FHA-in-
sured
1 82 33 03 74 14 24 13 73 85 36 98 69 7
10 812.0
9 . 59 . 7
9 . 910.110.410.8
11.111.411.712.0
12.212.4
VA-guar-anteed
22 45 57 28 1
10 313 214 616.1
12.513.213.613.914.314.6
15.015.315.816.116.416.8
Con-ven-
tional
14 515 015 414 513 713 714 217 018 920 822 526 229 033 337.8
28.429.0
29.831.132.333.3
34.235.736.837.8
38.840.3
debt outstanding, figures forfirst three quarters are Federal Reserve estimates.For conventional, figures are derived.
Sources.—Home Loan Bank Board.ing Administration, VeteransFederal Reserve.
Federal Hous-Administration, and
FEDERAL NATIONAL MORTGAGE ASSOCIATION ACTIVITY
[In millions of dollars]
FEDERAL HOME LOAN BANK LENDING[In millions of dollars]
End of yearor month
1948194919501951.19521953
1953—September...OctoberNovember . . .December.. . .
1954—JanuaryFebruary . . . .MarchAprilMayJuneTulyAugustSeptember...
Author-ized
fundsun-
com-mitted
528848918661
1.085550
566556552550
550542539539560570540594631
Com-mit-
mentsun-dis-
bursed
227824485239323638
544568608638
666685745812791779737700654
Mortgage holdings
Total
199828
1,3471,8502,2422,462
2,5402,5262,4902,462
2,4342,4242,3662,2992,2992,3012,3712,3552,362
FHA-in-
sured
188403169204320621
556585594621
625641653667680700724733745
VA-guar-
anteed
11425
1,1781,6461.9221,841
1,9841,9411,8961,841
1,8091,7831,7131,6321,6191,6011,6471,6221,618
Mort-gagepur-
chases(duringperiod)
198672
1,044677538542
26393042
374749503850
1203338
Mort-gagesales
(duringperiod)
2046911156
221
19445961
575098
1083037373919
Year or month
Source.—Federal National Mortgage Association.
194519461947194819491950195119521953
1953—September.October.. .November.December.
1954—January...February.March . . .AprilMayJuneJulyAugustSeptember.
Ad-vances
278329351360256675423586674
83627179
2615363528106535969
Repay-ments
213231209280337292433528611
28452514
2268884513339983138
Advances outstanding(end of period)
Total
195293436515433816806864952
801819865952
751677630613608675630659689
Short-term1
176184218257231547508565634
557564589634
496438396382377428406422452
Long-term2
19109217258202269298299317
244255276317
255239233231231247223236237
1 Secured or unsecured loans maturing in one year or less.2 Secured loans, amortized quarterly, having maturities of
more than one year but not more than ten years.Source.—Home Loan Bank Board.
OCTOBER 1954 1095
Digitized for FRASER http://fraser.stlouisfed.org/ Federal Reserve Bank of St. Louis

STATISTICS ON SHORT- AND INTERMEDIATE-TERM CONSUMER CREDITCONSUMER CREDIT, BY MAJOR PARTS
[Estimated amounts outstanding, in millions of dollars]
End of yearor month
1939194019411Q42
1945 . . .194619471948194919501951 . . .19521953
1953—AugustSeptemberOctoberNovemberDecember
1954—JanuaryFebruaryMarchAprilMayTuneJulyAugust
Total
7,2228,3389,1725,983
5,6658,384
11,57014,41117,10420,81321,46825,82728,896
27,81027.97928,16628,25228,896
28.12527,47827,15127.33027,52027,79127,83527,932
Instalment credit
Total
4,5035,5146,0853,166
2,4624,1726,6958,968
11,51614,49014,83718,68421,807
21,21821,34721.48621,58621,807
21 44421 15120.90020,90920,93221,12221,24621,310
Automobilepaper i
1,4972,0712,458
742
455981
1,9243,0544,6996,3426,2428,099
10,289
10,13610,23210,33710,35810,289
10.0849,9159.8009.7989,8389,980
10,10310,158
Otherconsumer
goodspaper i
1,6201,8271,9291,195
8161,2902,1432,8423,4864,3374,2705,3285,605
5.3625.3525,3665,4065,605
5,4955,3775,2205,1885,1425,1345.0045,069
Repairand mod-ernization
loans2
298371376255
182405718843887
1,0061,0901,4061,606
I 5341,5621,5851.6041,606
1,5871 ,5701,5541,5541,5651,5631 ,5661,569
Personalloans
1,0881,2451,322
974
1,0091,4961,9102,2292,4442,8053,2353,8514,307
4 1864 2014,1984,2184,307
4,2784.2894.3264,3694,3874,4454,4834,514
Noninstalment credit
Total
2,7192,8243,0872,817
3,2034,2124,8755,4435,5886,3236,6317,1437,089
6,5926,6326.6806.6667,089
6.6816,3276,2516,4216,5886,6696,5896,622
Single-payment
loans
787800845713
7461,1221,3561,4451,5321,8211,9342,0942,127
2,1312,1302,1312,1002,127
2,0832,0542,0732,1052,1812,2152 ,1932,203
Chargeaccounts
1 ,4141,4711,6451 ,444
1,6122,0762,3532,7132,6803,0063,0963,3423,249
2,6682,7162,8112,8403,249
2 8932,5502,4382,5662,6392,6792,6142,642
Servicecredit
518553597660
R4«?,014,166.285,376,496,601.707
1,713
1,7931,7861,7381,7261,713
1,7051,7231,7401,750
,7681,7751,7821,777
1 Includes all consumer instalment credit extended for the purpose of purchasing automobiles and other consumer goods and secured by theitems purchased, whether held by retail outlets or financial institutions. Includes credit on purchases by individuals of automobiles or otherconsumer goods that may be used in part for business.
2Includes only repair and modernization loans held by financial institutions; such loans held by retail outlets are included in "other consumergoods paper."
NOTE.—Monthly figures for the period December 1939 through 1951 and a general description of the series are shown on pp. 336-354 of theBULLETIN for April 1953. Revised monthly figures for 1952 are shown on p. 1214 of the BULLETIN for November 1953. A detailed descriptionof the methods used to derive the estimates may be obtained from Division of Research and Statistics.
INSTALMENT CREDIT, BY HOLDER
[Estimated amounts outstanding, in millions of dollars]
End of yearor month
1939194019411942 .
1945194619471948 . . .19491950195119521953
1953—AugustSeptemberOctoberNovemberDecember
1954—JanuaryFebruaryMarchApril . .MayJuneJuly-August
Totalinstal-mentcredit
4,5035.5146,0853.166
2.4624.1726.6958,968
11 .51614.49014.83718.68421.807
21 ,21821.34721.48621,58621.807
21.44421 15120,90020,90920,93221 ,12221.24621,310
Financial institutions
Total
3,0653,9184.4802,176
1,7763,2355,2557,0929,247
11,82012,07715,41018,534
18,20518.32818 43918 49518.534
18,27617,99917,84517.85917,89618,06918.19818,258
Com-mercialbanks
1,0791,4521,726
862
7451,5672,6253,5294,4395,7985,7717,5248,856
8.8798,8938 9088.8818.856
8,7238.5348,4528,4178,3868,4018.3798,348
Salesfinancecom-
panies
1,1971,5751,797
588
300677
1,3551,9902,9503,7853,7694,8336,147
5.9246,0056.0936.1476.147
6,0625.9745,8925.9015,9446,0606.1896,256
Creditunions
132171198128
102151235334438590635837
1.064
L 009L.0291.041I ,0501,064
1.043I .0551,0741.0961,1151,1451,1651,185
Other
657720759598
629840
1,0401,2391,4201.6471.9022.2162,467
2 3932 4012 3972 4172.467
2.4482.4362.4272,4452,4512,4632.4652,469
Total
1,4381,5961,605
990
686937
1.4401,8762,2692,6702,7603.2743,273
3 0133 0193 0473.0913.273
3.1683 1523.0553.0503.0363.0533.0483,052
Depai t-ment
stores1
354394320181
131209379470595743920
1.1171.068
931943957983
1.068
1.0311 .0941,0561,0581,0511,0611 .0551,056
Retail
Furni-ture
stores
439474496331
240319474604724791760866866
813811812826866
83681479578978778 S783785
outlets
House-hold
appli-ance
stores
183196206111
173879
127168239207244276
263265266270276
270265261260257259262260
Auto-mobile
dealers2
123167188
53
2847
101159239284255308407
396399406408407
400393388388390397404408
Other
339365395314
270324407516543613618739656
610601606604656
631586555555551551544543
includes mail-order houses.3Includes only automobile paper; other instalment credit held by automobile dealers is included with "other" retail outlets
1096 FEDERAL RESERVE BULLETIN
Digitized for FRASER http://fraser.stlouisfed.org/ Federal Reserve Bank of St. Louis

STATISTICS ON SHORT- AND INTERMEDIATE-TERM CONSUMER CREDIT— Continued
NONINSTALMENT CREDIT, BY HOLDER
[Estimated amounts outstanding, in millions of dollars]
End of yearor month
1939194019411942
194519461947194819491950195119521953
1953—AugustSeptember.October. . .November.December.
1954—January- • •February..M a r c h . . . .AprilMayJuneJulyAugust . . . .
Totalnon-
instal-mentcredit
2,7192,8243,0872,817
3,2034,2124,8755,4435,5886.3236,6317,1437,089
6,5926,6326,6806,6667,089
6,6816,3276,2516,4216,5886,6696,5896,622
Financialinstitutions(single-pay-ment loans)
Com-mer-cial
banks
625636693593
6741,0081,203L.2611,334L.5761,684,844
1,848
1,8701,8571,867L .798L.848
,824L ,782,780,812,841,893,908,907
Other
162164152120
72114153184198245250250279
261273264302279
259272293293340322285296
Retailoutlets(charge
accounts)
De-part-ment
stores1
236251275217
29045253257S584641685730769
453500524578769
631541497515512509459457
Other
1,1781,2201,3701,227
1,3221,6241,8212,1382,0962,3652,4112,6122.480
2,2152,2162,2872,2622,480
2,2622,0091.9412,0512,1272,1702,1552,185
Servicecredit
518553597660
8451,0141,1661,2851,3761,4961,6011,7071,713
L ,7931,786L ,7381,7261,713
1,705L ,723,740,750,768,775,782,777
1 Includes mail-order houses.
INSTALMENT CREDIT HELD BY SALES FINANCECOMPANIES, BY TYPE OF CREDIT
[Estimated amounts outstanding, in millions of dollars]
End of yearor month
1939194019411942
194519461947194819491950 .195119521953
1953—AugustSeptember. . .OctoberNovember. . .December
1954—JanuaryF e b r u a r y . . . .MarchAprilMayJuneJulyAugust
Totalinstal-mentcredit
1,1971,5751,797
588
3 0 0677
1,3551,9902,9503,7853,7694,8336,147
5,9246,0056,0936,1476,147
6,0625,9745,8925,9015,9446,0606,1896,256
Auto-mobilepaper
8781,1871,363
341
164377802
1,3782,4253,2573,1834,0725,306
5,1085,1865,2725,3215.306
5,2285,1505,0795,0895,1365,2495,3715,436
Othercon-
sumergoodspaper
115136167
78
2467
185232303313241332367
374375372368367
359351340336331331335335
Repairand
modern-izationloans
148190201117
58141242216
8357708283
7274767983
8685848483838282
Per-sonalloans
56626652
5492
126164139158275347391
370370373379391
389388389392394397401403
INSTALMENT CREDIT HELD BY COMMERCIAL BANKS,BY TYPE OF CREDIT
[Estimated amounts outstanding, in millions of dollars]
End of yearor month
1939194019411942
194519461947194819491950195119521953
1953—AugustSeptember.October. . .November.December.
1954—January.. .February..M a r c h . . . .AprilMayJuneJulyAugust . . . .
Totalinstal-mentcredit
1,0791,4521,726
862
7451,5672,6253,5294,4395,7985,7717,5248,856
8,8798,8938,9088,8818,856
8,7238,5348,4528,4178,3868,4018,3798,348
Automobilepaper
Pur-chased
111
:rA
'x
237339447149
66169352575849
1,1771,1351,633J.135
>,123>,141',157>,1502,135
>,079>,024,994,980,969,979,978,971
Direct
178276338134
143311539753946
1,2941,3111,6291,884
1,9571,9481,9391,9201,884
1,8341,8091,7991,7941,7911,7921,7831,769
Other
con-sumergoodspaper
166232309153
114299550794
1,0161,4561,3151,7512,038
2,0562,0362,0322,0272,038
2,0371,9371,8871,8621,8391,8211,7911,767
Repairand
mod-erniza-
tionloans
135165161124
110242437568715834888
1,1371,301
1,251L,2731,2911,3031,301
1,2831,267L,253L .2521,2591,2571,2611 ,262
Per-sonalloans
363440471302
312546747839913
1,0371,1221,3741.498
1,4921,4951,4891,4811,498
1,4901,4971,5191,5291,5281,5521,5661,579
INSTALMENT CREDIT HELD BY FINANCIAL INSTITU-TIONS OTHER THAN COMMERCIAL BANKS AND SALES
FINANCE COMPANIES, BY TYPE OF CREDIT
[Estimated amounts outstanding, in millions of dollars]
End of yearor month
1939194019411942
194519461947194819491950195119521953
1953—AugustSeptember. . .OctoberNovember. . .December
1954—JanuaryF e b r u a r y . . . .MarchAprilMayJuneJulyAugust
Totalinstal-mentcredit
789891957726
731991
1,2751,5731,8582,2372,5373,0533,531
3,4023,4303,4383,4673,531
3,4913,4913,5013,5413,5663,6083,6303,654
Auto-mobilepaper
81102122
65
5477
130189240330358457557
552558563559557
543539540547552563567574
Othercon-
sumergoodspaper
24303627
20346999
137182209279334
315321321328334
331330326328326326324323
Repairand
modern-izationloans
15161414
1422395989
115132187222
211215218222222
218218217218223223223225
Per-sonalloans
669743785620
643858
1.0371,2261,3921,6101,8382,1302,418
2,3242,3362,3362,3582,418
2,3992,4042,4182,4482,4652,4962,5162,532
NOTE.—Institutions included are consumer finance companies (oper-ating primarily under State small-loan laws), credit unions, industrialloan companies, mutual savings banks, savings and loan associations,and other lending institutions holding consumer instalment loans.
OCTOBER 1954 1097
Digitized for FRASER http://fraser.stlouisfed.org/ Federal Reserve Bank of St. Louis

STATISTICS ON SHORT- AND INTERMEDIATE-TERM CONSUMER CREDIT—ContinuedINSTALMENT CREDIT EXTENDED AND REPAID
[Estimates, in millions of dollars]
Year or mouth
19401941
19451946194719481949 .1950195119521953
WITHOUT SEASONAL ADJUSTMENT
1953—AugustSeptemberOctoberNovemberDecember
1954—JanuaryFebruaryMarchAprilMay . .JuneJulyAugust . . .
SEASONALLY ADJUSTED*
1953—AugustSeptemberOctoberNovemberDecember
1954—JanuaryFebruaryMarchAprilMay. . . . .JuneJulyAugust . . .
Total
Extended
8.2199,425
5,3798,495
12,7131S,54018,00221,25622,79128,39729,812
2,4362,3892,4862,2972,598
1.8691,8642,2852,3152,2992,6032.4722,424
2,3582 4092,3932,4412,331
2,2112,2432,2002,2722,2242,3982,3792,355
Repaid
7.2088.854
5.0936.785
10,19013,26715,45418,28222,44424,55026,689
2,2222,2602,3472,1972,377
2,2322,1572,5362,3062,2762,4132,3482,360
2,2732,2522,2492,2942,283
2,3012,3202,4122,3082,3332,3542,2962,413
Automobilepaper
Extended
3.0863.823
9991 ,9693,6925,2807,1828,9289,362
12,30613,553
1,1261,0891,121
974947
750776985998
1,0051,2021 ,1361,092
1,0441,1021,1171,0801,035
872919924926943
1,0751,0351,013
Repaid
2,5123,436
9411,4432,7494,1505,5377,2859,462
10,44911,363
963993
1,016953
1,016
955945
1,1001,000
9651,0601,0131,037
967962963
1,0061,015
9771,0281,0421,009
9881,038
9871,041
Other consumergoods paper
Extended
2.5882,929
2,0243,0774,4985,2805,5336,4586,5187,9597,741
619625668646824
517470540594580624591594
621600589631593
661586566621577614633599
Repaid
2.3812,827
1,9992,6033,6454,5814,8895,6076,5856,9017,464
608635654606625
627588697626626632631619
643633633619604
636612667610635628637655
Repair andmodernization loans
Extended
328312
206423704702721826853
1,2431,340
12012013110898
67819498
113101103107
108112111106102
87109103101107
889496
Repaid
255307
143200391577677707769927
1,140
10292
1088996
8698
11098
102103100104
10094
1009294
8199
107104113103
95102
Personalloans
Extended
2 2172.361
2,1503,0263,8194,2784,5665,0446,0586.8897,178
571555566569729
535537666625601676642631
585595576624601
591629607624597621617647
Repaid
2.0602,284
2,0102,5393,4053,9594,3514,6835,6286,2736,722
549540569549640
564526629"58258361&604600
563563553577570
607581596585597585577615
* Includes adjustment for differences in trading days.NOTE.—Back figures by months beginning January 1940, together with a discussion of the composition and characteristics of the data and a
description of the methods used to derive the estimates, are shown in the BULLETIN for January 1954, pp. 9-22. Estimates of instalment creditextended and repaid are based on information from accounting records of retail outlets and financial institutions and include finance, insurance,and other charges incurred under the instalment contract. Renewals and refinancing of loans, repurchases and resales of instalment paper, andcertain other transactions may increase the amount of both credit extended and credit repaid without adding to the amount of credit outstanding.
FURNITURE STORE STATISTICS
Item
Net sales:TotalCash salesCredit sales:
InstalmentCharge account
Accounts receivable, endof month:
Total ..InstalmentCharge accounts
Inventories, end ofmonth, at retail value.
Percentage changefrom preceding
month
Aug.1954
+7+4
+7+ 14
+ 7
0
July1954
- 3- 2- 3- 2
00
+ 1•?
June1954
+20
+20
00
- 1
- 5
Percentage changefrom correspondingmonth of preceding
year
Aug.1954
- 6- 7
- 6+2
- 3- 3- 2
- 9
July1954
- 4- 7
- 4+3
- 4- 4- 6
- 9
Tune1954
- 8- 9
- 9- 5
- 5- 3
- 1 0
- 9
RATIO OF COLLECTIONS TO ACCOUNTS RECEIVABLE *
Year or month
1953AugustSeptemberOctoberNovemberDecember
1954
JanuaryFebruaryMarchAprilMayJuneJulyAugust
Instalment accounts
Depart-mentstores
1414141414
1314151414141413
Furni-ture
stores
1212121111
1211131212121212
House-hold ap-pliancestores
10101099
99
109
10101010
Chargeaccounts
Depart-mentstores
4546484746
4543484546474545
1 Collections during month as percentage of accounts outstanding atbeginning of month.
1098 FEDERAL RESERVE BULLETIN
Digitized for FRASER http://fraser.stlouisfed.org/ Federal Reserve Bank of St. Louis
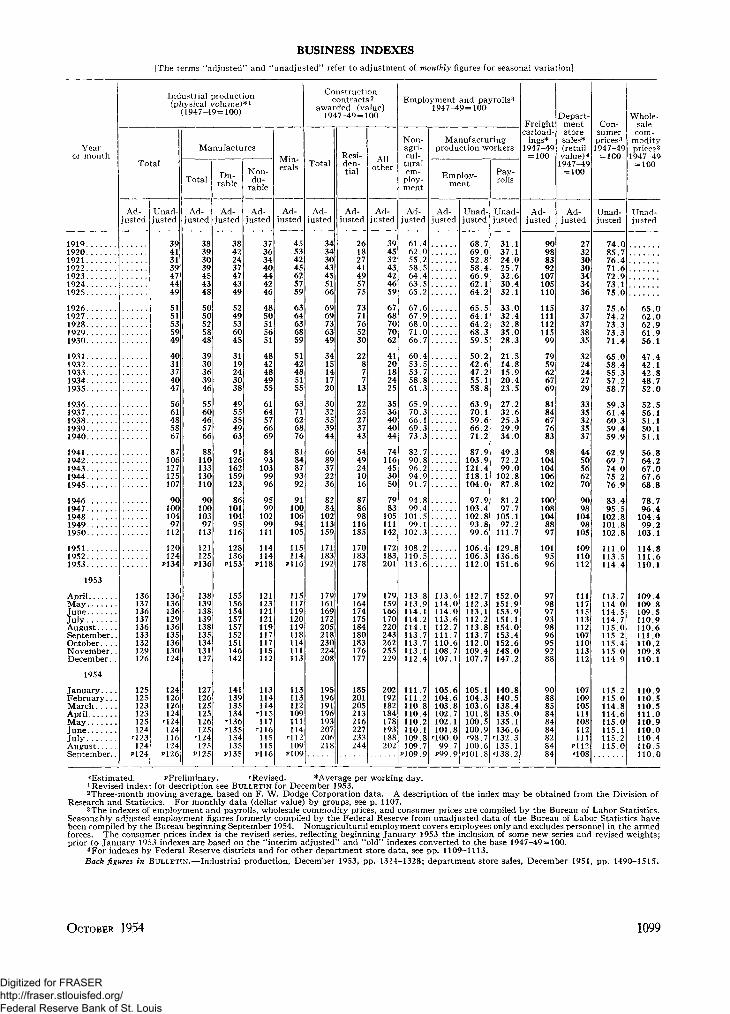
BUSINESS INDEXES[The terms "adjusted" and "unadjusted" refer to adjustment of monthly figures for seasonal variation]
Yearor month
1919192019211922192319241925
19261927192819291930
19311932193319341935
19361937193819391940
19411 9 4 2 . . . . . . .194319441945
19461947194819491950
195119521953
1953
AprilMayJuneJulyAugust .September..OctoberNovember..December. .
1954
January.. . .February.. .MarchAprilM a yJuneJulyAugustSeptember..
Industrial production(physical volume)*1
(1947-49 = 100)
Total
Ad-justed
136137136137136133132129126
125125123123125124
'123124
P124
Unad-justed
39413139474449
5151535949
4031374047
5661485867
87106127125107
9010010497
112
120124
?134
136136136129136135136130124
124126126124
'•124124116124
P126
Manufactures
Total
Ad-justed
38393039454348
5050525848
3930363946
5560465766
88110133130110
9010010397
113
121125
P136
138139138139138135134131127
127126125125126125
r124125
P125
Du-rable
Ad-justed
38422437474349
5249536045
3119243038
4955354963
91126162159123
8610110495
116
128136
P153
155156154157157152151146142
141139135134
'136••135134135
P135
N o n -du-
rable
Ad-justed
37363440444246
4850515651
4842484955
6164576669
8493
1039996
9599
10299
111
114114
P118
121123121121119117117115112
113114114
'115117
'116115115
P116
Min-erals
Ad-justed
45534245625759
6364636859
5142485155
6371626876
8184879392
9110010694
105
115114
P116
115117119120119118114111113
113113112109111114
'112109
P109
Constructioncontracts2
awarded (value)1947-49 = 100
Total
t Ad-justed
34343043455166
6969736349
3415141720
3032353944
6689372236
8284
102113159
171183192
179161169172205218230224208
195196191196193207206218
Resi-den-tial
Ad-justed
26182741495775
7371765230
22877
13
2225273743
5449241016
878698
116185
170183178
179164174175184180183176177
185201205213216227233244
other
Ad-justed
39453243424659
6768707062
4120182425
3536404044
74116453050
7983
105111142
172183201
179159166170220243262255229
202192182184178193188202
Employment and payrolls3
1947-49 = 100
Non-agri-cul-turalem-
ploy-ment
Ad-justed
61 462.055.258 564.463 565.2
67.667.968.071.066.7
60.453.553.758 861.3
65.970 366.169 373.3
82.790.896 294 991.7
94 899.4
101 599.1
102.3
108 2110.5113.6
113 8113.9114.1114.2114 1113.7113.7113.1112.4
111.7111.2110 8110.4110 2110 1109.8109.7
P109.9
Manufacturingproduction workers
Employ-ment
Ad-justed
113.6114.0114.0113.6112 7111.7110.6108.7107.1
105.6104.6103.8102.7102.1101.8
'100.099.7
P99.9
Unad-justed
68 769 052.858 466.962 164.2
65.564.164.268.359.5
50.242 647.255 158.8
63.970 159.666 271.2
87.9103.9121 4118 1104.0
97 9103 4102.893.899.6
106 4106.3112.0
112.7112.3113.1112.2113 8113.7112.0109.4107.7
105.1104.3103.6101.8100.5100.9'98.7100.6
P101.8
Pay-rolls
Unad-justed
31 137 124.025 732.630 432.1
33 032.432.835 028.3
21.514 815.920 423.5
27.232 625.329 934.0
49 372.299 0
102 887.8
81 297.7
105.197.2
111.7
129 8136.6151.6
152.0151.9153.9151.1154 0153.4152.6148.0147.2
140.8140.5138.4135.0135 1136.6
'132.3135.1
"138.2
Freightcarload-
ings*1947-49
= 100
Ad-justed
90988392
107105110
11511111211599
7959626769
8184677683
98104104106102
1001081048897
1019596
979897939896959288
908885848484828484
Depart-mentstoresales*(retailvalue)4
1947-49= 100
Ad-justed
27323030343436
3737373835
3224242729
3335323537
4450566270
9098
10498
105
109110112
111117115113112107110113112
107109105111108112111
P112"108
Con-sumerprices3
1947-49-1C0
Unad-justed
74 085 776 471 672 973 175.0
75 674 273.373 371.4
65.058 455.357 258 7
59.361 460.359 459 9
62 969.774 075 276.9
83 495 5
102.8101 8102.8
111 0113.5114.4
113.7114 0114.5114 7115 0115.2115.4115.0114.9
115.2115.0114.8114.6115 0115 1115.2115.0
Whole-salecom-
modityprices3
1947-49= 100
Unad-justed
65 062 062.961 956.1
47.442 142.848 752 0
52.556 151.150 151 1
56 864.267 067 668.8
78 796 4
104.499 2
103.1
114 8111.6110.1
109.4109.8109.5110 9110 6111.0110.2109.8110.1
110.9110.5110.5111.0110 9110 0110.4110.5110.0
Estimated. ^Preliminary. 'Revised. *Average per working day.1 Revised index; for description see BULLETIN for December 1953.2 Three-month moving average, based on F. W. Dodge Corporation data. A description of the index may be obtained from the Division of
Research and Statistics. For monthly data (dollar value) by groups, see p. 1107.3The indexes of employment and payrolls, wholesale commodity prices, and consumer prices are compiled by the Bureau of Labor Statistics.
Seasonably adjusted employment figures formerly compiled by the Federal Reserve from unadjusted data of the Bureau of Labor Statistics havebeen compiled by the Bureau beginning September 1954. Nonagricultural employment covers employees only and excludes personnel in the armedforces. The consumer prices index is the revised series, reflecting beginning January 1953 the inclusion of some new series and revised weights;prior to January 1953 indexes are based on the "interim adjusted" and "old" indexes converted to the base 1947-49 = 100.
4For indexes by Federal Reserve districts and for other department store data, see pp. 1109-1113.Back figures in BULLETIN.—Industrial production, Dscember 1953, pp. 1324-1328; department store sales, December 1951, pp. 1490-1515.
OCTOBER 1954 1099
Digitized for FRASER http://fraser.stlouisfed.org/ Federal Reserve Bank of St. Louis
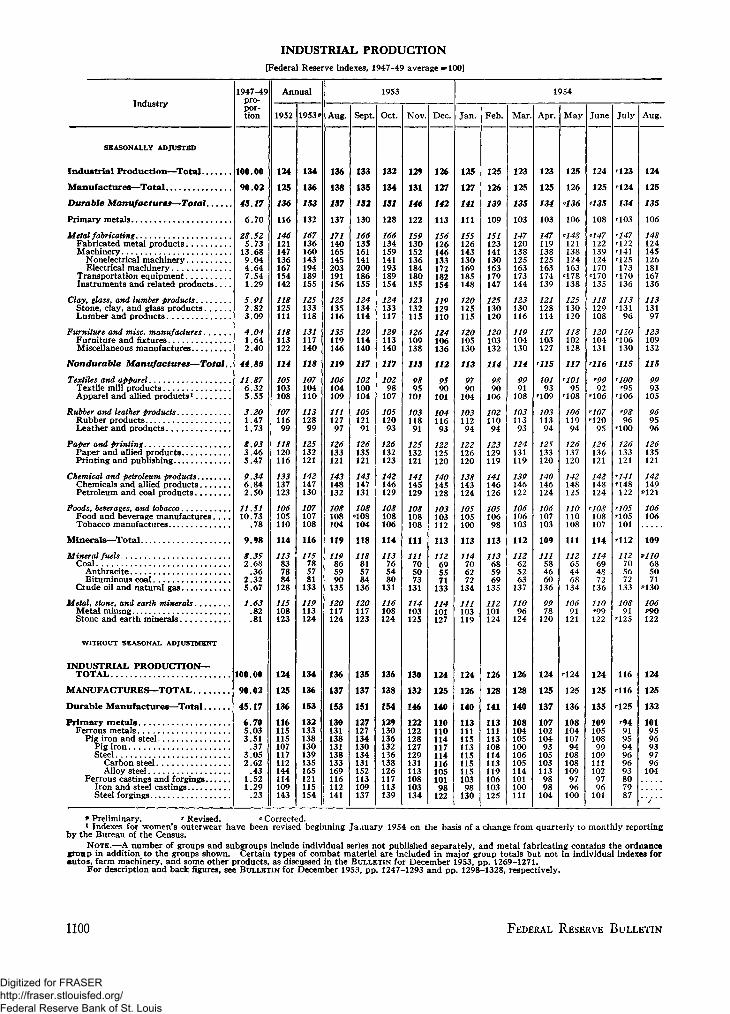
INDUSTRIAL PRODUCTION[Federal Reserve indexes, 1947-49 average = 100]
Industry1947-49
pro-por-tion
Annual
1952 1953*
1953
Aug. Sept. Oct. Nov. Dec.
1954
Jan. Feb. Mar. Apr. May June July Aug.
SEASONALLY ADJUSTED
Industrial Production—Total
Manufactures—Total
Durable Manufactures—Total
Primary metals
Metal fabricatingFabricated metal productsMachinery
Nonelectrical machineryElectrical machinery
Transportation equipmentInstruments and related products. . .
Clay, glass, and lumber productsStone, clay, and glass productsLumber and products
Furniture and misc. manufacturesFurniture and fixturesMiscellaneous manufactures
Nondurable Manufactures—Total
Textiles and apparelTextile mill productsApparel and allied products1
Rubber and leather ProductsRubber productsLeather and products
Paper and PrintingPaper and allied productsPrinting and publishing
Chemical and Petroleum productsChemicals and allied productsPetroleum and coal products
Foods, beverages, and tobaccoFood and beverage manufactures. . .Tobacco manufactures
Minerals—Total
Mineral fuelsCoal
AnthraciteBituminous coal. . .
Crude oil and natural gas
Metal, stone, and earth mineralsMetal miningStone and earth minerals
WITHOUT SEASONAL ADJUSTMENT
INDUSTRIAL PRODUCTION-TOTAL
MANUFACTURES—TOTAL
Durable Manufactures—Total..
Primary metalsFerrous metals
Pig iron and steelPig ironSteel
Carbon steelAlloy steel
Ferrous castings and forgings..Iron and steel castingsSteel forgings
100.00
90.02
43.17
6.70
28.525.73
13.689.044.647.541.29
5.912.823.09
4.041.642.40
44.85
11.876.325.55
3.201.471.73
8.933.465.47
9.346.842.50
11.5110.73
.78
9.98
8.352.68
.362.325.67
1.63.82.81
100.00
90.02
45.17
6.705.033.51.37
3.052.62.43
1.521.29.23
124
125
136
116
146121147136167154142
118125111
118113122
114
105103108
10711699
118120116
133137123
106105110
114
113837884128
115108123
124
125
136
116115115107117112144114109143
134
136
153
132
167136160143194189155
125133118
131117140
118
107104110
11312899
125132121
142147130
107107108
116
115785781133
119113
134
136
153
132133138130139135165121115154
136
138
137
137
171140165145203191156
125135116
135119146
119
106104109
11112797
126133121
143148132
108108104
119
119865990135
120117124
136
137
153
130131138131138133169116112141
133
135
132
130
166135161141200186155
124134114
129114140
117
102100104
10512191
126135121
143147131
108'108104
118
118815784136
120117123
135
137
151
127127134130134131152113109137
132
134
131
128
166134159141193189154
124133117
129113140
117
10298107
10512093
126132123
142146129
108108106
114
113765480131
116108124
136
138
154
129130136132136138126117113139
129
131
146
122
159130152136184180155
123132115
126109138
113
9895101
10311891
125132121
141145129
108108108
111
111705073131
114103125
130
132
146
122122128127129131113108103134
126
127
142
113
156126146133172182154
119129110
124106136
112
9590101
10411693
122125120
140145128
103103112
113
112695571133
114101127
124
125
140
11011011411711411610510198122
125
127
141
111
155126143130169185148
120125115
120105130
113
9790104
10311294
122126
138143124
105105100
113
114706272
134
111103119
124
126
140
11311111511311511511510398130
125
126
139
109
151123141130163179147
125130120
120103132
114
9890106
10211094
123129119
141146126
10510698
113
113685969135
112101124
126
128
141
113111113108114113119106103125
123
125
135
103
147120138125163173144
123130116
119104130
114
9991108
10311393
124131119
139146122
106106103
112
112625263137
11096124
126
128
140
108104105100106105114101100111
123
125
134
103
147119138125163174139
121128114
117103127
115
10193
1 09
10311394
125133120
140146124
106107103
109
HI584660136
9978120
124
125
137
107102104931051031139898104
125
126
°136
106
"148121138124163"178138
125130
102128
117
'10195
108
10611994
126137120
142148125
110110108
111
112654468134
10691121
124
125
136
108104107941081081099796100
124
125
108
'147122139124170'170135
118129108
120104131
nur9992
106
'107••12095
126136121
142148124
'108108107
114
114694872
136
110rOQ122
124
125
135
109105108991091111029796101
123
124
134
103
'147122'141125173
170136
113131
96
nzo106130
'100'95
106
'9896
100
12613312,1
148122
rlO5105101
'112
112705672
133
10891
125
116
116
125
'94919594969693807987
124
125
135
106
148124145126181167136
11313197
123109132
125
9993
105
969596
126135121
142149
P121
106106
109
PIIO685071
P 1 3 0
106P90122
124
125
132
1019596939796
104
* Preliminary. «• Revised. e Corrected.1 Indexes for women's outerwear have been revised beginning Jaauary 1954 on the basis of a change from quarterly to monthly reporting
by the Bureau of the Census.NOTE.—A number of groups and subgroups include individual series not published separately, and metal fabricating contains the ordnance
group in addition to the groups shown. Certain types of combat materiel are included in major group totals but not in individual indexes forautos, farm machinery, and some other products, as discussed in the BULLETIN for December 1953, pp. 1269-1271.
For description and back figures, see BULLETIN for December 1953, pp. 1247-1293 and pp. 1298-1328, respectively.
1100 FEDERAL RESERVE BULLETIN
Digitized for FRASER http://fraser.stlouisfed.org/ Federal Reserve Bank of St. Louis
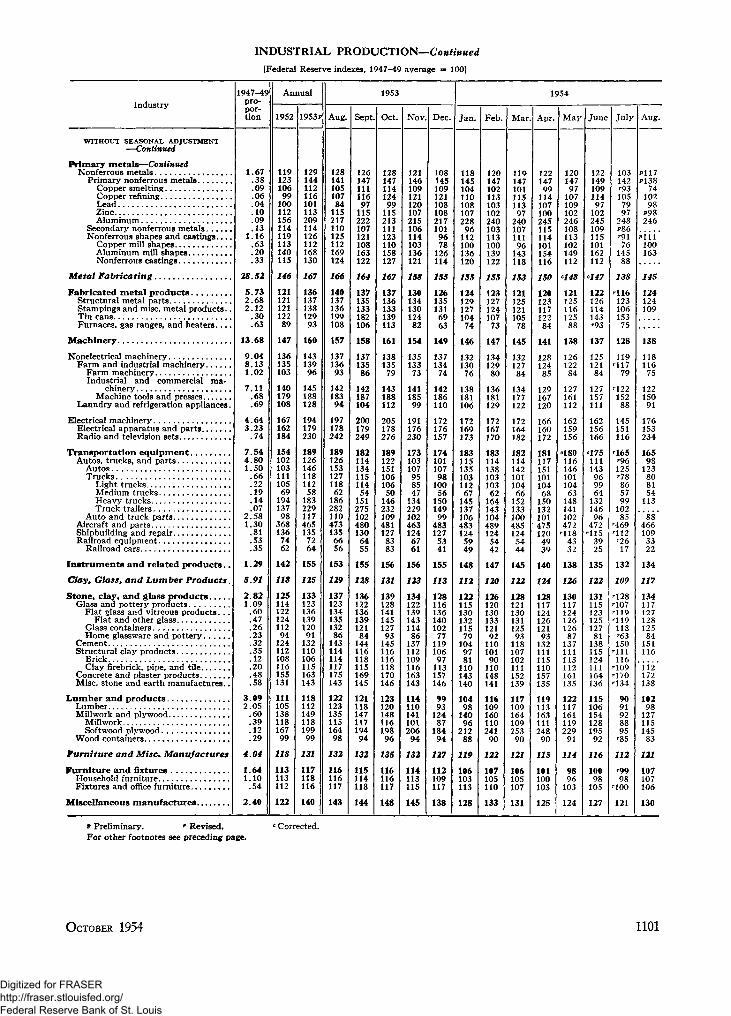
INDUSTRIAL PRODUCTION—Continued[Federal Reserve indexes, 1947-49 average = 100]
Industry1947-49
pro-por-tion
Annual
1952 1953
1953
Aug. Sept. Oct. Nov. Dec
1954
Jan. Feb. Mar. Apr. May June July Aug.
WITHOUT SEASONAL ADJUSTMENT—Continued
Mmary metals—ContinuedNonferrous metals
Primary nonferrous metalsCopper smeltingCopper refiningLeadZincAluminum
Secondary nonferrous metalsNonferrous shapes and castings..
Copper mill shapesAluminum mill shapesNonferrous castings
Metal Fabricating
Fabricated metal productsStructural metal partsStampings and misc. metal products.Tin cansFurnaces, gas ranges, and heaters...
Machinery
Nonelectrical machineryFarm and industrial machinery
Farm machineryIndustrial and commercial ma-
chineryMachine tools and presses
Laundry and refrigeration appliances
Electrical machineryElectrical apparatus and parts.Radio and television sets
Transportation equipment.Autos, trucks, and parts
AutosTrucks
Light trucksMedium trucksHeavy trucksTruck trailers
Auto and truck partsAircraft and partsShipbuilding and repairRailroad equipment
Railroad cars
Instruments and related products..
Clay, Glass, and Lumber Products.
Stone, clay, and glass productsGlass and pottery products
Flat glass and vitreous products. . .Flat and other glass
Glass containersHome glassware and pottery
CementStructural clay products
BrickClay firebrick, pipe, and tile
Concrete and plaster productsMisc. stone and earth manufactures..
Lumber and products..LumberMill work and plywood.
MillworkSoftwood plywood. . .
Wood containers
Furniture and Misc. Manufactures
Furniture and fixturesHousehold furnitureFixtures and office furniture...
Miscellaneous manufactures.
1.67.38.09.06.04.10.09.13
1.16.63.20.33
28.52
5.732.682.12.30.63
13.68
9.048.131.02
7.11.68.69
4.643.23.74
7.544.801.50.66.22.19.14.07
2.581.30.81.53
.35
1.29
5.912.821.09.60.47.26.23.32.35.12.20.48.58
3.092.05.60.39.12.29
4.04
1.641.10.54
2.40
11912310699100112156114119113140115
146
12112112112289
147
136135103
140179108
167162184
15410210311110569194137983681367462
142
118
12511412212411294124112108116155131
11110513811816799
118
113113112
122
129144112116101113209114126112168130
167
13613713812993
160
14313996
145188128
194179230
1891261461181125818322911746513572
64
155
12513312313613912091132110106115163143
11811214911819999
131
117118116
140
12814110510784115217110125112169124
166
140137136199108
157
13713693
14218394
197178242
1891261531271186218628211047313566
56
153
12913712313413513286143114114117175143
12212313511516498
132
116116117
143
12614711111697115222107121108163122
164
137135133182106
158
13713586
142187104
200179249
1821141341151145415127510248013064
55
155
12813612213613912184144116118115169145
12111814711719494
132
115114118
144
12814711412499115213111123110158127
167
137136133139113
161
13813579
143188112
205178276
1891221511061065014623210948112783
83
156
13113912814114512793145116116118170146
12312014811619896
135
116116117
148
121146109121120107215106114103136121
158
13013413012482
154
13513373
14118599
191176230
17310310795854713422910246312467
61
156
12313412213914311486137112109116163143
11411014110120694
132
114113115
145
1081451091211081082171019678126114
155
1261351316963
149
13713474
142186110
172176157
1741011079810056150149994831275341
155
113
1281161361401027711910697113157146
99931248718494
127
112109117
138
11814510411010810722896112100136120
155
12412912710474
146
13213076
138181106
172169173
1831151351031126714513710648312459
49
148
112
122115130132115791049781110143140104981409621288
119
106103113
128
120147102113103102240103113100139122
155
12312712410773
147
13412980
136181129
172167170
1831141381031036216414310448912454
42
147
1201261201301331219211010190110148141
11610916011024190
122
107105110
133
1471011151139724010711196143118
153
12112512110578
145
13212784
134177122
172164182
1821141421011046615213310048512454
44
145
12212812113013112593118107102111152139
11710916410925390
121
106105107
131
14799114107100245115114101154116
150
12012311712284
141
12812485
129167120
166160172
1811171511011046815013210147512049
39
140
12412811712412612193132111115110157135
11911316311124890
115
101100103
125
12014797107109102246108113102149112
'148
121125116125
138
12612284
127161112
162159156
«18011614610110463148141102472'11843
32
138
12613011712412612687137111113112161135
12211716111922991
114
9896103
124
12214910911497102245109115101162112
122126114143'93
137
12512184
127157111
162156166
'17511114396996413214696472'11539
25
135
12213111512312512781138115124111164136
11510615412819592
116
10098105
127
103142'931057997248
76145
P117P1387410298P98246
piii'100163
138
'11612310615375
128
119'11779
'122152
145151116
'165'96125•7886579910285
'469'112"•26
17
132
109'128107'119'119118'63150'111116'109'170'134
9091928895'85
112
'9998
'100
121
145
124124109
138
11811675
12215091
176153234
16598123808154113
4661093322
134
117
13411712712812584151116
iii'172138
1029812711514583
121
107107106
130
v Preliminary. r Revised.For other footnotes see preceding page.
e Corrected.
OCTOBER 1954 1101
Digitized for FRASER http://fraser.stlouisfed.org/ Federal Reserve Bank of St. Louis
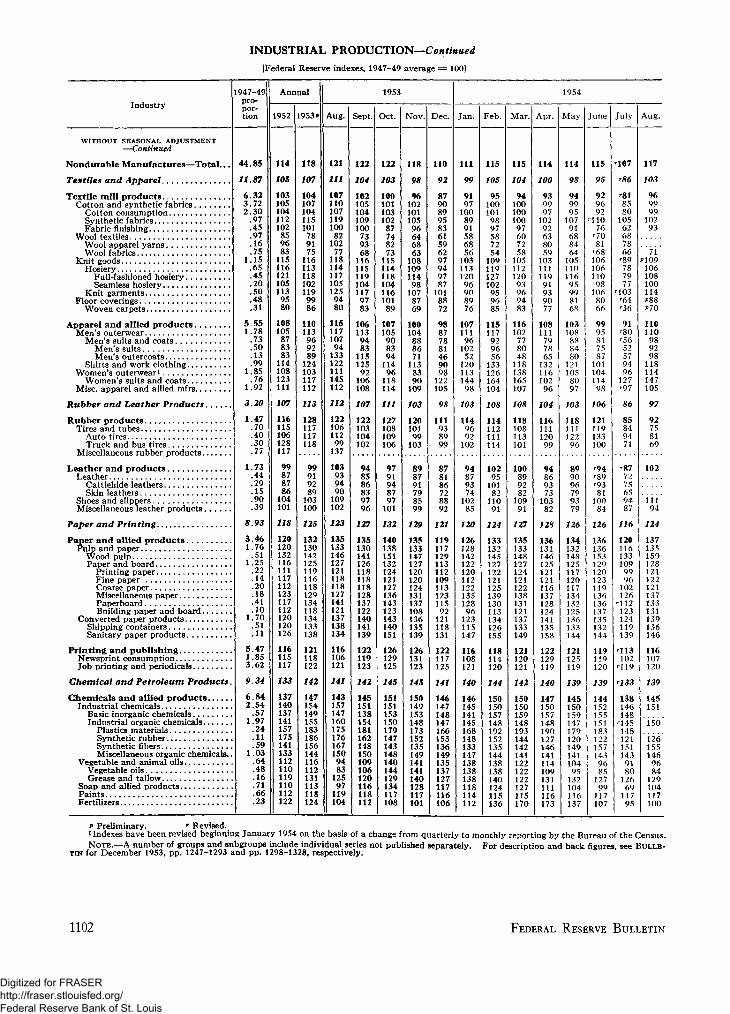
INDUSTRIAL PRODUCTION—Continued[Federal Reserve indexes, 1947-49 average = 100]
Industry
WITHOUT SEASONAL ADJUSTMENT
—Continued
Nondurable Manufactures—Total...
Textiles and Apparel.
Textile mill productsCotton and synthetic fabrics.
Cotton consumptionSynthetic fabricsFabric finishing
Wool textilesWool apparel yarnsWool fabrics
Knit goodsHosiery
Full-fashioned hosiery. . .Seamless hosiery
Knit garmentsFloor coverings
Woven carpets
Apparel and allied products . . .Men's outerwear
Men's suits and coatsMen's suitsMen's outercoats
Shirts and work clothingWomen's outerwear1
Women's suits and coatsMisc. apparel and allied mfrs.. .
Rubber and Leather Products.
Rubber productsTires and tubes
Auto tiresTruck and bus tires
Miscellaneous rubber products.
Leather and productsLeather
Cattlehide leathersSkin leathers
Shoes and slippersMiscellaneous leather products.
Paper and Printing
P a p e r a n d a l l i e d p r o d u c t s . . . .Pulp and paper
Wood pulpPaper and board
Printing paperFine paperCoarse paperMiscellaneous paperPaperboardBuilding paper and board.
Converted paper productsShipping containersSanitary paper p roduc ts . . . .
Printing and publishingNewsprint consumptionJob printing and periodicals.
Chemical and Petroleum Products
Chemicals and allied productsIndustrial chemicals
Basic inorganic chemicalsIndustrial organic chemicals
Plastics materialsSynthetic rubberSynthetic fibers #Miscellaneous organic chemicals.
Vegetable and animal oilsVegetable oilsGrease and tallow
Soap and allied productsPaintsFertilizers
947-49pro-por-tion
44.85
11.87
6.323.722.30.97.45.97.16.75
1.15.65.45.20.50.48.31
5.551.78.73.50.13.99
1.85.76
1.92
3.20
1.47.70.40.30.77
1.73.44.29.15.90.39
8.93
3.461.76.51
1.25.22.14.20.18.41.10
1.70.51.11
5.471.853.62
9.34
6.842.54.57
1.97.24.11.59
1.03.64.48.16.71.66.23
Annual
952 1953P
114
105
1031051041121028596831151161211051139580
108105878383114108123111
107
116115106128117
99878786104101
118
120120132116111117112123117112120120126
116115117
133
137140137141157175141133112110119110112122
118
107
1041071041151017891751161131181021199986
110113969289124103117112
113
128117117118
99919289103
125
132130142125119116118129134118134133138
121118122
142
147154149155183186156144116112131113118124
1953
Aug. Sept. Oct. Nov. Dec.
121
HI
10711010711910082102771181141171051259480
11511710794133122111145112
112
12210611299137
103939490109102
123
135133146127121118118127141121137138134
116106121
141
143157147160175176167150948312597119104
122
104
1021051041091007393681161151191041179783
106113948311512592106108
107
122103104102
948586839796
127
135130141126118118118128137122140141139
122119123
142
145151138154181162148150109106120116118112
122
103
1001011031028774827311511411810411610189
10710590839411496118114
111
127108109106
9791948797101
132
140138151132124121127136143123143140151
126129125
145
151151153150179147143148140144129134117108
118
98
9610210110596646863108109114981078769
1001048886711138390109
103
12010199103
898791798599
129
135133147127120120124131137108136135139
126131123
145
150149153148173152135149141141140128117101
110
92
8790899583615962979497871018872
98877881469098122105
98
111938999
878186728892
121
11911712911311210911312311592121118131
122117125
141
146147148147166153136149135137127117116106
Jan. Feb. Mar. Apr. May June July Aug,
111
99
9197100899158685610311312096908976
107111961025212011314498
103
1149692102
9487937410285
120
12612814212212011212213512896123115147
116108121
140
146145141145168148133147138138138118114112
115
105
951001019897587254109119127102959685
115117929656133126164104
108
114112111114
102951018211091
124
133132145127122121125139130113134126155
118114120
144
150150157148192152135144138138140124115136
115
104
941001001009760725810511212093969483
116102778048118138165107
108
118108113101
10089928210991
127
135133148127124121122138131121137133149
121120121
142
150150159148193144142141122122122127115170
114
100
9399971029263805910311111991939077
10811179786513211610296
104
11611112099
9486937310382
128
136131146125121121116137128124141135158
122129119
140
147150157148190127146141114109131111116173
114
98
9499951079168846410511011695998168
1031088884801211058097
103
11811112296
899096799379
126
134132148125117120117134132125136133144
121125119
139
14515015914717912014914110495132104116137
115
95
92969211076'7081'68106106110981068066
999581758710110411498
106
121119133100
'94'89'938110084
126
136136153129120123119136136137135132144
119119120
139
144152155151183122157143968512799117107
107
'86
'81858010562687866'89787977103'64
91'80'5652579496127'97
86
85849471
'877275659487
116
1201161331099996102126"112123124119139
113102'119
rl33
138146148'14514812115114391801266911795
117
103
96999910293
71109106108100114
110110989298118114147105
97
92758169
102
11194
124
137135150128121122121137133131139136146
116107120
139
145
151
150'
1261551469684
129104117100
P Preliminary. r Revised.iIndexes have been revised beginning January 1954 on the basis of a change from quarterly to monthly reporting by the Bureau of the Census.NOTE.—A number of groups and subgroups include individual series not published separately. For description and back figures, see BULLE-
TIN for December 1953, pp. 1247-1293 and pp. 1298-1328, respectively.
1102 FEDERAL RESERVE BULLETIN
Digitized for FRASER http://fraser.stlouisfed.org/ Federal Reserve Bank of St. Louis
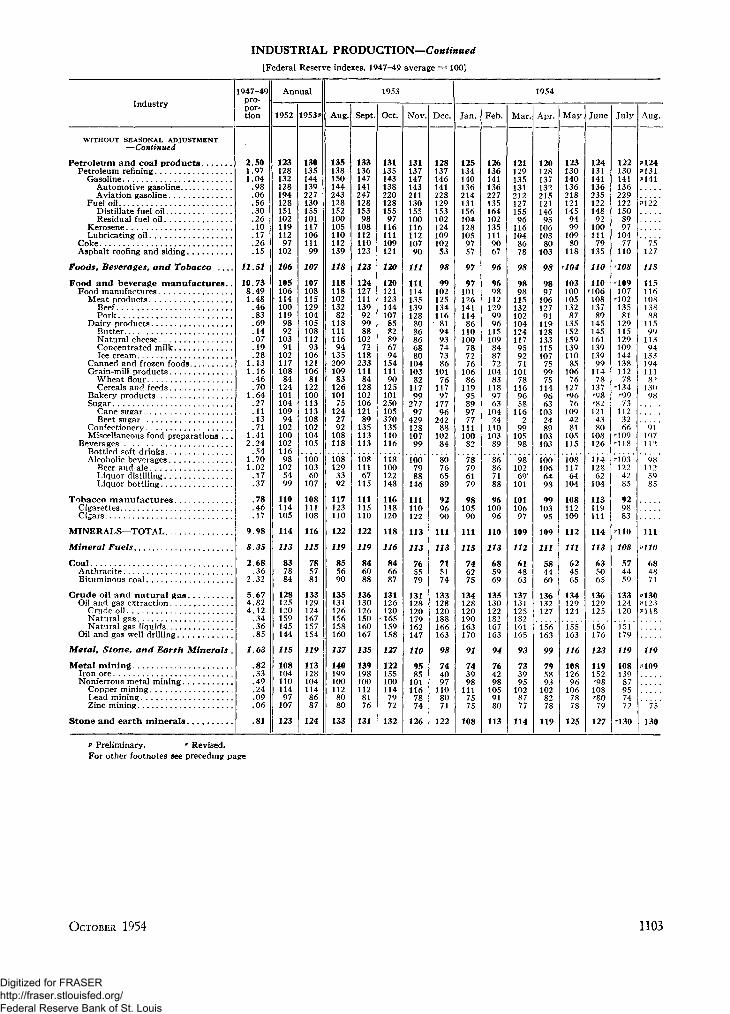
INDUSTRIAL PRODUCTION—Continued[Federal Reserve indexes, 1947-49 average = 100]
Industry
WITHOUT SEASONAL ADJUSTMENT
—Continued
Petroleum and coal productsPetroleum refiningGasoline. . .
Automotive gasolineAviation gasoline
Fuel oilDistillate fuel oilResidual fuel oil
KeroseneLubricating oil
Coke
Foods, Beverages, and Tobacco
Food and beverage manufactures..Food manufactures
Meat productsBeefPork
Dairy productsButterNatural cheeseConcentrated milkIce cream
Canned and frozen foodsGrain-mill products
Wheat flourCereals and feeds
Bakery productsSugar
Cane sugarBeet sugar
ConfectioneryMiscellaneous food preparations . . .
BeveragesBottled soft drinksAlcoholic beverages
Beer and aleLiquor distilling . .Liquor bottling
Tobacco manufacturesCigarettesCigars
MINERALS—TOTAL
Mineral Fuels
CoalAnthraciteBituminous coal
Crude oil and natural gasOil and gas extractionCrude oil
Natural gasNatural gas liquids
Oil and gas well drilling
Metal, Stone, and Earth Minerals .
Metal miningIron oreNonferrous metal mining
Copper miningLead miningZinc mining
Stone and earth minerals
1947-49pro-por-tion
2.501.971.04
.98
.06
.56
.30
.26
.10
.17
.26
.15
11.51
10.738.491.48
.46
.83
.69
.14
.07
.19
.281.131.16
.46
.701.64
.27
.11
.13
.711.412.24
.541.701.02
.17
.37
.78
.46
.17
9.98
8.35
2.68.36
2.32
5.674.824.12
.34
.36
.85
1.63
.82
.33.49
.24
.09
.06
.81
Annual
1952
12312813212819412815110211911297
102
106
1051061141001199892
10391
10211710884
12410110410994
10210010211698
1025499
110114105
114
113
837884
128125120159145144
115
10810411011497
107
123
1953P
13013514413922713015510111710611199
107
107108115129104105108112
93106121106
81122100113113108102104105
10010360
107
108111108
116
115
785781
133129124167157154
119
1131281041148687
124
1953
Aug.
135138150144243128152100105110112139
118
11811810213282
11811111694
135209109
8312610175
1242792
108118
1081293392
117123110
122
119
855690
135131126156158160
137
1401991001128080
133
Sept.
133136147141247128153
98108112110123
123
124127111139929988
10272
118233111
84128102106121
89135113113
10811167
115
111115110
122
119
846088
136130126150160167
135
1391981001128176
131
Oct.
131135143138220128155
97116111109121
120
1201211231441078582896794
15411190
125101250105370135110116
118100122148
116118120
118
116
846687
131126120
-165159158
127
1221551001147972
132
Nov.
13113714714321113015510011611210790
111
1111141351391288086866880
104103
8211799
27797
42912810799
1007988
146
111110122
113
113
765579
131128120179162147
110
9585101
1167874
126
Dec.
12813714614122812915310212410910253
98
99102125134116819493747386
10176
11797
17796
24288
10284
80766589
929690
111
113
715174
133128120188166163
98
744097
1108071
122
1954
Jan.
1251341401362141311561041281059757
97
9710112614111486
110100
787276
10686
11995899777
11110082
78796179
9810590
111
115
746 ?75
134128120190163170
91
743998
1117575
108
Feb.
1261361411362271351641021351119067
96
9698
1121299996
115109
848772
10483
1189763
10424
11010389
86867188
9610096
110
113
685969
135130122182167163
94
764298
1059180
113
Mar.
121129135131212127155
961161048678
98
9898
115132102104124117959271
10178
1169658
1162
9910598
9810269'
101
10110697
109
112
614863
137131125182161165
93
733995
1028777
114
Apr.
120128137132215121146
9310610380
103
98
9897
10612791
11912813311 5107
759975
1149663
1032489
103103
1001066498
9910395
109
111
584460
136132127
156163
99
795893
1028278
119
M a y
123130140136218121145
9499
10980
118
rlO4
10310010513287
135152159139110
85106
76127
76109
4281
105115
10811764
104
108112109
112
111
624565
134129124
155163
116
108
96106
7878
125
June
124131141136235122148
9210011179
135
no110
10813789
145145161139139
99114
78137'98
1214380
108126
11412862
104
113119111
114
113
635065
136129125
156176
123
119152' 98108'8079
127
July
122130141136229122150
8997
10477
110
rlO8
'109107
'10213581
129115129109144138112
78
'9973
1123266
'109'118
'1031224285
929883
'110
108
574459
133124120
151179
119
10813987957472
'130
Aug.
P124P\31P141
P122
75127
115
11511610813888
115Q9
11394
133194111
13098
91107112
981123985
111
P110
684871
P 1 1 8
119
P109
75
130
P Preliminary. r Revised.For other footnotes see preceding page
OCTOBER 1954 1103
Digitized for FRASER http://fraser.stlouisfed.org/ Federal Reserve Bank of St. Louis
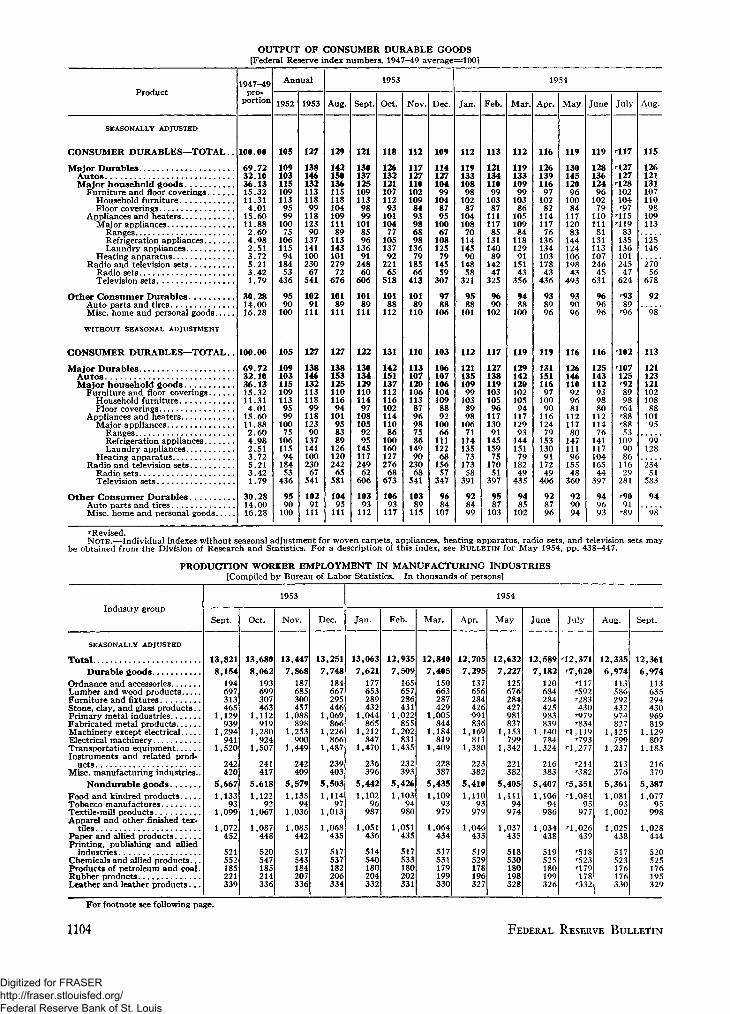
OUTPUT OF CONSUMER DURABLE GOODS[Federal Reserve index numbers, 1947-49 average=100]
Product
SEASONALLY ADJUSTED
CONSUMER DURABLES—TOTAL..
AutO8 •Major household goods
Household furniture
Appliances and heaters
Ranges . •Refrigeration appliances
Heating apparatusRadio and television sets
Television sets
Other Consumer DurablesAuto parts and tiresMisc. home and personal goods
WITHOUT SEASONAL ADJUSTMENT
CONSUMER DURABLES—TOTAL..
AutosMajor household goods
Furniture and floor coveringsHousehold furnitureFloor coverings . •
Appliances and heaters
Ranges . . . .Refrigeration appliancesLaundry appliances
Heating apparatusRadio and television sets
Radio setsTelevision sets
Other Consumer DurablesAuto parts and tiresMisc. home and personal goods
1947-49prc~
portion
100.00
69.7232 1036.1315.3211.314.01
15.6011.882 604.982.513.725.213.421.79
30.2814 0016.28
100.00
69.7232.1036.1315 3211.314.01
15.6011.882.604.982.513.725.213.421.79
30.2814 0016.28
Annual
1952
105
1091031151091139599
10075
10611594
18453
436
9590
100
105
1091031151091139599
10075
106115
94184
53436
9590
100
1953
127
138146132113118
9911812390
137141100230
67541
10291
111
127
13814613211311899
11812390
137141100230
67541
10291
111
1953
Aug.
129
142150136115118104109111
89113143101279
72676
10189
111
127
13815312511011694
101958389
126120242
65581
10495
111
Sept.
121
130137125109113
9899
1018596
13691
24860
606
10189
111
122
13013412911011497
108105
9295
145117249
62606
10393
112
Oct.
118
126132121107112
9310110477
10513792
22165
518
10188
112
131
142151137112116102114110
86100160127276
68673
10693
117
Nov.
112
117127110102109
8493986898
13679
18566
413
10189
110
110
1131071201061138796987586
14990
23068
541
10389
115
Dec.
109
114127104
99104
8795
10067
10812579
14559
307
9788
106
103
1061071061041098892
10066
111122
68156
57347
9684
107
1954
Jan.
112
119133108
98102
87104108
7011414590
14858
321
95' 88
101
112
12113510999
1038998
10671
114135
73173
58391
928499
Feb.
113
121134110
99103
87111117
8513114089
14247
325
9690
102
117
12713811910310596
117130
9114515975
17051
397
9587
103
Mar.
112
119133109
99103
86105109
8411812991
15143
356
9488
100
119
12914212010210594
117129
93144151
79182
49435
9485
102
Apr.
116
126139116
97102
82114117
76136134103178
43436
938996
119
13115111697
10090
116124
79153130
91172
49406
928796
M a y
119
130145120
96100
84117120
83144124106198
43493
939096
116
126146110929681
112117
80147111
96155
48360
929094
June
119
128136124
96102
79110111
81131113107246
45631
969696
116
125143112939880
112114
76141117104165
44397
949693
July
'117
'127127
'128102104'97
'115'119
83135136101245
47624
' 9 389
'96
'102
'107125'928998
'64'88' 8853
1099086
11629
281
'9091
'89
Aug.
115
126121131107110
98109113
125146
27056
678
92
98
113
12112312110210888
10195
99128
23451
583
94
98
••Revised.NOTE.—Individual indexes without seasonal adjustment for woven carpets, appliances, heating apparatus, radio sets, and television sets may
be obtained from the Division of Research and Statistics. For a description of this index, see BULLETIN for May 1954, pp. 438-447.
PRODUCTION WORKER EMPLOYMENT IN MANUFACTURING INDUSTRIES
Industry group
SEASONALLY ADJUSTED
Total
Ordnance and accessoriesLumber and wood productsFurniture and fixturesStone, clay, and glass products..Primary metal industriesFabricated metal productsMachinery except electrical
Transportation equipmentInstruments and related prod-
uctsMisc. manufacturing industries..
Food and kindred productsTobacco manufacturesTextile-mill productsApparel and other finished tex-
Paper and allied productsPrinting, publishing and allied
industries .Chemicals and allied products.. .Products of petroleum and coal.Rubber productsLeather and leather products. . .
[Compiled by Bureau of
Sept.
13,8218,154
194697313465
1,129939
1,294941
1,520
242420
5,6671,133
931,099
1,072452
521552185221339
Oct.
13,6808,062
193699307463
1,112919
1,280924
1,507
241417
5,6181,122
921,067
1,087448
520547185214336
1953
Nov.
13
7
1
1
1
51
1
1
,447,868187685300457
,088898
,253900
,449
74?409
,579,135
04,036
,085442
S17543184?07336
Labor Statistics.
Dec.
13
7
1
1
1
51
1
1
,251,74818466770S446
,069866
,226866
,487
739403
,503,114
97,013
,068435
517537182?06334
Jan.
13,0637,621
177653289432
1,044865
1,212847
1,470
236396
5,4421,102
96987
1,051436
514540180204332
In thousands of persons]
Feb.
12
7
1
1
1
51
1
,935,5091656577864310?7855
,202831
,435
737393
,426,103
94980
,051435
51753318070?331
Mar.
12,8407,405
150663287429
1,005844
1,184819
1,409
228387
5,4351,109
93979
1,064434
517531179199330
Apr.
12
7
1
1
51
1
,705
,295
H7656784426Q91836
,169811
,380
773382
,410
,11003
979
,046433
519529178196327
1954
M a y
12,632
7,227
125676284427981837
1,153799
1,342
221382
5,405
1,11194
974
1,037435
518530180198328
June
12,5897,182
120684284425983839
1,140784
1,324
216383
5,4071,106
94986
1,034438
519525180199326
July
' 1 ?
' 7
' 1
' 1
'5'1
' 1
371
,020'117'592
430rQ7Q'834,119r7QS,277
r?H'382,351,084
95977
,026439
'518'523'179178
'332
Aug.
1?6
1
1
51
1
1
J&35
,974
1135869Q?432074827
,125700
,237
91S376
,361,081
93,002
,025438
517523176176330
Sept.
12,3616,974
113635294430969819
1,129807
1,183
216379
5,3871,077
95998
1,028444
520525176195329
For footnote see following page.
1104 FEDERAL RESERVE BULLETIN
Digitized for FRASER http://fraser.stlouisfed.org/ Federal Reserve Bank of St. Louis
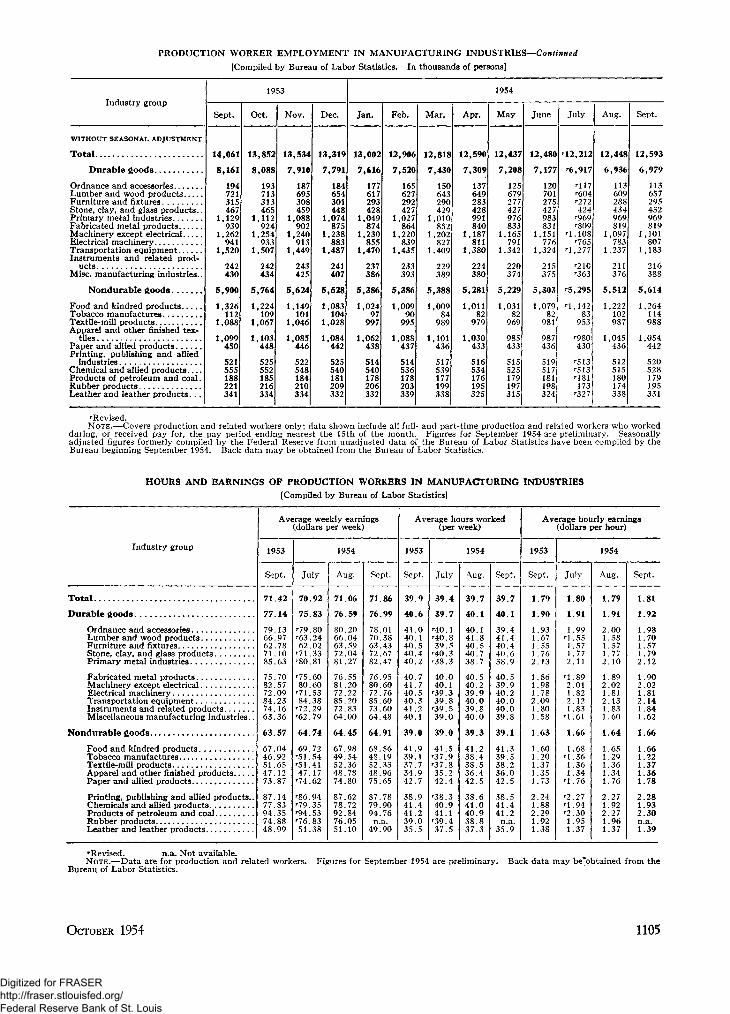
PRODUCTION WORKER EMPLOYMENT IN MANUFACTURING INDUSTRIES—Continued
[Compiled by Bureau of Labor Statistics. In thousands of persons]
Industry group1953
Sept. Oct. Nov. Dec,
1954
Jan. Feb. Mar. Apr. May June July Aug. Sept,
WITHOUT SEASONAL ADJUSTMENT
Total
Durable goods
Ordnance and accessoriesLumber and wood productsFurniture and fixturesStone, clay, and glass products..Primary metal industriesFabricated metal productsMachinery except electricalElectrical machineryTransportation equipmentInstruments and related prod-
uctsMisc. manufacturing industries..
Nondurable goods
Food and kindred productsTobacco manufacturesTextile-mill productsApparel and other finished tex-
tilesPaper and allied productsPrinting, publishing and allied
industriesChemical and allied products.. . .Products of petroleum and coal.Rubber productsLeather and leather products. . .
14,061
8,161
194721315467
1,129939
1,262941
1,520
242430
5,900
1,326112
1,088
1,099450
521555188221341
13,852
8,088
193713313465
1,112924
1,254933
1,507
242434
5,764
1,224109
1,067
1,103448
525552185216334
13,534
7,910
187695308459
1,088902
1,240913
1,449
243425
5,624
1,149101
1,046
1,085446
522548184210334
13,319
7,791
184654301448
1,074875
1,238883
1,487
241407
5,528
1,083104
1,028
1,084442
525540181209332
13,00
7,616
177617293428
1,049874
1,230855
1,470
237386
5,386
1,02497
997
1,062438
514540178206332
12,906
7,520
165627292427
1,027864
1,220839
1,435
233393
5,386
1,00990
995
1,088437
514536178203339
12,818
7,430
150643290429
1,010852
1,202827
1,409
229389
5,388
1,00984
989
1,101436
517539177199338
12,590
7,309
137649283428991840
1,187811
1,380
224380
5,281
1,01182
979
1,030433
516534176195325
12,437
7,208
125679277427976833
1,165791
1,342
220
374
5,229
1,03182
969985433
515525179197315
12,480
7,177
120701275427983831
1,151776
1,324
215375
5,303
1,07982
981
987436
519517181198324
12,212
'6,917
'117'604'272424'969'809
'1,108'765
'1,277
'210'363
'5,295
'1,14283
953
'980430
'513'513'181173'327
12,448
6,936
113609288434969819
1,097783
1,237
211376
5,512
1,222102987
1,045436
512515180174338
12,593
6,979
113657295432969819
1,101807
1,183
216388
5,614
1,264114988
1,054442
520528179195331
'Revised.NOTE.—Covers production and related workers only; data shown include all full- and part-time production and related workers who worked
during, or received pay for, the pay period ending nearest the 15th of the month. Figures for September 1954 are preliminary. Seasonallyadjusted figures formerly compiled by the Federal Reserve from unadjusted data of the Bureau of Labor Statistics have been compiled by theBureau beginning September 1954. Back data may be obtained from the Bureau of Labor Statistics.
HOURS AND EARNINGS OF PRODUCTION WORKERS IN MANUFACTURING INDUSTRIES
[Compiled by Bureau of Labor Statistics]
Industry group
Average weekly earnings(dollars per week)
1953
Sept.
1954
July Aug. Sept.
Average hours worked(per week)
1953
Sept.
1954
July Aug. Sept.
Average hourly earnings(dollars per hour)
1953
Sept.
1954
July Aug. Sept.
Total
Durable goods
Ordnance and accessoriesLumber and wood productsFurniture and fixturesStone, clay, and glass productsPrimary metal industries
Fabricated metal productsMachinery except electricalElectrical machineryTransportation equipmentInstruments and related productsMiscellaneous manufacturing industries.
Nondurable goods
Food and kindred productsTobacco manufacturesTextile-mill productsApparel and other finished products. . . .Paper and allied products
Printing, publishing and allied products.Chemicals and allied productsProducts of petroleum and coalRubber productsLeather and leather products
71.42
77.14
79.1366.9762.7871.1085.63
75.7082.5772.0984.2374.1663.36
63.57
67.0446.9251.6547.1273.87
87.1477.8394.3574.8848.99
70.92
75.83
'79.80'63.2462.02
'71.33'80.81
'75.6080.60
'71.5384.38
'72.29'62.79
64.74
69.72'51.54'51.4147.17
'74.62
'86.94'79.35'94.53'76.8351.38
71.06
76.59
80.2066.0463.5972.0481.27
76.5581.2072.2285.2072.8364.00
64.45
67.9849.5452.3648.7874.80
87.6278.7292.8476.0551.10
71.86
76.99
78.0170.3863.4372.6782.47
76.9580.6072.7685.6073.6064.48
64.91
68.5648.1952.3348.9675.65
87.7879.9094.76
n.a.49.90
39.9
40.6
41.040.140.540.440.2
40.741.740.540.341.240.1
39.0
41.939.137.734.942.7
38.941.441.239.035.5
39.4
39.7
-•40.1'40.839.5'40.3
40.040.1'39.339.8'39.539.0
39.0
41.5•37.9•37.835.242.4
•38.340.941.1-39.437.5
39.7
40.1
40.141.840.540.738.7
40.540.239.940.039.840.0
39.3
42.5
38.641.040.938.837.3
39.7
40.1
39.441.440.4
38.9
40.539.940.240.040.039.8
39.1
41.339.538.236.042.5
38.541.441.2
n.a.35.9
1.79
1.90
1.931.671.551.762.13
1.861.981.782.091.801.58
1.63
1.351.73
2.248829
1.921.38
1.80
1.91
1.99'1.551.571.772.11
'1.892.011.822.121.83
'1.61
1.66
1.68'1.361.361.34
'1.76
'2.27'1.94'2.301.951.37
1.79
1.91
1.57
1.60
1.64
1.651.291.361.341.76
2.271.922.271.961.37
1.81
1.92
1.98
1.902.021.812.141.841.62
1.66
1.661.221.371.361.78
2.281.932.30n.a.1.39
'Revised. n.a. Not available.NOTE.—Data are for production and related workers. Figures for September 1954 are preliminary. Back data may be'obtained from the
Bureau of Labor Statistics.
OCTOBER 1954 1105
Digitized for FRASER http://fraser.stlouisfed.org/ Federal Reserve Bank of St. Louis
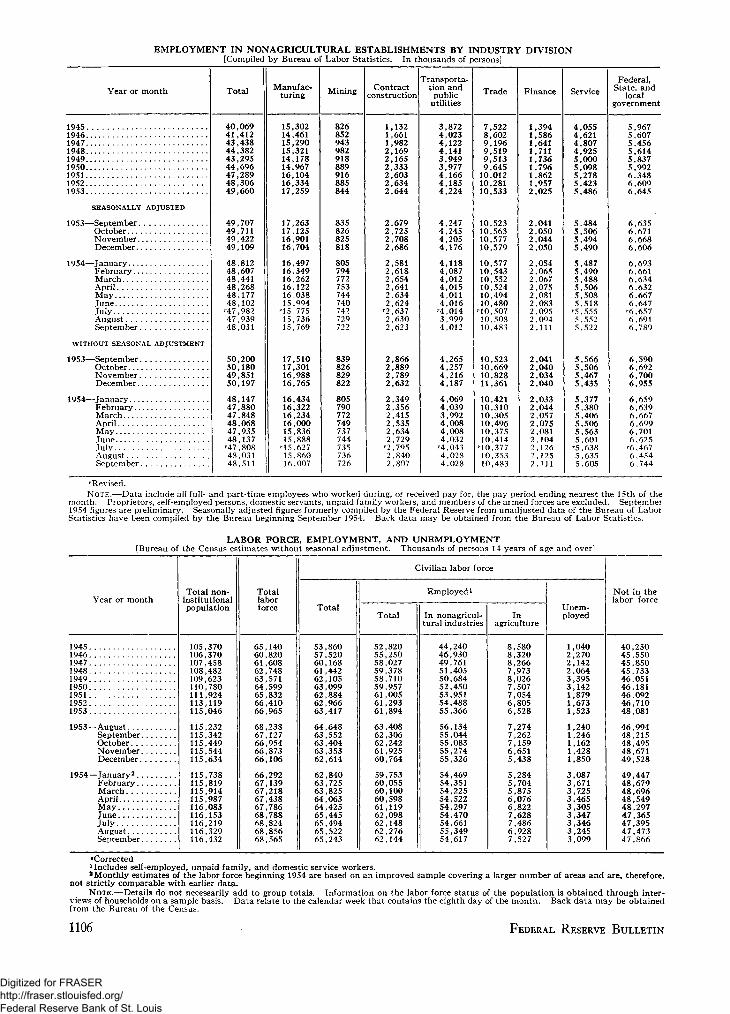
EMPLOYMENT IN NONAGRICULTURAL ESTABLISHMENTS BY INDUSTRY DIVISION[Compiled by Bureau of Labor Statistics. In thousands of persons]
Year or month Total Manufac-turing Mining Contract
:onstruction
Transporta-tion and
publicutilities
Trade Finance ServiceFederal,
State, andlocal
government
194519461947194819491950195119521953
SEASONALLY ADJUSTED
1953—SeptemberOctoberNovemberDecember
1954—JanuaryFebruaryMarchAprilMayJuneJulyAugustSeptember
WITHOUT SEASONAL ADJUSTMENT
1953—SeptemberOctoberNovemberDecember
1954—JanuaryFebruaryMarchAprilMayJuneJulyAugustSeptember
40,06941,41243,43844,38243,29544,69647,28948,30649,660
49,70749,71149,42249,109
48,81248,60748,44148,26848,17748,102'•47,98247,93948,031
50,20050,18049,85150,197
48,14747,88047,84848,06847,93548,137'47,80848,03148,511
15,30214,46115,29015,32114,17814.96716,10416,33417,259
17,26317,12516,90116,704
16,49716,34916,26216,12216,03815,994••15,77515,73615,769
17,51017,30116,98816,765
16,43416,32216,23416,00015,83615,888'15,62715,86016,007
826852943982918889916885844
835826825818
805794772753744740742729722
839826829822
805790772749737744735736726
1,1321,6611,9822,1692,1652,3332,6032,6342,644
2,6792,7252,7082,686
2,5812,6182,6542,6412,6342,624
'2,6372,6302,623
2,8662,8892,7892,632
2,3492,3562,4152,5352,6342,729
'2,795,840
2,807
3,8724,0234,1224,1413,9493,9774,1664,1854,224
4,2474,2454,2054,176
4,1184,0874,0124,0154,0114,016
'4,0143,9994,012
4,2654,2574,2164,187
4,0694,0393,9924,0084,0084,032
'4,0434,0284,028
7,5228,6029,1969,5199,5139,645
10,01210,28110,533
10,52310,56310,57710,579
10,57710,54310,55210,52410,49410,480
"10,50710,50810,483
10,52310,66910,82811,361
10,42110,31010,30510,49610,37510.414
'10,37710,3 S310,483
1,3941,5861,6411,7111,7361,7961,8621,9572,025
2.0412,0502,0442,050
2,0542.0652,0672,0752,0812,0832,0952,0942,111
2,0412,0402,0342,040
2,0332,0442,0572,0752.0812.1042 ,1262 ,1252 ,111
4,0554,6214,8074,9255,0005,0985,2785,4235,486
5.4845,5065,4945,490
5,4875,4905,4885,5065,5085,518
'5,5555,5525,522
5,5665,5065,4675,435
5,3775,3805,4065,5065,5635,601'5,6385,6355,605
5,9675,6075,4565,6145,8375,9926,3486,6096,645
6,6356.6716,6686,606
6,6936.6616,6346,6326,6676,647
'6,6576,6916,789
6,5906,6926,7006,955
6,6596,6396,6676,6996,7016,625
'6,4676,4546,744
[Bureau of
Year or month
19451946. . . .1947194819491950195119521953
1953—AugustSeptemberOctoberNovemberDecember
1954—January2
FebruaryMarchAprilMayJuneJulyAugustSeptember
LABOR FORCE, EMPLOYMENT, AND UNEMPLOYMENTthe Census estimates without seasonal adjustment. Thousands of persons 14 years of age and over]
Total non-institutionalpopulation
105,370106,370107,458108,482109,623110,780111,924113,119115,046
115,232115,342115,449115,544115,634
115,738115,819115,914115,987116,083116,153116,219116,329116,432
Totallaborforce
65,14060,82061,60862,74863,57164,59965,83266,41066,965
68,23867,12766,95466,87366,106
66,29267,13967,21867,43867,78668,78868,82468,85668,565
Civilian labor force
Total
53,86057,52060,16861,44262,10563,09962,88462,96663,417
64,64863,55263,40463,35362,614
62,84063,72563,82564,06364,42565,44565,49465,52265,243
Employed1
Total
52,82055,25058,02759,37858,71059,95761,00561,29361,894
63,40862,30662,24261,92560,764
59,75360,05560,10060,59861,11962,09862,14862,27662,144
In nonagricul-tural industries
44,24046,93049,76151,40550,68452,45053,95154,48855,366
56,13455,04455,08355,27455,326
54,46954,35154,22554,52254,29754,47054,66155,34954,617
Inagriculture
8,5808,3208,2667,9738,0267,5077,0546,8056,528
7,2747,2627,1596,6515,438
5,2845,7045,8756,0766,8227,6287,4866,9287,527
Unem-ployed
1,0402,2702,1422.0643,3953,142J .879L,6731,523
L,2401,2461,1621,4281,850
$,0875,6715,7255,4655,3055,3475,3463,2453,099
Not in thelabor force
40,23045,55045,85045,73346,05146,18146,09246,71048,081
46,99448,21548,49548,67149,528
49,44748,67948,69648,54948,29747,36547,39547,47347,866
"Corrected1 Includes self-employed, unpaid family, and domestic service workers.2Monthly estimates of the labor force beginning 1954 are based on an improved sample covering a larger number of areas and are, therefore,
not strictly comparable with earlier data.NOTE.—Details do not necessarily add to group totals. Information on the labor force status of the population is obtained through inter-
views of households on a sample basis. Data relate to the calendar week that contains the eighth day of the month. Back data may be obtainedfrom the Bureau of the Census.
1106 FEDERAL RESERVE BULLETIN
Digitized for FRASER http://fraser.stlouisfed.org/ Federal Reserve Bank of St. Louis
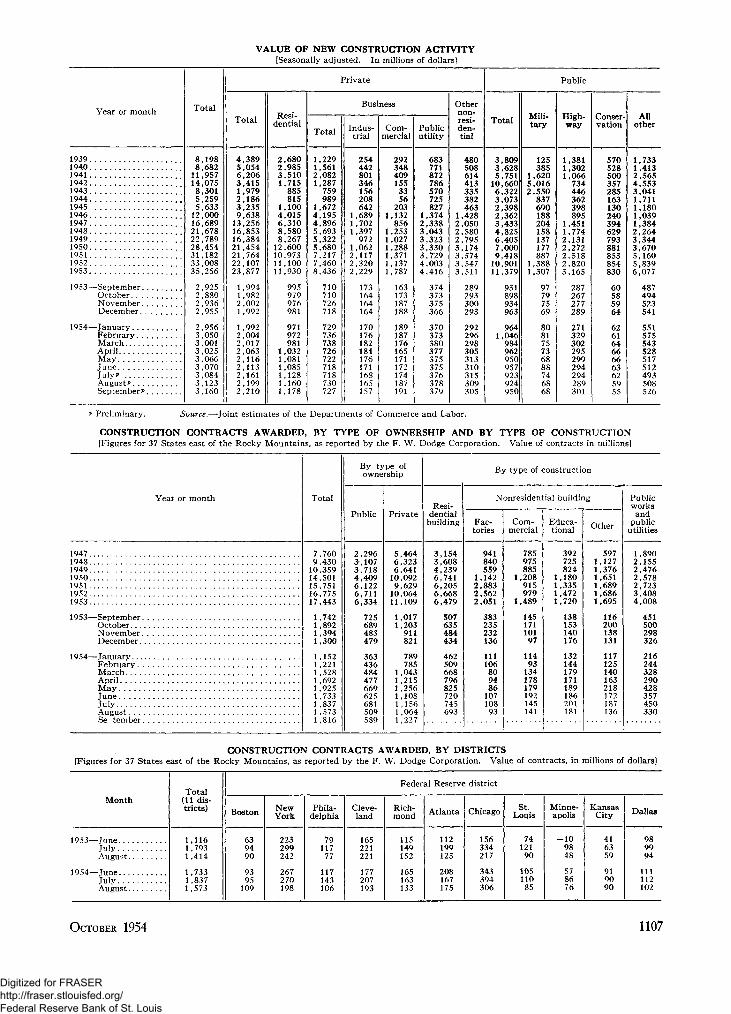
VALUE OF NEW CONSTRUCTION ACTIVITY[Seasonally adjusted. In millions of dollars]
Year or month
193919401941194219431944194519461947194819491950195119521953
1953—SeptemberOctober.November.December
1954—JanuaryFebrua ry . . . .March.. . .AprilMay. .JuneJuly? ..August?Septembers
Total
8,1988,682
11,95714,0758,3015,2595,633
12,00016,68921,67822,78928,45431,18233,00835,256
2,9252,8802,9362,955
2,9563,0503,0013,0253,0663,0703,0843,1233,160
Private
Total
4,3895,0546,2063,4151,9792,1863,2359,638
13,25616,85316,38421,45421,76422,10723,877
1,9941,9822,0021,992
1,9922,0042,0172,0632,1162,1132,1612,1992,210
Resi-dential
2,6802,9853,5101,715
885815
1,1004,0156,3108,5808,267
12,60010,97311,10011,930
995979976981
971972981
1,0321,0811,0851,1281,1601,178
Business
Total
1,2291,5612,0821,287
759989
1,6724,1954,8965,6935,3225,6807,2177,4608,436
710710726718
729736738726722718718730727
Indus-trial
254442801346156208642
1,6891,7021,397
9721,0622,1172,3202,229
173164164164
170176182184176171168165157
Com-mercial
2923484091553356
2031,132
8561,2531,0271,2881,3711,1371,787
163173187188
189187176165171172174187191
Publicutility
683771872786570725827
1,3742,3383,0433,3233,3303,7294,0034,416
374373375366
370373380377375375376378379
Othernon-resi-den-tial
480508614413335382463
1,4282,0502,5802,7953,1743,5743,5473,511
289293300293
292296298305313310315309305
Public
Total
3,8093 6285 751
10,6606 3223,0732,3982,3623,4334 8256,4057,0009,418
10,90111,379
931898934963
9641,046
984962950957923924950
Mili-tary
125385
1 6205,0162,550
837690188204158137177887
1,3881,307
97797569
808175736888746868
High-way
1,3811 3021 066
734446362398895
1,4511,7742,1312,2722,5182,8203,165
287267277289
271329302295299294294289301
Conser-vation
570528500357285163130240394629793881853854830
60585964
626164666663625955
Allother
1,7331 4132 5654,5533 0411,7111,1801,0391,3842 2643,3443,6705,1605,8396,077
487494523541
551575543528517512493508526
Preliminary. Source.—Joint estimates of the Departments of Commerce and Labor.
CONSTRUCTION CONTRACTS AWARDED, BY TYPE OF OWNERSHIP AND BY TYPE OF CONSTRUCTION[Figures for 37 States east of the Rocky Mountains, as reported by the F. W. Dodge Corporation. Value of contracts in millions]
Year or month
1947194819491950195119521953
1953—SeptemberOctoberNovemberDecember
1954—January.... . .FebruaryMarchAprilMayJuneTulvAugustSe tember
Total
7,7609,430
10,35914,50115,75116,77517,443
1,7421,8921,3941,300
1,1521,2211,5281 6921,9251,7331,8371 ,5731,816
By type ofownership
Public
2,2963,1073,7184,4096,1226,7116,334
725689483479
363436484477669625681509589
Private
5,4646,3236,641
10,0929,629
10,06411,109
1,0171,203
911821
789785
1,0431,2151,2561,1081,1561,064I 227
Resi-dential
building
3,1543,6084,2396,7416,2056,6686,479
507635484434
462509668796825720745693
By type of construction
Nonresidential building
Fac-tories
941840559
1,1422,8832,5622,051
383235232136
111106809486
107108
93
Com-mercial
785975885
1,208915979
1,489
14517110197
11493
134178179192145141
Educa-tional
392725824
1,1801,3351,4721,720
138153140176
132144179171189186201181
Other
5971,1271,3761,6511,6891,6861,695
116200138131
117125140163218172187136
Publicworks
andpublic
utilities
1,8902,1552,4762,5782,7233,4084,008
451500298326
216244328290428357450330
CONSTRUCTION CONTRACTS AWARDED, BY DISTRICTS[Figures for 37 States east of the Rocky Mountains, as reported by the F. W. Dodge Corporation. Value of contracts, in millions of dollars]
Month
1953—TuneJulyAugust
1954—JuneJulyAugust
Total(11 dis-tricts)
1,1161 .7931,414
1,7331,8371,573
Federal Reserve district
Boston
639490
9395
109
NewYork
223299242
267270198
Phila-delphia
7911777
117143106
Cleve-land
165221221
177207193
Rich-mond
115149152
165163133
Atlanta
112199123
208167175
Chicago
156334217
343394306
StLouis
7412190
10511085
Minne-apolis
- 1 09848
578676
KansasCity
416359
919090
Dallas
989994
111112102
OCTOBER 1954 1107
Digitized for FRASER http://fraser.stlouisfed.org/ Federal Reserve Bank of St. Louis
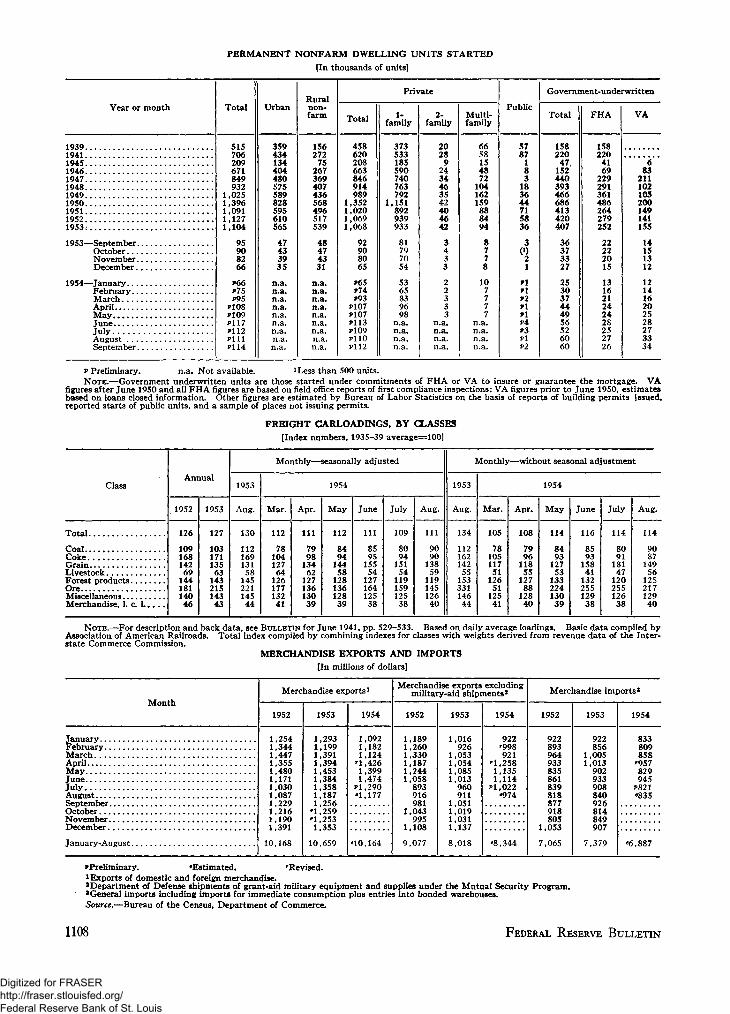
PERMANENT NONFARM DWELLING UNITS STARTEDfin. thousands of units]
Year or month
193919411945194619471948194919501951195219531
1953—SeptemberOctoberNovember . .December
1954—JanuaryFebruaryMarchApril..May
July .AugustSeptember
Total
515706209671849932
1,0251,3961,0911,1271,104
95908266
»66*75J>95
P108*109P117J>112P i l lP114
Urban
359434134404480525589828595610565
47433935
n.a.n.a.n.a.n.a.n.a.n.a.n.a.n.a.n.a.
Ruralnon-farm
156272
75267369407436568496517539
48474331
n.a.n.a.n.a.n.a.n.a.n.a.n.a.n.a.n.a.
Private
Total
458620208663846914989
1,3521,0201,0691,068
92908065
>65»74*93
P107P107P113J»109PllOP112
1-family
373533185590740763792
1,151892939933
81797054
5365839698
n.a.n.a.n.a.n.a.
2-family
2028
92434463542404642
3433
22333
n.a.n.a.n.a.n.a.
Multi-family
6658154872
104162159
888494
8778
107777
n.a.n.a.n.a.n.a.
Public
5787
183
183644715836
30)2
1
9191»2J»l91P 4P 3P IP2
Government-underwritten
Total
158220
47152440393466686413420407
36373327
253037444956526060
FHA
158220
4169
229291361486264279252
22222015
131621242428252726
VA
6S3
211102105200149141155
14151312
121116202528273334
P Preliminary. n.a. Not available. 1Less than 500 units.NOTE.—Government underwritten units are those started under commitments of FHA or VA to insure or guarantee the mortgage. VA
figures after June 1950 and all FHA figures are based on field office reports of first compliance inspections; VA figures prior to June 1950, estimatesbased on loans closed information. Other figures are estimated by Bureau of Labor Statistics on the basis of reports of building permits issued,reported starts of public units, and a sample of places not issuing permits.
FREIGHT CARLOADINGS, BY CLASSES[Index numbers, 1935-39 average=100]
Class
Total
CoalCokeGrainLivestock
OreMiscellaneousMerchandise, 1. c. 1
Annual
1952
126
109168142
6914418114046
1953
127
103171135
6314321514343
Monthly—seasonally adjusted
1953
Aug.
130
112169131
5814522114544
1954
Mar.
112
78104127
6412617713241
Apr.
I l l
7998
13462
12713613039
M a y
112
8494
14458
12813612839
June
111
8595
15554
12716412538
July
109
8094
15154
11915912538
Aug.
I l l
9090
13859
11914512640
Monthly—without seasonal adjustment
1953
Aug.
134
112162142
5515333114644
1954
Mar.
105
78105117
51126
5112541
Apr.
108
7996
11855
12788
12840
M a y
114
8493
12753
13322413039
June
116
8593
15841
13225512938
July
114
8091
18147
12025512638
Aug.
114
9087
14956
12521712940
NOTE.—For description and back data, see BULLETIN for June 1941, pp. 529-533. Based on daily average loadings. Basic data compiled byAssociation of American Railroads. Total index compiled by combining indexes for classes with weights derived from revenue data of the Inter-state Commerce Commission.
MERCHANDISE EXPORTS AND IMPORTS[In millions of dollars]
Month
JanuaryFebruary . .MarchAprilMay . . . . .JuneJulyAugustSeptemberOctober
December
January-August . . .
Merchandise exports1
1952
1,2541,3441,4471,3551,4801,1711,0301,0871,2291,2161,1901,391
10,168
1953
1.293
11
r]_
1,1991,3911,3941,453L,3841,3581,1871,2561.259
1,2531 353
10,659
1954
1,0921,1821,124
•"1,4261,3991,474
Pl.290•1,177
no ,164
Merchandise exports excludingmilitary-aid shipments2
1952
1,1891,2601,3301,1871,2441,058
893916981
1,043995
1,108
9,077
1953
1,016926
1,0531,0541,0851,013
960911
1,0511,0191,0311,137
8,018
1954
922'998921
'1,2581,1351,114
Pl.022e974
«8,344
Merchandise imports3
1952
922893964933835861839818877918805
1,053
7,065
1953
922856
1,0051,013
902933908840926814849907
7,379
1954
833809858
r957829945
P821•835
«6,887
^Preliminary. •Estimated. 'Revised.1 Exports of domestic and foreign merchandise.a Department of Defense shipments of grant-aid military equipment and supplies under the Mutual Security Program.'General imports including imports for immediate consumption plus entries into bonded warehouses.Source.—Bureau of the Census, Department of Commerce.
1108 FEDERAL RESERVE BULLETIN
Digitized for FRASER http://fraser.stlouisfed.org/ Federal Reserve Bank of St. Louis
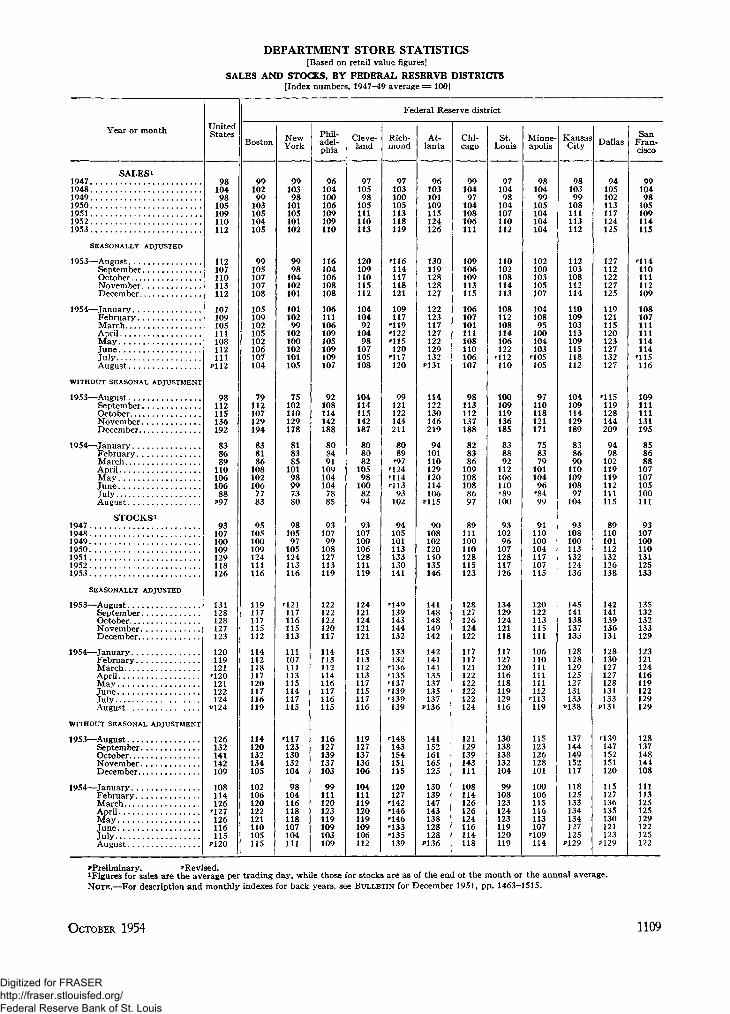
DEPARTMENT STORE STATISTICS[Based on retail value figures]
SALES AND STOCKS, BY FEDERAL RESERVE DISTRICTS[Index numbers, 1947-49 average = 100]
Year or month
SALESi1947194819491950 .19511952 .1953
SEASONALLY ADJUSTED
1953—AugustSeptemberOctober . .NovemberDecember
1954—JanuaryFebruaryMarch . . .
May
July .August
WITHOUT SEASONAL ADJUSTMENT
1953—AugustSeptemberOctoberNovemberDecember
1954—JanuaryFebruaryMarchApril....MayJuneJuly ..August . .
STOCKS i19471948. . .19491950... .19511952... .1953
SEASONALLY ADJUSTED
1953—AugustSeptemberOctoberNovemberDecember
1954—January . .FebruaryMarchAprilM!ay
JulyAugust
WITHOUT SEASONAL ADJUSTMENT
1953—AugustSeptemberOctoberNovemberDecember
1954—JanuaryFebruaryMarchAprilMayJuneJulyAugust
UnitedStates
9810498105109110112
112107110113112
107109105111108112111
P112
98112115136192
83868911010610688
2>97
93107100109129118126
131128128127123
120119121'120121122124
*124
126132141142109
108114126••127126116115
P120
Federal Reserve district
Boston
9910299103105104105
99105107107108
105109102105102106107104
79112107129194
8381861081021067783
95105100109124111116
119117117115112
114112118117120117116119
114120132134105
102106120122121110105115
NewYork
9910398101105101102
9998104102101
10110299102100102101105
75102110129178
81838510198997380
9810597105124113116
121117116115113
111107111113115114117115
rH7123130132104
98104116118118107104111
Phil-adel-phia
96104100106109109110
116104106108108
106111106109105109109107
92108114142188
8084911091041047885
9310799108127113119
122122122120117
114113112114116117116115
116127139137103
99111120123119109103109
Cleve-land
9710598105111110113
120109110115112
1041049210498107105108
104114115142187
808082105981008294
93107100106128111119
124121124121121
115113112113117115117116
119127137136106
104111119120119109106112
Rich-mond
97103100105113118119
116114117118121
109117'119122••115120••117120
99121122144211
8089••97
••124••114••11393102
94105101113133130141
149139143144132
133132••136••135••137••139••139139
••148143154151115
120127142146146133135139
At-lanta
96103101109115124126
130119128128127
122123117127122129132
P131
114122130146219
94101110129120114106
P115
90108102120140135146
141148148149142
142141141135137135137
P136
141152161165125
130139147143138128128
P136
Chi-cago
9910497104108106111
109106109113115
106107101111108110106107
98113112137188
8283861091081088697
89111100110128115123
128127126124122
117117121122122122122124
121129139143111
108114126126124116114118
St.Louis
9710498104107110112
110102108114113
108112108114106122••112110
100109119136185
838892112106110••89100
9310296107128117126
134129124121118
117127120116118119129116
130138138132104
99108123124123119120119
Minne-apolis
9810499105104104104
102100103105107
10410895100104103105105
97110118121171
75837910110496••8499
91110100104117107115
120122113115111
106110111111111112113119
115123126128101
100106115116113107109114
KansasCity
9810399108111113112
112103108112114
110109103113109115118112
104109114129189
83869011010910897104
93108100113132124136
14514113813713i
128128129125127131133P138
137144149152117
118125133134134127125P129
Dallas
94105102113117124125
127112122127125
119121115120123127132127
115119128144209
9498102119119112111115
89110101112132126138
142141139136131
128130127127128131133
P131
139147152151120
115127136135130121123
P129
SanFran-cisco
9910498105109114115
114110111112109
108107111111114114
••115116
109111111131195
858688107107105100111
93107100110131125133
135132132133129
123121124116119122129129
128137148144108
111113125125129122125122
'Preliminary. 'Revised.1 Figures for sales are the average per trading day, while those for stocks are as of the end ot the month or the annual average.NOTE.—For description and monthly indexes for back years, see BULLETIN for December 1951, pp. 1463-1515.
OCTOBER 1954 1109
Digitized for FRASER http://fraser.stlouisfed.org/ Federal Reserve Bank of St. Louis
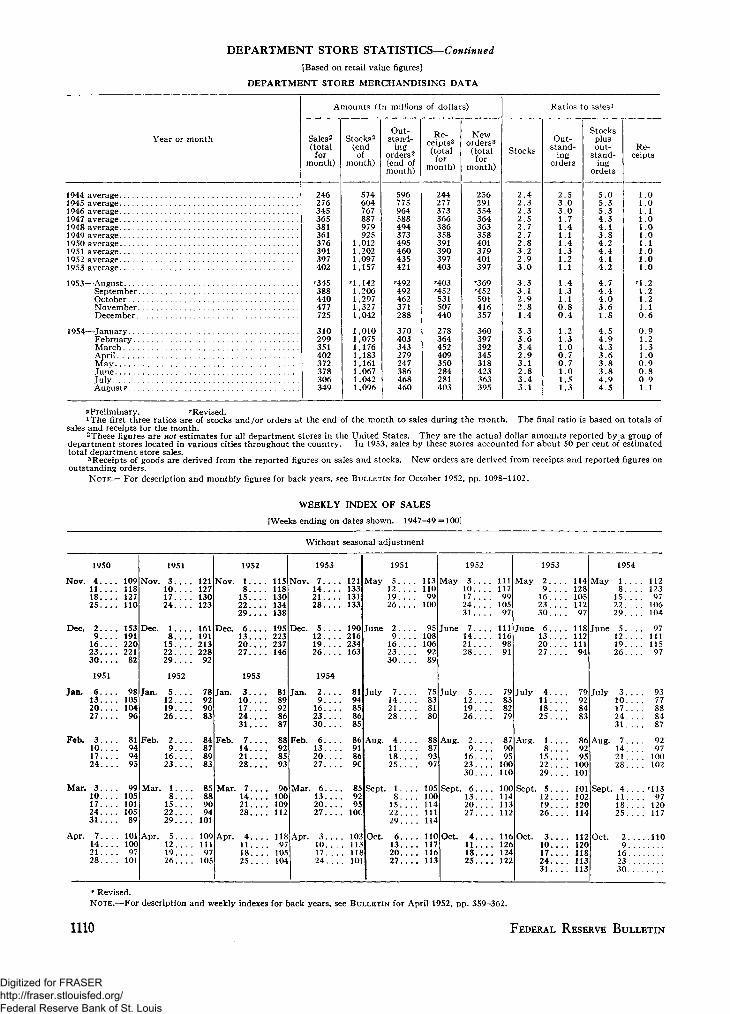
DEPARTMENT STORE STATISTICS—Continued[Based on retail value figures]
DEPARTMENT STORE MERCHANDISING DATA
Year or month
1944 average1945 average.1946 average1947 average1948 average . . .1949 average1950 average1951 average1952 average1953 average. .
1953—AugustSeptemberOctoberNovemberDecember
1954—January .FebruaryMarchAprilMayTune.Tuly.August?
Amounts (In millions
Sales2
(totalfor
month)
246276345365381361376391397402
'345388440477725
310299351402372378306349
Stocks2
(endof
month)
574604767887979925
1,0121,2021,0971,157
rl ,1421,2061,2971,3271,042
1,0101,0751,1761,1831,1611,0671,0421,096
Out-stand-
ingorders2
(end ofmonth)
596775964588494373495460435421
'492492462371288
370403343279247386468460
of dollars)
Re-ceipts3
(totalfor
month)
244277373366386358391390397403
'403'452531507440
278364452409350284281403
Neworders3
(totalfor
month)
256291354364363358401379401397
'369••452501416357
360397392345318423363395
Stocks
2.42.32.32.52.72.72.83.22.93.0
3.33.12 . 92.81.4
3 . 33.63.42 . 93.12.83 . 43 . 1
Ratios to sales1
Out-stand-
ingorders
2.53.03.01 .7L.4L.IL.41.3L .2L.I
L.43
L.I0.80.4
1.21.31.00 . 70.71.01.51.3
Stocksplusout-
stand-ing
orders
5.05.35.34 34.13.84.24.44 14.2
4.74.44 . 03.61.8
4 . 54.94.33 . 63.83.84 . 94 . 5
Re-ceipts
1.01 01.11 01.01.01.11.01 01.0
n . 21.21.21.10.6
0 . 91.21.31.00.90 80 . 91.1
pPreliminary. 'Revised.*The first three ratios are of stocks and/or orders at the end of the month to sales during the month. The final ratio is based on totals of
sales and receipts for the month.2These figures are not estimates for all department stores in the United States. They are the actual dollar amounts reported by a group of
department stores located in various cities throughout the country. In 1953, sales by these stores accounted for about 50 per cent of estimatedtotal department store sales.
3Receipts of goods are derived from the reported figures on sales and stocks. New orders are derived from receipts and reported figures onoutstanding orders.
NOTE.—For description and monthly figures for back years, see BULLETIN for October 1952, pp. 1098-1102.
WEEKLY INDEX OF SALES
[Weeks ending on dates shown. 1947-49 =100]
Without seasonal adjustment
Nov.
Dec.
Jan.
Feb.
Mar.
Apr.
1950
4111825
29
162330
1951
6132027
3101724
310172431
7. . . .1 4 . . . .2128
109118127110
153191220221
82
98105104
96
81949495
99105101105
89
101100
97101
Nov.
Dec.
Jan.
Feb.
Mar.
Apr.
1951
3101724
18
152229
1952
5121926
29
1623
18
152229
512192 6 . . . .
121127130123
161191213228
92
78929083
84878983
85889094
101
109111
97105
Nov.
Dec.
Jan.
Feb.
Mar.
Apr.
1952
18
152229
6132027
1953
310172431
7142128
7142128
411. . . .1825
115118130134138
195223237146
8189928687
88928593
96100109112
11897
105104
Nov.
Dec.
Jan.
Feb.
Mar
Apr.
1953
7142128
5121926
1954
29
162330
6132027
6132027
31 0 . . . .172 4 . . . .
121133131133
190216234163
8194858685
86918690
859295
10C
103113118101
VI ay
une
[uly
Aug.
Sept.
Oct.
1951
5121 9 . . . .26
2 . . . .9
162 3 . . . .30
71421 . . . .28
411 . . . .1825
1. . . .8
152229
6132027
113110
99100
95108106
9289
75838180
88879397
105100114111114
110117116113
M a y
June
July
Aug.
Sept.
Oct.
1952
31 0 . . . .172 4 . . . .31
7142 1 . . . .28
5121926
29
162330
61 3 . . . .2027. . . .
4111825
111117
99105
97
111116
9891
79838279
879095
100110
100114113112
116126124122
M a y
June
July
Aug.
Sept.
Oct.
1953
29 . . . .
162 3 . . . .30
6 . . . .132 0 . . . .27
4111825 . . . .
18
1 5 . . . .2229
512. . . .1926
310172431
114128105112
97
118112111
94
79928483
869295
100101
101102120114
112120118113113
M a y
June
July
Aug.
Sept.
Oct.
1954
1 . . . .8
15. . . .2229
51219. . . .26
310172 4 . . . .31
71421 . . . .28
4111825
2 . . . .9
162 3 .3 0 . . . .
112123
97106104
97111115
97
9377888487
9297
100102
'•11397
120117
.110
r Revised.N O T E . — F o r description and weekly indexes for back years, see BULLETIN for April 1952, pp. 359-362.
1110 FEDERAL RESERVE BULLETIN
Digitized for FRASER http://fraser.stlouisfed.org/ Federal Reserve Bank of St. Louis
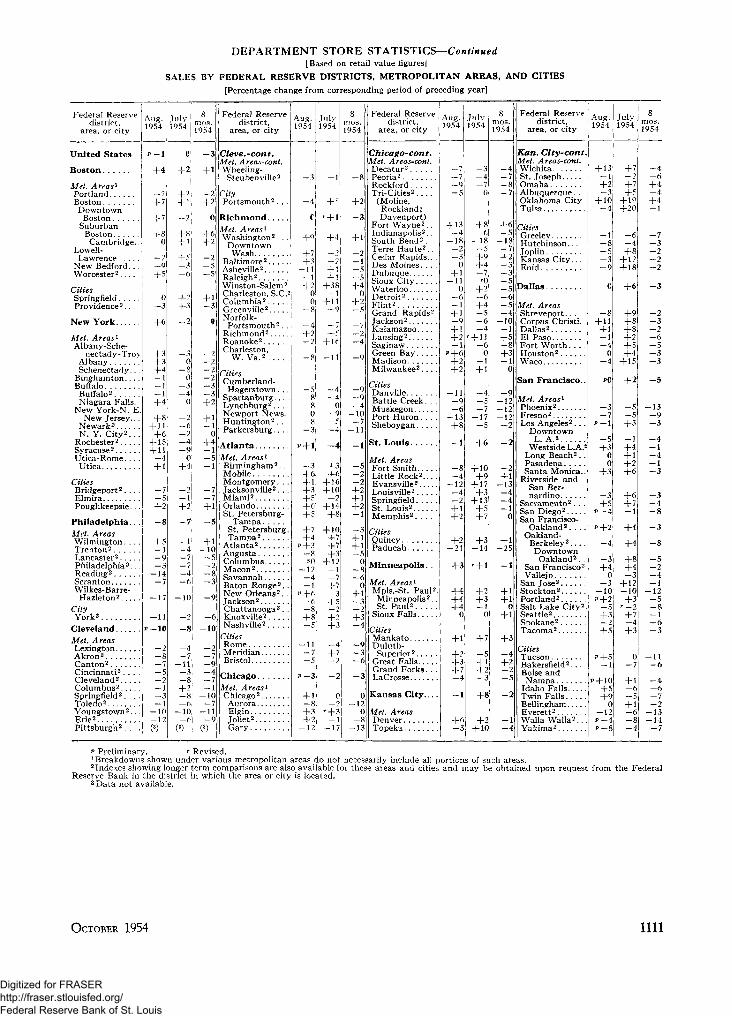
DEPARTMENT STORE STATISTICS—Continued[Based on retail value figures]
SALES BY FEDERAL RESERVE DISTRICTS, METROPOLITAN AREAS, AND CITIES[Percentage change from corresponding period of preceding year]
Federal Reservedistrict,
area, or cityAug.1954
July1954 rnos.
1954
Federal Reservedistrict,
area, or city 1954
- 3
- 4
C
-I-Q
+7+3
- 1 1— 1
+200
- 8
- 4+?
2
- 8
- 5- 8- 8
0- 8- 3
P + 1
- 3+6+ 1+3+5+6+5+7+4
P + 3o
PQ
- 1 2^
- 1P+6
— 6- 8+8- 5
- 1 1— 7— 5
P - 3
+ 1- 8+3+2
- 1 2
Julv1954
- 1
+ r
+ 4
— 3— 2
+ 1+ 1+38- 1
+ 11+9- 7
+-c+ lf
- 1 1
_ 4- 4
0- 9
c- 4
+4
+3+6
+ 16+ 10+2
+ 14+8
+ 10+7+7+3
+ 12— 1
- 7+ 7- 3+5- 2+ 2+3
—4+7- 2
- 2
0- 2
r+3- 1
- 1 7
8
1954
- 8
+2
- 3
+ 1- 2- 1- 5- 5+4
0+2- 5
_ 7
- 2- 4
- 9
- 9Q
- 4- 1 0
- 7- 1 1
- 1
- 5- 2- 2+2+ 1+2- 1
- 3
+ 1+ 1- 5
0- 8- 6
0
+ 1- 3- 2+3- 4
- 9- 3- 6
- 3
0- 1 2
0- 8
- 1 3
Federal Reservedistrict,
area, or cityAug.1954
Tuly1954 mos.
1954
Federal Reservedistrict,
area, or cityAug. July
1954
United States
Boston
Met. Areas*PortlandBostonDowntown
BostonSuburban
BostonCambridge.
Lowell-Lawrence . . .
New Bedford.. .Worcester2.. . .
CitiesSpringfieldProvidence2.. .
New York
Met. Areas1
Albany-Sche-nectady-Troy
AlbanySchenectady..
Binghamton... .Buffalo
Buffalo2
Niagara Falls.New York-N. E.
New Jersey.. .Newark2
N. Y. C i ty 2 . . .Rochester2
Syracuse2
Utica-Rome. . . .Utica
CitiesBridgeport2. . . .ElmiraPoughkeepsie...
Philadelphia . .Met. AreasWilmington. . . .Trenton2
Lancaster2
Philadelphia2..Reading2
ScrantonWilkes-Barre-
Hazleton2
CityYork2
ClevelandMet. AreasLexingtonAkron2
Canton2
Cincinnati2 . . . .Cleveland2
Columbus2
Springfield2 . . . .Toledo2
Youngstown2...Erie2
Pi t t sburgh 2 . . . .
+4
+7
+ 7
+8
-2-9+5
0-3
+6
+3+3+4-1-1-1+4
+8+ 11+6+ 15+ 11̂
+ 1
+ 1
3 Cleve.-cont.Met. Areas-cont.Wheeling-Steubenville2
+2
-8
+5-1-9-3-14-7
-17
— 7-52
-1-3-1-10-12
++ 1
+8+ 1
+_3-6
+2+3
-2
-30
-80
zl0
_2-6-2-4-90
+4
-2-1+2
- 7
- 1- 4
- 7^
- 6
- 1 0
2- 8
- 4
- 1 1-J
- 8+2- 8-6
- 1 0-6
- 2+2
+6+2- 2- 5- 5
+ 1- 3
- 2- 2
2- 2- 3- 3+2
+ 1i
0+4- 1- 5
<
- 7
+ 1- 5
+ 1- 1 0
5- 2- 8- 3
- 6- 1 0
- 2- 7- 9- 4
y- 1
- 1 0
\CityPortsmouth2. . .
Richmond[Met. Areas1
Washington2 . . .Downtown
WashBaltimore2
Asheville2
Raleigh2
Winston-Salem2
Charleston, S.C.5Columbia2
Greenville2
Norfolk-Portsmouth2. .
Richmond2
Roanoke2
Charleston,W. Va.2
iCitiesCumberland-
I Hagerstown . . .Spartanburg.. . .Lynchburg2
Newport News.Huntington2. .Parkersburg. . . .
AtlantaMet. Areas1
Birmingham2..MobileMontgomery. . .Jacksonville2. . .Miami2.
- 1 1- 9
OrlandoSt. Petersburg-
TampaSt. PetersburgTampa2
Atlanta2
AugustaColumbusMacon2
SavannahBaton Rouge2.New Orleans2. .Jackson2
Chattanooga2.Knoxville2
Nashvi l le 2 . . . .CitiesRomeMeridianBristol
Chicago. . .Met. Areas1
Chicago2...Aurora.. . .Elgin.Joliet2
Gary.
Chicago-cont.Met. Areas-cont.Decatur2
Peoria2
Rockf ordTri-Cities2
(Moline,Rockland;Davenport)
Fort Wayne2. .Indianapolis2. .South Bend2.Terre Haute2 . .Cedar Rapids.. .Des Moines. . . .DubuqueSioux CityWaterlooDetroit2
Flint2
Grand Rapids2
Jackson2
KalamazooLansing2
SaginawGreen BayMadisonMilwaukee2
CitiesDanvilleBattle Creek. . .MuskegonPort Huron. . . .Sheboygan
St. Louis
Met. AreasFort SmithLittle Rock2... .Evans ville2
Louisville2
SpringfieldSt. Louis2
Memphis 2 . . . .
CitiesQuincyPaducah
Minneapolis. .
Met. Areas1
Mpls.-St. Paul-'Minneapolis2. .St. Paul2
Sioux Falls.
CitiesMankato ,Duluth-Superior2.. . . .
Great FallsGrand Forks. . .LaCrosse
Kansas City
Met. AreasDenver. . .Topeka.. .
- 7 - 3
~ 7 |—Q
c
+ 13- 4
- 1 8- 2- 3
0+ 1
- 1 10
- 6- 1+ 1- 9+ 1+2-1
P+6+2+2
- 1 1- 9- 6
- 1 3+8- 1
- 4- 2+ 1+2
+2
+3
+4+4+4
0
+ 1+ 2+3+7- 4
- 1
+6- 3
+8-6-18—5+9+4-7
+2-6+4
r
-6—4
+ 11-60
-1+ 1- 4
= ?-17- 5+6
+ 10+9
+ 17+3
+ 13+5+7
+3
+2+3
0
+7- 5+ 1+2- 3
+8
+2+ 10
+6- 1 8
7
+2- 3
c- 5- 6- 5- 4
+5- 8+3
- 9-12-12-12
- 2
- 2
- 2+1
- 1 3- 4- 4- 1
0
+ 1- 2 5
- 1
+ 1+ 1
0+1+3- 4+2- 5
- 2
Kan. City-cont.Met. Areas-cont.WichitaSt. JosephOmahaAlbuquerque. .Oklahoma CityTulsa
CitiesGreeleyHutchinson...JoplinKansas City..Enid
Dallas.
Met. AreasShreveport.. . .Corpus Christi.Dallas2
El PasoFort Worth. . .Houston2
Waco
San Francisco.
Met. Areas1
Phoenix2
Fresno2
Los Angeles2 . .Downtown
L. A.2
Westside L.A.*Long Beach2 . .PasadenaSanta Monica..
Riverside andSan Ber-nardino
Sacramento2. . .San Diego2
San Francisco-Oakland2
Oakland-Berkeley2 . . . .Downtown
Oakland2.San Francisco2
VallejoSan Jose2
Stockton2
Portland2
Salt Lake City2.Seattle2
Spokane2
Tacoma2
CitiesTucsonBakersfield2. . .Boise andNampa
Idaho FallsTwin FallsBellinghamEverett2
Walla Walla2.. .Yakima2
+ 13i
+2
+ 10-4
^-3
+ 11+ 1-1-40
-4
-3-7
c
+300
+3
-3+5
P-4
P+2
-4
-3+40
-3-10P+2
+3
+5
-1
'+10+5+90
-12v —'P—\
+7-2+7
++ 2 0
-6-4+8+ 12+ 18
+6
+9+8+8+2+5+4+ 15
+2
-5-5+3
-1+4+ 1+2+6
+6+7-1
+4
+4
+8+4-3
+ 1 2-10+3r-2+7-4+3
+ 1-6
+ 1-6
Q
-4
-4-6+4-
+4-1
-7-3-2_22
-3
-2-3-2-6-5-3-3
-5
-13-9
-2
-4-1-4-1-3
-3-4
-5-2-4-1-12-5-8-1-6-3
-11-6
-4-6-72
-13— 14-7
lecessarily include all portions of such areas,these areas and cities and may be obtained upon request from the Federal
OCTOBER 1954 1111
Digitized for FRASER http://fraser.stlouisfed.org/ Federal Reserve Bank of St. Louis
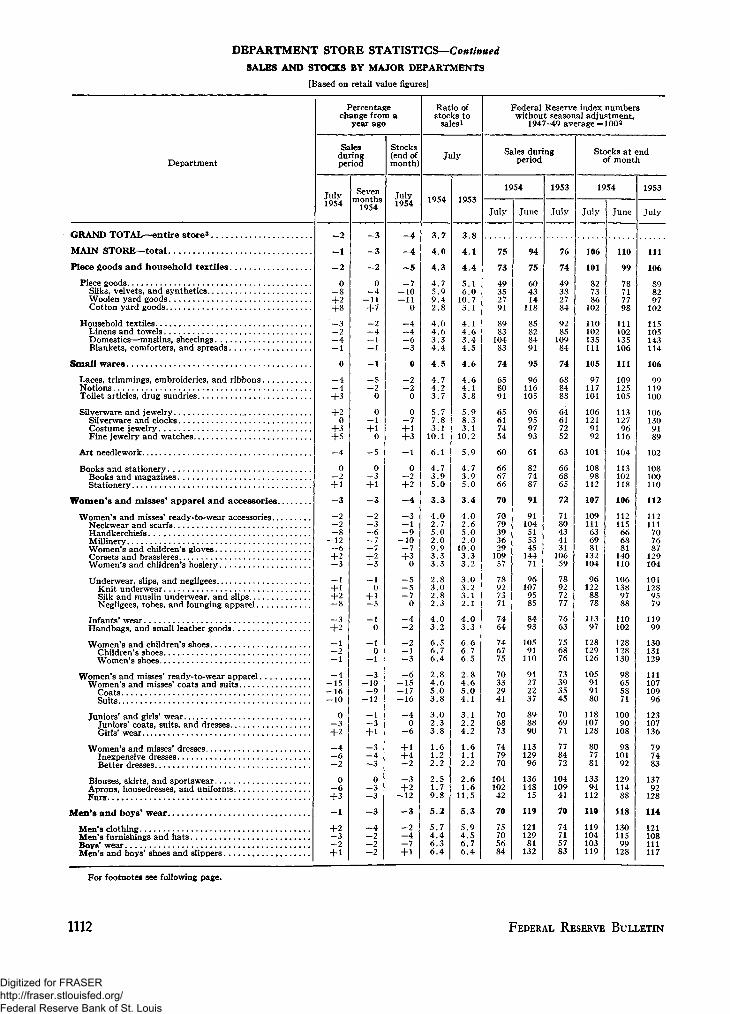
DEPARTMENT STORE STATISTICS—ContinuedSALES AND STOCKS BY MAJOR DEPARTMENTS
[Based on retail value figures]
Department
GRAND TOTAL—entire stores
MAIN STORE—total
Piece goods and household textiles . .
Piece goodsSilks, velvets, and syntheticsWoolen yard goods
Household textilesLinens and towelsDomestics—muslins, sheetingsBlankets, comforters, and spreads
Small wares
Laces, trimmings, embroideries, and ribbonsNotionsToilet articles, drug sundries
Silverware and jewelrySilverware and clocksCostume jewelryFine jewelry and watches
Art needlework
Books and stationeryBooks and magazinesStationery
Women's and misses' apparel and accessories
Women's and misses' ready-to-wear accessories
HandkerchiefsMillineryWomen's and children's glovesCorsets and brassieresWomen's and children's hosiery
Underwear, slips, and negligeesKnit underwearSilk and muslin underwear, and slipsNegligees, robes, and lounging apparel . .
Infants' wearHandbags and small leather goods
^Tomen's and children's shoesChildren's shoes^Vomen's shoes . . .
Women's and misses' coats and suits . . .CoatsSuits
Juniors' and girls' wearJuniors' coats, suits, and dressesGirls' wear
Inexpensive dressesBetter dresses .
Blouses skirts and sportswear . . . .Aprons, housedresses, and uniformsFurs
Men's and boys' wear
Men's clothing
Men's and boys' shoes and slippers
Percentagechange from a
year ago
Salesduringperiod
July1954
- 2
- 1
- 2
0- 8+2+8—3_ 2- 4- 1
0
- 4- 4+3+2
0+3+5—4
0- 2+ 1- 3
- 2- 2- 8
- 1 2- 6+2
- 1
+ 1+2- 8
- 3+2- 1- 2- 1
- 4- 1 5- 1 6- 1 0
0- 3+2- 4- 6- 2
0- 6+3- 1
+2
- 2+1
Sevenmonths
1954
- 3
- 3
- 2
0- 4
- 1 1+7—2- 4
- 1
- 1
— 5- 2
0
0- 1+ 1
0
- 5
0- 3+ 1- 3
- 2- 3- 6- 7- 7+2
0
- 5
- 10
- 10
- 1
- 3- 1 0
- 9- 1 2
- 1•?
- 3- 4- 3
0- 3- 3
- 3
- 4- 2- 2- 2
Stocks(end ofmonth)
July1954
- 4
- 4
- 5
- 7- 1 0- 1 1
0
—4- 4- 6- 3
0
220
0
+1+3- 1
02
+2- 4
- 3- 1- 9
- 1 0— 7+3
0
- 5- 7
0
- 4- 2
- 2- 1- 3
- 6- 1 5- 1 7- 1 6
- 40
- 6
+ 1+4- 2
- 3+2
- 1 2_ 3
- 2- 4- 7+1
Ratio ofstocks to
sales1
July
1954
3 7
4.0
4.3
4.75.99.42.8
4 04.63.34.4
4.5
4.74.23.7
5.77.83.1
10.1
6.1
4 . 73 . 95.0
3.3
4.02 . 75 . 02 . 09 . 93 . 33.3
2.83 . 02 . 82.3
4.03.2
6.56 . 76 . 4
2 . 84 . 65 . 03 . 8
3 . 02 . 33 . 8
1.61.22 . 2
2 . 51.79.8
5.2
5 . 74 . 46 . 36 . 4
1953
3 8
4.1
4.4
5.16.0
10.73.1
4 14.63.44.5
4.6
4.64.13.8
5.98.33.1
10.2
5.9
4 . 73 . 95.0
3.4
4.02 . 65 .02 . 0
10.03 . 33.2
3.03 . 23 . 12.1
4.03.3
6.66 .76 . 5
2 . 84 . 65 . 04 . 1
3 . 12 . 24 . 2
1.61.12 . 2
2 . 61.6
11.5
5 . 3
5 . 94 . 56 . 76 . 4
]federal Reserve index numberswithout seasonal adjustment,
1947-49 average = 1002
Sales duringperiod
1954
July
75
73
49352791
8983
10483
74
658091
65617454
60
666766
70
7079393629
10957
78927371
7464
746775
70332941
706873
747970
10410242
70
75705684
June
94
75
604314
118
85828491
95
96116105
96959793
61
827487
91
91104515345
14471
961079585
8493
10591
110
91272237
898890
11312996
13614815
119
121129
81132
1953
July
76
74
49382784
9285
10984
74
688488
64617252
63
666865
72
7180434131
10659
78927277
7663
756876
73393545
706971
778472
10410941
70
74715783
Stocks at endof month
1954
July
106
101
827386
102
110102135111
105
97117101
1061219192
101
10898
112
107
109111636981
132104
96122
8878
11397
128129126
105919180
118107128
807781
13394
112
110
119104103119
June
110
99
78717798
111102135106
111
109125105
11312796
116
104
113102118
106
112115666881
140110
1061389788
110102
128128130
98655871
10090
108
9810192
12911488
118
13011599
128
1953
July
111
106
898297
102
115105143114
106
99119100
1061309189
102
108100110
112
112111
707687
129104
1011289579
11999
130131129
11110710996
123107136
797483
13792
128
114
121108111117
For footnotes see following page.
1112 FEDERAL RESERVE BULLETIN
Digitized for FRASER http://fraser.stlouisfed.org/ Federal Reserve Bank of St. Louis
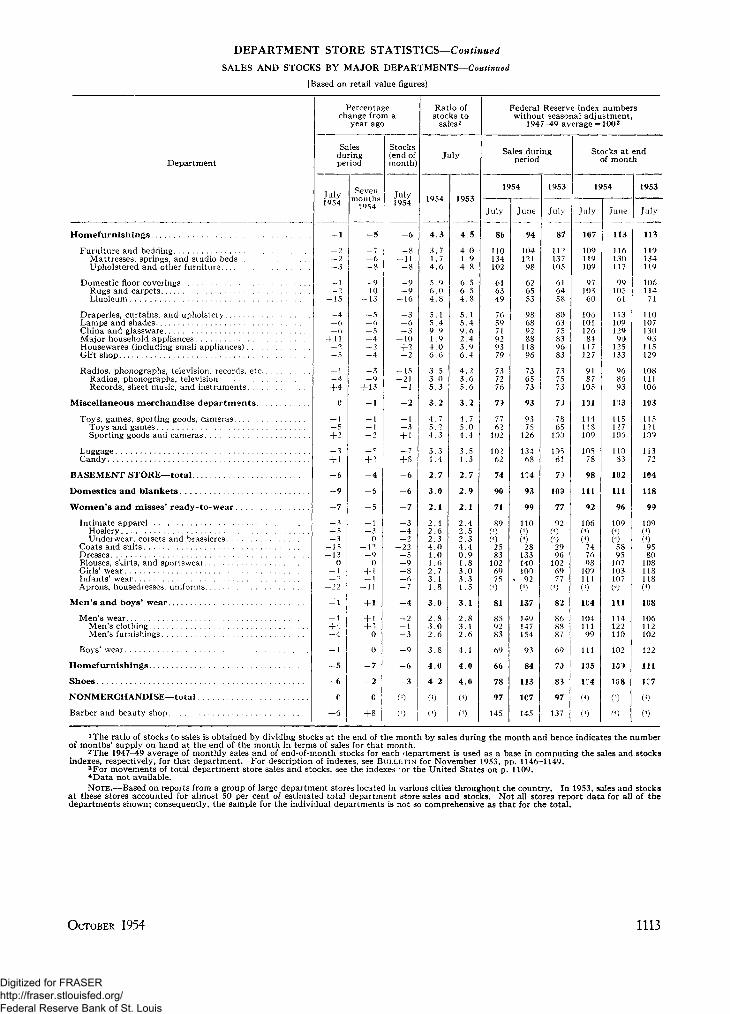
DEPARTMENT STORE STATISTICS—ContinuedSALES AND STOCKS BY MAJOR DEPARTMENTS—Continued
[Based on retail value figures]
Department
Homef u rn ish ings .
Furniture and beddingMattresses, springs, and studio beds . . . .Upholstered and other furniture
Domestic floor coveringsRugs and carpetsLinoleum
Draperies, curtains, and upholsteryLamps and shadesChina and glasswareMajor household appliancesHousewares (including small appliances). .Gift shop
Radios, phonographs, television, records, etc..Radios, phonographs, televisionRecords, sheet music, and instruments
Miscellaneous merchandise depa r tmen t s . .
Toys, games, sporting goods, camerasToys and gamesSporting goods and cameras
Luggage.Candy. . .
BASEMENT STORE—total
Domestics and blankets
Women's and misses' ready-to-wear
Intimate apparelHosieryUnderwear, corsets and brassieres
Coats and suitsDressesBlouses, skirts, and sportswearGirls' wearInfants' wearAprons, housedresses, uniforms
Men's and boys' wear
Men's wearMen's clothingMen's furnishings
Boys' wear
Homef urnishings
Shoes
NONMERCHANDISE—total
Barber and beauty shop
Percentagechange from a
year age
Salesduringperiod
July1954
_i
-2-2-3
— 1— 2
-15
-4-6— 6+ 11— 2— 5
-1-4+ 4
0
1c
+ 2
-3+ 1
-6
9
-7
—3— 5-3
-15-13
0-1— ~>
-22
— 1
-1
+ *4— 1
-5
-6
0
+ 5
Sevenmonths1954
-5
— 7-6-8
-9-10-13
c
-6— 5-49
-4
-3-9+ 13
-1
-1-1-2
_ q
+ ?
-4
-6
-5
-1-̂0
-12— 90
+ 1_ 1
-11
+ 1
+ 1+ ̂>00
-7
-2
0
+8
Stocks(end ofmonth)
July1954
-6
-8-11-8
-9_9
-16
-3-6_3
-10+2— 2
-15-21-1
-2
-1-3+ 1_7+8
-6
-6
-7
-3-4-2— 22_5n
-8— 6— 7
-4
— 2-1-3
-9
-6
-3
(4)
(0
Ratio ofstocks tosales1
July
1954
4.3
3.71.74.6
5.96.04.8
5.15.49.91.94.06.6
3.53.05.3
3.2
4.75.24.3
3.31.4
2.7
3.0
2.1
2.42.62.34.01.01.62.73.11.8
3.0
2.83.02.6
3.8
4.0
4 2
(4)
0)
1953
4.5
4.01.94.8
6.56.54.8
5.15.49.62.43.96.4
4.23.65.6
3.2
4.75.04.4
3.51 .3
2.7
2.9
2.1
2.42.52.34.40.91.83.03.31 .5
3.1
2.83.12.6
4.1
4.0
4.0
(4)
(4)
Federal Reserve index numberswithout seasonal adjustment,
1947-49 average =
Sales duringperiod
1954
July
85
110134102
616349
765971929379
737276
79
7762102
10262
74
90
71
89(4)(4)25831026975
(4)
81
859283
69
66
78
97
145
June
94
10412198
626553
9868928811896
736573
93
9375126
13468
l?A
93
99
110(4)(4)28133140100
• 92(4)
137
149147154
93
84
113
107
145
1953
July
87
112137105
616458
806375839683
737573
7)
7865100
10561
7)
100
77
92(4)(4)29961026977(4)
82
868887
69
70
83
97
137
1002
Stocks at endof month
1954
July
107
109119109
9710360
10610112684117127
9187105
131
114118109
10578
98
111
92
106(4)(4)747698109111(4)
104
10411199
111
105
1C4
(4)
0)
June
113
116130117
9910561
11310912990125133
968693
ir»3
115127105
11083
102
111
96
109(4)(4)5895107103107(4)
111
114122110
102
109
108
(4)
(4)
1953
July
113
119134119
10611471
11010713093115129
108111106
103
115
m10911372
104
118
99
109(4)(4)9580108118118(4)
108
106112102
122
111
1C7
(4)
(4)
JThe ratio of stocks to sales is obtained by dividing stocks at the end of the month by sales during the month and hence indicates the numberof months' supply on hand at the end of the month in terms of sales for that month.
2The 1947-49 average of monthly sales and of end-of-month stocks for each department is used as a base in computing the sales and stocksindexes, respectively, for that department. For description of indexes, see BULLETIN for November 1953, pp. 1146-1149.
3For movements of total department store sales and stocks, see the indexes tor the United States on p. 1109.4 Data not available.NOTE.—Based on reports from a group of large department stores located in various cities throughout the country. In 1953, sales and stocks
at these stores accounted for almost 50 per cent of estimated total department store sales and stocks. Not all stores report data for all of thedepartments shown; consequently, the sample for the individual departments is not so comprehensive as that for the total.
OCTOBER 1954 1113
Digitized for FRASER http://fraser.stlouisfed.org/ Federal Reserve Bank of St. Louis
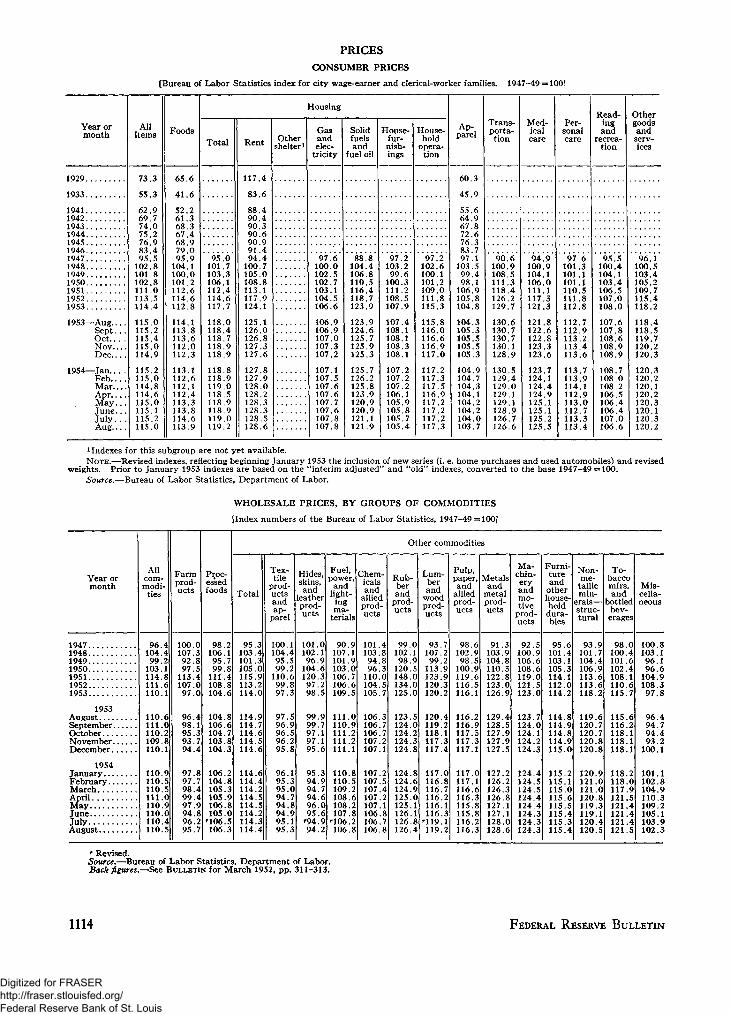
PRICESCONSUMER PRICES
[Bureau of Labor Statistics index for city wage-earner and clerical-worker families. 1947-49 =100]
Year ormonth
1929
1933
1941194219431944194519461947194819491950195119521953
1953—Aug....Sept . . .OctNovDec. . . .
1954—JanFeb.. . .Mar.. . .Apr.. . .May . . .June . . .J u l y . . .Aug.. . .
Allitems
73.3
55.3
62.969.774.075.276.983.495.5
102.8101.8102.8111.0113.5114.4
115.0115.2115.4115.0114.9
115.2115.0114.8114.6115.0115.1115.2115.0
Foods
65.6
41.6
52.261.368.367.468.979.095.9
104.1100.0101.2112.6114.6112.8
114.1113.8113.6112.0112.3
113.1112.6112.1112.4113.3113.8114.6113.9
Housing
Total
95.0101.7103.3106.1112.4114.6117.7
118.0118.4118.7118.9118.9
118.8118.9119.0118.5118.9118.9119.0119.2
Rent
117.4
83 6
88 490 490 390 690.991 494.4
100.7105.0108.8113.1117.9124.1
125.1126.0126.8127.3127.6
127.8127.9128.0128.2128.3128.3128.5128.6
Othershelter i
Gasandelec-
tricity
97.6100.0102.5102.7103.1104.5106.6
106.9106.9107.0107.3107.2
107.1107.5107.6107.6107.7107.6107.8107.8
Solidfuelsand
fuel oil
88.8104.4106.8110.5116.4118.7123.9
123.9124.6125.7125.9125.3
125.7126.2125.8123.9120.9120.9121.1121.9
House-fur-nish-ings
97.2103.299.6
100.3111.2108.5107.9
107.4108.1108.1108.3108.1
107.2107.2107.2106.1105.9105.8105.7105.4
House-hold
opera-tion
97.2102.6100.1101.2109.0111.8115.3
115.8116.0116.6116.9117.0
117.2117.3117.5116.9117.2117.2117.2117.3
Ap-parel
60.3
45.9
55 664 967 872 676.383 797.1
103.599.498.1
106.9105.8104.8
104.3105.3105.5105.5105.3
104.9104.7104.3104.1104.2104.2104.0103.7
Trans-porta-tion
90.6100.9108.5111.3118.4126.2129.7
130.6130.7130.7130.1128.9
130.5129.4129.0129.1129.1128.9126.7126.6
Med-icalcare
94.9100.9104.1106.0111.1117.3121.3
121.8122.6122.8123.3123.6
123.7124.1124.4124.9125.1125.1125.2125.5
Per-sonalcare
97.6101.3101.1101.1110.5111.8112.8
112.7112.9113.2113.4113.6
113.7113.9114.1112.9113.0112.7113.3113.4
Read-ingand
recrea-tion
95.5100.4104.1103.4106.5107.0108.0
107.6107.8108.6108.9108.9
108.7108.0108.2106.5106.4106.4107.0106.6
Othergoodsandserv-ices
96.1100.5103.4105.2109.7115.4118.2
118.4118.5119.7120.2120.3
120.3120.2120.1120.2120.3120.1120.3120.2
1 Indexes for this subgroup are not yet available.NOTE.—Revised indexes, reflecting beginning January 1953 the inclusion of new series (i. e. home purchases and used automobiles) and revised
weights. Prior to January 1953 indexes are based on the "interim adjusted" and "old" indexes, converted to the base 1947-49 = 100.Source.—Bureau of Labor Statistics, Department of Labor.
WHOLESALE PRICES, BY GROUPS OF COMMODITIES
[Index numbers of the Bureau of Labor Statistics, 1947-49 = 100]
Year ormonth
Allcom-modi-ties
Farmprod-ucts
Proc-essedfoods
Other commodities
Total
Tex-tile
prod-uctsandap-
parel
Hides,skins,and
leatherprod-ucts
Fuel,power,
andlight-ingma-
terials
Chem-icalsand
alliedprod-ucts
Rub-berand
prod-ucts
Lum-berand
woodprod-ucts
Pulp,paper,and
alliedprod-ucts
Metalsand
metalprod-ucts
Ma-chin-eryandmo-tive
prod-ucts
Furni-tureand
otherhouse-holddura-bles
Non-me-
tallicmin-
erals—struc-tural
T o -baccomfrs.a n d
bottledbev-erages
Mis-cella-neous
1947194819491950195119521953
1953AugustSeptemberOctoberNovember...December...
1954JanuaryFebruaryMarchAprilMayJuneJulyAugust
96.4104.499.2
103.1114.8111.6110.1
110.6111.0110.2109.8110.1
110.9110.5110.5111.0110.9110.0110.4110.5
100.0107.392.897.5
113.4107.097.0
96.498.195.393.794.4
97.897.98.499.497.994.896.295.
98.2106.195.799.8
111.4108.8104.6
104.8106.6104.7103.8104.3
106.2104.8105.3105.9106.8105.0
106.5106.3
95.3103.4101.3105.0115.9113.2114.0
114.9114.7114.6114.5114.6
114.6114.4114.2114114.5114.2114.3114.4
100.1104.495.599.2
110.699.897.3
97.596.996.596.295.8
96.195.395.094.94.894.995.195.3
101.0102.196.9
104.6120.397.298.5
99.999.797.197.195.6
95.394.99494.696.095.6
'94.994.2
90.9107.1101.9103.0106.7106.6109.5
111.0110.9111.2111.2111.1
110.8110.5109.108.6108.107.8
106.2106.8
101.4103.894.896.3
110.0104.5105.7
106.3106.7106.7107.2107.1
107107107107107106106106.8
99.0102.198.9
120.5148.0134.0125.0
123.5124.0124.2124.3124.8
124.8124.6124.9125.0125.1126.1126.8126.4
93.7107.299.2
113.9123.9120.3120.2
120.4119.2118.1117.3117.4
117.0116.8116.7116.2116.1116.3
'•119.1119.2
98.6102.998.5
100.9119.6116.5116.1
116.2116.9117.5117.3117.1
117.0117.1116.6116.3115.8115.8116.2116.3
91.3103.9104.8110.3122.8123.0126.9
129.4128.5127.9127.9127.5
127.2126126.3126.8127127.1128.0128.6
92.5100.9106.6108.6119.0121.5123.0
123.7124.0124.1124.2124.3
124.4124.5124.5124.4124.4124.3124.3124.3
95.6101.4103.1105.3114.1112.0114.2
114.8114.9114.8114.9115.0
115.2115.1115.0115.6115.5115.4115.3115.4
93.9101.7104.4106.9113.6113.6118.2
119.6120.7120.7120.8120.8
120.9121.0121.0120.8119.3119.1120.4120.5
98.0100.4101.6102.4108.1110.6115.7
115.6116.2118.1118.1118.1
118.2118.0117.9121.5121.4121.4121.4121.5
100.8103.196.196.6
104.9108.397.8
96.494.794.493.2
100.1
101.1102.8104.9110.3109.2105.1103.9102.3
r Revised.Source.—Bureau of Labor Statistics, Department of Labor.Back figures.—See BULLETIN for March 1952, pp. 311-313.
1114 FEDERAL RESERVE BULLETIN
Digitized for FRASER http://fraser.stlouisfed.org/ Federal Reserve Bank of St. Louis
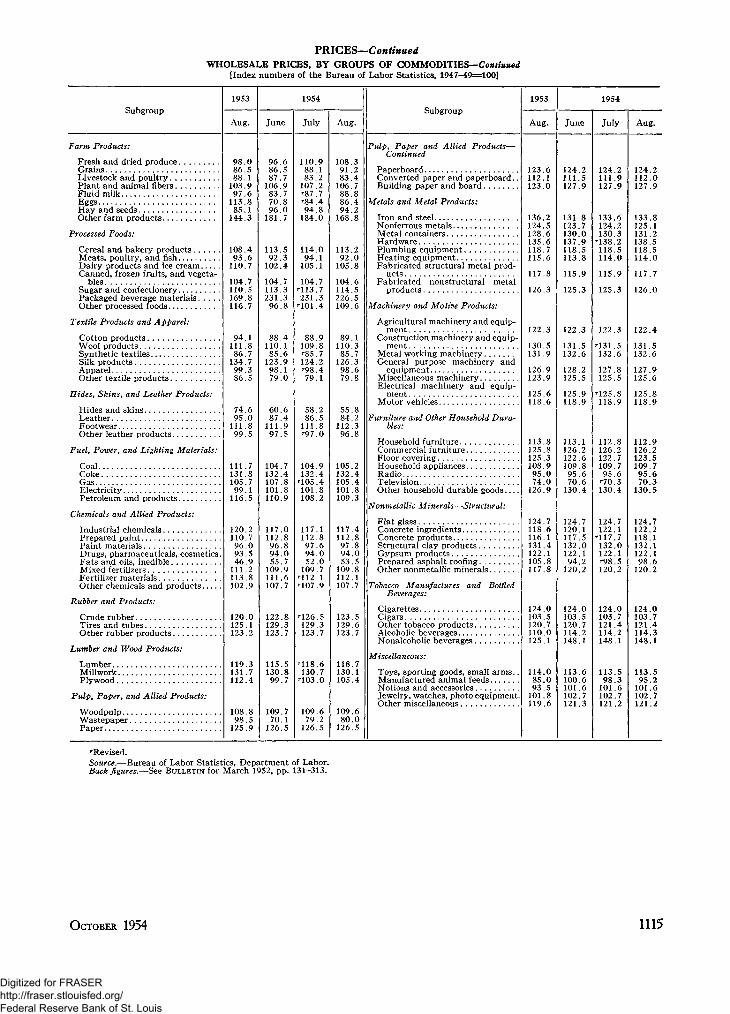
PRICES—ContinuedWHOLESALE PRICES, BY GROUPS OF COMMODITIES—Continued
[Index numbers of the Bureau of Labor Statistics, 1947-49=100]
Subgroup1953
Aug.
98.086.588.1
103.997.6
113.885.1
144.3
108.493.6
110.7
104.7110.5169.8116.7
94.1111.886.7
134.799.386.5
74.695.0
111.899.5
111.7131.8105.799.1
116.5
120.2110.796.093.546.9
111.2113.8102.9
120.0125.1123.2
119.3131.7112.4
108.898.5
125.9
1954
June
96.686.587.7
106.983.770.896.0
181.7
113.592.3
102.4
104.7113.3231.396.8
88.4110.185.6
123.998.179.0
60.687.4
111.997.5
104.7132.4107.8101.8110.9
117.0112.896.894.055.7
109.9111.6107.7
122.8129.3123.7
115.5130.899.7
109.770.1
126.5
July
110.988.183.2
107.2••87.7'84.494.8
184.0
114.094.1
105.1
104.7113.7231.3
101.4
88.9109.8'85.7124.2»-98.479.1
58.286.5
111.8'97.0
104.9132.4
105.4101.8108.2
117.1112.897.694.052.0
109.7112.1107.9
126.5129.3123.7
118.6130.7
103.0
109.679.2
126.5
Aug.
108.391.283.4
106.788.886.494.2
168.8
113.292.0
105.8
104.6114.5226.5109.6
89.1110.385.7
126.398.679.8
55.884.2
112.396.8
105.2132.4105.4101.8109.3
117.4112.897.894.053.5
109.8112.1107.7
123.5129.6123.7
118.7130.1105.4
109.680.0
126.5
Subgroup1953
Aug.
1954
June July Aug.
Farm Products:
Fresh and dried produceGrainsLivestock and poultryPlant and animal fibersFluid milkEggsHay and seedsOther farm products
Processed Foods:
Cereal and bakery productsMeats, poultry, and fishDairy products and ice creamCanned, frozen fruits, and vegeta-
blesSugar and confectioneryPackaged beverage materialsOther processed foods
Textile Products and Apparel:
Cotton productsWool productsSynthetic textilesSilk productsApparelOther textile products
Hides, Skins, and Leather Products:
Hides and skinsLeatherFootwearOther leather products
Fuel, Power, and Lighting Materials:
CoalCokeGasElectricityPetroleum and products
Chemicals and Allied Products:
Industrial chemicalsPrepared paintPaint materialsDrugs, Pharmaceuticals, cosmeticsFats and oils, inedibleMixed fertilizersFertilizer materialsOther chemicals and products
Rubber and Products:
Crude rubberTires and tubesOther rubber products
Lumber and Wood Products:
LumberMillworkPlywood
Pulp, Paper, and Allied Products:
WoodpulpWastepaperPaper
Pulp, Paper and Allied Products—Continued
PaperboardConverted paper and paperboard..Building paper and board
Metals and Metal Products:
Iron and steelNonferrous metalsMetal containersHardwarePlumbing equipmentHeating equipmentFabricated structural metal prod-
uctsFabricated nonstructural metal
products
Machinery and Motive Products:
Agricultural machinery and equip-ment
Construction machinery and equip-ment
Metal working machineryGeneral purpose machinery and
equipmentMiscellaneous machineryElectrical machinery and equip-
mentMotor vehicles
Furniture and Other Household Dura-bles:
Household furnitureCommercial furnitureFloor coveringHousehold appliancesRadioTelevisionOther household durable goods
Nonmetallic Minerals—Structural:
Flat glassConcrete ingredientsConcrete productsStructural clay productsGypsum productsPrepared asphalt roofingOther nonmetallic minerals.
Tobacco Manufactures and BottledBeverages:
CigarettesCigarsOther tobacco productsAlcoholic beveragesNonalcoholic beverages
Miscellaneous:
Toys, sporting goods, small arms..Manufactured animal feedsNotions and accessoriesJewelry, watches, photo equipment.Other miscellaneous
123.6112.1123.0
136.2124.5128.6135.6118.7115.6
117.8
126.3
122.3
130.5131.9
126.9123.9
125.6118.6
113.8125.8125.3108.995.074.0
126.9
124.7118.6116.1131.4122.1105.8117.8
124.0103.5120.7110.0125.1
114.085.093.5
101.8119.6
124.2111.5127.9
131.8123.7130.0137.9118.5113.8
115.9
125.3
122.3
131.5132.6
128.2125.5
125.9118.9
113.1126.2122.6109.895.670.6
130.4
124.7120.1117.5132.0122.194.2
120.2
124.0103.5120.7114.2148.1
113.6100.6101.6102.7121.3
124.2111.9127.9
133.6124.2130.3
138.2118.5114.0
115.9
125.3
122.3
131.5132.6
127.8125.5
125.8118.9
112.8126.2122.7109.795.6
'70.3130.4
124.7122.1
117.7132.0122.1'98.5120.2
124.0103.7121.4114.2148.1
113.598.3
101.6102.7121.2
124.2112.0127.9
133.8125.1131.2138.5118.5114.0
117.7
126.0
122.4
131.5132.6
127.9125.6
125.8118.9
112.9126.2123.5109.795.670.3
130.5
124.7122.2118.1132.1122.198.6
120.2
124.0103.7121.4114.3148.1
113.595.2
101.6102.7121.2
••Revised.Source.—Bureau of Labor Statistics, Department of Labor.Back figures.—See BULLETIN for March 1952, pp. 131-313.
OCTOBER 1954 1115
Digitized for FRASER http://fraser.stlouisfed.org/ Federal Reserve Bank of St. Louis

GROSS NATIONAL PRODUCT, NATIONAL INCOME, AND PERSONAL INCOME[Estimates of the Department of Commerce, in billions of dollars]
RELATION OF GROSS NATIONAL PRODUCT, NATIONAL INCOME, PERSONAL INCOME, AND SAVING
Annual totals
1929 1933 1941
Seasonally adjusted annual ratesby quarters
1953 1954
Gross national product
Less: Capital consumption allowances..Indirect business tax and related
liabilitiesBusiness transfer paymentsStatistical discrepancy
Plus: Subsidies less current surplus ofgovernment enterprises
Equals: National income
Less: Corporate profits and inventoryvaluation adjustment
Contributions for social insurance.Excess of wage accruals over dis-
bursementsPlus: Government transfer payments...
Net interest paid by government. .DividendsBusiness transfer payments
Equals: Personal income
Less: Personal tax and related payments..Federal
State and local
Equals: Disposable personal income.
Less: Personal consumption expenditures
Equals: Personal saving. . .
104.4
8.6
7.0.6.3
- . 1
87.8
10.1.2
.0
.91.05.8
.6
85.8
2.61.31.4
83.1
79.0
4.2
56.0
7.2
7.1.7.9
.0
40.2
-2 .0.3
.01.51.22.1
.7
47.2
15.5
1.0
45.7
46.4
- . 6
125.8
9.0
11.3.5.4
.1
104 7
14.52.8
.02.61.34.5
.596.3
3.32.01.3
93 0
81.9
11.1
257.3
16.5
20.4.7
- 2 . 1
- . 2
221.630.6
5.2
.010.54.47.2
.7
208.7
21.119.02.1
187.6
177.6
10.0
257.3
18.4
21.6.8.1
- . 2
216.2
28.15.7
.011.64.67.5
.8
206.8
18.716.22.5
188.2
180.6
7.6
285.1
20.5
23.7.8.2
.2
240.0
35.16.9
.014.34.79.2
227.1
20.918.22.7
206.1
194.0
12.1
328.2
23.5
25.61.01.3
.2
277.0
39.98.2
.111.64.89.11.0
255.3
29.326.3
3.0
226.1
208.3
17.7
346.1
25.3
28.01.0
.6
- . 2
291.038.28.7
.012.14.99.11.0
271.2
34.431.1
3.2
236.9
218.4
18.4
364 9
27.2
30.01.01.0
- . 5
305.0
38.58 8
- 112 85 09.41.0
286 1
36 032.5
3.5
250.1
230.1
20.0
369 9
27.4
30.21.02.6
- . 6
308.2
41 08 9
- 112 65 09 31 0
286 4
35 932 5
3 5
250.4
230.8
19.6
367.2
27.4
30.11.02.1
- . 4
306.2
38.38.7
- . 112.65.19.51.0
287.5
36.332.83.5
251.2
231.2
20.0
360.5
27.9
30.31.0
.6
- . 8
299.933.1
8.6
- . 113.35.29.61.0
287.3
36.132.6
3.6
251.2
229.7
21.5
355.8
28.2
30.31.0
- 3 . 0
- . 4
298.9
34.19.8
.014.25.29.61.0
285.1
32.829.1
3.7
252.3
230.5
21.8
356.0
29.0
30.21.0n.a.
n.a.9.7
.014.85.39.61.0
285 7
32.929.2
3.7
252.9
233.1
19.7
NATIONAL INCOME, BY DISTRIBUTIVE SHARES
National income
Compensation of employeesWages and salaries1
PrivateMilitaryGovernment civilian
Supplements to wages and salaries..
Proprietors* and rental income 2 . . .Business and professional
• FarmRental income of persons
Corporate profits and inventoryvaluation adjustment
Corporate profits before taxCorporate profits tax l iabil i ty. . . .Corporate profits after tax
Inventory valuation adjustment.. . .
Net interest
Annual totals
1929
87.8
51.150.445.5
.34.6
.7
20.28.86.05.4
10 19.61.48.3
6.4
1933
40.2
29.529.023.9
.34.9
.5
7.63.22.42.0
- 2 . 0.2.5
- . 4- 2 . 1
5.0
1941
104.7
64 862.151.9
1.98.32.7
20.910.96.53.5
14 517 07.69.4
- 2 . 5
4 5
1948
221.6
140.9135.2116.4
4.014.85.8
45.621.616.77.2
30 632 812.520.3
- 2 . 2
4.5
1949
216.2
140.9134.3113.9
4.216.26.5
42.021.412.77.9
28 126 210.415.8
1.9
5 2
1950
240.0
154.3146124.3
5.017.27.8
44.622.913.38.5
35 140 017.822.1
- 4 . 9
5.9
277.0
180.4170 9142.1
8.720.19.5
49.924.816.09.1
39 941 22218
- 1
6 8
1952
291.0
195.4185 0152.210.522.410.4
49.925.714.210.0
38 237 220.017 2
1.0
7.4
1953
305.0
209.1198.0164.510.223.311.1
49.026.212.210.6
38.539 421.118 3
- 1 . 0
8.4
Seasonally adjusted annual ratesby quarters
1953
308.2
210.0198.9165.310.423.211.1
48.926 312.110.5
41.041.922.519.5- 9
8 3
306.2
211.4200.3166.7
10.223.411.1
47.826.111.110.6
38.340.921.919.0
- 2 . 6
8 6
299.9
208.8197.6164.1
9.923.511.2
49.125.912.310.8
33 132.517.415.1
.6
8 9
298.9
206.4194.6161.2
9.723.711.8
49.425.613.010.8
34.134.517.017.5- . 4
9 0
n.a.
206.6194.9161.5
9.523.811.7
49 025.912.210.9
n.a.n.an.a.n.a.
.4
9.1
n.a. Not available.1 Includes employee contributions to social insurance funds.2Includes noncorporate inventory valuation adjustment.NOTE.—Details may not add to totals because of rounding.Source.—Department of Commerce.
1116 FEDERAL RESERVE BULLETIN
Digitized for FRASER http://fraser.stlouisfed.org/ Federal Reserve Bank of St. Louis
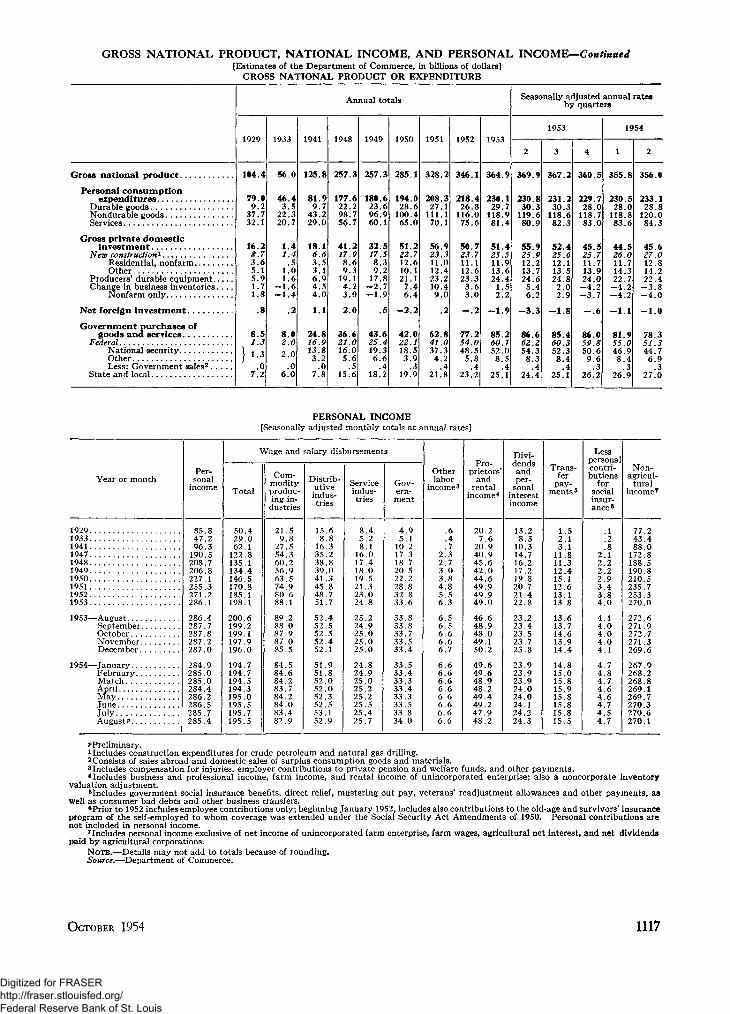
GROSS NATIONAL PRODUCT, NATIONAL INCOME, AND PERSONAL INCOME— Continued[Estimates of the Department of Commerce, in billions of dollars]
GROSS NATIONAL PRODUCT OR EXPENDITURE
Annual totals
1929 1933 1941 1948 1949 1950 1951 1952 1953
Seasonally adjusted annual ratesby quarters
1953 1954
Gross national product
Personal consumptionexpenditures
Durable goodsNondurable goodsServices
Gross private domesticinvestment
New construction1
Residential, nonfarmOther
Producers' durable equipmentChange in business inventories. . . .
Nonfarm only
Net foreign investment
Government purchases ofgoods and services
FederalNational securityOtherLess: Government sales2
State and local
104.4
79.09.2
37.732.1
16.28.73.65.15.91.71.8
.8
8.51.31.3
.07.2
56.0
46.43.5
22.320.7
1.41.4
.51.01.6
-1.6-1.4
.2
8.02.02.0
.06.0
125.8
81.99.7
43.229.0
18.16.63.53.16.94.54.0
1.1
24.816.913.83.2
.07.8
257.3
177.622.298.756.7
41.217.98.69.3
19.14.23.0
2.0
36.621.016.05.6
.515.6
257.3
180.623.696.960.1
32.517.58.39.2
17.8-2.7-1.9
.5
43.625.419.36.6
.418.2
285.1
194.028.6
100.465.0
51.222.712.610.121.1
7.46.4
-2.2
42.022.118.53.9
.319.9
328.2
208.327.1
111.170.1
56.923.311.012.423.210.49.0
.2
62.841.037.34.2
.421.8
346.1
218.426.8
116.075.6
50.723.711.112.623.3
3.63.0
- . 2
77.254.048.55.8
.423.2
364.9
230.129.7
118.981.4
51.425.511.913.624.4
1.52.2
- 1 . 9
85.260.152.08.5
.425.1
369.9
230.830.3
119.680.9
55.925.912.213.724.65.46.2
-3.3
86.662.254.38.3
.424.4
367.2
231.230.3
118.682.3
52.425.612.113.524.82.02.9
- 1 . 8
85.460.352.38.4
.425.1
360.5
229.728.0
118.783.0
45.525.711.713.924.0
- 4 . 2- 3 . 7
- . 6
86.059.850.69.6
.326.2
355.8
230.528.0
118.883.6
44.526.011.714.322.7
- 4 . 2- 4 . 2
- 1 . 1
81.955.046.98.4
.326.9
356.0
233.128.8
120.084.3
45.627.012.814.222.4
- 3 . 8- 4 . 0
- 1 . 0
78.351.344.76.9
.327.0
PERSONAL INCOME[Seasonally adjusted monthly totals at annual rates]
Year or month
192919331941194719481949. . .1950195119521953
1953—August.SeptemberOctober. .NovemberDecember
1954—January.FebruaryMarch . . . .AprilMayJune . . .JulyAugust?
Per-sonal
income
85.847 296.3
190 5208.7206 8227.1255.3271.2286.1
286.4287.7287 8287.2287.0
284.9285.0285 0284.4286.2286 5285.7285.4
Wage and salary disbursements
Total
50.429 062.1
122 8135.1134 4146.5170.8185.1198 1
200.6199.2199 1197.9196.0
194.7194.7194 5194.3195.0195 5195.7195.5
Com-modityproduc-ing in-
dustries
21.59 8
27.554 360.256 963.574.980.688.1
89.288.087 987.085.5
84.584.684 283.784.284 083.482.9
Distrib-utiveindus-tries
15.68.8
16.335.238.839 041.345.848.751.7
52.452.552.552.452.1
51.951.852 052.052.352.553.152.9
Serviceindus-tries
8.45.28.1
16 017.418 019.521.323.024.8
25.224.925.025.025.0
24.824.925.025.225.225.525.425.7
Gov-ern-ment
4.95 1
10.217 318.720 522.228.832.833.6
33.833.833.733.533.4
33.533.433 333.433.333.533.834.0
Otherlabor
income3
.64
.72 32.73 03.84.85.56.3
6.56.56.66.66.7
6.66.66.66.66.66 . 66.66.6
Pro-prietors'
andrental
income4
20.27 6
20.940 945.642 044.649.949.949.0
46.648.948.049.150.2
49.649.648 948.249.449.247.948.2
Divi-dendsandper-
sonalinterestincome
13.28 3
10.314 716.217 219.820.721.422.8
23.223.423 523.723.8
23.923.923 924.024.024 124.224.3
Trans-fer
pay-ments 5
1.52 13.1
11 811.312 415.112.613.113 8
13.613.714 613.914.4
14.815.015 815.915 815 815.815.5
Lesspersonalcontri-butions
forsocialinsur-ance8
.12
.82 12.22 22.93.43.84 0
4.14.04 04.04.1
4.74.84 74.64 64 74.54.7
Non-agricul-
turalincome7
77.243 488.0
172 8188.5190 8210.5235.7253.3270 0
272.6271.9272 7271.3269.6
267.9268.2268 8269.1269 7270 3270.6270.1
^Preliminary.1 Includes construction expenditures for crude petroleum and natural gas drilling.2 Consists of sales abroad and domestic sales of surplus consumption goods and materials.3Includes compensation for injuries, employer contributions to private pension and welfare funds, and other payments.4Includes business and professional income, farm income, and rental income of unincorporated enterprise; also a noncorporate inventory
valuation adjustment.eIncludes government social insurance benefits, direct relief, mustering out pay, veterans' readjustment allowances and other payments, as
well as consumer bad debts and other business transfers.6Prior to 1952 includes employee contributions only; beginning January 1952, includes also contributions to the old-age and survivors' insurance
program of the self-employed to whom coverage was extended under the Social Security Act Amendments of 1950. Personal contributions arenot included in personal income.
7 Includes personal income exclusive of net income of unincorporated farm enterprise, farm wages, agricultural net interest, and net dividendspaid by agricultural corporations.
NOTE.—Details may not add to totals because of rounding.Source.—Department of Commerce.
OCTOBER 1954 1117
Digitized for FRASER http://fraser.stlouisfed.org/ Federal Reserve Bank of St. Louis
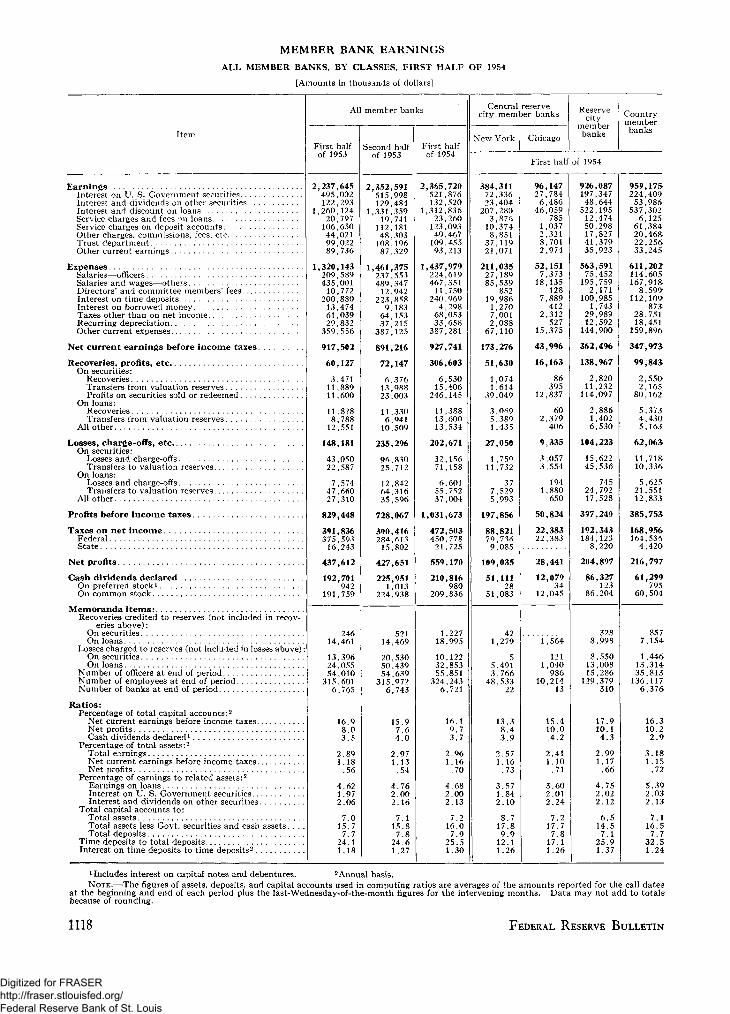
MEMBER BANK EARNINGS
ALL MEMBER BANKS, BY CLASSES, FIRST HALF OF 1954
[Amounts in thousands of dollars]
Iten
EarningsInterest on U. S. Government securities. . .Interest and dividends on other securities.Interest and discount on loansService charges and fees ^n loansService charges on deposit accountsOther charges, commissions, fees, etcTrust departmentOther current earnings
ExpensesSalaries—officersSalaries and wages—othersDirectors' and committee members' fees. . .Interest on time depositsInterest on borrowed moneyTaxes other than on net incomeRecurring depreciationOther current expenses
Net current earnings before income taxes.
Recoveries, profits, etcOn securities:
RecoveriesTransfers from valuation reservesProfits on securities sold or redeemed.
On loans:RecoveriesTransfers from valuation reserves
All other
Losses, charge-offs, etcOn securities:
Losses and charge-offsTransfers to valuation reserves
On loans:Losses and charge-offsTransfers to valuation reserves
All other
Profits before income taxes
Taxes on net incomeFederalState
Net profits
Gash dividends declaredOn preferred stock1
On common stock
Memoranda items:Recoveries credited to reserves (not included in recov-
eries above):On securitiesOn loans
Losses charged to reserves (not included in losses above)On securitiesOn loans
Number of officers at end of periodNumber of employees at end of periodNumber of banks at end of period
Ratios:Percentage of total capital accounts:2
Net current earnings before income taxesNet profitsCash dividends declared1 ,
Percentage of total assets:2
Total earningsNet current earnings before income taxesNet profits
Percentage of earnings to related assets:2
Earnings on loansInterest on U. S. Government securitiesInterest and dividends on other securities
Total capital accounts to:Total assetsTotal assets less Govt. securities and cash assets. . .Total deposits
Time deposits to total depositsInterest on time deposits to time deposits2
All member banks
First halfof 1953
2,237,645495,002122,293
1,260,12420,797106,65044,02199,02289,736
1,320,143209,589435,00110,772
200,88013,47461,03929,832
359,556
917,502
60,127
3,47111,88911,600
11,8?88,78812,551
148,181
43,05022,587
7,57447,66027,310
829,448
391,836375,59316,243
437,612
192,701942
191,759
24614,461
13,39624,05554,010
315,6016,765
16.98.03.5
2.891.18.56
4.621.972.06
7.015.77.7
24.11.18
Second halfof 1953
2,352,591515,998129,484
1,331,35919,741
112,18148,303108,19687,329
1,461,375237,553489,34712,942
223,8589,18364,15337,215
387,125
891,216
72,147
6,37613 Q8823,003
11,3306,94110,509
235,296
96,83025,712
12,84264,31635,596
728,067
300,416284-, 61315,802
427,651
225,9511,013
224,938
52114,469
20,53050,43954,639
315,9726,743
15.97.64.0
2.971.13.54
4.762.002.16
7.115.87.8
24.61.27
First halfof 1954
2,365,720521,876132,520
1,312,83623,260123,09349,467109,45593,213
1,437,979224,619467,35111,750
240,9694,29868,05333,658387,281
927,741
306,603
6,53015,406
246,145
11,38813,60013,534
202,671
32,15671,158
6,60155,75237,004
1,031,673
472,503450,77821,725
559,170
210,816980
209,836
1.22718,995
10,12232,85355,851
324,2436,721
16.19.73.7
2.961.16.70
4.682.002.13
7.216.07.9
25.51.30
Central reservecity member banks
New York Chicago
Reservecity
memberbanks
Countrymemberbanks
First half of 1954
384,31172,33623,404
207,2803,87610,3748,851
37,11921,071
211,03527,18985,539
85219,9861,2707,0012,08867,110
173,276
51,630
1,0741,614
39,049
3, 0*95,3891,435
27,050
1,75911,732
377,5295,993
197,856
88,82179,7369,085
109,035
51,11128
51,083
421,279
55,4913,766
48,53322
13.38.43.9
2.571.16.73
3.571.842.10
8.717.89.912.11.26
96,14727,7846,486
46,059785
1,0372,3218,7012,974
52,1517,373
18,135128
7,889412
2,312527
15,375
43,996
16,163
86395
12,83760
2,379406
9,335
3,0573,554
1941,880650
50,824
22,38322.383
28,441
12,07934
12,045
1,564
1211,040986
10,21413
15.410.04.2
2.411.10.71
3.602.012.24
7.217.77.817.11.26
926,087197,34748,644522,19512,47450,29817,82741,37935,923
563,59175,452195,7592,171
100,9851,743
29,98912,592
144,900
362,496
138,967
2,82011,232114,097
2,8861,4026,530
104,223
15,62245,536
74524,79217,528
397,249
192,343184,123
8,220
204,897
86,327123
86,204
3288,998
8,55013,00815,286
129,379310
17.910.14.3
4.752.022.12
6.514.57.1
25.91.37
959,175224,40953,986
537,3026,125
61,38420,46822,25633,245
611,202114,605167,918
8,599112,109
87528,75118,451
159,896
347,973
99,843
2,5502,165
80,1625,3734,4305,163
62,063
11,718-10,336
5,62521,55112,833
385,753
168,956164,536
4,420
216,797
61,299795
60,504
8577,154
1,44613,31435,813
136,1176,376
16.310.22.9
3.181.15
.72
5.392.032.13
7.116.57.7
32.51.24
1 Includes interest on capital notes and debentures. 2Annual basis.NOTE.—The figures of assets, deposits, and capital accounts used in computing ratios are averages of the amounts reported for the call dates
at the beginning and end of each period plus the last-Wednesday-of-the-month figures for the intervening months. Data may not add to totalsbecause of rounding.
1118 FEDERAL RESERVE BULLETIN
Digitized for FRASER http://fraser.stlouisfed.org/ Federal Reserve Bank of St. Louis

INTERNATIONAL FINANCIAL STATISTICS
PAGE
International capital transactions of the United States 1120-1124
Gold production 1124
Estimated foreign gold reserves and dollar holdings 1125
Reported gold reserves of central banks and governments 1126
Net gold purchases and gold stock of the United States. 1127
International Monetary Fund and Bank 1128
Central banks 1128-1132
Money rates in foreign countries 1133
Commercial banks 1134
Foreign exchange rates 1135
Price movements in principal countries:
Wholesale prices 1136
Consumers' price indexes 1137
Security prices 1137
Tables on the following pages include the principal available statistics of current significance relatingto gold, international capital transactions of the United States, and financial developments abroad.The data are compiled for the most part from regularly published sources such as central and com-mercial bank statements and official statistical bulletins, some data are reported to the Board directly.Figures on international capital transactions of the United States are collected by the Federal ReserveBanks from banks, bankers, brokers, and dealers in the United States in accordance with the TreasuryRegulation of November 12, 1934. Back figures for all except price tables, together with descriptivetext, may be obtained from the Board's publication, Banking and Monetary Statistics.
OCTOBER 1954 1119
Digitized for FRASER http://fraser.stlouisfed.org/ Federal Reserve Bank of St. Louis
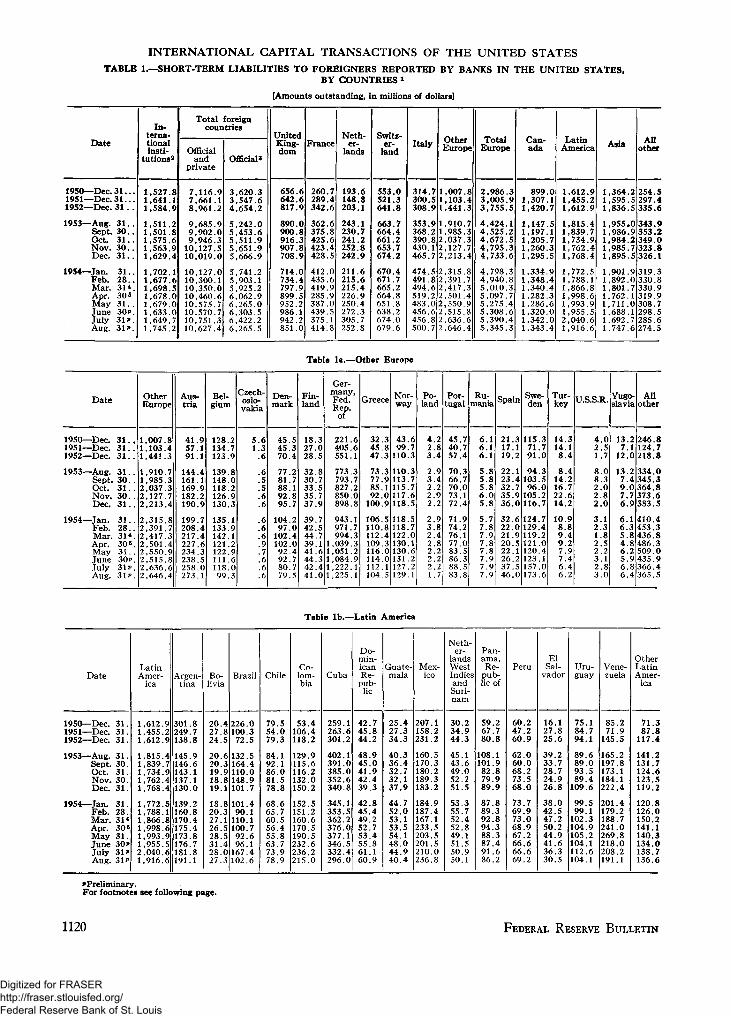
INTERNATIONAL CAPITAL TRANSACTIONS OF THE UNITED STATESTABLE 1.—SHORT-TERM LIABILITIES TO FOREIGNERS REPORTED BY BANKS IN THE UNITED STATES,
BY COUNTRIES 1
Date
1950—Dec. 3 1 . . .1951—Dec. 3 1 . . .1952—Dec. 31 . .
1953—Aug. 3 1 . .Sept. 30 . .Oct. 3 1 . .Nov. 30 . .Dec. 3 1 . .
1954—Jan. 31..Feb. 28. .Mar. 31*.Apr. 306May 31. .June 30P .July 31 P.Aug. 31 P.
In-terna-tionalinsti-
tutions2
1,527.81,641.11,584.9
1,511.21,501.81,575.61,563.91,629.4
1,702.11,677.61,698.51,678.01,679.01,633.01,649.71,745.2
Total foreigncountries
Officialand
private
7,116.97,661.18,961.2
9,685.99,902.09,946.3
10,127.510,019.0
10,127.010,300.110,350.010,460.610,575.710,570.710,751.310,627.4
Official*
3,620.33,547.64,654.2
5,242.05,453.65,511.95,651.95,666.9
5,741.25,903.15,925.26,062.96,265.06,303.56,422.26,265.5
[Amounts outstanding, i
UnitedKing-dom
656.6642.6817.9
890.0900.8916.3907.8708.9
714.0734.4797.9899.5952.2986.1942.2851.0
France
260.7289.4342.6
362.6375.8425.6423.4428.5
412.0435.6419.9285.9387.0439.5375.1414.8
Neth-er-
lands
193.6148.8203.1
243.1230.7241.2252.8242.9
211.6215.6215.4226.9250.4272.3305.7252.8
n millions of dollars]
Switz-er-
land
553.0521.3641.8
663.7664.4661.2653.7674.2
670.4671.7665.2664.8651.8638.2674.0679.6
Italy
314.7300.5308.9
353.9368.2390.8430.1465.7
474.5491.8494.6519.2483.0456.6456.8500.7
OtherEurope
1,007.81,103.41.441.3
1,910.71,985.32,037.32,127.72,213.4
2,315.82,391.72,417.32,501.42,550.92,515.82,636.62,646.4
TotalEurope
2,986.33,005.93,755.5
4,424.14,525.24,672.54,795.34,733.6
4,798.34,940.85,010.35,097.75,275.45,308.65,390.45,345.3
Can-ada
899.01,307.11,420.7
1,147.51,197.11,205.71,260.31,295.5
1,334.91,348.41,340.41,282.31,286.61,320.01,342.01,343.4
LatinAmerica
1,612.91,455.21,612.9
1,815.4L,839.71,734.91,762.41,768.4
1,772.5L,788.11,866.81,998.6L.993.91,955.52,040.61,916.6
Asia
1,364.21,595.51.836.5
1,955.01,986.91,984.21,985.71,895.5
1,901.91,892.01,801.7L,762.1L, 711.0L,688.1L.692.71,747.6
Allother
254.5297.4335.6
343.9353.2349.0323.8326.1
319.3330.8330.9319.9308.7298.5285.6274.5
Table la.—Other Europe
Date
1950—Dec. 3 1 . .1951—Dec. 3 1 . .1952—Dec. 3 1 . .
1953—Aug. 3 1 . .Sept. 30. .Oct. 31. .Nov. 30. .Dec. 3 1 . .
1954—Jan . 3 1 . .Feb. 28..Mar. 31*.Apr. 30«.May 31 . .June 30P .July 31 P .Aug. 31P .
OtherEurope
1,007.81,103.41,441.3
1,910.71,985.32,037.32,127.72,213.4
2,315.82,391.72,417.32,501.42,550.92,515.82,636.62,646.4
Aus-tria
41.957.191.1
144.4161.1169.9182.2190.9
199.7208.4217.4227.6234.3238.5258.0273.1
Bel-gium
128.2134.7123.9
139.8148.0118.2126.9130.3
135.1133.9142.1121.2122.9111.6118.099.3
Czech-oslo-vakia
5 . 61.3
.6
.6
.5
.5
.6
.6
.6
.6
.6
.9
.7
.6
.6
.6
Den-mark
45.545.370.4
77.281.788.192.895.7
104.297.0
102.4102.092.492.780.779.5
Fin-land
18.327.028.5
32.830.733.535.737.9
39.742.544.739.141.644.342.441.0
Ger-many,Fed.Rep.
of
221.6405.6551.1
773.3793.7827.2850.0898.8
943.1971.7994.3
1,039.31,051.21,084.91,222.11,225.1
Greece
32.345.847.3
73.377.985.192.0
100.9
106.5110.8112.4109.3116.0114.0112.1104.5
Nor-way
43.699.7
110.3
110.3113.7115.7117.6118.5
118.5118.7122.0130.1130.6131.2127.2129.1
Po-land
4 . 22 . 83 . 4
2 . 93 . 42 . 22 . 92 . 2
2 . 93 . 82 . 42 . 82 . 22 .22 . 21.7
Por-tugal
45.740.757.4
70.366.770.073.172.4
71.974.276.177.083.586.388.583.8
Ru-mania
6 . 16 . 16 . 1
5 . 85 . 85 . 86 . 05 . 8
5 . 77 .87 . 97 . 87 .87 .97 .97 .9
Spain
21.317.119.2
22.123.432.735.936.0
32.622.021.920.522.126.237.546.0
Swe-den
115.371.791.0
94.3103.596.0
105.2116.7
124.7129.4119.2121.0120.4123.1157.0173.6
Tur-key
14.314.1
8 . 4
8 . 414.216.722.614.2
10.98 . 89 . 49 . 27 .97 .46 . 46 .2
U.S.S.R.
4 . 02 . 51.7
8 . 08 . 32 . 02 . 82 . 0
3 . 12 . 31.82 . 52 . 23 . 12 . 83 . 0
Yugo-slavia
13.27 .1
12.0
13.27 .49 . 07.76 . 9
6 . 16 . 35 . 84 . 86 .25 . 96 . 86 . 4
Allother
246.8124.7218.8
334.0345.3364.8373.6383.5
410.4453.3436.8486.3509.0435.9366.4365.5
Table lb.—Latin America
Date
1950—Dec. 31.1951—Dec. 31.1952—Dec. 31.
1953—Aug. 31.Sept. 30.Oct. 31.Nov. 30.Dec. 31.
1954—Jan. 31.Feb. 28.Mar. 31*Apr. 30«May 31.June 30PJuly 31 PAug. 31 P
LatinAmer-
ica
1,612.91,455.21,612.9
1,815.41,839.71,734.91,762.41,768.4
1,772.51,788.1L.866.81,998.61,993.9L.955.52,040.61,916.6
Argen-tina
301.8249.7138.8
145.9146.6143.1137.1130.0
139.2160.8170.4175.4173.8176.7181.8191.1
Bo-livia
20.427.824.5
20.620.319.918.819.1
18.820.327.126.528.531.428.027.3
Brazil
226.0100.372.5
132.5164.4110.0148.9101.7
101.490.1
110.1100.792.696.1
167.4102.6
Chile
79.554.079.3
84.192.186.081.578.8
68.665.760.556.455.863.773.978.9
Co-lom-bia
53.4106.4118.2
129.9115.6116.2132.0150.2
152.5151.2160.6170.5190.5232.6236.2215.0
Cuba
259.1263.6301.2
402.1391.0385.0352.6340.8
345.1353.5362.2376.0377.1346.5332.4296.0
D o -min-icanRe-
pub-lic
42.745.844.2
48.945.041.942.439.3
42.845.449.252.753.455.861.160.9
Guate-mala
25.427.334.3
40.336.432.732.137.9
44.752.053.153.554.148.044.940.4
Mex-ico
207.1158.2231.2
160.5170.3180.2189.3183.2
184.9187.4167.1233.5203.5201.5210.0236.8
Neth-er-
landsWestIndiesandSuri-n a m
30.234.944.3
45.143.649.052.251.5
53.355.752.452.849.151.550.950.1
Pan-ama,Re-
pub-lic of
59.267.780.8
108.1101.982.879.989.9
87.889.392.894.388.387.491.686.2
Peru
60.247.260.9
62.060.068.273.568.0
73.769.973.068.967.266.666.669.2
ElSal-
vador
16.127.825.6
39.233.728.724.926.8
38.042.547.250.244.941.636.330.5
Uru-guay
75.184.794.1
89.689.093.589.4
109.6
99.599.1
102.3104.9105.2104.1112.6104.1
Vene-zuela
85.271.9
145.5
165.2197.8173.1184.1222.4
201.4179.2188.7241.0269.8218.0208.2191.1
OtherLatinAmer-
ica
71.387.8
117.4
141.2131.7124.6123.5119.2
120.8126.0150.2141.1140.3134.0138.7136.6
^Preliminary.For footnotes see following page.
1120 FEDERAL RESERVE BULLETIN
Digitized for FRASER http://fraser.stlouisfed.org/ Federal Reserve Bank of St. Louis
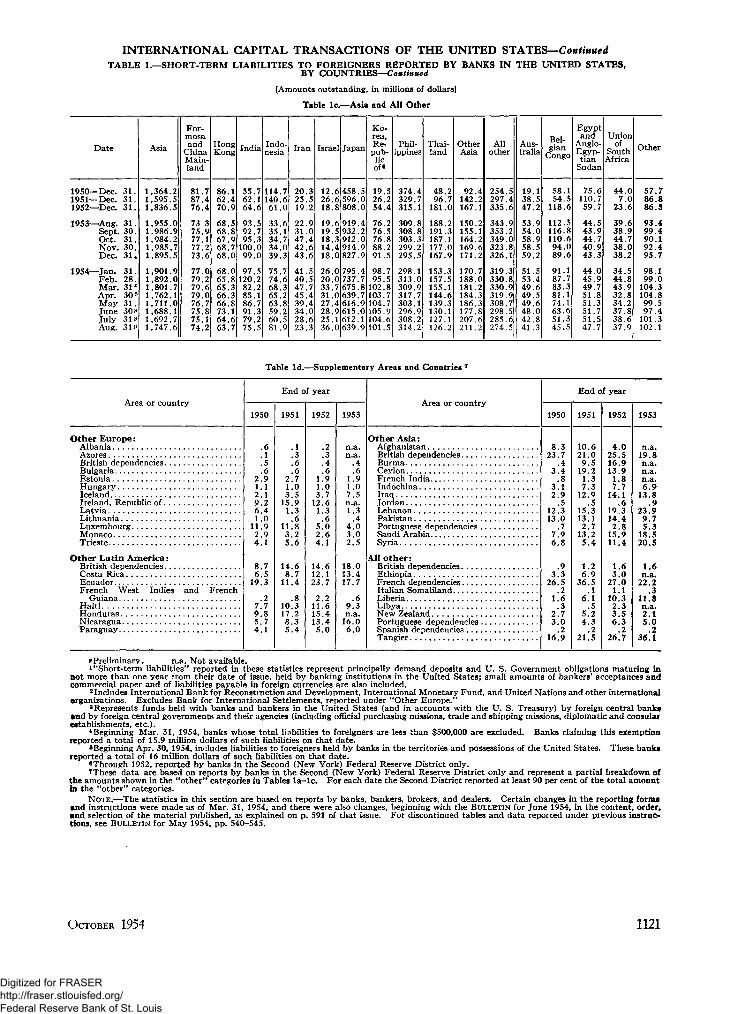
INTERNATIONAL CAPITAL TRANSACTIONS OF THE UNITED STATES—ContinuedTABLE 1.—SHORT-TERM LIABILITIES TO FOREIGNERS REPORTED BY BANKS IN THE UNITED STATES,
BY COUNTRIES—Continued
[Amounts outstanding, in millions of dollars]
Table lc—Asia and All Other
Date
1950—Dec. 31.1951—Dec. 31.1952—Dec. 31.
1953—Aug. 31.Sept. 30.Oct. 31.Nov. 30.Dec. 31.
1954—Jan. 31.Feb. 28.Mar. 314Apr. 305May 31.June 30PJuly 31*Aug. 31 P
Asia
1,364.21,595.51,836.5
1,955.01,986.91,984.21,985.71,895.5
1,901.91,892.01,801.71,762.11,711.01,688.11,692.71,747.6
For-mosaand
ChinaMain-land
81.787.476.4
73 375.977.177.273.6
77.079.279.679.076.775.875.174.2
HongKong
86.162.470.9
68.568.867.968.768.0
68.065.865.366.366.873.164.663.7
India
55.762.164.6
93.592.795.3
100.099.0
97.5120.282.285.186.791.379.275.5
Indo-nesia
114.7140.661.0
33.635.134.734.039.3
75.774.668.365.263.859.260.581.9
Iran
20.325.519.2
22.931.047.442.643.6
41.540.547.745.439.434.028.623.3
Israel
12.626.618.8
19.619.518.314.418.0
26.020.033.731.027.428.925.136.0
Japan
458.5596.0808.0
919.4932.2912.0914.9827.9
795.4737.7675.8639.7616.9615.0612.1639.9
Ko-rea,Re-
pub-licof«
19.526.254.4
76.276.576.888.291.5
98.795.5
102.8103.7104.7105.9104.6101.5
Phil-ippines
374.4329.7315.1
309.8308.8303.3299.2295.5
298.1313.0309.9317.7303.1296.9308.2314.2
Thai-land
48.296.7
181.0
188.2191.3187.1177.0167.9
153.3157.5155.1144.6139.3130.1127.1126.2
OtherAsia
92.4142.2167.1
150.2155.1164.2169.6171.2
170.7188.0181.2184.3186.3177.8207.6211.2
Allother
254.5297.4335.6
343.9353.2349.0323.8326.1
319.3330.8330.9319.9308.7298.5285.6274.5
Aus-tralia
19.138.547.2
53.954.058.958.559.2
51.553.449.649.549.648.042.841.3
Bel-gian
Congo
58.154.5
118.6
112.5116.8110.694.089.6
91.187.783.381.174.163.651.345.5
Egyptand
Anglo-Egyp-tian
Sudan
75.6110.759.7
44.543.944.740.943.3
44.045.949.751.851.351.751.547.7
Unionof
SouthAfrica
44.07 . 0
23.6
39.638.944.738.038.2
34.544.843.932.834.237.838.637.9
Other
57.786.886.5
93.499.490.192.495.7
98.199.0
104.3104.899.597.4
101.3102.1
Table Id.—Supplementary Areas and Countries 7
Area or countryEnd of year
1950 1951 1952 1953
Area or country
End of year
1950 1951 1952 1953
Other Europe:AlbaniaAzoresBritish dependencies.BulgariaEstoniaHungaryIcelandIreland, Republic of.LatviaLithuaniaLuxembourgMonacoTrieste
Other Latin America:British dependenciesCosta RicaEcuadorFrench West Indies and French
GuianaHaitiHondurasNicaraguaParaguay
.62.91.12.19.26.41.0
11.92.94.1
8.76.5
19.3
.27.79.85.74.1
.62.71.03.5
15.91.3
.611.83.25.6
14.68.7
11.4
.810.317.28.35.4
.61.91.03.7
12.61.3
.65.02.64.1
14.612.123.7
2.211.615.413.45.0
n.a.n.a.
.4
.61.91.07.5n.a.1.3
.44.03.02.5
18.013.417.7
.69.3n.a.
16.06.0
Other Asia:AfghanistanBritish dependencies.Burma.CeylonFrench IndiaIndochinaIraqJordanLebanonPakistanPortuguese dependencies .Saudi ArabiaSyria
All other:British dependenciesEthiopiaFrench dependenciesItalian SomalilandLiberiaLibyaNew ZealandPortuguese dependenciesSpanish dependenciesTangier
8.323.7
.43.4
.83.12.9
.512.313.0
.77.96.8
.93.3
26.5.2
1.6.3
2.73.0
.216.9
10.621.09.5
19.21.37.3
12.9.5
15.313.12.7
13.25.4
1.26.9
36.5.1
6.1.5
5.24.3
.221.5
4.025.516.913.91.87.7
14.1.6
19.314.42.8
15.911.4
1.63.0
27.01.1
10.32.33.56.3
.226.7
n.a.19.8n.a.n.a.n.a.6.9
13.8.9
23.99.75.3
18.520.5
1.6n.a.
22.2.3
11.8n.a.2.15.0
.236.1
pPreliminary. n.s. Not available.i "Short-term liabilities" reported in these statistics represent principally demand deposits and U. S. Government obligations maturing in
not more than one year from their date of issue, held by banking institutions in the United States; small amounts of bankers' acceptances andcommercial paper and of liabilities payable in foreign currencies are also included.
2Includes International Bank for Reconstniction and Development, International Monetary Fund, and United Nations and other internationalorganizations. Excludes Bank for International Settlements, reported under "Other Europe."
3 Represents funds held with banks and bankers in the United States (and in accounts with the U. S. Treasury) by foreign central banksand by foreign central governments and their agencies (including official purchasing missions, trade and shipping missions, diplomatic and consularestablishments, etc.).
4Beginning Mar. 31, 1954, banks whose total liabilities to foreigners are less than $500,000 are excluded. Banks claiming this exemptionreported a total of 15.9 million dollars of such liabilities on that date.
6Beginning Apr. 30, 1954, includes liabilities to foreigners held by banks in the territories and possessions of the United States. These banksreported a total of 16 million dollars of such liabilities on that date.
•Through 1952, reported by banks in the Second (New York) Federal Reserve District only.7These data are based on reports by banks in the Second (New York) Federal Reserve District only and represent a partial breakdown of
the amounts shown in the "other" categories in Tables la-lc. For each date the Second District reported at least 90 per cent of the total amountin the "other" categories.
NOTE.—The statistics in this section are based on reports by banks, bankers, brokers, and dealers. Certain changes in the reporting formsand instructions were made as of Mar. 31, 1954, and there were also changes, beginning with the BULLETIN for June 1954, in the content, order,and selection of the material published, as explained on p. 591 of that issue. For discontinued tables and data reported under previous instruc-tions, see BULLETIN for May 1954, pp. 540-545.
OCTOBER 1954 1121
Digitized for FRASER http://fraser.stlouisfed.org/ Federal Reserve Bank of St. Louis
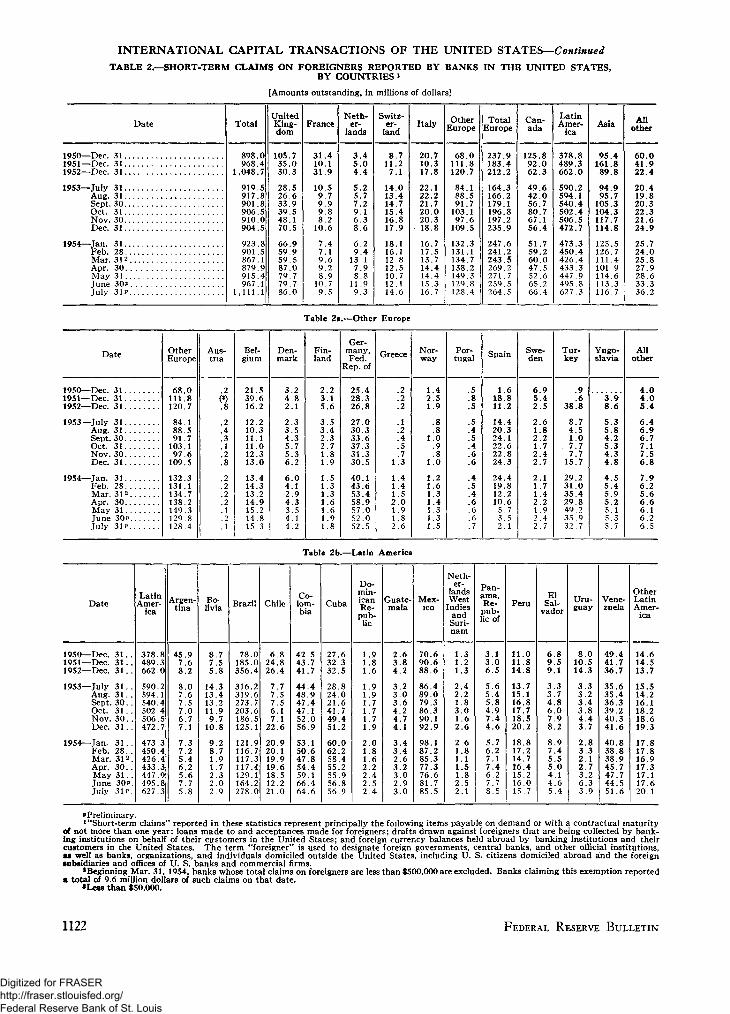
INTERNATIONAL CAPITAL TRANSACTIONS OF THE UNITED STATES—ContinuedTABLE 2.—SHORT-TERM CLAIMS ON FOREIGNERS REPORTED BY BANKS IN THE UNITED STATES,
BY COUNTRIES *
[Amounts outstanding, in millions of dollars]
Date Total
898.0968.4
1,048.7
919.5917.8901.8906.5910.0904.5
923.8901.5867.1879.9915.4967.1
1,111.1
UnitedKing-dom
105.735.030.3
28.526.633.939.548.170.5
66.959.959.587.079.779.786.0
France
31.410.131.9
10.59 . 79 . 99 . 88 .2
10.6
7 . 47 .19 . 69 . 28 .9
10.79 . 5
Neth-er-
lands
3 . 45 . 04 . 4
5 .25 . 77 .29 . 16 . 38 . 6
6 .29 . 4
13.17 . 98 .8
11 .99 . 3
Switz-er-
land
8 .711.2
7 . 1
14.013.414.715.416.817.9
18.116.112 812.510.712.114.6
Italy
20.710.317.8
22.122.221.720.020.318.8
16.717.513.714.414.415.316.7
OtherEurope
68111120
848891
10397
109
132131134138149129128
.0
.8
.7
.1
.5
.7
.1
.6
.5
.3
.1
.7
.2
.3
.8
.4
TotalEurope
237.9183.4212.2
164.3166.2179.1196.8197.2235.9
247.6241.2243.5269.2271.7259.5264.5
Can-ada
1259262
494256806756
5159
803
607714
7.2
60.047526566
.5
.6
.2
.4
LatinAmer-
ica
378.489.662.
590.594.540.502.506.472.
473.450.426.433.447.495627.
830
214457
3443983
Asia
95161
48
89.8
9495
97
105.3104117114
125126111101114113116
378
57
.496
.3
.7
Allother
1950—Dec. 311951—Dec. 311952—Dec. 31
1953—July 31Aug. 31Sept. 30Oct. 31Nov. 30Dec. 31
1954—Jan. 31Feb. 28Mar. 312Apr. 30May 31June 30PJuly 31 J»
60.041.922.4
20.419.820.322.321.624.9
25.724.025.827.928.633.336.2
Table 2a.—Other Europe
Date
1950—Dec. 311951—Dec. 311952—Dec. 3 1 . . .
1953—July 31Aug. 31Sept. 30Oct. 31Nov. 30Dec. 31
1954—Jan. 31Feb. 28Mar. 312Apr. 30May 31June 30PJuly 31P
OtherEurope
68.0111.8120.7
84.188.591.7
103.197.6
109.5
132.3131.1134.7138.2149.3129.8128.4
Aus-tria
.2(J).8
.2
.4
.3
.1
.2
.8
.2
.2
.2
.2
.1
.2
.1
Bel-gium
21.539.616.2
12.210.311.111.012.313.0
13.414.313.214.915.214.815.3
Den-mark
3.24.82.1
2.33.54.35.75.36.2
6.04.12.94.33.54.14.2
Fin-land
2.23.15.6
3.53.42.32.71.81.9
1.51.31.31.61.61.91.8
Ger-many,Fed.
Rep. of
25.428.326.8
27.030.333.637.331.330.5
40.143.653.458.957.052.052.5
Greece
.2
.2
.2
.1
.2
.4
.5
.71.3
[AL.4L.5>.O1.91.81.6
Nor-w a y
1.42.51.9
.8
.81.0
.9
.81.0
1.21.61.31.41.31 .31.5
Por-tugal
.5
.8
.5
.5
.4
.5
.4
.6
.6
.4
.5
.4
.6
.6
.6
.7
Spain
1.618.811.2
14.420.324.122.622.824.3
24.419.812.210.65.73.52.1
Swe-den
6.95.42.5
2.61.82.21.72.42.7
2.11.71.42.21.92.42.7
Tur-key
.9
.638.8
8.74.51.07.77.7
15.7
29.231.035.429.849.235.932.7
Yugo-slavia
3.98.6
5.35.84.25.34.34.8
4.55.45.95.25.15.35.7
Allother
4.04.05.4
6.46.96.77.17.56.8
7.96.25.66.66.16.26.5
Table 2b.—Latin America
Date
1950—Dec.1951—Dec.1952—Dec.
1953—JulyAug.Sept.Oct.Nov.Dec.
1954—Jan.Feb.Mar.Apr.MayJuneJuly
3 1 . .3 1 . .3 1 . .
31. .31. .30. .31. .30 . .31. .
31. .28. .312.30. .3 1 . .30P.31P .
LatinAmer-
ica
378489662
590594540502506472
473450426433447495627
830
214457
3443983
Argen-tina
4578
877767
7756575
.9
.6
.2
.0
.6
.5
.0
.7
.1
.3
.2
.4
.2
.6
.7
.8
Bo-livia
8 .77 . 55 . 8
14.313.413.211.99 . 7
10.8
9 .28 .71.91.72 . 32 . 02 . 9
Brazil
78.0185.0356.4
316.2319.6273.7203.6186.5125.1
121.9116.7117.3117.4129.1164.2278.0
Chile
6 . 824.826.4
7.77 .57 .56 .17 .1
22.6
20.920.119.919.618.512.221.0
Co-lom-bia
42.543.741.7
44.448.947.447.152.056.9
53.150.647.854.459.166.464.6
Cuba
27.632.332.5
28.824.021.641.749.451.2
60.062.258.455.255.956.856.9
Do-min-icanRe-pub-lic
1.91.81.6
1.91.91.71.71.71.9
2 . 01.81.62 . 22 . 42 . 52 . 4
Guate-mala
2 . 63 . 84 . 2
3 . 23 . 03 . 64 . 24 . 74 . 1
3 . 43 . 42 . 63 . 23 . 02 . 93 . 0
Mex-ico
70.690.688.6
86.489.079.386.390.192.9
98.187.285.377.376.681.785.5
Neth-er-
landsWest
IndiesandSuri-n a m
1.31.21.3
2 . 42 . 21.83 . 01.62 . 6
2 . 61.81.11.51.82 . 52 . 1
Pan-ama,Re-pub-lic of
3 . 13 . 06 . 5
5 . 65 . 45 . 84 . 97 . 44 . 6
5.76 .27 . 17 . 46 .27 .78 .5
Peru
11.011.814.8
13.715.116.817.718.520.2
18.817.214.716.415.216.015.7
ElSal-
vador
699
334678
8755445
851
378092
.9
.4
.5
.0
.1
.6
.4
Uru-guay
81014
333343
2322363
.0
.5
.3
.3
.2
.4
.8
.4
.7
. 8
.3
.1
.7
.2
.3
.9
Vene-zuela
494136
353536394041
40383845474451
.4
.7
.7
.6
.4
.3
.2
.3
.6
.8
.8
.9
.7
.7
.5
.6
OtherLatinAmer-
ica
14.614.513.7
15.514.216.118.218.619.3
17.817.816.917.317.117.620.1
^Preliminary.1 "Short-term claims" reported in these statistics represent principally the following items payable on demand or with a contractual maturity
of not more than one year: loans made to and acceptances made for foreigners; drafts drawn against foreigners that are being collected by bank-ing institutions on behalf of their customers in the United States; and foreign currency balances held abroad by banking institutions and theircustomers in the United States. The term "foreigner" is used to designate foreign governments, central banks, and other official institutions,as well as banks, organizations, and individuals domiciled outside the United States, including U. S. citizens domiciled abroad and the foreignsubsidiaries and offices of U. S. banks and commercial firms.
a Beginning Mar. 31, 1954, banks whose total claims on foreigners are less than $500,000 are excluded. Banks claiming this exemption reportedft total of 9.6 million dollars of such claims on that date.
•Less than $50,000.
1122 FEDERAL RESERVE BULLETIN
Digitized for FRASER http://fraser.stlouisfed.org/ Federal Reserve Bank of St. Louis

INTERNATIONAL CAPITAL TRANSACTIONS OF THE UNITED STATES—ContinuedTABLE 2.—SHORT-TERM CLAIMS ON FOREIGNERS REPORTED BY BANKS IN THE UNITED STATES,
BY COUNTRIES—Continued[Amounts outstanding, in millions of dollars]
Table 2c—Asia and All Other
Date
1950—Dec. 31 . .1951—Dec. 31 . .1952—Dec. 3 1 . .
I 9 5 3 _ j u l y 3 i .Aug. 31Sept. 30. .Oct. 31 . .Nov. 30. .Dec. 31 . .
1954—Jan. 3 1 . .Feb. 28 . .Mar. 3 1 2 .Apr. 30. .May 31 ..Tune 3 0 P .July 31 P.
Asia
95.4161 889.8
94.995 7
105.3104.3117.7114.8
125.5126.7111.4101.9114.6113.3116.7
For-mosaand
ChinaMain-land
18.210 110.1
8 .27 98 .58 .58 .58 .1
8 .18 .18 . 48.18 .28 .18 .1
HongKong
3 . 03 11.2
2 . 32 92 . 92 . 64 . 33 . 1
2 . 32 . 22 .23 . 23 . 43 .13 . 6
India
16.213.4
4 . 3
2 .52 72 . 93 . 44 . 13 . 7
2 . 93 . 24 .13 . 95 .13 . 53 . 4
Indo-nesia
.2
.3
.9
1.21 61.1
.6
.6
.8
1.0.9.7.5
1.4.6.6
Iran
6 . 69 . 3
10.2
13.313 913.014.213.313.8
14.714.714.315.115.316.017.5
Israel
18.930.015.1
17.818 824.425.923.422.9
32.727.622.116.2
8 . 88 . 08 . 4
Japan
12.112.212.5
18.817.120.517.726.625.6
28.531.732.830.636.738.633.3
Korea,Re-pub-lic of1
. . . . . .
(•).1.2.2
Phil-ippines
4 . 929.3
7.6
10.810 1
9 . 45 .55 .25 . 8
6 . 08 . 04 . 96 . 4
10.58.79 .7
Thai-land
1.52 53 . 3
4 55 25 . 96 .26 . 86.1
5 . 55 .24 . 34 . 95 . 76 .25 .6
OtherAsia
13.951.624.6
15.515 516.719.724.924.7
23.925.017.513.019.520.126.3
Allother
60.041 922.4
20.419 820.322.321.624.9
25.724.025.827.928.633.336.2
Aus-tralia
40.822 810.1
6 . 36 37 .05 . 85 .78 . 0
6 . 97 .27 .68 .77.78.2
12.1
Bel-gian
Congo
4 . 45 76 . 0
7.15 95 .75 . 75 . 86 . 3
6 .56 .56 .76 . 47.17 .87 .9
Egyptand
Anglo-Egyp-tian
Sudan
.32
.5
.2
.2
.1
.2
.4
.5
.7
.51.3
.3
.5
.3
.2
Unionof
SouthAfrica
7.36 72 . 0
2 . 92 92 . 32 .72 . 32 . 4
4 .75.14 . 55 .55 . 85 .95 . 3
Other
7.26 53 . 8
3 . 94 65 .17 .87 .47 .8
6 . 84 . 65 .77 .07 .6
11.110.7
TABLE 3.—PURCHASES AND SALES BY FOREIGNERS OF LONG-TERM SECURITIES, BY TYPES*
[In millions of dollars]
Year or month
1950195119521953
1953—JulyAugustSeptemberOctober.NovemberDecember
1954—JanuaryFebruaryMarchAprilMayJune?JulyP ..
U. S. Government bondsand notes
Pur-chases
1 236 4673.6533 7646.0
36.630.143.124.437.0
191.1
33.787.455.065.287.348.933.4
Sales
294 31,356.6
231 4728.0
82.329.3
116.428.838.6
192.6
38.099.922.130.088.427.324.3
Netpur-
chasesor sales
(-)
942 1-683 .0
302 3- 8 2 . 0
- 4 5 . 7.8
- 7 3 . 3- 4 . 4- 1 . 6- 1 . 5
- 4 . 3- 1 2 . 6
32.935.2
- 1 . 221.6
9.1
U. S. corporateand stocks
Pur-chases
774 7859.8850 3801.9
56.249.768.253.357.575.4
68.777.198.0
112.1110.8107.2132.8
Sales
772 3761 .0837 7731.4
48.347.345.150.860.464.1
71.685.795.896.596.499.9
100.5
Donds
Netpur-
chasesor sales
(-)
2 498.712 670.5
7.92.4
23.12.5
- 3 . 011.3
- 2 . 9- 8 . 6
2.215.614.4
7.332.2
Foreign bonds
Pur-chases
589 2500.4495 3542.5
46.220.023.283.934.639.5
58.664.846.854.337.353.246.0
Sales
710 2801.0677 4621.5
50.317.916.9
120.679.664.0
234.435.682.680.034.343.151.6
Netpur-
chasesor sales
(-)
— 121 0- 3 0 0 . 6— 182 1- 7 9 . 0
- 4 . 12.16.3
- 3 6 . 7- 4 5 . 0- 2 4 . 4
- 1 7 5 . 929.1
- 3 5 . 8- 2 5 . 7
3.010.0
- 5 . 7
Foreign stocks
Pur-chases
173 8272.3293 9310.1
23.118.623.923.125.634.5
28.126.932.631.329.528.734.8
Sales
198 2348.7329 6303.4
21.218.516.318.425.630.9
26.938.941.646.556.179.038.6
Netpur-
chasesor sales
(-)
—24 4- 7 6 . 4—35 8
6.8
2.0.1
7.74.7
(3)3.6
1.2- 1 2 . 0
- 9 . 0-15 .2- 2 6 . 6- 5 0 . 3
- 3 . 8
TABLE 4.—NET PURCHASES BY FOREIGNERS OF LONG-TERM UNITED STATES SECURITIES, BY COUNTRIES[Net sales, (—). In millions of dollars]
Year ormonth
1950195119521953
1953—July. . .AugSept . . .Oct . . . .Nov. . . .Dec....
1954—JanFeb.. . .Mar....Apr,.-. .May. . .June?. .Julyp. .
Inter-national
insti-tutions
121.2— 15.9
14.722^7
.5- 4 . 2
- 1 4 . 1- 8 . 2
8 .5- 4 . 4
. 9
.7
.5
.621.8
.5- 4 . 4
Totalforeigncoun-tries
823.2—568.4
300.2—34! 3
- 3 8 . 37 .4
- 3 6 . 26 . 3
- 1 3 . 014.2
- 8 . 1- 2 1 . 8
34.550.1
- 8 . 628.345.7
UnitedKing-dom
64.021.470.471.3
9 . 06 . 82 . 64 . 2
- 2 . 525.7
9 . 06 . 19 . 25 . 03 . 43 . 55.7
France
197 86 . 05 .5
—41.7
- 4 9 . 01.0
.7
.3
.21.1
- 7 . 1- 1 6 . 2
21.436.1
2 . 21.53 . 0
Nether-lands
—6.3—22.2—21.9—21.3
- 1 . 9- . 5- . 8
- 2 . 8- . 1
- 1 . 1
- 2 . 0- 2 . 9- 3 . 7- 4 . 6- 3 . 4- 1 . 9- 1 . 5
Switzer-land
19.045.950 757.1
2 . 55 .59 . 61.32 .11.2
1.1.1
2 . 310.5
5 . 4_ 2
24.8
Italy
- . 71.9
5- . 5
.4
.1(3)( 3 )
A
( 3 )- . 1- . 4
.1- . 4
.2(3)
OtherEurope
73.8- 4 3 . 8
6 .2- 2 . 5
2 . 6- 1 . 5
.51.6
( 3 )1.6
1.01.91.42 . 73 . 61.5
.9
TotalEurope
347.59 .2
111.462.4
-36.311.412.7
4 . 7- . 728.5
2 . 1- 1 1 . 1
30.249.710.8
4 . 632.8
Canada
458.2-595.5
191 6— 120.6
- 3 . 1- 6 . 5
- 5 0 . 5- 9 . 9
- 1 4 . 9- 1 7 . 4
- 6 . 8- 6 . 7
- . 3- 5 . 2
- 3 4 . 3- 8 . 3- 3 . 5
LatinAmer-
ica
30.113.9
4 . 724.9
1.52 . 3
.311.8
3 . 92 .7
-3.3- 2 . 9
3 . 23 . 3
14.831.215.8
Asia
— 15 .34.8
—9 5( 3 )
— .2.5.4.1
- . 5- . 5
- . 3- . 1
(3).8
- . 2.1.6
Allother
2 .77
1.9— .9
- . 1- . 31.0
3-.8
.9
.3- 1 . 0
1.41.4
.4
.7
.1
P Preliminary.*Not reported separately until Mar. 31, 1954.2 See footnote 2 on opposite page.3Less than $50,000.4 Includes transactions of international institutions.
OCTOBER 1954 1123
Digitized for FRASER http://fraser.stlouisfed.org/ Federal Reserve Bank of St. Louis

INTERNATIONAL CAPITAL TRANSACTIONS OF THE UNITED STATES—Continued
TABLE 5.—NET PURCHASES BY FOREIGNERS OF LONG-TERM FOREIGN SECURITIES OWNED IN THE
UNITED STATES, BY AREAS
Year ormonth
1950195119521953
1953—July...Aug.. .Sept. . .Oct . . . .Nov.. .D e c . . .
1954—Jan....Feb. . .Mar . . .Apr.. . .May. .June? .Julyp..
[Net sales, ( - ) .
Inter-national
insti-tutions
- 3 . 6—152.7—118.1
-61.2
- 2 . 2- . 3^ )
-73 .1.6
— .5
-100 .610.5
.1
.7- 4 . 70)- 1 . 1
Totalforeigncoun-tries
-141.8—224 3-99.8-11.0
.12 . 5
14.041.1
-45.5-20.3
-74.06 . 7
-44.8-41.6-18.8-40.3-8 .4
In millions of dollars]
TotalEurope
13.428 519.996.3
.5— .26 . 5
33.74 . 84 . 7
8 .910.7
8 . 3-5 .9
-18.6-9 .9
2.2
Can-ada
-190.0—258.6-141.0-137.8
-18.0.3
5 .1-9 .8
-49.6-23.3
-95.38 .0
-53.2-35.9
- . 9-28.5-18.0
LatinAmer-
ica
29.833.825.334.6
2 . 11.42 . 49 . 32 . 21.6
5 . 6.1
1.31.73 . 92.62.4
Aciarisia
1.0- 3 6 . 0- 1 0 . 0- 2 9 . 9
- 2 . 7- . 4— .7- . 8
- 3 . 5- 5 . 4
- 2 . 6- 4 . 8- 2 . 2- 2 . 5- 3 . 6- 4 . 7- 3 . 0
Allother
3 . 97 . 96 . 0
25.8
18.11.4
.78 .8
.52 . 1
9 . 4-7 .4
1.0.9.4.3
8.0
» Preliminary.iLess than $50,000.
TABLE 6.—DEPOSITS AND OTHER DOLLAR ASSETS HELDAT FEDERAL RESERVE BANKS FOR FOREIGN
CORRESPONDENTS *
[In millions of dollars]
Date
1952—Dec. 31..
1953—Sept. 30. .Oct. 31. .Nov. 30. .Dec. 31. .
1954—Jan. 31. .Feb. 28. .Mar. 31. .Apr. 30. .May 31. .June 30. .July 31..Aug. 31. .Sept. 30. .
1954—Sept. 1. .Sept. 8. .Sept. 15..Sept. 22. .Sept. 29. .
Deposits
550
512448417423440490494471527545533477461
483524506524489
Assets in custody
U. S. Govt.securities2
2,156
2,6412,6742,694
586632716784840969
2,9003,0332,9893,013
2,9812,9572,9822,9932,995
Miscel-laneous3
86
9497991069988929693878582101
82818499100
1 Excludes assets held for Intl. Bank and Monetary Fund and ear-marked gold. See footnote 4, p. 1127, for total gold under earmarkat Federal Reserve Banks for foreign and international accounts.
2U. S. Treasury bills, certificates of indebtedness, notes and/or bonds.3 Includes bankers' acceptances, commercial paper, foreign and
international bonds.NOTE.—For explanation of table and for back figures see BULLETIN
for May 1953, p. 474.
GOLD PRODUCTIONOUTSIDE U. S. S. R.
[In millions of dollars]
Year ormonth
1947194819491950195119521953 . . .
1953—JulyAugust..September.OctoberNovember.December.
1954—JanuaryFebruary..MarchApr i l . . . . . .M a yJuneJuly
Estimatedworld
productionoutside
U.S.S.R.i
766 5805 0840.0864.5840 0864.5
Totalreportedmonthly
705 5728 1753.2777.1758 3780.9
'776.5
67.066 065.764 964.364.4
Production reported
Africa
SouthAfrica
Rho-desia
$1 = 15 H
392.0 18.3405.5409.7408.2403.1413.7417.9
35.935.635.035.635.135.7
35.734.537.537.038 338 339.4
18 018.517.917 017.417.5
1 S5
L.5
1.5L.5
ss«;
1 61 6
WestAfrica*
i grains
19.323.423.124.122.923.825.4
2.12.12.12.22.22.2
2.12 . 22.22.22 32 32 . 3
BelgianCongo2
of gold tf
10.811.112.912.012.312.913.0
1.11.21.21.21.1
.9
1.51.11.21.11 01.01.0
monthly
North and South America
UnitedStates 3
o fine: i.
75.870.967.380.166.367.4
••69.0
6.86.26.26.86.26.1
5.14 . 95.44.95 06 . 16 . 1
Can-ada
e., an ou
107.5123.5144.2155.4153.7156.5142.4
12.911.511.710.09.69.6
10.310.912.912.513 413 213.3
Mex-ico
nee of fin
16.312.914.214.313.816.116.9
1.11.41.31.42.02.1
Colom-bia
e gold = j
13.411.712.613.315 114.815.3
1.11.11.91.31.61.1
1 41.21 l
.91 01 2
Chile
U5.
5.95 . 76.36.76 16 . 24.6
.3
.3
.4
.5
.4
.4
4. 3
Nica-ragua4
7 . 47 87.78.08 88 . 99.1
.9
.8
.78
.7
.7
7.7.7.7778
Other
Austra-lia
32.831 231.330.431 334.337.7
2.83.73.03 13.33.7
2 93 03 .2
India3
6 . 16 55.76.77 . 98 . 97.8
.7
.6
.7
.6
.6
.5
6. 6.7.767
.7
'Revised.Gold production in U.S.S.R.: No regular government statistics on gold production in U.S.S.R. are available, but data of percentage changes
irregularly given out by officials of the gold mining industry, together with certain direct figures for past years, afford a basis for estimating annualproduction as follows: 1934, 135 million dollars; 1935, 158 million; 1936, 187 million; 1937, 185 million; and 1938, 180 million.
i Estimates of United States Bureau of Mines.3 Reported by American Bureau of Metal Statistics.3Yearly figures are estimates of United States Mint. Monthly figures are estimates of American Bureau of Metal Statistics.*Gold exports reported by the National Bank of Nicaragua, which states that they represent approximately 90 per cent of total production.
NOTE.—For explanation of table and sources, see BULLETIN for June 1948, p. 731, and Banking and Monetary Statistics, p. 524. For annualestimates compiled by the United States Mint for these and other countries in the period 1910-1941, see Banking and Monetary Statistics, pp.542-543; for figures subsequent to 1941 see BULLETIN for April 1953, p. 427.
1124 FEDERAL RESERVE BULLETIN
Digitized for FRASER http://fraser.stlouisfed.org/ Federal Reserve Bank of St. Louis

ESTIMATED GOLD RESERVES AND DOLLAR HOLDINGS OF FOREIGN COUNTRIES AND INTERNATIONAL INSTITUTIONS
[Amounts outstanding, in millions of dollars]
Area and country
Continental Western Europe:AustriaBelgium-Luxembourg (and Belgian
Congo)France (and dependencies) * .Germany (Federal Republic of) . . .Italy..Netherlands (and Netherlands
West Indies and Surinam)NorwayPortugal (and dependencies)Spain (and dependencies)SwedenSwitzerland .TurkeyOthers
Total
Sterling Area:United KingdomUnited Kingdom dependencies.. . .IndiaUnion of South AfricaOther
Total . . .
Canada
Latin America:ArgentinaBrazil. .ChileCubaMexico . .UruguayVenezuelaOther
Total
Asia:Indonesia . . . .IranJapanPhilippinesThailandOther
Total
Eastern Europe4
All other:EgyptOther
Total
Total foreign countries
International5
Grand total
1950
Dec. 31
92
848834222571
55994
257132205
2,023164828
6,829
3,557120303241232
4,453
1,988
518543120530415311458560
3,455
324160587377166256
1,870
344
17328
201
19,140
3,090
22,230
1951
Dec. 31
107
898896434633
524150331128224
1,973165651
7,114
2,84399
309197326
3,774
2,157
518417
99575366306445634
3,360
421163729337210325
2,185
309
28542
327
19,226
3,171
22,397
1952
June 30
102
969906545613
603145342129281
2,009171822
7,637
2,218103306159348
3,134
2,396
415398
96635266309503679
3,301
456159849341240310
2,355
307
29238
330
19,460
3,150
22,610
Sept. 30
126
1,0361,022
604638
734154356131280
2,010155947
8,193
2,241109302170353
3,175
2,437
398406100601320302527683
3,337
367156898329271355
2,376
310
26644
310
20,138
3,266
23,404
Dec. 31
143
1,035967691655
815160374130275
2,053151919
8,368
2,318113312194347
3,284
2,492
427390121515375301519721
3,369
296157936324294360
2,367
307
23449
283
20,470
3,287
23,757
1953
Mar. 31
154
1,052883770651
905171391130283
2,051153980
8,574
2,627113323207356
3,626
2,435
485393128527393309490812
3,537
275156
1,026334306401
2,498
307
22757
284
21,261
3,249
24,510
June 30
166
1,044926893660
953164412134280
2,091152
1,032
8,907
2,886109334212369
3,910
2,238
519451129579339311530814
3,672
246155
1,022316311363
2,413
306
22961
290
21,736
3,272
25,008
Sept. 30
208
1,0811,0031,053
714
1,022169437138309
2,120157
1,091
9,502
3,051111340214354
4,070
2,292
520481134587325311571779
3,708
198168
1,062318304374
2,424
314
21863
281
22,591
3,212
25,803
Dec. 31
238
1,0981,0491,225
812
1,055171469150335
2,133157
1,183
10,075
3,009108346214375
4,052
2,417
503423121531341337595772
3,623
184181958304281401
2,309
306
21767
284
23,066
3,331
26,397
1954
Mar. 31
267
1,1241,0601,381
841
1,064169499136337
2,134153
1,292
10,457
3,198105329221372
4,225
2,487
543431102548329329562868
3,712
166185807319268451
2,196
308
22474
298
23,683
3,401
27,084
June 30*
289
1,0551,0901,503
803
1,122178516142342
2,107151
1,320
10,618
3,536113338225376
4,588
2,462
550417106532
3288331621879
3,724
140171747306243444
2,051
309
22668
294
24,046
3,360
27,406
P Preliminary.1 Includes gold reserves of Bank of France and French dependencies only.2 Includes holdings of other Continental OEEC countries, Finland, Yugoslavia, Bank for International Settlements, (both for its own and
European Payments Union account), gold to be distributed by the Tripartite Commission for Restitution of Monetary Gold, and unpublishedgold reserves of certain Western European countries.
3Includes latest available figure for Mexican gold reserves (May 31). Estimated change for remainder of quarter is included in "Other LatinAmerica."
4Excludes gold reserves of the U. S. S. R.includes holdings of International Bank for Reconstruction and Development, International Monetary Fund, and United Nations and other
international organizations.NOTE.—Includes reported and estimated gold reserves of central banks, governments, and international institutions, and official and private
dollar holdings as shown in Tables 1 and l a - Id of the preceding section, as well as certain longer term U. S. Government securities reported aspurchased within 20 months of maturity. For back figures see BULLETIN for March 1954, p. 245.
OCTOBER 1954 1125
Digitized for FRASER http://fraser.stlouisfed.org/ Federal Reserve Bank of St. Louis
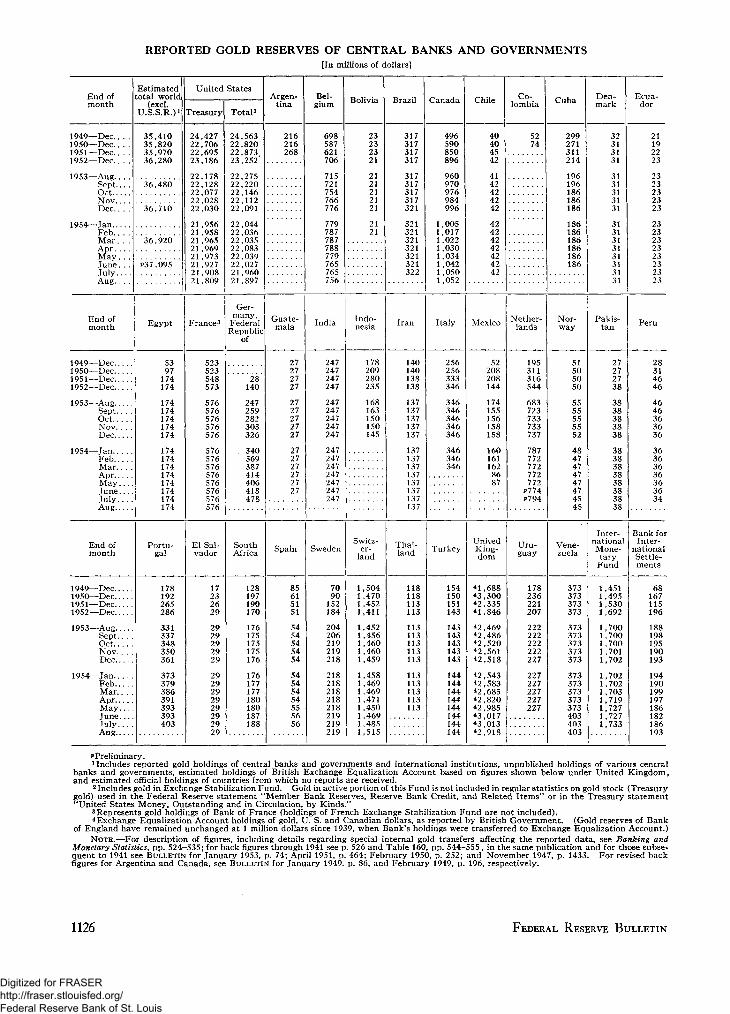
REPORTED GOLD RESERVES OF CENTRAL BANKS AND GOVERNMENTS[In millions of dollars]
End ofmonth
1949—Dec1950—Dec1951—Dec.. . .1952—Dec
1953—AugSept. . . .OctNov.. . .Dec
1954—JanFeb.Mar. . .AprMay. . .J u n e . . .Tuly .Aug.. . .
End ofmonth
1949—Dec1950—Dec1951—Dec1952—Dec
1953—AugSept.. . .Oct,NovDec
1954—JanFebMarAprMay. . .June . . .July. . . .Aug
End ofmonth
1949—Dec1950—Dec1951—Dec1952—Dec...
1953—Aug....Sept.. .Oct.. . .Nov.. .D e c . . .
1954—Jan....Feb . . . .Mar.. .AprMay. . .June . . .Ju ly . . .Aug.. . .
Estimatedotal world
(excl.U.S.S.R.)1
35,41035,82035,97036,280
36,480
36,710 ' '
36,920
P37,095'
Egypt
5397
174174
174174174174174
174174174174174174174174
Portu-gal
178192265286
331337348350361
373379386391393393403
United States
Treasury
24,42722,70622,69523,186
22,17822,12822,07722,02822,030
21,95621,95821,96521,96921,97321,92721,90821,809
France3
523523548573
576576576576576
576576576576576576576576
El Sal-vador
17232629
2929292929
2929292929292929
TotaP
24,56322,82022,87323,252'
22,27522,22022,14622,11222,091
22,04422,03622,03522,08322,03922,02721,96021,897
Ger-many,
FederalRepublic
of
28*140
247259282303326
340369387414406418478
SouthAfrica
128197190170
176175175175176
176177177180180187188
Argen-tina
216216268
Guate-mala
27272727
2727272727
272727272727
Spain
85615151
5454545454
54545454555656
Bel-gium
698587621706
715721754766776
779787787788779765765756
India
247247247247
247247247247247
247247247247247247247
Sweden
7090
152184
204206219219218
218218218218218219219219
Bolivia
23232321
2121212121
2121
Indo-nesia
178209280235
168163150150145
Switz-er-
land
L.5041,470L.452L ,411
1,4521,4561,4601,4601,459
1,4581,4691,4691,4711,4501,4691,4851,515
Brazil
317317317317
317317317317321
321321321321321321322
Iran
140140138138
137137137137137
137137137137137137137137
Thai-land
118118113113
113113113113113
113113113113113
Canada
496590850896
960970976984996
,005,017
L,0221,0301,0341,042I ,050
052
Italy
256256333346
346346346346346
346346346
Turkey
154150151143
143143143143143
144144144144144144144144
Chile
40404542
4142424242
42424242424242
Mexico
52208208144
174155156158158
1601611628687
UnitedKing-dom
41,68843,30042,33541,846
42,46942,48642,52042,56142,518
42,54342,58342,68542,82042,98543,01743,01342,918
Co-lombia
5274
Nether-lands
195311316544
683723733733737
787772772772772
P774P794
Uru-guay
178236221207
222222222222227
227227227227227
Cuba
299271311214
196196186186186
186186186186186186
Nor-way
51505050
5555555552
4847474747474545
Vene-zuela
373373373373
373373373373373
373373373373373403403403
Den-mark
32313131
3131313131
3131313131313131
Pakis-tan
27272738
3838383838
3838383838383838
Inter-nationalMone-tary
Fund
1,4511,4951,5301,692
1,7001,7001,7001,7011,702
1,7021,7021,7031,7191,7271,7271,733
Ecua-dor
21192223
2323232323
2323232323232323
Peru
28314646
4646363636
36363636363634
Bank forInter-
nationalSettle-ments
68167115196
188198195190193
194190199197186182186193
^Preliminary.1 Includes reported gold holdings of central banks and governments and international institutions, unpublished holdings of various central
banks and governments, estimated holdings of British Exchange Equalization Account based on figures shown below under United Kingdom,and estimated official holdings of countries from which no reports are received.
2Includes gold in Exchange Stabilization Fund. Gold in active portion of this Fund is not included in regular statistics on gold stock (Treasurygold) used in the Federal Reserve statement "Member Bank Reserves, Reserve Bank Credit, and Related Items" or in the Treasury statement"United States Money, Outstanding and in Circulation, by Kinds."
^Represents gold holdings of Bank of France (holdings of French Exchange Stabilization Fund are not included).4Exchange Equalization Account holdings of gold, U. S. and Canadian dollars, as reported by British Government. (Gold reserves of Bank
of England have remained unchanged at 1 million dollars since 1939, when Bank's holdings were transferred to Exchange Equalization Account.)
NOTE.—For description of figures, including details regarding special internal gold transfers affecting the reported data, see Banking andMonetary Statistics, pp. 524-535; for back figures through 1941 see p. 526 and Table 160, pp. 544-555, in the same publication and for those subse-quent to 1941 see BULLETIN for January 1953, p. 74; April 1951, p. 464; February 1950, p. 252; and November 1947, p. 1433. For revised backfigures for Argentina and Canada, see BULLETIN for January 1949, p. 86, and February 1949, p. 196, respectively.
1126 FEDERAL RESERVE BULLETIN
Digitized for FRASER http://fraser.stlouisfed.org/ Federal Reserve Bank of St. Louis
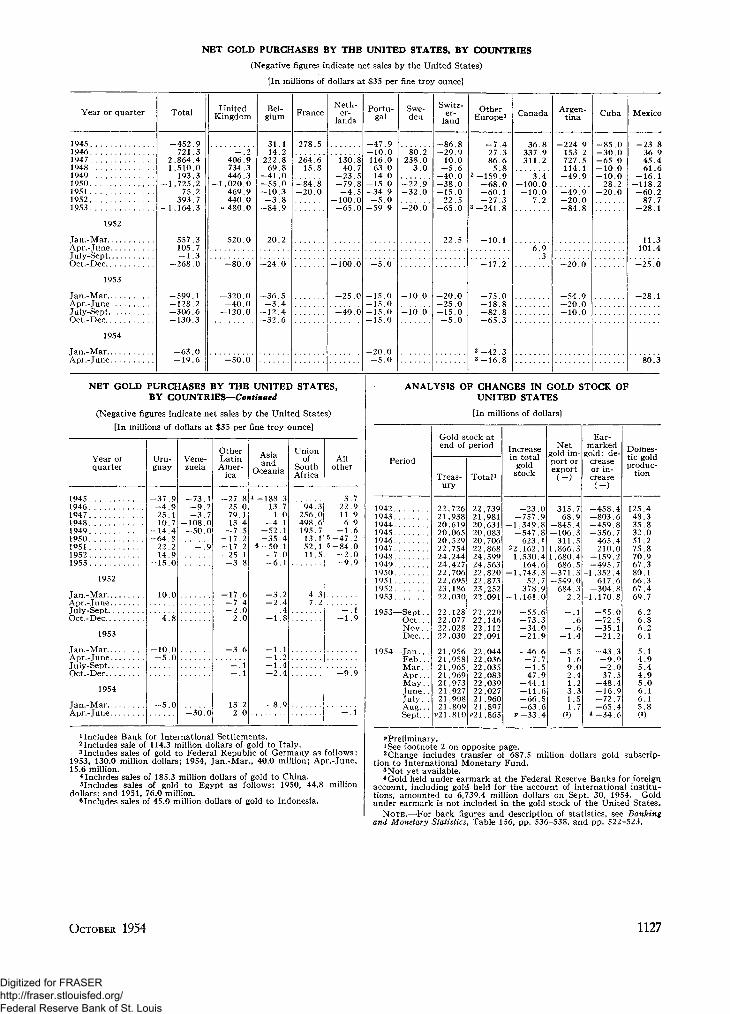
NET GOLD PURCHASES BY THE UNITED STATES, BY COUNTRIES
(Negative figures indicate net sales by the United States)
[In millions of dollars at $35 per fine troy ounce]
Year or quarter Total UnitedKingdom
Bel-gium France
Neth-er-
landsPortu-
galSwe-den
Switz-er-
landOther
Europe1 Canada Argen-tina Cuba Mexico
194519461947194819491950195119521953
1952
Jan.-MarApr.-June... .July-SeptOct.-Dec
-452 .9721.3
2,864.41,510.0
193.31,725.2
75.2393.7
1,164.3
557.3105.7— 1.3
-268.C
- . 2406.9734.3446.3
-1,020.0469.9440.0
-480 .0
31.114.2
222.869.8
- 4 1 . 0- 5 5 . 0- 1 0 . 3
- 3 . 8- 8 4 . 9
278.5
264.615.8
-84.8-20.0
130.840.7
-23.5-79.8-4 .5
-100.0-65.0
-47.9-10.0116.063.014.0
-15.0-34.9-5 .0-59.9
80.2238.0
3.0
-22 .9-32.0
-86.8-29.9
10.0-5 .6
-40.0-38.0-15.0
22.5-65.0
22.5
-7 .427.386.65.8
2-159.9-68.0-60.1-27.3
3-241.8
36.8337.9311.2
-100.0-10.0
7.2
-224.9153.2727.5114.1
-49.9
-49^9-20.0-84.8
-85.0-30.0-65.0-10.0-10.028.2
-20.0
1953
Jan.-MarApr.-June... .July-SeptOct.-Dec
1954
Jan.-MarApr.-June... .
-599.1-128.2-306.6-130.3
-63.0-19.6
-80.0
-320.0-40.0-120.0
-5.0
-36.5-3.4-12.4-32.6
-25.0
-40 "0
-50.0
-15.0-15.0-15.0-15.0
-20.0-5.0
-10.0 -20.0-25.0-15.0-5.0
-17.2
-75.0-18.8-82.8-65.3
3 -42.33-16.8
6.9.3
-20.0
-54.9-20.0-10.0
-23.836.945.461.6
-16.1-118.2-60.287.7
-28.1
11.3101.4
-25.0
-28.1
80.3
NET GOLD PURCHASES BY THE UNITED STATES,BY COUNTRIES—Continued
(Negative figures indicate net sales by the United States)
[In millions of dollars at $35 per fine troy ounce]
Year orquarter
194519461947194819491950195119521953
1952
Jan -MarApr -JuneJuly-SeptOct.-Dec
1953
Jan.-Mar. ..Apr.-JuneJuly-SeptOct -Dec
1954
Jan -^larApr.-June
Uru-guay
- 3 7 . 9—4 925.110 7
- 1 4 . 4—64 8
22.214.9
— 15 0
10 0
4^8
— 10 0- 5 . 0
—5 0
Vene-zuela
- 7 3 . 1—9 2- 3 . 7
— 108 0- 5 0 . 0
p
- 3 0 . 0
OtherLatinAmer-
ica
- 2 7 . 825 079.113 4
- 7 . 5— 17 2- 1 7 . 2- 2 5 . 1
—3 8
— 17 6- 7 . 4- 2 . 0
2.0
—3 6
- . 1- . 1
13.22.0
Asiaand
Oceania
4-188.313 71.0
—4 1- 5 2 .1—35 4
6-50.1- 7 . 0—6.1
- 3 2- 2 . 4
.4- 1 . 8
— 1 1-1 .2- 1 . 4- 2 . 4
- 8 . 9
Unionof
SouthAfrica
94 3256.0498 6195.7
13 152.111.5
4 37.2
Allother
3.722 911.96 9
- 1 . 65—47 25-84.0
- 2 . 0- 9 . 9
- . 1- 1 . 9
- 9 . 9
- . 1
includes Bank for International Settlements.2 Includes sale of 114.3 million dollars of gold to Italy.3Includes sales of gold to Federal Republic of Germany as follows:
1953, 130.0 million dollars; 1954, Jan.-Mar., 40.0 million; Apr.-June,15.6 million.
4Includes sales of 185.3 million dollars of gold to China.^Includes sales of gold to Egypt as follows: 1950, 44.8 million
dollars; and 1951, 76.0 million.6Includes sales of 45.0 million dollars of gold to Indonesia.
ANALYSIS OF CHANGES IN GOLD STOCK OFUNITED STATES
[In millions of dollars]
P(
1942.1943.1944.1945.19461947.1948.1949.1950.19511952.1953
;riod
1953—Sept. .Oct.. .Nov. .Dec.. .
1954—Jan.. .Feb . . .Mar. .Apr. . .May. .Tune..July. .Aug.. .Sept.. .
Gold stock atend of
Treas-ury
22,72621,93820,61920,06520,52922,75424,24424,42722,70622,69523,18622,030
22,12822,07722,02822,030
21,95621,95821,96521,96921,97321,92721,90821,809
P21.810
period
Total 1
22,73921,98120,63120,08320,70622,86824,39924,56322,82022 87323,25222,091
22,22022,14622,11222,091
22,04422,03622,03522,08322,03922,02721,96021,897
P21,863
Increasein total
goldstock
- 2 3 . 0-757.9
-1 ,349 .8-547 .8
623.122,162.11,530.4
164.6-1 ,743 .3
52 7378.9
— 1,161.0
- 5 5 . 6- 7 3 . 3- 3 4 . 0- 2 1 . 9
- 4 6 . 6- 7 . 7- 1 . 547.9
- 4 4 . 1— 11.6- 6 6 . 5- 6 3 . 6
P-33A
Netgold im-port orexport
315.768.9
-845.4-106.3
311.51,866.31,680.4
686.5-371.3—549.0
684.32 .2
- . 1.6
- . 6— 1.4
- 5 . 51 .69 . 02 . 41.23 . 31.51 .7
(3)
Ear-marked
gold: de-creaseor in-crease
( - )
- 4 5 8 .- 8 0 3 .-459 .-356 .
465.210.
-159 .- 4 9 5 .
-1,352.617
-304 .-1,170.
- 5 5- 7 2- 3 5- 2 1
- 4 3Q
- 237
- 4 8- 1 6- 7 2- 6 5
4 - 3 4
468740274688
0512
390549746
Domes-tic goldproduc-
tion
125.448.335.832.051 275.870.967.380.166 367.469.7
6 .26 . 86.26 .1
5 .14 . 95 .44 . 95 . 06 .16 .15 . 8(3)
^Preliminary.1See footnote 2 on opposite page.2Change includes transfer of 687.5 million dollars gold subscrip-
tion to International Monetary Fund.3 Not yet available.4 Gold held under earmark at the Federal Reserve Banks for foreign
account, including gold held for the account of international institu-tions, amounted to 6,739.4 million dollars on Sept. 30, 1954. Goldunder earmark is not included in the gold stock of the United States.
NOTE.—For back figures and description of statistics, see Bankingand Monetary Statistics, Table 156, pp. 536-538, and pp. 522-523.
OCTOBER 1954 1127
Digitized for FRASER http://fraser.stlouisfed.org/ Federal Reserve Bank of St. Louis
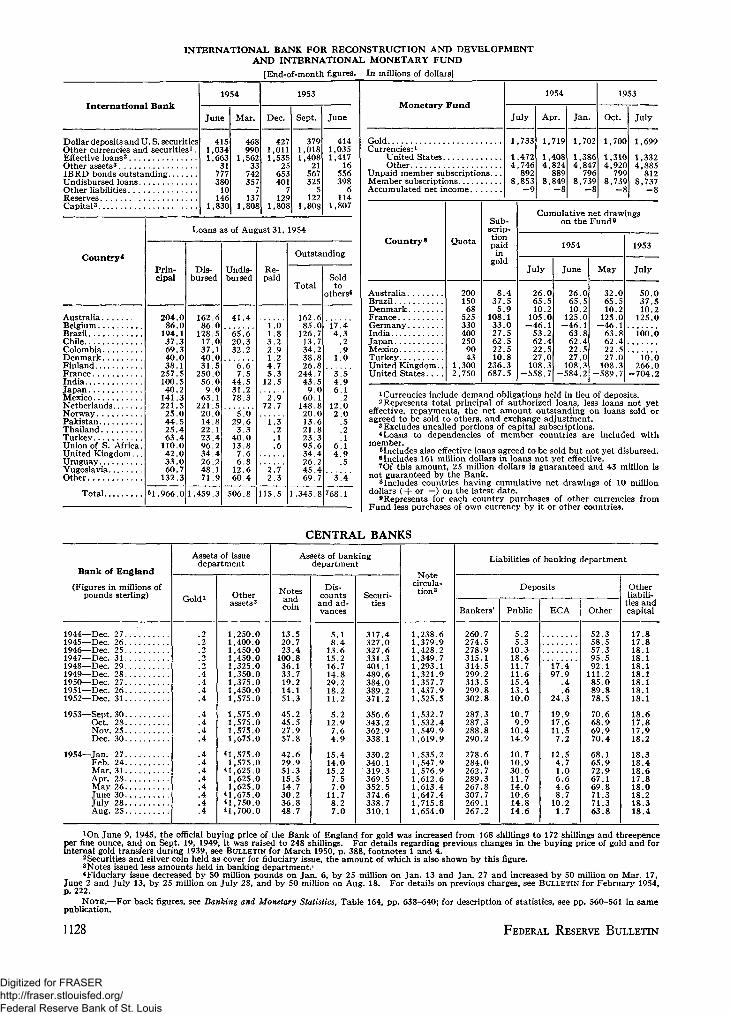
INTERNATIONAL BANK FOR RECONSTRUCTION AND DEVELOPMENTAND INTERNATIONAL MONETARY FUND
[End-of-month figures. In millions of dollars]
International Bank
Dollar deposits and U. S. securitiesOther currencies and securities1.Effective loans2
Other assets3
IBRD bonds outstandingUndisbursed loansOther liabilitiesReservesCapital3
1954
June Mar.
4151,0341,663
31777380
10146
1,830
468990
1,56233
742357
7137
1,808
1953
Dec. Sept. June
4271,0111,535
25653401
1291,808
3791,0181,408
21567325
5122
4141,0351,417
16556398
6114
1,807
Country*
AustraliaBelgiumBrazilChileColombiaDenmarkFinlandFranceIndiaJapanMexicoNetherlandsNorwayPakistanThailandTurkeyUnion of S. Africa.United Kingdom...UruguayYugoslaviaOther
Total
Loans as of August 31, 1954
Prin-cipal
204.086.0
194.137.369.340.038.1
257.5100.540.2
141.3221.525.044.525.463.4
110.042.033.060.7
132.3
61,966.0 1,459.3
Dis-bursed
162.686.0
128.517.037.140.031.5
250.056.09.0
63.1221.520.014.822.123.496.234.426.248.171.9
Undis-bursed
41.4
65.620.332.2
6.67.5
44.531.278.3
5.029.63.3
40.013.87.66.8
12.660.4
506.8 115.5
Re-paid
1.01.83.22.91.24.75.3
12.5
2.972.71.3
.2
.1
.6
2.72.3
Outstanding
TotalSoldto
others5
162.685.0
126.713.734.238.826.8
244.743.59.0
60.1148.820.013.621.823.395.634.426.245.469.7
1,343.8
17.44.3
.2
.91.0
3.54.96.1
.212.02.0
.5
.2
.16.14.9
.5
3"A'
768.1
Monetary Fund
GoldCurrencies:1
United StatesOther
Unpaid member subscriptions...Member subscriptionsAccumulated net income
1954
July Apr. Jan.
1,733
1,4724,746
8928,853
—9
1,719
1,4084,824
8898,849
1,702
1,3864,847
7968,739
1953
Oct. July
1,700
1,3104,920
7998,739
1,699
1,3324,885
8128,737
- 8
Country8
AustraliaBrazilDenmarkFranceGermanyIndiaJapanMexicoTurkeyUnited Kingdom..United S ta tes . . . .
Quota
20015068
5253304002509043
1,3002,750
Sub-scrip-tionpaidin
gold
8.437.55.9
108.133.027.562.522.510.8
236.3687.5
Cumulative net drawingson the Fund 9
1954
July June May
26.065.510.2
105.0—46.1
53.262.422.527.0
108.3-558.7
26.065.510.2
125.0-46 .1
63.86222.527.0
108.3-584.2
32.065.510.2
125.0-46 .1
63.862.422.527.0
108.3-589.7
1953
July
50.037.510.2
125.0
100.0
10.0266.0
-704.2
1 Currencies include demand obligations held in lieu of deposits.2 Represents total principal of authorized loans, less loans not yet
effective, repayments, the net amount outstanding on loans sold oragreed to be sold to others, and exchange adjustment.
3 Excludes uncalled portions of capital subscriptions.4 Loans to dependencies of member countries are included with
member.^Includes also effective loans agreed to be sold but not yet disbursed.8 Includes 161 million dollars in loans not yet effective.7Of this amount, 25 million dollars is guaranteed and 43 million is
not guaranteed by the Bank.8Includes countries having cumulative net drawings of 10 million
dollars ( + or —) on the latest date.•Represents for each country purchases of other currencies from
Fund less purchases of own currency by it or other countries.
CENTRAL BANKS
Bank of England
(Figures in millions ofpounds sterling)
1944—Dec. 271945—Dec. 261946—Dec. 251947—Dec. 311948—Dec. 291949—Dec. 281950—Dec. 271951—Dec. 261952—Dec. 31
1953—Sept. 30Oct. 28Nov. 25Dec. 30
1954—Jan. 27Feb. 24Mar. 31Apr. 28May 26June 30July 28Aug. 25
Assets of issuedepartment
Goldi
.2
.2
.2
.2
.2
.4
.4
.4
.4
.4
.4
.4
.4
.4
.4
.4
.4
.4
.4
.4
.4
Otherassets2
,250.0,400.0,450.0,450.0,325.0,350.0,375.0,450.0,575.0
,575.0,575.0,575.0,675.0
,575.0,575.0,625.0,625.0,625.0,675.0
M, 750.041,700.0
Assets of bankingdepartment
Notesandcoin
13.520.723.4
100.836.133.719.214.151.3
45.245.527.957.8
42.629.951.315.514.730.236.848.7
Dis-countsand ad-vances
5.18.4
13.615.216.714.829.218.211.2
5.212.97.64.9
15.414.015.27.57.0
11.78.27.0
Securi-ties
317.4327.0327.6331.3401.1489.6384.0389.2371.2
356.6343.2362.9338.1
330.2340.1319.3369.5352.5374.6338.7310.1
Notecircula-tion3
1,238.61,379.91,428.21,349.71,293.11,321.91,357.71,437.91,525.5
1,532.71,532.41,549.91,619.9
1,535.21,547.91,576.91,612.61,613.41,647.41,715.81,654.0
Liabilities of banking department
Deposits
Bankers' Public ECA Other
260.7274.5278.9315.1314.5299.2313.5299.8302.8
287.3287.3288.8290.2
278.6284.0262.7289.3267.8307.7269.1267.2
5.25.3
10.318.611.711.615.413.410.0
10.79.9
10.414.9
10.710.930.611.714.010.614.814.6
17.497.9
.4
.624.3
19.917.611.57.2
12.54.71.06.64.68.7
10.21.7
52.358.557.395.592.1
111.285.089.878.5
70.668.969.970.4
68.165.972.967.169.871.371.363.8
Otherliabili-
ties andcapital
17.817.818.18.18.18.18.18.18.
18.617.817.918.2
18.318.418.617.818.018.218.318.4
*On June 9, 1945, the official buying price of the Bank of England for gold was increased from 168 shillings to 172 shillings and threepenceper fine ounce, and on Sept. 19, 1949, it was raised to 248 shillings. For details regarding previous changes in the buying price of gold and forinternal gold transfers during 1939, see BULLETIN for March 1950, p. 388, footnotes 1 and 4.
2 Securities and silver coin held as cover for fiduciary issue, the amount of which is also shown by this figure.3 Notes issued less amounts held in banking departments^Fiduciary issue decreased by 50 million pounds on Jan. 6, by 25 million on Jan. 13 and Jan. 27 and increased by 50 million on Mar. 17,
June 2 and July 13, by 25 million on July 28, and by 50 million on Aug. 18. For details on previous charges, see BULLETIN for February 1954,p. 222.
NOTE.—For back figures, see Banking and Monetary Statistics, Table 164, pp. 638-640; for description of statistics, see pp. 560-561 in samepublication.
1128 FEDERAL RESERVE BULLETIN
Digitized for FRASER http://fraser.stlouisfed.org/ Federal Reserve Bank of St. Louis
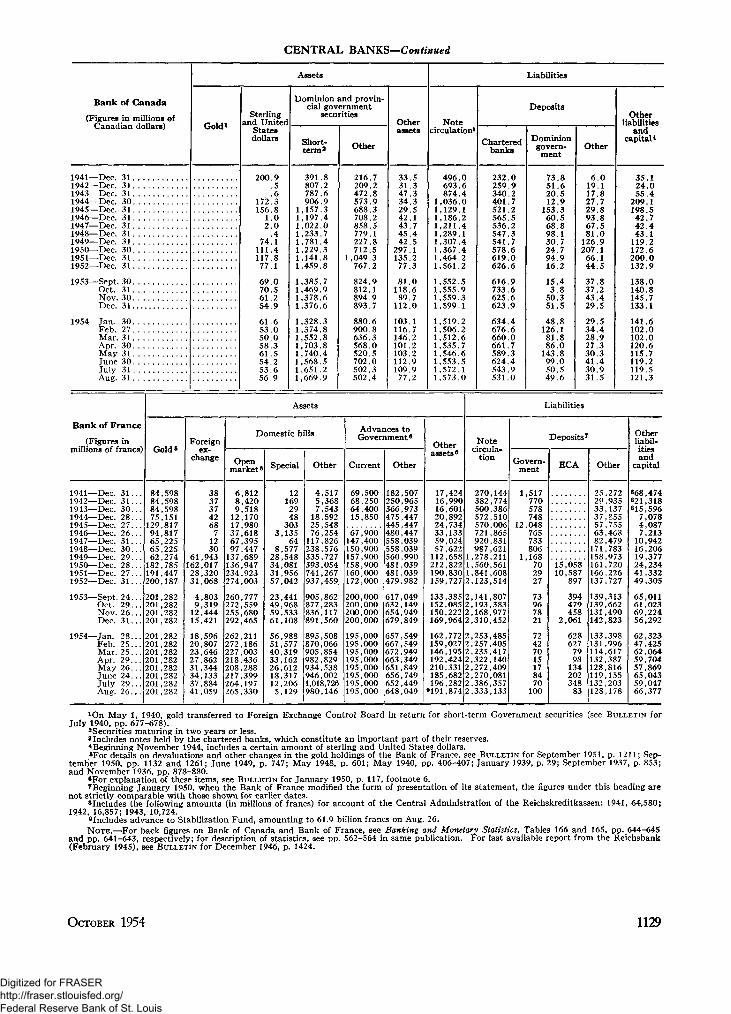
CENTRAL BANKS—Continued
Bank of Canada(Figures in millions of
Canadian dollars)
Assets
Gold»Sterling
and UnitedStatesdollars
Dominion and provin-cial government
securities
Short-term3 Other
Otherassets
Liabilities
Notecirculation1
Deposits
Charteredbanks
Dominiongovern-
mentOther
Otherliabilities
andcapital4
1941—Dec. 31.1942—Dec. 31.1943—Dec. 31.1944—Dec. 30.1945—Dec. 31.1946—Dec. 31.1947—Dec. 31.1948—Dec. 31.1949—Dec. 31.1950—Dec. 30.1951—Dec. 31.1952—Dec. 31.
1953—Sept. 30.Oct. 31.Nov. 30.Dec. 31.
1954—Jan. 30.Feb. 27.Mar. 31.Apr. 30.May 31.June 30.July 31.Aug. 31.
200.9.5.6
172.3156.8
1.02.0
.474.1
111.4117.877.1
69.070.561.254.9
61.653.050.058.361.554.253.656.9
391.8807.2787.6906.9
,157.3,197.4,022.0,233.7,781.4,229.3,141.8,459.8
,385.7,469.9,378.6,376.6
,328.3,374.8,552.8,703.8,740.4
1,568.51,651.21,669.9
216.7209.2472.8573.9688.3708.2858.5779.1227.8712.5
1,049.3767.2
824.9812.1894.9893.7
880.6900.8636.3568.0520.5702.0502.3502.4
33.531.347.334.329.542.143.745.442.5
297.1135.277.3
81.0118.689.7
112.0
103.1116.7146.2101.2103.2112.9109.977.2
496.0693.6874.4
,036.0,129.1,186.2,211.4,289.1,307.4,367.4,464.2,561.2
,552.5,555.9,559.3,599.1
,519.2,506.2,512.6,535.7,546.6,553.5,572.1
1,573.0
232.0259.9340.2401.7521.2565.5536.2547.3541.7578.6619.0626.6
616.9733.6625.6623.9
634.4676.6660.0661.7589.3624.4543.9531.0
73.851.620.512.9
153.360.568.898.130.724.794.916.2
15.43.8
50.351.5
48.8126.181.886.0
143.899.050.549.6
6.019.117.827.729.893.867.581.0
126.9207.166.144.5
37.837.243.429.5
29.534.428.927.330.341.430.931.5
35.124.055.4
209.1198.542.742.443.1
119.2172.6200.0132.9
138.0140.8145.7133.1
141.6102.0102.0120.6115.7119.2119.5121.3
Bank of France(Figures in
millions of francs)
Assets
Gold*Foreign
ex-change
Domestic bills
Openmarket
Special Other
Advances toGovernment6
Current Other
Otherassets0
Liabilities
Notecircula-
tion
Deposits7
Govern-ment ECA Other
Otherliabil-itiesand
capital
1941—Dec. 31.1942—Dec. 31.1943—Dec. 30.1944—Dec. 28.1945—Dec. 27.1946—Dec. 26.1947—Dec. 31.1948—Dec. 30.1949—Dec. 29.1950—Dec. 28.1951—Dec. 27.1952—Dec. 31.
1953—Sept. 24.Oct. 29.Nov. 26.Dec. 31.
1954—Jan. 28.Feb. 25.Mar. 25.Apr. 29.May 26.June 24.July 29.Aug. 26.,
84,59884,59884,59875,151129,81794,81765,22565,22562,274182,785191,447200,187
201,282201,28201,282201,282
201,282201,282201,282201,282201,282201,282201,282201,282
383737426871230
61,943162,01728,32031,068
4,8039,31912,44415,421
18,59620,80723,64627,86231,34434,13337,88441,059
6,8128,4209,51812,17017,98037,61867,39597,447137,689136,947234,923274,003
260,777272,559255,680292,465
262,211272,186227,003218,436208,288217,399264,197265,330
121692948
3033,135
648,57728,54834,08131,95657,042
23,44149,96859,53361,108
56,98851,57740,31933,16226,61218,31712,2065,129
4,5175,3687,54318,59225,54876,254117,826238,576335,727393,054741,267937,459
905,862877,283836,117891,560
895,508870,066905,854982,829934,538946,0021,018,726980,146
69,50068,25064,40015,850
67]900147,400150,900157,900158,900160,000172,000
200,000200,000200,000200,000
195,000195,000195,000195,000195,000195,000195,000195,000
182,507250,965366,973475,447445,447480,447558,039558,039560,990481,039481,039479,982
617,049632,149654,949679,849
657,549667,549672,949663,349651,849656,749652,449648,049
17,42416,99016,60120,89224,73433,13359,02457,622112,658212,822190,830159,727 2
270,144382,774500,386572,510570,006721,865920,831987,621,278,211,560,561,841,608,123,514
133,385152,085150,222169,964 2
162,772159,027146,195192,424210,331185,682196,2829191,874 2
2,141,8072,193,3832,168,977,310,452
,253,485,257,405,235,417,322,140,272,409,270,081,386,357,333,133
1,517770578748
12,048765733806
1,168702927
73967821
72427015178470100
15,05810,587
897
394479458
2,061
628627799813420234883
25,27229,93533,13737,85557,75563,46882,479171,783158,973161,720166,226137,727
139,313139,662131,490142,823
133,398131,996114,617132,387128,816119,155132,203128,178
868,474821,318815,5967,0784,0877,21310,94216,20619,37724,23441,33249,305
65,01161,02369,22456,292
62,32347,42562,06459,70457,86965,04359,04766,377
*On May 1, 1940, gold transferred to Foreign Exchange Control Board in return for short-term Government securities (see BULLETIN forJuly 1940, pp. 677-678).
Securities maturing in two years or less.3 Includes notes held by the chartered banks, which constitute an important part of their reserves.4 Beginning November 1944, includes a certain amount of sterling and United States dollars.6For details on devaluations and other changes in the gold holdings of the Bank of France, see BULLETIN for September 1951, p. 1211; Sep-
tember 1950, pp. 1132 and 1261; June 1949, p. 747; May 1948, p. 601; May 1940, pp. 406-407; January 1939, p. 29; September 1937, p. 853;and November 1936, pp. 878-880.
«For explanation of these items, see BULLETIN for January 1950, p. 117, footnote 6.7Beginning January 1950, when the Bank of France modified the form of presentation of its statement, the figures under this heading arenot strictly comparable with those shown for earlier dates.8Includes the following amounts (in millions of francs) for account of the Central Administration of the Reichskreditkassen: 1941, 64,580;1942, 16,857; 1943, 10,724.
^Includes advance to Stabilization Fund, amounting to 61.9 billion francs on Aug. 26.NOTE.—For back figures on Bank of Canada and Bank of France, see Banking and Monetary Statistics, Tables 166 and 165, pp. 644-645
and pp. 641-643, respectively; for description of statistics, see pp. 562-564 in same publication. For last available report from the Reichsbank(February 1945), see BULLETIN for December 1946, p. 1424.
OCTOBER 1954 1129
Digitized for FRASER http://fraser.stlouisfed.org/ Federal Reserve Bank of St. Louis
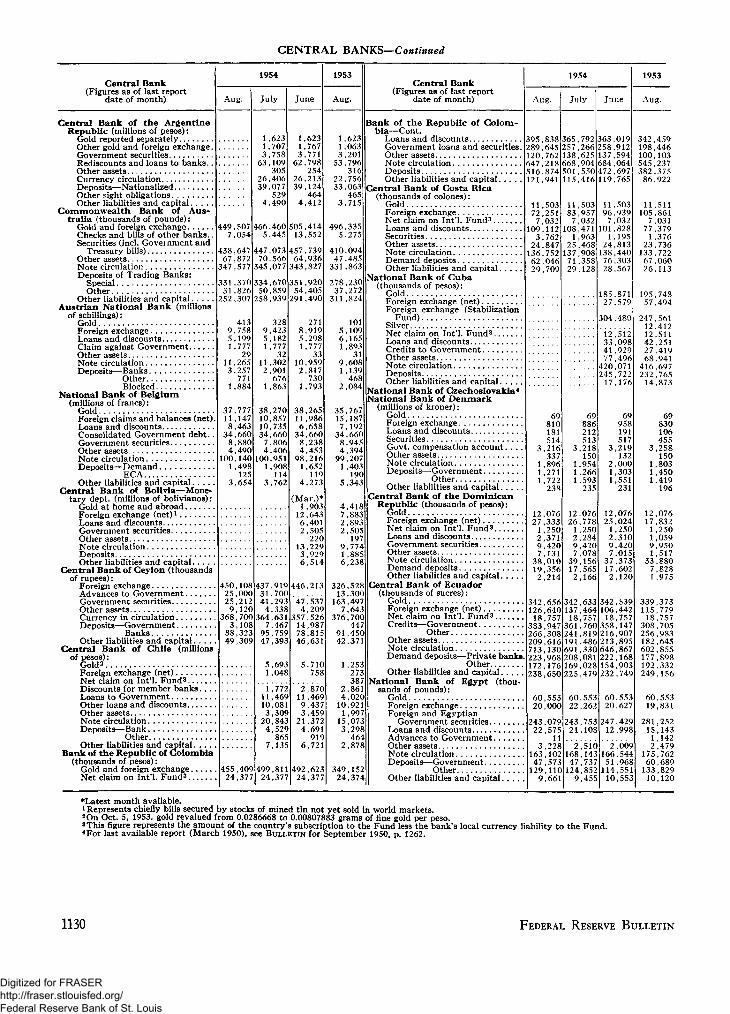
CENTRAL BANKS—Continued
Central Bank(Figures as of last report
date of month)
1954
Aug. July June
1953
Aug.
Central Bank(Figures as of last report
date of month)
1954
Aug. July June
1953
Aug.
Central Bank of the ArgentineRepublic (millions of pesos):
Gold reported separatelyOther gold and foreign exchange.Government securitiesRediscounts and loans to banks..Other assetsCurrency circulationDeposits—NationalizedOther sight obligationsOther liabilities and capital
Commonwealth Bank of Aus-tralia (thousands of pounds):
Gold and foreign exchangeChecks and bills of other banks..Securities (incl. Government and
Treasury bills)Other assetsNote circulationDeposits of Trading Banks:
SpecialOther
Other liabilities and c a p i t a l . . . . .Austrian National Bank (millions
of schillings):GoldForeign exchangeLoans and discountsClaim against GovernmentOther assets.Note circulationDeposits—Banks
OtherBlocked
National Bank of Belgium(millions of francs):
GoldForeign claims and balances (net)Loans and discountsConsolidated Government debt. .Government securitiesOther assetsNote circulationDeposits—Demand
ECAOther liabilities and capital
Central Bank of Bolivia—Mone-tary dept. (millions of bolivianos):
Gold at home and abroadForeign exchange (net)x
Loans and discountsGovernment securitiesOther assetsNote circulationDepositsOther liabilities and capital
Central Bank of Ceylon (thousandsof rupees):
Foreign exchangeAdvances to GovernmentGovernment securitiesOther assetsCurrency in circulationDeposits—Government
BanksOther liabilities and c a p i t a l . . . .
Central Bank of Chile (millionsof pesos):
GoldsForeign exchange (net)Net claim on Int'l. Fund3
Discounts for member banks. . .Loans to GovernmentOther loans and discountsOther assetsNote circulationDeposits—Bank
OtherOther liabilities and c a p i t a l . . . .
Bank of the Republic of Colombia(thousands of pesos):
Gold and foreign exchangeNet claim on Int'l. Fund3
623707758109305406077529490
449,5077,054
460445
438,64767,872
447,70,
073566
347,577 345,077
670859939
331,37031,826
252,307
4139,7585,1991,777
2911,2653,257
7711,884
37,77711,1478,463
34,6608,8804,490
100,1401,498
1253,654
33450
258,
328,423,182,77732
,302,901676,863
1,6231,7673,771
62,798254
26,21339,124
4644,412
;05,41413,552
457,73964,936
343,827
351,92054,405
291,490
2718,9195,2981,777
3310,9592,817
7301,793
38,10,10,34,74'
100
27085773566080640695190811476:
450,108 43725,00025,2129,120
368,7003,10888,32.49,309
,919,700,293,338,631,467,759,393
38,26511,9866,658
34,6608,2384,453
98,2161,65
1194,273
Mar.)*1,903
12,6436,4012,505
22013,2293,9296,51
446,213
47,534,209
357,52614,9878,81546,63
5,710758
455,40924,377 24
77246"0830984352'865135
2,87011,4699,4373,45'
21,3724,69
9V6,72
492,62324,377
1,6231,0633,20153,796
31622,75633,063
4653,715
496,3355,275
410,09447,485331,863
278,23037,272
311,824
1015,1096,1651,893
319,6081,139
4682,084
35,76'15,1877,192
34,6608,9454,394
99,2071,403
1905,343
4,4187,2,8932,505
199,771,8856,238
326,52513,300
163,4977,643
376,7OC44
91,45i42,37
1,25327338
2,864,021
10,921,99
15,073,29?
46'2,87?
349,1524,374
Bank of the Republic of Colom-bia—Cont.
Loans and discountsGovernment loans and securities.Other assetsNote circulationDepositsOther liabilities and capital
Central Bank of Costa Rica(thousands of colones):
GoldForeign exchangeNet claim on Int'l. Fund3
Loans and discounts.SecuritiesOther assetsNote circulationDemand depositsOther liabilities and capital
National Bank of Cuba(thousands of pesos):
GoldForeign exchange (net)Foreign exchange (Stabilization
Fund)SilverNet claim on Int'l. Fund3
Loans and discountsCredits to GovernmentOther assetsNote circulationDepositsOther liabilities and capital
National Bank of Czechoslovakia4
National Bank of Denmark(millions of kroner):
GoldForeign exchangeLoans and discountsSecuritiesGovt. compensation account. . . .Other assetsNote circulationDeposits—Government....
OtherOther liabilities and capital
Central Bank of the DominicanRepublic (thousands of pesos):
GoldForeign exchange (net)Net claim on Int'l. Fund3
Loans and discountsGovernment securitiesOther assetsNote circulationDemand depositsOther liabilities and capital
Central Bank of Ecuador(thousands of sucres):
GoldForeign exchange ( n e t ) . . . .Net claim on Int'l. Fund 3 . .Credits—Government
OtherOther assetsNote circulationDemand deposits—Private banks.
OtherOther liabilities and capital
National Bank of Egypt (thousands of pounds):
GoldForeign exchangeForeign and Egyptian
Government securitiesLoans and discountsAdvances to GovernmentOther assetsNote circulationDeposits—Government
OtherOther liabilities and c a p i t a l . . . .
395,838289,64520,762547,21816,87421,941
11,50372,2517,032
09,1123,76224,84736,75262,04629,709
365,79257,26638,625568,904501,55015,416
11,50383,9577,032
08,4711,963
25,46837,90871,35829,128
163,019158,91237,594
684,064472,697
19,765
11,50396,939
7,03201,8281,195
24,81338,44076,30328,567
185,87127,579
304,480
12,51233,09841,92977,496
420,071245,72217,176
69810181514
3,216337
1,8961,2711,722238
12,07627,3331,2502,3719,4207,131
38,01019,3562,214
342,656126,64018,757
383,947266,308209,616713,130223,968172,176238,650
60,55320,000
243,07922,575
113,228
163,10247,573129,1109,661
69886212513
3,218150
1,9541,2661,593235
12,07626,7781,2502,2849,4207,078
39,15617,5652,166
342,633137,46418,75'
361,760241,819191,486691,330208,081169,028225,479
60,55322,26:
243,75321,108
69958191517
3,219132
2,0001,3031,551231
12,07625,0241,2502,3109,4207,015
37,37317,60:2,120
342,539106,44218,757
358,147216,907213,895646,867222,168154,903232,74<
60,55320,627
247,42912,998
2,510168,14347,737124,8529,455
2,009166,54-51,968114,55110,553
342,459198,446100,103545,237382,37586,922
11,511105,8617,031
77,3791,376
23,736133,72267,06026,113
195,74857,494
247,56112,41212,51142,25127,41968,941
416,697232,76514,873
69830106455
3,258150
1,8031,4501,419
196
12,07617,8321,2501,0599,9501,517
33,8807,8281,975
339,373115,77918,757
308,705256,983182,645602,855177,898192.332249,156
60,55319,831
281,25215,1431,1422,479
175,76260,689133,82910,120
•Latest month available.1 Represents chiefly bills secured by stocks of mined tin not yet sold in world markets.2On Oct. 5, 1953, gold revalued from 0.0286668 to 0.00807883 grams of fine gold per peso.3 This figure represents the amount of the country's subscription to the Fund less the bank's local currency liability to the Fund.4For last available report (March 1950), see BULLETIN for September 1950, p. 1262.
1130 FEDERAL RESERVE BULLETIN
Digitized for FRASER http://fraser.stlouisfed.org/ Federal Reserve Bank of St. Louis

CENTRAL BANKS—Continued
Central Bank(Figures as of last report
date of month)
Central Reserve Bank of El Salva-dor (thousands of colones):
Gold . .Foreign exchange (net)Net claim on Int'l. Fund1
Loans and discountsGovernment debt and securities..Other assetsNote circulationDepositsOther liabilities and capital
Bank of Finland (millions of mark-kaa):
GoldForeign assets (net) . . . .Clearings (net)
SecuritiesOther assets . .Note circulationDepositsOther liabilities and capital. . .
Bank of German States2
(millions of German marks):GoldForeign exchangeLoans and discountsLoans to GovernmentOther assetsNote circulationDeposits—Government
BanksOther
Other liabilities and capitalBank of Greece (billions of drach-
mae):Gold and foreign exchange (net).
Advances—GovernmentOther
Other assetsNote circulationDeposits—Government
relief actsOther
Other liabilities and capitalBank of Guatemala (thousands of
quetzales):GoldForeign exchange (net) . .Gold contribution to Int'l FundRediscounts and advancesOther assetsCirculation—Notes
CoinDeposits—Government .
BanksOther liabilities and capital
National Bank of HungarySReserve Bank of India (millions of
rupees):Issue department:
Gold at home and abroadForeign securitiesIndian Govt. securities . . . .Rupee coin . .Note circulation
Banking department:Notes of issue departmentBalances abroadBills discountedLoans to GovernmentOther assetsDepositsOther liabilities and capital
Bank Indonesia4(millions of rupiah):Gold and foreign exchange (net) 5.Loans and discountsAdvances to GovernmentOther assets
1954
Aug.
72,08945,287
1,56833,182
7,1037,246
90,84965,05310,573
6,97317,3977,722
33 0592,2441,985
45,8507,996
15,534
582717
7,707299
July
72,15754,538
1,56827,890
7,7747,652
93,77967,33810,462
6,97316,6717,962
36,3212,2122,425
44,72012,90014,943
2,0068,1771,8284,794
80911,732
1,1552,632
2631,832
4,866141
9,1474,3861,8093,3761,343
6,7493,7105,169
4006,2324,2121 ,027
11,427
4441 ,091
14
1,1882,370
367
444639
7,514287
June
72,22365,584
1,56817,20511,5498,001
94,55471,07710,499
6,97314,8658,503
41 9242,2172,142
44,60517,34714,671
1,7548,1542,3704,452
93611,542
1,1622,843
2481,870
4,886148
8,6904,0821,9253,2721,246
6,7493,2175 246
27,22812,803
1,25013,00335 31254,1313,6952,506
13 57715,686
4006 5324,212
98311,745
382904
6711
1,2522,237
378
366569
7,249247
1953
Aug.
72,94058,665
1,56616,8914,0782,362
85,42062,888
8,193
5,86210,6905,938
41 2781,6612,386
45,0754,605
18,136
1,0356,0452,1956,707
99811,124
1,3352,477
2411 ,801
4,500164
8,7663,2482,1722,7601,298
7,0232,2915 469
27,22813,761
1 2509,927
28 29943,816
3,5166,031
11 06216,039
4005,5824,249
94310,829
3441,412
484
1,0492,648
210
1,915644
4,092257
Central Bank(Figures as of last report
date of month)
Bank Indonesia—Cont.Note circulationDeposits—ECA
OtherOther liabilities and capital
Central Bank of Ireland (thousandsof pounds):
GoldSterling fundsNote circulation
Bank of Italy (billions of lire):GoldForeign exchangeAdvances to TreasuryLoans and discountsGovernment securitiesOther assets .. .Note circulationDeposits—Government
DemandOther
Other liabilities and capital. . .Bank of Japan (millions of yen):
BullionAdvances to GovernmentLoans and discountsGovernment securitiesOther assetsNote circulationDeposits—Government
OtherOther liabilities
Bank of Mexico (millions of pesos):Monetary reserve8
"Authorized" holdings of secu-rities, etc
Bills and discountsOther assets... .Note circulationDemand liabilitiesOther liabilities and capi ta l . . .
Netherlands Bank (millions ofguilders):
GoldSilver (including subsidiary coin).Foreign assets (net)Loans and discountsGovt. debt and securitiesOther assetsNote circulation—Old
NewDeposits—Government
ECAOther
Other liabilities and capitalReserve Bank of New Zealand
(thousands of pounds):GoldForeign exchange reserveLoans and discountsAdvances to State or State un-
dertakings .InvestmentsOther assetsNote circulationDemand depositsOther liabilities and capital
Bank of Norway (millions of kroner):GoldForeign assets (net)Clearing accounts (net)Loans and discountsSecuritiesOccupation account (net)Other assetsNote circulationDeposits—Government
BanksFOA—MSA
Other liabilities and capital
1954
Aug.
6,212495
2,116482
2,64664,13566,781
477
567364311774
1,3953069
475129
4481,400
435,759193,93482,562
521,72542,42375,36674,590
1,271
3,393475729
3,7451,340
783
3,01518
1,33528
695436
293,418
406801640232
6,17285,82213,369
30,84723,964
1,47567,93085,4698,249
203176
- 7 55226
5,54657
3,1191,341
741207578
July
6,031495
1,890468
2,64665,28867,934
474
567333320791
1,3922958
479131
4481,400
430,667199,24587,952
524,00240,74378,04376,923
1,218
3,210495734
3,6661,207
784
3,00617
1,54730
670439
293,395
550821685229
6,17189,44213,542
28,15423,957
1,61566,97987,974
7,927
203185
- 7 85530
5,54676
3,1221,453
699205539
June
5,938495
1,532466
2,64664,00366,649
471
567349290725
1,3413571
435126
4481,400
444,595202,99193,369
534,21563,21768,57376,799
1,201
3,277793
1,0543,5371,2681,520
2,93016
1,62837
713421
293,357
624797723214
6,17093,95710,556
36,30023,950
1,41267,47996,969
7,896
2*18132
- 6 86230
5,54662
3,0781,708
532174491
1953
Aug.
4,840495
1,115457
2,64661,07663,722
456
567307256734
1,2896566
389114
44837,344
458,828136,644134,559526,992137,11155,68748,033
1,155
2,775723456
3,1411,479
488
2,58816
1,51032
1,217461
323,176
6911,195
521209
6,02466,421
6,019
58,71936,990
1,51762,647
105,0368,007
28169395343
5,54649
2,9141,672
759278456
lThis figure represents the amount of the country's subscription to the Fund less the bank's local currency liability to the Fund.2 Combined figures for the Bank of German States and the nine Land Central Banks.3For last available report (February 1950), see BULLETIN for September 1950, p. 1263.4 As of July 1, 1953, the Java Bank became the Bank Indonesia and established an Issue and a Banking Department. Figures shown represent
Issue and Banking Departments combined.5Gold not reported separately beginning January 1954.6Includes gold, silver, and foreign exchange forming required reserve (25 per cent) against notes and other demand liabilities.
OCTOBER 1954 1131
Digitized for FRASER http://fraser.stlouisfed.org/ Federal Reserve Bank of St. Louis

CENTRAL BANKS—Continued
Central Bank(Figures as of last report
date of month)
1954
Aug. July June
1953
Aug.
Central Bank(Figures as of last report
date of month)
1954
Aug. July June
1953
Aug.
State Bank of Pakistan (millions ofrupees):
Issue department:Gold at home and abroad. . .Sterling securitiesPakistan Goyt. securities. . .Govt. of India securit ies. . . .India currencyRupee coinNotes in circulation
Banking department:Notes of issue department. .Bills discountedLoans to GovernmentOther assetsDepositsOther liabilities and capital..
Central Bank of Paraguay1
(thousands of guaranies):Gold2Foreign exchange (net)Net claim on Int'l. Fund3
Loans and discountsGovernment loans and securities.Other assetsNote and coin issueDeposits—Government
OtherOther liabilities and capital
Central Reserve Bank of Peru(millions of soles):
Gold and foreign exchangeNet claim on Int'l. Fund3
Loans and discounts to banks. . .Loans to GovernmentOther assets tNote circulationDepositsOther liabilities and capital
Central Bank of the Philippines(thousands of pesos):
GoldForeign exchangeNet claim on Int'l. Fund3
LoansDomestic securitiesOther assetsCirculation—Notes
CoinDemand depositsOther liabilities and capital
Bank of Portugal (millions ofescudos):
GoldForeign exchange (net)Loans and discountsAdvances to GovernmentOther assetsNote circulationDemand deposits—Government..
ECAOther
Other liabilities and capitalSouth African Reserve Bank
(thousands of pounds):GoldForeign billsOther bills and loansOther assetsNote circulationDepositsOther liabilities and capital
Bank of Spain (millions of pesetas):GoldSilverGovernment loans and securities.Other loans and discounts
81381
1,300147300
572,164
1026
73420508
93
81400
,281147300
58,167
995
65424496
98
81416
1,367146300
552,240
124
18438
29
227161584
8415453
32567
689,216
73,801356212
75304387115
(May)*2,846
91,30728
450,566537,452229,189625,964138,965155,762390,697
32767
5751,225
1001,703
355237
504714
18,813474 447,130
29,5041,584
970 240,066156,923
708 587,48684,701
170,77551,058
802484048
66411444
1004718
,381,204639
,408979,525,761
6177
,143
,615,174,137,262,218,686,283
613323
,247,751
5,34513,198
6451,412
9789,5011,734
68,1782,161
66,12047,589
7,04147,51798,98851,95617,323
613323
15,74326,642
81424
1,118126300
682,009
1081
124492640
85
1,13854,782
11248,398363,569361,105465,554121,746152,512289,192
47067
4611,023
1811,545
386272
18,813452,09829,50417,374
224,061155,835551,44786,106204,20255,931
4,76812,146
6771,427668
9,1371,690
66,7032,150
62,25926,38930,91439,63493,46847,66518,063
596338
15,99123,082
Bank of Spain—Cont.Other assetsNote circulationDeposits—Government
OtherOther liabilities and capital. . . . .
Bank of Sweden (millions of kronor):GoldForeign assets (net)Net claim on Int'l.*Fund3
Swedish Govt. securities and ad-vances to National Debt Office4
Other domestic bills and advancesOther assetsNote circulationDemand deposits—Government..
OtherOther liabilities and capital
Swiss National Bank (millions offrancs):
GoldForeign exchangeLoans and discountsOther assetsNote circulationOther sight liabilitiesOther liabilities and capital
Central Bank of the Republic ofTurkey (millions of pounds):
GoldForeign exchange and foreign
clearingsLoans and discountsSecuritiesOther assetsNote circulationDeposits—Gold
OtherOther liabilities and capital
Bank of the Republic of Uruguay(thousands of pesos):
GoldSilverAdvances to State and Govern-
ment bodiesOther loans and discountsOther assetsNote circulationDeposits—Government
OtherOther liabilities and capital
Central Bank of Venezuela (mil-lions of bolivares):
GoldForeign exchange (net)Other assetsNote circulationDepositsOther liabilities and capital
Bank for International Settle-ments (thousands of Swiss goldfrancs):
Gold in barsCash on hand and with banks. . .Sight funds at interestRediscountable bills and accept-
ances (at cost)Time funds at interestSundry bills and investments. . . .Funds invested in GermanyOther assetsDemand deposits (gold)Short-term deposits:
Central banks—Own account..Other
Long-term deposits: SpecialOther liabilities and capital
4821,359129
2,57246860
4,52315078
697
6,22153010292
4,9571,785203
402
2162,385
3092
1,469154983519
37,13839,4466,2363,43831,953
4821,331129
2,53056849
4,463100121693
6,19850910890
4,9561,746203
402
2252,310
3088
1,449154957495
1,232212142992223371
591,11188,6991,528
1,232277149986258414
570,28799,1511,484
293,325386,345441,820297,2016,615
435,794 432
300,056409,462508,495297,2017,105,775
37,38937,7287,1043,32932,548
4821,356129
2,405433896
4,59337640693
6,13153711793
4,9671,706204
402
2372,190
3090
1,432154875488
(May)*344,1678,672
123,343375,715609,949456,400148,591333,215523,640
1,232374123999269463
558,10651,1441,491
174,970374,355539,690297,2018,555
434,282
1,133,89826,598228,909 228,909 228281,446 280
1,231,90419,089
1,032,38626,373
,909565 283,561
30,77737,1243,7212,983
26,957
4501,327
129
2,376365856
4,321228233720
6,05653621156
4,8611,787211
402
1841,831
26108
1,370153711316
336,5729,276
116,460341,293601,562400,046128,965367,271508,881
1,14119783
917293211
575,69675,4393,322
288,13323,706254,143297,201
1,399433,012
540,11542,848228,909274,154
* Latest month available.!The new Central Bank of Paraguay began operations on July 1, 1952. Central banking functions previously performed by the Monetary De-
partment of the Bank of Paraguay were transferred to the new institution.2On Jan. 1, 1954, gold revalued from 0.148112 to 0.0592447 grams of fine gold per guarani.3This figure represents the amount of the country's subscription to the Fund less the bank's local currency liability to the Fund.4 Includes small amount of non-Government bonds.
1132 FEDERAL RESERVE BULLETIN
Digitized for FRASER http://fraser.stlouisfed.org/ Federal Reserve Bank of St. Louis
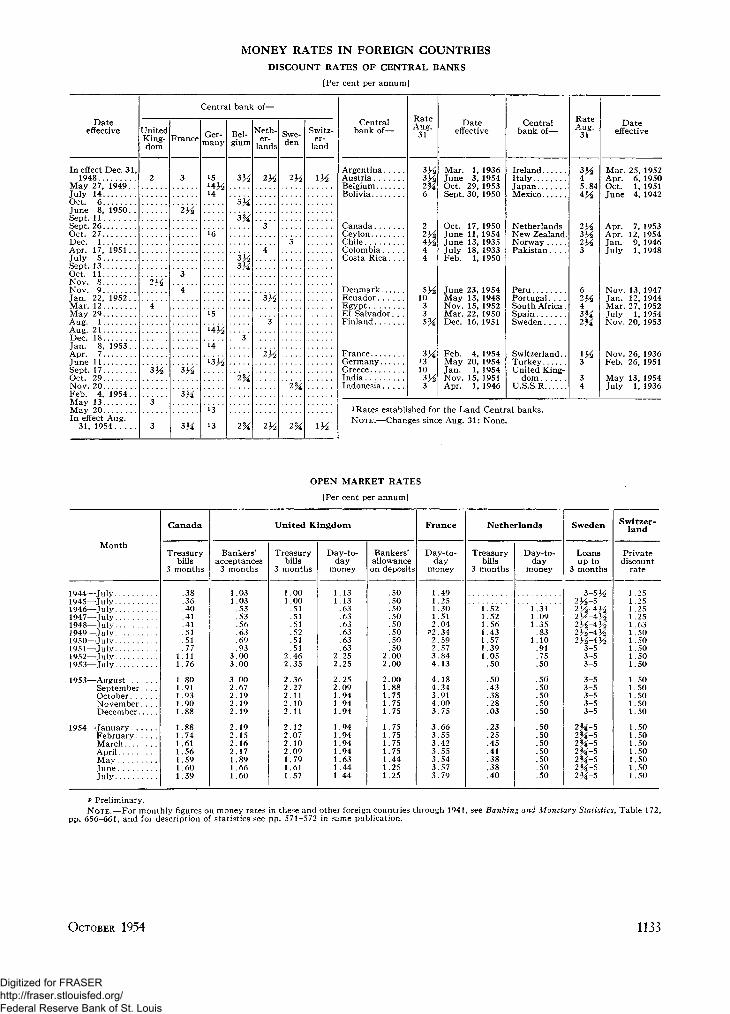
MONEY RATES IN FOREIGN COUNTRIESDISCOUNT RATES OF CENTRAL BANKS
[Per cent per annumj
Dateeffective
In effect Dec. 31,1948
May 27, 1949July 14Oct 6June 8, 1950. .Sept 11Sept. 26 . . .Oct 27Dec. 1 . . .Apr. 17, 1951. .July 5 . . .Sept 13Oct. 11 . .Nov. 8Nov. 9Jan. 22, 1952. .Mar. 12May 29Aug. 1 . .Aug. 21Dec 18Jan. 8, 1953Apr 7June 11Sept. 17Oct. 29 ..Nov 20Feb. 4, 1954. .May 13May 20In effect Aug.
31, 1954
Central bank of—
UnitedKing-dom
2
iy2
4
334
3
3
France
3
234
3
4
334
3H
3M
Ger-many
15
14 2
16
15
1434
14
13 V
13
13
Bel-gium
3M
3%
3 1 /
3H
3
2%
2%
Neth-er-
lands
3
4
3}/
3
"ilk
2Y2
Swe-den
"3"
"2%
2M
Switz-er-
land
I X
I X
Centralbank of—
ArgentinaAustriaBelgiumBolivia
CanadaCeylonChileColombiaCosta Rica
Denmark. . . .EcuadorEgyptEl Salvador. . .F in land. . . .
FranceGermanyGreeceIndiaIndonesia
RateAug.
31
2%6
2
4 2
4
10 2
335M
3M13
10
3
Dateeffective
Mar. 1, 1936June 3, 1954Oct. 29, 1953Sept. 30, 1950
Oct. 17. 1950June 11, 1954June 13, 1935July 18, 1933Feb. 1, 1950
June 23, 1954May 13, 1948Nov. 15, 1952Mar. 22, 1950Dec. 16, 1951
Feb. 4, 1954May 20, 1954Jan. 1, 1954Nov. 15, 1951Apr. 1, 1946
Centralbank of—
IrelandItalyJapanMexico
Netherlands.New Zealand.NorwayPakistan. . . .
PeruPor tuga l . . . .South Africa.SpainSweden
Switzerland..TurkeyUnited King-
domU.S.S.R
RateAug.
31
45.84434
iy23y2
62Y24
3
34
Dateeffective
Mar. 25, 1952Apr. 6, 1950Oct. 1, 1951June 4, 1942
Apr. 7, 1953Apr. 12, 1954Jan. 9, 1946July 1, 1948
Nov. 13, 1947Jan. 12, 1944Mar. 27, 1952July 1, 1954Nov. 20, 1953
Nov. 26, 1936Feb. 26, 1951
May 13, 1954July 1, 1936
1 Rates established for the Land Central banks.NOTE.—Changes since Aug. 31: None.
OPEN MARKET RATES[Per cent per annum]
Month
I944—July1945—July1946—July1947—July1948—July1949—July1950—July1951—July1952—July1953—July
1953—AugustSeptember. . . .OctoberNovember . . . .December
1954—JanuaryFebruaryMarchAprilMavJuneJuly
Canada
Treasurybills
3 months
.38
.36
. 4 0
.41
.41
.51
.51
.771 .111.76
1 .801.911.931.901.88
1.881.741.611.561.591 601.39
United Kingdom
Bankers'acceptances
3 months
1.031.03
.53
.53
.56
.63
. 6 9
.933.003.00
3.002.672.192.192.19
2.192.152.162.171.891 .661.60
Treasurybills
3 months
1.001.00
.51
.51
.51
.52
.51
.512.462.35
2.362.272.112.102.11
2.122.072.102.091.791 .611.57
Day-to-day
money
1.131.13
. 6 3
.63
.63
. 6 3
.63
.632.252.25
2.252.091.94
.94
.94
.94
.94
.94L.94
.63
.44
.44
Bankers 'allowance
on deposits
.50
.50
.50
.50
.50
.50
.50
.502.002.00
2.00.88
L.75L.75L.75
L.75L.751.75L.751.44L.251.25
France
Day-to-day
money
1.491 .251.301.512.04
P2.342.592.573.844.13
4.184.343.914.003.75
3.663.553.423.553.543.573.79
Netherlands
Treasurybills
3 months
L . 5 2L.52L.56L.43L.57L.39L.05
.50
.50
.43
.38
.28
.03
.23
.25
.45
.41
.38
.38
.40
D a y - t o -d a y
money
"" "i'.ii" * "1.091.35
.831.10
.91
.75
.50
.50
.50
.50
.50
.50
.50
.50
.50
.50
.50
.50
.50
Sweden
Loansup to
3 months
3-5342 34-52 3^-43^2 1 ^ — 4 1 ^
2 34^434234~43421^-41^
3-53-53-5
3-53-53-53-53-5
2H-52%—S2%-h2%—52%—52%-S2H-5
Switzer-land
Privatediscount
rate
1 .251.251.251.251.631.501.501.501.501.50
1.501.501.501.501.50
1.501.501.501.501.501 .501.50
P Preliminary.NOTE.—For monthly figures on money rates in these and other foreign countries through 1941, see Banking and Monetary Statistics, Table 1 72,
pp. 656-661, and for description of statistics see pp. 571-572 in same publication.
OCTOBER 1954 1133
Digitized for FRASER http://fraser.stlouisfed.org/ Federal Reserve Bank of St. Louis
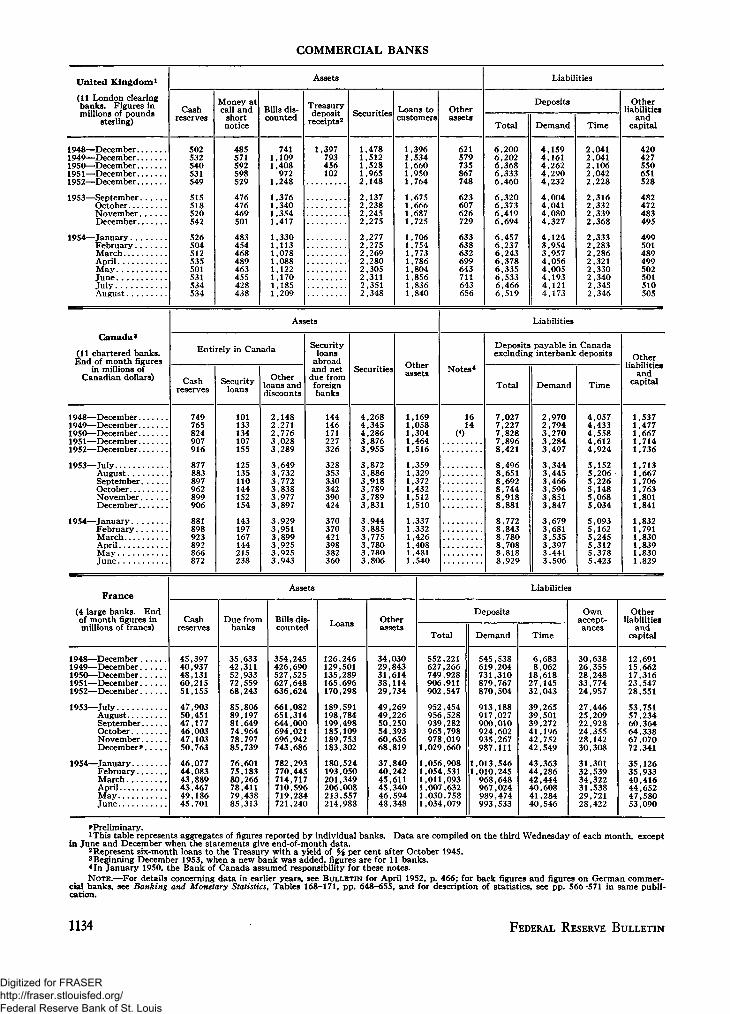
COMMERCIAL BANKS
United Kingdom*
(11 London clearingbanks. Figures inmillions of pounds
sterling)
Assets
Cashreserves
502532540531549
515518520542
526504512535501531534534
Money atcall and
shortnotice
485571592598529
476476469501
483454468489463455428438
Bills dis-counted
7411,1091,408
9721,2481,3761,3401,3541,4171,3301,1131,0781,0881,1221,1701,1851,209
Treasurydeposit
receipts2 Securities Loans tocustomers
Otherassets
Liabilities
Deposits
Total Demand Time
Otherliabilities
andcapital
1948—December.1949—December.1950—December.1951—December.1952—December.
1953—SeptemberOctober...NovemberDecember.
1954—January. .February.March....AprilMayJuneJulyAugust. . .
1,397793456102
1,4781,5121,5281,9652,148
2,1372,2382,2452,275
2,2772,2752,2692,2802,3052,3112,3512,348
1,3961,5341,660
,950,764
,675,666,687,725
,706,754,773,786,804,856,836,840
621579735867748
623607626729
633638632699643711643656
6,2006,2026,3686,3336,460
6,3206,3736,4196,694
6,4576,2376,2436,3786,3356,5336,4666,519
4,1594,1614,2624,2904,232
4,0044,0414,0804,327
4,1243,9543,9574,0564,0054,1934,1214,173
2,0412,0412,1062,0422,228
2,3162,3322,3392,368
2,3332,2832,2862,3212,3302,3402,3452,346
420427550651528
482472483495
499501489499502501510505
Assets Liabilities
Canada8
(11 chartered banks.End of month figures
in millions ofCanadian dollars)
Entirely in Canada
Cash Securityloans
Otherloans anddiscounts
Securityloans
abroadand netdue fromforeignbanks
Securities Otherassets Notes*
Deposits payable in Canadaexcluding interbank deposits
Total Demand Time
OtherLiabilities
andcapital
1948—December.1949—December.1950—December.1951—December.1952—December.
1953—JulyAugust. . .SeptemberOctober...NovemberDecember.
1954—January. .February.March....AprilMayJune
749765824907916
877883897962899906
881898923892866872
101133134107155
125135110144152154
143197167144215238
2,1482,2712,7763,0283,289
3,6493,7323,7723,8383,9773,897
3,9293,9513,8993,9253,9253,943
144146171227326
328353330342390424
370370421398382360
4,2684,3454,2863,8763,955
3,8723,8863,9183,7893,7893,831
3,9443,8853,7753,7803,7803,806
1,1691,0581,304
,464,516
,359,329,372,432,512,510
,337,332,426,408
1,4811,540
1614
7,0277,2277,8287,8968,421
8,4968,6518,6928,7448,9188,881
8,7728,8438,7808,7088,8188,929
2,9702,7943,2703,2843,497
3,3443,4453,4663,5963,8513,847
3,6793,6813,5353,3973,4413,506
4,0574,4334,5584,6124,924
5,1525,2065,2265,1485,0685,034
5,0935,1625,2455,3125,3785,423
,537,477,667,714,736
,713,667,706,763,801,841
,832,791,830,839,830
1,829
France(4 large banks. Endof month figures inmillions of francs)
Assets
Cashreserves
Due frombanks
Bills dis-counted Loans Other
Liabilities
Deposits
Total Demand Time
Ownaccept-ances
Otherliabilities
andcapital
1948—December .1949—December.1950—December.1951—December.1952—December.
1953—JulyAugust....September.October. . .November.December P
1954—January...February..MarchAprilMayJune
45,39740,93748,13160,21551,155
47,90350,45147,17746,00347,10350,763
46,07744,08343,88943,46749,18645,701
35,63342,31152,93372,55968,243
85,80689,19781,64974,96478,79785,739
76,60175,18380,26678,41179,43885,313
354,245426,690527,525627,648636,624
661,082651,314644,000694,021696,942743,686
782,293770,445714,717710,596719,284721,240
126,246129,501135,289165,696170,298
189,591198,784199,498185,109189,753183,302
180,524193,050201,349206,008213,557214,988
34,03029,84331,61438,11429,734
49,26949,22650,25054,39360,63668,819
37,84040.24245,61145,34046,59448,348
552,221627,266749,928906,911902,547
952,454956,528939,282965,798978,019
1,029,660
,056,908,054,531,011,093,007,632,030,758,034,079
545,538619,204731,310879,767870,504
913,188917,027900,010924,602935,267987,111
1,013,5461,010,245968,648967,024989,474993,533
6,6838,06218,61827,14532,043
39,26539,50139,27241,19642,75242,549
43,36344,28642,44440,60841,28440,546
30,63826,35528,24833,77424,957
27,44625,20922,92824,35528,14230,308
31,30132,53934,32231,53829,72128,422
12,69115,66217,31623,54728,551
53,75157,23460,36464,33867,07072,341
35,12635,93340,41644,65247,58053,090
P Preliminary.!This table represents aggregates of figures reported by individual banks. Data are compiled on the third Wednesday of each month, except
in June and December when the statements give end-of-month data.2 Represent six-month loans to the Treasury with a yield of */% per cent after October 1945.3Beginning December 1953, when a new bank was added, figures are for 11 banks.* In January 1950, the Bank of Canada assumed responsibility for these notes.NOTE.—For details concerning data in earlier years, see BULLETIN for April 1952, p. 466; for back figures and figures on German commer-
cial banks, see Banking and Monetary Statistics, Tables 168-171, pp. 648-655, and for description of statistics, see pp. 566-571 in same publi-cation.
1134 FEDERAL RESERVE BULLETIN
Digitized for FRASER http://fraser.stlouisfed.org/ Federal Reserve Bank of St. Louis
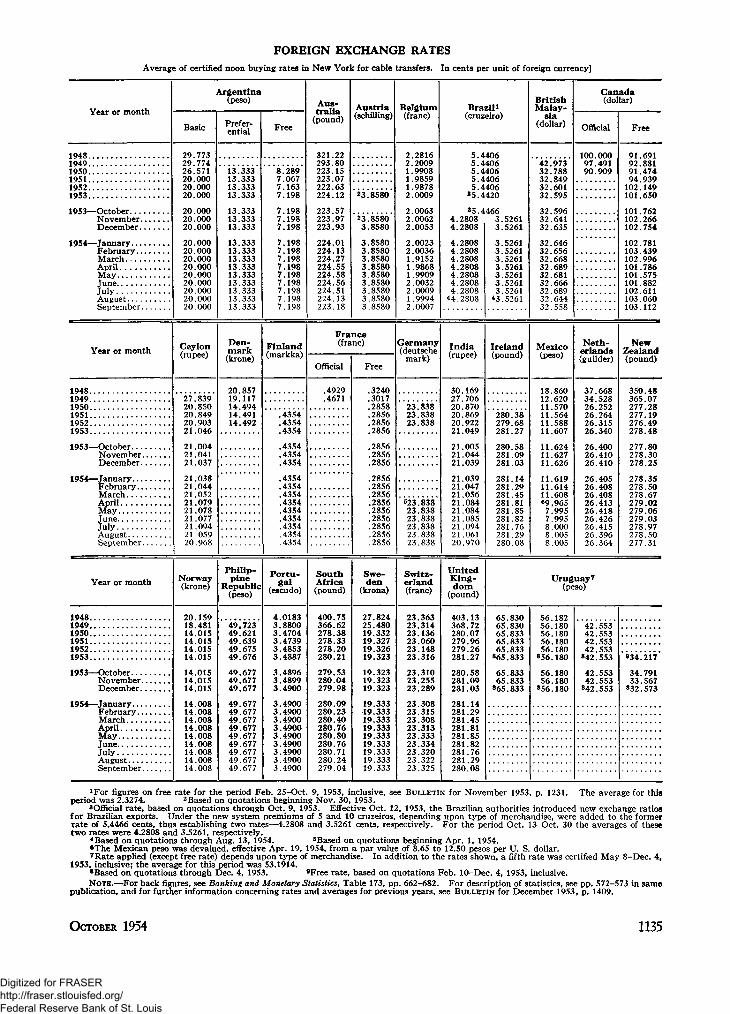
FOREIGN EXCHANGE RATESAverage of certified noon buying rates in New York for cable transfers. In cents per unit of foreign currency]
Year or month
19481949195019511952 . . .1953
1953—OctoberNovember . .December
February #
AprilMayJune •JulyAugust •September
Year or month
194819491950195119521953
1953—OctoberNovemberDecember
FebruaryMarchAprilMayJuneJulyAugustSeptember
Year or month
194819491950195119521953
1953—OctoberNovember . . . .
1954—January
March
MayJuneJulyAugustSeptember
Basic
29.77329.77426 57120.00020 00020.000
20.00020 00020.000
20.00020 00020.00020.00020 00020 00020 00020 00020.000
Ceylon(rupee)
27.83920.85020.84920.90321.046
21.00421.04121.037
21.03821.04421.05221.07921.07821.07721.09421.05920.968
Norway(krone)
20.15918.48114 01514.01514 01514.015
14.01514.01514.015
14 00814.00814.00814.00814.00814.00814.00814.00814.008
\rgentina(peso)
Prefer-ential
13 33313.33313 33313.333
13.33313 33313.333
13.33313 33313.33313.33313.33313 33313 33313 33313.333
Den-mark(krone)
20 85719.11714.49414.49114.492
Philip-pine
Republic(peso)
49.72349 62149.63949 67549.676
49.67749.67749.677
49.67749.67749 67749.67749.67749.67749.67749.67749.677
Free
8 2897.0677 1637.198
7.1987 1987.198
7.1987 1987.1987.1987.1987 1987.1987 1987.198
Finland(markka)
.4354
.4354
.4354
.4354
.4354
.4354
.4354
.4354
.4354
.4354
.4354
.4354
.4354
.4354
.4354
Portu-gal
(escudo)
4.01833.88003.47043.47393.48533.4887
3.48963.48993.4900
3.49003.49003.49003.49003.49003.49003.49003.49003.4900
Aus-tralia
(pound)
321.22293.80223.15223.07222 63224.12
223.57223 97223.93
224.01224 13224.27224.55224.58224 56224.51224 13223.18
Austria(schilling)
23.8580
23 85803.8580
3.85803 85803.85803.85803.85803 85803.85803 85803.8580
France(franc)
Official
.4929
.4671
SouthAfrica(pound)
400.75366.62278.38278.33278.20280.21
279.53280.04279.98
280.09280.23280.40280.76280.80280.76280.71280.24279.04
Free
.3240
.3017
.2858
.2856
.2856
.2856
.2856
.2856
.2856
.2856
.2856
.2856
.2856
.2856
.2856
.2856
.2856
.2856
Swe-den
(krona)
27.82425.48019 33219.32719.32619.323
19.32319.32319.323
19.33319.33319.33319.33319.33319.33319.33319.33319.333
Belgium(franc)
2.28162.20091 99081.98591 98782.0009
2.00632 00622.0053
2.00232 00361.91521.98681 99092 00322 00091 99942.0007
Germany(deutsche
mark)
23.83823.83823.838
623.83823.83823.83823.83823 83823.838
Switz-erland(franc)
23.36323.31423 13623.06023 14823.316
23.31023.25523.289
23 30823.31523 30823.31323.33323.33423.32023.32223.325
Brazil 1(cruzeiro)
5.44065.44065 44065.44065 4406
»5.442035.4466
4 2808 3 Wtfi4.2808
4.28084 28084.28084.28084.28084 28084 2808
44 2808
India(rupee)
30.16927.70620.87020.86920.92221.049
21.00521.04421.039
21.03921.04721.05621.08421.08421.08521.09421 06120.970
UnitedKing-dom
(pound)
403.13368.72280 07279 96279 26281.27
280.58281.09281.03
281 14281.29281 45281 81281.85281.82281.76281.29280.08
3.5261
3 52613 52613 52613.52613 52613 52613 5261
43 5261
Ireland(pound)
280.38279 68281.27
280.58281.09281.03
281.14281.29281.45281.81281.85281.82281.76281 29280.08
BritishMalay-
sia(dollar)
42.97332 78832 84932 60132.595
32 59632 64132.635
32 64632 65632 66832.68932 68132 66632 68932 64432.558
Mexico(peso)
18.86012 62011.57011.56411 58811.607
11.62411.62711.626
11.61911.61411.60869,9657.9957.9958.0008 0058.005
Canada(dollar)
Official
100 00097.49190 909
Neth-erlands(guilder)
37.66834 52826 25226.26426 31526.340
26.40026.41026.410
26.40526.40826.40826.41326.41826.42626.41526 39626.364
Free
91 69192.88191 47494 939
102 149101.650
101 762102 266102.754
102 781103 439102 996101.786101 575101 882102 611103 060103.112
NewZealand(pound)
350.48365 07277.28277.19276.49278.48
277.80278.30278.25
278.35278.50278.67279.02279.06279.03278.97278 50277.31
Uruguay7
(peso)
65 83065.83065 83365 83365 833
865.833
65.83365.833
865 833
56 18256.18056 18056 18056 180
856.180
56.18056.180
856 180
42.55342 55342 55342 553
842.553
42.55342.553
842 553
934.217
34.79133.567
832 573
JFor figures on free rate for the period Feb. 25-Oct. 9, 1953, inclusive, see BULLETIN for November 1953, p. 1231. The average for thisperiod was 2.3274. 2Based on quotations beginning Nov. 30, 1953.
3Official rate, based on quotations through Oct. 9, 1953. Effective Oct. 12, 1953, the Brazilian authorities introduced new exchange ratiosfor Brazilian exports. Under the new system premiums of 5 and 10 cruzeiros, depending upon type of merchandise, were added to the formerrate of 5.4466 cents, thus establishing two rates—4.2808 and 3.5261 cents, respectively. For the period Oct. 13-Oct. 30 the averages of thesetwo rates were 4.2808 and 3.5261, respectively.
4Based on quotations through Aug. 13, 1954. 5Based on quotations beginning Apr. 1, 1954.•The Mexican peso was devalued, effective Apr. 19, 1954, from a par value of 8.65 to 12.50 pesos per U. S. dollar.7Rate applied (except free rate) depends upon type of merchandise. In addition to the rates shown, a fifth rate was certified May 8-Dec. 4,
1953, inclusive; the average for this period was 53.1914.•Based on quotations through Dec. 4, 1953. 9Free rate, based on quotations Feb. 10-Dec. 4, 1953, inclusive.NOTE.—For back figures, see Banking and Monetary Statistics, Table 173, pp. 662-682. For description of statistics, see pp. 572-573 in same
publication, and for further information concerning rates and averages for previous years, see BULLETIN for December 1953, p. 1409.
OCTOBER 1954 1135
Digitized for FRASER http://fraser.stlouisfed.org/ Federal Reserve Bank of St. Louis

PRICE MOVEMENTS IN PRINCIPAL COUNTRIESWHOLESALE PRICES—ALL COMMODITIES
[Index numbers]
Year or month
1944194519461947194819491950195119521953
1953—AugustSeptemberOctoberNovemberDecember
1954—JanuaryFebruaryMarchAprilMayJuneJulyAugust
UnitedStates
(1947-49=100)
68697996
10499
103115112110
111111110110110
111111111111111110110111
Canada(1935-39=100)
131132139163193198211240226221
222221220219219
220219219218218218217216
Mexico(1939=
100)
179199229242260285311386400393
395398401396396
396397401411431437437441
UnitedKingdom
(1930=100)
166169175192219230262320328328
327326326328326
326326329330331
P332P333P330
France(1949=
100)
1420345289
100108138145138
137137136137138
138138136137139135
P134P136
Italy(1938=
100)
5,1595,4435,1694,8975,5815,2705,250
5,2705,2465,2375,2225,256
5,2865,3285,3365,295
••5,2925,262
Japan(1934-36average
= 1 )
24
1648
128209246343349354
355357359360361
368369368364358
Nether-lands
(1948=100)
100104117143140134
133133133134134
135136135136137137134
Sweden(1935=
100)
196194186199214216227299317298
296295295297296
296296296297296298
P297
Switzer-land
(Aug. 1939=100)
207205200208217206203227220213
212212212212211
213213214215214215214214
P Preliminary. r Revised.NOTE.—For sources and references concerning changes in the structure of price indexes for various countries, see BULLETIN for December
1952, p. 1356.
WHOLESALE PRICES—GROUPS OF COMMODITIES
[Indexes for groups included in total index above]
Year or month
1944194519461947 . ,194819491950195119521953
1953—AugustSeptemberOctoberNovemberDecember
1954—JanuaryFebruaryMarchAprilMayJuneJulyAugust
United States(1947-49=100)
Farmproducts
697283
1001079398
11310797
9698959494
9898989998959696
Processedfoods
n.a.n.a.n.a.
9810696
100111109105
105107105104104
106105105106107105
'107106
Othercommod-
ities
70717895
103101105116113114
115115115115115
115114114115115114114114
Canada(1935-39=100)
Farmproducts
155165177190230226237269250220
214209209205207
209209207206210210214208
Raw andpartlymanu-
facturedgoods
134136140164196197213238219207
210207205203204
207205204206208207207205
Fully andchieflymanu-
facturedgoods
129130138162192199211242231229
230230229228228
228227227225225225224222
United Kingdom(1930=100)
Foods
158158158165181197221247284307
309307304305302
302305311310310
P311P313P304
Indus-trial
products
170175184207242249286
»364*352
Netherlands(1948=100)
Foods
100101112122129123
119121120122122
127128126127129131118
Indus-trial rawproducts
100108128171166156
155155154153153
1531531541.S3155155154
Indus-trial
finishedproducts
100104116143135132
131132132132132
133133133133133134133
n.a. Not available. P Preliminary. rRevised.NOTE.—For sources and references concerning changes in the structure of price indexes for various countries, see BULLETIN for December
1952, p. 1356.
1136 FEDERAL RESERVE BULLETIN
Digitized for FRASER http://fraser.stlouisfed.org/ Federal Reserve Bank of St. Louis
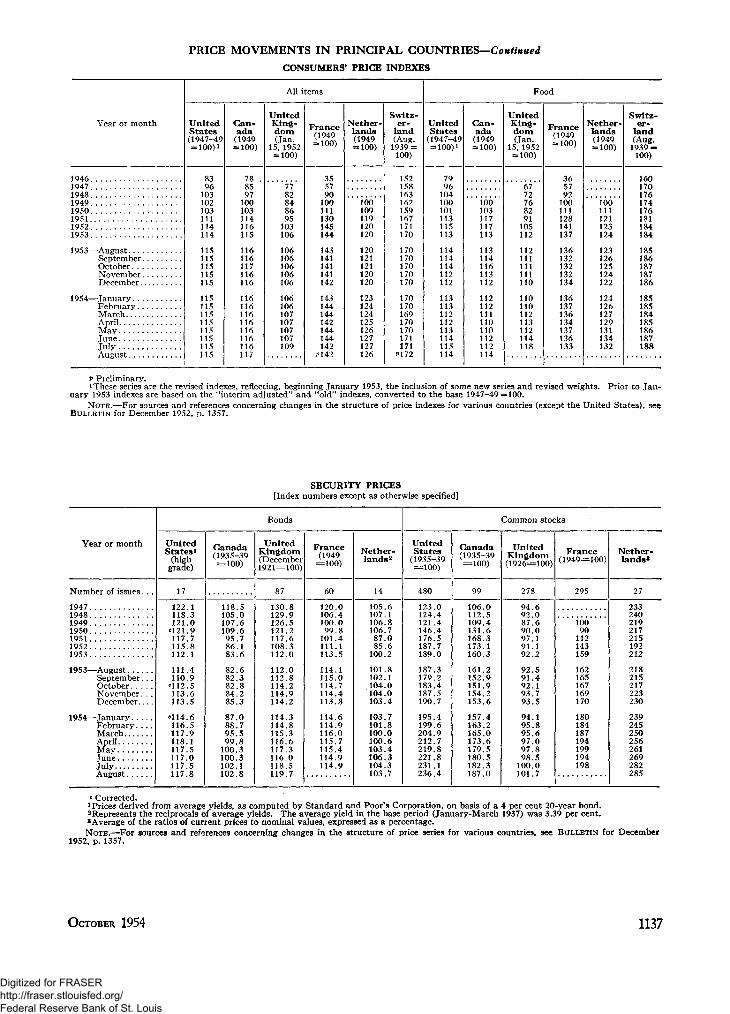
PRICE MOVEMENTS IN PRINCIPAL COUNTRIES—ContinuedCONSUMERS' PRICE INDEXES
Year or month
All items
UnitedStates(1947-49= 100)1
Can-ada(1949= 100)
UnitedKing-dom(Jan.
15, 1952= 100)
France(1949= 100)
Nether-lands(1949= 100)
Switz-er-
land(Aug.
1939 =100)
Food
UnitedStates
(1947-49= 100)1
Can-ada(1949= 100)
UnitedKing-dom(Jan.
15, 1952= 100)
France(1949= 100)
Nether-lands(1949= 100)
Switz-er-
land(Aug.
1939=-100)
19461947194819491950195119521953
1953—AugustSeptemberOctoberNovemberDecember
1954—JanuaryFebruaryMarchAprilMayJuneJulyAugust
8396103102103111114114
115115115115115
115115115115115115115115
788597100103114116115
116116117116116
116116116116116116116117
848695103106
106106106106106
106106107107107107109
355790100111130145144
143141141141142
143144144142144144142
P142
100109119120120
120121121120120
123124124125126127127126
152158163162159167171170
170170170170170
170170169170170171171P172
7996104100101113115113
114114114112112
113113112112113114115114
100103117117113
113114116113112
112112111110110112112114
6772768291105112
112111111111110
110110112113112114118
365792100111128141137
136132132132134
136137136134137136133
100111121123124
123126125124122
124126127129131134132
160170176174176181184184
185186187187186
185185184185186187188
P Preliminary.1 These series are the revised indexes, reflecting, beginning January 1953, the inclusion of some new series and revised weights. Prior to Jan-
uary 1953 indexes are based on the "interim adjusted" and "old" indexes, converted to the base 1947-49=100.
NOTE.—For sources and references concerning changes in the structure of price indexes for various countries (except the United States), seeB U L L E T I N for December 1952, p. 1357.
SECURITY PRICES[Index numbers except as otherwise specified]
Year or month
Number of issues. . .
194719481949 . . .1950195119521953
1953—AugustSeptember. . .OctoberNovember. . .December
1954—JanuaryFebruary.. . .MarchAprilMayJuneJulyAugust
Bonds
UnitedStates^
(highgrade)
17
122.1118.3121.0
'121.9117.7115.8112.1
111.4110.9
C112.5113.6113.5
«114.6116.5117.9118.1117.5117.0117.5117.8
Canada(1935-39=100)
118.5105.0107.6109.695.786.183.6
82.682.382.884.285.3
87.088.795.599.8
100.3100.3102.1102.8
UnitedKingdom(December1921=100)
87
130.8129.9126.5121.2117.6108.3112.0
112.0112.8114.2114.9114.2
114.3114.8115.3116.6117.3116.0118.5119.7
France(1949
=100)
60
120.0106.4100.099.8
101.4111.1113.5
114.1115.0114.7114.4113.8
114.6114.9116.0115.7115.4114.9114.9
Nether-lands2
14
105.6107.1106.8106.787.085.6
100.2
101.8102.1104.0104.0103.4
103.7101.8100.0100.6103.4106.3104.3103.7
Common stocks
UnitedStates
(1935-39=100)
480
123.0124.4121.4146.4176.5187.7189.0
187.3179.2183.4187.5190.7
195.4199.6204.9212.7219.8221.8231.1236.4
Canada(1935-39=100)
99
106.0112.5109.4131.6168.3173.1160.3
161.2152.9151.9154.2153.6
157.4163.2165.0173.6179.5180.5182.3187.0
UnitedKingdom(1926=100)
278
94.692.087.690.097.191.192.2
92.591.492.193.793.5
94.195.895.697.097.898.5
100.0101.7
France(1949=100)
295
10090
112143159
162165167169170
180184187194199194198
Nether-lands3
27
233240219217215192212
218215217223230
239245250256261269282285
e Corrected.1 Prices derived from average yields, as computed by Standard and Poor's Corporation, on basis of a 4 per cent 20-year bond.2Represents the reciprocals of average yields. The average yield in the base period (January-March 1937) was 3.39 per cent.3Average of the ratios of current prices to nominal values, expressed as a percentage.NOTE.—For sources and references concerning changes in the structure of price series for various countries, see BULLETIN for December
1952, p. 1357.
OCTOBER 1954 1137
Digitized for FRASER http://fraser.stlouisfed.org/ Federal Reserve Bank of St. Louis

BOARD OF GOVERNORSOF THE FEDERAL RESERVE SYSTEM
W M . MCC. MARTIN, JR., Chairman
M. S. SZYMCZAK A. L. MILLS, JR. PAUL E. MILLER
JAMES K. VARDAMAN, JR. J. L. ROBERTSON C. CANBY BALDERSTON
ELLIOTT THURSTON, Assistant to the BoardWOODLIEF THOMAS, Economic Adviser to the Board
WINFIELD W. RIEFLER, Assistant to the ChairmanALFRED K. CHERRY, Legislative Counsel
OFFICE OF THE SECRETARYS. R. CARPENTER, SecretaryMERRITT SHERMAN, Assistant SecretaryKENNETH A. KENYON, Assistant Secretary
LEGAL DIVISIONGEORGE B. VEST, General CounselFREDERIC SOLOMON, Assistant General CounselHOWARD H. HACKLEY, Assistant General CounselDAVID B. HEXTER, Assistant General CounselG. HOWLAND CHASE, Assistant General Counsel
DIVISION OF RESEARCH AND STATISTICSRALPH A. YOUNG, Director
FRANK R. GARFIELD, Adviser on Economic ResearchKENNETH B. WILLIAMS, Assistant DirectorSUSAN S. BURR, Assistant DirectorGUY E. NOYES, Assistant DirectorC. RICHARD YOUNGDAHL, Assistant Director
DIVISION OF INTERNATIONAL FINANCEARTHUR W. MARGET, DirectorLEWIS N. DEMBITZ, Assistant Director
DIVISION OF EXAMINATIONSGEORGE S. SLOAN, DirectorC. C. HOSTRUP, Assistant DirectorFRED A. NELSON, Assistant DirectorARTHUR H. LANG, Chief Federal Reserve ExaminerROBERT C. MASTERS, Assistant DirectorGLENN M. GOODMAN, Assistant DirectorHENRY BENNER, Assistant Director
DIVISION OF BANK OPERATIONSROBERT F. LEONARD, DirectorJ. E. HORBETT, Assistant DirectorLOWELL MYRICK, Assistant Director
DIVISION OF PERSONNEL ADMINISTRATIONH. FRANKLIN SPRECHER, JR., Assistant Director
DIVISION OF ADMINISTRATIVE SERVICESLISTON P. BETHEA, DirectorJOSEPH E. KELLEHER, Assistant Director
OFFICE OF DEFENSE LOANSGARDNER L. BOOTHE, II, Administrator
OFFICE OF THE CONTROLLEREDWIN J. JOHNSON, Controller
Special Assistants to the Board—CHARLES MOLONY AND CLARKE L. FAUVER
FEDERAL OPENMARKET COMMITTEE
W M . MCC. MARTIN, JR., ChairmanALLAN SPROUL, Vice Chairman
C. CANBY BALDERSTON J. L. ROBERTSON
MALCOLM BRYAN M. S. SZYMCZAK
H. G. LEEDY JAMES K. VARDAMAN, JR.
PAUL E. MILLER ALFRED H. WILLIAMS
A. L. MILLS, JR. C. S. YOUNG
FEDERALADVISORY COUNCIL
WINFIELD W. RIEFLER, SecretaryELLIOTT THURSTON, Assistant SecretaryGEORGE B. VEST, General CounselFREDERIC SOLOMON, Assistant General CounselWOODLIEF THOMAS, EconomistKARL R. BOPP, Associate EconomistGEORGE W. MITCHELL, Associate EconomistEARLE L. RAUBER, Associate EconomistH. V. ROELSE, Associate EconomistCLARENCE W. TOW, Associate EconomistRALPH A. YOUNG, Associate EconomistROBERT G. ROUSE, Manager of System Open
Market Account
WILLIAM D. IRELAND,
HENRY C. ALEXANDER,
GEOFFREY S. SMITH,
GEORGE GUND,
ROBERT V. FLEMING,
Vice President
WALLACE M. DAVIS,
EDWARD E. BROWN,
President
W. W. CAMPBELL,
JOSEPH F. RINGLAND,
CHARLES J. CHANDLER,
GEO. G. MATKIN,
JOHN M. WALLACE,
BOSTON DISTRICT
N E W YORK DISTRICT
PHILADELPHIA DISTRICT
CLEVELAND DISTRICT
RICHMOND DISTRICT
ATLANTA DISTRICT
CHICAGO DISTRICT
ST. LOUIS DISTRICT
MINNEAPOLIS DISTRICT
KANSAS CITY DISTRICT
DALLAS DISTRICT
SAN FRANCISCO DISTRICT
HERBERT V. PROCHNOW, Secretary
1138 FEDERAL RESERVE BULLETIN
Digitized for FRASER http://fraser.stlouisfed.org/ Federal Reserve Bank of St. Louis
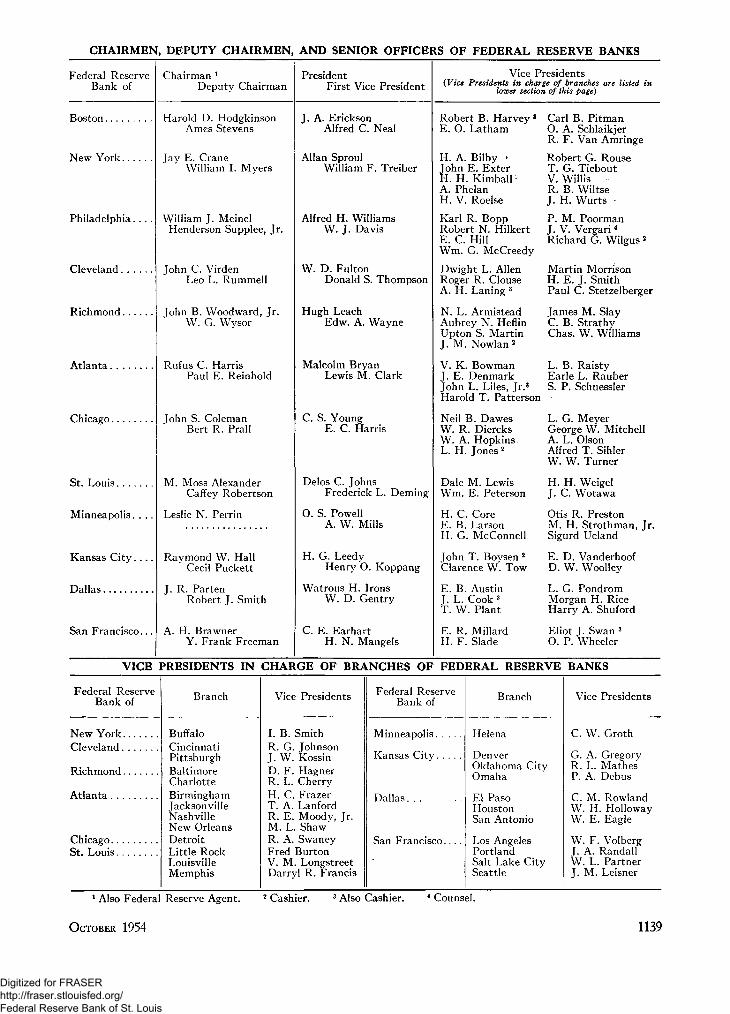
CHAIRMEN, DEPUTY CHAIRMEN, AND SENIOR OFFICERS OF FEDERAL RESERVE BANKS
Federal ReserveBank of
Chairman 1
Deputy ChairmanPresident
First Vice PresidentVice Presidents
(Vice Presidents in charge of branches are listed inlower section of this page)
Boston.
New York
Philadelphia. . .
Cleveland.
Richmond.
Atlanta.
Chicago.
St. Louis
Minneapolis. . .
Kansas City. . .
Dallas
Harold D. HodgkinsonAmes Stevens
Jay E. CraneWilliam I. Myers
William J. MeinelHenderson Supplee, Jr.
John C. VirdenLeo L. Rummell
John B. Woodward, Jr.W. G. Wysor
Rufus C. HarrisPaul E. Reinhold
John S. ColemanBert R. Prall
M. Moss AlexanderCaffey Robertson
Leslie N. Perrin
San Francisco..,
Raymond W. HallCecil Puckett
J. R. PartenRobert J. Smith
A. H. BrawnerY. Frank Freeman
J. A. EricksonAlfred C. Neal
Allan SproulWilliam F. Treiber
Alfred H. WilliamsW. J. Davis
W. D. FultonDonald S. Thompson
Hugh LeachEdw. A. Wayne
Malcolm BryanLewis M. Clark
C. S. YoungE. C. Ha
Delos C. JohnsFrederick L. Deming
O. S. PowellA. W. Mills
H. G. LeedyHenry O. Koppang
Watrous H. IronsW. D. Gentry
C. E. EarhartH. N. Mangels
Robert B. Harvey 3
E. O. Latham
H. A. Bilby *John E. ExterH. H. Kimball -A. PhelanH. V. Roelse
Karl R. BoppRobert N. HilkertE. C. HillWm. G. McCreedy
Dwight L. AllenRoger R. ClouseA. H. Laning 3
N. L. ArmisteadAubrey N. HeflinUpton S. MartinJ. M. Nowlan 2
Carl B. PitmanO. A. SchlaikjerR. F. Van Amringe
Robert G. RouseT. G. TieboutV. Willis *R. B. WiltseJ. H. Wurts -
P. M. PoormanJ. V. Vergari4
Richard G. Wilgus 2
Martin MorrisonH. E. J. SmithPaul C. Stetzelberger
James M. SlayC. B. StrathyChas. W. Williams
V. K. Bowman L. B. RaistyJ. E. Denmark Earle L. RauberJohn L. Liles, Jr.3 S. P. SchuesslerHarold T. Patterson .
Neil B. DawesW. R. DiercksW. A. HopkinsL. H. Jones 2
Dale M. LewisWm. E. Peterson
H. C. CoreE. B. LarsonH. G. McConnell
John T. Boysen 2
Clarence W. Tow
E. B. AustinI. L. Cook 3
T. W. Plant
E. R. MillardH. F. Slade
L. G. MeyerGeorge W. MitchellA. L. OlsonAlfred T. SihlerW. W. Turner
H. H. WeigelJ. C. Wotawa
Otis R. PrestonM. H. Strothman, Jr.Sigurd Ueland
E. D. VanderhoofD. W. Woolley
L. G. PondromMorgan H. RiceHarry A. Shuford
Eliot J. Swan 3
O. P. Wheeler
VICE PRESIDENTS IN CHARGE OF BRANCHES OF FEDERAL RESERVE BANKS
Federal ReserveBank of
New YorkCleveland
Richmond
Atlanta
ChicagoSt. Louis
Branch
BuffaloCincinnatiPittsburghBaltimoreCharlotteBirminghamJacksonvilleNashvilleNew OrleansDetroitLittle RockLouisvilleMemphis
Vice Presidents
I. B. SmithR. G. JohnsonJ. W. KossinD. F. HagnerR. L. CherryH. C. FrazerT. A. LanfordR. E. Moody, Jr.M. L. ShawR. A. SwaneyFred BurtonV. M. LongstreetDarryl R. Francis
Federal ReserveBank of
Minneapolis
Kansas City
Dallas
San Francisco....
Branch
Helena
DenverOklahoma CityOmaha
El PasoHoustonSan Antonio
Los AngelesPortlandSalt Lake CitySeattle
Vice Presidents
C. W. Groth
G. A. GregoryR. L. MathesP. A. Debus
C. M. RowlandW. H. HollowayW. E. Eagle
W. F. VolbergJ. A. RandallW. L. PartnerJ. M. Leisner
1 Also Federal Reserve Agent. 2 Cashier. 3 Also Cashier. 1 Counsel.
OCTOBER 1954 1139
Digitized for FRASER http://fraser.stlouisfed.org/ Federal Reserve Bank of St. Louis

FEDERAL RESERVE BOARD PUBLICATIONS
The material listed below may be obtained fromthe Division of Administrative Services, Board ofGovernors of the Federal Reserve System, Wash-ington 25, D. C. Where a charge is indicated,remittance should be made payable to the orderof the Board of Governors of the Federal ReserveSystem.
THE FEDERAL RESERVE SYSTEM—PURPOSES AND
FUNCTIONS. Revised edition. July 1954. 224pages.
ANNUAL REPORT of the Board of Governors of theFederal Reserve System. Issued each year.
FEDERAL RESERVE BULLETIN. Issued monthly. Sub-scription price in the United States and its pos-sessions, Bolivia, Canada, Chile, Colombia, CostaRica, Cuba, Dominican Republic, Ecuador,Guatemala, Haiti, Republic of Honduras, Mexico,Nicaragua, Panama, Paraguay, Peru, El Salvador,Uruguay, and Venezuela is $2.00 per annum or20 cents per copy; elsewhere $2.60 per annum or25 cents per copy. Group subscriptions in theUnited States for 10 or more copies to one ad-dress, 15 cents per copy per month, or $1.50for 12 months.
FEDERAL RESERVE CHARTS ON BANK CREDIT, MONEYRATES, AND BUSINESS. Issued monthly. $6.00per annum including edition of historical supple-ment (listed below) available when subscriptionis entered or renewed. 60 cents per copy; inquantities of 10 or more copies of a particularissue for single shipment, 50 cents each. (Do-mestic rates)
HISTORICAL SUPPLEMENT TO FEDERAL RESERVE
CHARTS ON BANK CREDIT, MONEY RATES, ANDBUSINESS. Issued annually in September. Annual
aA more complete list, including periodic releases andreprints, appeared on pp. 676-79 of the June 1954 BULLETIN.
subscription to monthly chart book includes oneissue of supplement. Single copies, 60 cents each;in quantities of 10 or more copies for singleshipment, 50 cents each. (Domestic rates)
BANKING AND MONETARY STATISTICS. Statistics ofbanking, monetary, and other financial develop-ments. November 1943. 979 pages. $1.50 percopy. No charge for individual sections (un-bound).
A STATISTICAL STUDY OF REGULATION V LOANS.September 1950. 74 pages. 25 cents per copy;in quantities of 10 or more copies for singleshipment, 15 cents each.
THE DEVELOPMENT OF BANK DEBITS AND CLEAR-
INGS AND THEIR USE IN ECONOMIC ANALYSIS.
January 1952. 175 pages. 25 cents per copy; inquantities of 10 or more copies for single ship-ment, 15 cents each.
THE FEDERAL RESERVE ACT, as amended to Novem-ber 1, 1946, with an Appendix containing pro-visions of certain other statutes affecting theFederal Reserve System. 372 pages. 50 cents perpaper-bound copy; $1.00 per cloth-bound copy.
COMPILATION OF FEDERAL AND STATE LAWS RELAT-ING TO BRANCH BANKING WITHIN THE UNITEDSTATES. (July 1, 1951.) December 1951. 33pages.
RULES OF ORGANIZATION AND RULES OF PROCEDURE—Board of Governors of the Federal ReserveSystem (with Amendments). September 1946.31 pages.
REGULATIONS OF THE BOARD OF GOVERNORS OF THE
FEDERAL RESERVE SYSTEM. Individual regulationswith amendments and supplements thereto.
1140 FEDERAL RESERVE BULLETIN
Digitized for FRASER http://fraser.stlouisfed.org/ Federal Reserve Bank of St. Louis

FEDERAL RESERVE BOARD PUBLICATIONS
REPRINTS(From Federal Reserve Bulletin unless preceded by an asterisk.)
CHANGES IN INSTALMENT CREDIT TERMS. May 1952.
6 pages.
EXCESS PROFITS TAXES OF COMMERCIAL BANKS.
June 1952. 18 pages.
REAL ESTATE LOANS OF REGISTRANTS UNDER REGU-
LATION X. June 1952. 18 pages.
PROBLEMS OF TRADE EQUILIBRIUM. October 1952.
9 pages.
REVISED SERIES ON DEPARTMENT STORE SALES,
STOCKS, AND ORDERS. October 1952. 5 pages.
RECENT CREDIT EXPANSION. December 1952. 7
pages.
CREDIT AND MONETARY REVIEW FOR 1952. February
1953. 7 pages.
T H E MONETARY SYSTEM OF THE UNITED STATES.
February 1953. 16 pages.
INFLUENCE OF CREDIT AND MONETARY MEASURES ON
ECONOMIC STABILITY. March 1953. 16 pages.
FEDERAL FINANCIAL MEASURES FOR ECONOMIC STA-
BILITY. May 1953. 7 pages.
REVISION OF CONSUMER CREDIT STATISTICS. April
1953. 19 pages.
^DETAILED DESCRIPTION OF SOURCES AND METHODS
USED IN REVISION OF SHORT- AND INTERMEDIATE-
TERM CONSUMER CREDIT STATISTICS (supplemen-
tary details for item listed above), April 1953.25 pages.
T H E TRANSITION TO FREE MARKETS. April 1953.
6 pages.
FEDERAL RESERVE BANK RESPONSIBILITIES. May
1953. 5 pages.
UNITED STATES POSTWAR INVESTMENT IN LATIN
AMERICA. May 1953. 6 pages.
WARTIME AND POSTWAR CREDIT DEMANDS OF LARGE
CORPORATIONS. July 1953. 12 pages.
REVISED INDEXES OF DEPARTMENT STORE SALES AND
STOCKS, BY MAJOR DEPARTMENTS. November
1953. 65 pages.
FEDERAL RESERVE MONTHLY INDEX OF INDUSTRIAL
PRODUCTION, 1953 Revision. December 1953. %pages.
EXTENSIONS AND REPAYMENTS OF CONSUMER IN-
STALMENT CREDIT. January 1954. 14 pages.
BANK CREDIT AND MONEY IN 1953. February 1954.
6 pages.
INTERNATIONAL GOLD AND DOLLAR MOVEMENTS.
March 1954. 9 pages. (Also, similar article fromMarch 1953 BULLETIN.)
1954 SURVEY OF CONSUMER FINANCES—PRELIMINARY
FINDINGS OF THE 1954 SURVEY OF CONSUMER
FINANCES. March 1954. 4 pages. PURCHASES OFDURABLE GOODS AND HOUSES IN 1953. June 1954.
17 pages. T H E FINANCIAL POSITION AND COM-
MITMENTS OF CONSUMERS. July 1954. 20 pages.Also, similar surveys for earlier years from 1946,1947, 1948, 1949, 1950, 1951, 1952, and 1953BULLETINS.)
N E W INDEXES OF OUTPUT OF CONSUMER DURABLE
GOODS. May 1954. 15 pages. (Also, similar re-print from October 1951 BULLETIN.)
ESTIMATED LIQUID ASSET HOLDINGS OF INDIVIDUALS
AND BUSINESSES. July 1954. 2 pages. (Also,similar article from July 1953 BULLETIN.)
MONETARY AND CREDIT DEVELOPMENTS SINCE MID-
1953 . July 1954. 8 pages.
FINANCING OF LARGE CORPORATIONS IN 1953. August
1954. 9 pages.
T H E BALANCE SHEET OF AGRICULTURE, 1954. August
1954. 13 pages.
T H E PRIVATE DEMAND FOR GOLD, 1931-53. Sep-
tember 1954. 10 pages.
WORLD TRADE AND PRODUCTION IN 1953-54. October
1954. 8 pages.
RECENT FINANCIAL CHANGES IN WESTERN GER-
MANY. October 1954. 10 pages.
OCTOBER 1954 1141
Digitized for FRASER http://fraser.stlouisfed.org/ Federal Reserve Bank of St. Louis
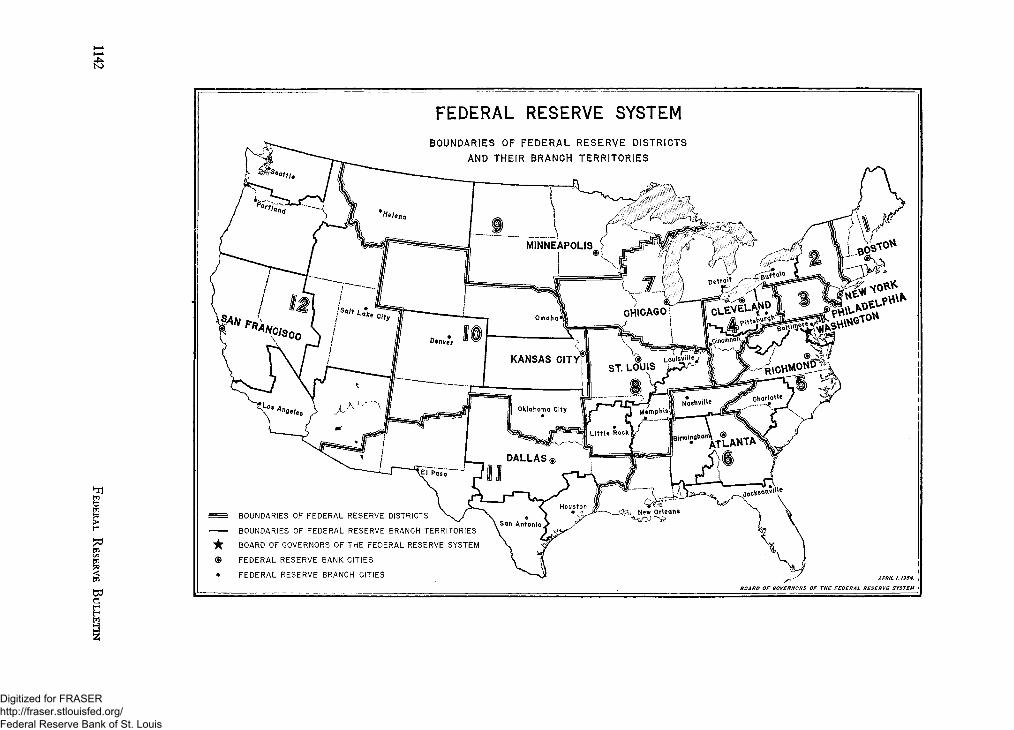
FEDERAL RESERVE SYSTEM
BOUNDARIES OF FEDERAL RESERVE DISTRICTSAND THEIR BRANCH TERRITORIES
jwwJ0
= = BOUNDARIES OF FEDERAL RESERVE DISTRICTS
BOUNDARIES OF FEDERAL RESERVE BRANCH TERRITORIES
if BOARD OF GOVERNORS OF THE FEDERAL RESERVE SYSTEM
<S> FEDERAL RESERVE BANK CITIES
• FEDERAL RESERVE BRANCH CITIES
Digitized for FRASER http://fraser.stlouisfed.org/ Federal Reserve Bank of St. Louis


![Monthly Monetary Trends [St. Louis Fed]](https://img.pdfslide.us/doc/110x75/577d21cc1a28ab4e1e95e8c6/monthly-monetary-trends-st-louis-fed.jpg)