Embed Size (px)
Citation preview

RESEARCH ARTICLE
Coordinating Role of RXRα in DownregulatingHepatic Detoxification during InflammationRevealed by Fuzzy-Logic ModelingRoland Keller1☯, Marcus Klein2,3☯, Maria Thomas2,3, Andreas Dräger1,4, Ute Metzger5,Markus F. Templin5, Thomas O. Joos5, Wolfgang E. Thasler6, Andreas Zell1, UlrichM. Zanger2,3*
1 Center for Bioinformatics Tuebingen (ZBIT), University of Tuebingen, Tuebingen, Germany, 2 Dr.Margarete Fischer Bosch-Institute of Clinical Pharmacology, Stuttgart, 3 University of Tuebingen,Tuebingen, Germany, 4 Systems Biology Research Group, University of California, San Diego, La Jolla,California, United States of America, 5 NMI Institute of Natural and Medical Sciences, Reutlingen, Germany,6 Department of General, Visceral, Transplantation, Vascular and Thoracic Surgery, Hospital of theUniversity of Munich, Munich, Germany
☯ These authors contributed equally to this work.* [email protected]
AbstractDuring various inflammatory processes circulating cytokines including IL-6, IL-1β, and
TNFα elicit a broad and clinically relevant impairment of hepatic detoxification that is based
on the simultaneous downregulation of many drug metabolizing enzymes and transporter
genes. To address the question whether a common mechanism is involved we treated
human primary hepatocytes with IL-6, the major mediator of the acute phase response in
liver, and characterized acute phase and detoxification responses in quantitative gene
expression and (phospho-)proteomics data sets. Selective inhibitors were used to disentan-
gle the roles of JAK/STAT, MAPK, and PI3K signaling pathways. A prior knowledge-based
fuzzy logic model comprising signal transduction and gene regulation was established and
trained with perturbation-derived gene expression data from five hepatocyte donors. Our
model suggests a greater role of MAPK/PI3K compared to JAK/STAT with the orphan
nuclear receptor RXRα playing a central role in mediating transcriptional downregulation.
Validation experiments revealed a striking similarity of RXRα gene silencing versus IL-6
induced negative gene regulation (rs = 0.79; P<0.0001). These results concur with RXRα
functioning as obligatory heterodimerization partner for several nuclear receptors that regu-
late drug and lipid metabolism.
Author Summary
During inflammation, circulating proinflammatory cytokines such as TNFα, IL-1ß, andIL-6, which are produced by, e.g., Kupffer cells, macrophages, or tumor cells, play impor-tant roles in hepatocellular signaling pathways and in the regulation of cellular homeosta-sis. In particular, these cytokines are responsible for the acute phase response (APR) but
PLOS Computational Biology | DOI:10.1371/journal.pcbi.1004431 January 4, 2016 1 / 20
OPEN ACCESS
Citation: Keller R, Klein M, Thomas M, Dräger A,Metzger U, Templin MF, et al. (2016) CoordinatingRole of RXRα in Downregulating HepaticDetoxification during Inflammation Revealed byFuzzy-Logic Modeling. PLoS Comput Biol 12(1):e1004431. doi:10.1371/journal.pcbi.1004431
Editor: Grégoire Altan-Bonnet, Memorial Sloan-Kettering Cancer Center, UNITED STATES
Received: December 23, 2014
Accepted: July 5, 2015
Published: January 4, 2016
Copyright: © 2015 Keller et al. This is an openaccess article distributed under the terms of theCreative Commons Attribution License, which permitsunrestricted use, distribution, and reproduction in anymedium, provided the original author and source arecredited.
Data Availability Statement: Data are available viathe SEEK server of the Virtual Liver Network: http://seek.virtual-liver.de/data_files/3399
Funding: This work was funded by the FederalMinistry of Education and Research (BMBF,Germany) as part of the Virtual Liver Network (grantnumbers 0315756 to AZ; 0315755 to UMZ; 0315742to TJ and 0315759 to WET), by the Robert BoschFoundation, Stuttgart, Germany, and by a Marie CurieInternational Outgoing Fellowship within the EU 7thFramework Program for Research and TechnologicalDevelopment (project AMBiCon, 332020, to AD). The

also for a dramatic reduction of drug detoxification capacity due to impaired expression ofnumerous genes coding for drug metabolic enzymes and transporters. Here we used high-throughput (phospho-)proteomic and gene expression data to investigate the impact ofcanonical signaling pathways in mediating IL-6-induced downregulation of drug metabo-lism related genes. We performed chemical inhibition perturbations to show that most ofthe IL-6 effects on gene expression are mediated through the MAPK and PI3K/AKT path-ways. We constructed a prior knowledge network as basis for a fuzzy logic model that wastrained with extensive gene expression data to identify critical regulatory nodes. Ourresults suggest that the nuclear receptor RXRα plays a central role, which was convincinglyvalidated by RXRα gene silencing experiments. This work shows how computationalmodeling can support identifying decisive regulatory events from large-scale experimentaldata.
IntroductionIn a variety of acute and chronic illnesses, including bacterial or viral infection, tissue injury,many chronic diseases and most cancers, proinflammatory cytokines such as interleukin (IL)6, IL-1β, and TNFα evoke a major reorganization of hepatic gene expression resulting in themassive synthesis of acute phase proteins such as C-reactive protein (CRP) [1]. It has longbeen known that under such conditions the drug metabolism capacity and other hepatic func-tions can be impaired, largely due to strong and broad downregulation of most drug metaboliz-ing enzymes and transporters (DMET) at the transcriptional level [2–4]. As 60 to 80% of allused drugs are extensively metabolized in the liver [5], these changes may lead to unrecognizeddrug overdosing and adverse events especially for drugs with narrow therapeutic index, includ-ing many cardiovascular, anti-cancer and central nervous system drugs [6–9]. DMET genes areregulated at the constitutive level by hepatic nuclear factors (HNF) such as HNF-1α, HNF-4α,and CCAAT-enhancer binding proteins (C/EBPs) [10,11], while inducible expression involvesseveral ligand-activated receptors including the aryl hydrocarbon receptor (AhR), the constitu-tive androstane receptor (CAR), the pregnane X receptor (PXR), the peroxisome proliferator-activated receptor-α (PPARα) and others, which function as pleiotropic sensors for a largevariety of endogenous and xenobiotic compounds [12,13]. The potential involvement of severalof these transcription factors in the downregulation of DMETs by proinflammatory cytokineshas been suggested in numerous reports on both mouse and human model systems [14–18].Taken together, current evidence indicates that the downregulation of hepatic DMET genes byproinflammatory cytokines involves intense crosstalk between signaling components and thetranscriptional machinery, potentially involving several and overlapping receptor-dependentmechanisms. Some authors also suggested coordinated mechanisms, e.g. involving the majorhepatic retinoid X receptor, RXRα, which is required as a heterodimerization partner for sev-eral nuclear receptors including CAR, FXR, LXR, PPAR, PXR, and VDR [19,20].
Further upstream, the signaling pathways involved in DMET regulation also remainedlargely unclear. IL-6 is known to activate janus kinase/ signal transductors and activators oftranscription (JAK/STAT), mitogen activated protein kinase/ extracellular regulated kinase(MAPK/ERK), and phosphoinositide 3 kinase (PI3K)/AKT pathways [21,22]. Earlier work hasshown that downregulation of the major human drug metabolizing cytochrome P450,CYP3A4, in response to IL-6 occurs independently of the JAK/STAT pathway [14], although itremained unknown whether this also applies to other DMET genes. On the other hand there isevidence that MAPKs are able to phosphorylate nuclear receptors, which may lead to their
Fuzzy-Logic Modeling of Hepatocyte IL-6 Response
PLOS Computational Biology | DOI:10.1371/journal.pcbi.1004431 January 4, 2016 2 / 20
funders had no role in study design, data collectionand analysis, decision to publish, or preparation ofthe manuscript.
Competing Interests: The authors have declaredthat no competing interests exist.

subcellular relocalization [19,23], and PI3K/AKT may induce nuclear translocation of NF-κB,which has been shown to antagonize nuclear receptor function by mutual repression as well asby direct binding of NF-κB to DMET promoter regions [24].
To enhance understanding of the complex interactions within signaling pathways and tran-scriptional networks, different kinds of systems biology modeling techniques have beenincreasingly employed [25–30]. The most prominent types of logical models are Boolean mod-els, which permit individual components to be only in active or inactive state, thus allowingonly a qualitative description of the input-output behavior of signaling pathways. While verylarge Boolean models can be constructed, they are often not adequate for describing biologicalreality. By contrast, logic-based ordinary differential equation (ODE) modeling enables a morequantitative simulation of signaling dynamics over time [27]. However, the requirement forextensive time-resolved experimental data as well as prior knowledge about the involved sig-naling mechanisms limits application of ODE modeling to small networks. An intermediatealternative is provided by “fuzzy logic”, a highly flexible methodology that enables system com-ponent states to be in a continuous interval. Recent studies have shown that fuzzy logic can beapplied to complex biological problems. Some studies established the use of fuzzy logic toconvert prior (e.g., literature-based) knowledge networks to computable models that can betrained to multi-factorial experimental data in order to understand complex signaling path-ways [28–30].
Here we used primary human hepatocytes (PHH) stimulated by IL-6, the most potent medi-ator of the acute phase response in liver, to characterize cellular responses in high-throughputquantitative gene expression and (phospho-)proteomics data sets. Using a previously devel-oped large-scale Boolean model of IL-1 and IL-6 signaling [22] and extensive literature surveywe constructed a fuzzy logic model comprising IL-6 signal transduction and DMET gene regu-lation. Selective inhibitors used in perturbation experiments to disentangle JAK/STAT, MAPK,and PI3K signaling pathways generated the necessary data for model training. Our approachsuggests a major role of MAPK and PI3K pathways with the orphan nuclear receptor RXRα ata central position as link between inflammatory signaling and downregulation of drug detoxifi-cation genes. We finally validated these findings by RXRα knock-down experiments. Thisstudy emphasizes fuzzy logic modeling as a useful alternative to elucidate complex signalinginteractions.
Results
Construction of a prior knowledge networkWe first constructed a prior knowledge network (PKN) comprising IL-6 signal transductionand downstream gene regulation (S1 Fig). The core of the signal transduction part of the net-work was taken from the Boolean model by Ryll and colleagues [22], which comprises severalsignaling pathways. As we were primarily interested in identifying logical nodes and not indynamic features, we did not attempt to include a time scale. This allowed us to simplify themodel by removing feedback loops, including those involving SOCS1 and SOCS3, without neg-atively impacting our model, because feedback loops by definition require a time scale. Further-more, we deleted several input and output nodes not relevant for our study. The AND, OR,and NOT gates of the remaining network were transformed into activating or inhibiting transi-tions from the respective input species of the gate to the output species. All changes introducedto the model by Ryll et al. are summarized in S1 Text.
The IL-6 signal transduction module of the PKN was supplemented with a gene regulationmodule by compiling biological knowledge from various cell types as provided by databasesand scientific literature, including e.g., BIOBASE TRANSFAC and Pubmed (S2 Text). The
Fuzzy-Logic Modeling of Hepatocyte IL-6 Response
PLOS Computational Biology | DOI:10.1371/journal.pcbi.1004431 January 4, 2016 3 / 20
resulting network contained all DMET genes including their transcriptional regulators STAT3,NF-κB, AhR, HNF-1α, HNF-4α, ELK1, glucocorticoid receptor, and cFOS, as well as a speciesRXR/NR, which represents the complexes between RXRα and any of the nuclear receptorsknown to be a potential partner of RXRα.
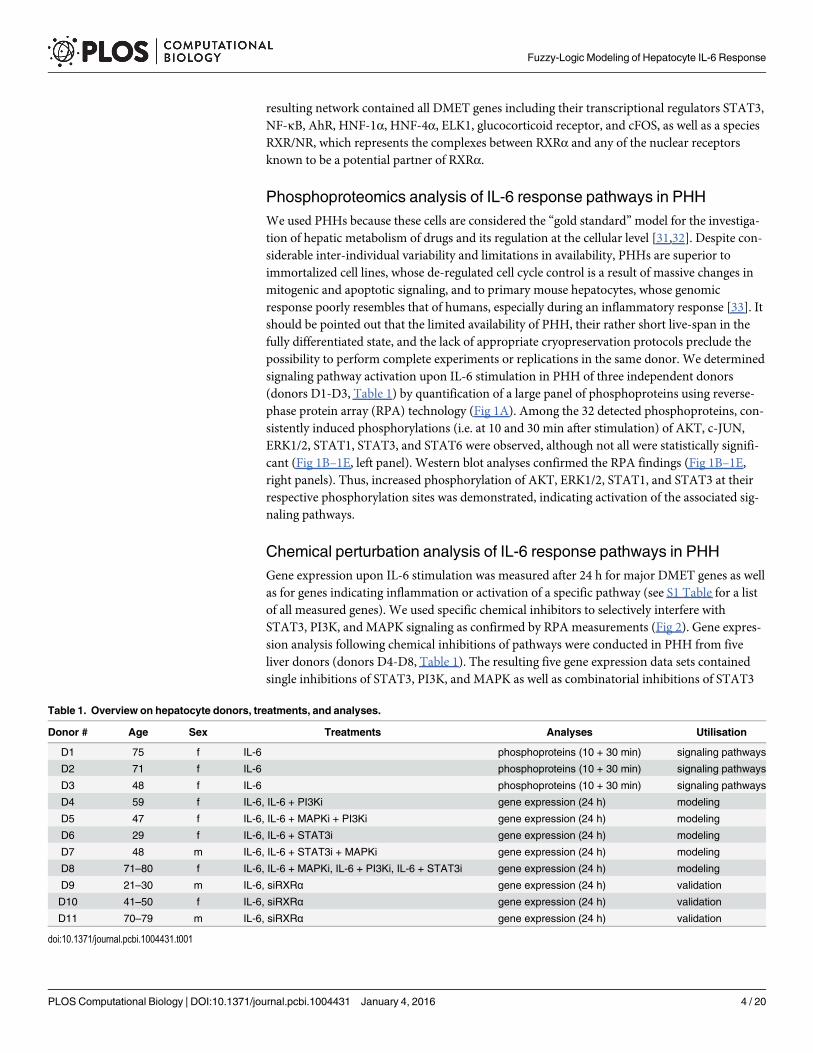
Phosphoproteomics analysis of IL-6 response pathways in PHHWe used PHHs because these cells are considered the “gold standard”model for the investiga-tion of hepatic metabolism of drugs and its regulation at the cellular level [31,32]. Despite con-siderable inter-individual variability and limitations in availability, PHHs are superior toimmortalized cell lines, whose de-regulated cell cycle control is a result of massive changes inmitogenic and apoptotic signaling, and to primary mouse hepatocytes, whose genomicresponse poorly resembles that of humans, especially during an inflammatory response [33]. Itshould be pointed out that the limited availability of PHH, their rather short live-span in thefully differentiated state, and the lack of appropriate cryopreservation protocols preclude thepossibility to perform complete experiments or replications in the same donor. We determinedsignaling pathway activation upon IL-6 stimulation in PHH of three independent donors(donors D1-D3, Table 1) by quantification of a large panel of phosphoproteins using reverse-phase protein array (RPA) technology (Fig 1A). Among the 32 detected phosphoproteins, con-sistently induced phosphorylations (i.e. at 10 and 30 min after stimulation) of AKT, c-JUN,ERK1/2, STAT1, STAT3, and STAT6 were observed, although not all were statistically signifi-cant (Fig 1B–1E, left panel). Western blot analyses confirmed the RPA findings (Fig 1B–1E,right panels). Thus, increased phosphorylation of AKT, ERK1/2, STAT1, and STAT3 at theirrespective phosphorylation sites was demonstrated, indicating activation of the associated sig-naling pathways.
Chemical perturbation analysis of IL-6 response pathways in PHHGene expression upon IL-6 stimulation was measured after 24 h for major DMET genes as wellas for genes indicating inflammation or activation of a specific pathway (see S1 Table for a listof all measured genes). We used specific chemical inhibitors to selectively interfere withSTAT3, PI3K, and MAPK signaling as confirmed by RPA measurements (Fig 2). Gene expres-sion analysis following chemical inhibitions of pathways were conducted in PHH from fiveliver donors (donors D4-D8, Table 1). The resulting five gene expression data sets containedsingle inhibitions of STAT3, PI3K, and MAPK as well as combinatorial inhibitions of STAT3
Table 1. Overview on hepatocyte donors, treatments, and analyses.
Donor # Age Sex Treatments Analyses Utilisation
D1 75 f IL-6 phosphoproteins (10 + 30 min) signaling pathways
D2 71 f IL-6 phosphoproteins (10 + 30 min) signaling pathways
D3 48 f IL-6 phosphoproteins (10 + 30 min) signaling pathways
D4 59 f IL-6, IL-6 + PI3Ki gene expression (24 h) modeling
D5 47 f IL-6, IL-6 + MAPKi + PI3Ki gene expression (24 h) modeling
D6 29 f IL-6, IL-6 + STAT3i gene expression (24 h) modeling
D7 48 m IL-6, IL-6 + STAT3i + MAPKi gene expression (24 h) modeling
D8 71–80 f IL-6, IL-6 + MAPKi, IL-6 + PI3Ki, IL-6 + STAT3i gene expression (24 h) modeling
D9 21–30 m IL-6, siRXRα gene expression (24 h) validation
D10 41–50 f IL-6, siRXRα gene expression (24 h) validation
D11 70–79 m IL-6, siRXRα gene expression (24 h) validation
doi:10.1371/journal.pcbi.1004431.t001
Fuzzy-Logic Modeling of Hepatocyte IL-6 Response
PLOS Computational Biology | DOI:10.1371/journal.pcbi.1004431 January 4, 2016 4 / 20

Fig 1. Phosphoprotein activation upon IL-6 stimulation in PHH. (A) Heat map showingmean changes (IL-6 vs. control) in levels of 32phosphoproteins at two time points from three independent PHH donors. Phosphoproteins were detected by RPA with phosphospecific antibodiesdirected at the indicated phosphorylation sites. Red color represents positive and blue color negative log2FC (color code provided). Asterisks indicatestatistical significance (P<0.05). (B-E, left panel) Bar charts showing means ± SD (n = 3) of relative fluorescent intensities (RFIs) of selected phosphoproteinsat different time points after IL-6 stimulation. RFIs were obtained from the RPA and background-normalized. Error bars represent standard deviationscalculated from replicates of three donors (not available in E) and asterisks indicate statistical significance (P<0.05). (B-E, right panel) Western blots of totalcell lysate (20 µg each) of selected phosphoproteins from control (Ctrl.) and IL-6 treated cells. β-Actin staining served as loading control. Detection wasperformed with an Odyssey infrared imaging system.
doi:10.1371/journal.pcbi.1004431.g001
Fuzzy-Logic Modeling of Hepatocyte IL-6 Response
PLOS Computational Biology | DOI:10.1371/journal.pcbi.1004431 January 4, 2016 5 / 20
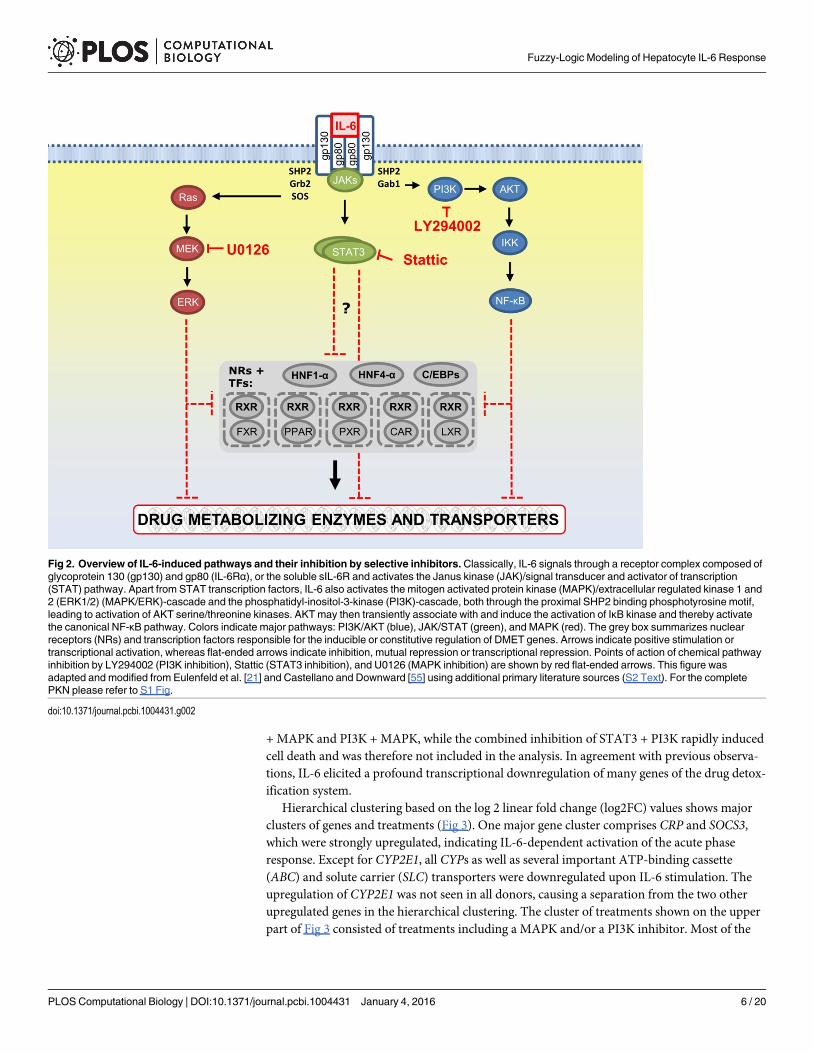
+ MAPK and PI3K + MAPK, while the combined inhibition of STAT3 + PI3K rapidly inducedcell death and was therefore not included in the analysis. In agreement with previous observa-tions, IL-6 elicited a profound transcriptional downregulation of many genes of the drug detox-ification system.
Hierarchical clustering based on the log 2 linear fold change (log2FC) values shows majorclusters of genes and treatments (Fig 3). One major gene cluster comprises CRP and SOCS3,which were strongly upregulated, indicating IL-6-dependent activation of the acute phaseresponse. Except for CYP2E1, all CYPs as well as several important ATP-binding cassette(ABC) and solute carrier (SLC) transporters were downregulated upon IL-6 stimulation. Theupregulation of CYP2E1 was not seen in all donors, causing a separation from the two otherupregulated genes in the hierarchical clustering. The cluster of treatments shown on the upperpart of Fig 3 consisted of treatments including a MAPK and/or a PI3K inhibitor. Most of the
Fig 2. Overview of IL-6-induced pathways and their inhibition by selective inhibitors. Classically, IL-6 signals through a receptor complex composed ofglycoprotein 130 (gp130) and gp80 (IL-6Rα), or the soluble sIL-6R and activates the Janus kinase (JAK)/signal transducer and activator of transcription(STAT) pathway. Apart from STAT transcription factors, IL-6 also activates the mitogen activated protein kinase (MAPK)/extracellular regulated kinase 1 and2 (ERK1/2) (MAPK/ERK)-cascade and the phosphatidyl-inositol-3-kinase (PI3K)-cascade, both through the proximal SHP2 binding phosphotyrosine motif,leading to activation of AKT serine/threonine kinases. AKTmay then transiently associate with and induce the activation of IκB kinase and thereby activatethe canonical NF-κB pathway. Colors indicate major pathways: PI3K/AKT (blue), JAK/STAT (green), and MAPK (red). The grey box summarizes nuclearreceptors (NRs) and transcription factors responsible for the inducible or constitutive regulation of DMET genes. Arrows indicate positive stimulation ortranscriptional activation, whereas flat-ended arrows indicate inhibition, mutual repression or transcriptional repression. Points of action of chemical pathwayinhibition by LY294002 (PI3K inhibition), Stattic (STAT3 inhibition), and U0126 (MAPK inhibition) are shown by red flat-ended arrows. This figure wasadapted and modified from Eulenfeld et al. [21] and Castellano and Downward [55] using additional primary literature sources (S2 Text). For the completePKN please refer to S1 Fig.
doi:10.1371/journal.pcbi.1004431.g002
Fuzzy-Logic Modeling of Hepatocyte IL-6 Response
PLOS Computational Biology | DOI:10.1371/journal.pcbi.1004431 January 4, 2016 6 / 20
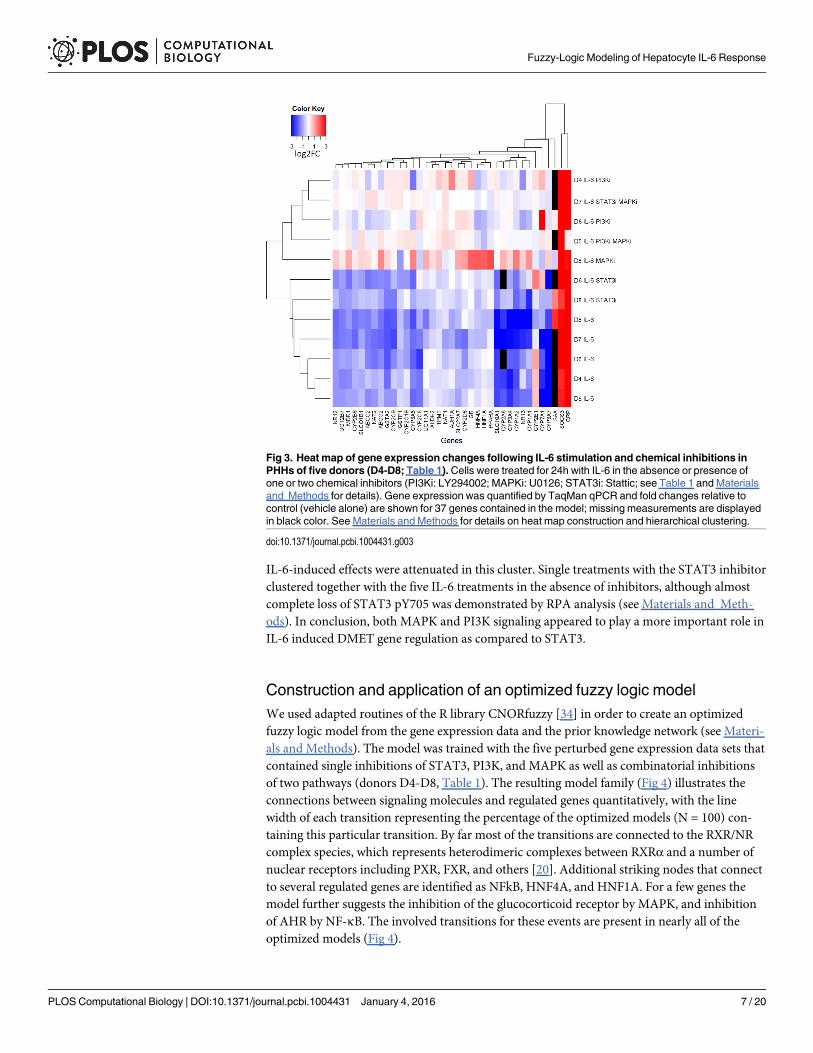
IL-6-induced effects were attenuated in this cluster. Single treatments with the STAT3 inhibitorclustered together with the five IL-6 treatments in the absence of inhibitors, although almostcomplete loss of STAT3 pY705 was demonstrated by RPA analysis (see Materials and Meth-ods). In conclusion, both MAPK and PI3K signaling appeared to play a more important role inIL-6 induced DMET gene regulation as compared to STAT3.
Construction and application of an optimized fuzzy logic modelWe used adapted routines of the R library CNORfuzzy [34] in order to create an optimizedfuzzy logic model from the gene expression data and the prior knowledge network (see Materi-als and Methods). The model was trained with the five perturbed gene expression data sets thatcontained single inhibitions of STAT3, PI3K, and MAPK as well as combinatorial inhibitionsof two pathways (donors D4-D8, Table 1). The resulting model family (Fig 4) illustrates theconnections between signaling molecules and regulated genes quantitatively, with the linewidth of each transition representing the percentage of the optimized models (N = 100) con-taining this particular transition. By far most of the transitions are connected to the RXR/NRcomplex species, which represents heterodimeric complexes between RXRα and a number ofnuclear receptors including PXR, FXR, and others [20]. Additional striking nodes that connectto several regulated genes are identified as NFkB, HNF4A, and HNF1A. For a few genes themodel further suggests the inhibition of the glucocorticoid receptor by MAPK, and inhibitionof AHR by NF-κB. The involved transitions for these events are present in nearly all of theoptimized models (Fig 4).
Fig 3. Heat map of gene expression changes following IL-6 stimulation and chemical inhibitions inPHHs of five donors (D4-D8; Table 1). Cells were treated for 24h with IL-6 in the absence or presence ofone or two chemical inhibitors (PI3Ki: LY294002; MAPKi: U0126; STAT3i: Stattic; see Table 1 and Materialsand Methods for details). Gene expression was quantified by TaqMan qPCR and fold changes relative tocontrol (vehicle alone) are shown for 37 genes contained in the model; missing measurements are displayedin black color. See Materials and Methods for details on heat map construction and hierarchical clustering.
doi:10.1371/journal.pcbi.1004431.g003
Fuzzy-Logic Modeling of Hepatocyte IL-6 Response
PLOS Computational Biology | DOI:10.1371/journal.pcbi.1004431 January 4, 2016 7 / 20

Comparison of the predictions of the model family with the respective data showed markedagreement for most genes, as indicated by bright-colored fields (Fig 5). Some higher deviationsbetween prediction and data were seen only for few genes in certain conditions, in particularSOCS3 and to a lesser extent some DMET genes, e.g. CYP2A6 and CYP2C8, in the presence ofSTAT3 inhibitor (darker colored fields). This may indicate unknown regulatory events notcontained in the prior-knowledge network. In the case of SOCS3, the deviations reflect inducedmeasured levels while the model predicts baseline levels due to the assumed inhibition ofSTAT3. Despite confirmed effective STAT3 inhibition (vide supra), we cannot exclude the pos-sibility that residual activity leads to “leaky” upregulation of SOCS3, since this is one of themost strongly regulated STAT3 target genes. It should be pointed out that this discrepancy can-not be due to the missing feedback loop in our model, which precludes secondary effects, asmentioned above.
Validating the role of RXRαThe optimized fuzzy logic model (Fig 4) suggested an important role of the RXRα/NR com-plexes. We used siRNA-mediated selective RXRα gene silencing to analyze the impact on geneexpression of major DMET genes via high-throughput real-time qPCR analysis. RXRα proteinexpression was almost completely suppressed as demonstrated by Western blot analysis (Fig6A). Fig 6B illustrates the IL-6- and RXRα knock-down (KD)-induced gene expression changesin PHH from three independent donors (D9-D11, Table 1). RXRα KD was further confirmedby more than 90% downregulation of RXRAmRNA. Upon IL-6 stimulation, APR genes werehighly upregulated and a coordinated downregulation of major DMET genes was observed inall donors, similar to those described for donors D4-D8 (Fig 3). The impact of RXRα KD on
Fig 4. Optimized model family based on the PKN and the gene expression perturbation data. Signaling molecules are displayed in white text on redbackground, genes in black text on light red, and AND-nodes in green ovals. Only transitions that are contained in at least 30% of the 100 optimized modelsare shown. The line width of each transition represents the percentage of the 100 optimization runs, in which the transition is retained in the model. RXR/NRdenotes heterodimeric complexes between RXRα and various nuclear receptors which maintain transitions to most of the DMET genes. The figure has beencreated with Cytoscape [56].
doi:10.1371/journal.pcbi.1004431.g004
Fuzzy-Logic Modeling of Hepatocyte IL-6 Response
PLOS Computational Biology | DOI:10.1371/journal.pcbi.1004431 January 4, 2016 8 / 20

Fig 5. Comparison of the predictions of the optimized PKNwith the respective data points from five gene expression data sets. The normalized datapoints are displayed in black solid lines, the predicted points in blue dashed lines. The vertical bars show the standard deviations of the normalized datapoints. The columns correspond to the genes, the rows to the different treatments. The figure has been created with an adapted method of CNORfuzzy [34].
doi:10.1371/journal.pcbi.1004431.g005
Fuzzy-Logic Modeling of Hepatocyte IL-6 Response
PLOS Computational Biology | DOI:10.1371/journal.pcbi.1004431 January 4, 2016 9 / 20

expression of DMET and modifier genes was very pronounced with similar patterns comparedto the effects of IL-6. This visual impression was supported by Spearman correlation analysis,showing a highly significant correlation between the mean fold changes of IL-6 and RXRα KDtreatments (rs = 0.79; N = 86; P<0.0001; Fig 6C). Among the phase I metabolism genes, most
Fig 6. Validation of the role of RXRα in the downregulation of DMET genes by gene silencing in PHH.(A) Western blot analysis of RXRα in total protein lysates 48 h and 72 h after transfection of cells with siCtrl(control) and siRXRα. β-Actin staining served as loading control. (B) Heat map showing the relative changesin gene expression (log2FC) for 86 selected APR and DMET genes after IL-6 stimulation (IL-6 vs. control,24 h) or after siRNA-mediated KD of RXRα (siRXRα vs. siControl, 72 h) in PHH of three independent donors(D9-D11, Table 1). Red color represents up- and blue color downregulation according to the supplied colorcode. Mean fold changes and statistical analyses of the same data are presented in S3 Fig. (C) Spearmancorrelation analysis between mean log2FC values for IL-6 and siRXRα treatments across all genes for allthree donors. The calculated Spearman coefficient was rs = 0.79 (N = 86, P<0.0001).
doi:10.1371/journal.pcbi.1004431.g006
Fuzzy-Logic Modeling of Hepatocyte IL-6 Response
PLOS Computational Biology | DOI:10.1371/journal.pcbi.1004431 January 4, 2016 10 / 20

of which were strongly and significantly downregulated, only CYP2E1 reacted differently,being downregulated by the RXRα KD while it showed (nonsignificantly) higher levels afterIL-6 treatment. The phase II metabolism genes NAT1, NAT2, and SULT1A1 were also downre-gulated to similar extent. Of note, the transporters ABCB1 and SLC10A1 showed opposite regu-lation, being upregulated by RXRα KD and downregulated by IL-6. Among the DMETmodifiers, only AHR, ARNT, and PPARA expression was significantly impaired by IL-6 but notafter the KD of RXRα. As expected, the RXRα KD experiment did not indicate significantinduction of most acute phase genes.
DiscussionIn this study we investigated the response of primary human hepatocytes to stimulation withIL-6, the most potent pro-inflammatory cytokine for the hepatic APR. Using quantitative geneexpression and time-resolved (phospho-)proteomics data sets of unprecedented comprehen-siveness, we optimized a fuzzy logic model comprising all known major IL-6 signal transduc-tion pathways as well as a broad spectrum of DMET gene regulation pathways. Our modelsuggested a major role of MAPK and PI3K pathways with the orphan nuclear receptor RXRαplaying a central role as link between inflammatory signaling and downregulation of drugdetoxification genes. Experimental RXRα knock-down by RNA interference further substanti-ated a coordinating role of RXRα to downregulate a wide variety of drug detoxification genesduring inflammation.
Based on our high-throughput (phospho-)proteomic analysis only a few major signalingmolecules demonstrated increased phosphorylation status following IL-6 treatment: AKT(S473), ERK1/2, (T202/Y204), STAT1, (Y701) and STAT3 (Y705). Whereas activation ofSTATs as well as established APR factors and ERK1/2 by IL-6 was shown previously[21,35,36], increased phosphorylation of AKT at S473 following IL-6 treatment has not beenshown before to our knowledge. Of note, PHH cultures of several donors showed increasedphosphorylation at AKTS473 already at the steady state prior to treatment. This may indicateddrug- or disease-induced basal deregulation of PI3K signaling pathway in the hepatocytes ofthese patients [37]. Our chemical inhibitions, which had been confirmed to be effective at theused concentrations by RPA phosphorylation analysis, indicated that blocking STAT3 signal-ing pathway compromised the IL-6 effect on DMET mRNA expression only marginally andonly for few DMET genes, in agreement with a previous study showing that STAT3 was notrequired for CYP3A4 downregulation [14]. Inhibition of the MAPK and PI3K pathways how-ever markedly interfered with IL-6-induced DMET expression changes, particularly in combi-nation (Fig 3). Thus, co-inhibition analyses of PI3K and MAPK as well as of STAT3 andMAPK signaling pathways abolished almost all IL-6-mediated effects on DMET gene expres-sion, suggesting a higher relevance of MAPK/PI3K compared to the JAK/STAT pathway inmediating the IL-6 triggered effects. Some limitations of this approach should be noted. Chem-ical inhibitors may have unspecific effects [38] and may also activate NRs by themselves [39].However, we believe that the concentrations used here were low enough to show primarily trueeffects on the intended pathways. Furthermore, extensive pathway crosstalk [21] poses generaldifficulties in the interpretation of such data.
In order to elucidate the regulatory events responsible for IL-6 regulation of DMET geneexpression, we developed a fuzzy logic model. This modeling technique avoids the requirementfor estimating numerous kinetic parameters as in ODE modeling and allows more realisticapproximations to biological systems compared to simple Boolean logic. Fuzzy logic modelinghas been previously used in studies involving rather tedious manual calibration of modelparameters [28] as well as parameter estimations with heuristic optimization routines [29,30].
Fuzzy-Logic Modeling of Hepatocyte IL-6 Response
PLOS Computational Biology | DOI:10.1371/journal.pcbi.1004431 January 4, 2016 11 / 20

In our study we applied the latter approach due to the lack of prior knowledge about modelparameters. This required training of the model by experimental data. Morris et al. [29] intro-duced a method to train signal transduction pathways to protein data that we adapted to theuse of gene expression data sets. As we combined several data sets for model training, we con-structed a “mean”model over these data sets. A principal problem in this respect could be vari-ability in the gene expression data throughout different donors. However, as shown by ourdatasets representing 8 individual donors (Figs 3 and 6), IL-6 effects on both APR and DMETgenes were remarkably similar for all liver donors. In principle, donor-specific models couldhave been created by model calibration with respect to only the data for a specific donor. Inorder to obtain a reliable model, this would, however, require that all experimental perturba-tions are conducted in this donor, which is practically very difficult with PHHs.
The model suggested the inhibition of the complexes of RXRα and nuclear receptors byMAPK and Nf-κB as the major event for the downregulation of most DMET genes by IL-6.RXRα is required as heterodimerization partner for several important nuclear receptors includ-ing CAR, FXR, LXR, PPAR, PXR, and VDR [20]. A coordinating role of RXRα based on its bio-logical function has been previously proposed [19] but only few mouse genes had beenobserved in that study and to our knowledge the hypothesis has not been tested for humans.Here we used siRNA-mediated gene KD in PHH to confirm the model-proposed role of RXRαin DMET gene downregulation. In three independent donors we observed highly similar pat-terns of regulation with comparably few interindividual differences (Fig 6), resulting in a highlysignificant correlation (rs = 0.79, N = 86; P<0.0001) between mean fold changes elicited by thetwo treatments.
Regarding the underlying mechanisms, it had been shown previously that endotoxin leadsto rapid loss of nuclearly localized RXRα, while RXRαmRNA levels were not affected [19],which is in agreement with our findings (Figs 6 and S3). The detailed molecular events leadingto RXRα inhibition remain to be investigated. Modulation of the phosphorylation status ofnuclear receptors including RXRα has been proposed as a possible event in this process [19].
In conclusion, this study provides new insights into the coordinated negative regulation ofDMET genes by the proinflammatory cytokine IL-6. Using extensive datasets that characterizethe activation of signaling pathways and the regulation of a broad range of APR and DMETgenes in primary human hepatocytes we found that MAPK and PI3K/AKT signaling pathwaysappear to be more important than STAT3 signaling in mediating the response of DMET genesto IL-6. A fuzzy logic model based on gene expression data sets from five different hepatocytedonors identified RXRα as a key player in downregulation of DMET gene expression, whichwas confirmed by gene silencing experiments. While previous fuzzy logic modeling approachesmainly focused on describing signaling events, our model also involves gene regulation. Hence,our study is a novel example for the elucidation of key gene-regulatory events from biologicaldata and prior knowledge using fuzzy logic.
Materials and Methods
Ethics statementThe use of PHH was approved by the local ethics committee and written informed consent wasobtained from all donors (number 025–12, Ethics Committee of the Medical Faculty of theLudwig-Maximilians-Universität München).
ReagentsWilliam’s E Medium was purchased from Invitrogen Life Technologies (Darmstadt, Germany).Fetal bovine serum (FBS) was from PAA Laboratories GmbH (Pasching, Austria), human
Fuzzy-Logic Modeling of Hepatocyte IL-6 Response
PLOS Computational Biology | DOI:10.1371/journal.pcbi.1004431 January 4, 2016 12 / 20

insulin from Sanofi (Frankfurt, Germany), and hydrocortisone from Pfizer Pharma GmbH(Karlsruhe, Germany). Hepes, L-glutamine, MEM non-essential amino acids (NEAA), penicil-lin/streptomycin (Pen/Strep), phosphate-buffered saline (PBS), and sodium pyruvate were pur-chased from GIBCO (Carlsbad, CA, USA). Bovine serum albumin (BSA), dexamethasone, anddimethyl sulfoxide (DMSO) were from Sigma-Aldrich (Steinheim, Germany), hydrocortisonefrom Pfizer (Karlsruhe, Germany). Human recombinant intereukin-6 (IL-6) was purchasedfrom Promo Cell GmbH (Heidelberg, Germany). Human recombinant interleukin 1β (IL-1β)and tumor necrosis factor α (TNF α) were purchased from Sigma-Aldrich (Steinheim, Ger-many). All cytokines were reconstituted and stored as high concentration stocks according tomanufacturer specifications. Chemical inhibitors were purchased from the following suppliers:LY294002 (Merck, Darmstadt, Germany), U0126 (Promega, Madison, WI, USA), and Stattic(Sigma-Aldrich, Steinheim, Germany). Inhibitor stock solutions (20 mM each) were preparedin DMSO. All TaqMan assays were purchased from Applied Biosystems (Foster City, CA,USA). Silencer Select Pre-designed siRNA was purchased from Applied Biosystems (FosterCity, CA, USA).
Human hepatocyte culturesPHH were isolated from partial liver resections by collagenase digestion as described previously[32,40]. Donor data are shown in Table 1. Isolated cells with a viability of more than 70% asdetermined via trypan exclusion test were seeded at a density of 4 × 10⁵ viable cells/well ontoBioCoat Collagen I Cellware 12-well culture plates (Becton Dickinson, Bedford, USA) in Wil-liam’s E Medium, supplemented with 10% FBS, 100 U/ml Pen/Strep, 2 mM L-glutamine,32 mU/ml human insulin, 1 mM sodium pyruvate, 1X NEAA, 15 mM hepes, and 0.8 μg/mlhydrocortisone. After 24 h, cells were equilibrated for another 24 h in cultivation medium,containing William’s E Medium, supplemented with 10% FBS, 100 U/ml Pen/Strep, 2 mML-glutamine, 32 mU/ml human insulin, 0.1% DMSO, and 0.1 μM dexamethasone. Cells weremaintained at 37°C in 5% CO2 throughout the experiment with the exception of the shippingperiod. All cells were cultured for a minimum of 48 h between isolation and treatment. Mediawere changed every 24 h.
TreatmentsPHH were treated for up to 24 h with 10 ng/ml human recombinant IL-6 in PBS, supplementedwith 0.1% BSA, or vehicle only (PBS + 0.1% BSA). This concentration had been previouslyshown in various cell models to activate STAT3 and to induce CRP expression without beingtoxic [41,42]. Furthermore, maximal induction of acute phase protein mRNA expressionincluding CRP and SAA1/2 was recently demonstrated by dose-response experiments in PHH[4].
For inhibition of signaling pathways, three specific chemical inhibitors were applied, target-ing three major signaling proteins: LY294002 for PI3K (upstream of AKT), U0126 for MEK1/2(upstream of ERK1/2), and Stattic for STAT3. LY294002 was shown to be a potent inhibitor ofPI3K in hepatocytes, where concentrations of> 20 μM inhibited the enzyme’s activity by morethan 90% [43]. U0126 is a selective inhibitor for MEK-1 and -2 [44]. It was shown to effectivelyinhibit wild-type MEK1 phosphorylation of ERK2 in concentrations between 20 and 100 μMin in vitro experiments [45]. Stattic is a selective inhibitor of the activation, dimerization, andnuclear translocation of STAT3 shown to inhibit STAT3 in vitro with an IC50 value after onehour of incubation of 5.1 ± 0.8 μM [46]. For inhibition, medium was aspirated and replaced byfresh medium containing one or a combination of chemical inhibitors in final concentrationsof 10 μM (Stattic) and 50 μM (LY294002 and U0126). DMSO-treated cells served as control.
Fuzzy-Logic Modeling of Hepatocyte IL-6 Response
PLOS Computational Biology | DOI:10.1371/journal.pcbi.1004431 January 4, 2016 13 / 20

After incubation for 1 h, cells were treated with IL-6 or vehicle as described above. Successfulinhibition of signal propagation was assessed in PHH using phosphoproteomics RPA technol-ogy. IL-6-dependent AKT S473, ERK1/2, and STAT3 Y705 phosphorylation was confirmed tobe nearly abolished by LY294002, U0126, and Stattic, respectively.
KD of RXRα via Silencer Select Pre-designed siRNA (P/N4392420, #s12384; sense:UCGUCCUCUUUAACCCUGAtt, antisense: UCAGGGUUAAAGAGGACGAtg) was carriedout in PHH according to the manufacturer’s instructions. In short, transfection mix was pre-pared and after 20 min incubation at RT added, giving a total volume of 1.2 ml per well(12-well plate).
Quantitative real-time PCRTotal RNA was isolated from PHH and HepaRG cells using the RNeasy Mini Kit, includingon-column genomic DNA digestion with RNase free DNase Set (Qiagen, Hilden, Germany).The RNA integrity (RIN) and quantity were analyzed with the Agilent 2100 Bioanalyzer usingthe RNA 6000 Nano Kit (Agilent Technologies, Waldbronn, Germany). Only samples with aRIN value larger than 7 were used. Synthesis of cDNA was performed with 500 ng RNA usingTaqMan Reverse Transcription Reagents (Applera GmbH, Darmstadt, Germany). Quantifica-tion of expression of 95 genes was performed using Fluidigm’s BioMark HD high-throughputquantitative 96x96 chip platform (Fluidigm Corporation, San Francisco, CA, USA), followingthe manufacturer’s instructions [47]. All used predesigned TaqMan assays are listed in S1Table. The mRNA expression levels were normalized to the most stably expressed gene amonga selection of housekeeping genes (ACTB, GAPDH, GUSB,HMBS, POLR2A, RPLP0, TBP) byusing the Normfinder Excel Add-in as described by Andersen and colleagues [48]. Relativegene expression changes were calculated using the delta delta Ct (ΔΔCt) method [49]. ΔΔCtvalues were calculated by subtracting the ΔCt value of the calibrator sample (e.g., PBS, 0.1%BSA-treated) from the ΔCt of the experimental sample (e.g., IL-6-treated). As the Ct is on a log2 scale, linear fold changes (FCs) were calculated as 2(-ΔΔCt).
Quantification of phosphoproteinsRPA technology and Western blot analysis were used for relative quantification of proteinphosphorylations. In the RPA, pL amounts of protein mixtures are immobilized in a microar-ray format and the presence of specific target proteins is screened by using highly selective anti-bodies [50]. This technology allows for the simultaneous quantification of more than 100proteins and phosphoproteins by direct two-step immunoassay using specific primary antibod-ies [51]. Proteins were isolated using the CLB1 lysis buffer. Sample preparation and measure-ments were carried out as described elsewhere [51]. Western blots of selected phosphoproteinsand of RXRα were performed with total cell lysate (20 μg of protein). β-Actin staining served asloading control. Detection was performed with an Odyssey infrared imaging system. Details onthe antibodies used can be found in S2 Table.
Clustering of gene expression dataEach DMET gene is represented by a vector of fold changes for all treatments. The R functionheatmap.2 [52] was used to create a heat map of the genes and treatments based on the loga-rithmized fold changes. The genes as well as the treatments are thereby clustered hierarchicallywith average-linkage clustering using Euclidean metrics [53].
Fuzzy-Logic Modeling of Hepatocyte IL-6 Response
PLOS Computational Biology | DOI:10.1371/journal.pcbi.1004431 January 4, 2016 14 / 20

Fuzzy logic modeling and CNORfuzzy methodCNORfuzzy is an add-on to the CellNOptR, which constructs a fuzzy logic model that enablesthe model species to be in a continuous state in the interval [0,1]. A state of 0 for a model spe-cies then represents inactivity of the species and a state of 1 the highest possible activity. Statesin between stand for intermediate activity levels of the species.
This routine has been used with proteomic data [29] and was here applied to gene expres-sion data. The two discrete states for model species in CellNetOptimizer (CNO) correspondingto an active and inactive species have proven to be suitable for modeling the activity of signal-ing molecules [54]. However, for most genes instead of this on-off-pattern, we rather expect agene to have several activation states. Therefore, we use CNORfuzzy for creating our model ofIL-6 induced DMET gene regulation. CNORfuzzy first tries to remove from the network allspecies that are neither measured nor perturbed in the experimental data, i.e., the only speciesthat are additionally maintained in the network are those that are necessary for logical consis-tency. The program then expands the PKN with possible AND-gates to supplement the alreadyimplemented OR-gates. For model inference a genetic algorithm that optimizes the meansquared error between model prediction and normalized experimental data was used. Thisalgorithm fits transfer functions for each gate to the data. In the following model reductionstep, gates that do not significantly affect the mean squared error (MSE) between model predic-tion and data are removed based on a chosen selection threshold that determines the maximumtolerated increase in the MSE, when a model is reduced by removing logic gates. CNORfuzzythus reduces the network to a topology that is sufficient to explain the experimental data.
The genetic algorithm for optimization and the following reduction procedure of CNOR-fuzzy were run 100 times, resulting in a family of optimized and reduced models. The meannumber of parameters in the optimized model family depends on the chosen selection thresh-old (S2 Fig). At a selected threshold of 0.01, the average MSE for the 100 models was 0.013 andthe mean number of parameters in the optimized model family was approximately 110. Detailson network compression and optimization are presented in the supplemental S3 Text.
Adaptation of CNO normalization method for gene expression dataThe methods of Cell Net Optimizer and CNORfuzzy are based on normalized data in the inter-val [0,1]. However, our gene expression data have a different structure and the normalizationmethod is neither suitable for the Ct values, nor for the calculated fold changes. Therefore, weadapt the given method in order to enable a transformation of the fold change values into theinterval [0,1].
We transformed all fold change values fci of a gene with the following Hill function, whichdepends on the Hill coefficient h and the valuem standing for the midpoint of the normaliza-tion function:
vi ¼fci
h
mh þ fcih
This Hill function is similar to the Hill function in the CNO routine [54]. The main differ-ence to the normalization method provided by CNO is the lack of fold change computation inour approach, because our data already contained fold changes.
The fold change values for genes downregulated by IL-6 are usually smaller than 1 in theexperimental data, whereas for genes upregulated by IL-6 they are greater than 1. In order toreasonably transform the values into [0,1] for both classes of genes, the midpoint of the Hillfunctionm had to be chosen differently. An important aspect to consider for this
Fuzzy-Logic Modeling of Hepatocyte IL-6 Response
PLOS Computational Biology | DOI:10.1371/journal.pcbi.1004431 January 4, 2016 15 / 20
transformation is that model simulation with CNORfuzzy only produces species states of 0 or1 in the case of inactivity of IL-6 (see S3 Text). Therefore, normalization of gene states for con-trol treatments should also lead to values near 0 or 1. For all genes downregulated by IL-6, theirgene activity after control treatment must be high compared to after IL-6 treatment and thustheir normalized values should be close to 1. To this end,m was set to 0.5, which proved effec-tive. For CYP2E1, which is upregulated, we correspondingly setm = 2, because the controltreatments represent a comparably low activity in this case. The other genes upregulated by IL-6 (SAA, CRP, SOCS3) showed large fold changes upon IL-6 stimulation andm = 2 was notsuitable for their midpoint of the normalization function. Therefore, we setm to half of themean fold change value of the IL-6 treatments over the data sets.
For all genes h was set to 4, which led to a transformation of the control fold change values(1) to a value near 0 (for the genes upregulated by IL-6) or 1 (for the genes downregulated byIL-6). In this way, we ensured that the transformed data points were spread throughout theentire interval [0,1]. We also conducted model calibrations with modified values ofm for thegenes downregulated by IL-6. Increasingm led to worse fitting results (MSE of approximately0.025 form = 0.7), while decreasingm produced fitting results with similar MSE but unsatisfy-ing spread of the data over the interval [0,1].
Statistical methodsStatistical significance of (phospho)proteomic and gene expression changes was analyzed bygrouped t-test (two-tailed). Spearman correlation coefficients (rs) were calculated for averagedfold changes from three independent experiments. Statistical significance was defined asP<0.05. All statistical calculations were performed using GraphPad Prism software (version5.04; GraphPad Software Inc., San Diego, CA).
Supporting InformationS1 Fig. Prior knowledge network comprising IL-6 signaling and downstream gene regula-tion. IL-6 signal transduction transitions were taken from the model by Ryll et al. [22]. Thismodel was simplified by removing feedback loops as well as by deleting irrelevant input andoutput nodes (S1 Text). AND, OR, and NOT gates were transformed into simple activating orinhibitory transitions. We extended the model with signal transduction steps and gene-regula-tory events based on newer literature (S3 Text). Color code: genes with measured expressionlevel, black text/light-red ovals; proteins measured by RPA, white text/red ovals; proteins notmeasured, white text/grey ovals. The figure was created with Cytoscape [56].(TIF)
S2 Fig. Reduction curve for model family resulting from optimization of the PKN. Thecurve shows how the mean MSE (mean squared error) and the mean number of parameters ofthe model family depend on the selection threshold. The chosen setting of the selection thresh-old of 0.01 lead on average to approximately 110 model parameters. This figure was createdwith CNORfuzzy [34].(TIF)
S3 Fig. Heat map showing mean relative changes in gene expression (log2FC) upon IL-6stimulation (IL-6 vs. control, 24 h) or siRNA-mediated knock down of RXRα (siRXRα vs.siControl, 72 h) in PHH of three independent donors (D9-D11; see Table 1 and Fig 6 forindividual donor data). Asterisks indicate statistical significance: �, P<0.05; ��, P<0.01; ���,P<0.005; ����, P<0.001.(TIF)
Fuzzy-Logic Modeling of Hepatocyte IL-6 Response
PLOS Computational Biology | DOI:10.1371/journal.pcbi.1004431 January 4, 2016 16 / 20

S1 Table. Predesigned TaqMan assays for quantitative gene expression analysis.(DOCX)
S2 Table. Antibodies used for Western blot analysis.(DOCX)
S1 Text. Summary of changes applied to the network by Ryll et al.(DOCX)
S2 Text. Supplementary references used for compiling biological knowledge to the PKN.(DOCX)
S3 Text. Detailed description of the CNORfuzzy method.(DOCX)
AcknowledgmentsWe gratefully acknowledge Igor Liebermann and Britta Klumpp for excellent technical assis-tance (Dr. Margarete Fischer-Bosch Institute of Clinical Pharmacology). We also thank theCharitable Foundation Human Tissue and Cell Research, Regensburg, for making human tis-sue available for research.
Author ContributionsConceived and designed the experiments: MKMT UMMFT TOJ UMZ. Performed the experi-ments: MKMT UMMFT. Analyzed the data: RK MKMT UMMFT UMZ. Contributedreagents/materials/analysis tools: WET. Wrote the paper: RK MKMT AD AZ UMZ. Con-ducted modeling: RK AD AZ.
References1. Cray C, Zaias J, Altman NH. Acute Phase Response in Animals: A Review. CompMed. 2009; 59: 517–
526. PMID: 20034426
2. Aitken AE, Richardson TA, Morgan ET. Regulation of drug-metabolizing enzymes and transporters ininflammation. Annu Rev Pharmacol Toxicol. 2006; 46: 123–149. doi: 10.1146/annurev.pharmtox.46.120604.141059 PMID: 16402901
3. Morgan ET, Goralski KB, Piquette-Miller M, Renton KW, Robertson GR, Chaluvadi MR, et al. Regula-tion of drug-metabolizing enzymes and transporters in infection, inflammation, and cancer. Drug MetabDispos 2008; 36: 205–16. doi:36/2/205 doi: 10.1124/dmd.107.018747 PMID: 18218849
4. Klein M, Thomas M, Hofmann U, Seehofer D, DammG, Zanger UM. A Systematic Comparison of theImpact of Inflammatory Signaling on ADMEGene Expression and Activity in Primary Human Hepato-cytes and HepaRGCells. Drug Metab Dispos 2014; 43: 273–283. doi: 10.1124/dmd.114.060962PMID: 25480923
5. Zanger UM, Turpeinen M, Klein K, SchwabM. Functional pharmacogenetics/genomics of human cyto-chromes P450 involved in drug biotransformation. Anal Bioanal Chem. 2008; 392: 1093–1108. doi: 10.1007/s00216-008-2291-6 PMID: 18695978
6. Evers R, Dallas S, Dickmann LJ, Fahmi OA, Kenny JR, Kraynov E, et al. Critical Review of PreclinicalApproaches to Investigate Cytochrome P450–Mediated Therapeutic Protein Drug-Drug Interactionsand Recommendations for Best Practices: A White Paper. Drug Metab Dispos. 2013; 41: 1598–1609.doi: 10.1124/dmd.113.052225 PMID: 23792813
7. Harvey RD, Morgan ET. Cancer, Inflammation, and Therapy: Effects on Cytochrome P450–MediatedDrug Metabolism and Implications for Novel Immunotherapeutic Agents. Clin Pharmacol Ther. 2014;96: 449–457. doi: 10.1038/clpt.2014.143 PMID: 24987833
8. Morgan ET. Impact of infectious and inflammatory disease on cytochrome P450-mediated drug metab-olism and pharmacokinetics. Clin Pharmacol Ther. 2009; 85: 434–438. doi: 10.1038/clpt.2008.302PMID: 19212314
Fuzzy-Logic Modeling of Hepatocyte IL-6 Response
PLOS Computational Biology | DOI:10.1371/journal.pcbi.1004431 January 4, 2016 17 / 20

9. Slaviero KA, Clarke SJ, Rivory LP. Inflammatory response: an unrecognised source of variability in thepharmacokinetics and pharmacodynamics of cancer chemotherapy. Lancet Oncol. 2003; 4: 224–232.PMID: 12681266
10. Jover R, Moya M, Gómez-Lechón MJ. Transcriptional regulation of cytochrome p450 genes by thenuclear receptor hepatocyte nuclear factor 4-alpha. Curr Drug Metab. 2009; 10: 508–519. PMID:19689247
11. Zanger UM, Schwab M. Cytochrome P450 enzymes in drug metabolism: Regulation of gene expres-sion, enzyme activities, and impact of genetic variation. Pharmacol Ther. 2013; 138: 103–141. doi: 10.1016/j.pharmthera.2012.12.007 PMID: 23333322
12. Pascussi J-M, Gerbal-Chaloin S, Duret C, Daujat-Chavanieu M, VilaremM-J, Maurel P. The tangle ofnuclear receptors that controls xenobiotic metabolism and transport: crosstalk and consequences.Annu Rev Pharmacol Toxicol. 2008; 48: 1–32. doi: 10.1146/annurev.pharmtox.47.120505.105349PMID: 17608617
13. Xie W, editor. Nuclear receptors in drug metabolism. Hoboken, NJ: JohnWiley & Sons; 2009.
14. Jover R, Bort, Lechon, Castell. Down-regulation of human CYP3A4 by the inflammatory signal interleu-kin-6: molecular mechanism and transcription factors involved. 2002;
15. Gu X, Ke S, Liu D, Sheng T, Thomas PE, Rabson AB, et al. Role of NF-kappaB in regulation of PXR-mediated gene expression: a mechanism for the suppression of cytochrome P-450 3A4 by proinflam-matory agents. J Biol Chem. 2006; 281: 17882–17889. doi: 10.1074/jbc.M601302200 PMID: 16608838
16. Sun Kim M, Sweeney TR, Shigenaga JK, Chui LG, Moser A, Grunfeld C, et al. TNF and IL-1 DecreaseRXRα, PPARα, PPARγ, LXRα, and the Coactivators SRC-1, PGC-1α, and PGC-1β in Liver Cells.Metabolism. 2007; 56: 267–279. doi: 10.1016/j.metabol.2006.10.007 PMID: 17224343
17. Congiu M, Mashford ML, Slavin JL, Desmond PV. Coordinate regulation of metabolic enzymes andtransporters by nuclear transcription factors in human liver disease. J Gastroenterol Hepatol. 2009; 24:1038–1044. doi: 10.1111/j.1440-1746.2009.05800.x PMID: 19638083
18. Wang Z, Salih E, Burke PA. Quantitative Analysis of Cytokine-Induced Hepatocyte Nuclear Factor-4αPhosphorylation by Mass Spectrometry. Biochemistry 2011; 50: 5292–5300. doi: 10.1021/bi200540wPMID: 21598922
19. Ghose R, Zimmerman TL, Thevananther S, Karpen SJ. Endotoxin leads to rapid subcellular re-localiza-tion of hepatic RXRα: A novel mechanism for reduced hepatic gene expression in inflammation. NuclRecept. 2004; 2: 4. doi: 10.1186/1478-1336-2-4 PMID: 15312234
20. Lefebvre P, Benomar Y, Staels B. Retinoid X receptors: common heterodimerization partners with dis-tinct functions. Trends Endocrinol Metab. 2010; 21: 676–683. doi: 10.1016/j.tem.2010.06.009 PMID:20674387
21. Eulenfeld R, Dittrich A, Khouri C, Müller PJ, Mütze B, Wolf A, et al. Interleukin-6 signalling: more thanJaks and STATs. Eur J Cell Biol. 2012; 91: 486–495. doi: 10.1016/j.ejcb.2011.09.010 PMID: 22138086
22. Ryll A, Samaga R, Schaper F, Alexopoulos LG, Klamt S. Large-scale network models of IL-1 and IL-6signalling and their hepatocellular specification. Mol Biosyst. 2011; 7: 3253–3270. doi: 10.1039/c1mb05261f PMID: 21968890
23. Burgermeister E, Lanzendoerfer M, Scheuer W. Comparative analysis of docking motifs in MAP-kinases and nuclear receptors. J Biomol Struct Dyn. 2003; 20: 623–634. doi: 10.1080/07391102.2003.10506879 PMID: 12643765
24. Zordoky BNM, El-Kadi AOS. Role of NF-kappaB in the regulation of cytochrome P450 enzymes. CurrDrug Metab. 2009; 10: 164–178. PMID: 19275551
25. Machado D, Costa RS, Rocha M, Ferreira EC, Tidor B, Rocha I. Modeling formalisms in Systems Biol-ogy. AMB Express. 2011; 1: 45. doi: 10.1186/2191-0855-1-45 PMID: 22141422
26. Schröder A, Wollnik J, Wrzodek C, Dräger A, Bonin M, Burk O, et al. Inferring statin-induced gene regu-latory relationships in primary human hepatocytes. Bioinformatics 2011; 27: 2473–2477. doi: 10.1093/bioinformatics/btr416 PMID: 21757465
27. Samaga R, Klamt S. Modeling approaches for qualitative and semi-quantitative analysis of cellular sig-naling networks. Cell Commun Signal CCS. 2013; 11: 43. doi: 10.1186/1478-811X-11-43 PMID:23803171
28. Aldridge BB, Saez-Rodriguez J, Muhlich JL, Sorger PK, Lauffenburger DA. Fuzzy logic analysis ofkinase pathway crosstalk in TNF/EGF/insulin-induced signaling. PLoS Comput Biol. 2009; 5:e1000340. doi: 10.1371/journal.pcbi.1000340 PMID: 19343194
29. Morris MK, Saez-Rodriguez J, Clarke DC, Sorger PK, Lauffenburger DA. Training signaling pathwaymaps to biochemical data with constrained fuzzy logic: quantitative analysis of liver cell responses toinflammatory stimuli. PLoS Comput Biol. 2011; 7: e1001099. doi: 10.1371/journal.pcbi.1001099 PMID:21408212
Fuzzy-Logic Modeling of Hepatocyte IL-6 Response
PLOS Computational Biology | DOI:10.1371/journal.pcbi.1004431 January 4, 2016 18 / 20

30. Bernardo-Faura M, Massen S, Falk CS, Brady NR, Eils R. Data-derived modeling characterizes plastic-ity of MAPK signaling in melanoma. PLoS Comput Biol. 2014; 10: e1003795. doi: 10.1371/journal.pcbi.1003795 PMID: 25188314
31. Lecluyse EL, Alexandre E. Isolation and culture of primary hepatocytes from resected human liver tis-sue. Methods Mol Biol. 2010; 640: 57–82. doi: 10.1007/978-1-60761-688-7_3 PMID: 20645046
32. Godoy P, Hewitt NJ, Albrecht U, Andersen ME, Ansari N, Bhattacharya S, et al. Recent advances in 2Dand 3D in vitro systems using primary hepatocytes, alternative hepatocyte sources and non-parenchy-mal liver cells and their use in investigating mechanisms of hepatotoxicity, cell signaling and ADME.Arch Toxicol. 2013; 87: 1315–1530. doi: 10.1007/s00204-013-1078-5 PMID: 23974980
33. Seok J, Warren HS, Cuenca AG, Mindrinos MN, Baker HV, XuW, et al. Genomic responses in mousemodels poorly mimic human inflammatory diseases. Proc Natl Acad Sci. 2013; 110: 3507–3512. doi:10.1073/pnas.1222878110 PMID: 23401516
34. Terfve C, Cokelaer T, Henriques D, MacNamara A, Goncalves E, Morris MK, et al. CellNOptR: a flexibletoolkit to train protein signaling networks to data using multiple logic formalisms. BMC Syst Biol. 2012;6: 133. doi: 10.1186/1752-0509-6-133 PMID: 23079107
35. Gerhartz C, Heesel B, Sasse J, Hemmann U, Landgraf C, Schneider-Mergener J, et al. Differential acti-vation of acute phase response factor/STAT3 and STAT1 via the cytoplasmic domain of the interleukin6 signal transducer gp130. I. Definition of a novel phosphotyrosine motif mediating STAT1 activation. JBiol Chem. 1996; 271: 12991–12998. PMID: 8662591
36. Takahashi-Tezuka M, Yoshida Y, Fukada T, Ohtani T, Yamanaka Y, Nishida K, et al. Gab1 acts as anadapter molecule linking the cytokine receptor gp130 to ERKmitogen-activated protein kinase. MolCell Biol. 1998; 18: 4109–4117. PMID: 9632795
37. Chang F, Lee JT, Navolanic PM, Steelman LS, Shelton JG, BlalockWL, et al. Involvement of PI3K//Aktpathway in cell cycle progression, apoptosis, and neoplastic transformation: a target for cancer chemo-therapy. Leukemia. 2003; 17: 590–603. PMID: 12646949
38. Karaman MW, Herrgard S, Treiber DK, Gallant P, Atteridge CE, Campbell BT, et al. A quantitative anal-ysis of kinase inhibitor selectivity. Nat Biotechnol. 2008; 26: 127–132. doi: 10.1038/nbt1358 PMID:18183025
39. Harmsen S, Meijerman I, Maas-Bakker RF, Beijnen JH, Schellens JHM. PXR-mediated P-glycoproteininduction by small molecule tyrosine kinase inhibitors. Eur J Pharm Sci. 2013; 48: 644–649. doi: 10.1016/j.ejps.2012.12.019 PMID: 23277288
40. Lee SML, Schelcher C, Demmel M, Hauner M, Thasler WE. Isolation of human hepatocytes by a two-step collagenase perfusion procedure. J Vis Exp. 2013; 79:e50615. doi: 10.3791/50615
41. Campbell JS, Prichard L, Schaper F, Schmitz J, Stephenson-Famy A, Rosenfeld ME, et al. Expressionof suppressors of cytokine signaling during liver regeneration. J Clin Invest. 2001; 107: 1285–1292. doi:10.1172/JCI11867 PMID: 11375418
42. Vee ML, Lecureur V, Stieger B, Fardel O. Regulation of Drug Transporter Expression in Human Hepa-tocytes Exposed to the Proinflammatory Cytokines Tumor Necrosis Factor-α or Interleukin-6. DrugMetab Dispos. 2009; 37: 685–693. doi: 10.1124/dmd.108.023630 PMID: 19074973
43. Blommaart EF, Krause U, Schellens JP, Vreeling-Sindelárová H, Meijer AJ. The phosphatidylinositol 3-kinase inhibitors wortmannin and LY294002 inhibit autophagy in isolated rat hepatocytes. Eur J Bio-chem FEBS. 1997; 243: 240–246.
44. Favata MF, Horiuchi KY, Manos EJ, Daulerio AJ, Stradley DA, Feeser WS, et al. Identification of anovel inhibitor of mitogen-activated protein kinase kinase. J Biol Chem. 1998; 273: 18623–18632.PMID: 9660836
45. Goueli SA, Hsiao K, Lu T, Simposn D. U0126: A Novel, Selective and Potent Inhibitor of MAP KinaseKinase (MEK). Promega Notes. 1998; 6.
46. Schust J, Sperl B, Hollis A, Mayer TU, Berg T. Stattic: a small-molecule inhibitor of STAT3 activationand dimerization. Chem Biol. 2006; 13: 1235–1242. doi: 10.1016/j.chembiol.2006.09.018 PMID:17114005
47. Spurgeon SL, Jones RC, Ramakrishnan R. High throughput gene expression measurement with realtime PCR in a microfluidic dynamic array. PloS One. 2008; 3: e1662. doi: 10.1371/journal.pone.0001662 PMID: 18301740
48. Andersen CL, Jensen JL,Ørntoft TF. Normalization of real-time quantitative reverse transcription-PCRdata: a model-based variance estimation approach to identify genes suited for normalization, applied tobladder and colon cancer data sets. Cancer Res. 2004; 64: 5245–5250. doi: 10.1158/0008-5472.CAN-04-0496 PMID: 15289330
Fuzzy-Logic Modeling of Hepatocyte IL-6 Response
PLOS Computational Biology | DOI:10.1371/journal.pcbi.1004431 January 4, 2016 19 / 20

49. Livak KJ, Schmittgen TD. Analysis of relative gene expression data using real-time quantitative PCRand the 2(-Delta Delta C(T)) Method. Methods. 2001; 25: 402–408. doi: 10.1006/meth.2001.1262PMID: 11846609
50. Poetz O, Ostendorp R, Brocks B, Schwenk JM, Stoll D, Joos TO, et al. Protein microarrays for antibodyprofiling: specificity and affinity determination on a chip. Proteomics. 2005; 5: 2402–2411. doi: 10.1002/pmic.200401299 PMID: 15887189
51. Braeuning A, Heubach Y, Knorpp T, Kowalik MA, Templin M, Columbano A, et al. Gender-SpecificInterplay of Signaling through β-Catenin and CAR in the Regulation of Xenobiotic-Induced HepatocyteProliferation. Toxicol Sci. 2011; 123: 113–122. doi: 10.1093/toxsci/kfr166 PMID: 21705713
52. Warnes GR, Bolker B, Bonebakker L, Gentleman R, LiawWHA, Lumley T, et al. gplots: Various R pro-gramming tools for plotting data [Internet]. 2013. Available: http://CRAN.R-project.org/package=gplots
53. Hartigan JA. Clustering Algorithms. New York: JohnWiley & Sons Inc.; 1975.
54. Saez-Rodriguez J, Alexopoulos LG, Epperlein J, Samaga R, Lauffenburger DA, Klamt S, et al. Discretelogic modelling as a means to link protein signalling networks with functional analysis of mammaliansignal transduction. Mol Syst Biol. 2009; 5: 331. doi: 10.1038/msb.2009.87 PMID: 19953085
55. Castellano E, Downward J. RAS Interaction with PI3K. Genes Cancer. 2011; 2: 261–274. doi: 10.1177/1947601911408079 PMID: 21779497
56. Shannon P, Markiel A, Ozier O, Baliga NS, Wang JT, Ramage D, et al. Cytoscape: a software environ-ment for integrated models of biomolecular interaction networks. Genome Res. 2003; 13: 2498–2504.doi: 10.1101/gr.1239303 PMID: 14597658
Fuzzy-Logic Modeling of Hepatocyte IL-6 Response
PLOS Computational Biology | DOI:10.1371/journal.pcbi.1004431 January 4, 2016 20 / 20


![[3] silabus pkn](https://img.pdfslide.us/doc/110x75/58efd52a1a28ab30708b464f/3-silabus-pkn-58fb864508c9d.jpg)