Embed Size (px)
Citation preview

Research ArticleAnalysis and Comparison of Long-Distance Pipeline Failures
Lianshuang Dai12 DongpoWang1 TingWang3 Qingshan Feng2 and Xinqi Yang1
1School of Materials Science and Engineering Tianjin University Tianjin 300072 China2PetroChina Pipeline Company Langfang Hebei 065000 China3PetroChina Pipeline RampD Center Langfang Hebei 065000 China
Correspondence should be addressed to Dongpo Wang wangdptjueducn
Received 20 February 2017 Revised 17 April 2017 Accepted 3 May 2017 Published 25 May 2017
Academic Editor Merv Fingas
Copyright copy 2017 Lianshuang Dai et alThis is an open access article distributed under the Creative CommonsAttribution Licensewhich permits unrestricted use distribution and reproduction in any medium provided the original work is properly cited
The analysis results of long-distance oil and gas pipeline failures are important for the industry and can be the basis of risk analysisintegrity assessment and management improvement for pipeline operators Through analysis and comparison of the statisticalresults of the United States Europe the UK and PetroChina in pipeline failure frequencies causes consequences similaritiesand differences of pipeline management focusing points and management effectiveness are given Suggestions on long-distancepipeline safety technology and management in China are proposed
1 Introduction
It is important to maintain high-pressure oil and gas pipelinesystems safety and reliability because the products are haz-ardous and may result in fire explosion and poisoning andlead to significant economic losses casualties and environ-mental pollution [1ndash3] By collecting and analyzing the failuredata pipeline operators can find out the causes of failureevents and understand the weak point in pipeline manage-ment which is significant for pipeline risk identificationintegrity assessment riskmitigation and accident prevention[4ndash6]
Statistical results of the US Europe the UK and Petro-China in pipeline failure frequencies causes and conse-quences are comparatively analyzed Similarities and dif-ferences of pipeline management are given Suggestions onlong-distance pipeline safety technology and management inChina are proposed
2 Analysis and Comparison
Failure statistical results of PHMSA in the US [7] EGIGin Europe [8] UKOPA in UK [9] and PNGPC in Chinaon long-distance pipeline failure frequencies causes andconsequences are comparatively analyzed Table 1 shows thepipeline types that the analysis involves
21 PHMSA Failure data of all pipelines in the US is updatedto show the recent 20 yearsrsquo statistical results and detailedinformation by PHMSA Significant incidents of onshorepipelines (for liquid only crude oil and refined andorpetroleum product are involved for gas only transmissionline is involved) are filtered from the database and calcu-lated for the failure frequencies in this paper Significantincidents are those including any of the following condi-tions
(1) Fatality or injury requiring in-patient hospitalization(2) $50000 or more in total costs measured in 1984
dollars(3) Highly volatile liquid releases of 5 barrels or more or
other liquid releases of 50 barrels or more(4) Liquid releases resulting in an unintentional fire or
explosion
211 Failure Frequency Figure 1 shows that from 2004 to2015 failure frequencies of oil pipelines in the US varybetween 04 timeskkmsdotyr and 06 timeskkmsdotyr which isslightly increasing in the last 5 years as seen in the trend lineAs for the natural gas pipelines shown in Figure 2 the numbergoes up from 004 timeskkmsdotyr to 014 timeskkmsdotyr withvibration
HindawiJournal of Petroleum EngineeringVolume 2017 Article ID 3174636 7 pageshttpsdoiorg10115520173174636
2 Journal of Petroleum Engineering
Table 1 Mediums included in the statistical data
NO OrganizationCompany Pipeline MediumCrude Oil Product Oil Natural Gas
1 PHMSA
2 EGIG
3 UKOPA
4 PNGPC
2004
2005
2006
2007
2008
2009
2010
2011
2012
2013
2014
2015
MileageFailure frequencyFailure frequency trend line
05101520253035
001020304050607
Figure 1 Mileage and failure frequency for oil pipelines
1995
1996
1997
1998
1999
2000
2001
2002
2003
2004
2005
2006
2007
2008
2009
2010
2011
2012
2013
2014
2015
MileageFailure frequencyFailure frequency trend line
01020304050607080
0002004006008
01012014016
Figure 2 Mileage and failure frequency for gas pipelines
212 Failure Causes Based on the statistical results from2010 to 2015 which includes 432 oil pipeline failures and238 gas pipeline failures all of which are flagged as sig-nificant incidents in the database the top 3 causes for oilpipeline failures are corrosion pipeweldmaterial failure andequipment failure while those of gas pipeline failures arepipeweld material failure excavation damag and corrosion(see Figures 3 and 4)
Table 2 listed the causes and subcauses categorized byPHMSA
(1) Corrosion For liquid pipelines corrosion is the mostimportant factor for failure while for gas pipelines corrosionis the top 3 of all failure factors Among those externalcorrosion usually accounted for more than 60 mainly
10725
9622
7517
6415
266
256
246
153
CorrosionPipeweld material failureEquipment failureExcavation damage
Other outside force damageIncorrect operationOthersNatural force damage
Figure 3 Oil pipelines causes
5624
5222
4318
2711
209
208
156
52
Pipeweld material failureExcavation damageCorrosionEquipment failure
Natural force damageOther outside force damageOthersIncorrect operation
Figure 4 Gas pipelines causes
Journal of Petroleum Engineering 3
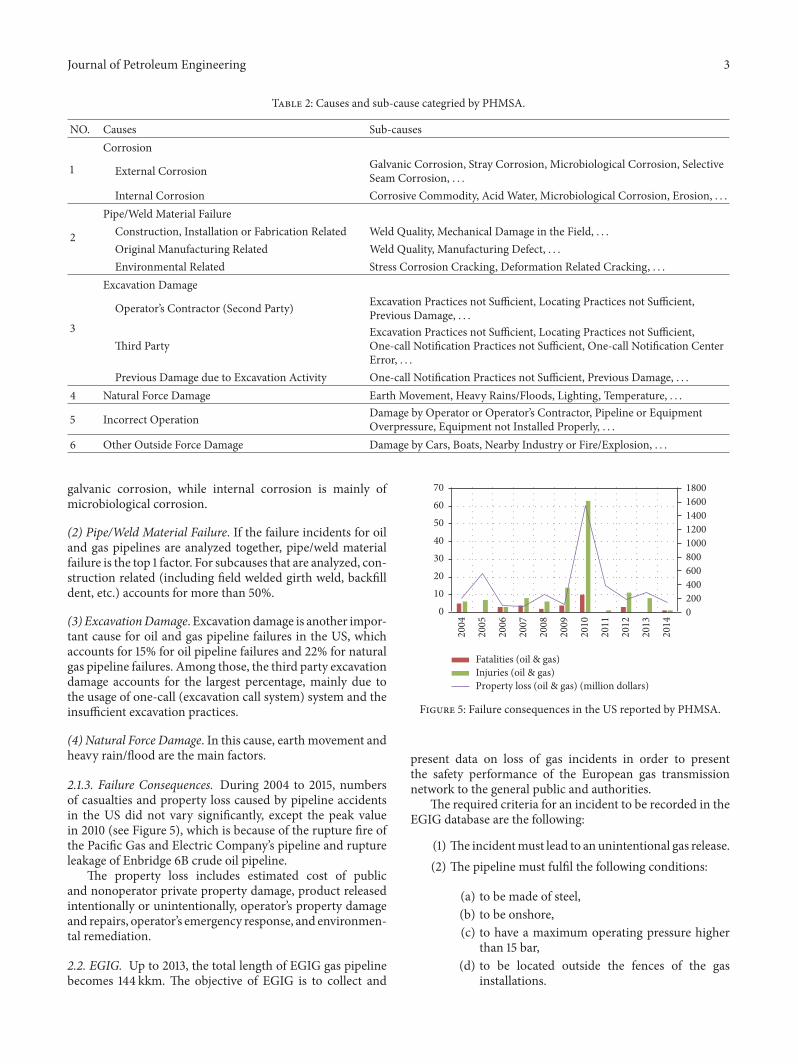
Table 2 Causes and sub-cause categried by PHMSA
NO Causes Sub-causes
1
Corrosion
External Corrosion Galvanic Corrosion Stray Corrosion Microbiological Corrosion SelectiveSeam Corrosion
Internal Corrosion Corrosive Commodity Acid Water Microbiological Corrosion Erosion
2
PipeWeld Material FailureConstruction Installation or Fabrication Related Weld Quality Mechanical Damage in the Field Original Manufacturing Related Weld Quality Manufacturing Defect Environmental Related Stress Corrosion Cracking Deformation Related Cracking
3
Excavation Damage
Operatorrsquos Contractor (Second Party) Excavation Practices not Sufficient Locating Practices not SufficientPrevious Damage
Third PartyExcavation Practices not Sufficient Locating Practices not SufficientOne-call Notification Practices not Sufficient One-call Notification CenterError
Previous Damage due to Excavation Activity One-call Notification Practices not Sufficient Previous Damage 4 Natural Force Damage Earth Movement Heavy RainsFloods Lighting Temperature
5 Incorrect Operation Damage by Operator or Operatorrsquos Contractor Pipeline or EquipmentOverpressure Equipment not Installed Properly
6 Other Outside Force Damage Damage by Cars Boats Nearby Industry or FireExplosion
galvanic corrosion while internal corrosion is mainly ofmicrobiological corrosion
(2) PipeWeld Material Failure If the failure incidents for oiland gas pipelines are analyzed together pipeweld materialfailure is the top 1 factor For subcauses that are analyzed con-struction related (including field welded girth weld backfilldent etc) accounts for more than 50
(3) ExcavationDamage Excavation damage is another impor-tant cause for oil and gas pipeline failures in the US whichaccounts for 15 for oil pipeline failures and 22 for naturalgas pipeline failures Among those the third party excavationdamage accounts for the largest percentage mainly due tothe usage of one-call (excavation call system) system and theinsufficient excavation practices
(4) Natural Force Damage In this cause earth movement andheavy rainflood are the main factors
213 Failure Consequences During 2004 to 2015 numbersof casualties and property loss caused by pipeline accidentsin the US did not vary significantly except the peak valuein 2010 (see Figure 5) which is because of the rupture fire ofthe Pacific Gas and Electric Companyrsquos pipeline and ruptureleakage of Enbridge 6B crude oil pipeline
The property loss includes estimated cost of publicand nonoperator private property damage product releasedintentionally or unintentionally operatorrsquos property damageand repairs operatorrsquos emergency response and environmen-tal remediation
22 EGIG Up to 2013 the total length of EGIG gas pipelinebecomes 144 kkm The objective of EGIG is to collect and
2004
2005
2006
2007
2008
2009
2010
2011
2012
2013
2014
Fatalities (oil amp gas)Injuries (oil amp gas)Property loss (oil amp gas) (million dollars)
010203040506070
020040060080010001200140016001800
Figure 5 Failure consequences in the US reported by PHMSA
present data on loss of gas incidents in order to presentthe safety performance of the European gas transmissionnetwork to the general public and authorities
The required criteria for an incident to be recorded in theEGIG database are the following
(1) The incidentmust lead to an unintentional gas release(2) The pipeline must fulfil the following conditions
(a) to be made of steel(b) to be onshore(c) to have a maximum operating pressure higher
than 15 bar(d) to be located outside the fences of the gas
installations
4 Journal of Petroleum Engineering
Year [mdash]
2012
2013
2009
2008
2007
2006
2005
2010
2011
2002
2001
2000
1999
1991
1990
1989
1987
1988
2003
2004
1985
1992
1993
1994
1995
1996
1997
1998
1984
1983
1982
1981
1980
1986
1978
1977
1976
1975
1974
1979
1973
1971
1972
1970
0
01
02
03
04
05
06
Failu
re fr
eque
ncy
per 1
000 k
mmiddoty
r
External interferenceConstruction defectmaterial failureGround movementCorrosionHot tap made by errorOther and unknown
Figure 6 Failure frequencies of different causes by EGIG
35
24
16
4
13
8
External interferenceCorrosionConstructionDefectsmaterial failures
Hot tapGround movementOtherunknown
Figure 7 Failure causes by EGIG
221 Failure Frequency From 1970 to 2013 the primaryfailure frequencies for the entire period (up to the year) percause keep decreasing (See Figure 6)
In 2013 the primary failure frequency over the entireperiod (1970ndash2013) was equal to 033 per kkmsdotyr This isslightly lower than the failure frequency of 035 per kkmsdotyrreported in the 8th EGIG report (1970ndash2010) The primaryfailure frequency over the last five years was equal to 016 perkkmsdotyr showing an improved performance over recent years
222 Failure Causes Top 3 causes for gas pipeline failures inEGIG are external interference corrosion and constructiondefectsmaterial failure (see Figure 7)
1 of 23
4 of 105 of 13
1 of 6
1 of 281 of 251 of 25
2 of 3
1 of 2
2 of 61 of 3
1 of 11 of 1
1 of 2
0102030405060708090
100
Perc
enta
ge o
f rup
ture
s tha
t ign
ited
()
Diameter (inches)
dlt
5㰀㰀
5㰀㰀
ledlt
11㰀㰀
11㰀㰀
ledlt
17㰀㰀
17㰀㰀
ledlt
23㰀㰀
23㰀㰀
ledlt
29㰀㰀
29㰀㰀
ledlt
35㰀㰀
35㰀㰀
ledlt
41㰀㰀
41㰀㰀
led
p le 35 bar35 bar lt p le 55 barp gt 55 bar
Figure 8 Ignited failures analysis by EGIG
00008
00061
00015
00023
00008
00046
00008
00015
Employeescontractors
Causing Fighting Public
InjuriesFatalities
0
0001
0002
0003
0004
0005
0006
0007
Perc
enta
ge o
f inc
iden
t (
)
Figure 9 Casualtiesrsquo analysis by EGIG
223 Failure Consequences According to statistical resultsin period of 1970ndash2013 only 50 of the gas releasesrecorded in the EGIG database ignited Gas releases fromlarge diameter pipelines at high pressure have ignited morefrequently than smaller diameter pipelines at lower pressure(see Figure 8)
The highest fatality and injury rate can be found amongthe people who are directly involved in causing the incidentEight cases (061 total 1309) caused fatalities among thepeople causing the incident (see Figure 9)
23 UKOPA Up to 2014 the total length of UKOPA pipelinebecomes 224 kkm A product loss incident is defined in thecontext of this report as
Journal of Petroleum Engineering 5
Overall average up to yearMoving 5-year average
1962
1964
1966
1968
1970
1972
1974
1976
1978
1980
1982
1984
1986
1988
1990
1992
1994
1996
1998
2000
2002
2004
2006
2008
2010
2012
2014
Year [mdash]
0
02
04
06
08
1
12
14
Freq
uenc
y pe
r 100
0 kmmiddoty
r
Figure 10 Average failure frequencies by UKOPA
1962ndash20142010ndash2014
Cause
Exte
rnal
corr
osio
n
Exte
rnal
inte
rfere
nce
Gro
und
mov
emen
t
Inte
rnal
corr
osio
n
Girt
h w
eld
defe
ct
Oth
er
Pipe
def
ect
Seam
wel
d de
fect
Unk
now
n
0
001
002
003
004
005
006
Freq
uenc
y pe
r 100
0 kmmiddoty
r
Figure 11 Failure causes by UKOPA
(1) an unintentional loss of product from the pipeline(2) within the public domain and outside the fences of
installations(3) excluding associated equipment (eg valves com-
pressors) or parts other than the pipeline itself
231 Failure Frequency From 1962 to 2014 altogether 192leakages have been recorded The overall failure frequencyover the period 1962 to 2014 is 0219 incidents per kkmsdotyrwhile in the previous report this figurewas 0223 incidents perkkmsdotyr (covering the period from 1962 to 2013) The overalltrend continues to show a reduction in failure frequency (seeFigure 10)
232 Failure Causes The top 3 failure causes of UKOPAare external corrosion external interference and girth welddefects (see Figure 11)
Table 3 Ignited failures analysis by UKOPA
AffectedComponent Cause Of Fault Hole Diameter Class
Pipe SeamWeld Defect 0ndash6mm
Pipe Ground Movement Full Bore and Above(1810158401015840 Diameter pipe)
Pipe Girth Weld Defect 6ndash20mmPipe Unknown 6ndash20mmPipe Pipe Defect 0ndash6mmPipe Unknown 40ndash110mmPipe Lightning Strike 0ndash6mmBend Internal Corrosion 0ndash6mmBend Pipe Defect 6ndash20mm
2006
2007
2008
2009
2010
2011
2012
2013
2014
2015
Mileage (km)Leakage number (times)
0
5
10
15
20
25
0
10000
20000
30000
40000
50000
60000
Figure 12 Mileage and failure numbers for PNGPC pipelines
233 Failure Consequences There were 9 out of 192 (47)product loss incidents that resulted in ignition Howeverthere is no obvious conclusion as shown in Table 3
24 PNGPC Up to 2015 the total length of PNGPC long-distance pipeline becomes 53 kkm Failure data were filteredin order to be comparable with other countries Only unin-tentional leakages for crude oil refined oil and natural gasfor transmission lines are counted here
241 Failure Frequency Failure frequency has increasedbefore 2011 and decreased in recent 5 years (see Figures 12 and13)
242 Failure Causes During 2006 to 2015 altogether 134leakages have been recorded among which illegal tapmanufacturing defects and construction quality are the top3 causes (see Figure 14)
(1) Illegal Tap With the enhancement of legislation failure ofthis cause has a significant downward trend
(2) Manufacturing Defect The majority of failures belong-ing to this cause are due to spiral weld defects which is
6 Journal of Petroleum Engineering
2006
ndash201
0
2007
ndash201
1
2008
ndash201
2
2009
ndash201
3
2010
ndash201
4
2011
ndash201
5
Oil pipelineGas pipelineOil amp gas pipeline
0010203040506070809
1
Figure 13 Average failure frequencies by PNGPC
50
19
10
9
74 1
Illegal tapManufacturing defectConstruction qualityCorrosion
Incorrect operation
Third partyNatural force damage
Figure 14 Failure causes by PNGPC
significantly decreasing as the manufacturing quality im-proved and the vintage pipelines abandoned
(3) Construction Quality This mainly includes girth welddefects gouges and dents As the decreasing of illegaltap and manufacturing defects and also the well-controlledcorrosion construction quality becomes the top concernedfactor in China now
(4) Corrosion As for the abandonment of old pipelinesand all kinds of control methods including periodic in-lineinspection corrosion is not as serious as before Howeverpin-hole corrosions still cause failures which are hardlydetected by MFL
(5) Third Party This is mainly due to the supervision escap-ing with unauthorized construction of third party which
2006
ndash201
0
2007
ndash201
1
2008
ndash201
2
2009
ndash201
3
2010
ndash201
4
2011
ndash201
5
PHSMAPNGPC
0010203040506070809
1
Figure 15 Compared failure frequencies for oil pipelines
2006
ndash201
0
2007
ndash201
1
2008
ndash201
2
2009
ndash201
3
2010
ndash201
4
2011
ndash201
5
0002004006008
01012014016018
02
PHSMAPNGPC
UKOPAEGIG
Figure 16 Compared failure frequencies for gas pipelines
causes damage on the pipes As third party constructionsmostly happen in the economically active regions conse-quences are relatively serious
3 Analysis Result Comparisons
Investigation and referring to foreign related failure statisticscan provide good experience for domestic pipeline operatorswhile figuring out their own management level for continu-ous improvement
31 Failure Frequencies Compared with the failure frequen-cies (5 yearsrsquo moving average) at home and abroad in the past10 years the value of PNGPCrsquos oil pipelines is higher than thatof theUS while that of PNGPCrsquos gas pipeline is roughly at thesame level compared to the US and slightly lower than theEuropean (see Figures 15 and 16)
Journal of Petroleum Engineering 7
32 Failure Causes
(1) Illegal Tap Restricted by the current situation of Chinarsquossocial and economic development this cause becomesChinarsquos top 1 factor of pipeline failure during the last 10 yearswhich rarely happens in the US and Europe However withthe strengthening of legislation and publicity the frequencyis significantly reduced
(2) PipeWeld Material Failure (Manufacturing Defect andConstruction Defect) This factor leads to a higher proportionof failures both at home and abroad With the promotion oftechnology and quality management defects on pipe bodiescan be effectively controlled However due to various con-straints it is difficult to guarantee the construction qualityHence girth weld defects dents gouges and other defectswill still exist to certain degrees
(3) Corrosion As for the abandonment of vintage pipelinesand the promotion of integrity management corrosion fail-ures are effectively controlled which is still one of the mainfactors of failures generally
(4) Third Party Failures due to this factor always occur ineconomically active areas between urban and rural bothat home and abroad As for pipeline patrolling in the USand Europe is not as timely and intensive as in China theproportion of failure caused by this factor is slightly higherthan that of China
33 Failure Consequences Compared with foreign countriesfailure consequence data is quite deficient in China Only theconsequences of serious pipeline accidents will be recordedincluding casualties economic losses and leakage
4 Conclusions and Suggestions
As for the concern from government and public on pipelinesafety in Chinamanagement has been significantly improvedby operators Consequently frequency of pipeline failures isdecreasing According to the statistical results PNGPC is notvery far compared with foreign countriesThere are still someaspects both in technology and inmanagement that should beimproved such as quality ofmanufacture and construction ofpipeline and third party monitoring
Nomenclature
PHMSA Pipeline and Hazardous Materials SafetyAdministration
EGIG European Gas Pipeline Incident DataGroup
UKOPA United Kingdom Onshore PipelineOperatorsrsquo Association
PNGPC PetroChina Natural Gas amp PipelineCompany
Conflicts of Interest
The authors declare that there are no conflicts of interestregarding the publication of this paper
Acknowledgments
Preparation of this paper was supported by the PNGPC thisis gratefully acknowledged by coauthors DongpoWang TingWang Qingshan Feng and Xinqi Yang Thanks are also dueto numerous past and present colleagues for insights andhelpful discussions
References
[1] P Hopkins ldquoTransmission pipelines how to improve theirintegrity and prevent failuresrdquo in Pipeline Technology Proceed-ings of the 2nd international pipeline technology conference RDenys Ed vol 1 pp 683ndash702 1995
[2] W Y Zheng ldquoStress corrosion cracking of oil and gas pipelinesin near neutral pH environment Review of recent researchrdquoEnergy Materials Materials Science and Engineering for EnergySystems vol 3 no 4 pp 220ndash226 2008
[3] T Wang W Xuan X Wang et al ldquoOverview of oil and gaspipeline failure databaserdquo in Proceedings of International Con-ference on Pipelines and Trenchless Technology ICPTT 2013 pp1161ndash1167 chn October 2013
[4] H L Li X W Zhao and L K Ji ldquoOil and gas pipeline failureanalysis and integrity managementrdquo Testing - Physical Volumepp 24ndash31 2005
[5] R Singh Pipeline Integrity Handbook Risk Management andEvaluation vol 51 Gulf Professional Publishing UK 2014
[6] C R F Azevedo ldquoFailure analysis of a crude oil pipelinerdquo Engi-neering Failure Analysis vol 14 no 6 pp 978ndash994 2007
[7] PHMSA httpprimisphmsadotgovcommreportssafetyPSIhtml 2015
[8] EGIG ldquo9th report of the gas pipeline incidents of european gaspipeline incident data grouprdquo 2015
[9] UKOPA ldquoUKOPA pipeline product loss incidents and faultsreport (1962ndash2014)rdquo 2015
RoboticsJournal of
Hindawi Publishing Corporationhttpwwwhindawicom Volume 2014
Hindawi Publishing Corporationhttpwwwhindawicom Volume 2014
Active and Passive Electronic Components
Control Scienceand Engineering
Journal of
Hindawi Publishing Corporationhttpwwwhindawicom Volume 2014
International Journal of
RotatingMachinery
Hindawi Publishing Corporationhttpwwwhindawicom Volume 2014
Hindawi Publishing Corporation httpwwwhindawicom
Journal of
Volume 201
Submit your manuscripts athttpswwwhindawicom
VLSI Design
Hindawi Publishing Corporationhttpwwwhindawicom Volume 201
Hindawi Publishing Corporationhttpwwwhindawicom Volume 2014
Shock and Vibration
Hindawi Publishing Corporationhttpwwwhindawicom Volume 2014
Civil EngineeringAdvances in
Acoustics and VibrationAdvances in
Hindawi Publishing Corporationhttpwwwhindawicom Volume 2014
Hindawi Publishing Corporationhttpwwwhindawicom Volume 2014
Electrical and Computer Engineering
Journal of
Advances inOptoElectronics
Hindawi Publishing Corporation httpwwwhindawicom
Volume 2014
The Scientific World JournalHindawi Publishing Corporation httpwwwhindawicom Volume 2014
SensorsJournal of
Hindawi Publishing Corporationhttpwwwhindawicom Volume 2014
Modelling amp Simulation in EngineeringHindawi Publishing Corporation httpwwwhindawicom Volume 2014
Hindawi Publishing Corporationhttpwwwhindawicom Volume 2014
Chemical EngineeringInternational Journal of Antennas and
Propagation
International Journal of
Hindawi Publishing Corporationhttpwwwhindawicom Volume 2014
Hindawi Publishing Corporationhttpwwwhindawicom Volume 2014
Navigation and Observation
International Journal of
Hindawi Publishing Corporationhttpwwwhindawicom Volume 2014
DistributedSensor Networks
International Journal of

2 Journal of Petroleum Engineering
Table 1 Mediums included in the statistical data
NO OrganizationCompany Pipeline MediumCrude Oil Product Oil Natural Gas
1 PHMSA
2 EGIG
3 UKOPA
4 PNGPC
2004
2005
2006
2007
2008
2009
2010
2011
2012
2013
2014
2015
MileageFailure frequencyFailure frequency trend line
05101520253035
001020304050607
Figure 1 Mileage and failure frequency for oil pipelines
1995
1996
1997
1998
1999
2000
2001
2002
2003
2004
2005
2006
2007
2008
2009
2010
2011
2012
2013
2014
2015
MileageFailure frequencyFailure frequency trend line
01020304050607080
0002004006008
01012014016
Figure 2 Mileage and failure frequency for gas pipelines
212 Failure Causes Based on the statistical results from2010 to 2015 which includes 432 oil pipeline failures and238 gas pipeline failures all of which are flagged as sig-nificant incidents in the database the top 3 causes for oilpipeline failures are corrosion pipeweldmaterial failure andequipment failure while those of gas pipeline failures arepipeweld material failure excavation damag and corrosion(see Figures 3 and 4)
Table 2 listed the causes and subcauses categorized byPHMSA
(1) Corrosion For liquid pipelines corrosion is the mostimportant factor for failure while for gas pipelines corrosionis the top 3 of all failure factors Among those externalcorrosion usually accounted for more than 60 mainly
10725
9622
7517
6415
266
256
246
153
CorrosionPipeweld material failureEquipment failureExcavation damage
Other outside force damageIncorrect operationOthersNatural force damage
Figure 3 Oil pipelines causes
5624
5222
4318
2711
209
208
156
52
Pipeweld material failureExcavation damageCorrosionEquipment failure
Natural force damageOther outside force damageOthersIncorrect operation
Figure 4 Gas pipelines causes
Journal of Petroleum Engineering 3
Table 2 Causes and sub-cause categried by PHMSA
NO Causes Sub-causes
1
Corrosion
External Corrosion Galvanic Corrosion Stray Corrosion Microbiological Corrosion SelectiveSeam Corrosion
Internal Corrosion Corrosive Commodity Acid Water Microbiological Corrosion Erosion
2
PipeWeld Material FailureConstruction Installation or Fabrication Related Weld Quality Mechanical Damage in the Field Original Manufacturing Related Weld Quality Manufacturing Defect Environmental Related Stress Corrosion Cracking Deformation Related Cracking
3
Excavation Damage
Operatorrsquos Contractor (Second Party) Excavation Practices not Sufficient Locating Practices not SufficientPrevious Damage
Third PartyExcavation Practices not Sufficient Locating Practices not SufficientOne-call Notification Practices not Sufficient One-call Notification CenterError
Previous Damage due to Excavation Activity One-call Notification Practices not Sufficient Previous Damage 4 Natural Force Damage Earth Movement Heavy RainsFloods Lighting Temperature
5 Incorrect Operation Damage by Operator or Operatorrsquos Contractor Pipeline or EquipmentOverpressure Equipment not Installed Properly
6 Other Outside Force Damage Damage by Cars Boats Nearby Industry or FireExplosion
galvanic corrosion while internal corrosion is mainly ofmicrobiological corrosion
(2) PipeWeld Material Failure If the failure incidents for oiland gas pipelines are analyzed together pipeweld materialfailure is the top 1 factor For subcauses that are analyzed con-struction related (including field welded girth weld backfilldent etc) accounts for more than 50
(3) ExcavationDamage Excavation damage is another impor-tant cause for oil and gas pipeline failures in the US whichaccounts for 15 for oil pipeline failures and 22 for naturalgas pipeline failures Among those the third party excavationdamage accounts for the largest percentage mainly due tothe usage of one-call (excavation call system) system and theinsufficient excavation practices
(4) Natural Force Damage In this cause earth movement andheavy rainflood are the main factors
213 Failure Consequences During 2004 to 2015 numbersof casualties and property loss caused by pipeline accidentsin the US did not vary significantly except the peak valuein 2010 (see Figure 5) which is because of the rupture fire ofthe Pacific Gas and Electric Companyrsquos pipeline and ruptureleakage of Enbridge 6B crude oil pipeline
The property loss includes estimated cost of publicand nonoperator private property damage product releasedintentionally or unintentionally operatorrsquos property damageand repairs operatorrsquos emergency response and environmen-tal remediation
22 EGIG Up to 2013 the total length of EGIG gas pipelinebecomes 144 kkm The objective of EGIG is to collect and
2004
2005
2006
2007
2008
2009
2010
2011
2012
2013
2014
Fatalities (oil amp gas)Injuries (oil amp gas)Property loss (oil amp gas) (million dollars)
010203040506070
020040060080010001200140016001800
Figure 5 Failure consequences in the US reported by PHMSA
present data on loss of gas incidents in order to presentthe safety performance of the European gas transmissionnetwork to the general public and authorities
The required criteria for an incident to be recorded in theEGIG database are the following
(1) The incidentmust lead to an unintentional gas release(2) The pipeline must fulfil the following conditions
(a) to be made of steel(b) to be onshore(c) to have a maximum operating pressure higher
than 15 bar(d) to be located outside the fences of the gas
installations
4 Journal of Petroleum Engineering
Year [mdash]
2012
2013
2009
2008
2007
2006
2005
2010
2011
2002
2001
2000
1999
1991
1990
1989
1987
1988
2003
2004
1985
1992
1993
1994
1995
1996
1997
1998
1984
1983
1982
1981
1980
1986
1978
1977
1976
1975
1974
1979
1973
1971
1972
1970
0
01
02
03
04
05
06
Failu
re fr
eque
ncy
per 1
000 k
mmiddoty
r
External interferenceConstruction defectmaterial failureGround movementCorrosionHot tap made by errorOther and unknown
Figure 6 Failure frequencies of different causes by EGIG
35
24
16
4
13
8
External interferenceCorrosionConstructionDefectsmaterial failures
Hot tapGround movementOtherunknown
Figure 7 Failure causes by EGIG
221 Failure Frequency From 1970 to 2013 the primaryfailure frequencies for the entire period (up to the year) percause keep decreasing (See Figure 6)
In 2013 the primary failure frequency over the entireperiod (1970ndash2013) was equal to 033 per kkmsdotyr This isslightly lower than the failure frequency of 035 per kkmsdotyrreported in the 8th EGIG report (1970ndash2010) The primaryfailure frequency over the last five years was equal to 016 perkkmsdotyr showing an improved performance over recent years
222 Failure Causes Top 3 causes for gas pipeline failures inEGIG are external interference corrosion and constructiondefectsmaterial failure (see Figure 7)
1 of 23
4 of 105 of 13
1 of 6
1 of 281 of 251 of 25
2 of 3
1 of 2
2 of 61 of 3
1 of 11 of 1
1 of 2
0102030405060708090
100
Perc
enta
ge o
f rup
ture
s tha
t ign
ited
()
Diameter (inches)
dlt
5㰀㰀
5㰀㰀
ledlt
11㰀㰀
11㰀㰀
ledlt
17㰀㰀
17㰀㰀
ledlt
23㰀㰀
23㰀㰀
ledlt
29㰀㰀
29㰀㰀
ledlt
35㰀㰀
35㰀㰀
ledlt
41㰀㰀
41㰀㰀
led
p le 35 bar35 bar lt p le 55 barp gt 55 bar
Figure 8 Ignited failures analysis by EGIG
00008
00061
00015
00023
00008
00046
00008
00015
Employeescontractors
Causing Fighting Public
InjuriesFatalities
0
0001
0002
0003
0004
0005
0006
0007
Perc
enta
ge o
f inc
iden
t (
)
Figure 9 Casualtiesrsquo analysis by EGIG
223 Failure Consequences According to statistical resultsin period of 1970ndash2013 only 50 of the gas releasesrecorded in the EGIG database ignited Gas releases fromlarge diameter pipelines at high pressure have ignited morefrequently than smaller diameter pipelines at lower pressure(see Figure 8)
The highest fatality and injury rate can be found amongthe people who are directly involved in causing the incidentEight cases (061 total 1309) caused fatalities among thepeople causing the incident (see Figure 9)
23 UKOPA Up to 2014 the total length of UKOPA pipelinebecomes 224 kkm A product loss incident is defined in thecontext of this report as
Journal of Petroleum Engineering 5
Overall average up to yearMoving 5-year average
1962
1964
1966
1968
1970
1972
1974
1976
1978
1980
1982
1984
1986
1988
1990
1992
1994
1996
1998
2000
2002
2004
2006
2008
2010
2012
2014
Year [mdash]
0
02
04
06
08
1
12
14
Freq
uenc
y pe
r 100
0 kmmiddoty
r
Figure 10 Average failure frequencies by UKOPA
1962ndash20142010ndash2014
Cause
Exte
rnal
corr
osio
n
Exte
rnal
inte
rfere
nce
Gro
und
mov
emen
t
Inte
rnal
corr
osio
n
Girt
h w
eld
defe
ct
Oth
er
Pipe
def
ect
Seam
wel
d de
fect
Unk
now
n
0
001
002
003
004
005
006
Freq
uenc
y pe
r 100
0 kmmiddoty
r
Figure 11 Failure causes by UKOPA
(1) an unintentional loss of product from the pipeline(2) within the public domain and outside the fences of
installations(3) excluding associated equipment (eg valves com-
pressors) or parts other than the pipeline itself
231 Failure Frequency From 1962 to 2014 altogether 192leakages have been recorded The overall failure frequencyover the period 1962 to 2014 is 0219 incidents per kkmsdotyrwhile in the previous report this figurewas 0223 incidents perkkmsdotyr (covering the period from 1962 to 2013) The overalltrend continues to show a reduction in failure frequency (seeFigure 10)
232 Failure Causes The top 3 failure causes of UKOPAare external corrosion external interference and girth welddefects (see Figure 11)
Table 3 Ignited failures analysis by UKOPA
AffectedComponent Cause Of Fault Hole Diameter Class
Pipe SeamWeld Defect 0ndash6mm
Pipe Ground Movement Full Bore and Above(1810158401015840 Diameter pipe)
Pipe Girth Weld Defect 6ndash20mmPipe Unknown 6ndash20mmPipe Pipe Defect 0ndash6mmPipe Unknown 40ndash110mmPipe Lightning Strike 0ndash6mmBend Internal Corrosion 0ndash6mmBend Pipe Defect 6ndash20mm
2006
2007
2008
2009
2010
2011
2012
2013
2014
2015
Mileage (km)Leakage number (times)
0
5
10
15
20
25
0
10000
20000
30000
40000
50000
60000
Figure 12 Mileage and failure numbers for PNGPC pipelines
233 Failure Consequences There were 9 out of 192 (47)product loss incidents that resulted in ignition Howeverthere is no obvious conclusion as shown in Table 3
24 PNGPC Up to 2015 the total length of PNGPC long-distance pipeline becomes 53 kkm Failure data were filteredin order to be comparable with other countries Only unin-tentional leakages for crude oil refined oil and natural gasfor transmission lines are counted here
241 Failure Frequency Failure frequency has increasedbefore 2011 and decreased in recent 5 years (see Figures 12 and13)
242 Failure Causes During 2006 to 2015 altogether 134leakages have been recorded among which illegal tapmanufacturing defects and construction quality are the top3 causes (see Figure 14)
(1) Illegal Tap With the enhancement of legislation failure ofthis cause has a significant downward trend
(2) Manufacturing Defect The majority of failures belong-ing to this cause are due to spiral weld defects which is
6 Journal of Petroleum Engineering
2006
ndash201
0
2007
ndash201
1
2008
ndash201
2
2009
ndash201
3
2010
ndash201
4
2011
ndash201
5
Oil pipelineGas pipelineOil amp gas pipeline
0010203040506070809
1
Figure 13 Average failure frequencies by PNGPC
50
19
10
9
74 1
Illegal tapManufacturing defectConstruction qualityCorrosion
Incorrect operation
Third partyNatural force damage
Figure 14 Failure causes by PNGPC
significantly decreasing as the manufacturing quality im-proved and the vintage pipelines abandoned
(3) Construction Quality This mainly includes girth welddefects gouges and dents As the decreasing of illegaltap and manufacturing defects and also the well-controlledcorrosion construction quality becomes the top concernedfactor in China now
(4) Corrosion As for the abandonment of old pipelinesand all kinds of control methods including periodic in-lineinspection corrosion is not as serious as before Howeverpin-hole corrosions still cause failures which are hardlydetected by MFL
(5) Third Party This is mainly due to the supervision escap-ing with unauthorized construction of third party which
2006
ndash201
0
2007
ndash201
1
2008
ndash201
2
2009
ndash201
3
2010
ndash201
4
2011
ndash201
5
PHSMAPNGPC
0010203040506070809
1
Figure 15 Compared failure frequencies for oil pipelines
2006
ndash201
0
2007
ndash201
1
2008
ndash201
2
2009
ndash201
3
2010
ndash201
4
2011
ndash201
5
0002004006008
01012014016018
02
PHSMAPNGPC
UKOPAEGIG
Figure 16 Compared failure frequencies for gas pipelines
causes damage on the pipes As third party constructionsmostly happen in the economically active regions conse-quences are relatively serious
3 Analysis Result Comparisons
Investigation and referring to foreign related failure statisticscan provide good experience for domestic pipeline operatorswhile figuring out their own management level for continu-ous improvement
31 Failure Frequencies Compared with the failure frequen-cies (5 yearsrsquo moving average) at home and abroad in the past10 years the value of PNGPCrsquos oil pipelines is higher than thatof theUS while that of PNGPCrsquos gas pipeline is roughly at thesame level compared to the US and slightly lower than theEuropean (see Figures 15 and 16)
Journal of Petroleum Engineering 7
32 Failure Causes
(1) Illegal Tap Restricted by the current situation of Chinarsquossocial and economic development this cause becomesChinarsquos top 1 factor of pipeline failure during the last 10 yearswhich rarely happens in the US and Europe However withthe strengthening of legislation and publicity the frequencyis significantly reduced
(2) PipeWeld Material Failure (Manufacturing Defect andConstruction Defect) This factor leads to a higher proportionof failures both at home and abroad With the promotion oftechnology and quality management defects on pipe bodiescan be effectively controlled However due to various con-straints it is difficult to guarantee the construction qualityHence girth weld defects dents gouges and other defectswill still exist to certain degrees
(3) Corrosion As for the abandonment of vintage pipelinesand the promotion of integrity management corrosion fail-ures are effectively controlled which is still one of the mainfactors of failures generally
(4) Third Party Failures due to this factor always occur ineconomically active areas between urban and rural bothat home and abroad As for pipeline patrolling in the USand Europe is not as timely and intensive as in China theproportion of failure caused by this factor is slightly higherthan that of China
33 Failure Consequences Compared with foreign countriesfailure consequence data is quite deficient in China Only theconsequences of serious pipeline accidents will be recordedincluding casualties economic losses and leakage
4 Conclusions and Suggestions
As for the concern from government and public on pipelinesafety in Chinamanagement has been significantly improvedby operators Consequently frequency of pipeline failures isdecreasing According to the statistical results PNGPC is notvery far compared with foreign countriesThere are still someaspects both in technology and inmanagement that should beimproved such as quality ofmanufacture and construction ofpipeline and third party monitoring
Nomenclature
PHMSA Pipeline and Hazardous Materials SafetyAdministration
EGIG European Gas Pipeline Incident DataGroup
UKOPA United Kingdom Onshore PipelineOperatorsrsquo Association
PNGPC PetroChina Natural Gas amp PipelineCompany
Conflicts of Interest
The authors declare that there are no conflicts of interestregarding the publication of this paper
Acknowledgments
Preparation of this paper was supported by the PNGPC thisis gratefully acknowledged by coauthors DongpoWang TingWang Qingshan Feng and Xinqi Yang Thanks are also dueto numerous past and present colleagues for insights andhelpful discussions
References
[1] P Hopkins ldquoTransmission pipelines how to improve theirintegrity and prevent failuresrdquo in Pipeline Technology Proceed-ings of the 2nd international pipeline technology conference RDenys Ed vol 1 pp 683ndash702 1995
[2] W Y Zheng ldquoStress corrosion cracking of oil and gas pipelinesin near neutral pH environment Review of recent researchrdquoEnergy Materials Materials Science and Engineering for EnergySystems vol 3 no 4 pp 220ndash226 2008
[3] T Wang W Xuan X Wang et al ldquoOverview of oil and gaspipeline failure databaserdquo in Proceedings of International Con-ference on Pipelines and Trenchless Technology ICPTT 2013 pp1161ndash1167 chn October 2013
[4] H L Li X W Zhao and L K Ji ldquoOil and gas pipeline failureanalysis and integrity managementrdquo Testing - Physical Volumepp 24ndash31 2005
[5] R Singh Pipeline Integrity Handbook Risk Management andEvaluation vol 51 Gulf Professional Publishing UK 2014
[6] C R F Azevedo ldquoFailure analysis of a crude oil pipelinerdquo Engi-neering Failure Analysis vol 14 no 6 pp 978ndash994 2007
[7] PHMSA httpprimisphmsadotgovcommreportssafetyPSIhtml 2015
[8] EGIG ldquo9th report of the gas pipeline incidents of european gaspipeline incident data grouprdquo 2015
[9] UKOPA ldquoUKOPA pipeline product loss incidents and faultsreport (1962ndash2014)rdquo 2015
RoboticsJournal of
Hindawi Publishing Corporationhttpwwwhindawicom Volume 2014
Hindawi Publishing Corporationhttpwwwhindawicom Volume 2014
Active and Passive Electronic Components
Control Scienceand Engineering
Journal of
Hindawi Publishing Corporationhttpwwwhindawicom Volume 2014
International Journal of
RotatingMachinery
Hindawi Publishing Corporationhttpwwwhindawicom Volume 2014
Hindawi Publishing Corporation httpwwwhindawicom
Journal of
Volume 201
Submit your manuscripts athttpswwwhindawicom
VLSI Design
Hindawi Publishing Corporationhttpwwwhindawicom Volume 201
Hindawi Publishing Corporationhttpwwwhindawicom Volume 2014
Shock and Vibration
Hindawi Publishing Corporationhttpwwwhindawicom Volume 2014
Civil EngineeringAdvances in
Acoustics and VibrationAdvances in
Hindawi Publishing Corporationhttpwwwhindawicom Volume 2014
Hindawi Publishing Corporationhttpwwwhindawicom Volume 2014
Electrical and Computer Engineering
Journal of
Advances inOptoElectronics
Hindawi Publishing Corporation httpwwwhindawicom
Volume 2014
The Scientific World JournalHindawi Publishing Corporation httpwwwhindawicom Volume 2014
SensorsJournal of
Hindawi Publishing Corporationhttpwwwhindawicom Volume 2014
Modelling amp Simulation in EngineeringHindawi Publishing Corporation httpwwwhindawicom Volume 2014
Hindawi Publishing Corporationhttpwwwhindawicom Volume 2014
Chemical EngineeringInternational Journal of Antennas and
Propagation
International Journal of
Hindawi Publishing Corporationhttpwwwhindawicom Volume 2014
Hindawi Publishing Corporationhttpwwwhindawicom Volume 2014
Navigation and Observation
International Journal of
Hindawi Publishing Corporationhttpwwwhindawicom Volume 2014
DistributedSensor Networks
International Journal of
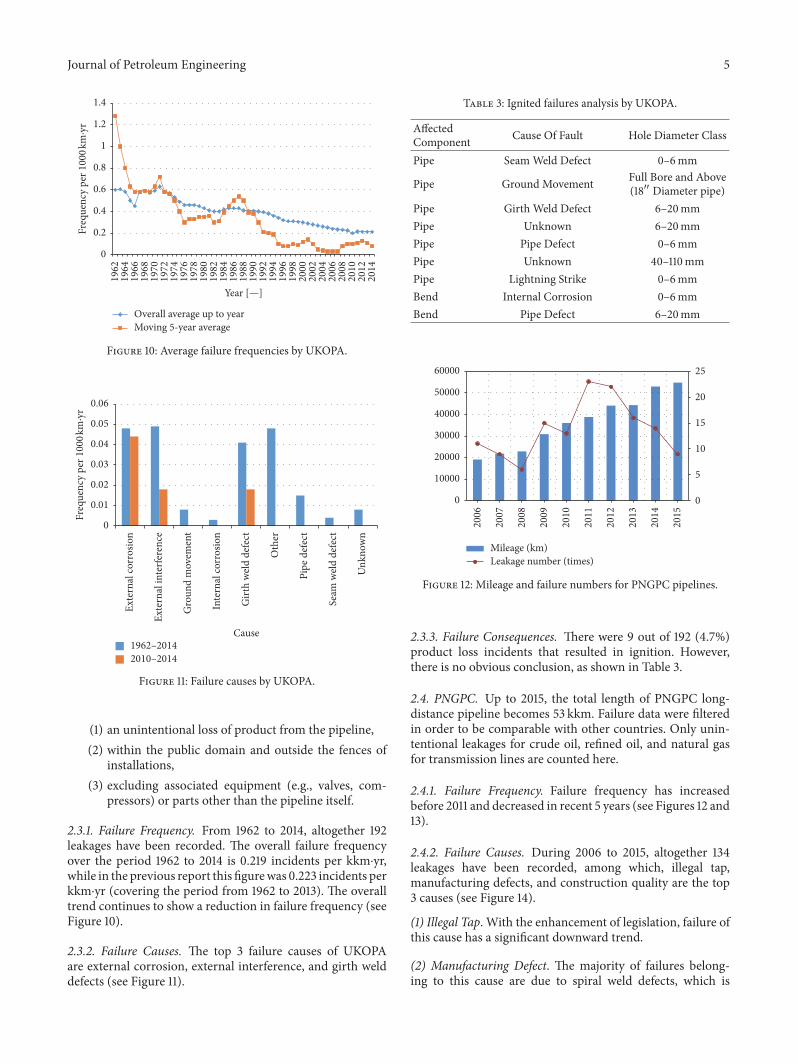
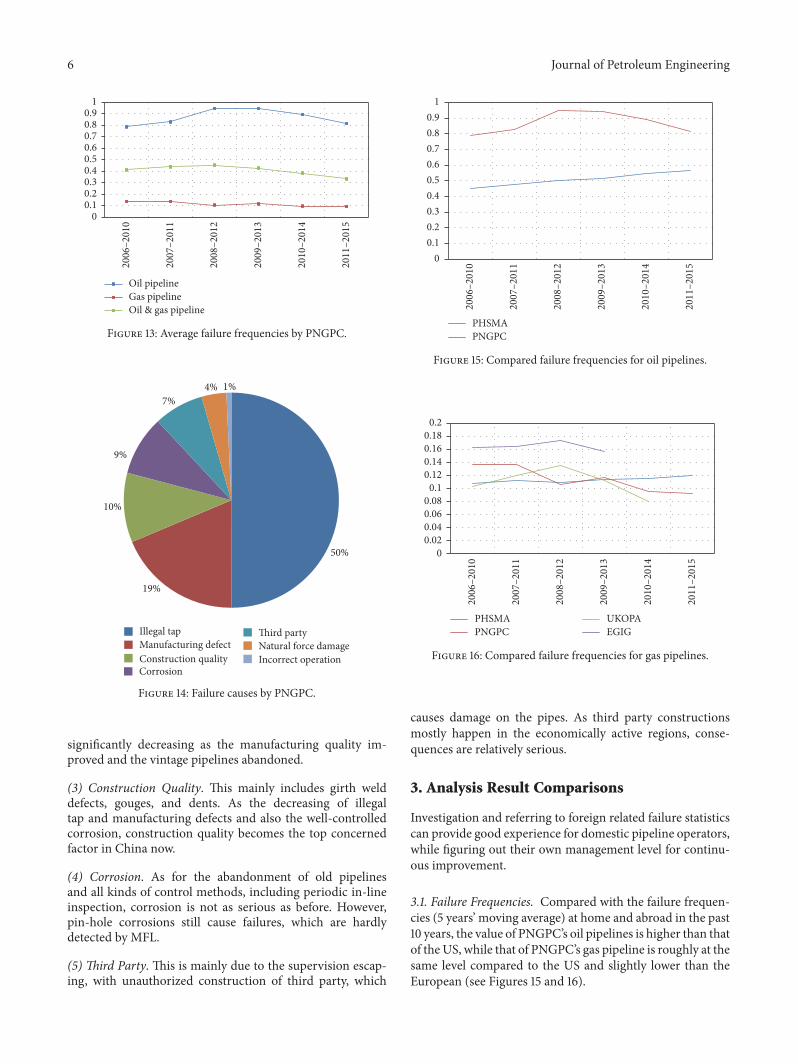


![RESEARCHARTICLE TwoDimensionalYau-HausdorffDistance ... · 2020. 11. 26. · Wepropose heretheYau-Hausdorff distance in termsofthe minimumone-dimensional Hausdorff distance [11].TheminimumHausdorff](https://img.pdfslide.us/doc/110x75/60b2e15de50b16271d5090e5/researcharticle-twodimensionalyau-hausdorffdistance-2020-11-26-wepropose.jpg)