Embed Size (px)
Citation preview

A comparison of underwater visual distance estimates made by SCUBA divers and a stereo-
video system: Implications for underwater visual census of reef fish abundance.
Euan Harvey1, David Fletcher2, Mark Shortis3 and Gary Kendrick1
1School of Plant Biology, Faculty of Natural and Agricultural Sciences, University of
Western Australia, 35 Stirling Highway, Crawley, Western Australia 6009.
2Department of Maths and Statistics, University of Otago, 539 Castle Street, Dunedin,
New Zealand.
3Faculty of Engineering, RMIT University, GPO Box 2476V Melbourne 3001, Victoria,
Australia.
Corresponding author: Euan Harvey School of Plant Biology, Faculty of Natural and
Agricultural Sciences, University of Western Australia, 35 Stirling Highway, Crawley,
Western Australia 6009.
E-mail [email protected]
Ph +61 (08) 93802416
Fax +61 (08) 93801001

2
Abstract
Underwater visual census of reef fish by SCUBA divers is a widely used and useful
technique for quickly evaluating the composition and abundance of reef fish assemblages,
but suffers from biases and errors in estimates of distance to, and the length of fish. Here
we present the errors associated with underwater visual estimates of distance made by
novice and experienced scientific divers and compare them to an underwater stereo video
system. We then demonstrate the potential implications of these biases and errors on
underwater visual census assessments of reef fish abundance and how the accuracy and
precision of SCUBA diver length estimates of fish is affected as distance increases.
Distance was under-estimated by both experienced (mean relative error = -11.7%,
standard deviation = 21.4%) and novice scientific divers (mean relative error = -5.0%,
standard deviation = 17.9%). For experienced scientific divers this error may potentially
result in an 82% under-estimate, or 194% over-estimate of the actual area censused and
will affect estimates of fish density. The stereo-video system also under-estimated
distance, but to a much lesser degree (mean relative error = -0.9%, standard deviation =
2.6%) and with less variability than divers resulting in consistent areas being censused.
To minimise the effects of distance error SCUBA divers using underwater visual census
for estimating densities and lengths of fish should routinely calibrate their distance
estimates in the same way that fish length calibrations are made presently. There was no
relationship between the relative error of length estimates and the distance of the fish
away from the observer.

3
Introduction
Visual survey techniques are widely used for determining the abundance of both
terrestrial (Caughley et al. 1976; Caughley 1977; Cormack et al. 1979; Ralph and Scott
1981; Francis 1994) and marine organisms (Estes and Gilbert 1978; Marsh and Sinclair
1989). These techniques were first used for assessing the abundance of reef fishes in the
1950s (Brock 1954; Odum and Odum 1955). Since then they have been further
developed and widely applied. Underwater Visual Census (UVC) techniques have
become popular, as they are relatively quick, non-destructive, repeatable and cost
effective (St. John et al. 1990; English et al. 1994; Watson et al. 1995; Thompson and
Mapstone 1997). There are also a number of disadvantages and biases (see Harvey et al.,
2002a). Three different types of UVC techniques are commonly used; transects, point
counts and Rapid Visual Censuses (RVC), or timed counts. Strip transects are the most
prevalent (Kingsford and Battershill 1998). When assessing the abundance of reef fish
using a strip transect, a SCUBA diver normally swims along a marked transect rope or
tape measure of a predetermined length and counts all the fish encountered within a set
distance either side of the centre of the transect over a predetermined distance. Point
counts are slightly different in that the SCUBA diver counts all the fish within a circle of
a predetermined radius. During RVC counts, the SCUBA diver records all fish seen
within a lane of estimated width over a predetermined time, effectively making many
RVC techniques a strip transect of variable length. A feature common to all of these
techniques is that the SCUBA diver has to decide whether a fish is inside or outside the
boundary of the sampling unit. In all cases the SCUBA diver will subconsciously or
consciously estimate the cross substratum distance to the fish, and decide whether or not

4
to include the fish in the count. While some researchers physically mark the boundary of
their transects or point counts (Bell 1983; Choat and Bellwood 1985; Thresher and Gunn
1986; McCormick and Choat 1987; Lincoln-Smith 1988; Bortone et al. 1989; Davis and
Anderson 1989; Polunin and Roberts 1993; Russ and Acala 1996; Rakitin and Kramer
1997) many do not, making the task for the SCUBA diver even more demanding. The
decision to include or exclude a particular fish is further complicated if the fish moves
rapidly across the sample unit boundary (Watson et al. 1995). The SCUBA diver then
has to decide whether the fish was inside or outside the sample unit when it was first
sighted (Andrew and Mapstone 1987). It is clear that systematic errors in distance
estimation leads to bias in the count of the number of fish within the sample unit, and
hence in overall estimate of fish abundances (Bohnsack and Bannerot 1986; Thresher and
Gunn 1986).
The accuracy and precision of in situ UVC length estimates of reef fish has been the
focus of some detailed researched (Bell et al. 1985; St. John et al. 1990; Darwall and
Dulvy 1996; Harvey et al. 2001 a; b; 2002), however the effect of increasing distance on
the accuracy and precision of in situ UVC length estimates has not been investigated.
The objectives of this study were to:
1. compare the accuracy and precision of visual estimates of distance made by novice
and experienced scientific SCUBA divers and a stereo-video system;
2. demonstrate how errors associated with estimating distance affect abundance
estimates of reef fish.

5
3. demonstrate the effect of increasing distance on the accuracy and precision of length
estimates of fish made by novice and experienced scientific SCUBA divers under
both controlled and field conditions.
Methods
Visual estimates of distance
The accuracy and precision of visual distance estimates made by experienced and novice
scientific divers were tested by a simple procedure routinely used for calibrating diver
estimates of the lengths of reef fish (GBRMPA 1979; Bell et al. 1985; English et al.
1994). Typically, PVC sticks or silhouettes of fish are placed in the water and their
lengths estimated. The accuracy of the diver estimate is then assessed from the
difference between the real size and the estimate. In this study, experienced and novice
scientific divers were asked to swim along either a fibreglass surveyors tape or a lead
transect rope marked at 1 metre intervals and estimate the distance to each silhouette
from marked positions. Sixteen plastic silhouettes of fish, ranging in length from 10 to
49 cm, were placed at distances of between 3.0 and 6.6 metres from the marked positions.
Trials took place in either a saltwater aquarium or a freshwater pool. 6.6 metres was
selected as the maximum distance from which estimates could be made as visibility was
never greater than 7 metres in the saltwater aquaria. Each of the experienced and novice
scientific divers swam five repeat transects. The distances from the transect rope and the
order of the silhouettes was maintained throughout the experiment. Data were recorded
on an underwater slate which was replaced between transects so the divers could not refer
back to a previous measurement. Distance data were not made available to either the
novice or experienced scientific divers between dives to avoid memorisation of previous

6
distance estimates for a particular silhouette. The mean error, standard deviation and the
standard error for each of the sixteen fish was calculated for each of the novice and
experienced scientific divers.
In many respects the trial represents a best case scenario. The silhouettes were stationary
and the SCUBA divers were given no time limits to estimate the cross substratum
distance from the point of observation to the silhouette. Consequently, they had time to
use the distance measures on the surveyor’s tape or the marked intervals on the lead
transect rope to help scale their estimates. Additionally, there were many other objects in
the saltwater aquarium (eg. building bricks, tiles, fish and support pillars) and in the
swimming pool (swimmers and lane markings) that could be used to scale the estimates.
Novice scientific divers
Novice scientific divers were defined as experienced SCUBA divers who had made few,
if any estimates of the lengths of reef fish underwater but were all experienced at
undertaking scientific observations in other disciplines. Eight novice scientific divers
made visual underwater distance estimates in a saltwater pool at the Portobello Marine
Laboratory (PML) between May 1994 and January 1995. No more than two transects
were completed on any one-day except for one diver who completed four consecutive
transects in one day.
Experienced scientific divers
Experienced scientific divers were considered active marine scientists who had been, or
who were currently involved in research that required them to make counts of reef fish
abundance. Five experienced scientific divers made underwater visual estimates of the

7
distances to the plastic silhouettes between October 1994 and June 1996. Three of the
divers made their estimates in a saltwater pool at PML whilst the other two made their
estimates in freshwater swimming pools elsewhere. Due to time constraints of diver
availability, all of the distance estimates were made on consecutive transects during one
dive.
Water clarity between the saltwater and freshwater pools was different. As each diver
completed all of their estimates under the same conditions we do not consider this to be a
major flaw. Under field conditions water clarity is a factor that may change substantially
throughout a dive.
Stereo-video estimates of distance
Stereo-video camera estimates of distance were obtained on 20 November 1997 in a
freshwater swimming pool. Three silhouettes of different lengths were held in front of
the stereo-video camera and their images recorded at 1 metre intervals between 3 and 12
metres. Three replicate images were recorded for each silhouette at each distance. The
mean of ten repeat measurements was calculated for each of the three replicate images
recorded for each of the three silhouettes at each distance. The actual distance, from the
silhouette to the centre of the camera, was measured using a fibreglass surveyors tape. A
detailed description of the stereo-video system, calibration and measurement procedures
may be found in Harvey and Shortis (1996, 1998) and Shortis and Harvey 1998).
Assessing the effect of distance error on estimates of abundance
To graphically demonstrate the potential impact of distance errors and bias on UVC
estimates of reef fish abundance, a hypothetical model was created. The results presented

8
here are based on point counts only, as the results for strip transects are very similar
(Harvey 1998) and any general conclusions are equally applicable.
Radial distances for published point counts range from 3m (Francour, 1997) and 5.64m
(Bortone et al. 1989) to 15m (Thresher and Gunn 1986). Francour (1997) notes that the
radial distance scanned should correspond to 2/3 of the maximum visibility. Most
commonly, radial distances of 7.5m (Bohnsack et al. 1994) and 7m (Samoilys 1992;
Samoilys and Carlos 1992; Jennings and Polunin 1995) have been used.
To keep with common practice, we used a radial distance of 7 metres for the theoretical
point count in our two-dimensional model. This point count, covering an area of 154.1m2
was positioned in the centre of a theoretical 20m x 20m square (400 m2). Circles
representing the upper and lower 95% confidence limits for the range of the actual area
censused by novice and scientific divers and the stereo-video system were also created
(see Figures 2a, 2b and 2c). We calculated a 95% confidence interval for the actual
distance associated with an estimated distance, using inverse regression (Draper and
Smith 1981). The confidence interval for the actual distance was then converted into a
confidence interval for the actual area censused, from which we calculated the potential
error associated with the estimated fish density. Potential error in estimated fish density
was determined by randomly allocating fifty points, symbolising fish, a location within
the 20 x 20 m square. Counts were then made of the number of fish symbols falling
within the actual area of the point count and the upper and lower 95% confidence
intervals for the novice and scientific divers and the stereo-video system. This was

9
repeated fifty times based on the confidence intervals for the novice and experienced
scientific divers and the stereo-video system.
Assessing the effect of increasing distance on the accuracy and precision of UVC
length estimates
Data on the accuracy and precision of in situ UVC length estimates by novice and
experienced scientific divers was collected in the same experiment and manner as
described above with divers estimating the length of each silhouette as it was
encountered. An analysis of this data has been presented in Harvey et al. (2001a) but the
relationship between errors in length estimates as distance increases was not investigated.
Similarly, the accuracy and precision of in situ length estimates made in the field by three
experienced observers was presented in Harvey et al. (2002a) but the relationship
between the accuracy and precision of length estimates was not investigated. Details of
the experimental design maybe found in Harvey et al. (2002a). We examine the
relationships between errors in length estimates and increasing distance using both these
data sets.
Analysis of data
Novice and experienced scientific divers
The results for the novice and experienced scientific divers were summarised prior to
further analysis by calculating, for each silhouette and each observer, the mean distance
estimate over all transects. The repeat transects were therefore used solely to provide a
reliable estimate of the error made by each diver on the distance away of each silhouette.

10
The individual divers provide replication. For each diver, the relative error (RE) at each
distance was calculated as a percentage using:
Relative error = ((Mean estimated distance - Actual distance)/Actual distance) * 100
where the mean estimated distance was over all transects. The overall RE at each distance
was the mean relative error across all observers. The variation at each distance was
summarised by the coefficient of variation (CV) among observers of the mean estimated
distance. CV was calculated as:
Coefficient of Variation = (SD of mean estimated distance/Actual distance) * 100
It might be expected that both the error in estimating distance and the variation between
observers would be proportional to the distance. This would imply that RE and CV would
both be consistent across a range of distances, allowing us to assume a single overall RE
and CV. We checked this by regressing both RE and CV against distance.
Stereo-video distance
For each replicate image, the RE for each combination of distance and silhouette was
calculated as for observers, with the mean estimated distance over the ten repeat
measurements. The overall RE for each combination of distance and silhouette was the
mean across the three images. The variation at each combination of distance and
silhouette was summarised by the CV among images of the mean estimated distance. As
for the divers, we regressed both RE and CV against distance to check their consistency
across a range of distances.
Length data
11
Errors in length estimates from novice and experienced scientific divers (Harvey et al.
2001a) and from the three experienced field observers (Harvey et al. 2002a) were
converted to relative error, graphically summarised and relationships between error in
increasing distance explored by regressing RE against distance analysis. We used
regression analysis as it might be expected that error in length estimates would be
proportional to the distance. Length errors were converted to RE because fishes of
different lengths were estimated over a range of distances. Length errors associated field
estimates were made by comparing the SCUBA diver estimate to simultaneous
measurements with a stereo-video system. The upper or lower 95% confidence limits for
the stereo-video was used as the real value (see Harvey et al. 2002a) to compare to the
SCUBA diver estimates, and therefore these data represent a best case scenario. The
accuracy and precision of stereo-video estimates of fish length as distance increase are
reported in Harvey et al. (2002b).
Results
Visual estimates of distance
Novice scientific divers
Novice scientific divers tended to underestimate distances (mean error = - 6.25 cm, SE =
25.62 cm, see Figure 1) and had a mean RE of –5% (Table 1). Also, RE increased with
distance (t = 2.97, df = 14, P = 0.010), and ranged from -20% to +16%. Similarly, CV
for novice scientific divers increased with distance (t = 2.37, df = 14, P = 0.030). CV
values ranged from 13% to 26% with a mean of 17.9% (Table 1).

12
Experienced scientific divers
Experienced scientific divers also tended to underestimate distances (mean error = -
46.22 cm, SE = 32.44 cm, see Figure 1) and had a mean RE of –11.7% (Table 1). For
experienced scientific divers there was no evidence that RE changed with distance (t = -
0.52, df = 14, P = 0.614). The RE values ranged from -17% to -8%. CV for experienced
scientific divers significantly decreased with distance (t = -3.14, df = 14, P = 0.007). CV
ranged from 9% to 34% with a mean of 21.4% (Table 1).
Stereo-Video
Estimates made from stereo-video also tended to underestimate distance, but to a much
lesser degree. A mean error of –10.24 cm (SE = 5.14 cm) was recorded across all
distances and decreased to –0.25 cm (SE = 3.51 cm) between distances of 3 and 7 m,
comparable to the distances over which divers were tested. For stereo-video, RE
decreased with distance (t = -8.19, df = 28, P < 0.0001). The RE values ranged from -
3.8% to +2.4%. There was no evidence that CVs for stereo-video changed with distance
(t = -0.58, df = 28, P = 0.57). The CV values ranged from 0.02% to 6.9%.
During underwater recordings it was noted that over larger distances sag in the surveyors
tape could not be completely eliminated, even though the tape was pulled taut. The effect
of the tape sagging can be seen in the differences in the mean errors for all distances and
for those up to 7 m, with an increasing mean negative error and increasing variation at 7
metres and beyond (Figure 1).

13
Effect of distance error on sampling area and counts of abundance: Point Counts
Novice scientific divers
The actual boundary of a 7 m point count, as perceived by novice scientific divers, could
in reality lie between 5.3 m and 8.1 m. An accurate 7 m point count will census an area
of 154.1 m2. According to these results the actual area censused by novice observers may
range between 89.0 m2 and 207.40 m2 (Figure 2a) or between 58% and 134% (Table 2) of
the actual area. In terms of abundance, as few as 8 fish may be counted if the novice
observer over estimates or as high as 38 fish if he or she under estimates the count of all
the fish within the upper 95% CI border (Table 3).
Experienced scientific divers
A fish estimated by an experienced scientific diver as being at the edge of a 7 m point
count could actually be at a distance of between 6.3 m and 9.7 m. The actual area
censused ranged between 127.7 m2 and 286.8 m2 (Figure 2b) or between 82% and
194% of the real area (Table 2). For the estimated 154.1 m2 supposedly censused by the
point count, abundance could range from as low as 5 fish (lower 95% CI) to as high as 38
fish (upper 95% CI) (Table3).
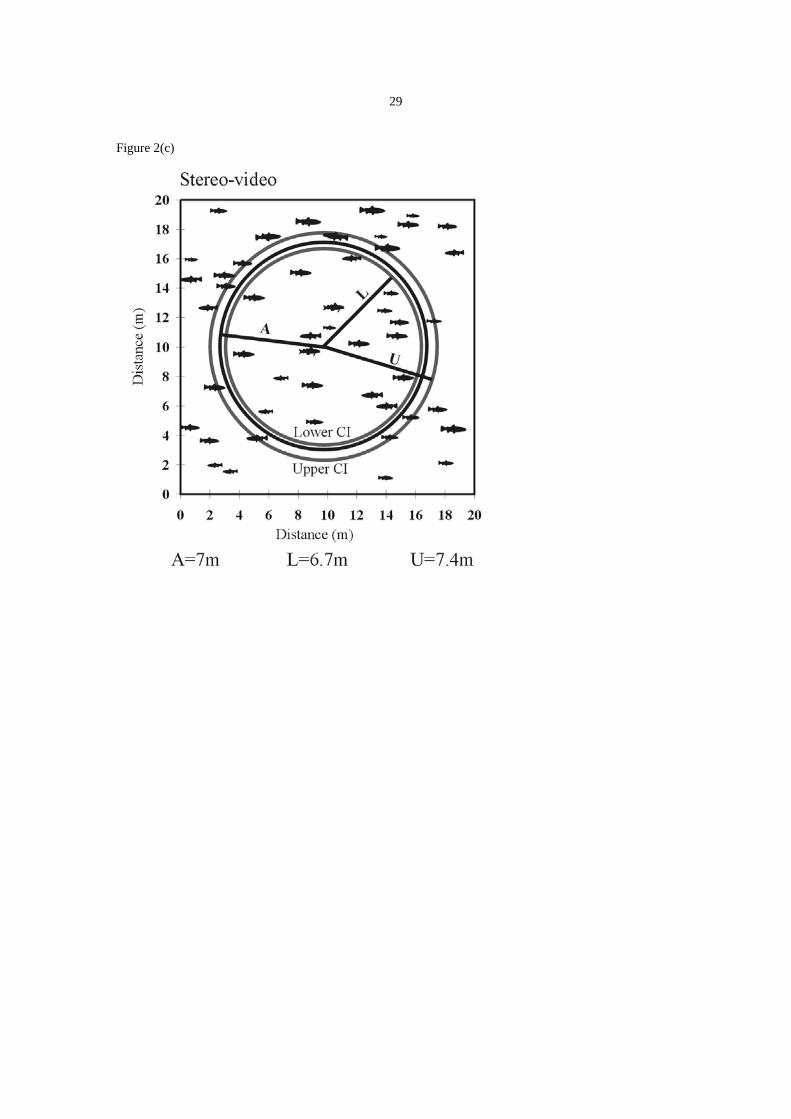
Stereo-video
Using a stereo-video, a fish estimated as being at the edge of the 7 m point count could
actually be at a distance of between 6.7 m and 7.4 m, with the actual area censused being
between 143.7 m2 and 173.9 m2 (Figure 2c). The actual area censused will fall between
93% and 113 % of the actual area (Table 2). In terms of fish counted, abundance
estimates may range between 20 fish (lower CI) to 24 fish (upper CI) (Table 3).
14
The relationship between in situ length estimates and increasing distance
Figures 3a and 3b show that for length estimates made in a controlled environment by
novice and experienced scientific divers there does not appear to be a relationship
between relative error and distance. Regressing relative error against distance shows
weak relationships between relative error and distance (Novice scientific divers R2
= 7.1%, RE Novice = -0.237993 + 0.0779883 Distance; Experienced scientific divers R2
= 10.4%, RE Experienced = -0.344252 + 0.0617702 Distance).
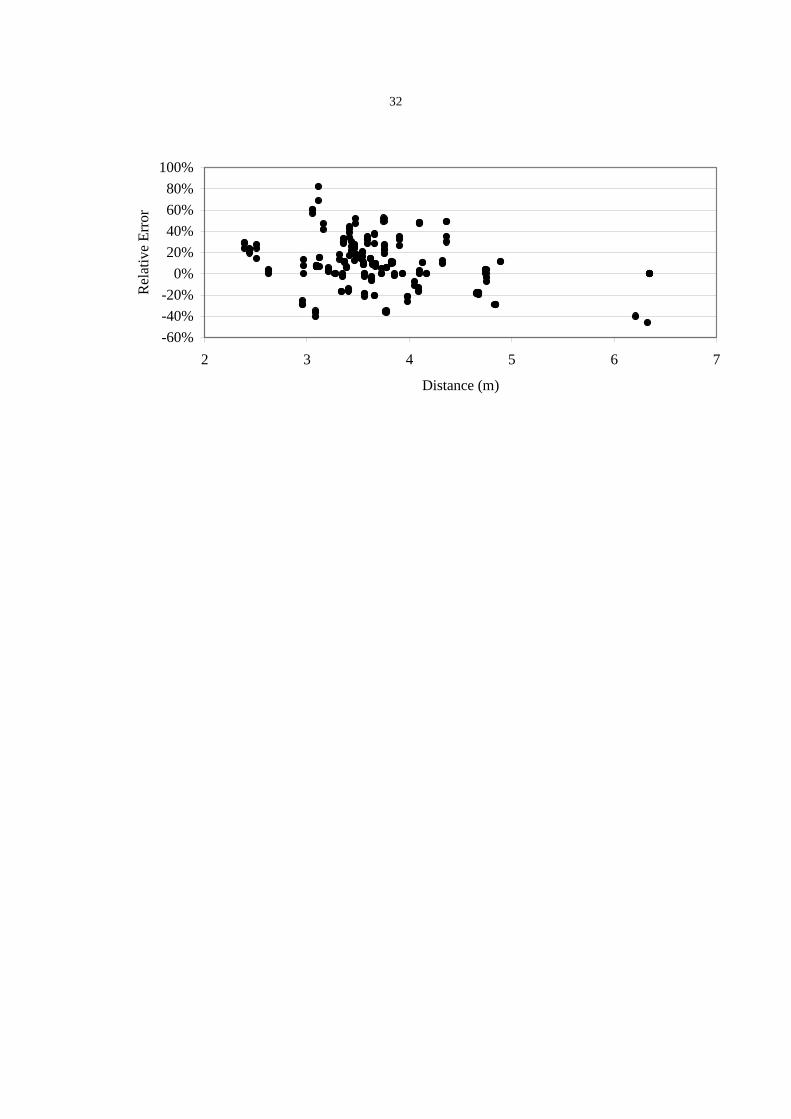
Figures 4a, b and c show that for experienced scientific divers operating under field
conditions there does not appear to be any relationship between the magnitude of the
relative error of length estimates and increasing distance. This supported by the
regression analysis which shows weak relationships between relative error and increasing
distance (Diver 1 R2 = 0.9%, Diver 1 RE = 0.194798 - 0.0331412 Distance; Diver 2 R2 =
1.8%, Diver 2 RE = 0.507170 - 0.0890697 Distance; Diver 3 R2 = 7.9%, Diver 3 RE =
0.437826 - 0.0924894 Distance).
Discussion
Both inexperienced and experienced scientific divers are shown to be unable to
accurately estimate the distance to fishes. This impacts on the total area surveyed in
UVC methods. This is a problem that has been recognised previously. Choat and
Bellwood (1985) noted that the 5m distance which represented half the transect width of
their 30m x 10m transects was initially under-estimated, and that there was a tendency to
include larger fish in the transect when they were in fact outside. Four of the five
experienced scientific divers used in this research tended to under-estimate distances

15
(mean RE = -20%; range = -29% to 0%), while one tended to over-estimate (mean RE =
+20%; range = -7% to +46%). For the novice scientific divers there was a tendency to
both over-estimate and under-estimate (mean RE = -5%; range = -44% to +58%).
Thompson and Mapstone (1997) report that a large proportion of the variation in surveys
is attributable to differences between observers. Thresher and Gunn (1986) note that
error in distance estimates has considerable influence on the area of the censused sample
unit, and consequently the number of fish recorded per sample. Under-estimates in
distance (like those predominantly recorded by our experienced scientific divers) result in
a larger area being surveyed, and more fish being counted. Based on the errors recorded
by the experienced scientific divers the 95% CI borders indicate that the area censused by
and experienced scientific diver could lie between 82% and 194% of the actual survey
area.
If bias is consistent within and among individual divers then it is possible to not only
compare data sets, but also to develop a calibration equation that allows biased
measurements to be corrected (Buckland et al. 1993). Therefore, we recommend that
distance calibration become a standard practice in UVC in the same way that length
calibrations are undertaken (eg. Bell et al. 1985).
Distance estimates made from either the stereo-video system or by the experienced and
novice scientific divers were made in controlled environments (saltwater aquaria,
swimming pools). It is very likely that the accuracy and precision of distance estimates
to a fish made by a diver will decrease when they have to contend with varying

16
conditions of lighting and water visibility in the presence of surges and currents (Harvey
et al. 2002a). Past experience has shown that the accuracy and precision of the stereo-
video measurements will not change (Harvey and Shortis 1996; Harvey and Shortis 1998;
Harvey et al. 2001a) provided calibrations are made within that system and a series of
guidelines are followed about how measurements should be made (Harvey et al. 2002b).
Such error and inter-observer variability in estimates of distance as described in this
paper have serious implications for comparisons of data sets between different observers
and among different surveys sampled at different times. Stereo-video does not completely
eliminate error in distance estimates but it does substantially improve the accuracy and
precision of estimates. The additional costs of using stereo-video technology include the
purchase of two video cameras and underwater housings, a base bar to mount the video
cameras on, a synchronisation diode, a PC frame grabber and the software for analysing
the resulting imagery. There is also processing time required back in the laboratory. It
has been shown that volunteers can operate both the measurement software in the
laboratory and the stereo-video system in the field without compromising data quality
(Harvey et al. 2001a). However, the use of stereo-video raises issues of the detectability
of fishes by the cameras. A diver moving along a transect, or within a point count has
the advantage of having a greater field of view and can move about the axis of the
transect or midpoint of the point count looking into crevices and behind rocks. A stereo-
video system is forward pointing and will not detect fish that are behind rocks or in
crevices unless the operator swims the system into those areas. Additionally, a diver can

17
sample at multiple scales where as the stereo-video system is deliberately preconfigured
to sample a specific area.
When sampling multi-species fish assemblages larger and more mobile reef fishes are
sampled first using a larger sampling unit (example a 50 x 10 m transect) and smaller
cryptic species sampled using a more intensive search of a smaller unit (example 50 x 2
m transects) (Kingsford and Battershill 1998; English et al. 1994). It is widely accepted
that divers conducting UVC will become overloaded and inefficient when they try to
sample too many species at one time (Greene and Alevizon 1989; Kingsford and
Battershill 1998; English et al. 1994). Perhaps the best combination is for a diver to
swim a stereo-video setup while wearing a fullface mask with a microphone to record
audio observations onto one of the videotapes in one of the two video cameras (eg.
Westera et al. 2003).
Surprisingly the data on the relationship between the relative error of UVC length
estimates and distance shows no relationship as distance increases. Error is length
estimates appears to be fixed as distance increases. However, the data do highlight the
variability in the precision of the length estimates. This variability will affect the
statistical power of programs using UVC methods to detect changes in the mean length of
fish (Harvey et al. 2001b).

18
Conclusion
This research demonstrates that error in visual distance estimates made by novice and
highly experienced scientific divers can be large, and that this error has the potential to
affect the size of the sample units censused. This in turn will affect numbers of fish
counted by a census and the comparison of data collected by different observers and
across different censuses by the same observer. It is essential that observer biases
inherent in visual surveys are minimised or standardised through calibrations in order to
detect changes in fish assemblages using UVC techniques. This is very important for
multi-species surveys carried out over large temporal (regional or continental) and/or
spatial scales. Particularly to those research programs investigating the effects of Marine
Protected Areas if multi-species data sets collected by different observers at different
times are to have any statistical power to support the conclusions they draw.
Stereo-video had less error associated with distance estimates than either novice or
scientific divers and may offer a cost-effective tool for removing many observer biases.
Acknowledgements
The authors acknowledge grants and financial aid from the New Zealand Department of
Conservation (Research Grant #1822), the University of Otago Research Committee, the
Southland Regional Council (New Zealand) and the Division of Sciences at the
University of Otago, Dunedin, New Zealand that made this research possible. Also
acknowledged is support from Sony New Zealand Ltd, THC Milford Sound, Fiordland
Lobster Company and Mobil and Gore Services Ltd. This work was completed thanks to
postdoctoral fellowship funding from the New Zealand Foundation for Research Science

19
and Technology and the University of Western Australia to Euan Harvey. The authors
are grateful to Chris Battershill June Hill, Justin McDonald, Philip Mladenov and Di
Watson and for comments and suggestions on this manuscript. Additionally, our thanks
to all novice and experienced scientific observers who willingly gave their time to assist
with this research and to two anonymous referees for their constructive comments.
Bibliography
Andrew, N. L., and B. D. Mapstone. (1987). Sampling and the description of spatial
pattern in marine ecology. Oceanography and Marine Biology Annual Review 25: 39-
90.
Bell, J. D. (1983). Effects of depth and marine reserve fishing restrictions on the structure
of a rocky reef fish assemblage in the north-western Mediterranean Sea. Journal of
Applied Ecology 20: 357-369.
Bell, J. D., G. J. S. Craik, D. A. Pollard, and B. C. Russell. (1985). Estimating length
frequency distributions of large reef fish underwater. Coral Reefs 4: 41-44.
Bohnsack, J. A., and S. P. Bannerot. (1986). A stationary visual census technique for
quantitatively assessing community structure of coral reef fishes. NOAA.
Bohnsack, J. A., D. E. Harper, D. B. McClellan, and M. Hulsbeck. (1994). Effects of reef
size on colonisation and assemblage structure of fishes at artificial reefs off
southeastern Florida, U.S.A. Bulletin of Marine Science 55: 796-823.
Bortone, S. A., J. J. Kimmel, and C. M. Bundrick. (1989). A comparison of three
methods for visually assessing reef fish communities: Time and area compensated.
Northeast Gulf Science 10: 85-96.
20
Brock, V. E. (1954). A preliminary report on a method of estimating reef fish
populations. Journal of Wildlife Management, 18: 297-308.
Buckland, S. T., D. R. Anderson, K. P. Burnham, and J. L. Laake. (1993). Distance
sampling. Estimating abundance of biological populations. Chapman & Hall, London.
Caughley, G. (1977). Analysis of vertebrate populations. Wiley, London.
Caughley, G. R., R. Sinclair, and D. Scott-Kemmis. (1976). Experiments in aerial survey.
Journal of Wildlife Management 40: 290-300.
Choat, J. H., and D. R. Bellwood. (1985). Interactions amongst herbivorous fishes on a
coral reef: influence of spatial variation. Marine Biology 89: 221-234.
Cormack, R. M., G. P. Patil, and D. S. Robson, eds. (1979). Sampling biological
populations. International Co-operative Publishing House, Fairland.
Davis, G. E., and T. W. Anderson. (1989). Population estimates of four kelp forest fishes
and an evaluation of three in situ assessment techniques. Bulletin of Marine Science 44:
1138-1151.
Draper, N. R., and Smith, H. (1981). Applied Regression Analysis. Wiley, New York.
709 p.
English, S., C. Wilkinson, and V. Baker, eds. (1994). Survey Manual for Tropical Marine
Resources, 368 p. [Available from the Australian Institute of Marine Science. P.M.B.
No. 3. Townsville Mail Centre, Australia, 4810.]
Estes, J. A., and J. R. Gilbert. (1978). Evaluation of an aerial survey of Pacific Walruses
(Odobenus rosmarus divergens). Journal of the Fisheries Research Board of Canada
35: 1130-1140.
21
Francis, C. M. (1994). Population changes of boreal forest ducks - A comment. Journal
of Wildlife Management 58: 582-586.
Francour, P. (1997). Fish assemblages of Posidonia oceanica beds at Port-Cros (France,
NW Mediterranean): Assessment of composition and long-term fluctuations by visual
census. Marine Ecology 18: 157-173.
GBRMPA (Great Barrier Reef Marine Park and Authority). 1979. Workshop on coral
trout assessment techniques: workshop series 3. G.B.R.M.P.A., Queensland, Australia,
64 p.
Greene, L. E., and W. E. Alevizon. (1989). Comparative accuracies of visual assessment
methods for coral reef fishes. Bulletin of Marine Science 44: 899-912.
Harvey, E. S., and M. R. Shortis. (1996). A system for stereo-video measurement of
subtidal organisms. Journal of the Marine Technology Society 29: 10-22.
Harvey, E. S. (1998). Underwater stereo-video: A tool for minimising the biases in
visual censuses of reef fish. PhD Thesis, Department of Marine Science, University of
Otago, New Zealand.
Harvey, E. and Shortis, M. R. 1998. Calibration stability of an underwater stereo-video
system: Implications for measurement accuracy and precision. Marine Technology
Society Journal, 32(2) : 3-17.
Harvey, E. S., Fletcher, D., and M. R. Shortis. (2001a). A comparison of the precision
and accuracy of estimates of reef-fish lengths made by divers and a stereo-video
system. Fishery Bulletin 99(1): 63-71.
Harvey, E. S., Fletcher, D., and Shortis, M. 2001b. Improving the statistical power of
visual length estimates of reef fish: A comparison of estimates determined visually by

22
divers with estimates produced by a stereo-video system. Fishery Bulletin, 99(1): 72-
80.
Harvey, E. S, Fletcher, D., and M. R. Shortis. (2002a). Estimation of reef fish length by
divers and by stereo-video. A first comparison of the accuracy and precision in the field
on living fish under operational conditions. Fisheries Research 57(3): 257-267.
Harvey, E. S., Shortis, M. R., Stadler, M. and M. Cappo. (2002b). A comparison of the
accuracy and precision of digital and analogue stereo-video systems. Marine
Technology Society Journal 36(2): 38-49.
Jennings, S., and N. V. C. Polunin. (1995). Biased underwater visual census biomass
estimates for target-species in tropical reef fisheries. Journal of Fish Biology 47: 733-
736.
Kingsford, M. and C. Battershill. (1998). Studying temperate marine environments. A
handbook for ecologists. Canterbury University Press, 335 p.
Lincoln Smith, M. P. (1988). Effects of observer swimming speed on sample counts of
temperate rocky reef fish assemblages. Marine Ecology Progress Series 43: 223-231.
Marsh, H., and D. F. Sinclair. (1989). Correcting for visibility bias in strip transect aerial
surveys of aquatic fauna. Journal of Wildlife Management 53: 1017-1024.
McCormick, M. I., and J. H. Choat. (1987). Estimating total abundance of a large
temperate reef fish using visual strip-transects. Marine Biology 96: 469-478.
Odum, H. T., and E. P. Odum. (1955). Trophic structure and productivity of a windward
coral reef community on Eniwetok Atoll, Marshall Islands. Ecological Monograph 25:
291-320.

23
Polunin, N. V. C., and C. M. Roberts. (1993). Greater biomass and value of target coral
reef fishes in two small Caribbean marine reserves. Marine Ecology Progress Series
100: 167-176.
Rakitin, A., and D. L. Kramer. (1996). Effect of a marine reserve on the distribution of
coral reef fishes in Barbados. Marine Ecology Progress Series 131: 97-113.
Ralph, C. J., and J. M. Scott, eds. (1981). Estimating numbers of terrestrial birds. Allen
Press, Lawrence.
Russ, G.R. and A.C. Alcala. 1996. Marine reserves: Rates and patterns of recovery and
decline of large predatory fish. Ecological Applications 6: 947-961.
Samoilys, M. A. (1992). Review of the underwater visual census method developed by
the DPI/ACIAR project: visual assessment of reef fish stocks. Conference Workshop
Series. Queensland Department of Primary Industries.
Samoilys, M. A., and G. Carlos. (1992). Development of an underwater visual census
method for assessing shallow water reef fish stocks in the south west Pacific.
Queensland Department of Primary Industries, Northern Fisheries Centre, Cairns.
Shortis, M. R. and Harvey, E. S. 1998. Design and calibration of an underwater stereo-
video system for the monitoring of marine fauna populations. International Archives
Photogrammetry and Remote Sensing, 32(5) : 792-799.
St. John, J., Russ, G. R., and W. Gladstone. (1990). Accuracy and bias of visual estimates
of numbers, size structure and biomass of coral reef fish. Marine Ecology Progress
Series 64: 253-262.
Thompson, A. A., and B. D. Mapstone. (1997). Observer effects and training in
underwater visual surveys of reef fishes. Marine Ecology Progress Series 154: 53-63.

24
Thresher, R. E., and J. S. Gunn. (1986). Comparative analysis of visual census techniques
for highly mobile, reef associated piscivores (Carangidae). Environmental Biology of
Fishes 17: 93-116.
Watson, R. A., G. M. Carlos, and M. A. Samoilys. (1995). Bias introduced by the non-
random movement of fish in visual transect surveys. Ecological Modelling 77: 205-
214.
Westera, M., Lavery, P. and G. Hyndes. (2003). Differences in recreationally targeted
fishes between protected and fished areas of a coral reef marine park. Journal of
Experimental Marine Biology and Ecology 294: 145 - 168.

25
Novice Scientific Divers
0
2
4
6
8
10
12
2.0 3.0 4.0 5.0 6.0 7.0
True Distance (m)
Estim
ated
Dis
tanc
e (m
)
Experienced Scientific Divers
0
2
4
6
8
10
12
2.0 3.0 4.0 5.0 6.0 7.0
True Distance (m)
Estim
ated
Dis
tanc
e (m
)

26
Stereo-Video
2
4
6
8
10
12
2 3 4 5 6 7 8 9 10 11 12
True Distance (m)
Estim
ated
Dis
tanc
e (m
)
Figure 1

27
Figure 2 (a)

28
Figure 2(b)
29
Figure 2(c)

30
Figure 3a Novice Scientific Divers
-60%-40%-20%
0%20%40%60%80%
100%
2 3 4 5 6 7
Distance (m)
Rel
ativ
e Er
ror
Figure 3b Experienced Scientific Divers
-60%-40%-20%
0%20%40%60%80%
100%
2 3 4 5 6 7
Distance (m)
Rel
ativ
ve E
rror

31
Figure 4a Diver 1
-60%-40%-20%
0%20%40%60%80%
100%
2 3 4 5 6 7
Distance (m)
Rel
ativ
e Er
ror
.
Figure 4b Diver 2
-60%-40%-20%
0%20%40%60%80%
100%
2 3 4 5 6 7
Distance (m)
Rel
ativ
e Er
ror
Figure 4c Diver 3
32
-60%-40%-20%
0%20%40%60%80%
100%
2 3 4 5 6 7
Distance (m)
Rel
ativ
e Er
ror

33
Table 1. Novice Experienced Stereo- Scientific
Divers Scientific Divers Video
Relative Error Mean -5.0% -11.7% -0.9%
SD 18.6% 18.1% 2.6%
Min -44% -29% -7%
Max +58% +46% +7%
Coefficient of 17.9% 21.4% 2.1%
Variation
Table 2.
Novice Experienced Stereo- Scientific
Divers Scientific Divers Video
Distance Lower 76% 91% 96%
Upper 116% 139% 106%
Area Lower 58% 82% 93%
Upper 134% 194% 113%
Table 3
Novice Experienced Stereo- Scientific
Divers Scientific Divers Video
Area Lower 89.0m2 127.7m2 143.7m2 Upper 207.4m2 286.8m2 173.9m2 Actual 154.1m2 154.1m2 154.1m2
Abundance
Lower
31
18
20 Upper 13 35 24 Actual 20 20 20
34
Captions for figures and tables.
Figure 1. The accuracy of visual estimates of distance by experienced and novice scientific divers
and a stereo-video system. The estimates are represented by the crosses while the dotted line
represents the real distance. The solid lines above and below the dotted line represent the 95%
confidence intervals.
Figure 2. The effect of error in distance estimates for novice (a), and experienced scientific divers
(b) and a stereo video system (c) on the actual area censused for a 7 m point count. The actual
border of the point count is represented by the middle black line (A) while the outer and inner
lines represent the upper (U) and lower (L) confidence intervals of the borders. The symbolised
fish help to visualise the potential effect that distance error may have on counts of fish abundance.
Figure 3. The distribution of the relative error of length for novice (a) and experienced (b)
scientific divers collected under controlled conditions on silhouettes of fish.
Figure 4. The distribution of the relative error of length for three experienced scientific divers (a =
Diver 1, b = Diver 2, c = Diver 3) collected under field conditions with real fish. N = 200 for
each diver.
Table 1. Summary statistics for visual distance estimates made by novice and experienced
scientific divers and an underwater stereo-video system. The coefficient of variation shown is the
average over the set of true distances.
Table 2. Confidence limits for the true radial distance and area censused during a point count
based on visual distance estimates made by novice and experienced scientific divers and an
underwater stereo-video system. All limits are expressed as percentages of the estimate, for a
point count with a nominal radial distance of 7 m.

35
Table 3. Confidence limits for the actual area censused during a point count and the numbers of
fish counted within each interval. All limits are expressed as m2 or numbers of fish for a point
count with a nominal radial distance of 7.


![rip.eng.hawaii...• Standalone underwater systems for rapid-response underwater 3D object reconstruction. Angle [deg] vs. Distance [m] 30 60 30 210 60 240 90 270 120 300 150 330 180](https://img.pdfslide.us/doc/110x75/60b2d39baec94818391df431/ripenghawaii-a-standalone-underwater-systems-for-rapid-response-underwater.jpg)