Embed Size (px)
Citation preview
RESEARCH ARTICLE
Alternating Current Stimulation for VisionRestoration after Optic Nerve Damage: ARandomized Clinical TrialCarolin Gall1☯*, Sein Schmidt2☯, Michael P. Schittkowski3, Andrea Antal4, GézaGergely Ambrus4, Walter Paulus4, Moritz Dannhauer5, Romualda Michalik1, Alf Mante2,Michal Bola1, Anke Lux6, Siegfried Kropf6, Stephan A. Brandt2, Bernhard A. Sabel1
1 Institute of Medical Psychology, Medical Faculty, Otto-von-Guericke University Magdeburg, Magdeburg,Germany, 2 Department of Neurology, Charité-Universitätsmedizin Berlin, Berlin, Germany, 3 Department ofOphthalmology, University Medical Center, Georg-August University of Goettingen, Goettingen, Germany,4 Department of Clinical Neurophysiology, University Medical Center, Georg-August University, Goettingen,Germany, 5 Center for Integrative Biomedical Computing and the Scientific Computing and Imaging Institute,University of Utah, Salt Lake City, Utah, United States of America, 6 Institute for Biometry and MedicalInformatics, Otto-von-Guericke University Magdeburg, Magdeburg, Germany
☯ These authors contributed equally to this work.* [email protected]
Abstract
Background
Vision loss after optic neuropathy is considered irreversible. Here, repetitive transorbital
alternating current stimulation (rtACS) was applied in partially blind patients with the goal of
activating their residual vision.
Methods
We conducted a multicenter, prospective, randomized, double-blind, sham-controlled trial
in an ambulatory setting with daily application of rtACS (n = 45) or sham-stimulation (n = 37)
for 50 min for a duration of 10 week days. A volunteer sample of patients with optic nerve
damage (mean age 59.1 yrs) was recruited. The primary outcome measure for efficacy was
super-threshold visual fields with 48 hrs after the last treatment day and at 2-months follow-
up. Secondary outcome measures were near-threshold visual fields, reaction time, visual
acuity, and resting-state EEGs to assess changes in brain physiology.
Results
The rtACS-treated group had a mean improvement in visual field of 24.0% which was signif-
icantly greater than after sham-stimulation (2.5%). This improvement persisted for at least 2
months in terms of both within- and between-group comparisons. Secondary analyses
revealed improvements of near-threshold visual fields in the central 5° and increased
thresholds in static perimetry after rtACS and improved reaction times, but visual acuity did
not change compared to shams. Visual field improvement induced by rtACS was associated
with EEG power-spectra and coherence alterations in visual cortical networks which are
PLOSONE | DOI:10.1371/journal.pone.0156134 June 29, 2016 1 / 19
a11111
OPEN ACCESS
Citation: Gall C, Schmidt S, Schittkowski MP, AntalA, Ambrus GG, Paulus W, et al. (2016) AlternatingCurrent Stimulation for Vision Restoration after OpticNerve Damage: A Randomized Clinical Trial. PLoSONE 11(6): e0156134. doi:10.1371/journal.pone.0156134
Editor: Margaret M DeAngelis, University of Utah,UNITED STATES
Received: November 15, 2015
Accepted: May 10, 2016
Published: June 29, 2016
Copyright: © 2016 Gall et al. This is an open accessarticle distributed under the terms of the CreativeCommons Attribution License, which permitsunrestricted use, distribution, and reproduction in anymedium, provided the original author and source arecredited.
Data Availability Statement: Data are available fromInstitute for Biometry and Medical Informatics, Otto-von-Guericke University Magdeburg for researcherswho meet the criteria for access to confidential data.Data requests may be sent to [email protected]
Funding: This study was funded in part, by theGerman Federal Education and Research Ministry,grant ERA-net Neuron (BMBF 01EW1210) to BASand CG, by the University of Magdeburg (LOM-grantto MB), by the German Research Foundation, Grantnumber BR 1691/8-1 to SS, and by the NationalInstitute of General Medical Sciences of the National
interpreted as signs of neuromodulation. Current flow simulation indicates current in the
frontal cortex, eye, and optic nerve and in the subcortical but not in the cortical regions.
Conclusion
rtACS treatment is a safe and effective means to partially restore vision after optic nerve
damage probably by modulating brain plasticity. This class 1 evidence suggests that visual
fields can be improved in a clinically meaningful way.
Trial Registration
ClinicalTrials.gov NCT01280877
IntroductionOptic neuropathy and glaucoma are frequent causes of chronic blindness [1]. After a spontane-ous recovery period, visual field (VF) loss is considered irreversible which compromises vision-related quality of life (QoL) [2–4]. A systematic search for a means to improve such vision lossis urgently needed.
Transcranial direct current stimulation (tDCS) and alternating current stimulation (ACS)of the brain are new methods to modify brain excitability and synchronicity in healthy subjectsand patients with brain injuries affecting different modalities such as the motor [5], language[6], or somatosensory domains [7]. In the visual system, exploratory evidence indicates thatACS can enhance neuronal function both in normal subjects [8–9] and in patients with VF losswho still have some residual vision [10]. The proposed mechanism of action is neuromodula-tion of oscillatory brain activity towards a more synchronized EEG via entrainment of specificstimulation frequencies [10–11], and the reorganization of brain functional connectivity net-works [12] is considered to be a novel and promising avenue for visual rehabilitation [13].
In a small sample study, ACS was delivered in frequencies ranging from theta to high betavia electrodes placed near the eye to re-activate residual vision in optic neuropathy [14]. Here,10 daily rtACS sessions increased light detection performance and improved patient-reportedvision-related QoL which was moderately correlated with VF gains [15]. These improvementswere associated with increased alpha-power at occipital sites in resting-EEGs [14,16] andincreased neuronal synchronization of functional connectivities between the occipital andfrontal regions [12]. Yet, the level of clinical evidence is still not definitive because the trialsincluded only small patient samples [12,14–16]. We hypothesized that efficacy and safetycould be documented in a larger sample prospective trial.
We now report the first confirmatory, large-sample, double blind, randomized, multi-centerclinical trial to establish the efficacy and safety of rtACS stimulation in patients with visionimpairments caused by optic nerve damage.
Methods
Study designThe trial flow diagram and study design are shown in Fig 1A and 1B. Diagnostic evaluationswere conducted at BASELINE, after completion of the 10-day treatment (POST), and after a2-month treatment-free interval (FOLLOW-UP). The CONSORT checklist (S1 File) and statis-tical analyses protocol (S2 File) are included as supporting information.
Alternating Current Stimulation for Vision Restoration
PLOS ONE | DOI:10.1371/journal.pone.0156134 June 29, 2016 2 / 19
Institutes of Health (USA) under grant number P41GM103545-17 to MD, and by EBS (Germany). Thefunders had no role in study design, data collectionand analysis, decision to publish, or preparation ofthe manuscript.
Competing Interests: The authors have declaredthat no competing interests exist.
Abbreviations: ACS, alternating current stimulation;CSF, conductive cerebrospinal fluid; HRP, highresolution perimetry; QoL, quality of life; tDCS,transcranial direct current stimulation; rtACS,repetitive transorbital alternating current stimulation;VF, visual field.

Fig 1. Consort flow chart and study design. (A) Patient flow for cases included in the primary outcomemeasure analysis. Of 98 eligible patients, 45 were treated with rtACS and 37 with sham-stimulation. Fivesubjects left the study between initial screening and BASELINE for different reasons and another fivesubjects were excluded due to violation of an inclusion criterion (unacceptable fluctuations between initialscreening and BASELINE). During the treatment phase three subjects dropped out because of medical
Alternating Current Stimulation for Vision Restoration
PLOS ONE | DOI:10.1371/journal.pone.0156134 June 29, 2016 3 / 19

The study design was prospective and double blind; neither the patients nor the diagnosticexaminers were aware to which treatment arm the patient belonged. For allocation conceal-ment, patients of the sham-group received minimal dose stimulation. The investigator admin-istering the treatment was aware of the group identity but was instructed not to reveal to thepatients which treatment they received. Patients were informed to which group they belongedonly after the FOLLOW-UP tests, and all sham-stimulation patients were offered rtACS.Informed written consent was obtained prior to randomization. Study participants received acompensation for study participation. The ethics committees of the participating study centersin Magdeburg, Berlin, and Goettingen approved the study, and a statistical analysis plan wasfiled with the lead ethics committee. The study was conducted according to the Declaration ofHelsinki and registered at ClinicalTrials.gov (NCT01280877). The trial was registered in Janu-ary 2011 upon receiving approval from the leading ethics committee in December 2010. Thedate range for patient recruitment and follow-up was from December 2010 until February2012. The authors confirm that all ongoing and related trials for this intervention areregistered.
Study sample descriptionPatients who suffered visual field loss caused by glaucoma (n = 33) or AION (n = 32) were ran-domized. The following etiologies of optic atrophy were also included: post-acute inflamma-tion (n = 12), optic nerve compression (n = 5, of which 4 were tumor-induced and 1intracranial hemorrhage), congenital or unknown etiology of optic atrophy (n = 5), and Leber'shereditary optic neuropathy (n = 3). Eight patients had two concomitant diagnoses of opticnerve atrophy. The sample sizes at each study center were as follows: Charité Berlin (n = 33),Otto-von-Guericke University Magdeburg (n = 31), and Department of Ophthalmology,Georg-August University of Goettingen/ Eye Clinic Kassel (n = 18). Table 1 summarizes thedemographics and lesion variables. With respect to BASELINE variables, results did not signifi-cantly differ between the rtACS- and the sham-group (Table 2).
Sample size and randomizationThe sample size calculation was based on results of two earlier pilot studies at the Institute ofMedical Psychology (University of Magdeburg) considering similar patients and equivalentstimulation schemes, i.e., rtACS- and sham-groups as in the present trial. In the first trial amean percentage increase (± standard deviation) of 65.61 ± 104.35 was observed in the rtACS-group (n = 19) and 16.93 ± 31.22 in the sham-group (n = 14). The corresponding results of thesubsequent trial were 30.68 ± 41.97 in the stimulation group (n = 12) and 9.57 ± 12.05 (n = 13)for the sham group. Using these means and standard deviations in a sample size calculation(α = 0.05, two-sided, power 1 – β = 0.80) for a two-sample t-test (Satterthwaite version) withnQuery Advisor 7.0 resulted in 41 patients per group for the first trial and 36 patients pergroup for the second trial. Therefore, we adopted a conservative approach of considering up to10 percent drop-out and planned to recruit 45 patients per group. Patients were assigned toeither the rtACS- or the sham-group by “Randomization In Treatment Arms” software (RITA,
conditions that were unrelated to study participation. Three treated cases of legally blind subjects wereexcluded from subsequent analyses due to violation of inclusion criterion (no residual vision). (B) Studydesign with diagnostic and treatment visits. Randomization was done after BASELINE assessment. Stabilityof VF defects was ascertained by comparing VFs at BASELINE with those obtained during the screening visit2 weeks earlier. Upon completion of the 10-day treatment, all initial diagnostic tests were repeated (POST).The FOLLOW-UP diagnostic assessment was conducted after a therapy-free interval of at least 2 months.
doi:10.1371/journal.pone.0156134.g001
Alternating Current Stimulation for Vision Restoration
PLOS ONE | DOI:10.1371/journal.pone.0156134 June 29, 2016 4 / 19

StatSol, Lübeck) with stratified block randomization considering the study center and the VFdefect depth at BASELINE as potential prognostic factors. High vs. low defect depth wasdefined as stimulus detection rates below vs. above 30% inside the VF defect.
Randomization resulted in comparable average baseline situation and demographics in thertACS- and sham-group. Only the percentage of males vs. females was unequally distributedbut this was independent of study results.
Inclusion and exclusion criteriaThe following criteria were established prospectively. Inclusion criteria included: (i) stable VFdefect with residual vision as detected by super-threshold perimetry testing (HRP, cut-off 1.5%in at least one eye); (ii) lesion age>6 months; (iii) patient age>18 yrs; (iv) compliance withthe experimenters’ instructions during diagnostic testing; and (v) sufficient fixation ability.Exclusion criteria included: electric or electronic implants (such as cardiac pacemaker); anymetal artifacts in the head or truncus area (with the exception of dental implants); epilepsy andphoto-sensibility; acute auto-immune diseases; psychiatric diagnoses; diabetic retinopathy orother documented retinal impairments; high blood pressure (>160/100 mmHg); acute con-junctivitis; retinitis pigmentosa; pathological nystagmus; an unstable or high level of intraocu-lar pressure (> 27 mm Hg); and presence of an un-operated tumor or cancer recurrenceanywhere in the body.
Statistical analyses and study endpointsPrimary data analysis was conducted independently by the biometry department of two of thecoauthors (A.L., S.K.) and included sample size calculation, statistical analysis plan, initializa-tion of randomization and data source verification. Primary and secondary endpoints weredefined prospectively.
VF mapping was conducted using a campimetric, high-resolution, super-threshold visualdetection test (HRP) [17], a method that reveals areas of residual vision in the central VF with
Table 1. Patients’ demographics and lesion characteristics.
rtACS-group Sham-group p
Sample size, n 45 37
Age (years), mean ± standard error mean (SEM) 57.8 ± 14.2 60.7 ± 11.6 0.563
Male, (%) 71.1 40.5 0.005
Lesion age, 6–12 months (%) 13.9 7.4 0.206
right eye 1–2 years (%) 8.3 0.0
> 2 years (%) 77.8 92.6
Lesion age, 6–12 months (%) 8.3 14.8 0.468
left eye 1–2 years (%) 16.7 7.4
> 2 years (%) 75.0 77.8
single diagnosis 88.9 89.2 0.965
dual diagnosis 11.1 10.8
Binocular lesions n(%)1 60.0 46.0 0.442
Monocular lesions, one eye intact (%) 31.1 45.9
Monocular lesions, one eye blind (%) 8.9 8.1
1 In cases with binocular vision loss both eyes were averaged for subsequent analyses. P-values are reported for Wilcoxon-Mann-Whitney U tests, two-
sided and Pearson-Chi-Square tests, two-sided.
doi:10.1371/journal.pone.0156134.t001
Alternating Current Stimulation for Vision Restoration
PLOS ONE | DOI:10.1371/journal.pone.0156134 June 29, 2016 5 / 19

lower inter-test-variability than standard static perimetry due to target luminance abovethreshold. In a darkened room, the patient was viewing a 17" monitor from a chin-head-rest ata distance of 42 cm. White target stimuli were presented at random in a grid of 25x19 stimuluslocations and the task was to hit the space bar. The procedure included a fixation control usingisoluminant color changes of the fixation point. Eyes with intact vision or complete blindnesswere not considered. The primary endpoint was “percent change over BASELINE” in the HRPdetection rate.
Secondary endpoints of HRP were percentage change of the stimulus detection rate in thedefective VF (excluding intact areas), the central 5°-VF, and average reaction time in total HRPVF. Further secondary endpoints were static and kinetic perimetry results (foveal and meanthreshold of 30°-VFs, mean eccentricity/VF size), best corrected near and far visual acuity(Landolt), and patient-reported outcome, i.e., an intervention-related questionnaire with astructured response format and a vision-related QoL questionnaire (NEI-VFQ-39) [18] to eval-uate subjective improvements of “visual field defect and related impairments” (15 items) and“general health and mental distress” (four items) at POST and FOLLOW-UP. Concerningstatic perimetry foveal threshold and mean threshold of 30°-VFs were obtained. A fast
Table 2. Visual field characteristics at BASELINE according to treatment arms.
rtACS-group Sham-group p
High-resolution perimetry
Detection accuracy whole VF (%) 44.59 [25.18; 63.82] 53.48 [37.34; 75.70] 0.142
Detection accuracy defective VF sectors (%)1 17.92 [12.06; 31.03] 23.31 [14.37; 38.94] 0.228
Detection accuracy within 5° VF (%) 56.25 [34.38; 75.35] 62.50 [45.83; 76.74] 0.459
Fixation accuracy (%) 91.70 [83.46; 97.26] 94.25 [84.40; 97.51] 0.586
False positive reactions (%) 2.18 [0.85; 4.00] 1.30 [0.49; 3.57] 0.155
Reaction time whole VF (ms) 525 [461; 575] 509 [463; 569] 0.394
Reaction time HRP defective VF sectors (ms) 554 [510; 581] 544 [485; 575] 0.261
Reaction time within 5° VF (ms) 484 [432; 565] 480 [429; 519] 0.554
Standard automated perimetry
Foveal threshold, static perimetry (dB) 21.25 [15.50; 27.00] 25.00 [19.00; 28.50] 0.113
Mean threshold, static perimetry (whole VF, dB) 8.78 [5.91; 15.74] 11.95 [6.7; 15.97] 0.320
Fixation accuracy, static perimetry (%) 93.81 [69.25; 100] 94.87 [86.13; 100] 0.259
Mean eccentricity, kinetic perimetry (degree) 46.82 [34.29; 55.40] 48.13 [28.09; 56.38] 0.899
Mean VF size, kinetic perimetry (square degree) 7280 [4461; 9743] 7907 [3131; 10053] 0.817
Visual acuity (logMAR)2
Uncorrected near vision (n = 77) 0.75 [0.45; 1.10] 0.80 [0.60; 1.10] 0.267
Uncorrected far vision (n = 69) 0.50 [0.29; 0.92] 0.44 [0.22; 0.70] 0.708
Results are given as medians and interquartile ranges. The groups did not differ significantly in any of the
BASELINE measures (Wilcoxon-Mann-Whitney U tests, two-sided).1 To balance the groups for randomization with respect to defect depth, the BASELINE VF defect was
classified as having a high or low defect depth with a threshold of 30% detection accuracy in the defective
VF. Based on this classification, 55 patients (67.1%) belonged to the high and 27 (32.9%) to the low defect
depth group. Between-group differences of the BASELINE diagnostic values were not statistically
significant in any measure (Wilcoxon-Mann-Whitney U test, two-sided).2 Visual acuity was calculated for all patients with better visual acuity than counting fingers (logMAR = 3).
Therefore, five subjects had to be excluded from the recording of near vision and 13 subjects from far
vision acuity.
doi:10.1371/journal.pone.0156134.t002
Alternating Current Stimulation for Vision Restoration
PLOS ONE | DOI:10.1371/journal.pone.0156134 June 29, 2016 6 / 19

threshold strategy was used to determine threshold values at 66 positions within the 30° visualfield. Target stimuli (size: III/4mm2, white, luminance: 318 cd/m2/ 0db, duration: 0.2 sec) werepresented on a background with constant luminance of 10cd/m2. Mean threshold refers to theaverage dB values of 66 test positions. In kinetic perimetry the VF border was determined for24 meridians (spaced by 15°) in randomized order at a constant luminance threshold of III/4e(0dB) and a velocity of 2° per sec. Mean eccentricity refers to the average of 24 meridians.Mean visual field size refers to the area inside the VF border in kinetic perimetry, i.e., the sumof 24 triangles (X axis eccentricity multiplied by Y axis eccentricity /2).
The percent change over BASELINE was determined at 48 hrs (minimum interval) afterthe last stimulation day (i.e., the 10th stimulation session) (POST) and at 2 months FOL-LOW-UP (FU) for each endpoint as 100�(POST resp. FOLLOW-UP–BASELINE) / BASE-LINE. HRP reaction time (absolute differences), visual acuity (logarithmic values) andquestionnaire data were shown as absolute values. For binocular defects the value of botheyes was averaged. Since there were no center effects (neither as the main factor nor as aninteraction with the treatment arm), nor dependencies of BASELINE results for the primaryendpoint, the primary data analysis and secondary between-group comparisons were per-formed for the pre-defined hypothesis with a one-sided U-test (p-value<0.05). The Hodges-Lehmann effect estimator and 95%-confidence intervals (CI) are reported. Within-groupcomparisons were calculated with Wilcoxon matched-pairs signed rank-tests. Analyses weredone in MatlabR2011b and SPSS 21.
EEG power spectra after rtACSAll subjects were seated in a dimly lit room and instructed to keep their eyes closed during thewhole recording session. Electroencephalography (EEG) was recorded for 2 min before andafter each stimulation session using 16 electrodes (10–20 system) with impedances<10kΩwith eyes closed (at rest) in a darkened room. The EEG-signal at occipital (O1, O2) areas ofinterest (AOIs) was referenced against the grand-average and preprocessed with ASA™- soft-ware (ANT, Enschede, Netherlands) including a bandpass-filter (0.5–40Hz, filter-slope 24dB/oct.), 2 sec bins, and baseline correction. Power-spectra at occipital sites O1 and O2 wereassessed with Fast Fourier Transformation (FFT) to determine bandwidth specific power(μV2) with automatic artifact-rejection (min/max allowed amplitude: ±75.00μV), normalizedpower-spectra and DC-correction during FFT-averaging. Resting state eyes-closed EEG imme-diately before and after one day of treatment was analyzed after the first rtACS session. TheEEG data were analyzed in 3 steps. First, we defined 5 spectral bands: delta, 1–3 Hz; theta, 3–7Hz; alpha (alpha I), 7–14 Hz; and beta, 14–30 Hz. Between-group comparisons were conductedwith independent samples t test. The effects of rtACS or sham-stimulation on EEG measureswere analyzed as ΔEEG = EEGpost−EEGpre. To assess functional interactions between brainregions coherence was analyzed indicating coupling between two signals as a function of fre-quency [19]. Coherence was calculated for each pair of channels ij and defined as follows:
Cij fð Þ ¼ jSijðf Þj2Siiðf Þ Sjjðf Þ
In this equation S denotes the spectrum of signals from two EEG channels i and j, for agiven frequency bin f.
Changes in spectral power of oscillatory brain activity and strength of functional connectiv-ity over the visual cortex after the first stimulation session were then related to the primary out-come measure. To assess the relationship between EEG and primary outcome measures,Spearman correlation coefficient was used.
Alternating Current Stimulation for Vision Restoration
PLOS ONE | DOI:10.1371/journal.pone.0156134 June 29, 2016 7 / 19
Repetitive transorbital alternating current stimulationAfter BASELINE assessments patients were stimulated with either rtACS or sham-stimulationon 2 × 5 weekdays for 25 min at day1 to 50 min at day10 with eyes closed. Four 10mm Grassgold electrodes (SAFELEAD™, Astro-Med, Inc, USA), 2 for each eye, were placed on the skinnear the orbital cavity (“transorbital”), and biphasic square-pulses were applied in bursts(Alpha SYNC stimulator, EBS Germany). The return electrode (stainless steel plate, 32x30mm) was positioned on the right arm. Stimulation current strength was 125% of phosphenethreshold recorded during 5 Hz stimulation. rtACS was conducted with frequencies between8–25 Hz. To conceal group identity, sham-patients received only one ACS burst per minute(“minimal” stimulation) to create phosphene experiences.
SafetyPossible side effects were evaluated by a semi-structured daily interview that included querieson mild headache, discomfort, and vertigo as expected minor adverse events. Patients were alsoasked at the end of each daily stimulation session and at POST and FOLLOW-UP to reportany adverse effects, such as uncommon or uncomfortable sensations.
Simulating alternating current flowFor assessing current flow properties of rtACS, a single computer simulation was performed tomimic stimulation using an electrode placed over the right eye and return electrode at the neckregion of the subject. Although four electrodes were used for treatment, they were only usedone at a time. Therefore, the current flow simulation was done only with one electrode, repre-senting all other electrodes. A finite element model was developed using multi-modal imagingdata (MRI/CT) of a 40-yrs-old male. Isotropic conductivities were assigned to head tissuessuch as scalp, cerebrospinal fluid, gray and white matter (0.43, 1.79, 0.33, 0.142; [20]), air pock-ets (1e-6 S/m), skull (0.01 S/m [21–22], and eye tissue (0.6, 1.05, 0.4 S/m for sclera, intraocularand nerve tissue [23]. One circular electrode (height/diameter: 3/10 mm, conductivity: 1.5 S/m) was placed above the subject's right eyebrow and a return electrode was modeled as the lastaxial slice of the neck region (SCIRun software, current injection: +/-0.5 mA [21]. The simula-tion represents a quasi-static solution of the Maxwell equations and serves as an approximationfor current density estimation of one time sample during rtACS when the cathode and anodereaches its maximal current intensity value.
Results
SafetyNone of the participants reported discomfort during the stimulation. One serious adverseevent with subsequent hospitalization occurred, but it was unrelated to rtACS. Transient ver-tigo was reported by two rtACS-subjects in a total of five sessions and one sham-subject experi-enced persistent vertigo for 0.5 hrs after each session. Temporary dizziness was reported onceafter a single rtACS-session. Mild headache during a single stimulation session was reportedonce by an rtACS-subject and once by a sham-subject. Further reports were mild headachesimmediately after a stimulation session by four rtACS- and two sham-subjects and cutaneoussensations in eight sham- and 12 rtACS-subjects. Back pain and stiff neck were reported byone rtACS-subject on the first four stimulation days. This subject dropped out of the study.
Concerning autonomic activity, we did not observe meaningful changes induced by rtACS(pre-session rtACS values: systolic pressure 131.54±1.94mmHG, diastolic pressure82.81 ± 1.72 mmHg, heart rate 72.82 ± 1.02, post-session rtACS values: systolic pressure
Alternating Current Stimulation for Vision Restoration
PLOS ONE | DOI:10.1371/journal.pone.0156134 June 29, 2016 8 / 19

129.19 ± 2.94 mmHg, diastolic pressure 82.20 ± 1.24 mmHg, heart rate 70.69 ± 0.99; meansand SEM).
Primary outcome measureConcerning the primary outcome, percent change over baseline in detection rates in VF tests,rtACS-treated patients showed significantly greater improvements than sham-treated patients(p = 0.011, Mann-Whitney U, Fig 2A). Due to the higher number of responders in the rtACS-group the mean improvement of VFs at POST was 24.0% detection accuracy after rtACS vs2.5% after sham-treatment. The corresponding effect estimator of the median difference(BASELINE vs. POST) between treatment arms was 5.0%, CI[0.6;10.0]. While the rtACS-group exhibited significant improvements in BASELINE vs. POST comparisons of medians(Hodges-Lehmann-estimator 6.4%, CI[2.9;11.6], p<0.001 (Wilcoxon signed rank test, one-sided), the sham-group did not (1.1%, CI[-2.0;4.3]). Fig 2B depicts HRP visual charts of twopatients with the greatest improvements in the primary outcome measure in both groups. Reli-ability parameters of HRP and eye-tracking documented excellent retinotopic reliability of theprimary outcome measure, validating that improved visual detection could not be explained byaltered eye movements (S2 Fig).
Secondary outcome measuresTable 3 summarizes the results of the trial. The median between-group difference in percentagedetection rate change in the defective VF did not reach statistical significance, (8.2% CI[-5.9%;22.5%, p = 0.131) because this parameter significantly increased in both groups; by41.3% (CI[31.5; 54.3]) in the rtACS- and 33.2% (CI[23.4; 44.2]) in the sham-group (bothp<0.001). Reaction time changes in HRP improved in the rtACS-group (median) by 8ms, (CI[-16;0], p = 0.023), with a trend in the sham-group of 4ms (CI[-15;2], p = 0.069); the between-group difference was not significant (p = 0.35). Other secondary outcome measures obtained atPOST did not reveal significant between-group differences. For example, visual acuity did notchange significantly (Table 3).
After 10 days rtACS, the mean threshold in static perimetry (median change 9.3%; CI[2.6;20.3], p = 0.003) significantly increased while after sham-stimulation no significant changein threshold in static perimetry was noted (median change 1.9%; CI [-4.8%, 8.8%]). Concerningmean VF size obtained in kinetic perimetry, a clinically negligible but still significant increasewas observed in both groups (median change after rtACS 4.3% [-0.3%, 11.9%]; p = 0.036, andafter sham-stimulation 4.8% [-1.5%, 16.1%], p = 0.040).
Additionally, at BASELINE, POST and FOLLOW-UP, patients completed a neuropsycho-logical test battery that included an alertness reaction time test, and a trail-making paper-pen-cil-test. Performance in these tests remained largely unchanged in both groups. However, asignificant increase in reaction time in the alertness test was observed in the rtACS- but not inthe sham-group (S1 Table). Improvements in the performance of the Trail Making Test wereobserved in both groups.
Outcome assessment at 2-months Follow-Up and outcome predictionThe differences between FOLLOW-UP and BASELINE are somewhat smaller than the differ-ences between POST and BASELINE with a persistent significant effect in the primary measuredetection accuracy in HRP in terms of both within- and between-group comparisons, indicat-ing the stability of the gains (Fig 2A). Interestingly, at FOLLOW-UP static perimetry thresh-olds increased beyond POST-levels in the rtACS-group and reached levels significantly higherthan at BASELINE (median change 11.7%; CI[3.7;29.5]; p = 0.001) which was not observed in
Alternating Current Stimulation for Vision Restoration
PLOS ONE | DOI:10.1371/journal.pone.0156134 June 29, 2016 9 / 19
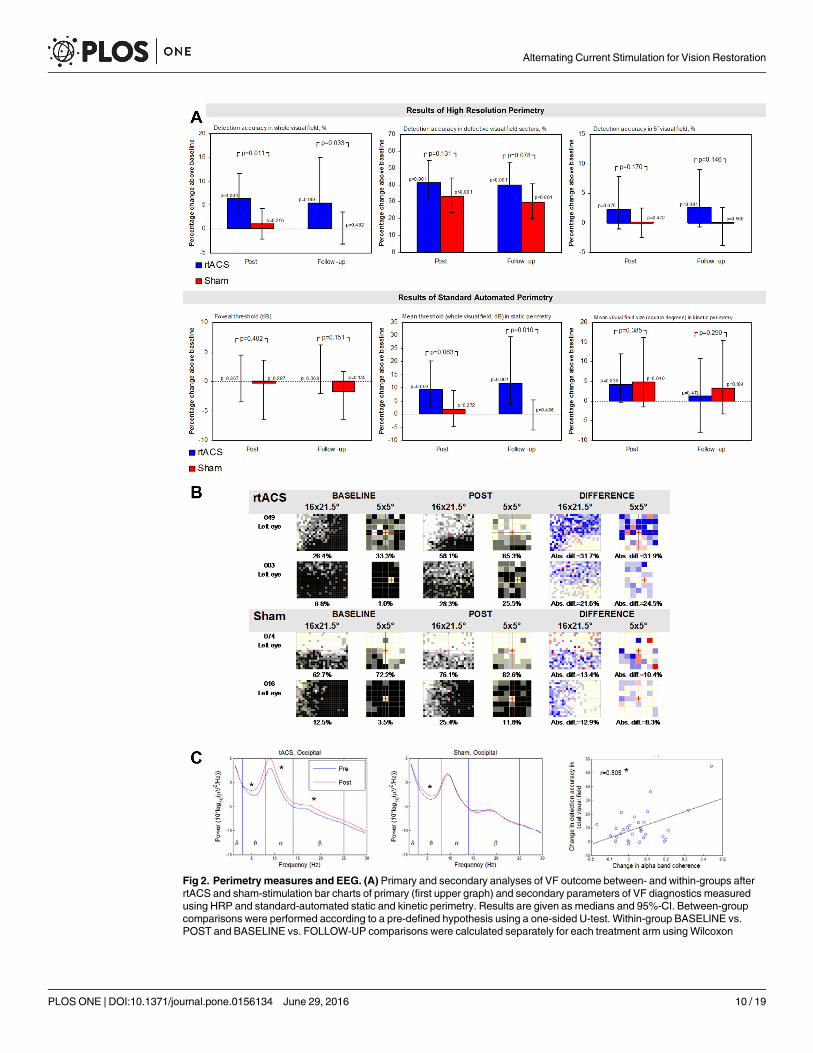
Fig 2. Perimetry measures and EEG. (A) Primary and secondary analyses of VF outcome between- and within-groups afterrtACS and sham-stimulation bar charts of primary (first upper graph) and secondary parameters of VF diagnostics measuredusing HRP and standard-automated static and kinetic perimetry. Results are given as medians and 95%-CI. Between-groupcomparisons were performed according to a pre-defined hypothesis using a one-sided U-test. Within-group BASELINE vs.POST and BASELINE vs. FOLLOW-UP comparisons were calculated separately for each treatment arm usingWilcoxon
Alternating Current Stimulation for Vision Restoration
PLOS ONE | DOI:10.1371/journal.pone.0156134 June 29, 2016 10 / 19
the sham-group. The 10.2% between-group difference at FOLLOW-UP was significant atp = 0.01 (CI[1.4%;22.8]). VF improvement as measured by kinetic perimetry did not persistafter 2 months in both groups. A treatment outcome prediction model was used to predict thechange in HRP visual fields based on BASELINE results [24] (S2 Fig).
Patient-reported outcomesIn subjects with binocular vision impairment, NEI-VFQ measures of vision-related QoL indi-cated improved ratings of NEI-VFQ scales “VF defect and related impairments” after rtACS aswell as improved ratings of “general health and mental distress” after sham. In the interven-tion-related questionnaire, the items “treatment was helpful”, “increased vision after treat-ment” at POST, and “satisfied with treatment”, “general perception” at FOLLOW-UP weremore frequently answered positively after rtACS than after sham (S3 Fig).
EEG power-spectra and functional connectivity changesGroup comparisons of the EEG-spectrum confirm that alpha- and beta but not theta powerincreases were significantly greater after 10 days rtACS (median change: 0.037) than aftersham-stimulation (median change: 0.015), F(1,1529.605) = 6.894, p = 0.009. Unspecific powerincreases after 10 days sham-stimulation were only found in the theta power-band, which mayreflect fatigue during the course of the experiment.
After the first rtACS session, an increase of spectral power was observed in theta, alpha andbeta frequency bands in both the occipital and frontal regions. The occipital coherence changeafter the first stimulation session was significantly correlated with final treatment outcome(Fig 2C).
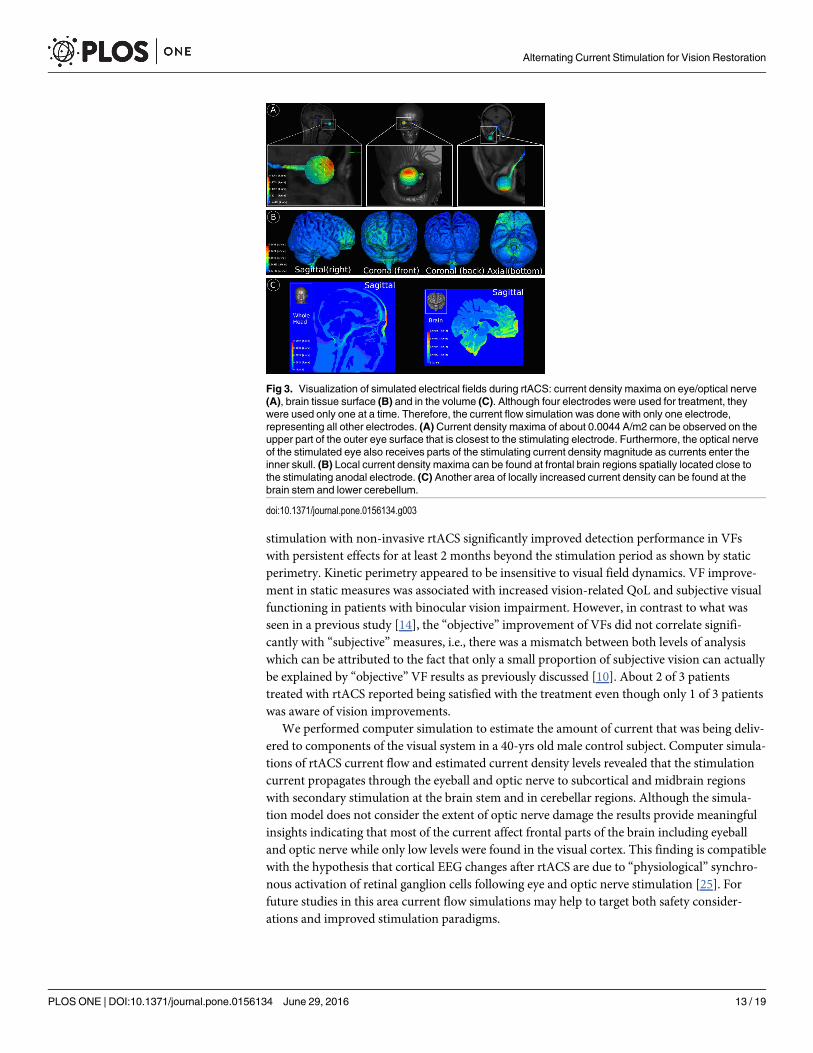
Current flow simulationComputer simulations of current flow in the intact brain suggest that a considerable amount ofcurrent enters the skull through the eye and optic nerve (Fig 3A), affecting brain regions closeto the eye socket. Fig 3B indicates that some amount of current appears to be shunted directlythrough the skull into the frontal cortex as seen by current density concentrations (of approxi-mately similar magnitude) just behind the electrode. Inside the skull, highest current densitieswere observed in high conductive cerebrospinal fluid (CSF) inferior to the brain stem (Fig 3C),which indicates that most of the current flows along the shortest path of lowest resistance atthe skull base within CSF liquor. A major proportion of the current appears to leave the skullthrough the foramen magnum and down the spinal cord into the ground. There was also anincreased current density magnitude at the lower cerebellum and lower brain stem (Fig 3B and3C). In Fig 3C (left), higher current densities are also present in skin tissue close to the elec-trode and lower current densities at lower conducting materials such as skull tissue, internal air
matched-pairs signed rank tests. The respective p-values are reported with p<0.05 considered as significant. (B) Individualchange in HRP VF charts at BASELINE and POST in the two best responding patients of both groups. By superimposing HRPcomputer campimetric VF charts of three repeated measurements, VF areas were categorized as intact (perfect stimulusdetection at a given location, white spots), partially damaged/relative defect (inconsistent stimulus detection, grey spots), andabsolutely impaired areas (no stimulus detected, black spots). Detection increases and decreases after intervention are shownin blue and red, respectively. The percentage improvement of the detection accuracy was comparable between the whole HRPVF 16x21.5° and the central 5° VF. (C) Power spectra before and after the first stimulation session. Left sub-figure: One sessionof tACS increased power of theta (Z = 3.583, p<0.001), alpha (t = 4.571, p<0.001) and beta bands (Z = 3.142, p = 0.002)recorded from electrode positions above the visual cortex. Middle sub-figure: After sham stimulation a significant powerincrease was observed for only the theta band (Z = 3.147, p = 0.002). Right sub-figure: Scatter plot showing the relationbetween change in alpha band coherence at the occipital area of interest and change in detection accuracy in total visual field(primary outcomemeasure).
doi:10.1371/journal.pone.0156134.g002
Alternating Current Stimulation for Vision Restoration
PLOS ONE | DOI:10.1371/journal.pone.0156134 June 29, 2016 11 / 19

cavities, and tissues remotely located from current injection sites. Smaller current density mag-nitudes are present in gray matter and white matter tissues of the brain (Fig 3C (right)) peakingin the frontal and lower cerebral regions. The thalamus and visual cortex show only low currentdensities compared to other sites presumably because they are further away from the shortestpath between electrodes.
DiscussionThe present randomized controlled, multi-center trial of non-invasive electrical brain stimula-tion documents the efficacy and safety of rtACS-treatment in patients with vision loss afteroptic neuropathies confirming earlier, exploratory, small-sample trials [14–16]. Repeated daily
Table 3. Clinical parameter changes after treatment and at follow-up.
POST vs BASELINE FOLLOW-UP vs BASELINE
Parameter Within groups Between groups Within groups Between groups
rtACS Sham rtACS Sham
mean ±SEM p mean ±SEM p mean ±SEM p mean ±SEM p mean ±SEM p mean ±SEM p
High ResolutionPerimetry
Detection accuracy inwhole visual field, %
23.96 ±10.1 <0.001 2.53 ±2.75 0.256 21.43±10.46
0.011 24.98±11.01
0.006 0.28 ±3.34 0.482 24.70±11.51
0.033
Detection accuracy indefective visual fieldsectors, %
59.86 ±13.44 <0.001 34.83 ±5.30 <0.001 25.03±14.44
0.131 61.29±16.14
<0.001 30.72 ±5.96 <0.001 30.56±17.21
0.078
Detection accuracywithin 5° visualfield, %
63.24 ±55.67 0.075 1.13 ±3.90 0.472 62.11±55.80
0.170 66.74±51.45
0.081 -0.96 ±2.46 0.500 67.71±51.51
0.146
Fixation accuracy(%)
12.20 ±8.62 0.015 5.66 ±3.55 0.016 6.54 ±9.32 0.427 30.48±19.77
0.076 6.08 ±2.91 0.013 24.40±19.98
0.390
False positivereactions in %
33.75 ±9.97 0.003 22.73 ±18.10 0.237 11.01±20.67
0.076 50.18±12.92
<0.001 46.70±22.74
0.034 3.49 ±26.15 0.134
RT whole visual field(ms)
2.13 ±0.87 0.022 1.30 ±1.19 0.086 0.86 ±1.47 0.338 1.49 ±0.89 0.084 0.59 ±1.30 0.383 0.90 ±1.58 0.242
RT in defective visualfield sectors (ms)
2.03 ±0.96 0.063 1.48 ±1.04 0.075 0.55 ±1.42 0.452 1.61 ±0.87 0.086 2.22 ±1.62 0.127 -0.60 ±1.84 0.485
RT within 5° visualfield (ms)
3.46 ±1.00 0.001 2.74 ±1.43 0.013 0.72 ±1.74 0.437 3.41 ±1.27 0.006 2.44 ±1.51 0.052 0.97 ±1.97 0.383
Static Perimetry
Foveal threshold (dB) -1.72 ±4.03 0.367 0.05 ±5.80 0.297 -1.77 ±7.06 0.402 1.13 ±3.00 0.368 -7.52 ±4.22 0.174 8.65 ±5.18 0.151
Mean threshold(whole visual field,dB)
22.38 ±10.67 0.003 3.72 ±5.00 0.272 18.65±11.78
0.063 34.97±18.52
0.001 2.14 ±4.59 0.486 32.83±19.08
0.010
Fixation accuracy instatic perimetry, %
0.93 ±3.36 0.373 2.82 ±2.62 0.129 -1.89 ±4.26 0.206 10.69±10.19
0.197 -4.00 ±3.62 0.205 14.70±10.81
0.192
Kinetic Perimetry
Mean eccentricity (°) 11.62 ±6.27 0.035 6.40 ±5.13 0.063 5.22 ±8.10 0.406 2.51 ±5.45 0.426 4.47 ±4.37 0.159 -1.96 ±6.99 0.285
Mean visual field size(square degree)
27.27 ±16.44 0.036 20.47 ±15.89 0.040 6.80 ±22.90 0.385 11.23±11.86
0.413 9.06 ±6.90 0.184 2.17 ±13.72 0.29
Visual acuity
Uncorrected nearvision
-0.014 ±0.016 0.267 -0.082 ±0.020 <0.001 0.068±0.026
0.012 -0.066±0.017
0.001 -0.068±0.025
0.002 0.003±0.029
0.370
Uncorrected farvision
-0.039 ±0.023 0.067 -0.032 ±0.019 0.032 -0.007±0.030
0.371 -0.020±0.025
0.257 -0.032±0.019
0.064 0.012±0.031
0.226
For cases with binocular lesions values for both eyes were averaged. Results are given as mean and standard error mean (SEM).
doi:10.1371/journal.pone.0156134.t003
Alternating Current Stimulation for Vision Restoration
PLOS ONE | DOI:10.1371/journal.pone.0156134 June 29, 2016 12 / 19
stimulation with non-invasive rtACS significantly improved detection performance in VFswith persistent effects for at least 2 months beyond the stimulation period as shown by staticperimetry. Kinetic perimetry appeared to be insensitive to visual field dynamics. VF improve-ment in static measures was associated with increased vision-related QoL and subjective visualfunctioning in patients with binocular vision impairment. However, in contrast to what wasseen in a previous study [14], the “objective” improvement of VFs did not correlate signifi-cantly with “subjective”measures, i.e., there was a mismatch between both levels of analysiswhich can be attributed to the fact that only a small proportion of subjective vision can actuallybe explained by “objective” VF results as previously discussed [10]. About 2 of 3 patientstreated with rtACS reported being satisfied with the treatment even though only 1 of 3 patientswas aware of vision improvements.
We performed computer simulation to estimate the amount of current that was being deliv-ered to components of the visual system in a 40-yrs old male control subject. Computer simula-tions of rtACS current flow and estimated current density levels revealed that the stimulationcurrent propagates through the eyeball and optic nerve to subcortical and midbrain regionswith secondary stimulation at the brain stem and in cerebellar regions. Although the simula-tion model does not consider the extent of optic nerve damage the results provide meaningfulinsights indicating that most of the current affect frontal parts of the brain including eyeballand optic nerve while only low levels were found in the visual cortex. This finding is compatiblewith the hypothesis that cortical EEG changes after rtACS are due to “physiological” synchro-nous activation of retinal ganglion cells following eye and optic nerve stimulation [25]. Forfuture studies in this area current flow simulations may help to target both safety consider-ations and improved stimulation paradigms.
Fig 3. Visualization of simulated electrical fields during rtACS: current density maxima on eye/optical nerve(A), brain tissue surface (B) and in the volume (C). Although four electrodes were used for treatment, theywere used only one at a time. Therefore, the current flow simulation was done with only one electrode,representing all other electrodes. (A) Current density maxima of about 0.0044 A/m2 can be observed on theupper part of the outer eye surface that is closest to the stimulating electrode. Furthermore, the optical nerveof the stimulated eye also receives parts of the stimulating current density magnitude as currents enter theinner skull. (B) Local current density maxima can be found at frontal brain regions spatially located close tothe stimulating anodal electrode. (C) Another area of locally increased current density can be found at thebrain stem and lower cerebellum.
doi:10.1371/journal.pone.0156134.g003
Alternating Current Stimulation for Vision Restoration
PLOS ONE | DOI:10.1371/journal.pone.0156134 June 29, 2016 13 / 19
Our findings of improved visual functions are consistent with the hypothesis that rtACS canmodulate perceptual thresholds in “areas of residual vision” as previously reported in studiesthat also used current stimulation [12, 14–16] or behavioral vision training methods [10, 17,26–28]. The improvement of visual functioning together with spectral power and connectivitychanges in the occipital EEG alpha band [12] are consistent with the hypothesis of a retinofugalentrainment by rtACS that improves visual perception through rhythmic firing of retinal gan-glion cells. Indeed, in the present study we cannot exclude that some of the effects on coherenceare due to volume conduction effect. Future studies might use high-density EEG, which wouldallow using source reconstruction algorithms (e.g. LORETA). Such algorithms typically reducethe volume conduction problem and thus allow a more spatially precise localization of neuro-physiological effects and more reliable estimation of functional coupling. As recently shown bypatients with optic nerve damage who suffer from desynchronization of spatial and temporalprocessing deficits of their brain functional networks [12, 29] the therapeutic effects of rtACSmay be mediated by re-synchronizing the brain networks, which were desynchronized by thevision loss. Because well-synchronized dynamic brain networks are critical for cognitive pro-cessing of visual information [30], we conclude that a visually deprived brain with re-synchro-nized functional networks can process reduced visual input more efficiently thereby activatingor amplifying, residual vision even many years after the damage has occurred [10].
According to the prevailing view, tACS entrainment leads to a frequency-specific phaserealignment of the endogenous oscillations with the applied alternating current with a subse-quent frequency-specific power enhancement [31–35]. The beneficial functional consequenceof rtACS for visual perception may possibly be explained by retinofugal entrainment and brainfunctional connectivity modulation [12, 16]. Another issue of interest is the specificity of therange of current frequencies used for stimulation. In future studies it will be important to sys-tematically study the effects of specific frequencies for parameter optimization [36]. Applica-tion of the optimal frequencies might improve efficacy and will also shed light on the role ofspecific brain oscillations in their ability to activate residual vision.
It may be argued that visual improvements after rtACS can be explained by perceptual learn-ing due to repeated testing. However, this is unlikely because we ascertained stable visual fieldbaselines before starting the treatment and the primary and secondary outcome criteria did notimprove to the same extent in the sham-group which was exposed to the same number of diag-nostic test repetitions. Since we observed a decrease in RT when ACS treated patients respondedto small light stimuli presented during visual field testing, another alternative explanation forimproved vision outcome is a secondary effect of an increase in attention in the treatment groupdue to rtACS which then results in general performance improvements in vision tests as well.However, this interpretation is not supported by results of a basic alertness test. Here, weobserved a general RT increase in response to large centrally presented stimuli as used during thealertness test (S1 Table). In other words, despite lower overall alertness, visual processing to(smaller) visual stimuli was faster. Our interpretation is that visual processing following ACStreatment may be more efficient, but the precise relationship between general alertness andmodality-specific (visual) attention in patients with visual field defects requires further study.
An important question in brain stimulation studies is what constitutes an appropriate sham-condition. In prior rtACS-studies, the sham-condition was an auditory sound that mimicked cur-rent delivery [14–15]. Below phosphene-threshold stimulation was employed by others [37].Both of these sham conditions cannot completely rule out that patients correctly guessed towhich group they belonged (because of lack of phosphene experience in shams), leaving open thepossibility of an expectation bias. Our sham-condition avoided this bias by using a “minimaldose” sham-condition where phosphene perceptions also occurred. However, the draw-back ofthis kind of sham procedure is that a “minimal dose”may actually have some, albeit small,
Alternating Current Stimulation for Vision Restoration
PLOS ONE | DOI:10.1371/journal.pone.0156134 June 29, 2016 14 / 19

therapeutic effects that cannot be separated from possible placebo effects of the current studydesign. Indeed, the sham group significantly improved in some parameters as well. The reasonwe selected a “minimal dose” treatment for sham controls is that this equalizes the expectationsin both groups. Indeed, one would not expect that patients generate a hypothesis on their ownthat fewer phosphenes were less effective. However, considering that phosphenes may contributeto a placebo effect, it cannot be ruled out that patients in the rtACS-group who experienced moresignificant visual phenomena during stimulation might have had a greater feeling of that a pow-erful treatment was occurring than those who only experienced a flash once a minute.
Several open questions should be addressed in future studies. Important issues are whethernon-invasive current stimulation-induced visual system changes are due to neuroplastic alter-ation, if they can be potentiated by vision training [38], and if rtACS can also improve vision inpatients with post-chiasmatic lesions [39]. In addition, for general diagnostics low contrastvisual acuity as a sensitive outcome measure and retinal nerve fiber layer thickness measure-ments to better define study inclusion criteria should be considered to explore altered axonaland neuronal integrity in the afferent visual pathway. While additional studies are needed tofurther explore the mechanisms of action, our results warrant the use of rtACS treatment in aclinical setting to activate residual vision by brain network re-synchronization, which can par-tially restore vision in patients with stable vision loss caused by nervous system damage.
Appendix
Reliability of visual field measurementsReliability parameters of the primary outcome measure. The absolute change of HRP
fixation accuracy and percentage of responses outside the valid response window in HRP wereconsidered as reliability parameters. Fixation accuracy improved significantly at POST in bothgroups (median increase, rtACS: 1.1%, CI[0.1; 2.5], p = 0.017; sham: 1.3%, CI[0.0; 2.6],p = 0.023), with no significant difference between groups. The percentage of reactions outsidethe valid response window (150–1000ms) after stimulus presentation in HRP increased slightlyafter rtACS (0.3%, CI[0.0; 0.9], p = 0.016) and remained unchanged after sham (-0.03%, CI[-0.5; 0.2], 0.377) with a significant difference between groups (p = 0.033).
Eye-tracking during HRP. To determine whether changes of visual field results arerelated to, or could be explained by, altered fixation behavior during visual field testing, HRPvisual fields were measured while eye movements were recorded with an eye-tracker (TobiiET1750, Tobii Technology AB, Sweden) in one study center (Magdeburg). Together with reli-ability parameters of HRP, the eye-tracking results documented excellent retinotopic reliabilityof the primary outcome measure, validating that improved visual detection could not beexplained by altered eye movements (such as saccades towards the blind field). Mean fixationwas within the central area of 1° horizontally and 0.5° vertically for both groups at all timepoints (S1 Fig). Standard deviation of the mean fixation position extended up to approx. 1.5–2°of visual angle both horizontally and vertically, which is in the expected range [17]. In fact, per-formance change in HRP correlated negatively with changes in deviations from fixation duringeye-tracked HRPs, i.e. the better the fixation, the greater the detection accuracy improvements.For both the rtACS- and sham-group significant correlations were observed between fixationperformance and detection accuracy change in the whole-tested HRP visual field (r = -0.47,p<0.05), and in the defective visual field as well (r = -0.51, p<0.05).
Treatment outcome prediction modelIn order to analyze which areas of the visual field respond with improvements after rtACS, weseparately analyzed different visual field states based on HRP measurements and developed a
Alternating Current Stimulation for Vision Restoration
PLOS ONE | DOI:10.1371/journal.pone.0156134 June 29, 2016 15 / 19
treatment outcome prediction model to predict from the BASELINE results of HRP visualfields the extent of vision restoration [24]. To this end, different visual field states (i.e. full func-tion, partial function and absolute vision loss) were determined by superimposing repeatedHRP measures to determine which visual field regions are intact, partially damaged (residual Iand residual II) and absolutely impaired (absolute defect).
The difference between groups in the primary outcome measure was found to be mailycaused by a reduction of the absolute (black) scotoma region in the rtACS-group. The size ofthe absolute defect significantly decreased after rtACS when compared to sham-treatedpatients (χ² = 190.201, df = 1, p<0.0001) (S2 Fig). Post-intervention changes in the intact andresidual visual field did not differ between groups.
Out of a total of 12 features deemed relevant based on previous studies [24], two features ofHRP visual fields at baseline were associated with visual field improvements after rtACS:greater “neighborhood activity”, i.e., the mean detection rate of all HRP test positions within a5° radius around each detected location, and greater “residual function”, i.e. the detection rateat a given visual field position (S3 Fig). This suggests that improvements of residual vision arethe key factor of vision restoration.
Patient reported outcomesSubjective change was evaluated with the NEI-VFQ scales “visual field defect and relatedimpairments” and “general health and mental distress” at POST and FOLLOW-UP and com-pared between groups. At POST there was an improvement in NEI-VFQ scale “general healthand mental distress” in the sham-group (p<0.01) but not after rtACS, with no significant dif-ference between groups (p = 0.81). At FOLLOW-UP both groups reported subjective benefitsin the NEI-VFQ scales “visual field defect and related impairments” (rtACS: p<0.01, sham:p = 0.02) and “general health and mental distress” (rtACS: p = 0.04; sham: p = 0.01), again withno significant difference between groups (p = 0.77).
Due to the possibility that patients with monocular impairment may not experience a severereduction in vision-related QoL, an exploratory subgroup analysis of patients with binocularloss, i.e., excluding those with an intact fellow eye, was conducted. Here, rtACS-patientsreported a significant increase in NEI-VFQ “visual field defect and related impairments” scale(p<0.01) at FOLLOW-UP with no significant difference between groups (p = 0.40). In thesham-group there was a significant increase in the NEI-VFQ “general health and mental dis-tress” scale (p = 0.01) at POST with no significant difference between groups (p = 0.30).
In another intervention-related questionnaire, the items: “treatment was helpful”,“increased vision after treatment” at POST, and “satisfied with treatment”, “general percep-tion” at FOLLOW-UP were more frequently answered positively after rtACS than after sham(S4 Fig).
Supporting InformationS1 Fig. Fixation accuracy. Fixation accuracy in eye-tracking during HRP. Eye-tracking fixa-tion accuracy while performing a visual detection task in HRP, shown as mean vertical andhorizontal fixation position in degrees of visual angle in the visual field. Fluctuations of themean fixation positions at BASELINE, POST and FOLLOW-UP are shown as 1SD.(PDF)
S2 Fig. Visual field change according to the visual field state at BASELINE comparingrtACS- and sham-group.(PDF)
Alternating Current Stimulation for Vision Restoration
PLOS ONE | DOI:10.1371/journal.pone.0156134 June 29, 2016 16 / 19
S3 Fig. Relevant features predicting treatment outcome after rtACS. According to self-orga-nizing map (SOM)-charts relevant features for prediction are “Neighborhood activity” and“Residual function”. For further explanations, see text. Improved II refers to previously defectpositions where detection rate improved by 66%, improved I refers to positions where detec-tion rate improved by 33%.(PDF)
S4 Fig. Patient-reported outcome. Patient-reported outcomes at POST and FOLLOW-UP.Results of a structured intervention-related questionnaire that also included a response cate-gory labeled “not sure”. All subjects answered the questionnaire, but “not sure” answers weregiven by a large number of subjects.(PDF)
S1 File. CONSORT checklist.(PDF)
S2 File. Statistical analyses report.(PDF)
S1 Table. Neuropsychological measures.(DOCX)
AcknowledgmentsThe authors would like to thank Nicole Mäter, Sandra Heinrich (both Magdeburg), Petra Leh-mann (Göttingen), Anne Müller (Kassel), and Josephine Rygus (Berlin) for their excellentpatient care and conducting diagnostic examinations. Furthermore, we would like to thankElectrical Geodesics Inc. (EGI) for providing multi-modal imaging data (MRI and CT images)to generate a volume conductor model to simulate rtACS. The use of bone images (skull CT)for computing the conductivity effects in relation to electrical analysis and stimulation of headtissues is described in US Pat. No. 6,529,759.
Author ContributionsConceived and designed the experiments: CG SS BAS SAB SKMPSWP. Performed the experi-ments: CG SS RM AMGGAMD. Analyzed the data: AL SK CGMBMD. Contributedreagents/materials/analysis tools: CG MB AM SS MD. Wrote the paper: CG AA BAS SS SAB.
References1. Ghaffarieh A, Levin LA. Optic nerve disease and axon pathophysiology. Int Rev Neurobiol 2012; 105:
1–17. doi: 10.1016/B978-0-12-398309-1.00002-0 PMID: 23206593
2. Gall C, Lucklum J, Sabel BA, Franke GH. Vision- and health-related quality of life in patients with visualfield loss after postchiasmatic lesions. Invest Ophthalmol Vis Sci 2009; 50: 2765–76. doi: 10.1167/iovs.08-2519 PMID: 19117930
3. Greenwald D, Kapoor N, Singh AD. Visual impairments in the first year after traumatic brain injury.Brain Inj 2012; 26: 1338–59. doi: 10.3109/02699052.2012.706356 PMID: 22897509
4. Raz N, Dotan S, Chokron S, Ben-Hur T, Levin N. Demyelination affects temporal aspects of perception:an optic neuritis study. Ann Neurol 2012; 71: 531–8. doi: 10.1002/ana.22692 PMID: 22447670
5. Nair G, Renga V, Lindenberg R, Zhu L, Schlaug G. Optimizing recovery potential through simultaneousoccupational therapy and non-invasive brain-stimulation using tDCS. Restor Neurol Neurosci 2011;29: 411–20. doi: 10.3233/RNN-2011-0612 PMID: 22124031
6. Chrysikou EG, Hamilton RH. Noninvasive brain stimulation in the treatment of aphasia: exploring inter-hemispheric relationships and their implications for neurorehabilitation. Restor Neurol Neurosci 2011;29: 375–94. doi: 10.3233/RNN-2011-0610 PMID: 22124035
Alternating Current Stimulation for Vision Restoration
PLOS ONE | DOI:10.1371/journal.pone.0156134 June 29, 2016 17 / 19
7. Song S, Sandrini M, Cohen LG. Modifying somatosensory processing with non-invasive brain stimula-tion. Restor Neurol Neurosci 2011; 29: 427–37. doi: 10.3233/RNN-2011-0614 PMID: 22124034
8. Antal A, PaulusW, Nitsche MA. Electrical stimulation and visual network plasticity. Restor Neurol Neu-rosci 2011; 29: 365–74. doi: 10.3233/RNN-2011-0609 PMID: 22124032
9. Laczó B, Antal A, Niebergall R, Treue S, PaulusW. Transcranial alternating stimulation in a highgamma frequency range applied over V1 improves contrast perception but does not modulate spatialattention. Brain Stimul 2012; 5: 484–91. doi: 10.1016/j.brs.2011.08.008 PMID: 21962982
10. Sabel BA, Henrich-Noack P, Fedorov A, Gall C. Vision restoration after brain and retina damage: the"residual vision activation theory". Prog Brain Res 2011; 192: 199–262. doi: 10.1016/B978-0-444-53355-5.00013-0 PMID: 21763527
11. Zaehle T, Rach S, Herrmann CS. Transcranial alternating current stimulation enhances individualalpha activity in human EEG. PLoS One 2010; 5: 13766.
12. Bola M, Gall C, Moewes C, Fedorov A, Hinrichs H, Sabel BA. Brain functional connectivity networkbreakdown and restoration in blindness. Neurology 2014; 83: 542–51. doi: 10.1212/WNL.0000000000000672 PMID: 24991030
13. Connell N, Merabet LB. Uncovering the connectivity of the brain in relation to novel vision rehabilitationstrategies. Neurology, 2014; 83:1–2.
14. Sabel BA, Fedorov AB, Naue N, Borrmann A, Herrmann C, Gall C. Non-invasive alternating currentstimulation improves vision in optic neuropathy. Restor Neurol Neurosci 2011; 29: 493–505. doi: 10.3233/RNN-2011-0624 PMID: 22124039
15. Gall C, Sgorzaly S, Schmidt S, Brandt S, Fedorov A, Sabel BA. Noninvasive transorbital alternating cur-rent stimulation improves subjective visual functioning and vision-related quality of life in optic neuropa-thy. Brain Stimul 2011; 4: 175–88. doi: 10.1016/j.brs.2011.07.003 PMID: 21981853
16. Schmidt S, Mante A, Rönnefarth M, Fleischmann R, Gall C, Brandt SA. Progressive enhancement ofalpha activity and visual function in patients with optic neuropathy: a two-week repeated session alter-nating current stimulation study. Brain Stimul 2013; 6: 87–93. doi: 10.1016/j.brs.2012.03.008 PMID:22537864
17. Kasten E, Wüst S, Behrens-BaumannW, Sabel BA. Computer-based training for the treatment of par-tial blindness. Nat Med 1998; 4: 1083–7. PMID: 9734406
18. Mangione M, Lee PP, Pitts J, Gutierrez P, Berry S, Hays RD. Psychometric properties of the NationalEye Institute-Visual Function Questionnaire (NEI-VFQ): NEI-VFQ Field Test Investigators. ArchOphthalmol 1998; 116: 1496–1504. PMID: 9823352
19. Pereda E, Quiroga RQ, Bhattacharya J. Nonlinear multivariate analysis of neurophysiological signals.Prog Neurobiol 2005; 77: 1–37. PMID: 16289760
20. Haueisen J, Tuch DS, Ramon C, Schimpf PH, Wedeen VJ, George JS, et al. The influence of brain tis-sue anisotropy on human EEG and MEG. Neuroimage 2002; 15: 159–66. PMID: 11771984
21. Dannhauer M, Lanfer B, Wolters CH, Knösche TR. Modeling of the human skull in EEG source analy-sis. Hum Brain Mapp 2011; 32: 1383–99. doi: 10.1002/hbm.21114 PMID: 20690140
22. Eichelbaum S, Dannhauer M, Hlawitschka M, Brooks D, Knösche TR, Scheuermann G. Visualizationsimulated electrical fields from electroencephalography and transcranial electric brain stimulation: acomparative evaluation. NeuroImage 2014; 101: 513–30. doi: 10.1016/j.neuroimage.2014.04.085PMID: 24821532
23. Lindenblatt G, Silny J. A model of the electrical volume conductor in the region of the eye in the ELFrange. Phys Med Biol 2001; 46: 3051–9. PMID: 11720363
24. Gall C, Steger B, Koehler J, Sabel BA. Evaluation of two treatment outcome prediction models for resto-ration of visual fields in patients with postchiasmatic visual pathway lesions. Neuropsychologia 2013;51: 2271–80. doi: 10.1016/j.neuropsychologia.2013.06.028 PMID: 23851112
25. Foik AT, Kublik E, Sergeeva EG, Tatlisumak T, Rossini PM, Sabel BA, et al. Retinal origin of electricallyevoked potentials in response to transcorneal alternating current stimulation in the rat. Invest Ophthal-mol Vis Sci 2015; 56: 1711–18. doi: 10.1167/iovs.14-15617 PMID: 25650414
26. Poggel DA, Kasten E, Sabel BA. Attentional cueing improves vision restoration therapy in patients withvisual field defects. Neurology 2004; 63: 2069–76. PMID: 15596752
27. Sahraie A, Trevethan CT, Macleod MJ, Weiskrantz L, Hunt AR. The continuum of detection and aware-ness of visual stimuli within the blindfield: from blindsight to the sighted-sight. Invest Ophthalmol Vis Sci2013; 54: 3579–85. doi: 10.1167/iovs.12-11231 PMID: 23633654
28. Sabel BA, Gudlin J. Vision restoration training in glaucoma—A prospective, double-blind, randomized,placebo-controlled clinical trial. JAMAOphthalmology 2014; 132: 381–9. doi: 10.1001/jamaophthalmol.2013.7963 PMID: 24504128
Alternating Current Stimulation for Vision Restoration
PLOS ONE | DOI:10.1371/journal.pone.0156134 June 29, 2016 18 / 19

29. Bola M, Gall C, Sabel BA. Disturbed temporal dynamics of brain synchronization in vision loss. Cortex,2015a; DOI information: doi: 10.1016/j.cortex.2015.03.020
30. Bola M, Sabel BA. Dynamic reorganization of brain functional networks during cognition. Neuroimage2015; 114: 398–413. doi: 10.1016/j.neuroimage.2015.03.057 PMID: 25828884
31. Ali M, Sellers K, Frohlich F. Transcranial Alternating Current Stimulation Modulates Large-Scale Corti-cal Network Activity by Network Resonance. J Neurosci 2013; 33: 11262–75. doi: 10.1523/JNEUROSCI.5867-12.2013 PMID: 23825429
32. Merlet I, Birot G, Salvador R, Molaee-Ardekani B, Mekonnen A, Soria-Frish A, et al. From oscillatorytranscranial current stimulation to scalp EEG changes: a biophysical and physiological modeling study.PLoS One 2013; 8: e57330. doi: 10.1371/journal.pone.0057330 PMID: 23468970
33. Reato D, Rahman A, Bikson M, Parra L. Low-Intensity Electrical Stimulation Affects Network Dynamicsby Modulating Population Rate and Spike Timing. J Neurosci 2010; 30: 15067–79. doi: 10.1523/JNEUROSCI.2059-10.2010 PMID: 21068312
34. Schmidt SL, Iyengar AK, Foulser AA, Boyle MR, Fröhlich F. Endogenous cortical oscillations constrainneuromodulation by weak electric fields. Brain Stimul 2014; 7(6): 878–89. doi: 10.1016/j.brs.2014.07.033 PMID: 25129402
35. Vosskuhl J, Huster R, Herrmann C. Increase in short-termmemory capacity induced by down-regulat-ing individual theta frequency via transcranial alternating current stimulation. Front Hum Neurosci2015; 9: 257. doi: 10.3389/fnhum.2015.00257 PMID: 26005411
36. Schmidt S, Scholz M, Obermayer K, Brandt SA. Patterned brain stimulation. What a framework withrhythmic and noisy components might tell us about recovery maximization. Front Hum Neurosci 2013a;7: 325.
37. Schatz A, Röck T, Naycheva L, Willmann G, Wilhelm B, Peters T, et al. Transcorneal electrical stimula-tion for patients with retinitis pigmentosa: a prospective, randomized, sham-controlled exploratorystudy. Invest Ophthalmol Vis Sci 2011; 52: 4485–96. doi: 10.1167/iovs.10-6932 PMID: 21467183
38. Plow B, Obretenova SN, Fregni F, Pascual-Leone A, Merabet LB. Comparison of VF training for hemia-nopia with active versus sham transcranial direct cortical stimulation. Neurorehabil Neural Repair 2012;26: 616–26. doi: 10.1177/1545968311431963 PMID: 22291042
39. Gall C, Silvennoinen K, Granata G, de Rossi F, Vecchio F, Brösel D, et al. Non-invasive electric currentstimulation for restoration of vision after unilateral occipital stroke. Contemp Clin Trials 2015; 43: 231–6. doi: 10.1016/j.cct.2015.06.005 PMID: 26072125
Alternating Current Stimulation for Vision Restoration
PLOS ONE | DOI:10.1371/journal.pone.0156134 June 29, 2016 19 / 19