Embed Size (px)
Citation preview
Proceedings of the 2008 Northeastern Recreation Research Symposium GTR-NRS-P-42 266
RESEaRCh To GuidE TRaiL maNaGEmENT aT aCadia NaTioNaL PaRk, maiNE
Kelly GoonanUniversity of VermontBurlington, Vermont [email protected]
Robert ManningUniversity of Vermont
William ValliereUniversity of Vermont
Abstract .—Acadia National Park, Maine, is the tenth most-visited national park in the United States. Managers face the challenge of protecting the park’s trail system from damage while maintaining a high quality recreation experience. For this study, an initial phase of research was conducted to identify potential indicators of quality for trail resources and the visitor experience. Trail impacts, crowding, and type and level of trail development were identified as important indicators of quality. A second phase of research focused on formulating standards for each of these indicators. Findings identified the resource and trail conditions that respondents prefer, find minimally acceptable, think the National Park Service should allow, and find so unacceptable that they would no longer hike the trails in the park. Responses from hikers on high- and low-use trails were compared. Overall, visitors to Acadia report that they find the trails in good condition and that they are receiving a relatively high quality recreation experience.
1.0 iNTRoduCTioNAcadia National Park includes approximately �20 miles of trails, and hiking is one of the most popular recreation activities in the park (Littlejohn �999). The popularity of the trail system presents a challenge to park staff who must protect trails from unacceptable
visitor impacts, such as soil compaction and erosion, trampling of vegetation, trail widening, and creation of visitor-caused trails (Hammitt and Cole �998). Trail use must also be managed to maintain the quality of the visitor experience with regard to the social impacts of visitor use, including crowding and unacceptable trail management practices (Manning �999).
Management of outdoor recreation in national parks is guided by the Visitor Experience and Resource Protection (VERP) framework developed by the National Park Service (NPS) (National Park Service �997). VERP relies on formulation of indicators and standards of quality for resource and social/experiential conditions that reflect management objectives/desired conditions. Indicators of quality are measurable, manageable variables that can be used as proxies for management objectives/desired conditions. Standards of quality define the minimum acceptable condition of indicator variables. This study was designed to help create indicators and standards of quality for Acadia’s trail system.
2.0 STudy mEThodSThe first phase of research was conducted in the summer of 2004 and focused on identifying potential indicators of quality. A visitor survey incorporated a series of open- and close-ended questions. Open-ended questions asked visitors what they enjoyed most and least about hiking in Acadia, and close-ended questions asked visitors to rate the importance of several trail-related issues. Park “ridge runners” obtained 249 completed questionnaires from a representative sample of hikers encountered throughout the trail system.
The second phase of research was conducted in the summer of 2007 and focused on identifying potential standards of quality for selected indicator variables. A visitor survey incorporated a series of questions that
Proceedings of the 2008 Northeastern Recreation Research Symposium GTR-NRS-P-42 267
asked respondents to judge the acceptability of a range of trail conditions. These questions adopted normative theory and methods (Manning �985, Vaske et al.�986, Shelby and Vaske �99�, Vaske and Whittaker 2004), and used narrative/numerical, visual, and long- and short-question formats to examine several evaluative dimensions, including “preference,” “acceptability,” “management action,” and “displacement” (Manning et al. �999, Manning and Freimund 2004). Three indicators covered the resource, social/experiential, and managerial dimensions of recreation opportunities: resource conditions, crowding, and type and intensity of management practices. Ridge runners administered the survey to a representative sample of hikers at trailheads throughout the trail system achieving an 82-percent response rate and yielding 287 completed questionnaires.
Acadia’s trails receive varying amounts of use. Trails sampled in phase 2 were divided into “high-use” and “low-use” categories based on a census of the park’s hiking trails (Jacobi, 2003). Trails that received �00 hikers or fewer per day were designated as “low use,” and trails receiving more than 100 hikers were designated as “high use.” Survey responses from these two classes of trails were compared and tested to see whether hikers’ normative standards varied significantly based on trail use level.
3.0 RESuLTS3.1 indicators of QualityThe results of the first phase of research identified trail impacts (such as soil erosion and trail widening) and crowding as important indicators of quality. Level of trail development and management was also considered a potentially important indicator of quality, as trail impacts are often addressed through a range of development practices such as signage and trail surfacing (Park Studies Laboratory 2008).
3.2 Standards of QualityRespondents were asked a series of questions to help identify standards of quality for each of the three indicator variables listed above. The first section of the survey addressed trail impacts. First, respondents were
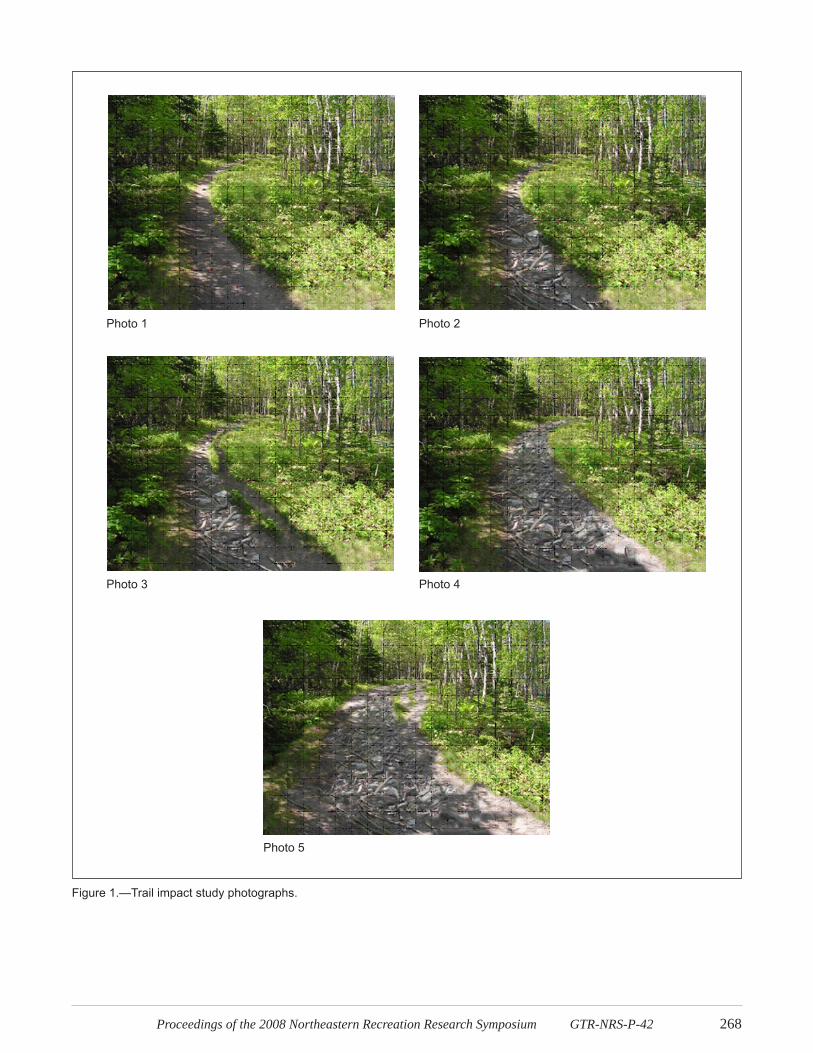
asked to evaluate the acceptability of five computer-generated photographs depicting increasing levels of visitor-caused soil and vegetation impact (Fig.�).
Acceptability was measured using a 9-point Likert-type scale ranging from -4 (“very unacceptable”) to 4 (“very acceptable”). The second question asked respondents to indicate which photograph showed the amount of trail impact they would prefer to see. The following question addressed visitor displacement, and asked respondents to report the photograph that showed the level of trail impact that was so unacceptable that they would no longer hike on park trails. Respondents were given the opportunity to report that “none of the photographs are so unacceptable that I would no longer hike on the trails I hiked today.” The fourth question asked respondents to report which photograph showed the highest level of trail impact that the NPS should allow before restricting visitor use. Respondents were given the opportunity to report that “none of the photographs show a high enough level of environmental impact to restrict people from hiking on these trails” or that “the number of people hiking on these trails should not be restricted.” The final question asked respondents to indicate the photograph that looked most like the amount of environmental impact that they typically saw on the trails they hiked.
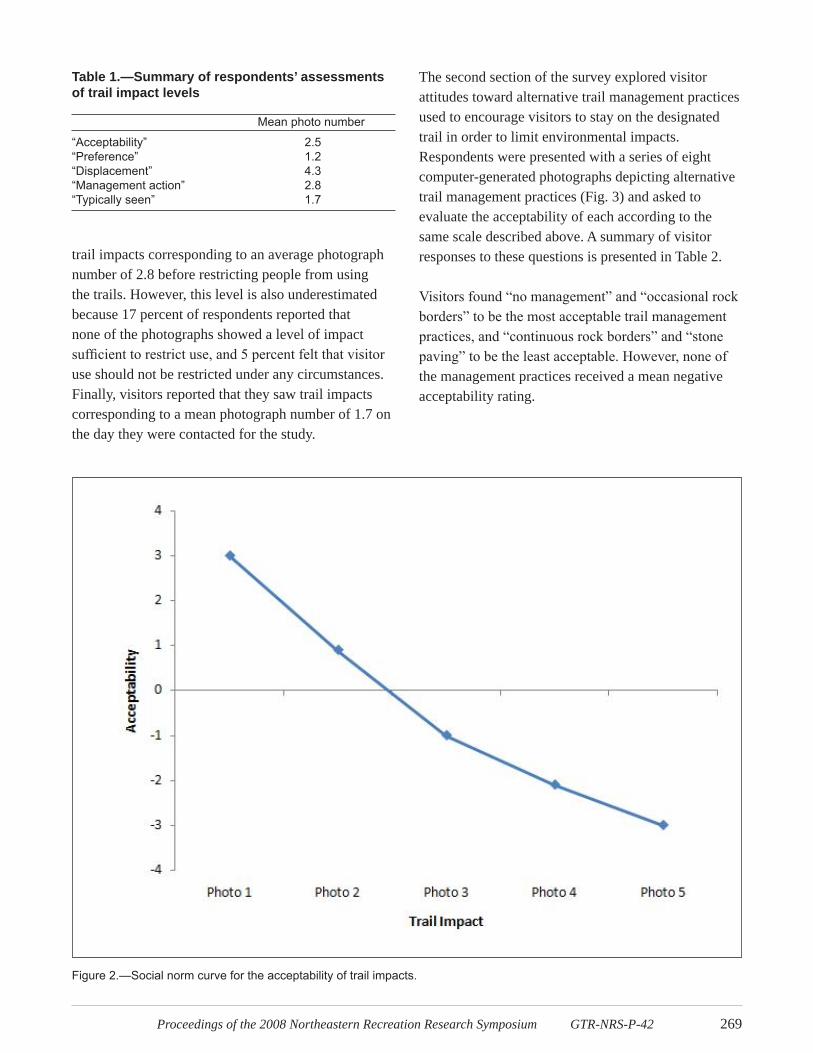
A summary of visitor responses to questions about trail impacts is shown in Table 1. Study findings suggest that increasing levels of trail impacts are increasingly unacceptable, as shown by the social norm curve in Figure 2.
The mean acceptability rating falls out of the acceptable range and into the unacceptable range between photographs 2 and 3. Respondents prefer to see very low levels of trail impact, with a mean photo preference of �.2. Visitors reported a displacement level corresponding to an average photograph number of 4.3, but this level is substantially underestimated because 43 percent of respondents said that none of the photographs showed a level of trail impact that was so unacceptable that they would be displaced from the area. Visitors felt that the NPS should allow
Proceedings of the 2008 Northeastern Recreation Research Symposium GTR-NRS-P-42 268
Photo 1 Photo 2
Photo 3 Photo 4
Photo 5
Figure 1.—Trail impact study photographs.
Proceedings of the 2008 Northeastern Recreation Research Symposium GTR-NRS-P-42 269
Table 1.—Summary of respondents’ assessments of trail impact levels
Mean photo number
“Acceptability” 2.5“Preference” 1.2“Displacement” 4.3“Management action” 2.8“Typically seen” 1.7
Figure 2.—Social norm curve for the acceptability of trail impacts.
trail impacts corresponding to an average photograph number of 2.8 before restricting people from using the trails. However, this level is also underestimated because �7 percent of respondents reported that none of the photographs showed a level of impact sufficient to restrict use, and 5 percent felt that visitor use should not be restricted under any circumstances. Finally, visitors reported that they saw trail impacts corresponding to a mean photograph number of �.7 on the day they were contacted for the study.
The second section of the survey explored visitor attitudes toward alternative trail management practices used to encourage visitors to stay on the designated trail in order to limit environmental impacts. Respondents were presented with a series of eight computer-generated photographs depicting alternative trail management practices (Fig. 3) and asked to evaluate the acceptability of each according to the same scale described above. A summary of visitor responses to these questions is presented in Table 2.
Visitors found “no management” and “occasional rock borders” to be the most acceptable trail management practices, and “continuous rock borders” and “stone paving” to be the least acceptable. However, none of the management practices received a mean negative acceptability rating.

Proceedings of the 2008 Northeastern Recreation Research Symposium GTR-NRS-P-42 270
Photo 1 Photo 2
Photo 3 Photo 4
Photo 5 Photo 6
Photo 7 Photo 8
Figure 3.—Trail management study photographs.

Proceedings of the 2008 Northeastern Recreation Research Symposium GTR-NRS-P-42 27�
Table 2.—mean acceptability ratings for the eight trail management approaches
Mean Acceptability Rating*
Photo 1: No management 3.0Photo 2: Occasional rock borders 2.8Photo 3: Continuous rock borders 0.9Photo 4: “Stay on Trail” sign 2.5Photo 5: Stone paving 0.7Photo 6: Wooden planking 1.4Photo 7: Brushed social trail 2.1Photo 8: Brushed and signed social trail 2.1
* -4 = “Very unacceptable”; 4 = “Very acceptable”
The final section of the survey addressed crowding levels on trails through the number of encounters with other hikers. Respondents were first presented with �� scenarios of encounters with an increasing number of other hikers (ranging from no other hikers up to more than �00 other hikers). Scenarios were presented in a narrative/numeric format, and respondents were asked to evaluate the acceptability of each scenario using the same 9-point response scale as the previous questions. After evaluating each scenario, respondents were asked to indicate the number of other hikers they would prefer to see on the trails per day. The third question addressed displacement by asking respondents to indicate the maximum number of other hikers seen per day before they would no longer hike these trails. Respondents were given the option to report that they “would continue to hike these trails regardless of the number of other hikers seen.” The fourth question asked respondents to indicate the maximum number of other hikers per day that the NPS should allow on trails before restricting hikers. Respondents were given the option to report that “the number of hikers on these trails should not be restricted.” The fifth question asked the approximate number of other hikers the respondent had seen while hiking that day. Next, respondents were asked how much time (in minutes) they had spent hiking on the day of the survey. Finally, respondents were asked to rate how crowded they felt on the trails they hiked. The rating was based on a scale of � (“not at all crowded”) to 9 (“extremely crowded”).
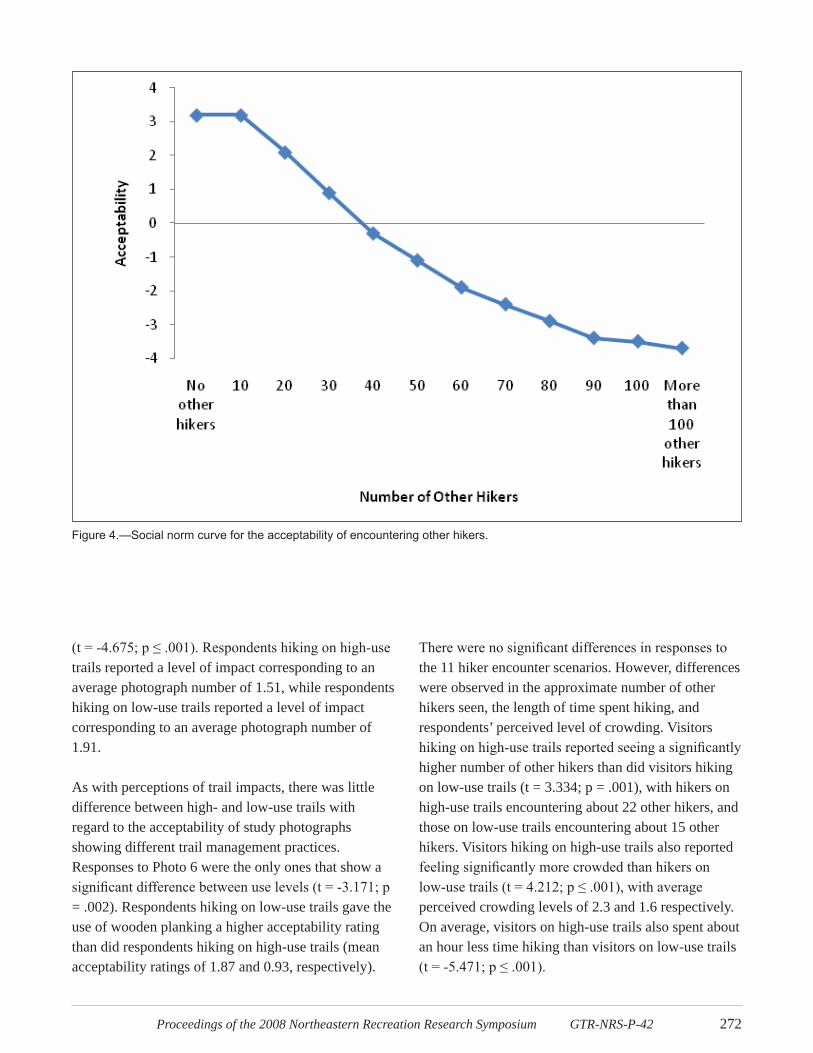
A summary of visitor responses to the questions addressing crowding is shown in Table 3. The study findings suggest that encountering increasing numbers of other hikers on trails is increasingly unacceptable. This result is presented graphically in the social norm curve in Figure 4. The mean acceptability rating falls out of the acceptable range into the unacceptable range at an encounter rate of 37.5 other hikers per day. Respondents prefer to see a mean of �5.4 other hikers per day on trails in Acadia. Visitors reported that encounters with other hikers would cause displacement (i.e., they would choose to hike elsewhere) at a mean of 54.2 other hikers per day. Approximately 25 percent of respondents said that they would continue hiking the trails regardless of the number of other hikers they saw. Visitors felt that the NPS should allow a mean of 84.5 hikers per day before restricting use on the trails. Approximately 52 percent of respondents felt that visitor use should not be restricted. Finally, visitors reported seeing a mean of �8.8 other hikers, and perceived crowding levels were low. About 54 percent of visitors reported that they felt “not at all crowded” while hiking on the day they were contacted for this study.
3.3 a Comparison of high- and Low-use TrailsHikers on high- and low-use trails displayed similar norms regarding resource conditions on trails. An independent-samples test found no significant differences in the acceptability of the range of trail impacts depicted in the study photographs. The only resource condition variable that showed a significant difference between high- and low-use trails was the level of impact that respondents reported seeing
Table 3.—Summary of respondents’ assessments of use levels
Number of Other Hikers Mean Median
“Acceptability” 37.5 --“Preference” 15.4 12.0“Displacement” 54.2 44.0“Management action” 84.5 50.0“Typically seen” 18.8 15.0
Proceedings of the 2008 Northeastern Recreation Research Symposium GTR-NRS-P-42 272
Figure 4.—Social norm curve for the acceptability of encountering other hikers.
(t = -4.675; p ≤ .001). Respondents hiking on high-use trails reported a level of impact corresponding to an average photograph number of �.5�, while respondents hiking on low-use trails reported a level of impact corresponding to an average photograph number of �.9�.
As with perceptions of trail impacts, there was little difference between high- and low-use trails with regard to the acceptability of study photographs showing different trail management practices. Responses to Photo 6 were the only ones that show a significant difference between use levels (t = -3.171; p = .002). Respondents hiking on low-use trails gave the use of wooden planking a higher acceptability rating than did respondents hiking on high-use trails (mean acceptability ratings of �.87 and 0.93, respectively).
There were no significant differences in responses to the �� hiker encounter scenarios. However, differences were observed in the approximate number of other hikers seen, the length of time spent hiking, and respondents’ perceived level of crowding. Visitors hiking on high-use trails reported seeing a significantly higher number of other hikers than did visitors hiking on low-use trails (t = 3.334; p = .00�), with hikers on high-use trails encountering about 22 other hikers, and those on low-use trails encountering about �5 other hikers. Visitors hiking on high-use trails also reported feeling significantly more crowded than hikers on low-use trails (t = 4.212; p ≤ .001), with average perceived crowding levels of 2.3 and �.6 respectively. On average, visitors on high-use trails also spent about an hour less time hiking than visitors on low-use trails (t = -5.471; p ≤ .001).
Proceedings of the 2008 Northeastern Recreation Research Symposium GTR-NRS-P-42 273
4.0 CoNCLuSioNThis study’s findings suggest that visitors hiking in Acadia National Park are receiving a fairly high quality recreation experience. Visitors are generally encountering trail impacts that are much lower than their minimum acceptable condition and very close to the conditions they would prefer to see. Although visitors reported seeing a higher number of other hikers than they would prefer to see, the difference is very small and far below their minimum acceptable condition. Visitors typically rated no trail management or “light-handed” management as being more acceptable than “heavier-handed” forms of management and trail hardening. None of the trail management practices depicted, however, received an average negative (unacceptable) rating, suggesting that visitors are willing to accept a variety of trail management practices that are deemed necessary to protect trails.
Few significant differences were observed between responses given by visitors hiking on high- and low-use trails and tended to relate mostly to what visitors saw, such as environmental impacts on trails and the number of other hikers. For example, visitors hiking on high-use trails reported more encounters with other people on average than visitors hiking on low-use trails. Consequently, hikers on high-use trails reported feeling slightly more crowded than hikers on low-use trails. In practical terms, however, observed differences were relatively small. Overall, it appears that hikers on high-use trails are as likely to accept management actions as hikers on low-use trails, and both groups display very similar norms relating to environmental and social conditions within the park.
Study results help provide an empirical basis for formulating indicators and standards of quality for the resource, experiential, and managerial components of trail management at Acadia. The range of potential standards of quality identified in this study provides a basis for designing and maintaining a diverse system of trail conditions and hiking opportunities across the park.
5.0 CiTaTioNS Hammitt, W., and Cole, D. (�998). Wildland
Recreation: Ecology and Management . New York: John Wiley and Sons.
Jacobi, C. (2003). A Census of Hiking Trail Use in Acadia National Park August 5 and 6, 2003. ANP Natural Resource Report 2003-�0. National Park Service.
Littlejohn, M. (�999). Acadia National Park Visitor Study . Visitor Services Project Report �08.
Manning, R.E. (�985). Crowding Norms in Backcountry Settings. Journal of Leisure Research, �7(2), 75-89.
Manning, R. (�999). Studies in Outdoor Recreation. Corvallis: Oregon State University Press.
Manning, R., Valliere, W., Wang, B., and Jacobi, C. (�999). Crowding Norms: Alternative Measurement Approaches . Leisure Sciences, 2�(2), 97-��5.
Manning, R., and Freimund, W. (2004). Use of Visual Research Methods to Measure Standards of Quality for Parks and Outdoor Recreation. Journal of Leisure Research 36(4), 552-579.
National Park Service. (�997). VERP: The Visitor Experience and Resource Protection (VERP) Framework- A Handbook for Planners and Managers . Denver, CO: Denver Service Center.
Park Studies Laboratory. (2008). Research to Support Visitor Management at Acadia National Park: 2004-2007. Burlington, VT: University of Vermont.
Shelby, B., and Vaske, J. (�99�). Using Normative Data to Develop Evaluative Standards for Resource Management: A Comment on Three Papers . Journal of Leisure Research, 23, �73-�87.

Proceedings of the 2008 Northeastern Recreation Research Symposium GTR-NRS-P-42 274
Vaske, J.J., Shelby, B., Graefe, A.R., and Heberlein, T.A. (�986). Backcountry Encounter Norms: Theory, Method and Empirical Evidence . Journal of Leisure Research, �8(3), �37-�53.
Vaske, J., and Whittaker, D. (2004). Normative Approaches to Natural Resources . Society and Natural Resources: A Summary of Knowledge. Jefferson City, MO: Modern Litho, pp. 283-294.