Embed Size (px)
Citation preview

Exponential Functions
Acadia National Park, Maine

I will be using the TI-nspire cx CAS calculator in this class.I will do my best to support whatever model calculator you have.
After turning the calculator on, push the Scratchpad key to get ready to work.

If $100 is invested for 4 years at 5.5% interest, compounded annually, the ending amount is:
4100 1.055 123.88
On the TI-nspire: 100 1.055 ^ 4
At the end of each year, interest is paid on the amount in the account and added back into the account, so the amount of increase gets larger each year.
This is an example of an exponential function:
xf bxexponent
base
enter

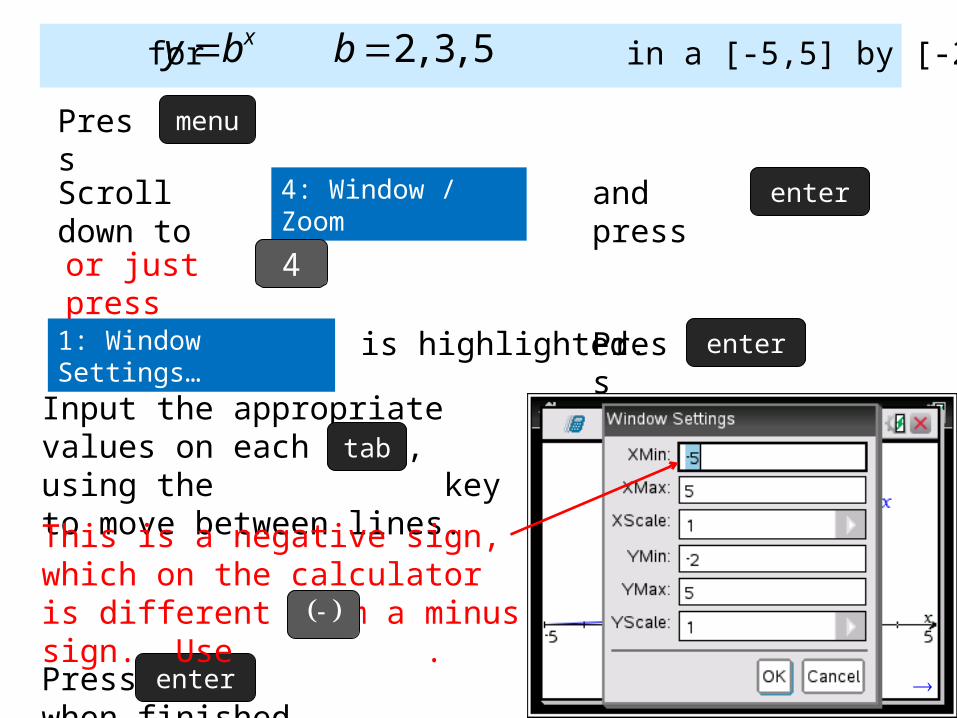
Graph for in a [-5,5] by [-2,5] window: xy b 2, 3, 5b
Start by pressing the scratchpad key again to switch to graphing mode.
Press menu
Scroll down to 3: Graph Entry/Edit
1: Function should be highlighted. enterPress
Input in the entry line.2 ^ x
enterPress
or just press 3
enterand press

Graph for in a [-5,5] by [-2,5] window: xy b 2, 3, 5b
To enter the next two functions, we are going to repeat some of the previous steps, but we will use a shortcut to save keystrokes.

Graph for in a [-5,5] by [-2,5] window: xy b 2, 3, 5b
Press menu
1: Function should be highlighted. enterPress
Input in the entry line.3^ x
enterPressInput in the entry line.5 ^ x
Instead of pressing enter, press the down arrow once to get out of the exponent box and a second time to get a new entry line .
Press 3

Graph for in a [-5,5] by [-2,5] window: xy b 2, 3, 5b
Next we will change the dimensions of the viewing window.
Press when finished.enter
Graph for in a [-5,5] by [-2,5] window: xy b 2, 3, 5b
Press menu
Scroll down to 4: Window / Zoom
or just press 4
enterand press
1: Window Settings… is highlighted.
Input the appropriate values on each line, using the key to move between lines.
tab
enterPress
This is a negative sign, which on the calculator is different from a minus sign. Use .

Graph for in a [-5,5] by [-2,5] window: xy b 2, 3, 5b
Where is ?2 3 5x x x
0,x
Where is ?2 3 5x x x
,0x
Where is ?2 3 5x x x
0x

Graph for in a [-5,5] by [-2,5] window: xy b 2, 3, 5b
Where is ?2 3 5x x x
0,x
Where is ?2 3 5x x x
,0x
Where is ?2 3 5x x x
0x
What is the domain?
,
What is the range?
0,

Population growth can often be modeled with an exponential function:
Ratio:
5023 4936 1.0176 5111 5023 1.0175
1.01761.02461.0175
World Population:
1986 4936 million1987 50231988 51111989 52011990 53291991 5422
The world population in any year is about 1.018 times the previous year.
in 2010: 195422 1.018P 7609.7
About 7.6 billion people.
Nineteen years past 1991.

Radioactive decay can also be modeled with an exponential function:
Suppose you start with 5 grams of a radioactive substance that has a half-life of 20 days. When will there be only one gram left?
After 20 days:1 5
52 2
40 days:2 51
542
t days:201
52
t
y
In Pre-Calc you solved this using logs. Today we are going to solve it graphically for practice.
Press menu
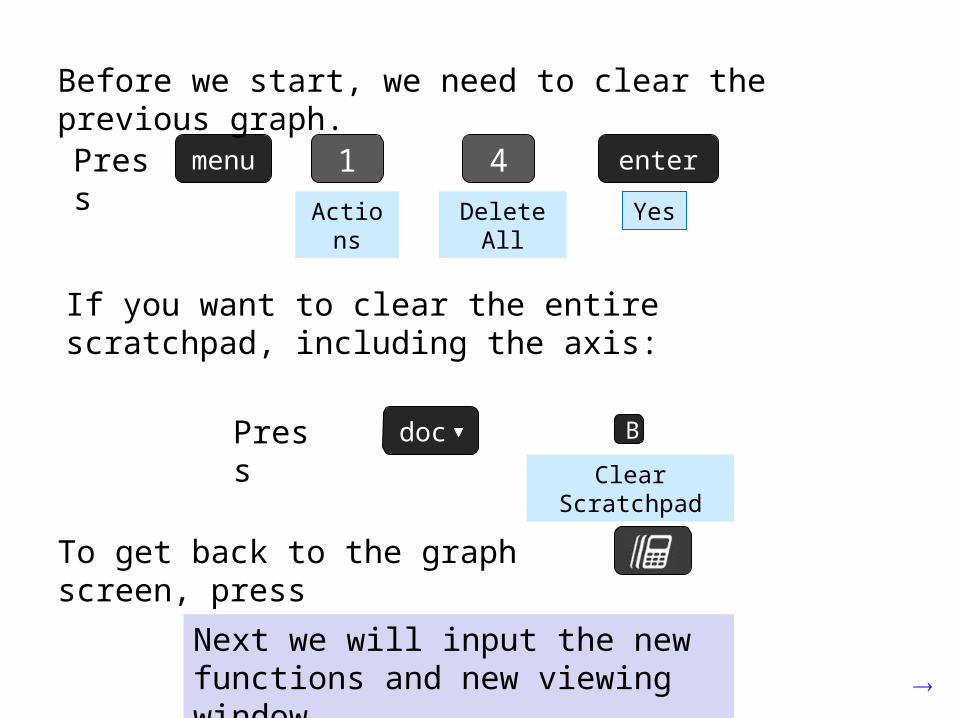
Before we start, we need to clear the previous graph.
Next we will input the new functions and new viewing window.
If you want to clear the entire scratchpad, including the axis:
Press doc_
1
Actions
4
Delete All
enter
Yes
B
Clear Scratchpad
To get back to the graph screen, press

Press menu enterPress
enterPress
Press the down arrow.
Press 3
Input in the entry line for .1 1f x
Input in the entry line for . 5 1 2 ^ 20x 2f x
/205 1/ 2
x
Press: menu
Press when finished.enter
Input the appropriate values using the key to move between lines.
tab
Use the right arrow to get out of the parentheses.
4
Window / Zoom
1
Window SettingsHint: If you have already entered one equation and are viewing the graph, a shortcut for entering another equation is to use the key.tab

We will use the calculator to find a decimal approximation for the intersection. Press menu
Notice that both graphs are flashing, if there had been more than two graphs, you would choose which ones you want to use.
Use the touchpad to move the lower bound to the left of the intersection, and push Enter.
Use the touchpad to move the upper bound to the right of the intersection, and push Enter.
6
Analyze Graph
4
Intersection

The calculator has found the intersection, although it is a little difficult to read.
There will be one gram of the substance left in approximately 46 days.
You can hover over the number and push the + button to increase the significant digits, then push Enter.

We can also clean up the graph by moving the labels.
Press to put the label in its new position.esc
While hovering over a label, push and to “grab” the label. Then drag it to a new position.
ctrl

We can change the color of a graph:
While hovering over a graph, press ctrl menu enter9
Color
Use the arrows to select a color, then either click or press . Then press again.enter enter
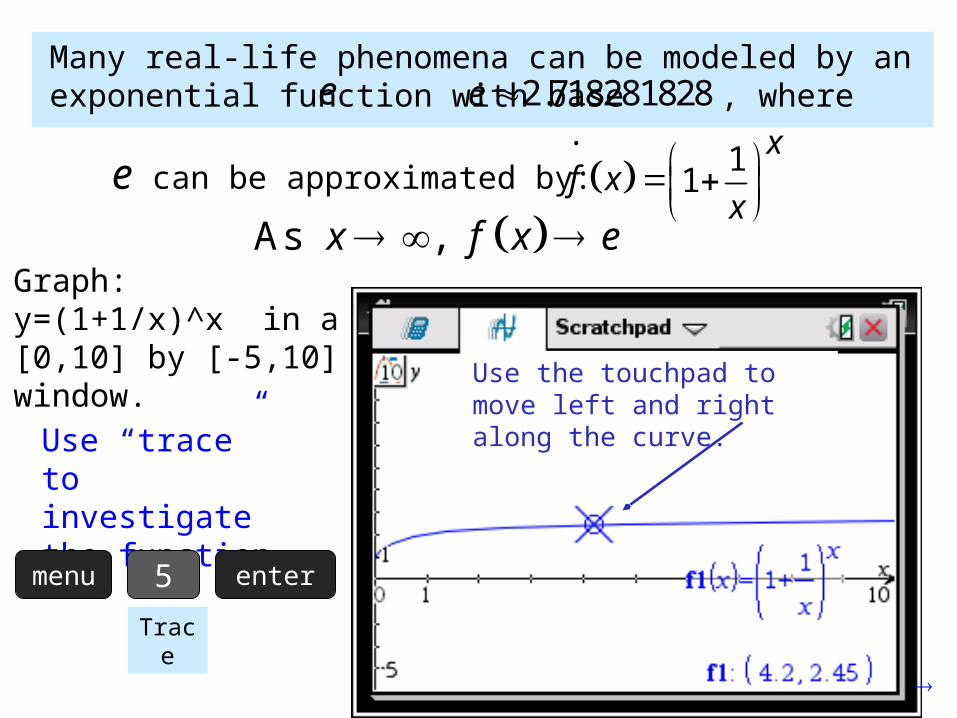
Many real-life phenomena can be modeled by an exponential function with base , where .e 2.718281828e
e can be approximated by: 11
xf x
x
As , x f x e Graph:y=(1+1/x)^x in a[0,10] by [-5,10]window.
Use “trace” to investigate the function.
menu enter
Use the touchpad to move left and right along the curve.
5
Trace

Tab to Table Step, change it to 1000, and press Enter.
menu enter
We can have the calculator construct a table to investigate how this function behaves as x gets much larger.
Press
menuTo change the table settings, press
Use the down arrow on the touch pad to scroll down to watch the y value approach e.
7
Table
2
Table
5
Edit Table Settings

menu
To remove the table, press:
2
Table
1
Remove Table
p