Embed Size (px)
Citation preview

Research Team October 23, 2021
DiwaliPicks 2021
Script NameCMP as on 22-
Oct-21Target Price Upside Potential Market Cap. (₹Bn.)
PE(FY23E)
Rationale/Description
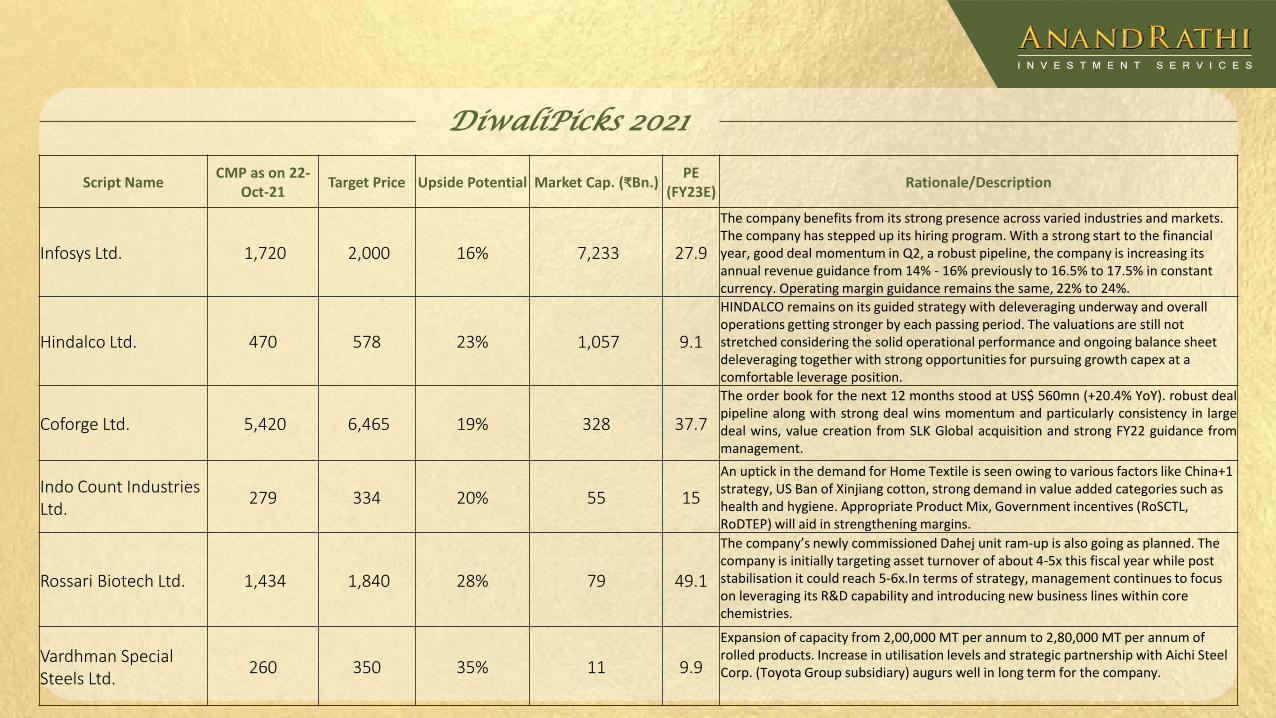
Infosys Ltd. 1,720 2,000 16% 7,233 27.9
The company benefits from its strong presence across varied industries and markets. The company has stepped up its hiring program. With a strong start to the financial year, good deal momentum in Q2, a robust pipeline, the company is increasing its annual revenue guidance from 14% - 16% previously to 16.5% to 17.5% in constant currency. Operating margin guidance remains the same, 22% to 24%.
Hindalco Ltd. 470 578 23% 1,057 9.1
HINDALCO remains on its guided strategy with deleveraging underway and overall operations getting stronger by each passing period. The valuations are still not stretched considering the solid operational performance and ongoing balance sheet deleveraging together with strong opportunities for pursuing growth capex at a comfortable leverage position.
Coforge Ltd. 5,420 6,465 19% 328 37.7
The order book for the next 12 months stood at US$ 560mn (+20.4% YoY). robust dealpipeline along with strong deal wins momentum and particularly consistency in largedeal wins, value creation from SLK Global acquisition and strong FY22 guidance frommanagement.
Indo Count Industries Ltd.
279 334 20% 55 15
An uptick in the demand for Home Textile is seen owing to various factors like China+1 strategy, US Ban of Xinjiang cotton, strong demand in value added categories such as health and hygiene. Appropriate Product Mix, Government incentives (RoSCTL, RoDTEP) will aid in strengthening margins.
Rossari Biotech Ltd. 1,434 1,840 28% 79 49.1
The company’s newly commissioned Dahej unit ram-up is also going as planned. The company is initially targeting asset turnover of about 4-5x this fiscal year while post stabilisation it could reach 5-6x.In terms of strategy, management continues to focus on leveraging its R&D capability and introducing new business lines within core chemistries.
Vardhman Special Steels Ltd.
260 350 35% 11 9.9
Expansion of capacity from 2,00,000 MT per annum to 2,80,000 MT per annum of rolled products. Increase in utilisation levels and strategic partnership with Aichi Steel Corp. (Toyota Group subsidiary) augurs well in long term for the company.
Infosys Limited (INFY) CMP: ₹1,720Target: ₹2,000
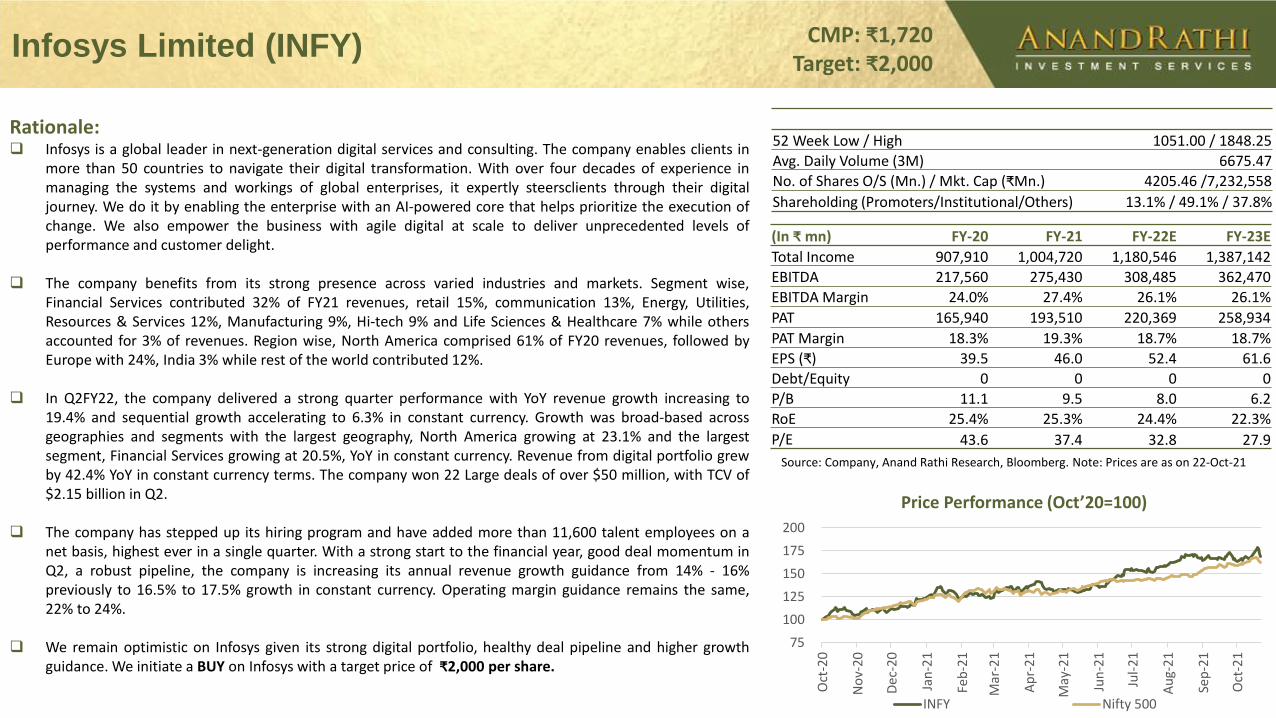
Price Performance (Oct’20=100)
Rationale: Infosys is a global leader in next-generation digital services and consulting. The company enables clients in
more than 50 countries to navigate their digital transformation. With over four decades of experience inmanaging the systems and workings of global enterprises, it expertly steersclients through their digitaljourney. We do it by enabling the enterprise with an AI-powered core that helps prioritize the execution ofchange. We also empower the business with agile digital at scale to deliver unprecedented levels ofperformance and customer delight.
The company benefits from its strong presence across varied industries and markets. Segment wise,Financial Services contributed 32% of FY21 revenues, retail 15%, communication 13%, Energy, Utilities,Resources & Services 12%, Manufacturing 9%, Hi-tech 9% and Life Sciences & Healthcare 7% while othersaccounted for 3% of revenues. Region wise, North America comprised 61% of FY20 revenues, followed byEurope with 24%, India 3% while rest of the world contributed 12%.
In Q2FY22, the company delivered a strong quarter performance with YoY revenue growth increasing to19.4% and sequential growth accelerating to 6.3% in constant currency. Growth was broad-based acrossgeographies and segments with the largest geography, North America growing at 23.1% and the largestsegment, Financial Services growing at 20.5%, YoY in constant currency. Revenue from digital portfolio grewby 42.4% YoY in constant currency terms. The company won 22 Large deals of over $50 million, with TCV of$2.15 billion in Q2.
The company has stepped up its hiring program and have added more than 11,600 talent employees on anet basis, highest ever in a single quarter. With a strong start to the financial year, good deal momentum inQ2, a robust pipeline, the company is increasing its annual revenue growth guidance from 14% - 16%previously to 16.5% to 17.5% growth in constant currency. Operating margin guidance remains the same,22% to 24%.
We remain optimistic on Infosys given its strong digital portfolio, healthy deal pipeline and higher growthguidance. We initiate a BUY on Infosys with a target price of ₹2,000 per share.
Source: Company, Anand Rathi Research, Bloomberg. Note: Prices are as on 22-Oct-21
52 Week Low / High 1051.00 / 1848.25
Avg. Daily Volume (3M) 6675.47
No. of Shares O/S (Mn.) / Mkt. Cap (₹Mn.) 4205.46 /7,232,558
Shareholding (Promoters/Institutional/Others) 13.1% / 49.1% / 37.8%
(In ₹ mn) FY-20 FY-21 FY-22E FY-23E
Total Income 907,910 1,004,720 1,180,546 1,387,142
EBITDA 217,560 275,430 308,485 362,470
EBITDA Margin 24.0% 27.4% 26.1% 26.1%
PAT 165,940 193,510 220,369 258,934
PAT Margin 18.3% 19.3% 18.7% 18.7%
EPS (₹) 39.5 46.0 52.4 61.6
Debt/Equity 0 0 0 0
P/B 11.1 9.5 8.0 6.2
RoE 25.4% 25.3% 24.4% 22.3%
P/E 43.6 37.4 32.8 27.9
75
100
125
150
175
200
Oct
-20
No
v-20
Dec
-20
Jan
-21
Feb
-21
Mar
-21
Ap
r-2
1
May
-21
Jun
-21
Jul-
21
Au
g-2
1
Sep
-21
Oct
-21
INFY Nifty 500
Hindalco Industries Ltd (HINDALCO) CMP: ₹470Target: ₹578
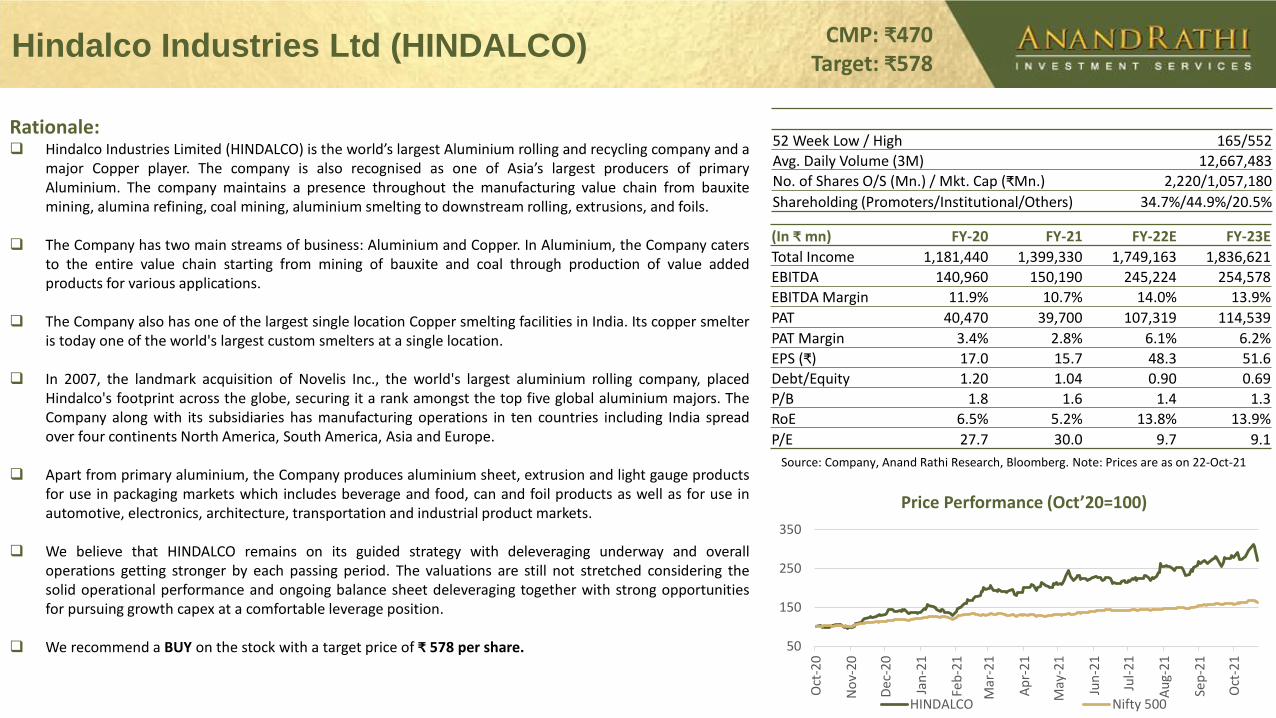
Price Performance (Oct’20=100)
Rationale: Hindalco Industries Limited (HINDALCO) is the world’s largest Aluminium rolling and recycling company and a
major Copper player. The company is also recognised as one of Asia’s largest producers of primaryAluminium. The company maintains a presence throughout the manufacturing value chain from bauxitemining, alumina refining, coal mining, aluminium smelting to downstream rolling, extrusions, and foils.
The Company has two main streams of business: Aluminium and Copper. In Aluminium, the Company catersto the entire value chain starting from mining of bauxite and coal through production of value addedproducts for various applications.
The Company also has one of the largest single location Copper smelting facilities in India. Its copper smelteris today one of the world's largest custom smelters at a single location.
In 2007, the landmark acquisition of Novelis Inc., the world's largest aluminium rolling company, placedHindalco's footprint across the globe, securing it a rank amongst the top five global aluminium majors. TheCompany along with its subsidiaries has manufacturing operations in ten countries including India spreadover four continents North America, South America, Asia and Europe.
Apart from primary aluminium, the Company produces aluminium sheet, extrusion and light gauge productsfor use in packaging markets which includes beverage and food, can and foil products as well as for use inautomotive, electronics, architecture, transportation and industrial product markets.
We believe that HINDALCO remains on its guided strategy with deleveraging underway and overalloperations getting stronger by each passing period. The valuations are still not stretched considering thesolid operational performance and ongoing balance sheet deleveraging together with strong opportunitiesfor pursuing growth capex at a comfortable leverage position.
We recommend a BUY on the stock with a target price of ₹ 578 per share.
Source: Company, Anand Rathi Research, Bloomberg. Note: Prices are as on 22-Oct-21
52 Week Low / High 165/552
Avg. Daily Volume (3M) 12,667,483
No. of Shares O/S (Mn.) / Mkt. Cap (₹Mn.) 2,220/1,057,180
Shareholding (Promoters/Institutional/Others) 34.7%/44.9%/20.5%
(In ₹ mn) FY-20 FY-21 FY-22E FY-23E
Total Income 1,181,440 1,399,330 1,749,163 1,836,621
EBITDA 140,960 150,190 245,224 254,578
EBITDA Margin 11.9% 10.7% 14.0% 13.9%
PAT 40,470 39,700 107,319 114,539
PAT Margin 3.4% 2.8% 6.1% 6.2%
EPS (₹) 17.0 15.7 48.3 51.6
Debt/Equity 1.20 1.04 0.90 0.69
P/B 1.8 1.6 1.4 1.3
RoE 6.5% 5.2% 13.8% 13.9%
P/E 27.7 30.0 9.7 9.1
50
150
250
350
Oct
-20
No
v-20
Dec
-20
Jan
-21
Feb
-21
Mar
-21
Ap
r-2
1
May
-21
Jun
-21
Jul-
21
Au
g-2
1
Sep
-21
Oct
-21
HINDALCO Nifty 500
Coforge Limited (COFORGE) CMP: ₹5,420Target: ₹6,465
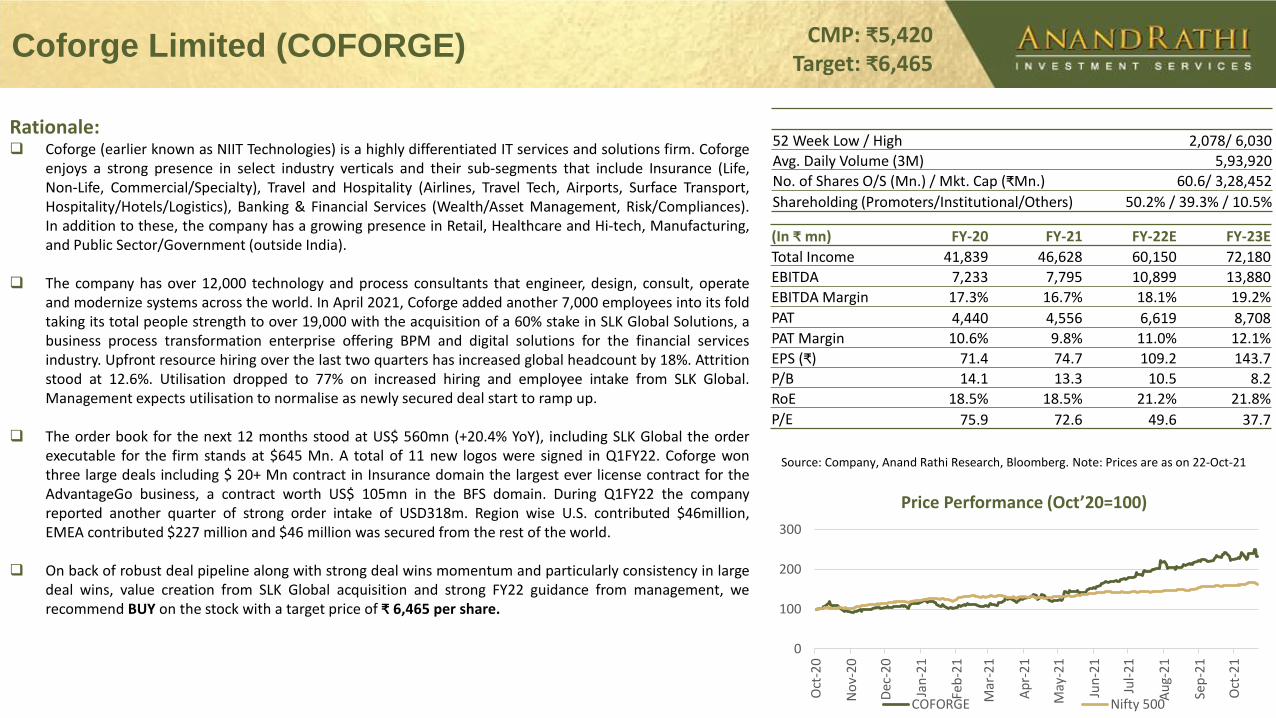
Price Performance (Oct’20=100)
Rationale: Coforge (earlier known as NIIT Technologies) is a highly differentiated IT services and solutions firm. Coforge
enjoys a strong presence in select industry verticals and their sub-segments that include Insurance (Life,Non-Life, Commercial/Specialty), Travel and Hospitality (Airlines, Travel Tech, Airports, Surface Transport,Hospitality/Hotels/Logistics), Banking & Financial Services (Wealth/Asset Management, Risk/Compliances).In addition to these, the company has a growing presence in Retail, Healthcare and Hi-tech, Manufacturing,and Public Sector/Government (outside India).
The company has over 12,000 technology and process consultants that engineer, design, consult, operateand modernize systems across the world. In April 2021, Coforge added another 7,000 employees into its foldtaking its total people strength to over 19,000 with the acquisition of a 60% stake in SLK Global Solutions, abusiness process transformation enterprise offering BPM and digital solutions for the financial servicesindustry. Upfront resource hiring over the last two quarters has increased global headcount by 18%. Attritionstood at 12.6%. Utilisation dropped to 77% on increased hiring and employee intake from SLK Global.Management expects utilisation to normalise as newly secured deal start to ramp up.
The order book for the next 12 months stood at US$ 560mn (+20.4% YoY), including SLK Global the orderexecutable for the firm stands at $645 Mn. A total of 11 new logos were signed in Q1FY22. Coforge wonthree large deals including $ 20+ Mn contract in Insurance domain the largest ever license contract for theAdvantageGo business, a contract worth US$ 105mn in the BFS domain. During Q1FY22 the companyreported another quarter of strong order intake of USD318m. Region wise U.S. contributed $46million,EMEA contributed $227 million and $46 million was secured from the rest of the world.
On back of robust deal pipeline along with strong deal wins momentum and particularly consistency in largedeal wins, value creation from SLK Global acquisition and strong FY22 guidance from management, werecommend BUY on the stock with a target price of ₹ 6,465 per share.
Source: Company, Anand Rathi Research, Bloomberg. Note: Prices are as on 22-Oct-21
52 Week Low / High 2,078/ 6,030
Avg. Daily Volume (3M) 5,93,920
No. of Shares O/S (Mn.) / Mkt. Cap (₹Mn.) 60.6/ 3,28,452
Shareholding (Promoters/Institutional/Others) 50.2% / 39.3% / 10.5%
(In ₹ mn) FY-20 FY-21 FY-22E FY-23E
Total Income 41,839 46,628 60,150 72,180
EBITDA 7,233 7,795 10,899 13,880
EBITDA Margin 17.3% 16.7% 18.1% 19.2%
PAT 4,440 4,556 6,619 8,708
PAT Margin 10.6% 9.8% 11.0% 12.1%
EPS (₹) 71.4 74.7 109.2 143.7
P/B 14.1 13.3 10.5 8.2
RoE 18.5% 18.5% 21.2% 21.8%
P/E 75.9 72.6 49.6 37.7
0
100
200
300
Oct
-20
No
v-20
Dec
-20
Jan
-21
Feb
-21
Mar
-21
Ap
r-2
1
May
-21
Jun
-21
Jul-
21
Au
g-2
1
Sep
-21
Oct
-21
COFORGE Nifty 500
Indo Count Industries Limited (ICIL) CMP: ₹279Target: ₹334
Price Performance (Oct’20=100)
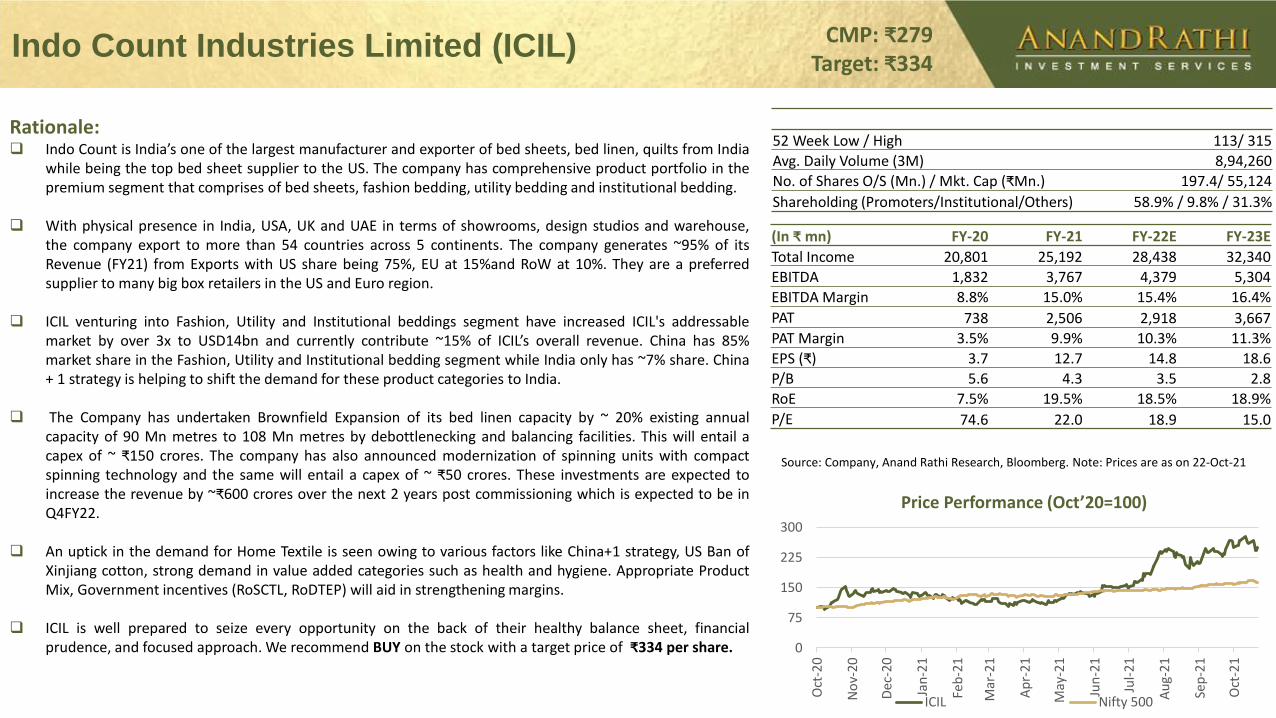
Rationale: Indo Count is India’s one of the largest manufacturer and exporter of bed sheets, bed linen, quilts from India
while being the top bed sheet supplier to the US. The company has comprehensive product portfolio in thepremium segment that comprises of bed sheets, fashion bedding, utility bedding and institutional bedding.
With physical presence in India, USA, UK and UAE in terms of showrooms, design studios and warehouse,the company export to more than 54 countries across 5 continents. The company generates ~95% of itsRevenue (FY21) from Exports with US share being 75%, EU at 15%and RoW at 10%. They are a preferredsupplier to many big box retailers in the US and Euro region.
ICIL venturing into Fashion, Utility and Institutional beddings segment have increased ICIL's addressablemarket by over 3x to USD14bn and currently contribute ~15% of ICIL’s overall revenue. China has 85%market share in the Fashion, Utility and Institutional bedding segment while India only has ~7% share. China+ 1 strategy is helping to shift the demand for these product categories to India.
The Company has undertaken Brownfield Expansion of its bed linen capacity by ~ 20% existing annualcapacity of 90 Mn metres to 108 Mn metres by debottlenecking and balancing facilities. This will entail acapex of ~ ₹150 crores. The company has also announced modernization of spinning units with compactspinning technology and the same will entail a capex of ~ ₹50 crores. These investments are expected toincrease the revenue by ~₹600 crores over the next 2 years post commissioning which is expected to be inQ4FY22.
An uptick in the demand for Home Textile is seen owing to various factors like China+1 strategy, US Ban ofXinjiang cotton, strong demand in value added categories such as health and hygiene. Appropriate ProductMix, Government incentives (RoSCTL, RoDTEP) will aid in strengthening margins.
ICIL is well prepared to seize every opportunity on the back of their healthy balance sheet, financialprudence, and focused approach. We recommend BUY on the stock with a target price of ₹334 per share.
Source: Company, Anand Rathi Research, Bloomberg. Note: Prices are as on 22-Oct-21
52 Week Low / High 113/ 315
Avg. Daily Volume (3M) 8,94,260
No. of Shares O/S (Mn.) / Mkt. Cap (₹Mn.) 197.4/ 55,124
Shareholding (Promoters/Institutional/Others) 58.9% / 9.8% / 31.3%
(In ₹ mn) FY-20 FY-21 FY-22E FY-23E
Total Income 20,801 25,192 28,438 32,340
EBITDA 1,832 3,767 4,379 5,304
EBITDA Margin 8.8% 15.0% 15.4% 16.4%
PAT 738 2,506 2,918 3,667
PAT Margin 3.5% 9.9% 10.3% 11.3%
EPS (₹) 3.7 12.7 14.8 18.6
P/B 5.6 4.3 3.5 2.8
RoE 7.5% 19.5% 18.5% 18.9%
P/E 74.6 22.0 18.9 15.0
0
75
150
225
300
Oct
-20
No
v-20
Dec
-20
Jan
-21
Feb
-21
Mar
-21
Ap
r-2
1
May
-21
Jun
-21
Jul-
21
Au
g-2
1
Sep
-21
Oct
-21
ICIL Nifty 500
Rossari Biotech Limited (ROSSARI) CMP: ₹1,434Target: ₹1,840
Price Performance (Oct’20=100)
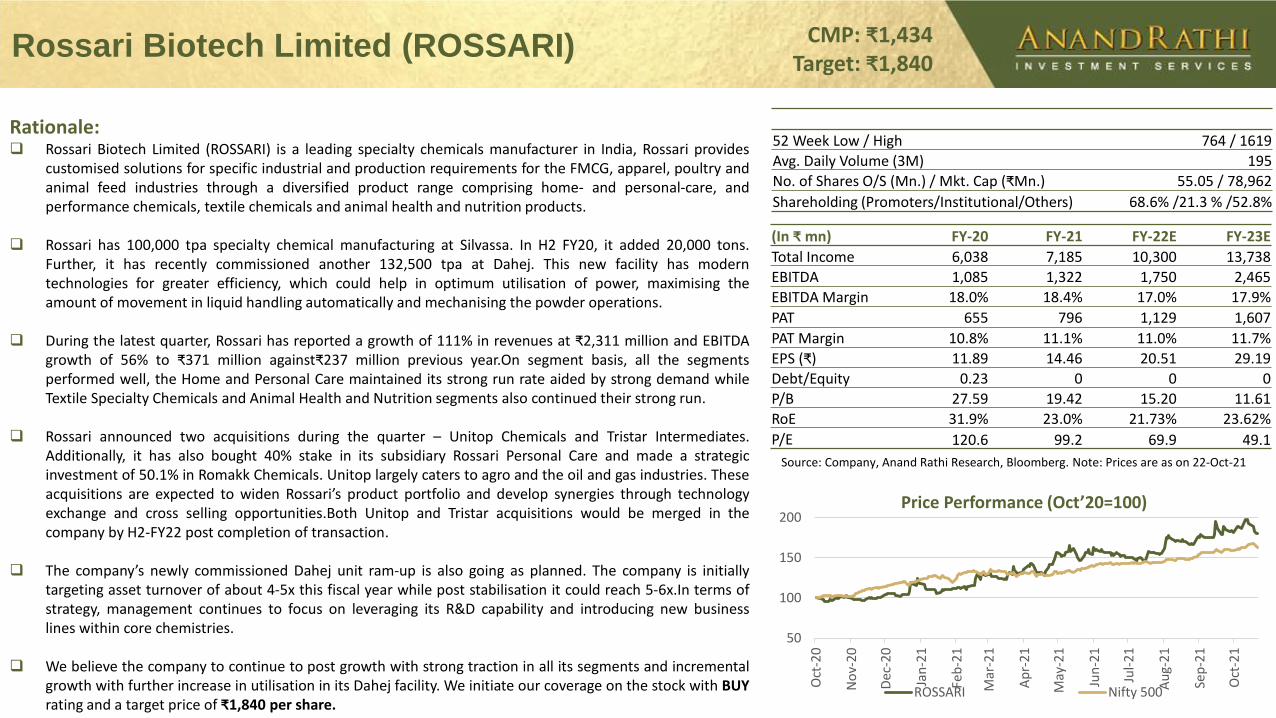
Rationale: Rossari Biotech Limited (ROSSARI) is a leading specialty chemicals manufacturer in India, Rossari provides
customised solutions for specific industrial and production requirements for the FMCG, apparel, poultry andanimal feed industries through a diversified product range comprising home- and personal-care, andperformance chemicals, textile chemicals and animal health and nutrition products.
Rossari has 100,000 tpa specialty chemical manufacturing at Silvassa. In H2 FY20, it added 20,000 tons.Further, it has recently commissioned another 132,500 tpa at Dahej. This new facility has moderntechnologies for greater efficiency, which could help in optimum utilisation of power, maximising theamount of movement in liquid handling automatically and mechanising the powder operations.
During the latest quarter, Rossari has reported a growth of 111% in revenues at ₹2,311 million and EBITDAgrowth of 56% to ₹371 million against₹237 million previous year.On segment basis, all the segmentsperformed well, the Home and Personal Care maintained its strong run rate aided by strong demand whileTextile Specialty Chemicals and Animal Health and Nutrition segments also continued their strong run.
Rossari announced two acquisitions during the quarter – Unitop Chemicals and Tristar Intermediates.Additionally, it has also bought 40% stake in its subsidiary Rossari Personal Care and made a strategicinvestment of 50.1% in Romakk Chemicals. Unitop largely caters to agro and the oil and gas industries. Theseacquisitions are expected to widen Rossari’s product portfolio and develop synergies through technologyexchange and cross selling opportunities.Both Unitop and Tristar acquisitions would be merged in thecompany by H2-FY22 post completion of transaction.
The company’s newly commissioned Dahej unit ram-up is also going as planned. The company is initiallytargeting asset turnover of about 4-5x this fiscal year while post stabilisation it could reach 5-6x.In terms ofstrategy, management continues to focus on leveraging its R&D capability and introducing new businesslines within core chemistries.
We believe the company to continue to post growth with strong traction in all its segments and incrementalgrowth with further increase in utilisation in its Dahej facility. We initiate our coverage on the stock with BUYrating and a target price of ₹1,840 per share.
Source: Company, Anand Rathi Research, Bloomberg. Note: Prices are as on 22-Oct-21
52 Week Low / High 764 / 1619
Avg. Daily Volume (3M) 195
No. of Shares O/S (Mn.) / Mkt. Cap (₹Mn.) 55.05 / 78,962
Shareholding (Promoters/Institutional/Others) 68.6% /21.3 % /52.8%
(In ₹ mn) FY-20 FY-21 FY-22E FY-23E
Total Income 6,038 7,185 10,300 13,738
EBITDA 1,085 1,322 1,750 2,465
EBITDA Margin 18.0% 18.4% 17.0% 17.9%
PAT 655 796 1,129 1,607
PAT Margin 10.8% 11.1% 11.0% 11.7%
EPS (₹) 11.89 14.46 20.51 29.19
Debt/Equity 0.23 0 0 0
P/B 27.59 19.42 15.20 11.61
RoE 31.9% 23.0% 21.73% 23.62%
P/E 120.6 99.2 69.9 49.1
50
100
150
200
Oct
-20
No
v-20
Dec
-20
Jan
-21
Feb
-21
Mar
-21
Ap
r-2
1
May
-21
Jun
-21
Jul-
21
Au
g-2
1
Sep
-21
Oct
-21
ROSSARI Nifty 500
Vardhman Special Steels Limited (VSSL) CMP: ₹260Target: ₹350
Price Performance (Oct’20=100)
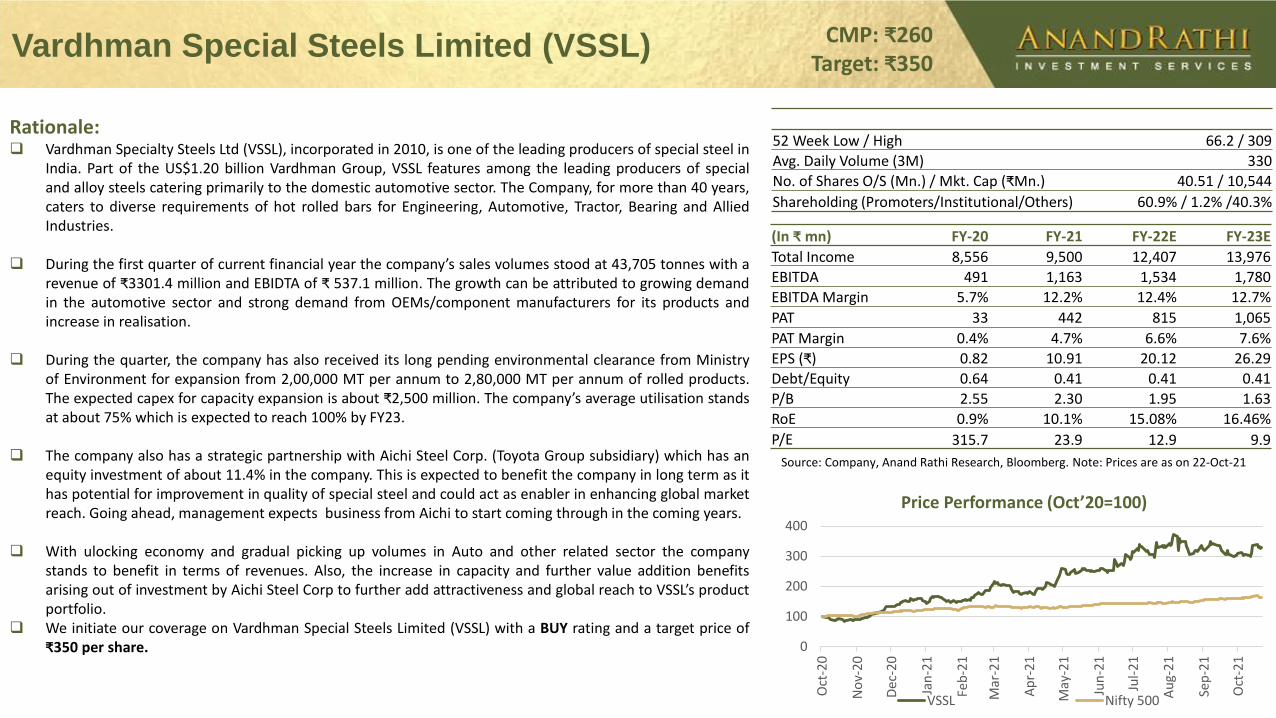
Rationale: Vardhman Specialty Steels Ltd (VSSL), incorporated in 2010, is one of the leading producers of special steel in
India. Part of the US$1.20 billion Vardhman Group, VSSL features among the leading producers of specialand alloy steels catering primarily to the domestic automotive sector. The Company, for more than 40 years,caters to diverse requirements of hot rolled bars for Engineering, Automotive, Tractor, Bearing and AlliedIndustries.
During the first quarter of current financial year the company’s sales volumes stood at 43,705 tonnes with arevenue of ₹3301.4 million and EBIDTA of ₹ 537.1 million. The growth can be attributed to growing demandin the automotive sector and strong demand from OEMs/component manufacturers for its products andincrease in realisation.
During the quarter, the company has also received its long pending environmental clearance from Ministryof Environment for expansion from 2,00,000 MT per annum to 2,80,000 MT per annum of rolled products.The expected capex for capacity expansion is about ₹2,500 million. The company’s average utilisation standsat about 75% which is expected to reach 100% by FY23.
The company also has a strategic partnership with Aichi Steel Corp. (Toyota Group subsidiary) which has anequity investment of about 11.4% in the company. This is expected to benefit the company in long term as ithas potential for improvement in quality of special steel and could act as enabler in enhancing global marketreach. Going ahead, management expects business from Aichi to start coming through in the coming years.
With ulocking economy and gradual picking up volumes in Auto and other related sector the companystands to benefit in terms of revenues. Also, the increase in capacity and further value addition benefitsarising out of investment by Aichi Steel Corp to further add attractiveness and global reach to VSSL’s productportfolio.
We initiate our coverage on Vardhman Special Steels Limited (VSSL) with a BUY rating and a target price of₹350 per share.
Source: Company, Anand Rathi Research, Bloomberg. Note: Prices are as on 22-Oct-21
52 Week Low / High 66.2 / 309
Avg. Daily Volume (3M) 330
No. of Shares O/S (Mn.) / Mkt. Cap (₹Mn.) 40.51 / 10,544
Shareholding (Promoters/Institutional/Others) 60.9% / 1.2% /40.3%
(In ₹ mn) FY-20 FY-21 FY-22E FY-23E
Total Income 8,556 9,500 12,407 13,976
EBITDA 491 1,163 1,534 1,780
EBITDA Margin 5.7% 12.2% 12.4% 12.7%
PAT 33 442 815 1,065
PAT Margin 0.4% 4.7% 6.6% 7.6%
EPS (₹) 0.82 10.91 20.12 26.29
Debt/Equity 0.64 0.41 0.41 0.41
P/B 2.55 2.30 1.95 1.63
RoE 0.9% 10.1% 15.08% 16.46%
P/E 315.7 23.9 12.9 9.9
0
100
200
300
400
Oct
-20
No
v-20
Dec
-20
Jan
-21
Feb
-21
Mar
-21
Ap
r-2
1
May
-21
Jun
-21
Jul-
21
Au
g-2
1
Sep
-21
Oct
-21
VSSL Nifty 500
Diwali Picks 2020 Performance (6th Nov 2020)
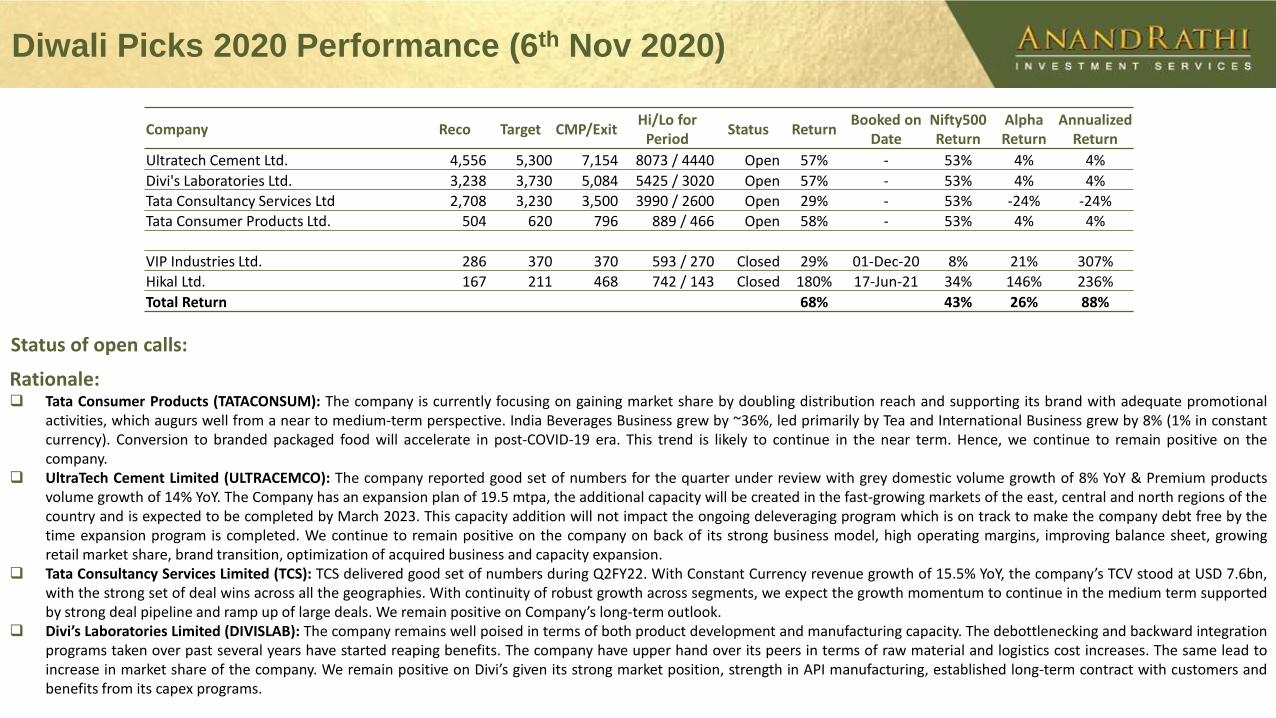
Rationale: Tata Consumer Products (TATACONSUM): The company is currently focusing on gaining market share by doubling distribution reach and supporting its brand with adequate promotional
activities, which augurs well from a near to medium-term perspective. India Beverages Business grew by ~36%, led primarily by Tea and International Business grew by 8% (1% in constantcurrency). Conversion to branded packaged food will accelerate in post-COVID-19 era. This trend is likely to continue in the near term. Hence, we continue to remain positive on thecompany.
UltraTech Cement Limited (ULTRACEMCO): The company reported good set of numbers for the quarter under review with grey domestic volume growth of 8% YoY & Premium productsvolume growth of 14% YoY. The Company has an expansion plan of 19.5 mtpa, the additional capacity will be created in the fast-growing markets of the east, central and north regions of thecountry and is expected to be completed by March 2023. This capacity addition will not impact the ongoing deleveraging program which is on track to make the company debt free by thetime expansion program is completed. We continue to remain positive on the company on back of its strong business model, high operating margins, improving balance sheet, growingretail market share, brand transition, optimization of acquired business and capacity expansion.
Tata Consultancy Services Limited (TCS): TCS delivered good set of numbers during Q2FY22. With Constant Currency revenue growth of 15.5% YoY, the company’s TCV stood at USD 7.6bn,with the strong set of deal wins across all the geographies. With continuity of robust growth across segments, we expect the growth momentum to continue in the medium term supportedby strong deal pipeline and ramp up of large deals. We remain positive on Company’s long-term outlook.
Divi’s Laboratories Limited (DIVISLAB): The company remains well poised in terms of both product development and manufacturing capacity. The debottlenecking and backward integrationprograms taken over past several years have started reaping benefits. The company have upper hand over its peers in terms of raw material and logistics cost increases. The same lead toincrease in market share of the company. We remain positive on Divi’s given its strong market position, strength in API manufacturing, established long-term contract with customers andbenefits from its capex programs.
Status of open calls:
Company Reco Target CMP/ExitHi/Lo for
PeriodStatus Return
Booked on Date
Nifty500 Return
Alpha Return
Annualized Return
Ultratech Cement Ltd. 4,556 5,300 7,154 8073 / 4440 Open 57% - 53% 4% 4%
Divi's Laboratories Ltd. 3,238 3,730 5,084 5425 / 3020 Open 57% - 53% 4% 4%
Tata Consultancy Services Ltd 2,708 3,230 3,500 3990 / 2600 Open 29% - 53% -24% -24%
Tata Consumer Products Ltd. 504 620 796 889 / 466 Open 58% - 53% 4% 4%
VIP Industries Ltd. 286 370 370 593 / 270 Closed 29% 01-Dec-20 8% 21% 307%
Hikal Ltd. 167 211 468 742 / 143 Closed 180% 17-Jun-21 34% 146% 236%
Total Return 68% 43% 26% 88%
Disclaimer:
Analyst Certification
The views expressed in this Research Report accurately reflect the personal views of the analyst(s) about the subject securities or issuers and no part of the compensation of the research
analyst(s) was, is, or will be directly or indirectly related to the specific recommendations or views expressed by the research analyst(s) in this report. The research analysts are bound by
stringent internal regulations and also legal and statutory requirements of the Securities and Exchange Board of India (hereinafter “SEBI”) and the analysts’ compensation are completely
delinked from all the other companies and/or entities of Anand Rathi, and have no bearing whatsoever on any recommendation that they have given in the Research Report.
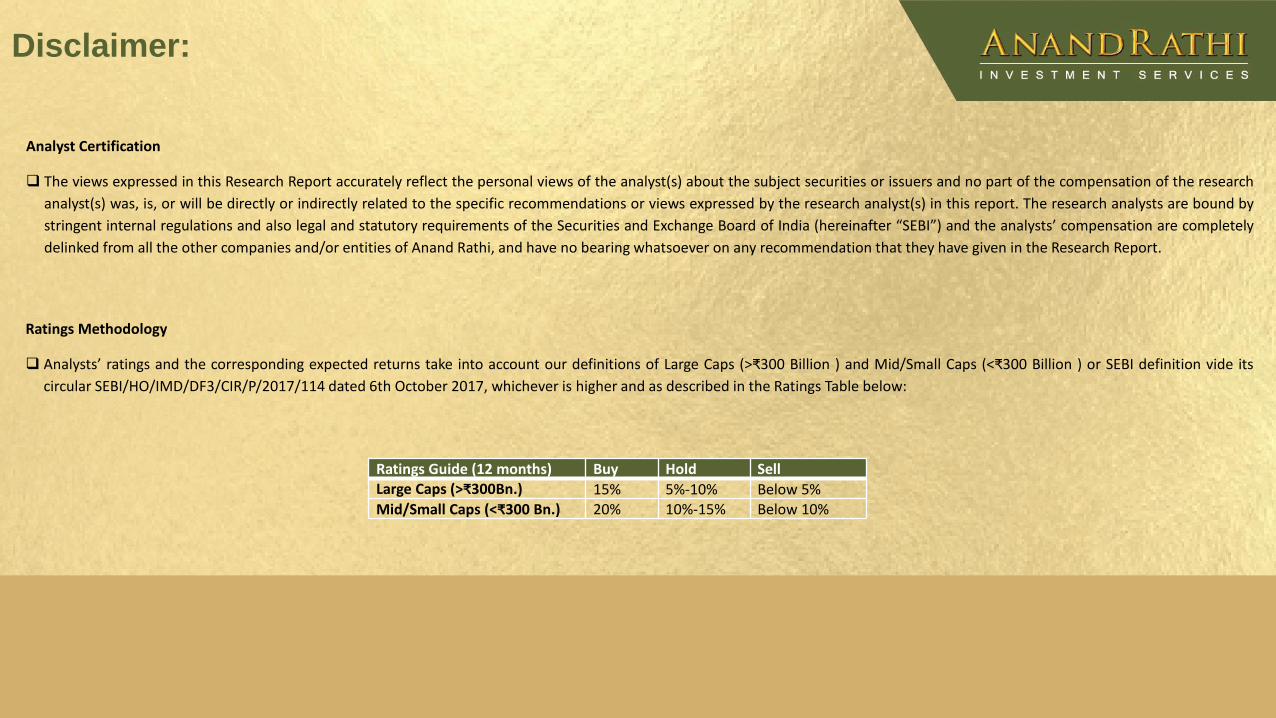
Ratings Methodology
Analysts’ ratings and the corresponding expected returns take into account our definitions of Large Caps (>₹300 Billion ) and Mid/Small Caps (<₹300 Billion ) or SEBI definition vide its
circular SEBI/HO/IMD/DF3/CIR/P/2017/114 dated 6th October 2017, whichever is higher and as described in the Ratings Table below:
Ratings Guide (12 months) Buy Hold SellLarge Caps (>₹300Bn.) 15% 5%-10% Below 5%Mid/Small Caps (<₹300 Bn.) 20% 10%-15% Below 10%
Research Disclaimer and Disclosure inter-alia as required under Securities and Exchange Board of India (Research Analysts) Regulations, 2014
Anand Rathi Share and Stock Brokers Ltd. (hereinafter refer as ARSSBL) (Research Entity, SEBI Regn No. INH000000834, Date of Regn. 29/06/2015) is a subsidiary of the Anand Rathi Financial Services Ltd.
ARSSBL is a corporate trading and clearing member of Bombay Stock Exchange Ltd, National Stock Exchange of India Ltd. (NSEIL), Multi Stock Exchange of India Ltd (MCX-SX), United stock exchange and also
depository participant with National Securities Depository Ltd (NSDL) and Central Depository Services Ltd. ARSSBL is engaged into the business of Stock Broking, Depository Participant, Mutual Fund
distributor.
The research analysts, strategists, or research associates principally responsible for the preparation of Anand Rathi Research have received compensation based upon various factors, including quality of
research, investor client feedback, stock picking, competitive factors, firm revenues.
General Disclaimer: - This Research Report (hereinafter called “Report”) is meant solely for use by the recipient and is not for circulation. This Report does not constitute a personal recommendation or take
into account the particular investment objectives, financial situations, or needs of individual clients. The recommendations, if any, made herein are expression of views and/or opinions and should not be
deemed or construed to be neither advice for the purpose of purchase or sale of any security, derivatives or any other security through ARSSBL nor any solicitation or offering of any investment /trading
opportunity on behalf of the issuer(s) of the respective security (ies) referred to herein. These information / opinions / views are not meant to serve as a professional investment guide for the readers.No
action is solicited based upon the information provided herein. Recipients of this Report should rely on information/data arising out of their own investigations. Readers are advised to seek independent
professional advice and arrive at an informed trading/investment decision before executing any trades or making any investments. This Report has been prepared on the basis of publicly available
information, internally developed data and other sources believed by ARSSBL to be reliable. ARSSBL or its directors, employees, affiliates or representatives do not assume any responsibility for, or warrant
the accuracy, completeness, adequacy and reliability of such information / opinions / views. While due care has been taken to ensure that the disclosures and opinions given are fair and reasonable, none of
the directors, employees, affiliates or representatives of ARSSBL shall be liable for any direct, indirect, special, incidental, consequential, punitive or exemplary damages, including lost profits arising in any
way whatsoever from the information / opinions / views contained in this Report. The price and value of the investments referred to in this Report and the income from them may go down as well as up, and
investors may realize losses on any investments. Past performance is not a guide for future performance. ARSSBL does not provide tax advice to its clients, and all investors are strongly advised to consult
with their tax advisers regarding taxation aspects of any potential investment.
Continued…
Contd…
Opinions expressed are our current opinions as of the date appearing on this Research only. We do not undertake to advise you as to any change of our views expressed in this Report. Research Report may differ between ARSSBL’s RAs and/ or ARSSBL’s associate companies on account of differences in research methodology, personal judgment and difference in time horizons for which recommendations are made. User should keep this risk in mind and not hold ARSSBL, its employees and associates responsible for any losses, damages of any type whatsoever.
ARSSBL and its associates or employees may; (a) from time to time, have long or short positions in, and buy or sell the investments in/ security of company (ies) mentioned herein or (b) be engaged in any other transaction involving such investments/ securities of company (ies) discussed herein or act as advisor or lender / borrower to such company (ies) these and other activities of ARSSBL and its associates or employees may not be construed as potential conflict of interest with respect to any recommendation and related information and opinions. Without limiting any of the foregoing, in no event shall ARSSBL and its associates or employees or any third party involved in, or related to computing or compiling the information have any liability for any damages of any kind.
Details of Associates of ARSSBL and Brief History of Disciplinary action by regulatory authorities & its associates are available on our website i. e. www.rathi.com
Disclaimers in respect of jurisdiction: This report is not directed to, or intended for distribution to or use by, any person or entity who is a citizen or resident of or located in any locality, state, country or other jurisdiction where such distribution, publication, availability or use would be contrary to law or regulation or which would subject ARSSBL to any registration or licensing requirement within such jurisdiction(s). No action has been or will be taken by ARSSBL in any jurisdiction (other than India), where any action for such purpose(s) is required. Accordingly, this Report shall not be possessed, circulated and/or distributed in any such country or jurisdiction unless such action is in compliance with all applicable laws and regulations of such country or jurisdiction. ARSSBL requires such recipient to inform himself about and to observe any restrictions at his own expense, without any liability to ARSSBL. Any dispute arising out of this Report shall be subject to the exclusive jurisdiction of the Courts in India.
Copyright: - This report is strictly confidential and is being furnished to you solely for your information. All material presented in this report, unless specifically indicated otherwise, is under copyright to ARSSBL. None of the material, its content, or any copy of such material or content, may be altered in any way, transmitted, copied or reproduced (in whole or in part) or redistributed in any form to any other party, without the prior express written permission of ARSSBL. All trademarks, service marks and logos used in this report are trademarks or service marks or registered trademarks or service marks of ARSSBL or its affiliates, unless specifically mentioned otherwise.
Contd…
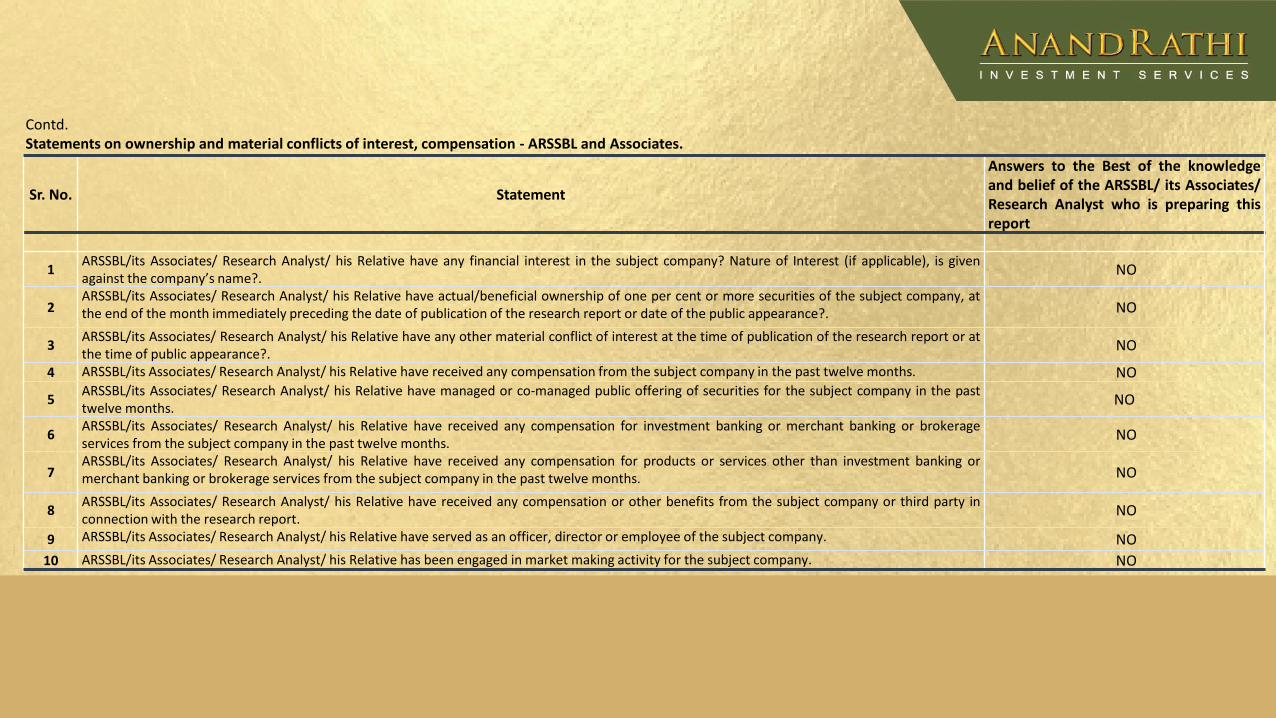
Contd.Statements on ownership and material conflicts of interest, compensation - ARSSBL and Associates.
Sr. No. Statement
Answers to the Best of the knowledgeand belief of the ARSSBL/ its Associates/Research Analyst who is preparing thisreport
1ARSSBL/its Associates/ Research Analyst/ his Relative have any financial interest in the subject company? Nature of Interest (if applicable), is givenagainst the company’s name?.
NO
2ARSSBL/its Associates/ Research Analyst/ his Relative have actual/beneficial ownership of one per cent or more securities of the subject company, atthe end of the month immediately preceding the date of publication of the research report or date of the public appearance?. NO
3ARSSBL/its Associates/ Research Analyst/ his Relative have any other material conflict of interest at the time of publication of the research report or atthe time of public appearance?.
NO
4 ARSSBL/its Associates/ Research Analyst/ his Relative have received any compensation from the subject company in the past twelve months. NO
5ARSSBL/its Associates/ Research Analyst/ his Relative have managed or co-managed public offering of securities for the subject company in the pasttwelve months.
NO
6ARSSBL/its Associates/ Research Analyst/ his Relative have received any compensation for investment banking or merchant banking or brokerageservices from the subject company in the past twelve months.
NO
7ARSSBL/its Associates/ Research Analyst/ his Relative have received any compensation for products or services other than investment banking ormerchant banking or brokerage services from the subject company in the past twelve months. NO
8ARSSBL/its Associates/ Research Analyst/ his Relative have received any compensation or other benefits from the subject company or third party inconnection with the research report.
NO
9 ARSSBL/its Associates/ Research Analyst/ his Relative have served as an officer, director or employee of the subject company. NO
10 ARSSBL/its Associates/ Research Analyst/ his Relative has been engaged in market making activity for the subject company. NO