Embed Size (px)
Citation preview

Research sampling design for rocklobsters in Te Tapuwae oRongokako Marine Reserve
DOC SCIENCE INTERNAL SERIES 128
John D. Booth
Published by
Department of Conservation
P.O. Box 10-420
Wellington, New Zealand
DOC Science Internal Series is a published record of scientific research carried out, or advice given, by
Department of Conservation staff, or external contractors funded by DOC. It comprises progress
reports and short communications that are generally peer-reviewed within DOC, but not always
externally refereed. Fully refereed contract reports funded from the Conservation Services Levy (CSL)
are also included.
Individual contributions to the series are first released on the departmental intranet in pdf form.
Hardcopy is printed, bound, and distributed at regular intervals. Titles are listed in the DOC Science
Publishing catalogue on the departmental website http://www.doc.govt.nz and electronic copies of
CSL papers can be downloaded from http://www.csl.org.nz
© Copyright August 2003, New Zealand Department of Conservation
ISSN 1175–6519
ISBN 0–478–22456–7
In the interest of forest conservation, DOC Science Publishing supports paperless electronic
publishing. When printing, recycled paper is used wherever possible.
This report was prepared for publication by DOC Science Publishing, Science & Research Unit; editing
and layout by Geoff Gregory. Publication was approved by the Manager, Science & Research Unit,
Science Technology and Information Services, Department of Conservation, Wellington.
CONTENTS
Abstract 5
1. Introduction 6
2. Tagging for growth and movements 6
2.1 Background 8
2.2 Movements in CRA3, particularly those near the Reserve 10
2.3 Methods 11
2.3.1 Tag type 11
2.3.2 Tag source and costs 11
2.3.3 Tagging procedure 12
2.3.4 Numbers of lobsters tagged 13
2.3.5 Tagging logistics 13
2.3.6 Data entry 15
2.3.7 Follow-up 15
2.4 Estimates of resources required and associated costs 15
2.5 Recommended tagging schedule and associated costs 16
2.6 Summary of the information expected from this project 17
3. Recruitment issues 17
3.1 Background 17
3.2 Approach 18
4. Pot CPUE as an index of abundance 19
4.1 Background 19
4.2 Methods and logistics 20
4.3 Estimates of resources required and associated costs for initial
investigation 22
5. Potential sources of funding and/or in-kind support 22
5.1 Current/imminent rock lobster research in CRA3 23
5.2 Possible synergies/support 23
6. Acknowledgements 24
7. References 25

4 Booth—Sampling rock lobsters in a marine reserve
5DOC Science Internal Series 128
© August 2003, New Zealand Department of Conservation. This paper may be cited as:
Booth, J.D. 2003: Research sampling design for rock lobsters in Te Tapuwae o Rongokako Marine
Reserve. DOC Science Internal Series 128. Department of Conservation, Wellington. 25 p.
Research sampling design for rocklobsters in Te Tapuwae oRongokako Marine Reserve
John D. Booth
National Institute of Water & Atmospheric Research Ltd, P.O. Box 14-901,
Wellington, New Zealand
A B S T R A C T
To determine growth rates and patterns of movement of a wide size range of
rock lobsters (Jasus edwardsii) within and near Te Tapuwae o Rongokako
Marine Reserve, it is recommended that about 6000 lobsters be tagged in and
within 2 km of the Reserve in the first year for subsequent recapture. In this
way information should be obtainable on moulting and growth, effects of
density on growth, and movement patterns within the Reserve and across its
boundaries. The surrounding Gisborne rock lobster fishery is unique in that it
targets males and for a significant portion of the year is based on new male
recruits about four years of age. The effectiveness of puerulus settlement levels
in forecasting recruitment to the fishery could be tested by following cohorts
trapped in fine-meshed pots. The proposed sampling, conducted over time,
should lead to the development of an index of the relative abundance by sex
and size (age) group of lobsters that can be directly correlated with the index of
settlement and a catch per unit effort (CPUE) index from the commercial
fishery. Identical sampling in both fished and non-fished areas will show how
lobster density affects cohort abundance. The Reserve, in which dive surveys of
lobster abundance are regularly undertaken and where there is no fishing, is
also a suitable place to test hypotheses concerning the relationship between
lobster pot CPUE and actual lobster abundance.
Keywords: rock lobster, Jasus edwardsii, moulting, growth, population
recruitment, movement patterns, Te Tapuwae o Rongokako Marine Reserve,
Gisborne, rock lobster fishery, New Zealand.
6 Booth—Sampling rock lobsters in a marine reserve
1. Introduction
The establishment in 1999 of Te Tapuwae o Rongokako Marine Reserve (‘the
Reserve’) meant that a productive rock lobster (Jasus edwardsii) fishing shore
was no longer available to fishers. Department of Conservation (DOC), co-
managers with Ngati Konohi of the Reserve, wish to ensure that information on
the dynamics of the lobster stock within the Reserve is available to fishery
managers, particularly as it can contribute to stock assessment and management
of the broader local lobster fishing area (CRA3) as a whole. DOC therefore
contracted National Institute of Water and Atmospheric Research Ltd (NIWA) to
formulate appropriate lobster research, to estimate its cost, and to identify
potential sources of funding. NIWA identified four areas of research that might
be considered, based in part on the outcome of a meeting, between staff of
DOC, NIWA, and the New Zealand Rock Lobster Industry Council (NZRLIC),
that canvassed useful topics for research. (Note that the critical issue of change
in abundance and size of lobsters in the Reserve following its inception is
already being addressed by DOC.) These four potential areas of research are:
tagging for growth and movements; cross-boundary movements; recruitment
issues; and pot catch per unit effort (CPUE) as a measure of abundance.
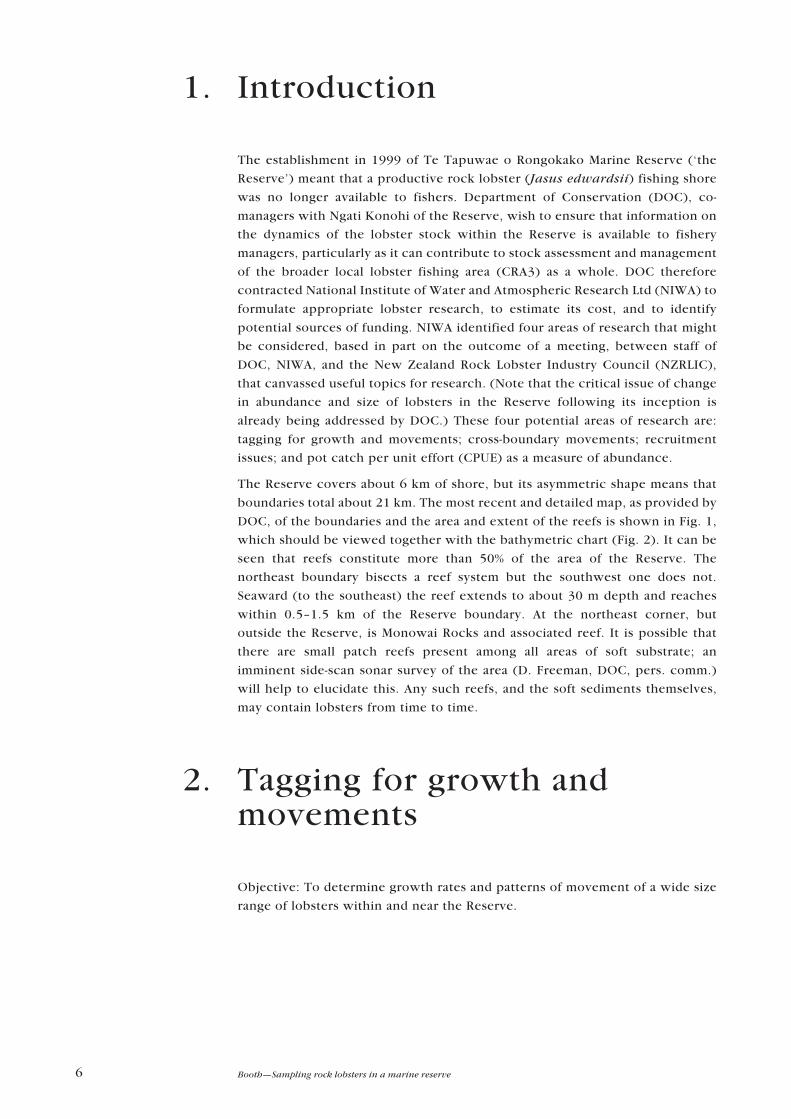
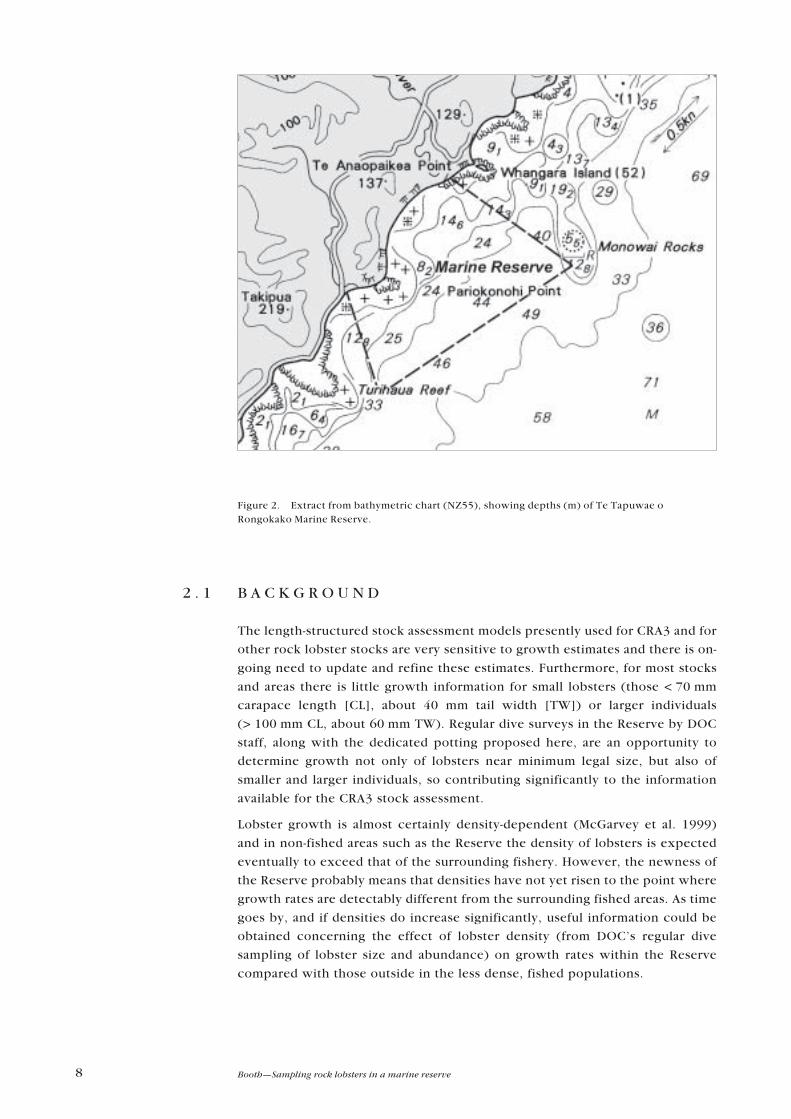
The Reserve covers about 6 km of shore, but its asymmetric shape means that
boundaries total about 21 km. The most recent and detailed map, as provided by
DOC, of the boundaries and the area and extent of the reefs is shown in Fig. 1,
which should be viewed together with the bathymetric chart (Fig. 2). It can be
seen that reefs constitute more than 50% of the area of the Reserve. The
northeast boundary bisects a reef system but the southwest one does not.
Seaward (to the southeast) the reef extends to about 30 m depth and reaches
within 0.5–1.5 km of the Reserve boundary. At the northeast corner, but
outside the Reserve, is Monowai Rocks and associated reef. It is possible that
there are small patch reefs present among all areas of soft substrate; an
imminent side-scan sonar survey of the area (D. Freeman, DOC, pers. comm.)
will help to elucidate this. Any such reefs, and the soft sediments themselves,
may contain lobsters from time to time.
2. Tagging for growth andmovements
Objective: To determine growth rates and patterns of movement of a wide size
range of lobsters within and near the Reserve.
7DOC Science Internal Series 128
Figure 1. Map of Te Tapuwae o Rongokako Marine Reserve, prepared by Survey Gisborne Ltd for East Coast Conservancy, DOC.Boundaries are indicative only, depths are in metres.
km
nautical miles
8 Booth—Sampling rock lobsters in a marine reserve
2 . 1 B A C K G R O U N D
The length-structured stock assessment models presently used for CRA3 and for
other rock lobster stocks are very sensitive to growth estimates and there is on-
going need to update and refine these estimates. Furthermore, for most stocks
and areas there is little growth information for small lobsters (those < 70 mm
carapace length [CL], about 40 mm tail width [TW]) or larger individuals
(> 100 mm CL, about 60 mm TW). Regular dive surveys in the Reserve by DOC
staff, along with the dedicated potting proposed here, are an opportunity to
determine growth not only of lobsters near minimum legal size, but also of
smaller and larger individuals, so contributing significantly to the information
available for the CRA3 stock assessment.
Lobster growth is almost certainly density-dependent (McGarvey et al. 1999)
and in non-fished areas such as the Reserve the density of lobsters is expected
eventually to exceed that of the surrounding fishery. However, the newness of
the Reserve probably means that densities have not yet risen to the point where
growth rates are detectably different from the surrounding fished areas. As time
goes by, and if densities do increase significantly, useful information could be
obtained concerning the effect of lobster density (from DOC’s regular dive
sampling of lobster size and abundance) on growth rates within the Reserve
compared with those outside in the less dense, fished populations.
Figure 2. Extract from bathymetric chart (NZ55), showing depths (m) of Te Tapuwae oRongokako Marine Reserve.
9DOC Science Internal Series 128
This section therefore proposes a strategy for determining growth of lobsters
over a wide size range within and close to the Reserve.
Tagging gives information not just on growth, but also on movements. Lobster
movements in and near the Reserve important to the CRA3 fishery include:
• those one way from the Reserve into surrounding areas, perhaps in response
to increased lobster density in the Reserve through absence of fishing there;
• those one way into the Reserve from surrounding areas;
• seasonal inshore–offshore movements within the Reserve and across the
Reserve boundaries according to moulting, breeding, and feeding cycles;
• longer-distance, alongshore migrations originating in CRA3, ending within
CRA3, or passing through CRA3.
Movements out of marine reserves—either seasonally (as at Leigh, Kelly et al.
1999) or permanently—can contribute to local fisheries. In the Reserve, the
cross-boundary route most often used is probably the northeast one because the
southeastern and southwestern boundaries are on average about 1 km beyond
the reef edge, and over what appear to be mainly soft substrates. Tagging of
lobsters within the Reserve, mainly with subsequent fisher recapture outside it,
should therefore provide information on the Reserve’s contribution, if any, to
lobsters in the surrounding fishery—but it will be difficult to distinguish
temporary seasonal movements out of the Reserve from departures that are
permanent.
Both seasonal and permanent migrants may also be entering the Reserve from
surrounding areas. Tag movements referred to later show that what appear to
be random movements of 2 km or more are not uncommon in CRA3.
Determining the timing, scale, and extent of seasonal inshore–offshore
movements—whether they are confined entirely within the boundaries of the
Reserve or if they involve crossing a Reserve boundary—is problematic. Very
little is known about seasonal inshore-offshore movements, with only two
detailed studies by size class of such movements in J. edwardsii in New
Zealand—at Leigh (MacDiarmid 1991; Kelly et al. 1999). All other reports have
been essentially anecdotal (e.g. Street 1969) or simply speculative (Sorensen
1969). The tag best suited for determining such movements are constant-
tracked types as used by Kelly et al. (1999) but their deployment is very
resource-intensive and only 10 or so lobsters can be tracked at any time; this is
not a practical way forward at this stage but is certainly possible for the future.
Long-distance alongshore movements appear to be crucial to larval recruitment
processes in J. edwardsii in the south of New Zealand and the green or
packhouse lobster (Sagmariasus verreauxi) along the east coast of the North
Island (Booth 1997; Kendrick & Bentley 2002). The migrants are almost always
immature females and similar-sized males (male maturity cannot be determined
externally). Such migrations of lobsters may also take place in and near CRA3
but the issue is unresolved because immature lobsters in CRA3 and surrounding
quota management areas are small (females, at least, are less than 70 mm CL;
Annala et al. 1980), smaller than those tagged in any number to date and
generally too small to be routinely taken by potting. Nevertheless, there is
anecdotal information from trawler fishers suggesting that there are large
movements in CRA3 from time to time, particularly in spring, of mainly small
10 Booth—Sampling rock lobsters in a marine reserve
lobsters on open bottom. The Reserve provides an opportunity to develop a
resource of tagged immature lobsters to test for any sign of such movements.
2 . 2 M O V E M E N T S I N C R A 3 , P A R T I C U L A R L Y T H O S E
N E A R T H E R E S E R V E
Tagging of lobsters in CRA3 began in the mid-1970s (Annala 1981; McKoy &
Esterman 1982; Annala & Bycroft 1984), continued into the early 1980s (Booth
1997), then next took place in the mid-1990s (Kendrick & Bentley 2002). All
but the 1990s taggings took place before there was precise position-fixing
technology such as GPS for locating the release and recapture positions;
accordingly, an estimated distance moved of 5 km was considered to be the
minimum detectable in the early studies. Taggings in the 1970s and 1980s (2847
tagged, 1142 recaptured) showed very small proportions of lobsters (0.5–3.1%
of recaptures) moving more than 5 km. The 1990s taggings in CRA3 (6313
tagged, 252 recaptures), in which positions were fixed by GPS, showed
similarly low frequency of movements exceeding 5 km. During the 1990s
taggings, no tagged lobsters were released and recaptured within the area of the
Reserve or within 5 km of its boundary (Ministry of Fisheries [MFish] tag
database, administered by NIWA), but the nature of movements that might be
expected to occur in the area of the Reserve are suggested by those seen slightly
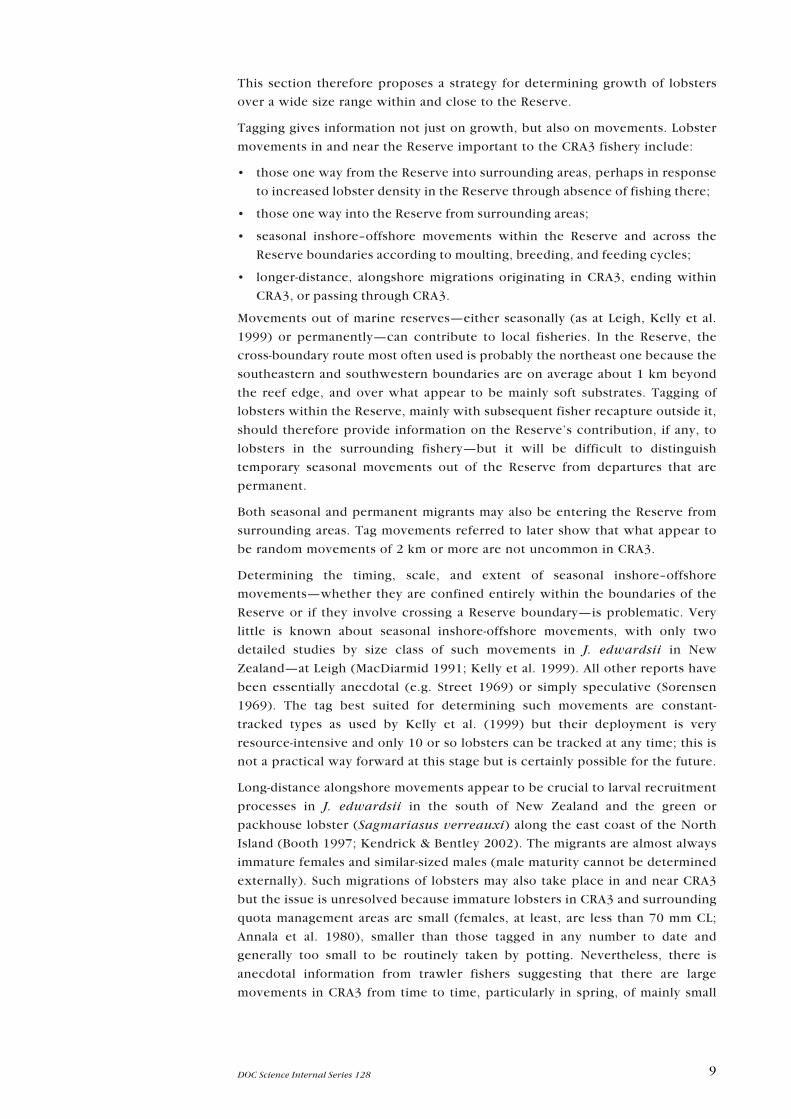
further south. Figure 3 shows all movements in the area between Tatapouri and
Tuaheni Point from the 1990s taggings. Most movements were short-distance
(less than 2 km) and alongshore, but similar numbers moved northeast as
moved southwest. Thus in order to determine the extent of any movements into
the Reserve, whether seasonally inshore-offshore or permanent, it is suggested
that some tagging needs to take place outside the Reserve, within at least 2 km
of its boundaries.
Figure 3. Movements of lobsters tagged betweenTatapouri and Tuahine Points, 1990s. Latitudes are38°S; circle gives tagging position.
11DOC Science Internal Series 128
2 . 3 M E T H O D S
Three tag groups within and near the Reserve are considered:
• Tag Group 1. These are 70–100 mm CL lobsters, the size group routinely
tagged in CRA3. The lobsters would be caught primarily by potting both inside
and within 2 km of the Reserve boundary.
• Tag Group 2. Small lobsters (< 70 mm CL), caught primarily by diving within
the Reserve.
• Tag Group 3. Large lobsters (> 100 mm CL), caught primarily by diving inside
the Reserve.
For all three groups, multiple recaptures and re-releases are likely, which
increases the potential information contribution of each tagged lobster. As time
goes by and the lobsters within the Reserve increase in mean size, more Tag
Group 3 lobsters should become available to research potting within the
Reserve.
2.3.1 Tag type
The tag type recommended is that used elsewhere in New Zealand, the
Hallprint T-bar anchor tag. For Tag Group 1 lobsters this is the standard T-bar
anchor tag (TBA-1 tag). Although not formally tested for its effect on lobster
survival and growth, this tag is less invasive because of its smaller T-section than
the western rock lobster tag, which itself has been shown in laboratory
experiments to have little effect on growth and survival (McKoy & Esterman
1981). However, the western rock lobster tag is not suitable for lobsters smaller
than 70 mm CL (McKoy & Esterman 1981; NIWA unpubl. results; C. Gardner
pers. comm.), nor probably is the standard T-bar tag. However, the Hallprint
Mini T-bar anchor tag (TBF-1) has been found to perform well with small
lobsters (those down to about 30 mm CL (Gardner et al. 2001)), and this is the
type that should be used for Tag Group 2 lobsters. The standard T-bar tag is
probably suitable for the large (Tag Group 3) lobsters but DOC should be
watchful for signs of the tag filament restricting moulting through being too
short.
It was originally proposed that the tags used within the Reserve be
indistinguishable from those in the surrounding fishery, but NZRLIC says that
this cannot be so (D. Sykes, pers. comm.). It is recommended that DOC use
sequentially numbered T-bar anchor tags with DOC printed on the ‘spaghetti’
portion. Tag colour might or might not be the same as that already used in
CRA3. NIWA maintains the tag number sequence for all MFish-funded lobster
taggings; DOC should consult NIWA to ensure that any tag numbers in CRA3 are
used only once.
2.3.2 Tag source and costs
Tags can be obtained from: Hallprint Pty Ltd, 15 Crozier Rd, Victor Harbour,
South Australia 5211 (phone +61 8 8552 3149; fax +61 8 8552 2874; e-mail
Both types cost $(A)560 per thousand (as of 15 July 2002) and come in a range
of about 10 colours. Allow 8–10 weeks from ordering to delivery. The tagging
12 Booth—Sampling rock lobsters in a marine reserve
gun recommended is the Dennison Model 08958 (Avery-Dennison Group),
which costs about $(NZ)120.
Like the CRA3 tags, it is recommended that there be a 2 cm ‘chew buffer’
beyond the end of the text on the tag (see below) and further, that the tag
number should appear closest to the T-section.
2.3.3 Tagging procedure
There is debate as to the best position for tag insertion—dorsal or ventral.
Almost all tagging in Australia and South Africa is ventral, because there the tag
is better protected and not so subject to preening damage and so remains visible
longer. However, in New Zealand all tagging has been dorsal, so for
consistency, dorsal tagging is also recommended for the Reserve.
Tag Group 1 lobsters will be caught mainly in commercial pots and the lobsters
tagged on the vessel, while lobsters of the other two groups will, at least in the
early years, be mainly captured by divers and tagged underwater. The tagging
method is the same for all groups. Lobsters should be tagged immediately they
are caught. For pot-caught lobsters, keep them out of wind and direct sunlight.
The tag is inserted into the dorsal thoracico-abdominal musculature between
the anterior edge of the first abdominal segment and the posterior edge of the
carapace and to the left or right of the midline. Take care not to insert the T-
section of the tag too deeply, particularly with the small lobsters, because it is
easy to penetrate the body cavity, with unknown and possibly unwelcome
consequences. Release lobsters as quickly and as close as possible to the point
of capture to reduce any displacement effects and to minimise losses due to
handling.
Records taken are the sex, CL, TW, moult stage, stage of sexual maturity
(females), and the GPS location, depth, and date of capture and release.
Damaged lobsters (including those with any missing limbs) should not be
tagged, but if after tagging limb(s) are lost, the limbs missing should be
recorded. CL and TW are measured with vernier calipers to the nearest 0.1 mm,
using modified verniers for TW. CL is the distance from the antennal platform to
the dorsal posterior margin of the carapace along the dorsal mid-line. TW is the
distance between the tips of the pleural spines of the second abdominal
segment. Moult stage is assessed according to Musgrove (2000, fig. 6), and the
second left pleopod is clipped by cleanly removing its distal third with scissors.
Multiple recaptures of the same lobster provide special opportunities to track
growth and movement and pleopods should be reclipped if the lobster has
moulted. The biological records are described in more detail in Breen & Tyson
(1998).
Growth is a composite of moult increment and moult frequency, the latter
being the most difficult to determine. Records of moult stage, information
additional to that obtained in the past CRA3 tagging, will allow the construction
of a schedule of moulting periods by sex and size, particularly for dive-caught
lobsters. The pleopod clip is used to confirm whether or not moulting has
occurred, which is particularly an issue where increments are small (they can
even be negative), such as in mature females and large lobsters.
13DOC Science Internal Series 128
2.3.4 Numbers of lobsters tagged
For growth estimates, the numbers of lobsters to be tagged ultimately depends
on the variability in moult increment and frequency by size class, and the
desired precision for the growth estimates. At this stage it is recommended that
the numbers tagged should be gradually increased until, at the very least, the
numbers of tag recaptures per kilometre of coast for Tag Group 1 lobsters in the
Reserve are similar to that achieved in the CRA3 tagging to date. In the CRA3
taggings in the late 1990s, 6292 lobsters were marked over 40 km of coast of
Statistical area 910, with 252 (about 4%) recaptured (Kendrick & Bentley 2002).
For the 6 km of Reserve coast, for similar rates of tagging and recapture there
would need to be: about 1000 rock lobsters marked, and at least about 40
recaptures.
However, because the opportunity for tag recapture is likely to be much lower
in the Reserve, the numbers tagged will have to be much higher per unit length
of coast in order to provide for at least 40 recaptures from DOC’s potting. It is
recommended that at least four times this number (4000) Tag Group 1
lobsters be tagged in the Reserve during Year 1. This number can be increased
depending on the tag return rate until at least 40 valid recaptures have been
made. (Obviously the figure of 40 valid recaptures is low, and a much higher
number, spread over both sexes and over a wide range of lobster size, would be
desirable.) A valid recapture is one in which the lobster has moulted at least
once or has been at liberty for at least three months. The numbers of Tag Group
1 lobsters tagged from potting can be supplemented during DOC’s annual
(January) dive surveys of lobster abundance and size.
To address the possibility of lobsters moving into the Reserve from outside, it is
recommended that over Year 1 about 800 Tag Group 1 lobsters be tagged
outside (but within about 2 km of) the Reserve’s northeastern boundary.
Lobsters could also be crossing the southwestern and southeastern Reserve
boundaries because they are known to move out on to soft substrates from time
to time to feed (Kelly et al. 1999) and because there may also be patch reefs
present. To address this, a pilot approach is recommended, possibly involving
trawling outside the boundaries; this is discussed below.
For each of Tag Groups 2 and 3 (the small and large lobsters), 600 animals of
each would be an appropriate initial target for Year 1, this being reviewed
according to recapture rates. An aim will be to tag over a wide size range in each
of these groups, down to about 25 mm CL. Small lobsters often occur in pockets
in shallow water, and it is recommended that divers return monthly to these
pockets to tag, recapture, and re-release lobsters.
2.3.5 Tagging logistics
Although the next period of MFish CRA3 taggings is not planned to begin until
April 2004 (D. Sykes, NZRLIC, pers. comm.), DOC should consider beginning to
tag immediately. Taggings, at least of Tag Group 1, should then be repeated in
synchrony with the CRA3 tagging programme, so that these taggings can be
used as direct control data for DOC to investigate such issues as density-
dependence in growth and movements.
14 Booth—Sampling rock lobsters in a marine reserve
Most Tag Group 1 lobsters will comprise lobsters taken in the Reserve and
within at least 2 km of its boundaries in commercial pots of the type used
locally. For the southeastern and southwestern boundaries where the substrate
appears to be mainly soft, potting to establish the presence of any lobsters on
any isolated patch reefs or out feeding on the soft bottom will be too hit and
miss to provide useful information. The following recommended strategy for
the southeastern and southwestern boundaries depends on results from the
imminent sidescan surveys.
1. If the sidescan surveys show the presence of more than just a few small patch
reefs within 2 km of either side of the boundaries, then pot those reefs
seasonally.
2. If there is no reef, or only a few small patch reefs, then seasonally trawl
seaward (out to at least 2 km) of the boundaries.
3. Pot any areas where lobsters are taken in trawls.
For growth, one focused potting event each season during Year 1, aimed at
tagging 1000 lobsters each season, should provide the basis for achieving 40
valid Tag Group 1 recaptures. It is recommended that an experienced local
fisher be contracted to undertake this work, with pot positions being recorded
using GPS. The potting should be carried out at the same positions each season
so as to increase the chance of tag recaptures, as should any repeat potting in
subsequent years. Anniversary recaptures are particularly useful for growth
estimates because growth rate is usually expressed as annual growth, a
composite of moult increment and moult frequency. Further, tagging sites
should include the general areas where DOC’s January dive surveys take place
in order to recapture and re-release as many tagged lobsters as possible. Records
of total pot contents will provide size–frequency distribution (SFD) information
directly comparable to that from the commercial fishery in terms of catch rates
and size of lobsters.
Diving will be required in order to obtain small lobsters, and more large
individuals (Tag Groups 2 and 3). Although a single tagging event would be
suitable for the large lobsters, if enough can be found, it is recommended that
the numbers of small lobsters tagged be built up slowly over time. This will
increase the opportunity for resightings of tagged animals of both groups and
will also allow better coverage of growth of the frequently moulting small
lobsters.
Tagging repeated every few years will give insight into the effect of lobster
density on growth rates where there is concomitant lobster density information
within the Reserve and control growth data from outside it. It is therefore
recommended that tagging in the Reserve be repeated whenever there is further
CRA3 tagging outside the Reserve.
Movements include those within the Reserve and those into and out of it.
Within the Reserve, the seasonal potting and diving described above will give at
least gross patterns of movement; these can be better defined through use of
more detailed constant-tracking techniques later, if required. For the Reserve
boundaries, seasonal tagging in the Reserve and within at least 2 km outside it
will indicate whether any crossings are occurring and allow a more detailed
research plan to be developed that, if necessary, estimates more precisely
15DOC Science Internal Series 128
proportions or absolute numbers crossing. Again, cross-boundary movements
can be better defined through more detailed constant-tracking.
Other fishery data. In all potting, total catch SFDs by pot should be routinely
recorded so that changes in SFDs and CPUE within the Reserve can be
compared with these outside the Reserve collected in the MFish-funded CRA3
research.
2.3.6 Data entry
All hardcopies of tagging data should be error-checked and then entered onto a
database that is consistent with the MFish tag database. If DOC wished, NIWA
in consultation with MFish and DOC could provide a high standard of
management of all tag data collected in this project.
2.3.7 Follow-up
For commercial, recreational, and customary fisher tag returns, DOC should use
the systems presently in place for the other CRA3 taggings:
• Articles in Seafood New Zealand and the local newspaper describing the tag
and the tagging programme;
• Alerting Licensed Fish Receivers of the likelihood of tagged lobsters turning
up and what to do with them;
• Notices at dive-filling stations advising recreational fishers what to do with
tagged lobsters.
For all recaptures, the required information is the tag number, CL, and TW, and
the date, location (GPS if possible), capture method, and depth of the
recapture. Many fishers will return tagged lobsters to the sea, particularly when
the lobsters are undersized; many of the commercial fishers have field kits for
lobster measurement and recording. Where the lobster is landed, the fisher/
Licensed Fish Receiver should be asked to measure it and record its recapture
details. As is the case for the 1990s CRA3 taggings, no reward or payment for
tagged lobsters should be necessary.
Tagged lobsters should be constantly watched for during DOC’s diving in and
near the Reserve. Over time it is possible that the home range of certain of these
tagged lobsters, particularly the large ones, will become clear, making
relocation for re-measurement more straightforward.
2 . 4 E S T I M A T E S O F R E S O U R C E S R E Q U I R E D A N DA S S O C I A T E D C O S T S
Resources required for the taggings are divided into the following categories, an
estimate of costs within each also being given. (Note that depending on who
provides the service, the cost may differ markedly from that estimated below.)
Pot vessel-day (commercial charter rate about $100 per hour)
Dive vessel-day (charter rate about $60 per hour)
Trawler-day (commercial charter rate about $120 per hour)
16 Booth—Sampling rock lobsters in a marine reserve
Pot-night (commercial rate about $5)
Tag-person-day (about $80 per hour)
Diver-day (about $80 per hour)
2 . 5 R E C O M M E N D E D T A G G I N G S C H E D U L E A N D
A S S O C I A T E D C O S T S
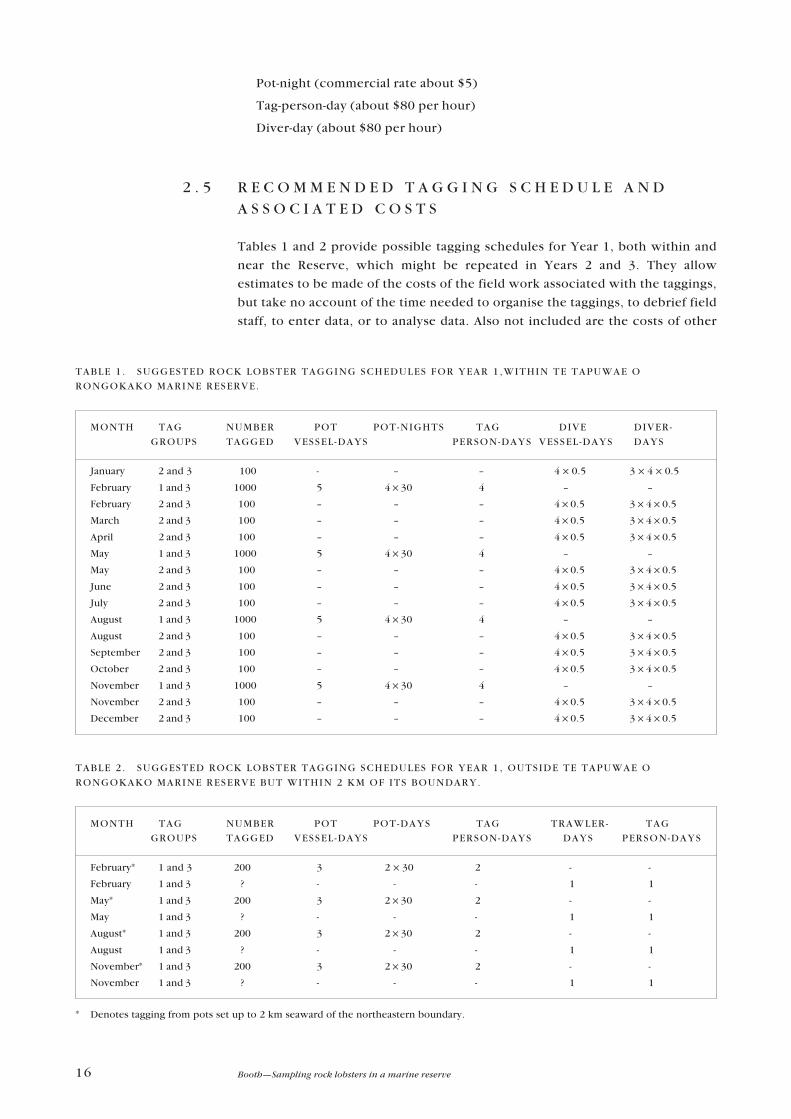
Tables 1 and 2 provide possible tagging schedules for Year 1, both within and
near the Reserve, which might be repeated in Years 2 and 3. They allow
estimates to be made of the costs of the field work associated with the taggings,
but take no account of the time needed to organise the taggings, to debrief field
staff, to enter data, or to analyse data. Also not included are the costs of other
TABLE 1 . SUGGESTED ROCK LOBSTER TAGGING SCHEDULES FOR YEAR 1 ,WITHIN TE TAPUWAE O
RONGOKAKO MARINE RESERVE.
MONTH TAG NUMBER POT POT-NIGHTS TAG DIVE DIVER-
GROUPS TAGGED VESSEL -DAYS PERSON-DAYS VESSEL -DAYS DAYS
January 2 and 3 100 - – – 4 ✕ 0.5 3 ✕ 4 ✕ 0.5
February 1 and 3 1000 5 4 ✕ 30 4 – –
February 2 and 3 100 – – – 4 ✕ 0.5 3 ✕ 4 ✕ 0.5
March 2 and 3 100 – – – 4 ✕ 0.5 3 ✕ 4 ✕ 0.5
April 2 and 3 100 – – – 4 ✕ 0.5 3 ✕ 4 ✕ 0.5
May 1 and 3 1000 5 4 ✕ 30 4 – –
May 2 and 3 100 – – – 4 ✕ 0.5 3 ✕ 4 ✕ 0.5
June 2 and 3 100 – – – 4 ✕ 0.5 3 ✕ 4 ✕ 0.5
July 2 and 3 100 – – – 4 ✕ 0.5 3 ✕ 4 ✕ 0.5
August 1 and 3 1000 5 4 ✕ 30 4 – –
August 2 and 3 100 – – – 4 ✕ 0.5 3 ✕ 4 ✕ 0.5
September 2 and 3 100 – – – 4 ✕ 0.5 3 ✕ 4 ✕ 0.5
October 2 and 3 100 – – – 4 ✕ 0.5 3 ✕ 4 ✕ 0.5
November 1 and 3 1000 5 4 ✕ 30 4 – –
November 2 and 3 100 – – – 4 ✕ 0.5 3 ✕ 4 ✕ 0.5
December 2 and 3 100 – – – 4 ✕ 0.5 3 ✕ 4 ✕ 0.5
TABLE 2 . SUGGESTED ROCK LOBSTER TAGGING SCHEDULES FOR YEAR 1 , OUTSIDE TE TAPUWAE O
RONGOKAKO MARINE RESERVE BUT WITHIN 2 KM OF ITS BOUNDARY.
MONTH TAG NUMBER POT POT-DAYS TAG TRAWLER- TAG
GROUPS TAGGED VESSEL -DAYS PERSON-DAYS DAYS PERSON-DAYS
February* 1 and 3 200 3 2 ✕ 30 2 - -
February 1 and 3 ? - - - 1 1
May* 1 and 3 200 3 2 ✕ 30 2 - -
May 1 and 3 ? - - - 1 1
August* 1 and 3 200 3 2 ✕ 30 2 - -
August 1 and 3 ? - - - 1 1
November* 1 and 3 200 3 2 ✕ 30 2 - -
November 1 and 3 ? - - - 1 1
* Denotes tagging from pots set up to 2 km seaward of the northeastern boundary.
17DOC Science Internal Series 128
necessities, such as measuring and recording gear, dive equipment, seagoing
gear, etc., nor allowances such as overtime or accommodation.
Tagging in Years 2 and 3 would take a similar form but the numbers to be tagged
would depend on the number of tag recaptures from Year 1.
2 . 6 S U M M A R Y O F T H E I N F O R M A T I O N E X P E C T E DF R O M T H I S P R O J E C T
The above approach should lead to the following information valuable to the
CRA3 stock assessment:
For growth:
• moult increments and annual growth for small, mid-size, and large rock
lobsters;
• moult frequencies for small, mid-size, and large rock lobsters;
• moulting calendar by size group;
• effects of density on growth, if there is repeated tagging.
For movements, preliminary information on the following, which will need to
be determined before a more detailed research design can be formulated:
• seasonal patterns within the Reserve
• cross-boundary movements
• long-distance alongshore movements
Fishery data concerning:
• Pot SFDs and CPUE from an unfished population
3. Recruitment issues
Objective: To correlate the abundance over time of pre-recruit lobster cohorts
to previous settlement levels in fished and unfished areas.
3 . 1 B A C K G R O U N D
The Gisborne rock lobster fishery is unique in that it is mainly for males and for
a significant portion of the year is based on new male recruits about four years
of age. This young age at recruitment (and with less variability in age) provides
an opportunity not available elsewhere in the North Island to test in detail the
effectiveness of puerulus settlement levels in forecasting recruitment to the
fishery by following cohorts trapped in fine-meshed pots. The design of this
research will match a similar project proposed by NIWA for outside the Reserve
and will address relationships between settlement levels and the subsequent
abundance of juveniles, pre-recruits, and recruits.
18 Booth—Sampling rock lobsters in a marine reserve
Puerulus settlement levels are estimated at two localities near the Reserve, at
Whangara just to the north and at Tatapouri just to the south. These are
reported each year (e.g. Booth et al. 2002), and often high levels of variability in
settlement are evident between years. High settlement years tend to be
associated with El Niño conditions, the last of which was in 1998. However,
another, forecast for 2002/03, would provide an opportunity to follow a strong
cohort through to the fishery.
In the Gisborne area, the main settlement period is winter, with juveniles
reaching 38 mm CL (about 22 mm TW) at the end of the first year, 58 mm CL
(about 34 mm TW) at the end of the second year, and 68 mm CL (about 42 mm
TW) at the end of the third. Standard commercial pots can provide an estimate
of abundance of pre-recruit lobsters, but potting along the Kaiti shore in the
early 1980s showed that fine-meshed kitchen parlour (K/P) pots caught and
retained greater proportions of the smaller animals. NIWA expects to be using
such pots in November off Tatapouri as an adjunct to the industry-based catch-
sampling programme. It is proposed that at the same time up to 10 pots of the
same style also be set within the Reserve. This will provide juvenile and pre-
recruit abundance indices from both unfished and fished populations to
correlate with settlement indices.
3 . 2 A P P R O A C H
The pots will be fine-meshed K/P pots, fished in the Reserve during the course
of the November NIWA/industry pot sampling and in the general area where
DOC’s January dive surveys take place. A commercial fisher will be contracted
to do the potting. The lobsters will be tagged so as to add to the numbers of tags
in the Reserve.
The first year will be a pilot project both within the Reserve and at Tatapouri, to
determine the levels of catches and to establish overall protocols. Nevertheless,
the general approach taken will reflect that used for the catch sampling but will
differ in the following:
• K/P pots will be used, rather than HRC (Hurricane reinforcing concrete mesh)
pots;
• potting will be more intensive and over smaller areas (about 1 km2 in both
areas);
• potting will be stratified, from the shallows out to the reef edge (about 40 m
depth);
• the same positions will be potted each year;
• bait will be standardised (probably frozen kahawai);
• if possible, fishing will be during the new moon.
Further details are yet to be established with the commercial fisher. Procedures
will be standardised between years.
This sampling would be additional to that already being undertaken by NIWA
and the cost to DOC in the first year would be two pot-vessel days,
approximately $1,500 + GST. This Reserve sampling will duplicate that at
19DOC Science Internal Series 128
Tatapouri. NIWA will supply the pots and bait, and NIWA staff will be aboard
the vessel for the potting and tagging.
Sampling beyond this first year is expected to be similar in approach, so the cost
will probably remain much the same. It is expected that over time it will be
possible to develop an index of the relative abundance by sex and size (age)
group of lobsters that can be directly correlated with the index of settlement
and a CPUE index from the commercial fishery. Identical sampling in both
fished and non-fished areas will show how lobster density affects cohort
abundance.
4. Pot CPUE as an index ofabundance
Objective: To determine the area of attraction and effective fishing area of a
standard commercial HRC lobster pot.
4 . 1 B A C K G R O U N D
The New Zealand commercial rock lobster fishery is managed mainly on the
basis of changes in pot CPUE (i.e. catch per pot lift) being a good proxy for
changes in abundance of recruited lobsters. The Reserve, in which dive surveys
of lobster abundance are regularly undertaken and where there is no other
fishing, is a suitable place to test hypotheses concerning the relationship
between pot CPUE and actual abundance. This would make an important
contribution to the rock lobster stock assessment capability in New Zealand. At
the same time there is the opportunity to investigate pot selectivity issues with
respect to lobster size and sex, but this is not addressed in this document.
Two key pieces of information are required in order to quantify the relationship
between CPUE and absolute abundance: the fishing radius of a pot and the
actual abundance of lobsters on the seafloor. Actual lobster abundance can be
determined through dive surveys. This section describes a method that could be
used to determine the effective fishing area of a pot under certain conditions.
There is a fairly extensive literature on this topic but it is beyond the scope of
this document to summarise it all. Instead, the approach recommended here is
based on a successful experimental procedure reported in the literature.
Catch per unit effort (c/f) is related to stock size (N) as
c/f = qN
where q is the catchability coefficient, defined as the fraction of the stock
captured by a unit of fishing effort. If stock density (D) is substituted for stock
size, and c/f is catch per potlift, the catchability coefficient becomes
q = (c/f)/D
20 Booth—Sampling rock lobsters in a marine reserve
with units expressed in area per pot haul (Miller 1990). In this application, q
has also been termed the effective fishing area. If q can be estimated with
enough accuracy and precision, it can be very useful for converting catch per
trap to stock density (Miller 1990). However, q is smaller than the actual area
from which the target animals are attracted to a trap. For these areas to be the
same, 100% of the target lobsters must be captured from inside and none from
outside the area. Almost certainly, a decreasing fraction would be captured at
increasing distance, and over time as numbers decline.
McQuinn et al. (1988) examined the size and shape of the area of attraction and
effective fishing area of a whelk trap under different physical and biotic
conditions, and then attempted to validate the whelk density estimates as
determined from the effective area. The effects of a number of variables (such as
season, bait, depth, substratum and current) on the size and shape of the area of
attraction and effective fishing area were determined. The study showed that
the effective area cannot be estimated as a single, gear-specific value. Effective
area estimates must therefore be determined on a site- and season-specific basis
if conditions affecting the catchability of whelks vary during the fishing season
and/or over the fishing area.
The approach recommended here for determining the area of attraction and
effective fishing area of a standard CRA3 HRC lobster pot set in the area of the
Reserve is based on that of McQuinn et al. (1988), but with a greater level of
replication (three similar sites, not just one). The variable for which the effect is
to be determined is season; later, if the approach is found to be useful, other
variables such as pot type, bait, depth, and bottom type might be examined.
The approach is summarised below; more detail is contained in McQuinn et al.
(1988).
4 . 2 M E T H O D S A N D L O G I S T I C S
The pot type to be used is the one most widely fished in CRA3, the HRC pot, and
the bait standardised to that most widely used in CRA3. The vessel need not be
large as only a few pots are being handled at any one time.
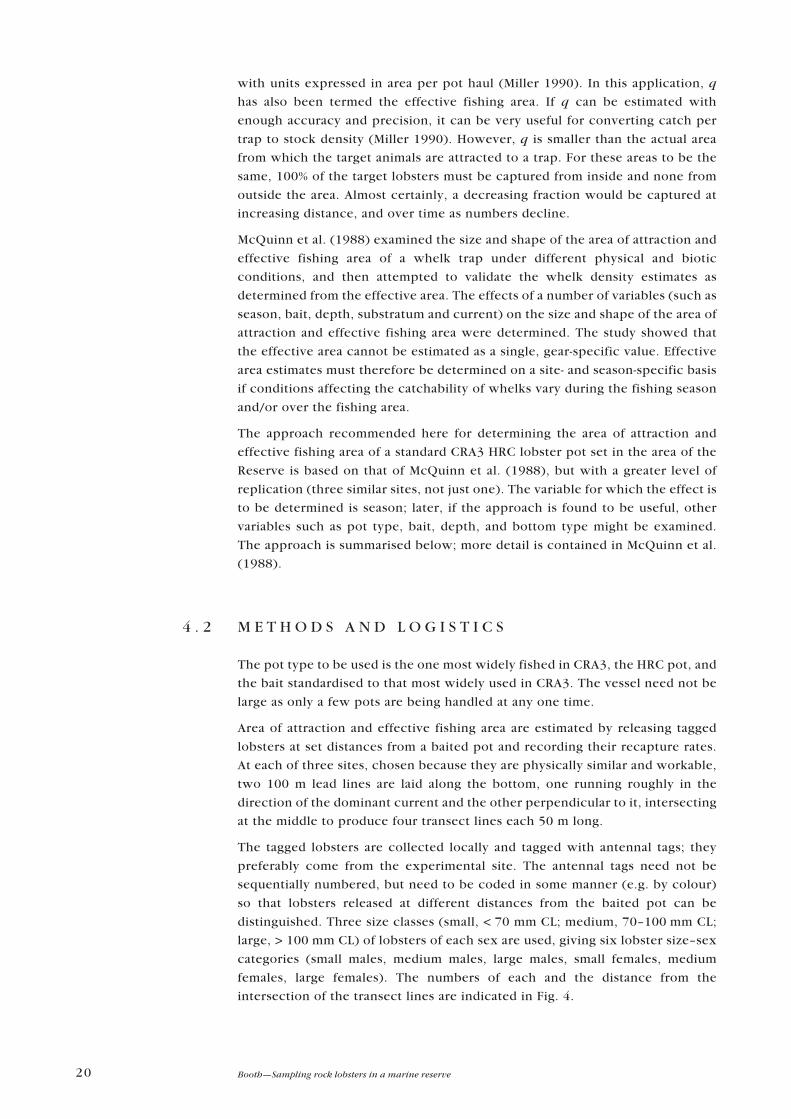
Area of attraction and effective fishing area are estimated by releasing tagged
lobsters at set distances from a baited pot and recording their recapture rates.
At each of three sites, chosen because they are physically similar and workable,
two 100 m lead lines are laid along the bottom, one running roughly in the
direction of the dominant current and the other perpendicular to it, intersecting
at the middle to produce four transect lines each 50 m long.
The tagged lobsters are collected locally and tagged with antennal tags; they
preferably come from the experimental site. The antennal tags need not be
sequentially numbered, but need to be coded in some manner (e.g. by colour)
so that lobsters released at different distances from the baited pot can be
distinguished. Three size classes (small, < 70 mm CL; medium, 70–100 mm CL;
large, > 100 mm CL) of lobsters of each sex are used, giving six lobster size–sex
categories (small males, medium males, large males, small females, medium
females, large females). The numbers of each and the distance from the
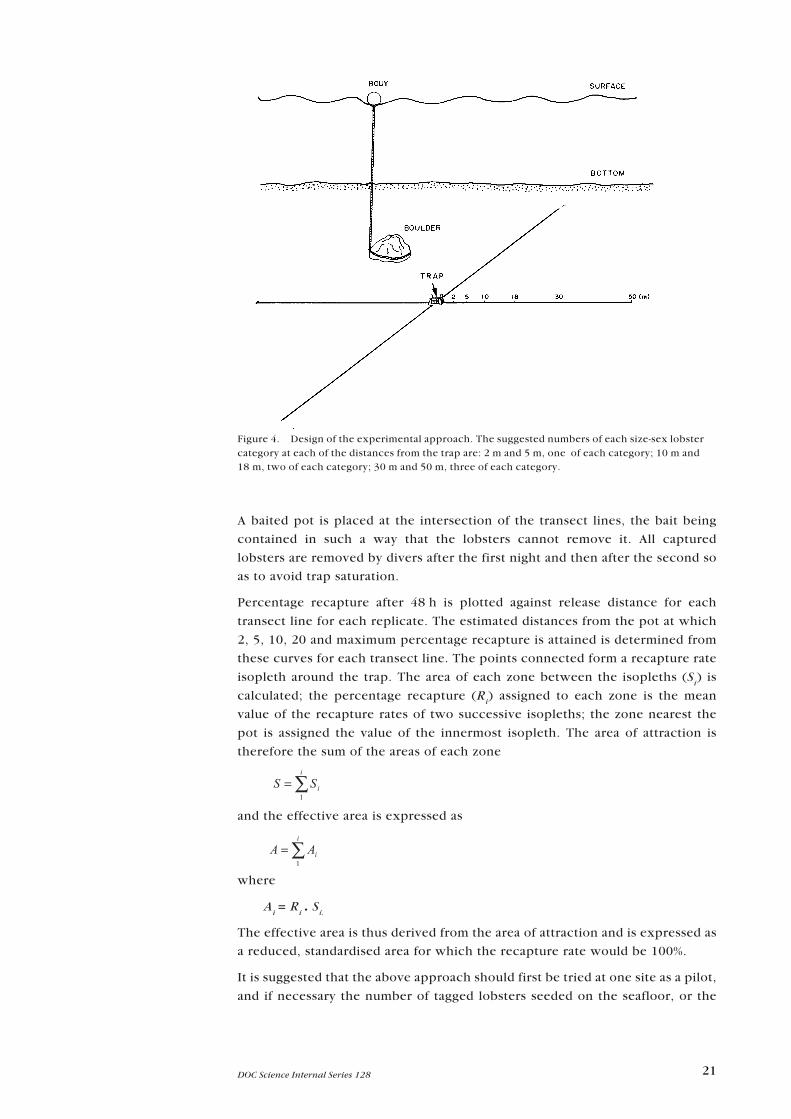
intersection of the transect lines are indicated in Fig. 4.
21DOC Science Internal Series 128
A baited pot is placed at the intersection of the transect lines, the bait being
contained in such a way that the lobsters cannot remove it. All captured
lobsters are removed by divers after the first night and then after the second so
as to avoid trap saturation.
Percentage recapture after 48 h is plotted against release distance for each
transect line for each replicate. The estimated distances from the pot at which
2, 5, 10, 20 and maximum percentage recapture is attained is determined from
these curves for each transect line. The points connected form a recapture rate
isopleth around the trap. The area of each zone between the isopleths (Si) is
calculated; the percentage recapture (Ri) assigned to each zone is the mean
value of the recapture rates of two successive isopleths; the zone nearest the
pot is assigned the value of the innermost isopleth. The area of attraction is
therefore the sum of the areas of each zone
and the effective area is expressed as
where
Ai = R
i . S
i.
The effective area is thus derived from the area of attraction and is expressed as
a reduced, standardised area for which the recapture rate would be 100%.
It is suggested that the above approach should first be tried at one site as a pilot,
and if necessary the number of tagged lobsters seeded on the seafloor, or the
Figure 4. Design of the experimental approach. The suggested numbers of each size-sex lobstercategory at each of the distances from the trap are: 2 m and 5 m, one of each category; 10 m and18 m, two of each category; 30 m and 50 m, three of each category.
∑=i
iAA1
∑=i
iSS1
22 Booth—Sampling rock lobsters in a marine reserve
distances from the pot, adjusted in order to avoid such problems as trap
saturation. The area of attraction of the pot, and the effective fishing area of the
pot, is then determined for three physically similar locations in the reserve and
the experiment repeated seasonally at the same site.
Depending on how successful this initial investigation is, the study could be
enlarged in line with the approach taken by McQuinn et al. (1988) to include:
• Define the shape of the areas of attraction and effective areas under different
current conditions.
• Determine the effects of such variables as bait, depth, and substratum.
• Compare estimates of lobster density based on effective area v. absolute
densities from diving.
4 . 3 E S T I M A T E S O F R E S O U R C E S R E Q U I R E D A N DA S S O C I A T E D C O S T S F O R I N I T I A LI N V E S T I G A T I O N
Estimates of resources required and associated costs for the initial investigation
(Table 3) are based on the same vessel, pot, and diver hire rates as indicated in
above, and for three locations.
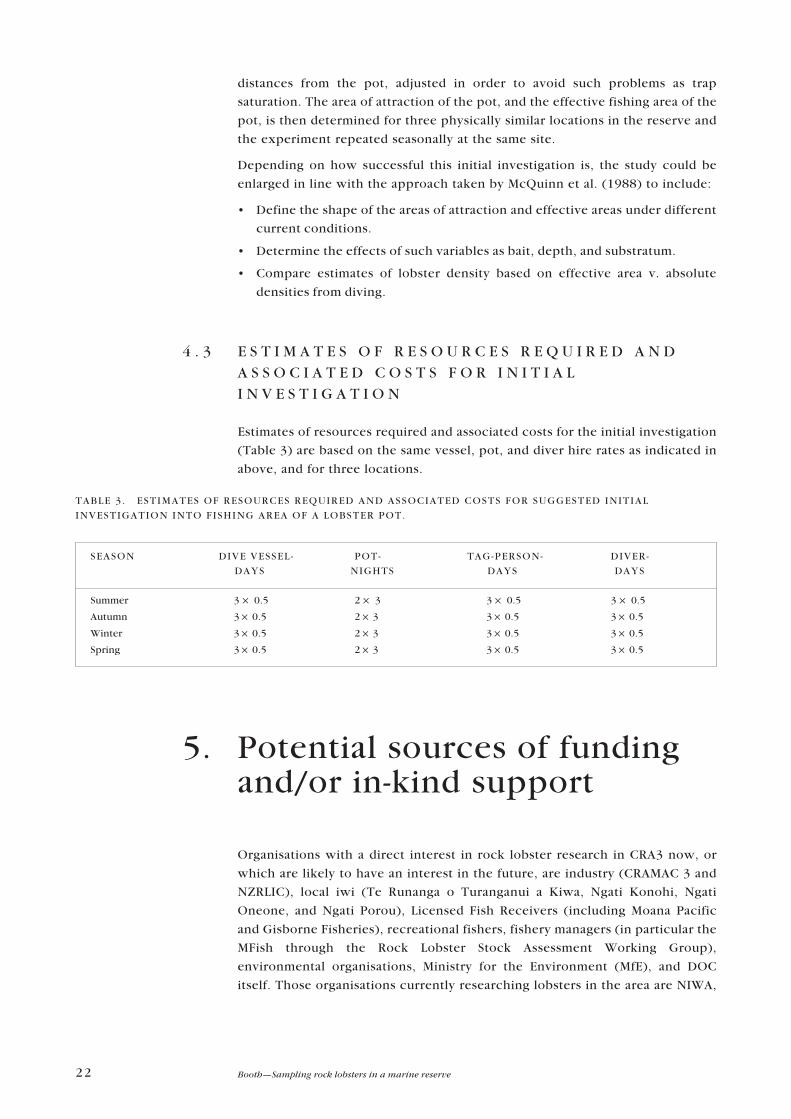
TABLE 3 . ESTIMATES OF RESOURCES REQUIRED AND ASSOCIATED COSTS FOR SUGGESTED INITIAL
INVESTIGATION INTO FISHING AREA OF A LOBSTER POT.
SEASON DIVE VESSEL - POT- TAG-PERSON- DIVER-
DAYS NIGHTS DAYS DAYS
Summer 3 ✕ 0.5 2 ✕ 3 3 ✕ 0.5 3 ✕ 0.5
Autumn 3 ✕ 0.5 2 ✕ 3 3 ✕ 0.5 3 ✕ 0.5
Winter 3 ✕ 0.5 2 ✕ 3 3 ✕ 0.5 3 ✕ 0.5
Spring 3 ✕ 0.5 2 ✕ 3 3 ✕ 0.5 3 ✕ 0.5
5. Potential sources of fundingand/or in-kind support
Organisations with a direct interest in rock lobster research in CRA3 now, or
which are likely to have an interest in the future, are industry (CRAMAC 3 and
NZRLIC), local iwi (Te Runanga o Turanganui a Kiwa, Ngati Konohi, Ngati
Oneone, and Ngati Porou), Licensed Fish Receivers (including Moana Pacific
and Gisborne Fisheries), recreational fishers, fishery managers (in particular the
MFish through the Rock Lobster Stock Assessment Working Group),
environmental organisations, Ministry for the Environment (MfE), and DOC
itself. Those organisations currently researching lobsters in the area are NIWA,
23DOC Science Internal Series 128
NZRLIC, and DOC. Support might be through direct funding or in-kind
cooperation. So as to be able to pinpoint any likely synergies with existing
projects, the current rock lobster research, and that expected to take place in
the near future, is listed below.
5 . 1 C U R R E N T / I M M I N E N T R O C K L O B S T E RR E S E A R C H I N C R A 3
Research being carried out by NIWA in CRA3 includes
• A MFish project that estimates levels of puerulus settlement within Port
Gisborne and at Kaiti, Tatapouri, and Whangara.
• A MFish-NZRLIC project that samples the size and sex of rock lobsters taken on
commercial vessels.
• A MFish-NZRLIC project that handles the returns, and information concerning
returns, of recaptured tagged rock lobsters from all taggings.
• A FRST project that investigates any survival bottlenecks at and soon after
settlement, at Omanuka Bay, north of Anaura Bay. A similar project is being
established inside Tuamotu Island in Poverty Bay.
• A FRST project that investigates the fate and behaviour of seeded lobsters,
inside Tuamotu Island.
DOC research in CRA3 includes a programme that estimates the changes in
lobster size and lobster abundance in the Reserve and at nearby control sites
(including Turihaua, Whangara, and Makorori).
5 . 2 P O S S I B L E S Y N E R G I E S / S U P P O R T
NZRLIC has made it clear that any DOC tagging for growth and movement
within or near the Reserve cannot take place as part of NZRLIC-NIWA research
contracted to MFish. This does not, however, mean that DOC cannot separately
and individually contract local fishers during the off season to pot in and near
the Reserve. At least two local fishers are, apparently, prepared to contract this
work.
NIWA is not able to fund any projects for the Reserve directly but is able to
provide advice and discussion as projects advance.
Te Runanga o Turanganui a Kiwa, Ngati Oneone and Ngati Porou were not
approached, as the Reserve is not within their rohe; Ngati Konohi is already
involved, as co-managers of the Reserve.
There are three major quota holders and Licensed Fish Receivers: Moana Pacific
Fisheries Ltd, Gisborne Fisheries Ltd, and No 1 Live Lobster Co. (The smaller
players, not contacted but possibly still of interest, are South Pacific Fisheries
and Port Nicholson Fisheries.) To quote directly, ‘Gisborne Fisheries Ltd feel
any cray research carried out in the marine reserve does not have any
application in managing rock lobster fisheries and therefore would not support
it’. Moana Pacific Fisheries Ltd and No 1 Live Lobster Co. are also unable to
assist.

24 Booth—Sampling rock lobsters in a marine reserve
For the recreational fishers, discussion with Roger Faber, Club Captain for the
Tatapouri Sports Club indicated that, although financial support was very
unlikely, dive support from suitably qualified divers might be possible for
particular projects. The club holds regular meetings and issues a newsletter
every 2–3 months. Roger suggested that the way forward would be for DOC to
attend one of their meetings and themselves ask for assistance or else place a
notice on their notice board.
MFish is a potential funder or collaborator, from both the rock lobster stock
management and the biodiversity perspectives. MFish suggested that DOC
submit one or more projects from the above to them for consideration for
funding.
MfE has a particular interest in the role of no-take or limited-take areas in
management of commercial fisheries and would consider approaches from DOC
for collaboration. Forest and Bird Protection Society does not have funding
available to support such work as that planned.
6. Acknowledgements
This work was commissioned by the East Coast Hawke’s Bay Conservancy of
DOC and funded from the Unprogrammed Science Advice fund. The paper
benefited from useful discussions and review by Dave Fisher, Megan Oliver,
Don Robertson, and Brian Sanders of NIWA, Greta Point, Wellington.
25DOC Science Internal Series 128
7. References
Annala, J.H. 1981: Movements of rock lobsters (Jasus edwardsii) tagged near Gisborne, New
Zealand. New Zealand Journal of Marine and Freshwater Research 15: 437–443.
Annala, J.H.; Bycroft, B.L. 1984: Exploratory fishing for rock lobsters in offshore areas near Gisborne.
Fisheries Research Division occasional publication 45.
Annala, J.H.; McKoy, J.L.; Booth, J.D.; Pike, R.B. 1980: Size at the onset of sexual maturity in female
Jasus edwardsii (Decapoda: Palinuridae) in New Zealand. New Zealand Journal of Marine
and FreshwaterResearch 14: 217–227.
Booth, J.D. 1997: Long-distance movements in Jasus spp. and their role in larval recruitment.
Bulletin of Marine Science 61: 111–128.
Breen, P.A.; Tyson, P.J. 1998: NIWA rock lobster catch sampling programme data collection manual.
Unpublished, available from NIWA.
Booth, J.D.; Forman, J.S.; Stotter, D.R.; Bradford, E. 2002: Settlement indices for 2000 for the red rock
lobster, Jasus edwardsii. New Zealand Fisheries Assessment Report 2002/12.
Gardner, C.; Mills, D.; Ibbott, S.; Wilcox, S.; Crear, B. 2001: Preliminary investigation towards
ongrowing puerulus to enhance rock lobster stocks while providing animals for commercial
culture. FRDC Final Report, FRDC Project 1999/314.
Kelly, S.; MacDiarmid, A.B.; Babcock, R.C. 1999: Characteristics of spiny lobster, Jasus edwardsii,
aggregations in exposed reef and sandy areas. Marine and Freshwater Research 50:
409–416.
Kendrick, T.H.; Bentley, N. 2002: Movements of rock lobsters (Jasus edwardsii) tagged by
commercial fishers around the coast of new Zealand from 1993. New Zealand Fisheries
Assessment Report in press.
MacDiarmid, A.B. 1991: Seasonal changes in depth distribution, sex ratio and size frequency of spiny
lobster Jasus edwardsii on a coastal reef in northern New Zealand. Marine Ecology Progress
Series 70: 120–141.
McGarvey, R.; Ferguson, G.J.; Prescott, J.A. 1999: Spatial variation in mean growth rates at size of
southern rock lobster, Jasus edwardsii, in South Australian waters. Marine and Freshwater
Research 50: 333–342.
McKoy, J.L.; Esterman, D.B. 1982: Growth of rock lobsters (Jasus edwardsii) in the Gisborne region,
New Zealand. New Zealand Journal of Marine and Freshwater Research 15: 121–136.
McQuinn, I.H.; Gendron, L.; Himmelman, J.H. 1988: Area of attraction and effective area fished by a
whelk (Buccinum undatum) trap under variable conditions. Canadian Journal of
Fisheries and Aquatic Sciences 45: 2045–2060.
Miller, R.J. 1990: Effectiveness of crab and lobster traps. Canadian Journal of Fisheries and Aquatic
Sciences 47: 1228–1251.
Musgrove, R.J.B. 2000: Molt staging in the southern rock lobster Jasus edwardsii. Journal of
Crustacean Biology 20: 44–53.
Sorensen, J.H. 1969: The New Zealand rock lobster or marine spiny crayfish Jasus edwardsii
(Hutton). Development, growth, embryology and development. Fisheries Technical Report 29.
Street, R.J. 1969: The New Zealand crayfish Jasus edwardsii (Hutton 1875). New Zealand Marine
Department Fisheries Technical Report 30. 53 p.