Embed Size (px)
Citation preview
rese
arch
repo
rt
Flexural Behavior and Strength of Cold-Formed Steel L-Headers
R E S E A R C H R E P O R T R P 0 8 - 3 2 0 0 8
American Iron and Steel Institute
Flexural Behavior and Strength of Cold-Formed Steel L-Headers i
DISCLAIMER
The material contained herein has been developed by researchers based on their research findings and is for general information only. The information in it should not be used without first securing competent advice with respect to its suitability for any given application. The publication of the information is not intended as a representation or warranty on the part of the American Iron and Steel Institute, Steel Framing Alliance, or of any other person named herein, that the information is suitable for any general or particular use or of freedom from infringement of any patent or patents. Anyone making use of the information assumes all liability arising from such use.
Copyright 2008 American Iron and Steel Institute / Steel Framing Alliance
ii Flexural Behavior and Strength of Cold-Formed Steel L-Headers
PREFACE
The North American Standard for Cold-Formed Steel Framing - Header Design, AISI S212-07, provides design expressions for cold-formed steel L-headers. However, methods to evaluate deflection of single or double L-headers and uplift flexural strength of single L-headers are currently not addressed. Presented in this report are the findings from an extensive testing program conducted at the University of Waterloo of full-scale single and double cold-formed steel L-headers. Also presented are improved ultimate flexural strength design expressions and new vertical deflection expressions for single and double L-header assemblies.
It is anticipated that the AISI Committee on Framing Standards will consider the results of this study in the development of future standards and the Cold-Formed Steel Engineers Institute in the development of design aids. The American Iron and Steel Institute and Steel Framing Alliance wish to express their appreciation to the researchers and project sponsors for this report.
Flexural Behavior and Strength
of Cold-formed Steel
L-Headers
Prepared by Jesse Pauls, BASc. (MASc. Candidate - University of Waterloo)
In conjuction with
Lei Xu, Ph.D., P.Eng. (Associate Professor, University of Waterloo) and Steven Fox, Ph.D., P.Eng. (General Manager, CSSBI)
Prepared for Canadian Sheet Steel Building Institute (CSSBI)
Waterloo, Ontario, Canada, 2008
ii
Abstract
Cold-formed steel framing of residential and light commercial buildings continues to grow in
popularity due to its structural and material advantages. The North American steel industry is
actively performing research studies and developing design standards to assist in the cost-
effectiveness of cold-formed steel in these markets. Cold-formed steel L-headers are structural
components used over wall openings to transfer the loads to adjacent king studs. Recently, there has
been an increased interest in L-headers among homebuilders primarily due to their ease of
installation and low material cost. Design of the L-headers in North America is currently governed
by the North American Standard for Cold Formed Steel Framing – Header Design (AISI, 2007) in
combination with the North American Specification for Design of Cold Formed Steel Structural
Members (CSA, 2007). However, the design provisions in the AISI - Header Design Standard
(AISI, 2007) are particularly limiting. For instance, the method for evaluation of span deflections for
both single and double L-headers, and uplift flexural strength for single L-headers is currently not
available primarily due to lack of research on the issues.
Presented in this thesis are the findings from an extensive laboratory testing program of full-scale
single and double cold-formed steel L-headers. The objective of the research was to investigate the
structural behavior of L-headers under both gravity and uplift loads. From the analysis, improved
ultimate flexural strength design expressions and new vertical deflection expressions for single and
double L-header assemblies were developed.
iii
Table of Contents Abstract ........................................................................................................................................... ii
Table of Contents ........................................................................................................................... iii
List of Figures ................................................................................................................................. v
List of Tables ................................................................................................................................ vii
List of Notations .......................................................................................................................... viii
Chapter 1 Experimental Setup ........................................................................................................ 1
1.1 General .................................................................................................................................. 1
1.2 Test Specimen ....................................................................................................................... 1
1.2.1 Material Properties ......................................................................................................... 1
1.2.2 Section Properties ........................................................................................................... 2
1.2.3 Test Specimen Assemblies ............................................................................................. 4
1.3 Short Span Test Setup ........................................................................................................... 6
1.3.1 Gravity Tests .................................................................................................................. 6
1.3.2 Uplift Tests ..................................................................................................................... 8
1.4 Long Span Test setup ............................................................................................................ 9
1.4.1 Gravity Tests ................................................................................................................ 10
1.4.2 Uplift Tests ................................................................................................................... 11
1.4.3 Differences in Test Setup Compared to NAHB Research ........................................... 11
Chapter 2 Results / Data analysis – Gravity Loads ...................................................................... 13
2.1 General ................................................................................................................................ 13
2.2 Observed Failure Behavior ................................................................................................. 13
2.3 Flexural Strength – Ultimate Limit State ............................................................................ 15
2.3.1 Double L-headers ......................................................................................................... 17
2.3.2 Single L-headers ........................................................................................................... 20
2.3.3 Single L-headers vs. Double L-headers ....................................................................... 22
2.3.4 Comparison to Previous NAHB L-header Tests .......................................................... 22
2.4 Proposed Flexural Strength Design Equations ................................................................... 24
2.4.1 Comparison between Current and Proposed Flexural Strength Equations .................. 28
2.5 Deflection – Serviceability Limit State ............................................................................... 29
2.5.1 Short Span L-headers ................................................................................................... 29
iv
2.5.2 Long Span L-headers ................................................................................................... 34
2.6 Proposed Deflection Prediction Equation ........................................................................... 40
2.7 Effect of Gypsum Board on L-headers ............................................................................... 43
Chapter 3 Results / Data Analysis – Uplift Loads ........................................................................ 46
3.1 General ................................................................................................................................ 46
3.2 Observed Failure Behavior ................................................................................................. 46
3.3 Flexural Strength – Ultimate Limit State ............................................................................ 50
3.3.1 Double L-headers ......................................................................................................... 51
3.3.2 Single L-headers ........................................................................................................... 53
3.3.3 Single L-headers vs. Double L-headers ....................................................................... 54
3.4 Shear Influence on Strength ................................................................................................ 54
3.5 Proposed Flexural Strength Design Equation ..................................................................... 56
3.6 Deflection – Serviceability Limit State ............................................................................... 59
3.7 Proposed Deflection Prediction Equations ......................................................................... 63
3.8 Effect of Gypsum Board on L-headers ............................................................................... 67
Chapter 4 Conclusions .................................................................................................................. 69
4.1 Recommendations for Future Research .............................................................................. 71
Bibliography ................................................................................................................................. 72
Appendix A Assembly Properties ................................................................................................ 74
Appendix B Test Data .................................................................................................................. 82
v
List of Figures Figure 1.1 Double L-Header ............................................................................................... 4
Figure 1.2 Single L-Header ................................................................................................. 5
Figure 1.3 Gravity Load Case – Schematic 3ft and 4ft Test Setup ..................................... 7
Figure 1.4 Gravity Load Case – Schematic 6ft Test Setup ................................................. 7
Figure 1.5 Uplift Load Case – Schematic 3ft and 4ft Test Setup........................................ 8
Figure 1.6 Uplift Load Case – Schematic 6ft Test Setup .................................................... 9
Figure 1.7 Long Span Load Cell Attachments .................................................................. 10
Figure 1.8 Gravity Load Case - Long Span Test Setup .................................................... 11
Figure 1.9 Uplift Load Case - Long Span Test Setup ....................................................... 11
Figure 1.10 Comparison of Loading Configurations ........................................................ 12
Figure 2.1 Gravity Load Case - Failure of Short Span Assemblies .................................. 14
Figure 2.2 Gravity Load Case - Web Crippling under Applied Load ............................... 14
Figure 2.3 Gravity Load Case - Local Buckling of Compression Flange ......................... 15
Figure 2.4 Gravity Load Case - Long Span Flexural Failure at Mid-span ........................ 15
Figure 2.5 Gravity Load Case - Mtg Compared to Mng for Double L-headers .................. 27
Figure 2.6 Gravity Load Case - Mtg Compared to Mng for Single L-headers .................... 27
Figure 2.7 Gravity Load Case - Comparison between Current and Proposed Strengths .. 28
Figure 2.8 Gravity Load Case - Crushed Portion of L-header .......................................... 30
Figure 2.9 Gravity Load Case - Typical Short Span L-header Load-Deflection Curve ... 31
Figure 2.10 Gravity Load Case - Typical Long Span L-header Load-Deflection Curve .. 36
Figure 2.11 Semi-rigid Beam Member (Xu, 2001) ........................................................... 36
Figure 2.12 Deflection vs. End-fixity Factor (Xu, 2001) .................................................. 37
Figure 2.13 Gravity Load Case - Typical Semi-Rigid Deflection Model ......................... 37
Figure 2.14 Semi-rigid Deflection Equations ................................................................... 38
Figure 2.15 Gravity Load Case - Comparison of Δtg to Δg for Double L-headers............. 43
Figure 2.16 Gravity Load Case - Comparison of Δtg to Δg for Single L-headers .............. 43
Figure 2.17 Gravity Load Case - Drywall Comparison Load-Deflection Curve .............. 45
Figure 3.1 Uplift Load Case - Buckling Failure of Web Section (6' Assemblies) ............ 47
Figure 3.2 Uplift Load Case - Flexural Buckling of Bottom Track .................................. 47
Figure 3.3 Uplift Load Case - Local Buckling of Web Section ........................................ 48
vi
Figure 3.4 Uplift Load Case - Prying of King Stud .......................................................... 48
Figure 3.5 Uplift Load Case - Screw failure at Ultimate Load ......................................... 49
Figure 3.6 Uplift Load Case - Load-Deflection Curve Failure ......................................... 50
Figure 3.7 Uplift Load Case - Mtu Compared to Mnu for Double L-headers ..................... 58
Figure 3.8 Uplift Load Case - Mtu Compared to Mnu for Single L-headers ...................... 58
Figure 3.9 Uplift Load Case - Typical Short Span Load-Deflection Curve ..................... 62
Figure 3.10 Uplift Load Case - Typical Long Span Load-Deflection Curve .................... 62
Figure 3.11 Uplift Load Case - Comparison of Δtu to Δu for Double L-headers ............... 65
Figure 3.12 Uplift Load Case - Comparison of Δtu to Δu for Single L-headers ................. 66
Figure 3.13 Uplift Load Case - Drywall Comparison Load-Deflection Curve ................. 68
vii
List of Tables Table 2.1 Long Span Ultimate Test Moment Equations ................................................... 16
Table 2.2 Gravity Load Case - Double L-header Test Result Summary .......................... 18
Table 2.3 Gravity Load Case - Single L-header Test Result Summary ............................ 21
Table 2.4 Multi-point vs. Two-point Loading Configuration ........................................... 23
Table 2.5 Gravity Load Case - Values of Ω and ϕ ............................................................ 26
Table 2.6 Gravity Load Case - Short Span L-Header Deflection Data Summary ............ 32
Table 2.7 Gravity Load Case - Shear Deformation Contribution ..................................... 33
Table 2.8 Gravity Load Case - Long Span Deflection Data Summary ............................. 34
Table 2.9 Semi-rigid Deflection m values ......................................................................... 39
Table 2.10 Gravity Load Case - Long Span L-header Semi-Rigid Property Summary .... 40
Table 2.11 Gravity Load Case - Gypsum Board Test Results .......................................... 44
Table 3.1 Uplift Load Case - Double L-header Test Result Summary ............................. 52
Table 3.2 Uplift Load Case - Single L-header Test Result Summary ............................... 53
Table 3.3 Uplift Load Case - Values of Ω and ϕ ............................................................... 59
Table 3.4 Uplift Load Case - Double L-header Deflection Summary .............................. 60
Table 3.5 Uplift Load Case - Single L-header Deflection Summary ................................ 61
Table 3.6 Uplift Load Case - Double L-header Ieq/Iec Deflection Summary ..................... 63
Table 3.7 Uplift Load Case - Single L-header Ieq/Iec Deflection Summary ...................... 64
Table 3.8 Uplift Load Case - Gypsum Board Test Results ............................................... 67
viii
List of Notations Aw Area of web (t x h) a Distance between point loads E Modulus of Elasticity of steel f Stress level in compression element Fy Yield strength of L-section Fv Nominal shear stress G Shear Modulus of steel h Depth of L-section Iec Effective moment of inertia, calculated at f = Fy (causing compression in top
flange)
Ieq Equivalent effective moment of inertia Ig Gross moment of inertia Kv Shear buckling coefficient L Span length Mng Nominal gravity flexural strength Mnu Nominal uplift flexural strength Mtg Ultimate test moment (gravity load case) Mtu Ultimate test moment (uplift load case) P Applied load at each cripple stud Pt Total applied load R End connection rotational stiffness AISI S212 Uplift factor r End-fixity factor Sec Effective elastic section modulus, calculated at f = Fy (causing compression in top
flange) t Thickness of L-section Vn Nominal shear strength Vtu Maximum shear force from test (uplift load case) Δg Predicted mid-span deflection at service load level – gravity load case Δmid Mid-span deflection Δu Predicted mid-span deflection at service load level – uplift load case Δtg Tested mid-span deflection at service load level – gravity load case Δtu Tested mid-span deflection at service load level – uplift load case ϕ Load and Resistance Factor Design (LRFD) resistance factor Ω Allowable Stress Design (ASD) factor of safety
1
Chapter 1
EXPERIMENTAL SETUP
1.1 GENERAL
The experimental investigation was conducted in four main phases: short span gravity
loaded tests, short span uplift tests, long span gravity loaded tests, and long span uplift tests.
Each phase of testing was required to observe the flexural behavior and deflection
performance of single and double L-header assemblies at various spans commonly used in
residential and light commercial construction. Short span tests consisted of L-header
assemblies with a clear span of 3ft (0.91m) to 6ft (1.83m). Long span tests consisted of
spans ranging between 8ft (2.44m) to 16ft (4.88m). The testing procedure used for the short
span tests was developed based on the test procedure implemented for similar tests,
conducted at the NAHB Research Center. However, for the long span tests a different
loading approach was implemented. The long span tests conducted at the NAHB Research
Center were loaded using two-point loading, whereas the long span tests for this study were
loaded with multiple loads at 24 inches (610mm) on center. Applying loads at 24 inches
(610mm) on center is a closer simulation of the actual loading of such assemblies in typical
residential load bearing wall construction. Simulating the actual loading conditions that are
seen in the construction industry will help ensure the true behavior of L-headers assemblies is
identified and will help create efficient design provisions.
All of the L-header assemblies were constructed with materials and methods appropriate
for framing light commercial or residential cold-formed steel structures. Steel sections were
provided by Bailey Metal Products Limited. Construction of the L-header assemblies and the
testing was entirely performed at the University of Waterloo.
1.2 TEST SPECIMEN
1.2.1 Material Properties
All steel materials used conformed to minimum strength and thickness guidelines as per
the North American Specification for Cold-Formed Steel Structural Members (CSA, 2007).
Mechanical properties for the L-headers were based on tensile coupon tests and base steel
2
thickness measurements, conducted in accordance with ASTM A370 and ASTM A90
respectively (ASTM, 2003). Three coupons were cut from the web section of the L-shaped
angle sections, by the University of Waterloo’s machine shop, to meet the ASTM A370
requirements. Prior to testing, the galvanized coatings were removed by dipping the coupons
in a sulfuric acid and water solution. Tensile tests were performed using an Instron 4206
testing machine, with a maximum capacity of 30 kips. Actual thickness and width
measurements of the coupons were performed using a digital micrometer. Summarized in
Tables A1 and A2 of Appendix A are the average mechanical properties for the material used
in the gravity and uplift tests, respectively.
The material designation is as per the Steel Stud Manufacturers Association (SSMA).
For example an 800L150-43 designation refers to an L-shaped angle with an 8" long leg
(1/100 inches), 1.5" short leg (1/100 inches) and a 43 mil nominal thickness.
1.2.2 Section Properties
In reality, the performance and behavior of L-header assemblies are based on the entire
assembly consisting of angle section(s), cripple studs, and track sections interconnected by
self-drilling screws. Thus, determining the effective section properties for such complicated
assemblies would be extremely difficult. As a simplification, the section properties for each
L-header assembly were based entirely on the L-shaped angle(s), the top track or bottom
track sections were not considered in the calculation of section properties. For strength
determination the effective section modulus is required, while for deflection determination
the effective moment of inertia is required.
Both the effective section modulus and effective moment of inertia of the L-shaped
sections were calculated in accordance to the 2007 North American Specification (CSA,
2007). Currently, the North American Specification is published by different publishers
depending on location. In the United States, the American Iron and Steel Institute (AISI
S100) publishes the specification; however, in Canada the Canadian Standards Association
(CSA S136) publishes the specification. For cold-formed steel L-headers, the effective
section properties are dependent on the loading configuration. Under gravity loads, the top
flange of the L-section experiences compression stresses, while the web section is subjected
to a stress gradient with the compressive stress increasing towards the top flange. Under this
3
loading configuration the top flange acts as a stiffener to the web section under compression;
as a result, the effective width of the web is increased.
In the case of uplift loads the top flange of the L-section experiences tensile stresses and
the web section is subjected to a stress gradient. However, the compressive stress is now
increasing towards the unstiffened free edge. With the compressed portion of the web being
unstiffened, the effective width of the web is greatly reduced, resulting in a shift of the
neutral axis towards the top flange and ultimately low effective section properties under
uplift loads.
Recent changes to the North American Specification for the Design of Cold-Formed Steel
Structural Members (CSA, 2007) have resulted in a significant decrease in section properties
for L-headers under uplift loads. The new formulation; clause B3.2 2(ii) of the specification,
for calculating the effective width of unstiffened compression elements subjected to stress
gradients is however limited to elements with a web slenderness ratio, h/t of less than 60. In
this study all of the tested headers had a web slenderness ratio exceeding this limit. It was
found that if the slenderness ratio limit was ignored for the gravity load case, sections with a
slenderness ratio of 150 or less resulted in identical section properties compared to the
previously used method. However, for sections with web slenderness ratios larger than 150,
the new formulation resulted in slightly larger section properties.
The calculated section properties based on a single L-section, for the gravity loaded tests
are summarized in Table A3 of Appendix A. For double L-header assemblies, the values of
the section properties were doubled. The subscript “c” denotes the section property was
calculated based on gravity loading, producing compression in the top flange. A Visual Basic
macro in Microsoft Excel was created in order to compute the following section properties;
gross moment of inertia Ig, effective moment of inertia Iec, and effective section modulus Sec.
All effective section properties were computed based on the maximum compression stress
equaling the yield stress of the given material (f = Fy). Yielding of the tensile fiber was not
considered a failure limit state. The inner radius of the L-shape corner was taken as twice the
thickness. For the purposes of calculating the effective section properties the corner was
assumed to be fully effective.
Under uplift loads the new formulation of the effective width of the web (clause B3.2 2(i)
of the specification) resulted in a decrease in the section properties. As with the gravity load
4
case, the new formulation is limited to elements with a slenderness ratio (h/t) of less than 60.
All of the L-sections used in the test program exceed this ratio, however if the new
formulation is used for the uplift load cases, the resulting effective width of the web section
is significantly reduced. With a small effective web section in compression, the neutral axis
will shift towards the compression flange, resulting in small effective section properties.
Since all the L-sections used within this test program greatly exceed the slenderness ratio of
60, a different approach was warranted. The gravity effective section modulus and gravity
effective moment of inertia section properties were used for the uplift strength and deflection
determination, respectively from herein. This is currently the approach also being used in the
AISI S212-07 standard for the uplift strength determination (AISI, 2007).
Presented in Table A4 of Appendix A are the calculated section properties based on a
single L-section, for the uplift loaded tests. The values are doubled for double L-headers.
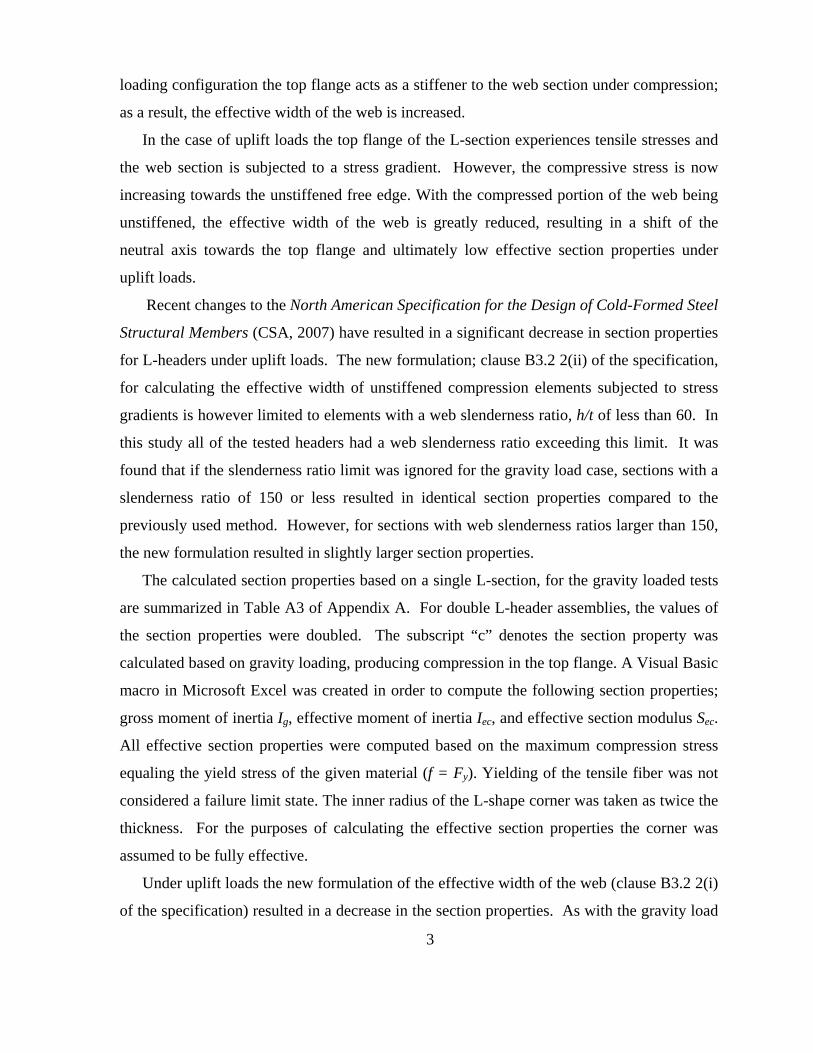
1.2.3 Test Specimen Assemblies
The header assemblies were fabricated to simulate a typical opening in a 3-5/8 in.
(92mm) wide steel stud wall assembly. One or two L-shaped cold-formed steel sections were
added over the opening with the short leg lapping over the top track section and the long leg
extended down the side of the cripple stud, as shown in Figure 1.1 and Figure 1.2 for double
and single L-headers, respectively. Self-drilling screws (no. 8) were used to connect the L-
shapes to the track sections, cripple studs, and king studs.
Figure 1.1 Double L-Header
5
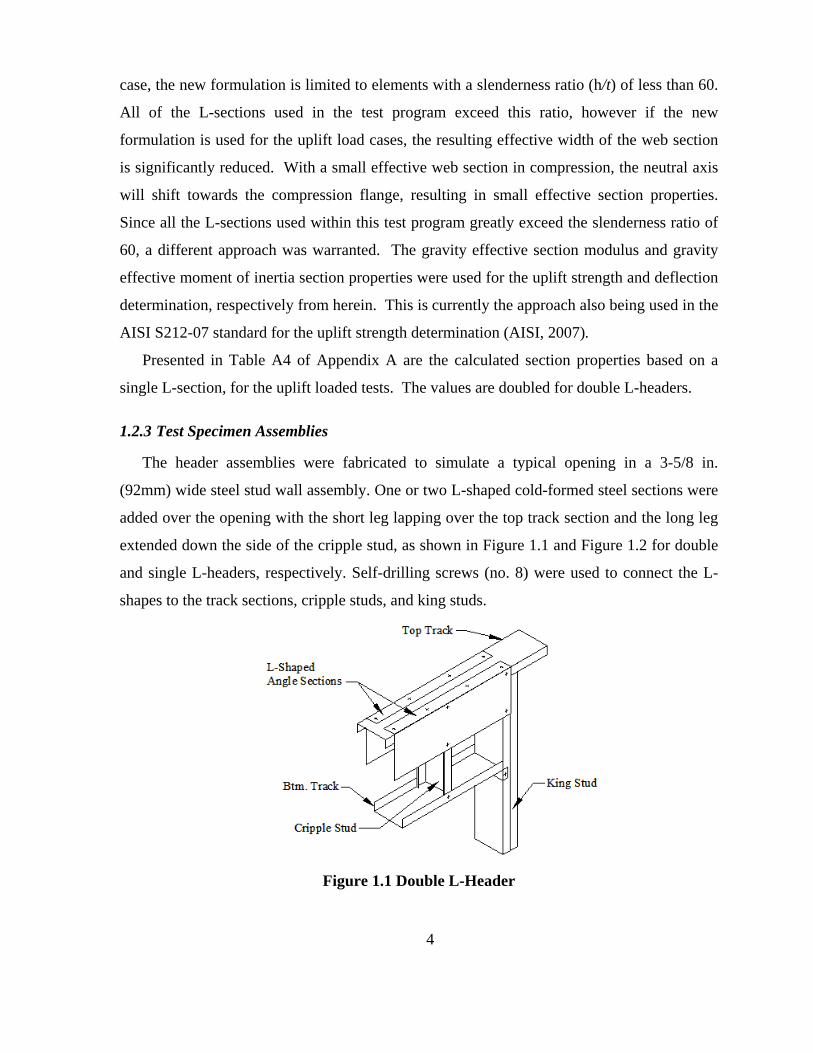
Track sections used (362T125-33) had a minimum thickness of 33mils (0.84mm). Back-
to-back cold-formed steel C-shaped studs (362S162-43) were attached to each end of the L-
header, to simulate king studs. C-shape cripple studs consisted of 362S162-43 sections
spaced 24 inches on center between the king studs. Drawings indentifying the location of
screws for each assemblies span are included in Appendix A.
Figure 1.2 Single L-Header
Assembly designation is as follows: the first letter “D” or “S” represents double or single
L-shape section, the first number is the vertical leg dimension (in.) of the L-shaped angle, the
second number is the nominal thickness of the angle (in.), and the last number is the clear
span (ft). The letter “A”, “B”, “C”, or “D” indicates the number of identical assemblies
tested. Results are based on the average of two identical assemblies, if the results were
within 10% of each other. If the results from the first two tests were not within 10% of each
other further tests were performed and the average of all the tests was reported, unless
notified otherwise. Uplift tests are identified with a ‘U’ at the end of the assembly
designation. For example a D10-54-16B assembly designation represents a 16ft L-header
assembly consisting of two L-sections with vertical leg depths of 10in., and thicknesses of
54mil. It is the second test for the D10-54-16 assemblies, tested under gravity loads.
Clear spans chosen for the tests were based on common spans used in construction and
were the same as previous tests conducted by NAHB (NAHB-RC, 1998) and (NAHB-RC,
2003), for comparison purposes. For the double L-headers five different span lengths were
tested: 3ft (0.91m), 6ft (1.83m), 8ft (2.44m), 12ft (3.66m), and 16ft (4.88m). For single L-
6
header assemblies three different span lengths were tested: 4ft (1.22m), 6ft (1.83m), and 8ft
(2.44m).
1.3 SHORT SPAN TEST SETUP
Short span tests included clear spans ranging between 3ft (0.91m) to 6ft (1.83m) for both
gravity and uplift loading. All short span tests were conducted using an H-frame universal
testing machine in the Structures Lab at the University of Waterloo, equipped with a 35 kip
(156 kN) maximum capacity actuator. A MTS Flex Test SE controller was used to control
the hydraulics. While the data was acquired through National Instruments hardware and
processed using a Labview virtual instrument (VI). The servo-hydraulics applied a constant
rate of displacement of 1/20 inch (1.27mm) per minute to the assembly until failure was
detected.
For the 3ft (0.91m) double L-header and 4ft (1.22m) single L-header assembly’s tested
under gravity loads mid-span deflections of the top track were recorded with a linear variable
differential transformer (LVDT). Certain assemblies were retested with a linear motion
transducer (LMT) attached to the bottom track in an effort to observe whether the bottom
track deflection was less than the top track at mid-span. Under uplift loads, mid-span
deflections were recorded with a LMT attached to the bottom track. For the 6ft (1.83m)
assemblies, an LVDT measured the deflection of the top track at the location of the applied
load (1/3 and 2/3 span), while the mid-span deflection was recorded using a LMT attached to
the bottom track.
1.3.1 Gravity Tests
Gravity loads were applied to the assemblies to observe the flexural behavior and strength
under typical loading conditions. The 3ft (0.91m) double L-header and 4ft (1.22m) single L-
header assemblies were loaded with a single point load applied at mid-span over a cripple
stud. The load was applied using a steel bearing plate with a contact area of 1.5 in. x 4 in.
(38mm x 102mm). The two end-studs (king studs) on either end were positioned in
fabricated base supports. The supports allowed the king studs to rotate in the plane of
bending, while restraining the king studs from out of plane bending and lateral movement.
Figure 1.3, shows the typical setup used for the 3ft and 4ft spans. Additional lateral braces
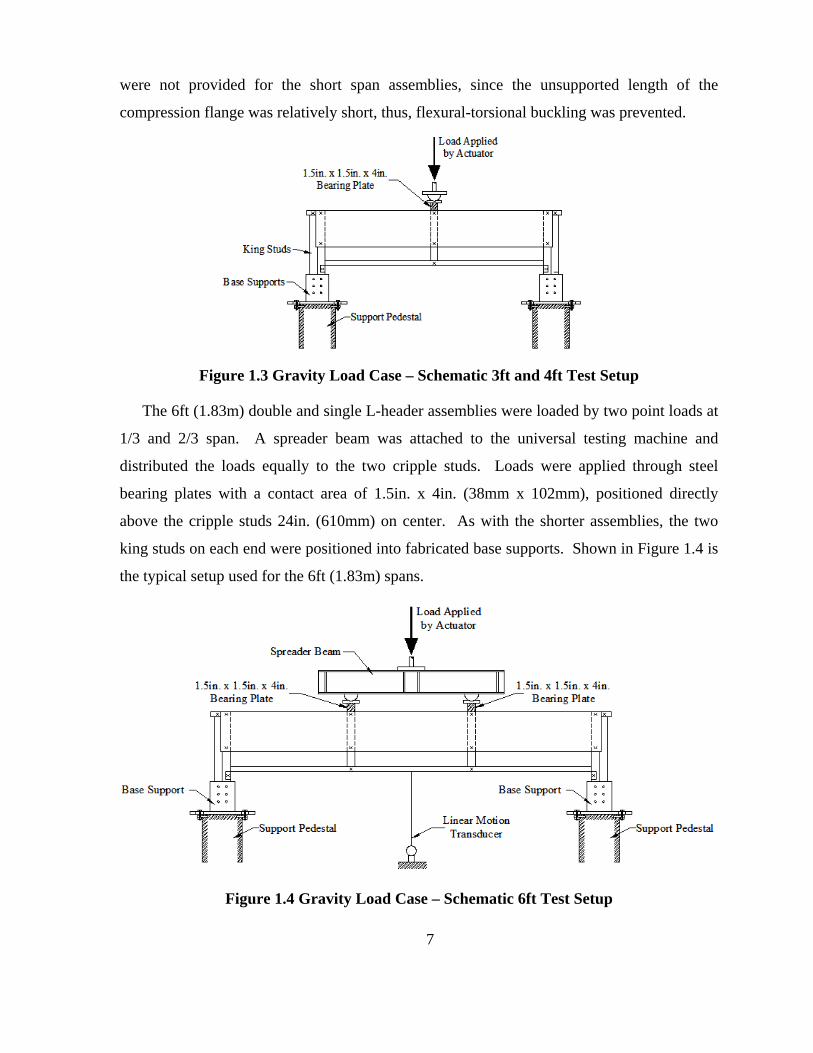
7
were not provided for the short span assemblies, since the unsupported length of the
compression flange was relatively short, thus, flexural-torsional buckling was prevented.
Figure 1.3 Gravity Load Case – Schematic 3ft and 4ft Test Setup
The 6ft (1.83m) double and single L-header assemblies were loaded by two point loads at
1/3 and 2/3 span. A spreader beam was attached to the universal testing machine and
distributed the loads equally to the two cripple studs. Loads were applied through steel
bearing plates with a contact area of 1.5in. x 4in. (38mm x 102mm), positioned directly
above the cripple studs 24in. (610mm) on center. As with the shorter assemblies, the two
king studs on each end were positioned into fabricated base supports. Shown in Figure 1.4 is
the typical setup used for the 6ft (1.83m) spans.
Figure 1.4 Gravity Load Case – Schematic 6ft Test Setup
8
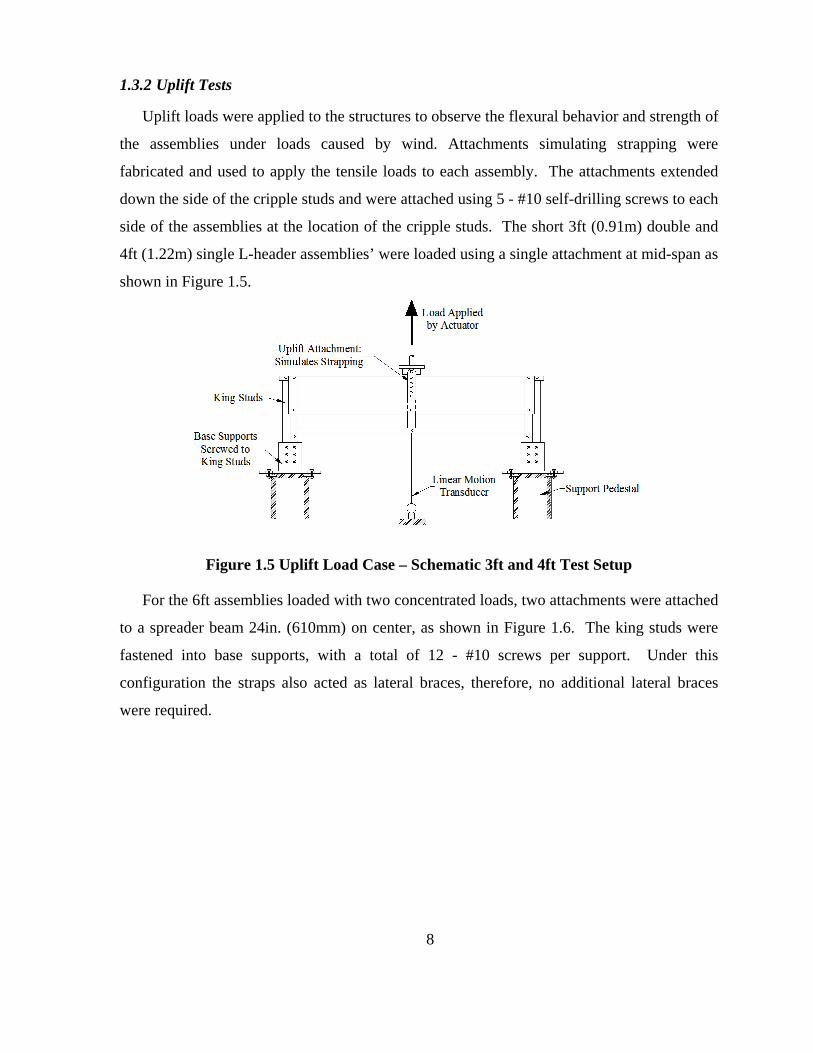
1.3.2 Uplift Tests
Uplift loads were applied to the structures to observe the flexural behavior and strength of
the assemblies under loads caused by wind. Attachments simulating strapping were
fabricated and used to apply the tensile loads to each assembly. The attachments extended
down the side of the cripple studs and were attached using 5 - #10 self-drilling screws to each
side of the assemblies at the location of the cripple studs. The short 3ft (0.91m) double and
4ft (1.22m) single L-header assemblies’ were loaded using a single attachment at mid-span as
shown in Figure 1.5.
Figure 1.5 Uplift Load Case – Schematic 3ft and 4ft Test Setup
For the 6ft assemblies loaded with two concentrated loads, two attachments were attached
to a spreader beam 24in. (610mm) on center, as shown in Figure 1.6. The king studs were
fastened into base supports, with a total of 12 - #10 screws per support. Under this
configuration the straps also acted as lateral braces, therefore, no additional lateral braces
were required.
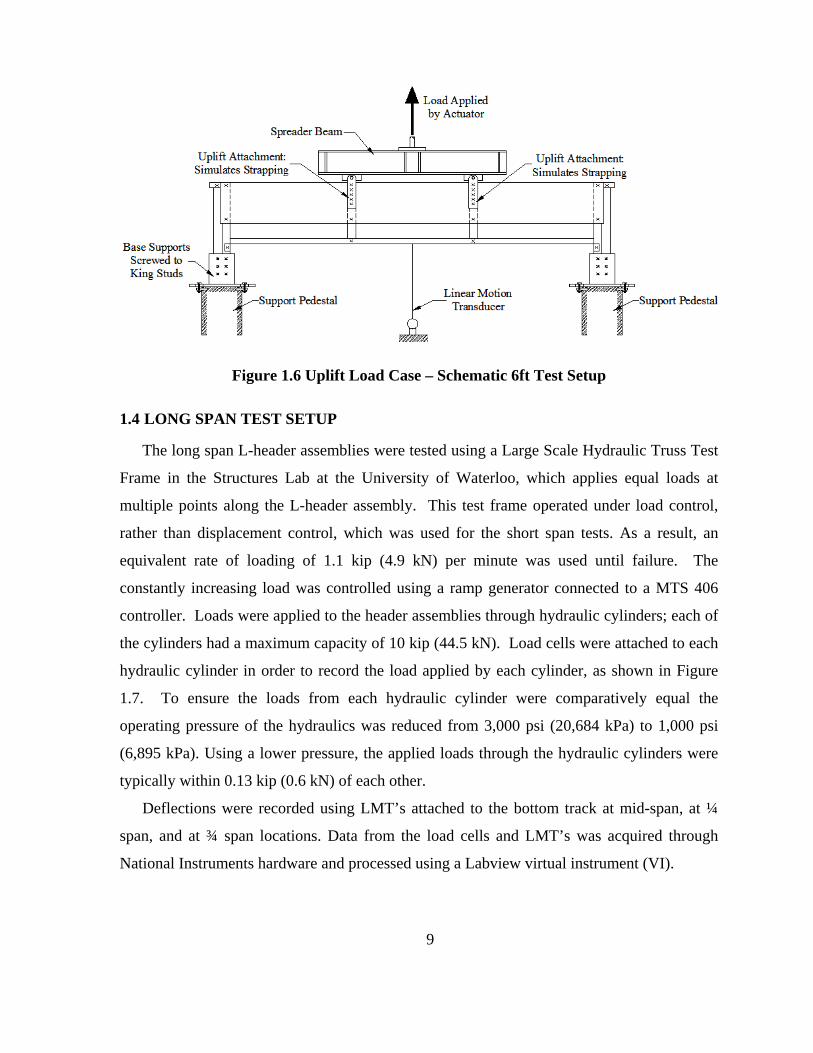
9
Figure 1.6 Uplift Load Case – Schematic 6ft Test Setup
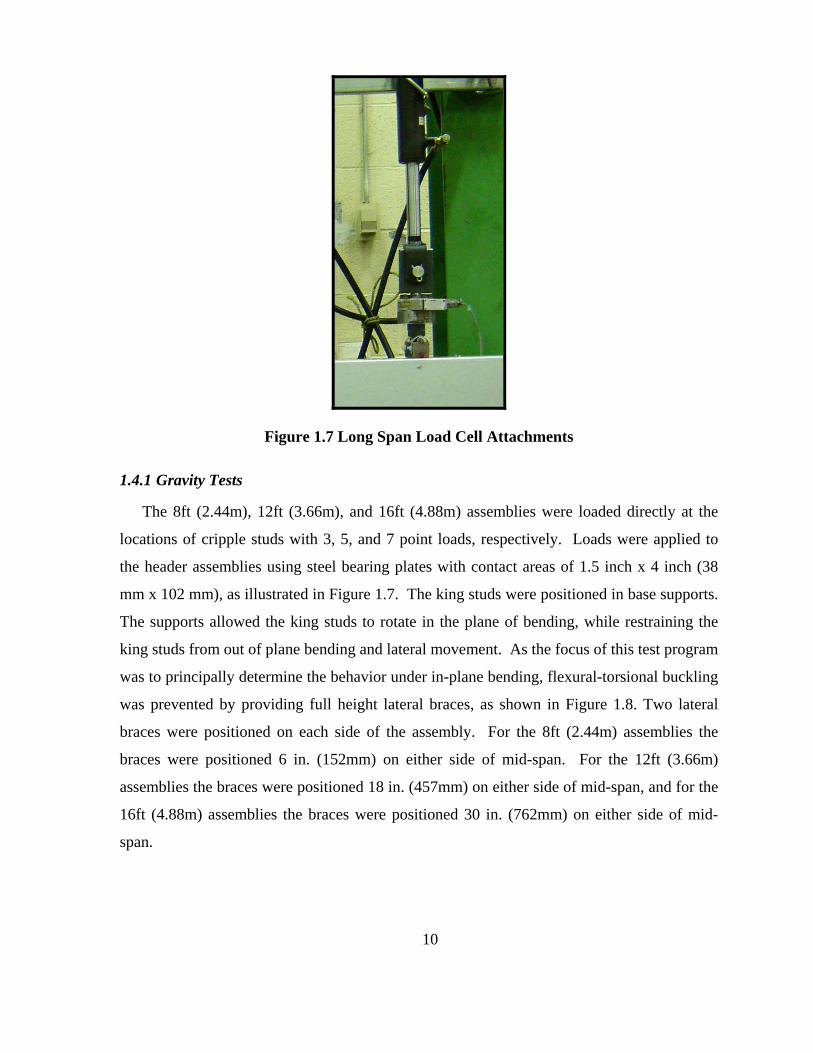
1.4 LONG SPAN TEST SETUP
The long span L-header assemblies were tested using a Large Scale Hydraulic Truss Test
Frame in the Structures Lab at the University of Waterloo, which applies equal loads at
multiple points along the L-header assembly. This test frame operated under load control,
rather than displacement control, which was used for the short span tests. As a result, an
equivalent rate of loading of 1.1 kip (4.9 kN) per minute was used until failure. The
constantly increasing load was controlled using a ramp generator connected to a MTS 406
controller. Loads were applied to the header assemblies through hydraulic cylinders; each of
the cylinders had a maximum capacity of 10 kip (44.5 kN). Load cells were attached to each
hydraulic cylinder in order to record the load applied by each cylinder, as shown in Figure
1.7. To ensure the loads from each hydraulic cylinder were comparatively equal the
operating pressure of the hydraulics was reduced from 3,000 psi (20,684 kPa) to 1,000 psi
(6,895 kPa). Using a lower pressure, the applied loads through the hydraulic cylinders were
typically within 0.13 kip (0.6 kN) of each other.
Deflections were recorded using LMT’s attached to the bottom track at mid-span, at ¼
span, and at ¾ span locations. Data from the load cells and LMT’s was acquired through
National Instruments hardware and processed using a Labview virtual instrument (VI).
10
Figure 1.7 Long Span Load Cell Attachments
1.4.1 Gravity Tests
The 8ft (2.44m), 12ft (3.66m), and 16ft (4.88m) assemblies were loaded directly at the
locations of cripple studs with 3, 5, and 7 point loads, respectively. Loads were applied to
the header assemblies using steel bearing plates with contact areas of 1.5 inch x 4 inch (38
mm x 102 mm), as illustrated in Figure 1.7. The king studs were positioned in base supports.
The supports allowed the king studs to rotate in the plane of bending, while restraining the
king studs from out of plane bending and lateral movement. As the focus of this test program
was to principally determine the behavior under in-plane bending, flexural-torsional buckling
was prevented by providing full height lateral braces, as shown in Figure 1.8. Two lateral
braces were positioned on each side of the assembly. For the 8ft (2.44m) assemblies the
braces were positioned 6 in. (152mm) on either side of mid-span. For the 12ft (3.66m)
assemblies the braces were positioned 18 in. (457mm) on either side of mid-span, and for the
16ft (4.88m) assemblies the braces were positioned 30 in. (762mm) on either side of mid-
span.
11
Figure 1.8 Gravity Load Case - Long Span Test Setup
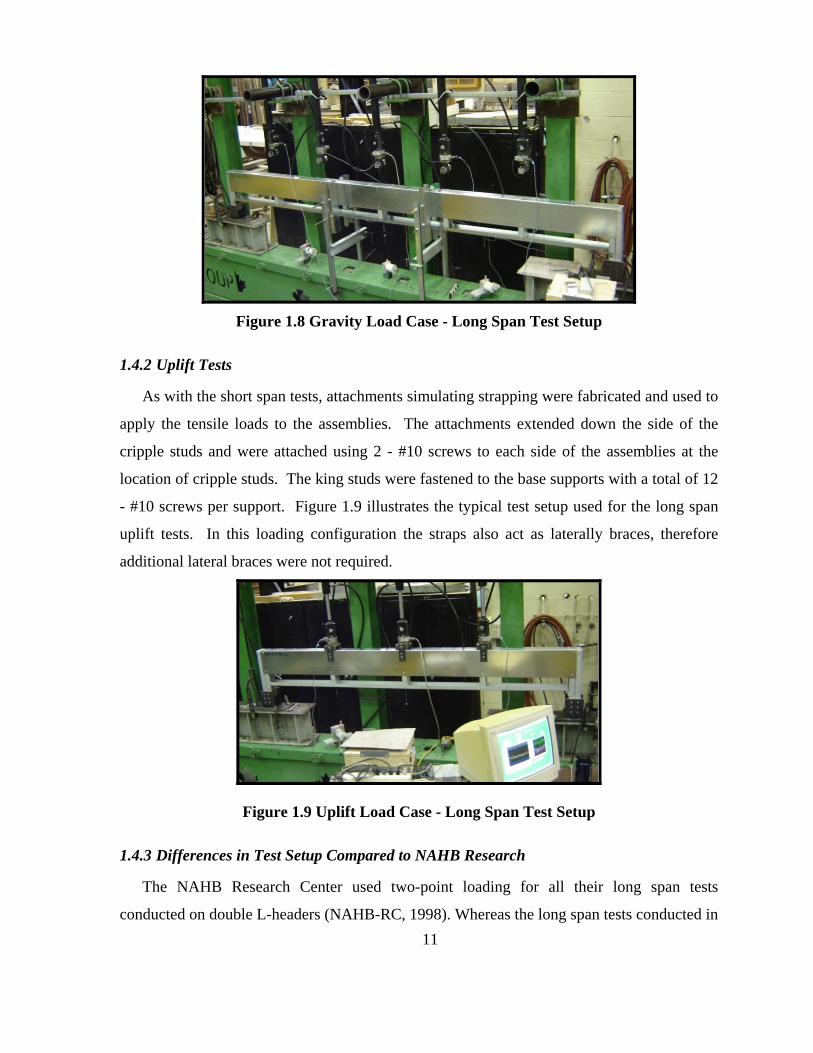
1.4.2 Uplift Tests
As with the short span tests, attachments simulating strapping were fabricated and used to
apply the tensile loads to the assemblies. The attachments extended down the side of the
cripple studs and were attached using 2 - #10 screws to each side of the assemblies at the
location of cripple studs. The king studs were fastened to the base supports with a total of 12
- #10 screws per support. Figure 1.9 illustrates the typical test setup used for the long span
uplift tests. In this loading configuration the straps also act as laterally braces, therefore
additional lateral braces were not required.
Figure 1.9 Uplift Load Case - Long Span Test Setup
1.4.3 Differences in Test Setup Compared to NAHB Research
The NAHB Research Center used two-point loading for all their long span tests
conducted on double L-headers (NAHB-RC, 1998). Whereas the long span tests conducted in
12
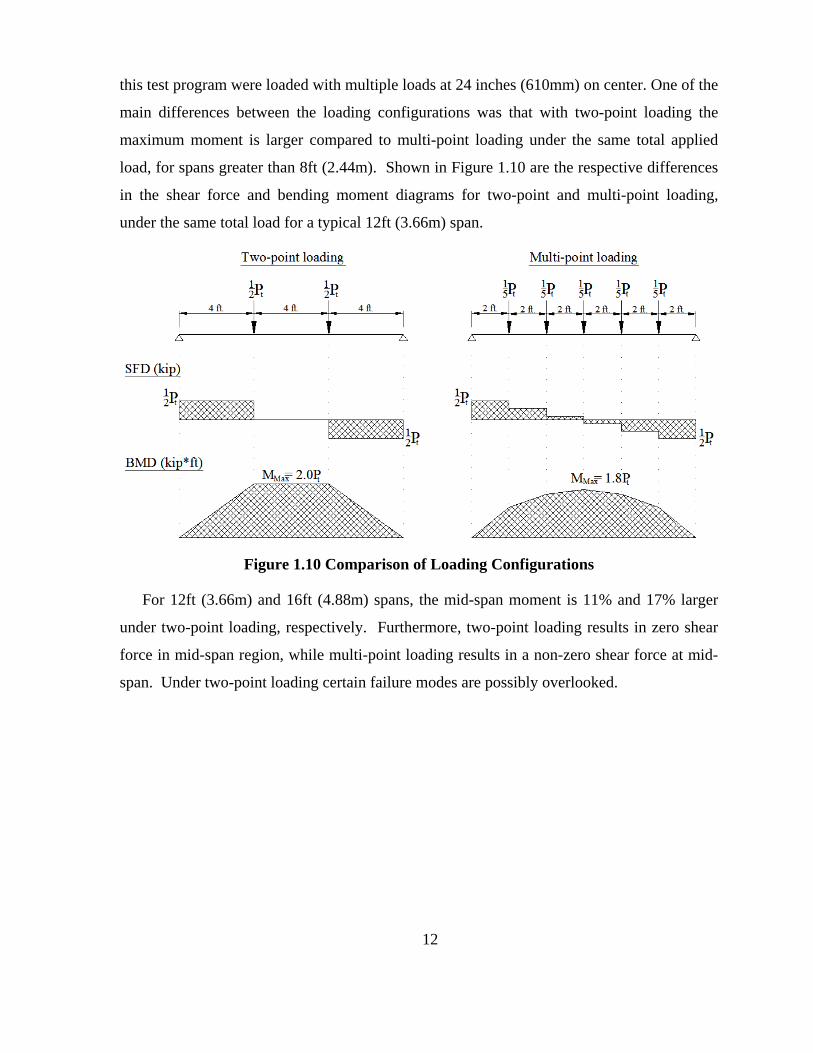
this test program were loaded with multiple loads at 24 inches (610mm) on center. One of the
main differences between the loading configurations was that with two-point loading the
maximum moment is larger compared to multi-point loading under the same total applied
load, for spans greater than 8ft (2.44m). Shown in Figure 1.10 are the respective differences
in the shear force and bending moment diagrams for two-point and multi-point loading,
under the same total load for a typical 12ft (3.66m) span.
Figure 1.10 Comparison of Loading Configurations
For 12ft (3.66m) and 16ft (4.88m) spans, the mid-span moment is 11% and 17% larger
under two-point loading, respectively. Furthermore, two-point loading results in zero shear
force in mid-span region, while multi-point loading results in a non-zero shear force at mid-
span. Under two-point loading certain failure modes are possibly overlooked.
Chapter 2
RESULTS / DATA ANALYSIS – GRAVITY LOADS
2.1 GENERAL
Data from the gravity load tests was collected in an effort to gain an understanding of the
structural behavior of cold-formed steel L-headers. In particular, the flexural performance
and deflection behavior were the main areas of interest. The nominal flexural strength as per
the current AISI – Header Design Standard (AISI S212-07) was compared to the ultimate test
moment in an effort to check the adequacy of the current design procedure. A new refined
design approach has been proposed, based on tests summarized in this chapter, as well as
tests previously conducted at the NAHB Research Center (NAHB-RC, 1998).
Given that there is currently no explicit deflection provisions for L-headers, deflection
data was recorded for each assembly tested, in an effort to further understand the
performance of the assemblies and ultimately produce a prediction equation for the vertical
deflections of such assemblies.
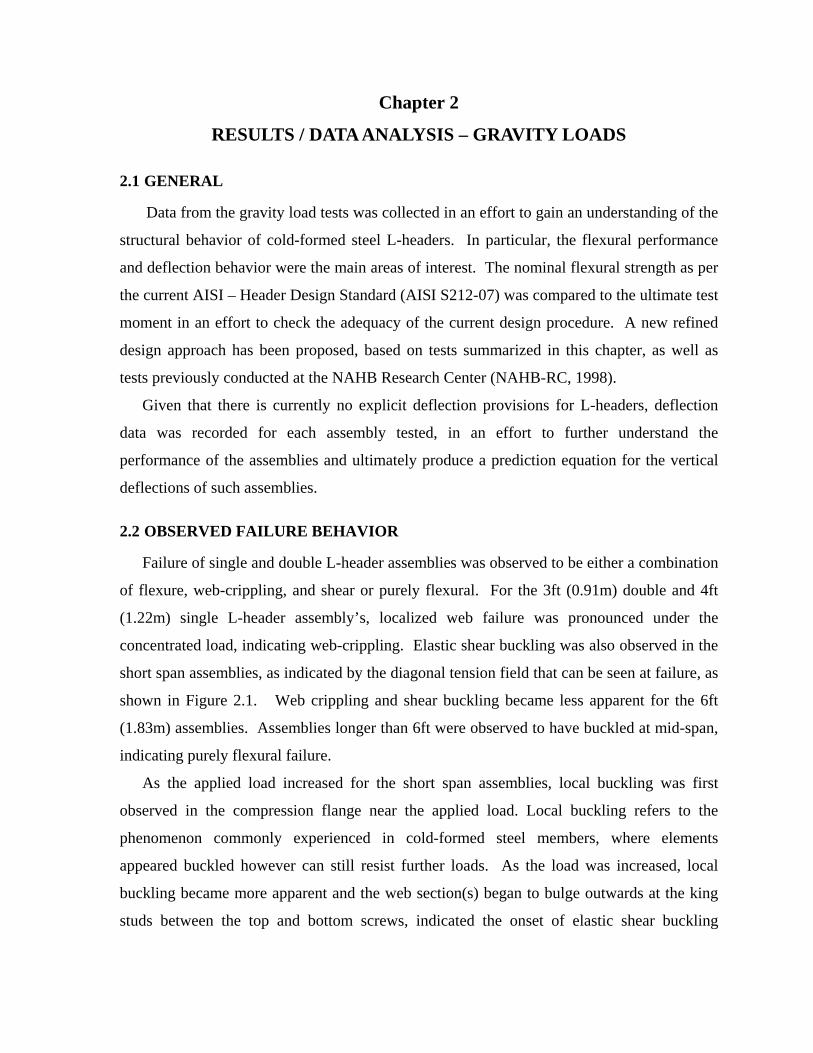
2.2 OBSERVED FAILURE BEHAVIOR
Failure of single and double L-header assemblies was observed to be either a combination
of flexure, web-crippling, and shear or purely flexural. For the 3ft (0.91m) double and 4ft
(1.22m) single L-header assembly’s, localized web failure was pronounced under the
concentrated load, indicating web-crippling. Elastic shear buckling was also observed in the
short span assemblies, as indicated by the diagonal tension field that can be seen at failure, as
shown in Figure 2.1. Web crippling and shear buckling became less apparent for the 6ft
(1.83m) assemblies. Assemblies longer than 6ft were observed to have buckled at mid-span,
indicating purely flexural failure.
As the applied load increased for the short span assemblies, local buckling was first
observed in the compression flange near the applied load. Local buckling refers to the
phenomenon commonly experienced in cold-formed steel members, where elements
appeared buckled however can still resist further loads. As the load was increased, local
buckling became more apparent and the web section(s) began to bulge outwards at the king
studs between the top and bottom screws, indicated the onset of elastic shear buckling
14
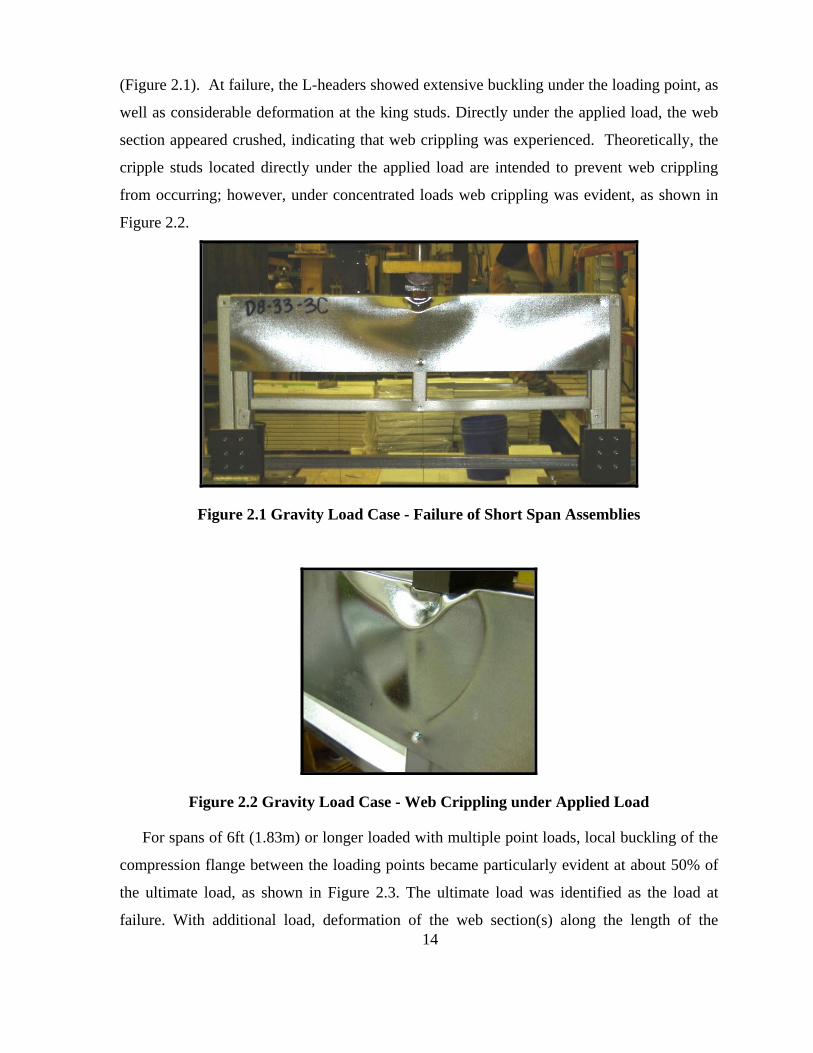
(Figure 2.1). At failure, the L-headers showed extensive buckling under the loading point, as
well as considerable deformation at the king studs. Directly under the applied load, the web
section appeared crushed, indicating that web crippling was experienced. Theoretically, the
cripple studs located directly under the applied load are intended to prevent web crippling
from occurring; however, under concentrated loads web crippling was evident, as shown in
Figure 2.2.
Figure 2.1 Gravity Load Case - Failure of Short Span Assemblies
Figure 2.2 Gravity Load Case - Web Crippling under Applied Load
For spans of 6ft (1.83m) or longer loaded with multiple point loads, local buckling of the
compression flange between the loading points became particularly evident at about 50% of
the ultimate load, as shown in Figure 2.3. The ultimate load was identified as the load at
failure. With additional load, deformation of the web section(s) along the length of the
15
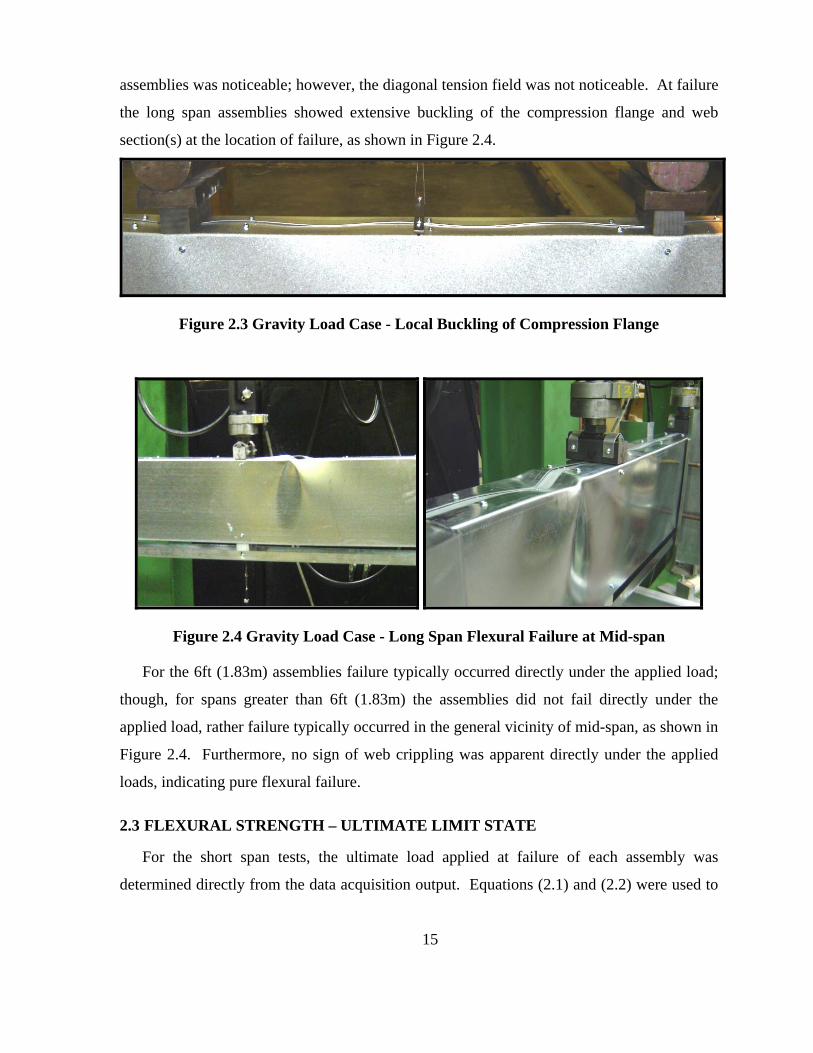
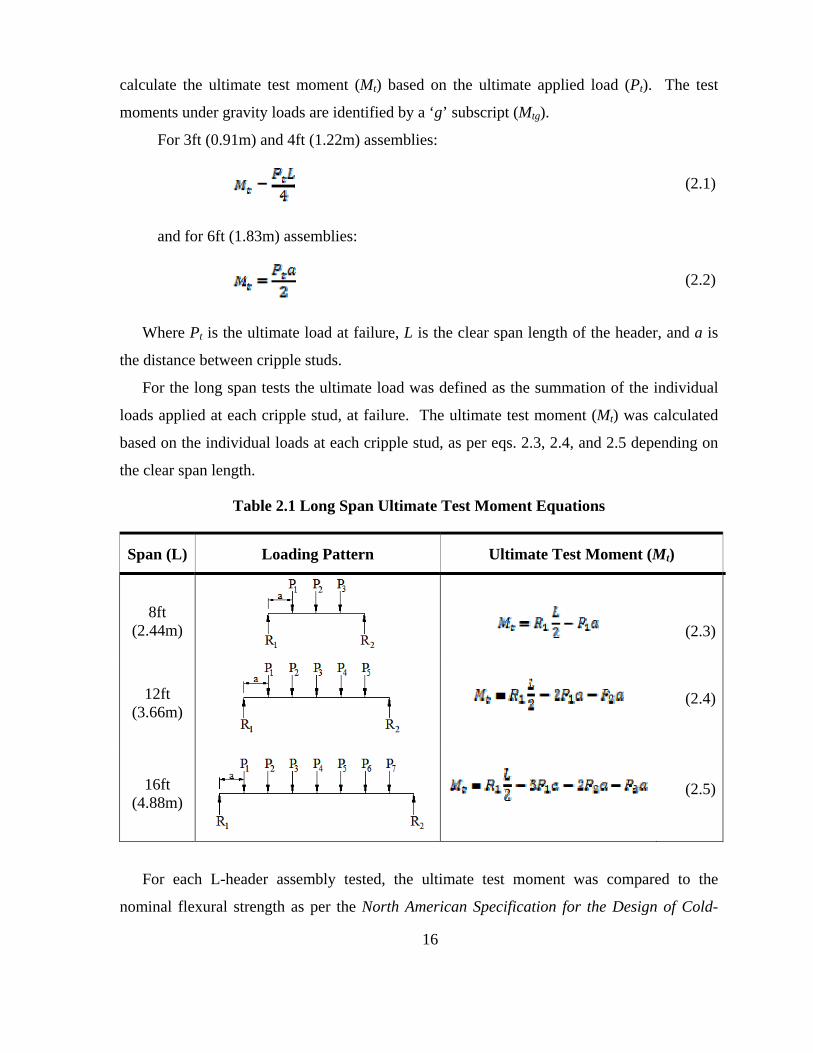
assemblies was noticeable; however, the diagonal tension field was not noticeable. At failure
the long span assemblies showed extensive buckling of the compression flange and web
section(s) at the location of failure, as shown in Figure 2.4.
Figure 2.3 Gravity Load Case - Local Buckling of Compression Flange
Figure 2.4 Gravity Load Case - Long Span Flexural Failure at Mid-span
For the 6ft (1.83m) assemblies failure typically occurred directly under the applied load;
though, for spans greater than 6ft (1.83m) the assemblies did not fail directly under the
applied load, rather failure typically occurred in the general vicinity of mid-span, as shown in
Figure 2.4. Furthermore, no sign of web crippling was apparent directly under the applied
loads, indicating pure flexural failure.
2.3 FLEXURAL STRENGTH – ULTIMATE LIMIT STATE
For the short span tests, the ultimate load applied at failure of each assembly was
determined directly from the data acquisition output. Equations (2.1) and (2.2) were used to
16
calculate the ultimate test moment (Mt) based on the ultimate applied load (Pt). The test
moments under gravity loads are identified by a ‘g’ subscript (Mtg).
For 3ft (0.91m) and 4ft (1.22m) assemblies:
(2.1)
and for 6ft (1.83m) assemblies:
(2.2)
Where Pt is the ultimate load at failure, L is the clear span length of the header, and a is
the distance between cripple studs.
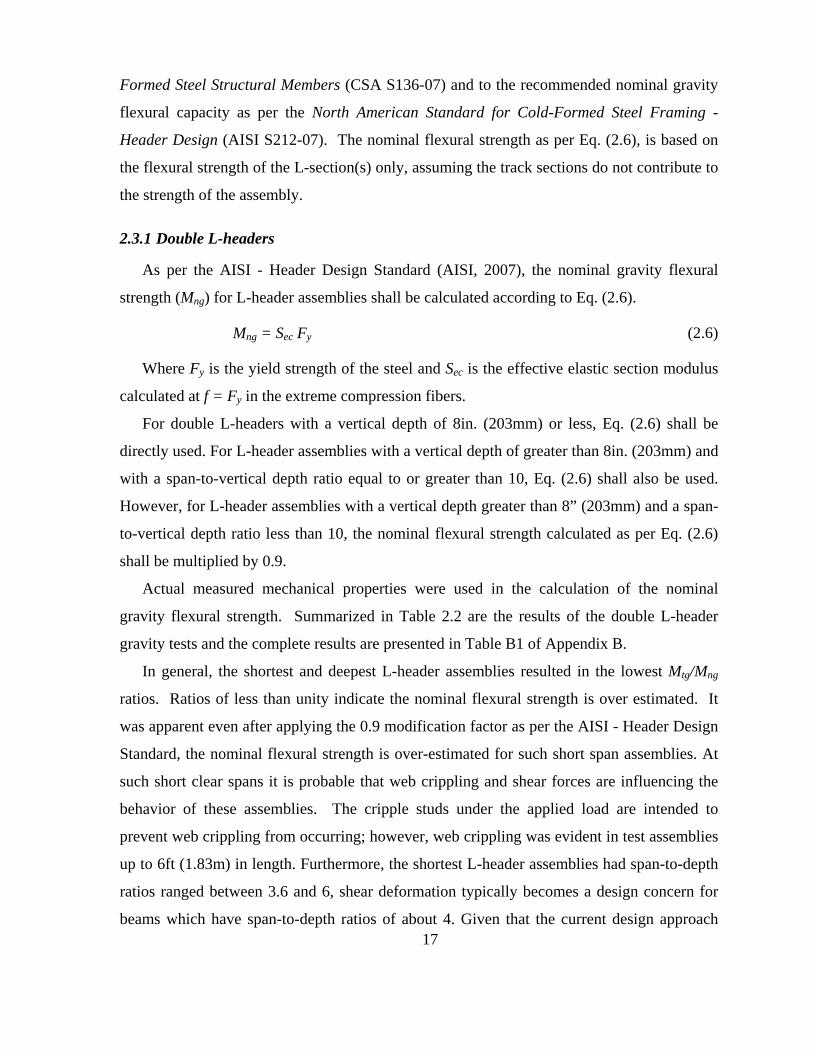
For the long span tests the ultimate load was defined as the summation of the individual
loads applied at each cripple stud, at failure. The ultimate test moment (Mt) was calculated
based on the individual loads at each cripple stud, as per eqs. 2.3, 2.4, and 2.5 depending on
the clear span length.
Table 2.1 Long Span Ultimate Test Moment Equations
Span (L) Loading Pattern Ultimate Test Moment (Mt)
8ft (2.44m)
(2.3)
12ft (3.66m)
(2.4)
16ft (4.88m)
(2.5)
For each L-header assembly tested, the ultimate test moment was compared to the
nominal flexural strength as per the North American Specification for the Design of Cold-
17
Formed Steel Structural Members (CSA S136-07) and to the recommended nominal gravity
flexural capacity as per the North American Standard for Cold-Formed Steel Framing -
Header Design (AISI S212-07). The nominal flexural strength as per Eq. (2.6), is based on
the flexural strength of the L-section(s) only, assuming the track sections do not contribute to
the strength of the assembly.
2.3.1 Double L-headers
As per the AISI - Header Design Standard (AISI, 2007), the nominal gravity flexural
strength (Mng) for L-header assemblies shall be calculated according to Eq. (2.6).
Mng = Sec Fy (2.6)
Where Fy is the yield strength of the steel and Sec is the effective elastic section modulus
calculated at f = Fy in the extreme compression fibers.
For double L-headers with a vertical depth of 8in. (203mm) or less, Eq. (2.6) shall be
directly used. For L-header assemblies with a vertical depth of greater than 8in. (203mm) and
with a span-to-vertical depth ratio equal to or greater than 10, Eq. (2.6) shall also be used.
However, for L-header assemblies with a vertical depth greater than 8” (203mm) and a span-
to-vertical depth ratio less than 10, the nominal flexural strength calculated as per Eq. (2.6)
shall be multiplied by 0.9.
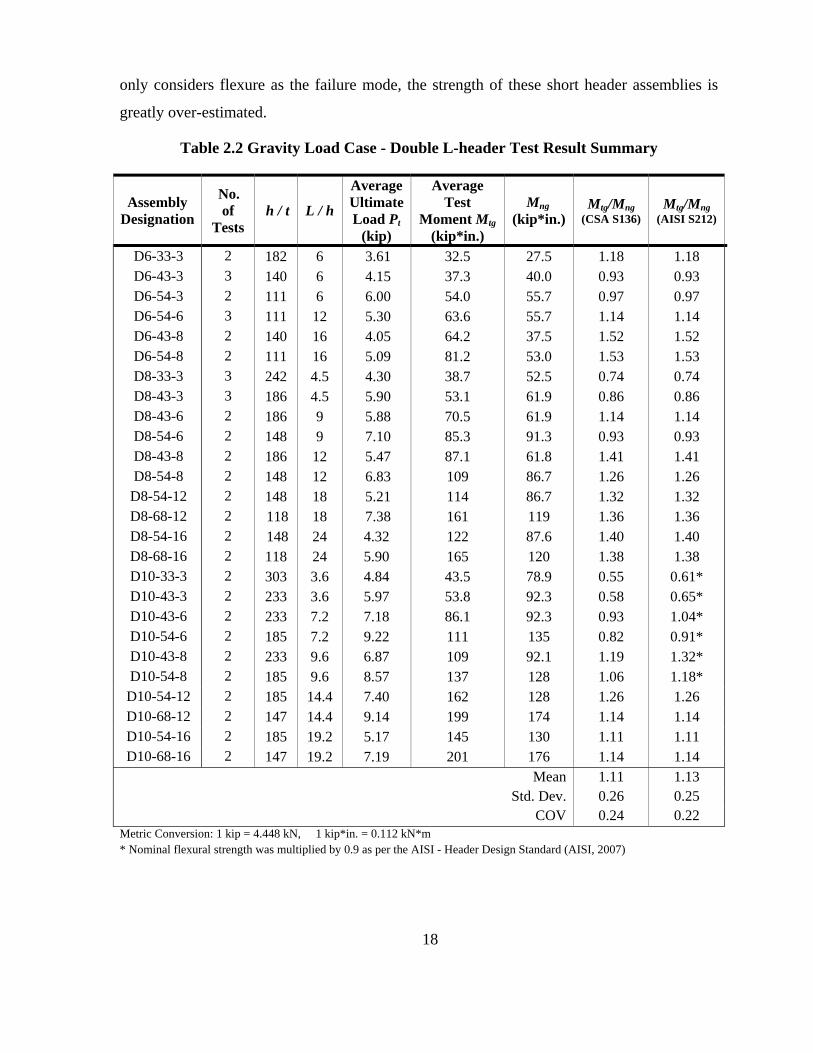
Actual measured mechanical properties were used in the calculation of the nominal
gravity flexural strength. Summarized in Table 2.2 are the results of the double L-header
gravity tests and the complete results are presented in Table B1 of Appendix B.
In general, the shortest and deepest L-header assemblies resulted in the lowest Mtg/Mng
ratios. Ratios of less than unity indicate the nominal flexural strength is over estimated. It
was apparent even after applying the 0.9 modification factor as per the AISI - Header Design
Standard, the nominal flexural strength is over-estimated for such short span assemblies. At
such short clear spans it is probable that web crippling and shear forces are influencing the
behavior of these assemblies. The cripple studs under the applied load are intended to
prevent web crippling from occurring; however, web crippling was evident in test assemblies
up to 6ft (1.83m) in length. Furthermore, the shortest L-header assemblies had span-to-depth
ratios ranged between 3.6 and 6, shear deformation typically becomes a design concern for
beams which have span-to-depth ratios of about 4. Given that the current design approach
18
only considers flexure as the failure mode, the strength of these short header assemblies is
greatly over-estimated.
Table 2.2 Gravity Load Case - Double L-header Test Result Summary
Assembly Designation
No. of
Tests h / t L / h
Average Ultimate Load Pt
(kip)
Average Test
Moment Mtg (kip*in.)
Mng (kip*in.)
Mtg/Mng (CSA S136)
Mtg/Mng (AISI S212)
D6-33-3 2 182 6 3.61 32.5 27.5 1.18 1.18 D6-43-3 3 140 6 4.15 37.3 40.0 0.93 0.93 D6-54-3 2 111 6 6.00 54.0 55.7 0.97 0.97 D6-54-6 3 111 12 5.30 63.6 55.7 1.14 1.14 D6-43-8 2 140 16 4.05 64.2 37.5 1.52 1.52 D6-54-8 2 111 16 5.09 81.2 53.0 1.53 1.53 D8-33-3 3 242 4.5 4.30 38.7 52.5 0.74 0.74 D8-43-3 3 186 4.5 5.90 53.1 61.9 0.86 0.86 D8-43-6 2 186 9 5.88 70.5 61.9 1.14 1.14 D8-54-6 2 148 9 7.10 85.3 91.3 0.93 0.93 D8-43-8 2 186 12 5.47 87.1 61.8 1.41 1.41 D8-54-8 2 148 12 6.83 109 86.7 1.26 1.26
D8-54-12 2 148 18 5.21 114 86.7 1.32 1.32 D8-68-12 2 118 18 7.38 161 119 1.36 1.36 D8-54-16 2 148 24 4.32 122 87.6 1.40 1.40 D8-68-16 2 118 24 5.90 165 120 1.38 1.38 D10-33-3 2 303 3.6 4.84 43.5 78.9 0.55 0.61* D10-43-3 2 233 3.6 5.97 53.8 92.3 0.58 0.65* D10-43-6 2 233 7.2 7.18 86.1 92.3 0.93 1.04* D10-54-6 2 185 7.2 9.22 111 135 0.82 0.91* D10-43-8 2 233 9.6 6.87 109 92.1 1.19 1.32* D10-54-8 2 185 9.6 8.57 137 128 1.06 1.18*
D10-54-12 2 185 14.4 7.40 162 128 1.26 1.26 D10-68-12 2 147 14.4 9.14 199 174 1.14 1.14 D10-54-16 2 185 19.2 5.17 145 130 1.11 1.11 D10-68-16 2 147 19.2 7.19 201 176 1.14 1.14
Mean 1.11 1.13 Std. Dev. 0.26 0.25
COV 0.24 0.22 Metric Conversion: 1 kip = 4.448 kN, 1 kip*in. = 0.112 kN*m * Nominal flexural strength was multiplied by 0.9 as per the AISI - Header Design Standard (AISI, 2007)
19
It can be observed from Table 2.2, as the span lengths increase, the Mtg/Mng ratios also
increase. Assemblies with a span-to-depth ratio (L/h) of approximately 9 have Mtg/Mng ratios
of close to unity. For assemblies with L/h ratios of less than 9, Mtg/Mng ratios are consistently
less than unity. Furthermore, as the L/h ratio increases beyond 9, the nominal flexural
strength calculated based on the AISI - Header Design Standard becomes conservative.
The slenderness ratio of the L-section (h/t) also tends to influence the nominal flexural
strength. Results indicate that the lowest Mtg/Mng ratios were obtained for short span
assemblies with large slenderness ratios. The tests indicated that these assemblies
experienced extensive local buckling, which causes the effective width to reduce and in
return lowering the flexural strength of the assembly. However, the theoretical nominal
flexural strength is calculated based on the effective section properties as per the North
American Specification (CSA, 2007), in which the maximum slenderness ratio of 60 is
greatly exceeded. It therefore becomes apparent that for unstiffened elements under stress
gradient that exceed the slenderness ratio criterion, the effective width calculation could be
perhaps over-estimated. As the slenderness ratio of L-header assemblies decreased, the
Mtg/Mng ratios increased closer to unity.
Flexural failure became increasingly predominant in long span assemblies. For such
assemblies the nominal flexural strength calculated as per the AISI - Header Design Standard
(AISI, 2007) resulted in accurate or underestimated strength values. Underestimated
strengths became increasingly frequent at spans greater than 8ft (2.44m). As a simplification,
the ultimate test moment was calculated based on pinned end connections. Pinned end-
connections have a theoretical rotational stiffness of zero. At spans of 8ft (2.44m) or greater,
it became evident that the connections between the L-sections and the king studs provided an
inherent stiffness; therefore, acting as semi-rigid connections rather than pinned end
connections. For semi-rigid connections, the end-fixity factor as given in Eq. (2.7) reflects
the relative stiffness of the end connections (Xu, 2001).
(2.7)
Where EIec/L is the effective flexural stiffness of the L-header(s) and R is the end
connection rotational stiffness. For pinned connections the end-fixity factor is zero (r = 0),
20
while rigid end connections have an end-fixity factor of one (r = 1). Semi-rigid members have
end-fixity factors ranging between zero and one. For members with a rotational stiffness
greater than zero, end moments can develop, which in return would lower the mid-span
moment and ultimately reduce the Mtg/Mng ratios. Although, without directly measuring the
rotation of the end connections, the magnitude of end moments developed cannot accurately
be predicted. Semi-rigid connections are further discussed in Section 2.5 with respect to
vertical deflections, end connection rotational stiffness’s are approximated based on
equations relating the end-fixity factor to the mid-span deflection.
Presented in Section 2.4 is a new design approach for gravity loaded double L-headers
which accounts for web crippling and shear affects in short spans and the increased resistance
of long spans due to semi-rigid connections.
2.3.2 Single L-headers
For single L-headers as per the AISI Header Design Standard (AISI, 2007), assemblies
with a vertical leg dimension of 6in. (152mm) or less, the nominal flexural strength shall be
calculated according to Eq. (2.6). For single L-headers with a vertical depth greater than 6in.
(152mm) but not greater than 8in. (203mm), the nominal flexural strength as per Eq. (2.6)
shall be multiplied by 0.9. Single L-headers with depths greater than 8in. (203mm) and/or
spans greater than 4ft (1.22m) are not covered in the AISI - Header Design Standard.
Assemblies tested which exceeded either of these limitations were calculated based on Eq.
(2.6) with no modification factor. Results of the single L-header gravity tests are summarized
in Table 2.3 and the complete results are presented in Table B2 of Appendix B. Actual
measured mechanical properties were used in the calculation of the nominal gravity flexural
strengths.
The results of the single L-header assemblies follow the same trend as the double L-
header assemblies. The short spans had the lowest Mtg/Mng ratios, as the spans increased the
Mtg/Mng ratios also increased. As with the double L-headers, assemblies with L/h ratios of 9
had Mtg/Mng ratios of approximately unity. Assemblies with L/h ratio of less than 9
consistently had Mtg/Mng less than unity. Assemblies with L/h ratios greater than 9 resulted in
underestimated nominal flexural strengths.
21
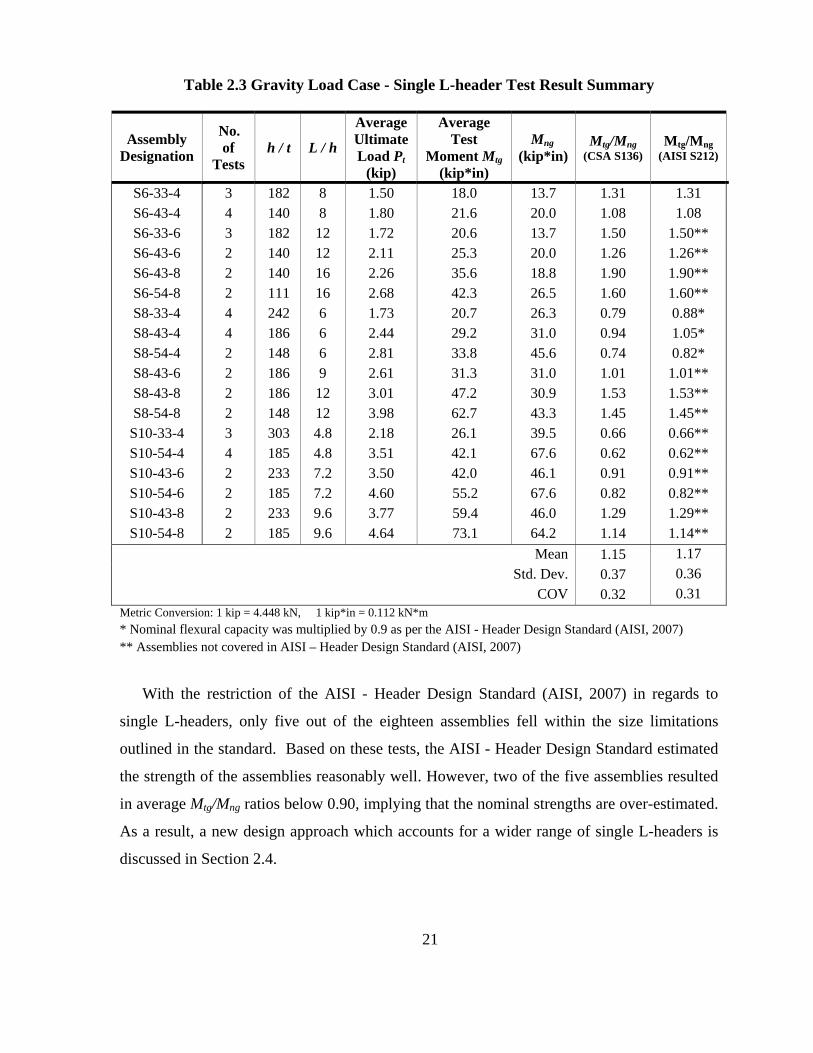
Table 2.3 Gravity Load Case - Single L-header Test Result Summary
Assembly Designation
No. of
Tests h / t L / h
Average Ultimate Load Pt
(kip)
Average Test
Moment Mtg (kip*in)
Mng (kip*in)
Mtg/Mng (CSA S136)
Mtg/Mng (AISI S212)
S6-33-4 3 182 8 1.50 18.0 13.7 1.31 1.31 S6-43-4 4 140 8 1.80 21.6 20.0 1.08 1.08 S6-33-6 3 182 12 1.72 20.6 13.7 1.50 1.50** S6-43-6 2 140 12 2.11 25.3 20.0 1.26 1.26** S6-43-8 2 140 16 2.26 35.6 18.8 1.90 1.90** S6-54-8 2 111 16 2.68 42.3 26.5 1.60 1.60** S8-33-4 4 242 6 1.73 20.7 26.3 0.79 0.88* S8-43-4 4 186 6 2.44 29.2 31.0 0.94 1.05* S8-54-4 2 148 6 2.81 33.8 45.6 0.74 0.82* S8-43-6 2 186 9 2.61 31.3 31.0 1.01 1.01** S8-43-8 2 186 12 3.01 47.2 30.9 1.53 1.53** S8-54-8 2 148 12 3.98 62.7 43.3 1.45 1.45** S10-33-4 3 303 4.8 2.18 26.1 39.5 0.66 0.66** S10-54-4 4 185 4.8 3.51 42.1 67.6 0.62 0.62** S10-43-6 2 233 7.2 3.50 42.0 46.1 0.91 0.91** S10-54-6 2 185 7.2 4.60 55.2 67.6 0.82 0.82** S10-43-8 2 233 9.6 3.77 59.4 46.0 1.29 1.29** S10-54-8 2 185 9.6 4.64 73.1 64.2 1.14 1.14**
Mean 1.15 1.17 Std. Dev. 0.37 0.36
COV 0.32 0.31 Metric Conversion: 1 kip = 4.448 kN, 1 kip*in = 0.112 kN*m * Nominal flexural capacity was multiplied by 0.9 as per the AISI - Header Design Standard (AISI, 2007) ** Assemblies not covered in AISI – Header Design Standard (AISI, 2007)
With the restriction of the AISI - Header Design Standard (AISI, 2007) in regards to
single L-headers, only five out of the eighteen assemblies fell within the size limitations
outlined in the standard. Based on these tests, the AISI - Header Design Standard estimated
the strength of the assemblies reasonably well. However, two of the five assemblies resulted
in average Mtg/Mng ratios below 0.90, implying that the nominal strengths are over-estimated.
As a result, a new design approach which accounts for a wider range of single L-headers is
discussed in Section 2.4.
22
2.3.3 Single L-headers vs. Double L-headers
Comparing the tested ultimate moment strength of single L-headers to that of equivalent
sized double L-headers, the single L-headers consistently had strengths of just over 50% of
the equivalent double L-header assembly. With the nominal flexural strength of the
assemblies calculated based solely on the section modulus of the L-section(s) alone, doubling
the section modulus for a double L-header assembly resulted in exactly double the theoretical
nominal flexural strength. However, the actual strength obtained from the test is to some
degree influenced by the top and bottom track sections; therefore, adding a second L-section
to the assembly did not exactly double the tested capacity. For this reason, the single L-
header assemblies resulted in slightly larger Mtg/Mng ratios compared to the same size double
L-header assembly.
2.3.4 Comparison to Previous NAHB L-header Tests
The testing procedure used at the University of Waterloo for the short span tests was
based on the testing conducted at the NAHB Research Center (NAHB-RC, 1998) and
(NAHB-RC, 2003). However, the long span tests conducted at the University of Waterloo
were loaded under multiple point loads, while two-point loading was used for the tests at the
NAHB Research Center.
In general, the results from the double L-headers tests conducted at the NAHB Research
Center were comparable to those conducted here at the University of Waterloo. For the short
span L-headers, the yield strength of the steel used in the NAHB Research Center tests were
lower. As a result, the average total load and maximum moment for these headers were
lower than those tested at the University of Waterloo. Nonetheless, comparisons of the
Mtg/Mng ratios show the results from the NAHB tests and those conducted at the University of
Waterloo were comparable, typically within 10% of each other. Two assemblies resulted in
ratios which vary considerably, both the D10-43-8 and D10-54-8 assemblies. For both
assemblies the ultimate total load and maximum moment obtained at the University of
Waterloo were considerably higher than those obtained at the NAHB Research Center.
For the long span headers where different loading configurations were implemented, the
average ultimate load at failure for the NAHB tests and University of Waterloo tests were
quite close. Although, the maximum test moments tended to be higher for the tests
23
conducted at the NAHB Research Center under the two-point loading configuration.
Complete comparisons of results are included in Table B3 in Appendix B. From a theoretical
stand point, in the case of pure flexural bending, the maximum moment at failure should be
independent of the loading configuration. To verify the maximum moment at failure does not
depend on the loading configuration, two additional assemblies were tested under two-point
loading rather than multi-point loading. As previously discussed in Section 1.4.3, under
equal total loads, two-point loading results in a higher maximum moment. Thus, in order for
the maximum moments to be equivalent, the ultimate load under two-point loading should be
slightly less than the ultimate load under multi-point loading. The results are summarized in
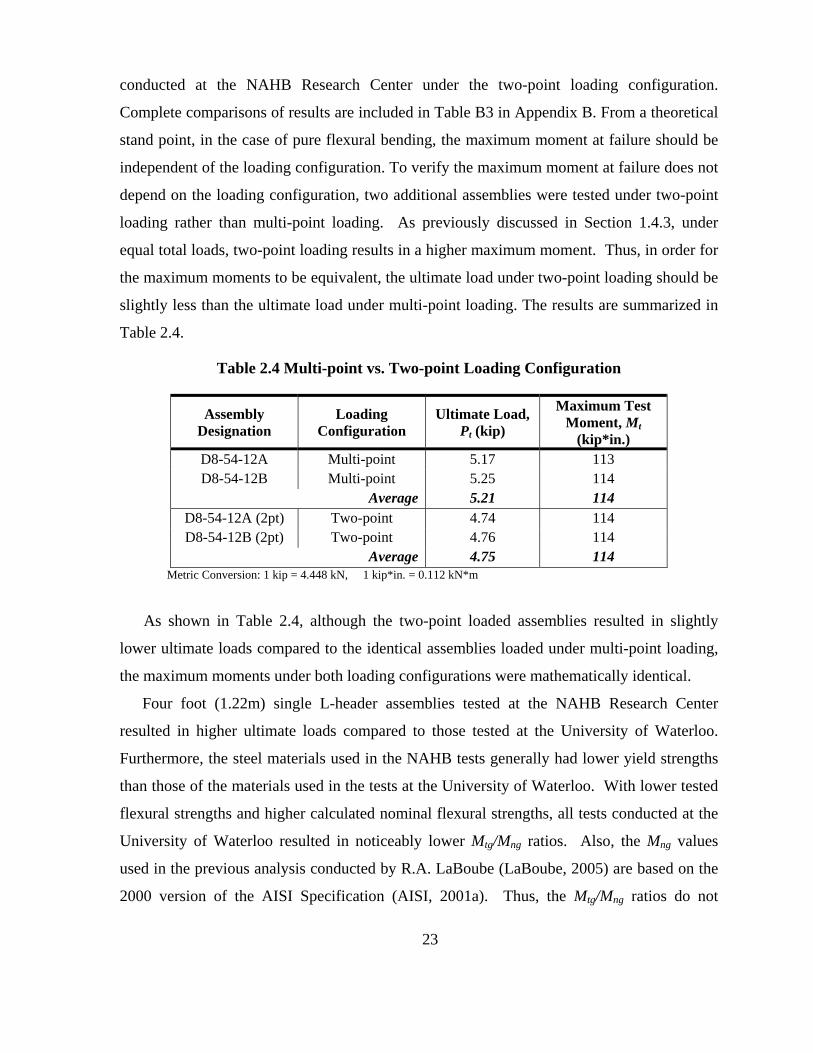
Table 2.4.
Table 2.4 Multi-point vs. Two-point Loading Configuration
Assembly Designation
Loading Configuration
Ultimate Load, Pt (kip)
Maximum Test Moment, Mt
(kip*in.) D8-54-12A Multi-point 5.17 113 D8-54-12B Multi-point 5.25 114
Average 5.21 114 D8-54-12A (2pt) Two-point 4.74 114 D8-54-12B (2pt) Two-point 4.76 114
Average 4.75 114 Metric Conversion: 1 kip = 4.448 kN, 1 kip*in. = 0.112 kN*m
As shown in Table 2.4, although the two-point loaded assemblies resulted in slightly
lower ultimate loads compared to the identical assemblies loaded under multi-point loading,
the maximum moments under both loading configurations were mathematically identical.
Four foot (1.22m) single L-header assemblies tested at the NAHB Research Center
resulted in higher ultimate loads compared to those tested at the University of Waterloo.
Furthermore, the steel materials used in the NAHB tests generally had lower yield strengths
than those of the materials used in the tests at the University of Waterloo. With lower tested
flexural strengths and higher calculated nominal flexural strengths, all tests conducted at the
University of Waterloo resulted in noticeably lower Mtg/Mng ratios. Also, the Mng values
used in the previous analysis conducted by R.A. LaBoube (LaBoube, 2005) are based on the
2000 version of the AISI Specification (AISI, 2001a). Thus, the Mtg/Mng ratios do not
24
exactly correlate with results obtained in this current investigation. Complete comparisons of
the results for the single L-header assemblies are included in Table B4 of Appendix B.
2.4 PROPOSED FLEXURAL STRENGTH DESIGN EQUATIONS
Under gravity loads, both single and double L-headers were observed to fail under
combined web-crippling, shear, and bending or pure bending. The current AISI – Header
Design Standard (AISI, 2007) provisions make a simplification by assuming the strength of
the assemblies is solely based on the flexural strength of the L-headers alone and do not take
into consideration the effect of web-crippling or shear in the overall strength of the L-header
assembly. It was found in this investigation that the current design provisions become
conservative for long spans. The inherent rotational stiffness of the end-connections makes
the assembly act as semi-rigid members. Comparison between the tests of this study and the
current design provisions indicate a new design methodology is desirable.
In an effort to be consistent with the current design provisions, the new strength equations
are based solely on the flexural strength of the L-shaped sections alone. However a
modification factor is applied to the flexural strength to account for the influence of web-
crippling and shear effects for short span assemblies, and the apparent end-connection
rotational stiffness of the long span assemblies.
As previously discussed, the ratio of the tested moment to the nominal flexural strength
(Mtg/Mng) of the L-header assemblies were found to generally be effected by the slenderness
ratio of the web section (h/t), and span-to-depth ratio (L/h) of the assemblies. Therefore, the
proposed flexural strength design equations are based on four major parameters. These four
parameters are: effective elastic section modulus (Sec), yield strength (fy), span-to-depth ratio
(L/h), and web slenderness ratio (h/t). Both the effective section modulus and yield strength
have a direct influence on the flexural strength of the assemblies. However, the span-to-
depth ratio and web slenderness ratio are indirectly related to the flexural strength, and seem
to be good indicators of other behaviors besides flexural behavior that are ultimately causing
failure of the assemblies. Equations (2.8) and (2.9) are proposed as the new nominal flexural
strength (Mng) determination equations for double and single L-headers, respectively.
25
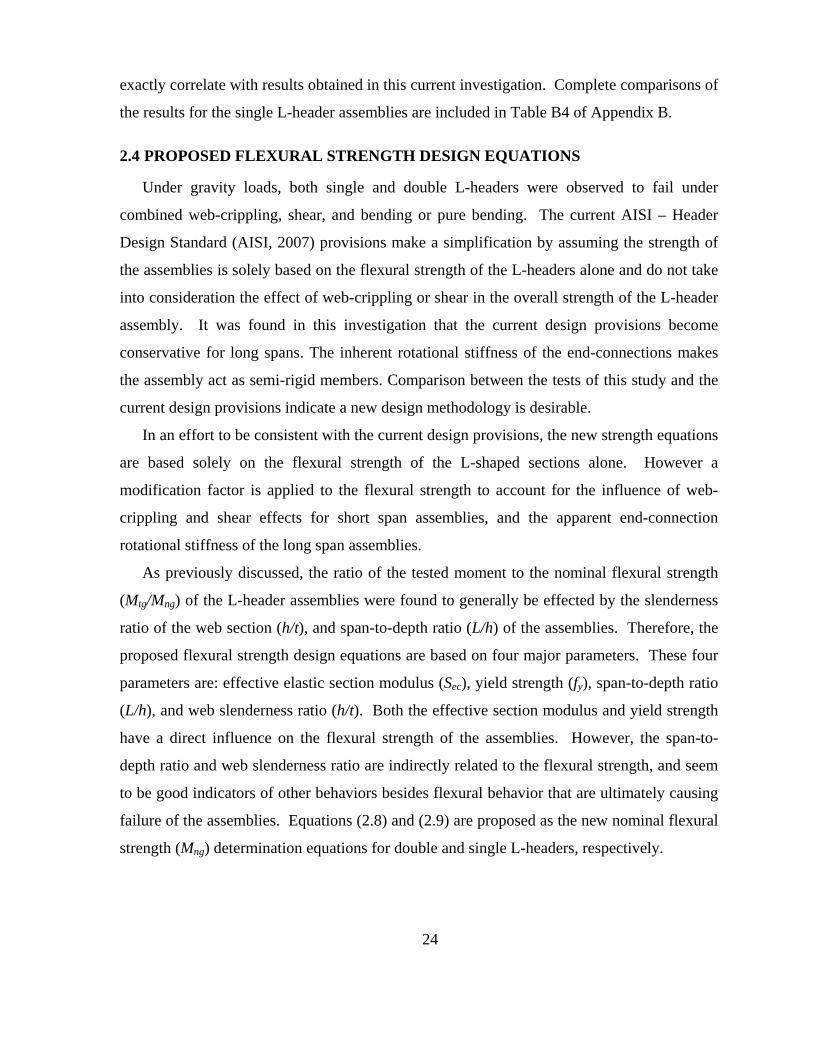
For double L-headers:
(2.8)
and for single L-headers:
(2.9)
Where Sec is the effective section modulus computed at (f = Fy) of the extreme
compression flange, Fy is the yield strength, L is the span length, h is the vertical depth of the
L-section(s), and t is the thickness of L-section(s). The equations take the same general form
as the web crippling equations currently used in the North American Specification for the
Design of Cold-Formed Steel Structural Members (CSA, 2007). The bracketed terms can be
thought as of correction factors, the first being a span-to-depth correction factor and the
second a web slenderness correction factor. As indicated by Eq. (2.9) the slenderness ratio
(h/t) correction factor for single L-header was found to have an insignificant effect on the
strength and therefore is not required in the nominal flexural strength determination equation.
The empirical equations were determined using a statistical analysis software package known
as Statistical Analysis System (SAS, 2004). SAS is a powerful statistical analysis program
which allows a non-linear multivariable model to be specified and coefficients that cause the
fitted curve to minimize the sum of the squares of the residuals can be determined.
The empirical coefficients for the double L-header predictor equation were determined
based on 56 tests conducted at the University of Waterloo, and 42 tests previously conducted
at the NAHB Research Center on double L-headers (NAHB-RC, 1998). Summarized in
Table B5 of Appendix B is a comparison of the actual and predicted flexural strengths.
The empirical coefficients for single L-header predictor equation were determined based
on 48 tests conducted at the University of Waterloo. Table B6 in Appendix B summarizes
the actual and predicted flexural capacities for single L-headers. Results from previous tests
conducted at the NAHB Research Center (NAHB-RC, 2003) were not included since they
were analyzed using the 2000 version of the AISI Specification (AISI, 2001a), thus the
Mtg/Mng ratios did not correlate with results obtained in this current investigation.
26
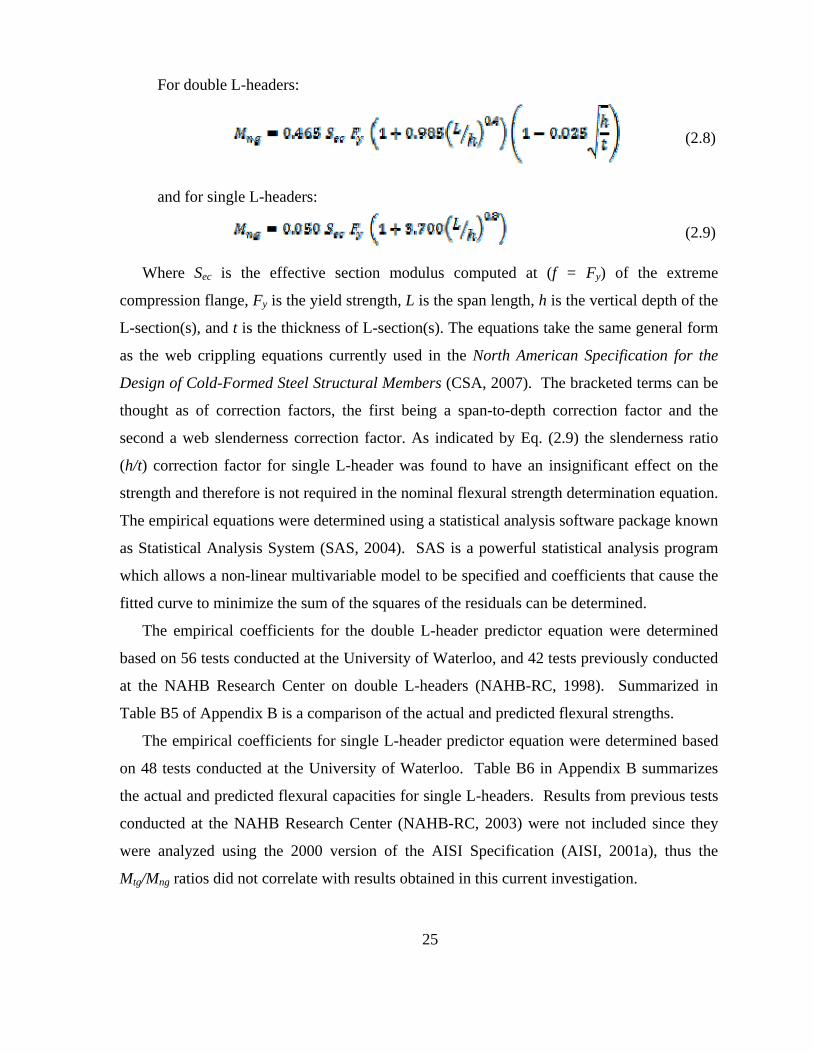
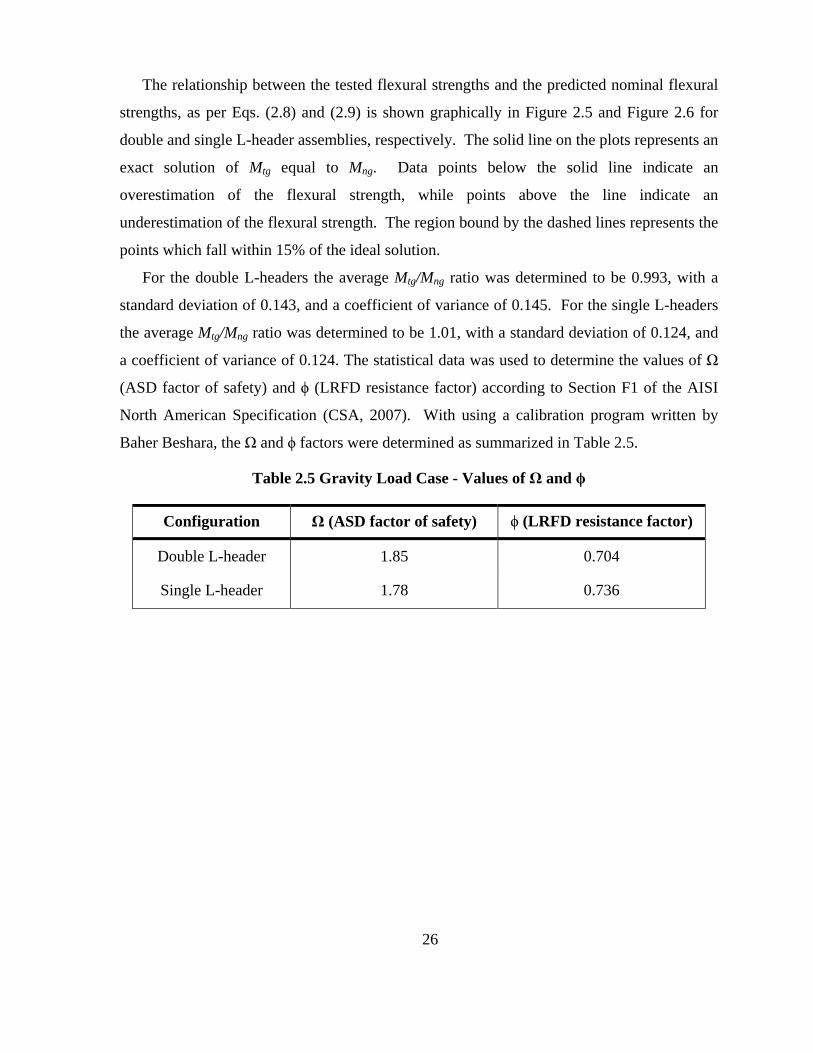
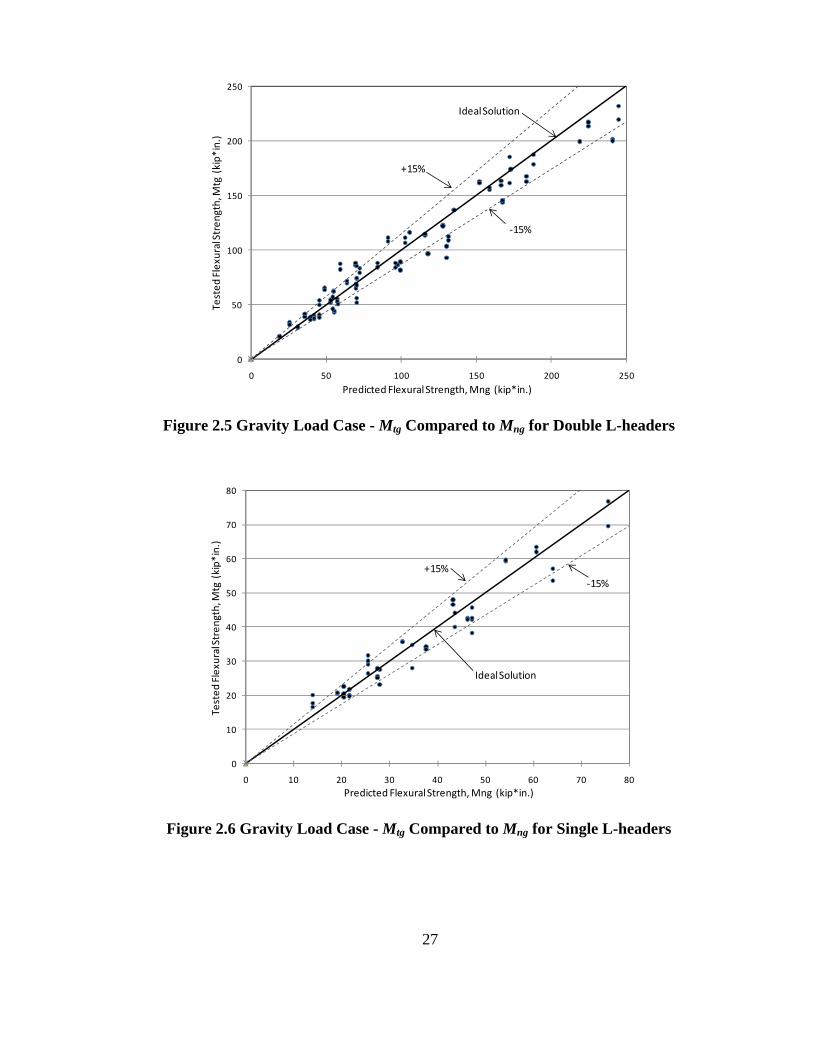
The relationship between the tested flexural strengths and the predicted nominal flexural
strengths, as per Eqs. (2.8) and (2.9) is shown graphically in Figure 2.5 and Figure 2.6 for
double and single L-header assemblies, respectively. The solid line on the plots represents an
exact solution of Mtg equal to Mng. Data points below the solid line indicate an
overestimation of the flexural strength, while points above the line indicate an
underestimation of the flexural strength. The region bound by the dashed lines represents the
points which fall within 15% of the ideal solution.
For the double L-headers the average Mtg/Mng ratio was determined to be 0.993, with a
standard deviation of 0.143, and a coefficient of variance of 0.145. For the single L-headers
the average Mtg/Mng ratio was determined to be 1.01, with a standard deviation of 0.124, and
a coefficient of variance of 0.124. The statistical data was used to determine the values of Ω
(ASD factor of safety) and ϕ (LRFD resistance factor) according to Section F1 of the AISI
North American Specification (CSA, 2007). With using a calibration program written by
Baher Beshara, the Ω and ϕ factors were determined as summarized in Table 2.5.
Table 2.5 Gravity Load Case - Values of Ω and ϕ
Configuration Ω (ASD factor of safety) ϕ (LRFD resistance factor)
Double L-header 1.85 0.704
Single L-header 1.78 0.736
27
0
50
100
150
200
250
0 50 100 150 200 250
Tested
Flexural Stren
gth, Mtg (kip*
in.)
Predicted Flexural Strength, Mng (kip*in.)
‐15%
Ideal Solution
+15%
Figure 2.5 Gravity Load Case - Mtg Compared to Mng for Double L-headers
0
10
20
30
40
50
60
70
80
0 10 20 30 40 50 60 70 80
Tested
Flexural Stren
gth, Mtg (kip*
in.)
Predicted Flexural Strength, Mng (kip*in.)
+15%‐15%
Ideal Solution
Figure 2.6 Gravity Load Case - Mtg Compared to Mng for Single L-headers
28
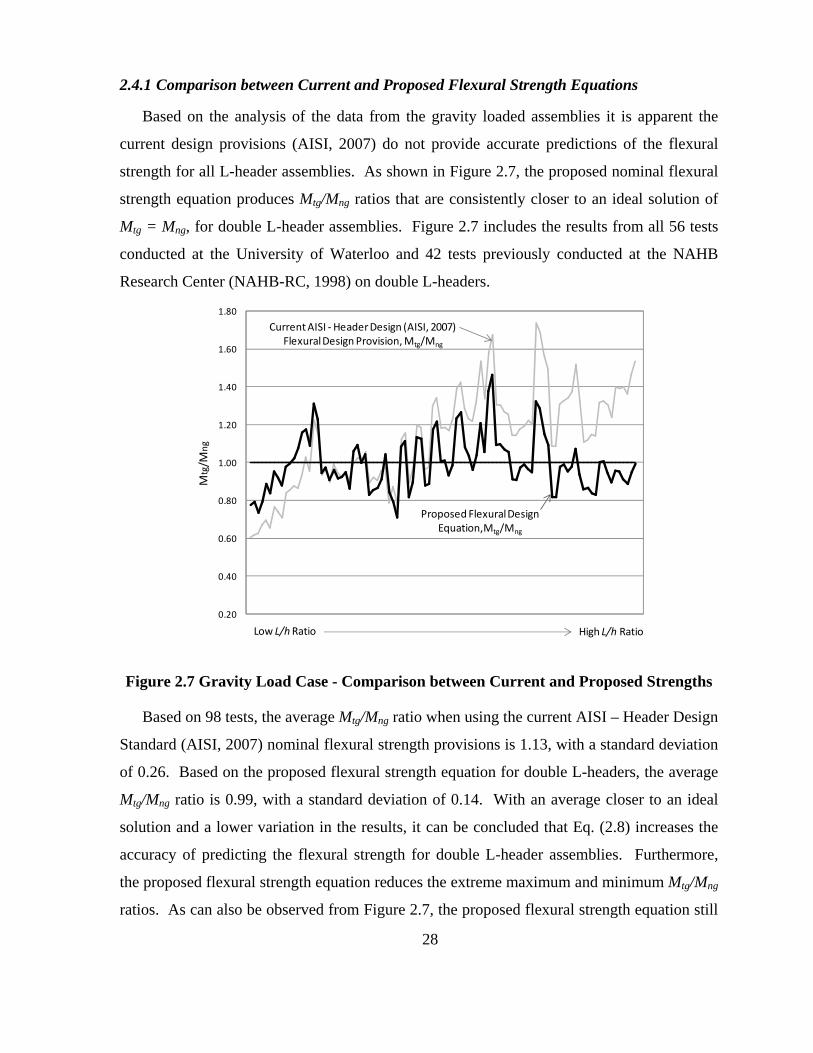
2.4.1 Comparison between Current and Proposed Flexural Strength Equations
Based on the analysis of the data from the gravity loaded assemblies it is apparent the
current design provisions (AISI, 2007) do not provide accurate predictions of the flexural
strength for all L-header assemblies. As shown in Figure 2.7, the proposed nominal flexural
strength equation produces Mtg/Mng ratios that are consistently closer to an ideal solution of
Mtg = Mng, for double L-header assemblies. Figure 2.7 includes the results from all 56 tests
conducted at the University of Waterloo and 42 tests previously conducted at the NAHB
Research Center (NAHB-RC, 1998) on double L-headers.
0.20
0.40
0.60
0.80
1.00
1.20
1.40
1.60
1.80
Mtg/M
ng
Current AISI ‐Header Design (AISI, 2007) Flexural Design Provision, Mtg/Mng
Proposed FlexuralDesign Equation,Mtg/Mng
Low L/hRatio High L/h Ratio
Figure 2.7 Gravity Load Case - Comparison between Current and Proposed Strengths
Based on 98 tests, the average Mtg/Mng ratio when using the current AISI – Header Design
Standard (AISI, 2007) nominal flexural strength provisions is 1.13, with a standard deviation
of 0.26. Based on the proposed flexural strength equation for double L-headers, the average
Mtg/Mng ratio is 0.99, with a standard deviation of 0.14. With an average closer to an ideal
solution and a lower variation in the results, it can be concluded that Eq. (2.8) increases the
accuracy of predicting the flexural strength for double L-header assemblies. Furthermore,
the proposed flexural strength equation reduces the extreme maximum and minimum Mtg/Mng
ratios. As can also be observed from Figure 2.7, the proposed flexural strength equation still
29
somewhat over-estimates the nominal flexural strength of assemblies with low span-to-depth
ratios; however, the degree of over-estimation is reduced considerably. At large span-to-
depth ratios the proposed flexural strength equation drastically increases the accuracy of the
predicted flexural strength compared to the current AISI – Header Design Standard
provisions.
2.5 DEFLECTION – SERVICEABILITY LIMIT STATE
Previous testing of L-header assemblies has provided limited deflection data. As a result,
the current AISI - Header Design Standard (AISI, 2007) does not provide any guidance with
regards to deflection computations. In an effort to further understand the behavior of L-
headers and to provide future design guidance, vertical deflections were measured for each of
the L-header test assemblies.
Generally, headers are designed to meet a minimum deflection criterion of L/240 under
service loads. The L/240 deflection criterion is a rather lenient limitation, often stricter
deflection requirements are necessary depending on the specific design protocol. For each L-
header assembly tested the vertical deflection at mid-span was compared to the L/240 limit at
60% of the ultimate load. Sixty percent of the ultimate load was used as an approximation of
the service load level.
2.5.1 Short Span L-headers
For the short span assemblies the mid-span deflection was measured using a linear
variable differential transformer (LVDT) which was attached to the actuator applying the
load to the assemblies. Thus, the deflection reading was an indication of the deflection of the
top of the assembly. Since localized web crippling and shear was observed for the short
spans it was anticipated the deflection readings of the top track would be greater than the
mid-span bottom track readings. Furthermore, from a general perspective deflections of such
assemblies are typically a greater concern when dealing with objects beneath the header
assemblies; therefore, the deflection of the bottom track is of importance. In an effort to
determine whether the bottom track was less susceptible to deflections three 3ft (0.91m) and
four 4ft (1.22m) assemblies were retested with linear motion transducers attached to the mid-
span of the bottom track. From the retests (D6-43-3C, D8-33-3C, D8-43-3C, S6-33-4C, S8-
30
43-4D, S10-33-4C, and S10-54-4D) it became evident that the deflections for the bottom
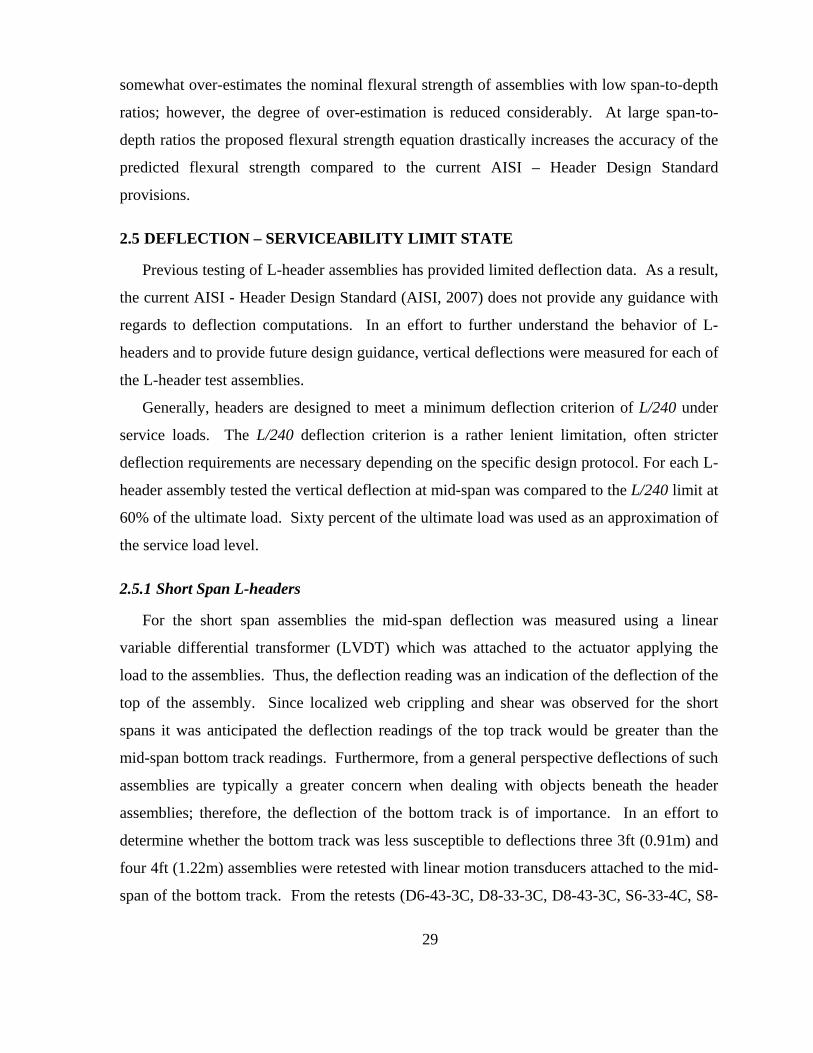
track was less than the deflections of the top of the assembly. Complete deflection results for
the short span assemblies are provided in Tables B7 and B9 of Appendix B. Theoretically,
the deflection at the bottom of the assembly is less than the deflection of the top at the
loading point because the deflection of the top includes the portion the L-section which
crushes until contact is made with the top of the cripple stud, as shown in Figure 2.8.
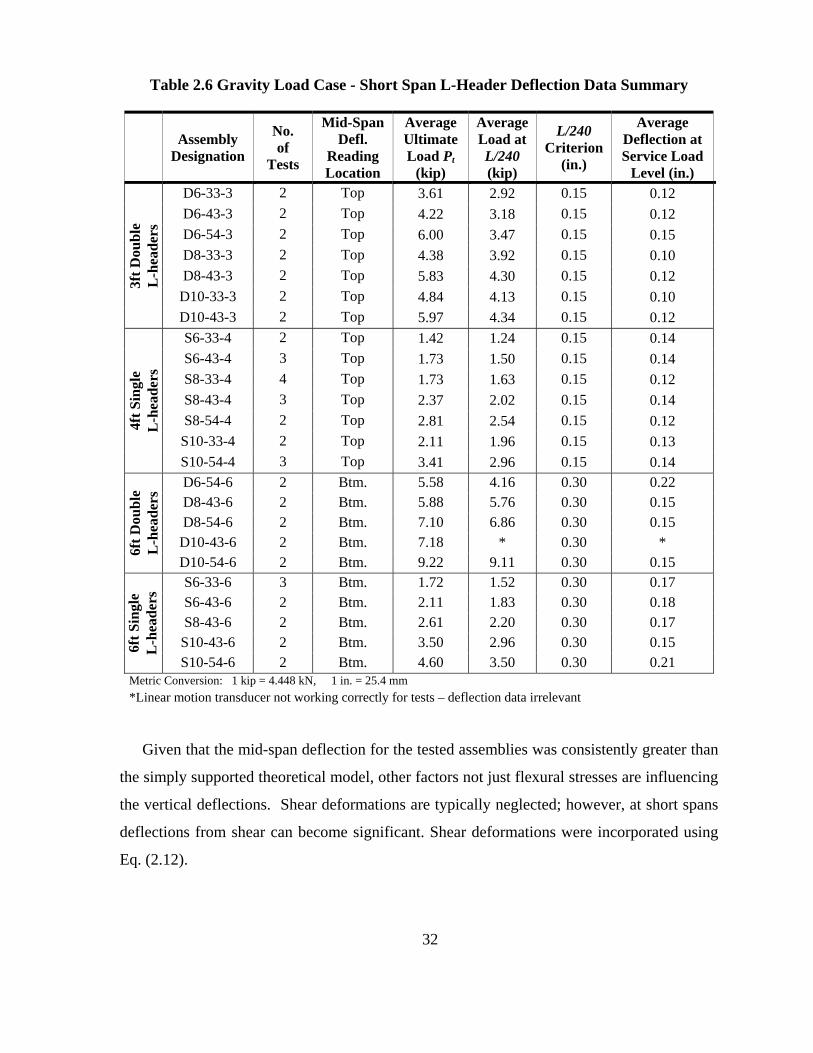
Even the span deflections measured on the top of the assemblies at service load levels
(60% of ultimate load), for each short span L-header assembly were typically less than the
L/240 criterion, as summarized in Table 2.6.
Average deflections for the 3ft (0.91m) and 4ft (1.22m) assemblies listed in Table 2.6 are
of the top of the assembly, the retests of the bottom track deflections are not included in the
averages. Span deflections for the 6ft (1.83m) assemblies are of the bottom track.
Figure 2.8 Gravity Load Case - Crushed Portion of L-header
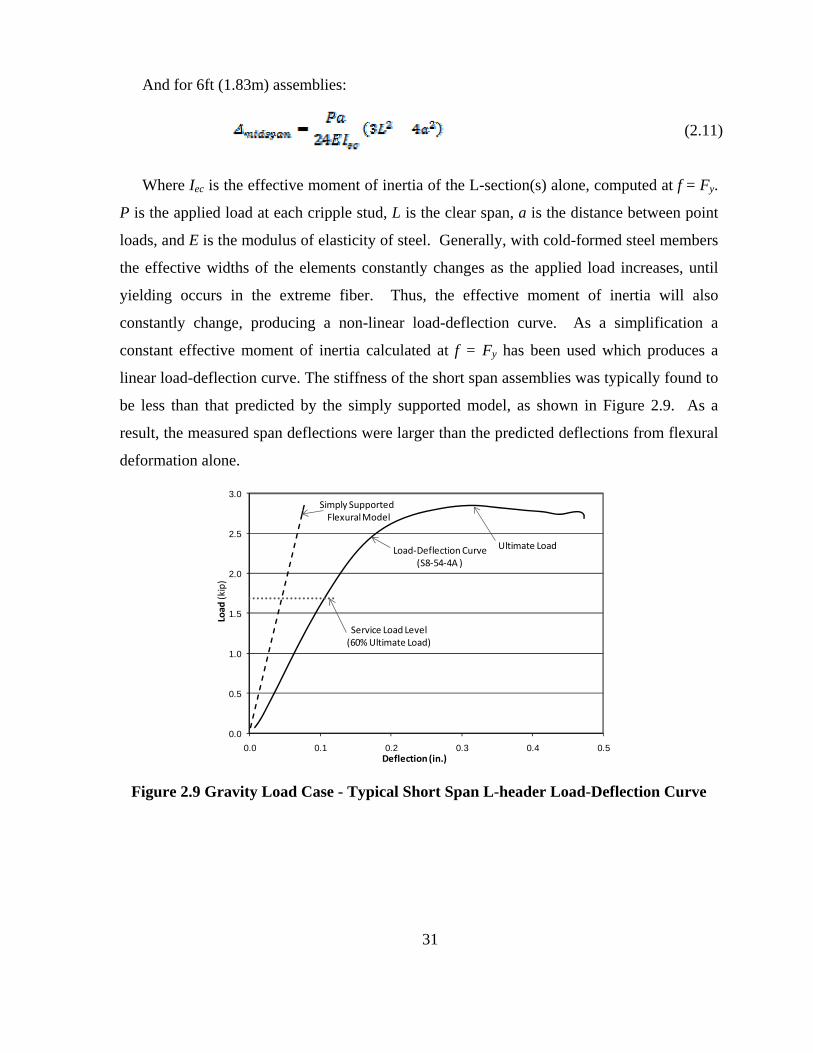
Mid-span load-deflection curves for each assembly were compared to a predicted simply
supported flexural deformation curve, as per Eqs. (2.10) and (2.11).
For 3ft (0.91m) and 4ft (1.22m) assemblies:
(2.10)
31
And for 6ft (1.83m) assemblies:
(2.11)
Where Iec is the effective moment of inertia of the L-section(s) alone, computed at f = Fy.
P is the applied load at each cripple stud, L is the clear span, a is the distance between point
loads, and E is the modulus of elasticity of steel. Generally, with cold-formed steel members
the effective widths of the elements constantly changes as the applied load increases, until
yielding occurs in the extreme fiber. Thus, the effective moment of inertia will also
constantly change, producing a non-linear load-deflection curve. As a simplification a
constant effective moment of inertia calculated at f = Fy has been used which produces a
linear load-deflection curve. The stiffness of the short span assemblies was typically found to
be less than that predicted by the simply supported model, as shown in Figure 2.9. As a
result, the measured span deflections were larger than the predicted deflections from flexural
deformation alone.
0.0
0.5
1.0
1.5
2.0
2.5
3.0
0.0 0.1 0.2 0.3 0.4 0.5
Load
(kip)
Deflection (in.)
Load‐Deflection Curve (S8‐54‐4A )
Simply Supported Flexural Model
Service Load Level(60% Ultimate Load)
Ultimate Load
Figure 2.9 Gravity Load Case - Typical Short Span L-header Load-Deflection Curve
32
Table 2.6 Gravity Load Case - Short Span L-Header Deflection Data Summary
Assembly
Designation
No. of
Tests
Mid-Span Defl.
Reading Location
Average Ultimate Load Pt
(kip)
Average Load at L/240 (kip)
L/240 Criterion
(in.)
Average Deflection at Service Load
Level (in.)
3ft D
oubl
e L
-hea
ders
D6-33-3 2 Top 3.61 2.92 0.15 0.12 D6-43-3 2 Top 4.22 3.18 0.15 0.12 D6-54-3 2 Top 6.00 3.47 0.15 0.15 D8-33-3 2 Top 4.38 3.92 0.15 0.10 D8-43-3 2 Top 5.83 4.30 0.15 0.12
D10-33-3 2 Top 4.84 4.13 0.15 0.10 D10-43-3 2 Top 5.97 4.34 0.15 0.12
4ft S
ingl
e L
-hea
ders
S6-33-4 2 Top 1.42 1.24 0.15 0.14 S6-43-4 3 Top 1.73 1.50 0.15 0.14 S8-33-4 4 Top 1.73 1.63 0.15 0.12 S8-43-4 3 Top 2.37 2.02 0.15 0.14 S8-54-4 2 Top 2.81 2.54 0.15 0.12 S10-33-4 2 Top 2.11 1.96 0.15 0.13 S10-54-4 3 Top 3.41 2.96 0.15 0.14
6ft D
oubl
e L
-hea
ders
D6-54-6 2 Btm. 5.58 4.16 0.30 0.22 D8-43-6 2 Btm. 5.88 5.76 0.30 0.15 D8-54-6 2 Btm. 7.10 6.86 0.30 0.15
D10-43-6 2 Btm. 7.18 * 0.30 * D10-54-6 2 Btm. 9.22 9.11 0.30 0.15
6ft S
ingl
e L
-hea
ders
S6-33-6 3 Btm. 1.72 1.52 0.30 0.17 S6-43-6 2 Btm. 2.11 1.83 0.30 0.18 S8-43-6 2 Btm. 2.61 2.20 0.30 0.17 S10-43-6 2 Btm. 3.50 2.96 0.30 0.15 S10-54-6 2 Btm. 4.60 3.50 0.30 0.21
Metric Conversion: 1 kip = 4.448 kN, 1 in. = 25.4 mm *Linear motion transducer not working correctly for tests – deflection data irrelevant
Given that the mid-span deflection for the tested assemblies was consistently greater than
the simply supported theoretical model, other factors not just flexural stresses are influencing
the vertical deflections. Shear deformations are typically neglected; however, at short spans
deflections from shear can become significant. Shear deformations were incorporated using
Eq. (2.12).
33
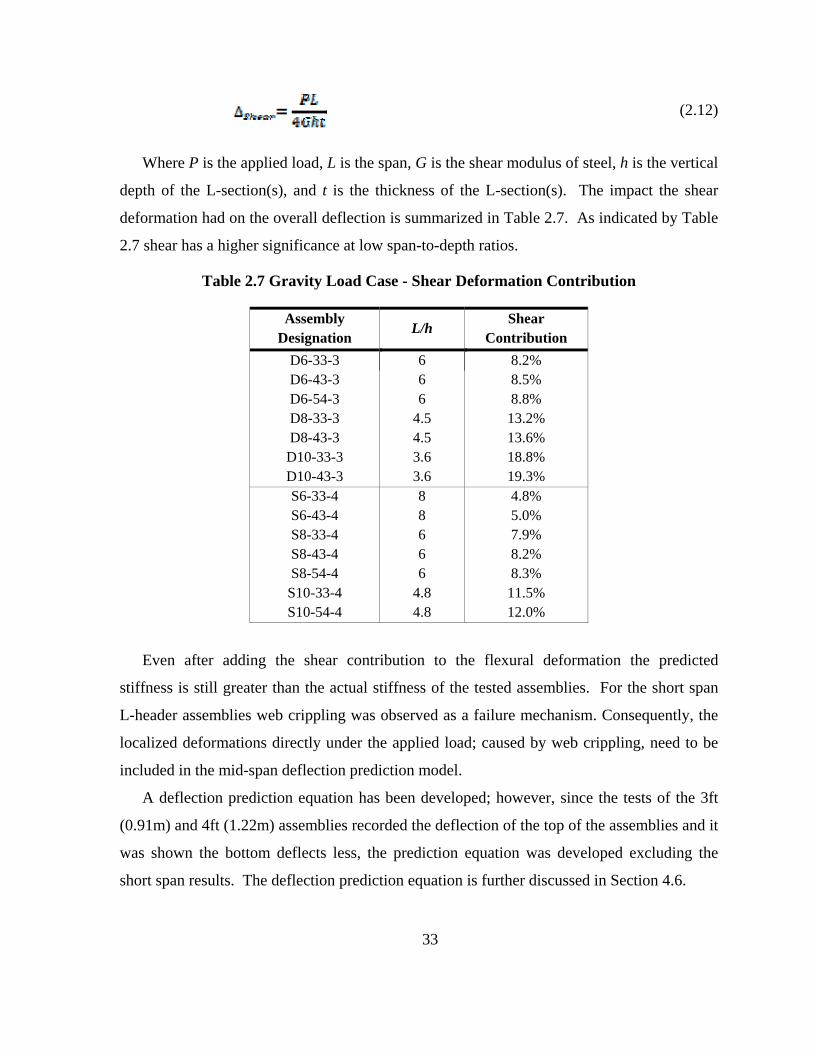
(2.12)
Where P is the applied load, L is the span, G is the shear modulus of steel, h is the vertical
depth of the L-section(s), and t is the thickness of the L-section(s). The impact the shear
deformation had on the overall deflection is summarized in Table 2.7. As indicated by Table
2.7 shear has a higher significance at low span-to-depth ratios.
Table 2.7 Gravity Load Case - Shear Deformation Contribution
Assembly Designation
L/h Shear
Contribution D6-33-3 6 8.2% D6-43-3 6 8.5% D6-54-3 6 8.8% D8-33-3 4.5 13.2% D8-43-3 4.5 13.6%
D10-33-3 3.6 18.8% D10-43-3 3.6 19.3% S6-33-4 8 4.8% S6-43-4 8 5.0% S8-33-4 6 7.9% S8-43-4 6 8.2% S8-54-4 6 8.3% S10-33-4 4.8 11.5% S10-54-4 4.8 12.0%
Even after adding the shear contribution to the flexural deformation the predicted
stiffness is still greater than the actual stiffness of the tested assemblies. For the short span
L-header assemblies web crippling was observed as a failure mechanism. Consequently, the
localized deformations directly under the applied load; caused by web crippling, need to be
included in the mid-span deflection prediction model.
A deflection prediction equation has been developed; however, since the tests of the 3ft
(0.91m) and 4ft (1.22m) assemblies recorded the deflection of the top of the assemblies and it
was shown the bottom deflects less, the prediction equation was developed excluding the
short span results. The deflection prediction equation is further discussed in Section 4.6.
34
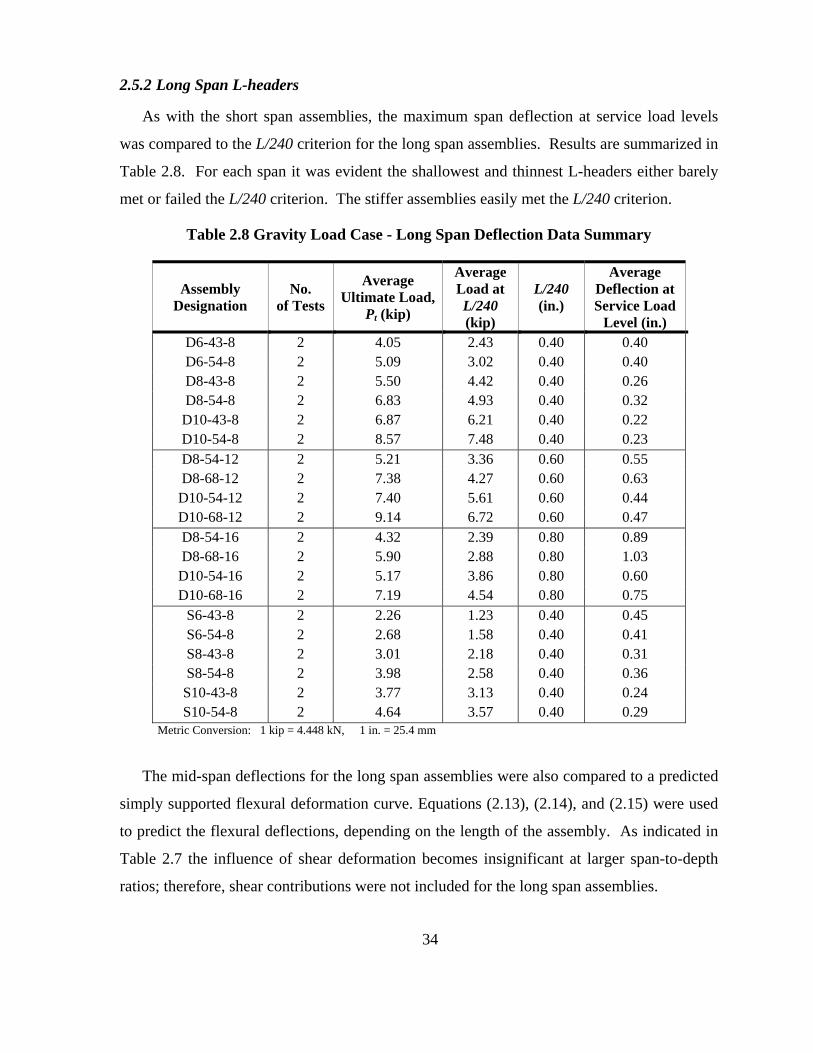
2.5.2 Long Span L-headers
As with the short span assemblies, the maximum span deflection at service load levels
was compared to the L/240 criterion for the long span assemblies. Results are summarized in
Table 2.8. For each span it was evident the shallowest and thinnest L-headers either barely
met or failed the L/240 criterion. The stiffer assemblies easily met the L/240 criterion.
Table 2.8 Gravity Load Case - Long Span Deflection Data Summary
Assembly Designation
No. of Tests
Average Ultimate Load,
Pt (kip)
Average Load at L/240 (kip)
L/240 (in.)
Average Deflection at Service Load
Level (in.) D6-43-8 2 4.05 2.43 0.40 0.40 D6-54-8 2 5.09 3.02 0.40 0.40 D8-43-8 2 5.50 4.42 0.40 0.26 D8-54-8 2 6.83 4.93 0.40 0.32
D10-43-8 2 6.87 6.21 0.40 0.22 D10-54-8 2 8.57 7.48 0.40 0.23 D8-54-12 2 5.21 3.36 0.60 0.55 D8-68-12 2 7.38 4.27 0.60 0.63
D10-54-12 2 7.40 5.61 0.60 0.44 D10-68-12 2 9.14 6.72 0.60 0.47 D8-54-16 2 4.32 2.39 0.80 0.89 D8-68-16 2 5.90 2.88 0.80 1.03
D10-54-16 2 5.17 3.86 0.80 0.60 D10-68-16 2 7.19 4.54 0.80 0.75
S6-43-8 2 2.26 1.23 0.40 0.45 S6-54-8 2 2.68 1.58 0.40 0.41 S8-43-8 2 3.01 2.18 0.40 0.31 S8-54-8 2 3.98 2.58 0.40 0.36
S10-43-8 2 3.77 3.13 0.40 0.24 S10-54-8 2 4.64 3.57 0.40 0.29
Metric Conversion: 1 kip = 4.448 kN, 1 in. = 25.4 mm
The mid-span deflections for the long span assemblies were also compared to a predicted
simply supported flexural deformation curve. Equations (2.13), (2.14), and (2.15) were used
to predict the flexural deflections, depending on the length of the assembly. As indicated in
Table 2.7 the influence of shear deformation becomes insignificant at larger span-to-depth
ratios; therefore, shear contributions were not included for the long span assemblies.
35
For 8ft (1.83m) assemblies:
(2.13)
for 12ft (3.66m) assemblies:
(2.14)
and for 16ft (4.88m) assemblies:
(2.15)
Where Iec is the effective moment of inertia of L-header(s) alone, computed at f = Fy. P is
the applied load at each cripple stud, L is the clear span, a is the distance between point
loads, and E is the modulus of elasticity of steel.
As with the short span assemblies the effective moment of inertia was taken as a constant,
calculated at f = Fy which produces a linear load-deflection curve. The stiffness of the long
span assemblies was typically found to be greater than that predicted value, as shown in
Figure 2.10 for a typical long span assembly. As a result, the measured span deflections
were smaller than the predicted deflections from flexural deformation alone.
The simply supported flexural predictor model is based on pinned end connections;
though, as previously discussed the end connections of the L-headers provide some degree of
end rotational restraint. Providing some degree of rotational restraint causes the L-headers to
behave as semi-rigid members. With semi-rigid end connections the mid-span deflection will
be less than predicted by the simply supported model. In order to accurately evaluate the
span deflections a semi-rigid prediction model was created to take into consideration the
rotational stiffness of the assemblies.
36
0.0
1.0
2.0
3.0
4.0
5.0
0.0 0.2 0.4 0.6 0.8 1.0 1.2 1.4 1.6
Force (kip)
Displacement (in.)
Simply Supported Flexural Model
Service Load Level
Ultimate LoadLoad‐DeflectionCurve(D6‐43‐8A)
Figure 2.10 Gravity Load Case - Typical Long Span L-header Load-Deflection Curve
Connection flexibility was modeled using a rotational spring of zero length, as shown in
Figure 2.11. Where the “@ symbol” represents the zero-length rotational spring, while R1
and R2 represent the stiffness of the springs.
Figure 2.11 Semi-rigid Beam Member (Xu, 2001)
The end-fixity factor as previously defined, by Eq. (2.7) reflects the relative stiffness of
the end connections (Xu, 2001). For pinned connections the end-fixity factor is zero (r = 0),
while rigid end connections have an end-fixity factor of one (r = 1). Semi-rigid connections
have end-fixity factors ranging between zero and one. As shown in Figure 2.12, the end-
fixity factor has a drastic influence on the mid-span deflection. As the fixity factor increases
from zero to one the mid-span deflection is considerably reduced, with a nearly linear
relationship.
37
Figure 2.12 Deflection vs. End-fixity Factor (Xu, 2001)
Given that the measured span deflection of the tested L-header assemblies is less than that
of a pinned end-connection, a certain end-fixity factor between (0 < r < 1) will cause the
stiffness of the test assembly to equal the stiffness of the semi-rigid prediction model at a
given point. As deflection evaluations are generally performed at the service load level, the
semi-rigid prediction model was calibrated based on the service load level (60% ultimate
load), as shown in Figure 2.13.
0.0
1.0
2.0
3.0
4.0
5.0
0.0 0.2 0.4 0.6 0.8 1.0 1.2 1.4 1.6
Force (kip)
Displacement (in.)
Load‐DeflectionCurve(D6‐43‐8A)
Semi‐Rigid Model(r = 0.11)
Service Load Level(60% Ultimate Load)
Ultimate Load
Figure 2.13 Gravity Load Case - Typical Semi-Rigid Deflection Model
The corresponding end-fixity factors were determined based on the deflection equations
for semi-rigid members. In order to evaluate the deflection of semi-rigid members, the
member end moments first need to be evaluated. The semi-rigid equations used to determine
38
the member end moments (M1 and M2) and mid-span deflection are shown in Figure 2.14.
The corresponding m-values are listed in Table 2.9 (Xu, 2001). Where P is the applied load
at a single cripple stud, and mi is the corresponding m value listed in Table 2.9 used in the
superposition method.
Semi-rigid Member with Concentrated Load(s)
Semi-rigid Member End-Moment Equation:
Semi-rigid Member Span Deflection Equation:
For ξ ≤ mi
For mi < ξ
Figure 2.14 Semi-rigid Deflection Equations
ξ = 0.5 (midspan)
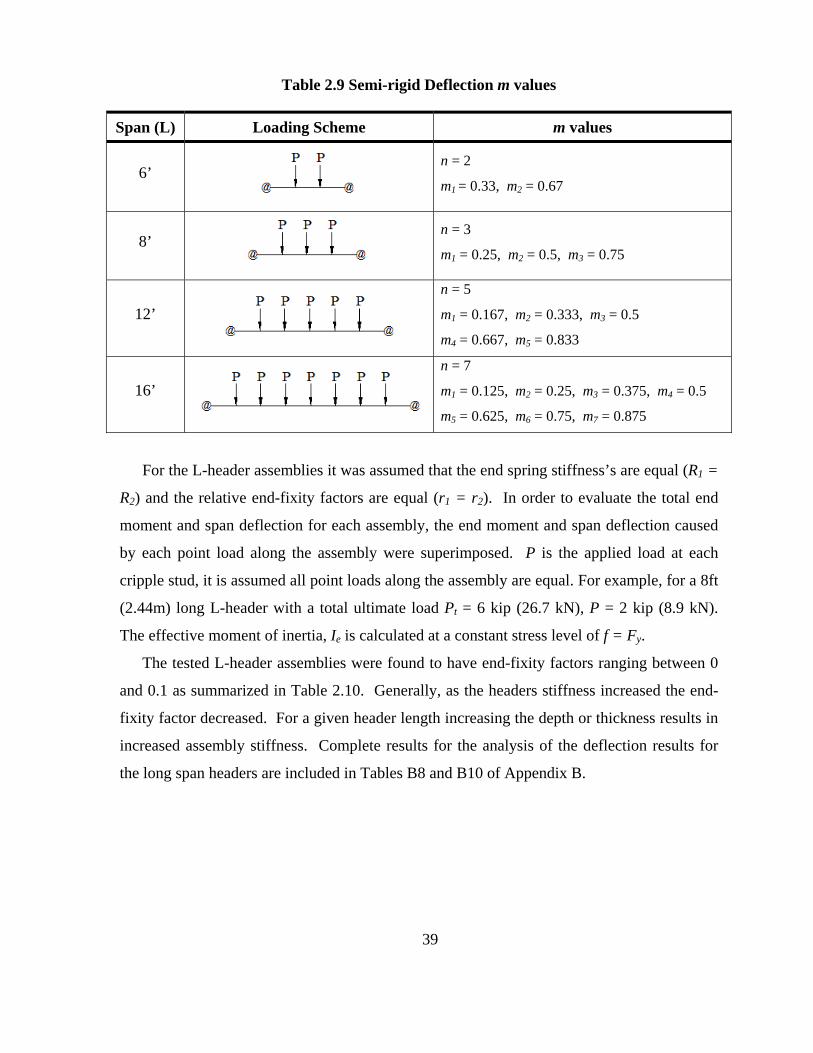
39
Table 2.9 Semi-rigid Deflection m values
Span (L) Loading Scheme m values
6’
n = 2
m1 = 0.33, m2 = 0.67
8’
n = 3
m1 = 0.25, m2 = 0.5, m3 = 0.75
12’
n = 5
m1 = 0.167, m2 = 0.333, m3 = 0.5
m4 = 0.667, m5 = 0.833
16’
n = 7
m1 = 0.125, m2 = 0.25, m3 = 0.375, m4 = 0.5
m5 = 0.625, m6 = 0.75, m7 = 0.875
For the L-header assemblies it was assumed that the end spring stiffness’s are equal (R1 =
R2) and the relative end-fixity factors are equal (r1 = r2). In order to evaluate the total end
moment and span deflection for each assembly, the end moment and span deflection caused
by each point load along the assembly were superimposed. P is the applied load at each
cripple stud, it is assumed all point loads along the assembly are equal. For example, for a 8ft
(2.44m) long L-header with a total ultimate load Pt = 6 kip (26.7 kN), P = 2 kip (8.9 kN).
The effective moment of inertia, Ie is calculated at a constant stress level of f = Fy.
The tested L-header assemblies were found to have end-fixity factors ranging between 0
and 0.1 as summarized in Table 2.10. Generally, as the headers stiffness increased the end-
fixity factor decreased. For a given header length increasing the depth or thickness results in
increased assembly stiffness. Complete results for the analysis of the deflection results for
the long span headers are included in Tables B8 and B10 of Appendix B.
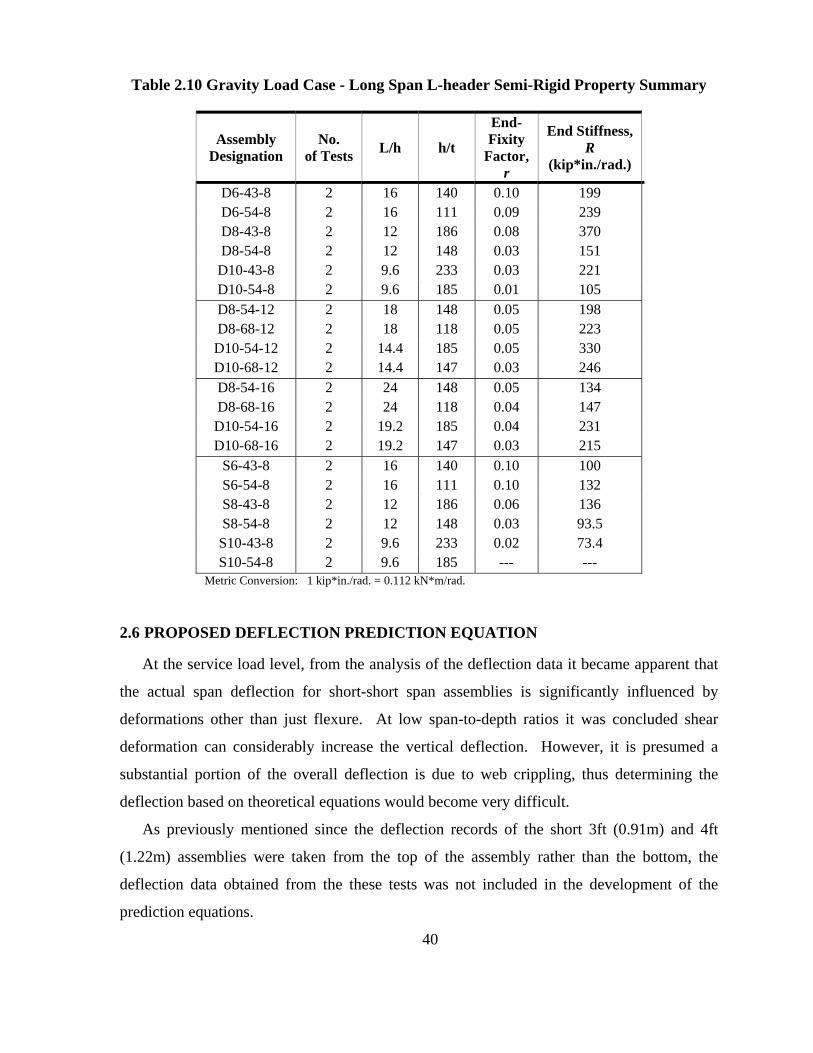
40
Table 2.10 Gravity Load Case - Long Span L-header Semi-Rigid Property Summary
Assembly Designation
No. of Tests L/h h/t
End-Fixity
Factor, r
End Stiffness, R
(kip*in./rad.)
D6-43-8 2 16 140 0.10 199 D6-54-8 2 16 111 0.09 239 D8-43-8 2 12 186 0.08 370 D8-54-8 2 12 148 0.03 151
D10-43-8 2 9.6 233 0.03 221 D10-54-8 2 9.6 185 0.01 105 D8-54-12 2 18 148 0.05 198 D8-68-12 2 18 118 0.05 223 D10-54-12 2 14.4 185 0.05 330 D10-68-12 2 14.4 147 0.03 246 D8-54-16 2 24 148 0.05 134 D8-68-16 2 24 118 0.04 147 D10-54-16 2 19.2 185 0.04 231 D10-68-16 2 19.2 147 0.03 215
S6-43-8 2 16 140 0.10 100 S6-54-8 2 16 111 0.10 132 S8-43-8 2 12 186 0.06 136 S8-54-8 2 12 148 0.03 93.5 S10-43-8 2 9.6 233 0.02 73.4 S10-54-8 2 9.6 185 --- ---
Metric Conversion: 1 kip*in./rad. = 0.112 kN*m/rad.
2.6 PROPOSED DEFLECTION PREDICTION EQUATION
At the service load level, from the analysis of the deflection data it became apparent that
the actual span deflection for short-short span assemblies is significantly influenced by
deformations other than just flexure. At low span-to-depth ratios it was concluded shear
deformation can considerably increase the vertical deflection. However, it is presumed a
substantial portion of the overall deflection is due to web crippling, thus determining the
deflection based on theoretical equations would become very difficult.
As previously mentioned since the deflection records of the short 3ft (0.91m) and 4ft
(1.22m) assemblies were taken from the top of the assembly rather than the bottom, the
deflection data obtained from the these tests was not included in the development of the
prediction equations.
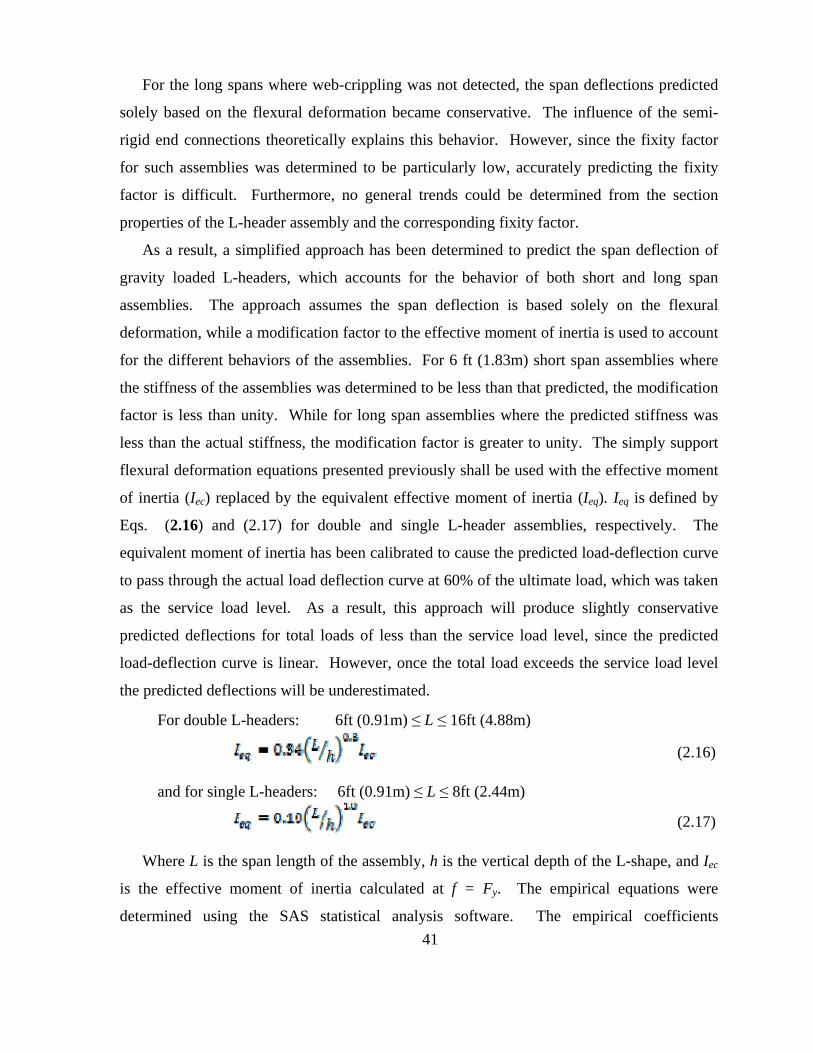
41
For the long spans where web-crippling was not detected, the span deflections predicted
solely based on the flexural deformation became conservative. The influence of the semi-
rigid end connections theoretically explains this behavior. However, since the fixity factor
for such assemblies was determined to be particularly low, accurately predicting the fixity
factor is difficult. Furthermore, no general trends could be determined from the section
properties of the L-header assembly and the corresponding fixity factor.
As a result, a simplified approach has been determined to predict the span deflection of
gravity loaded L-headers, which accounts for the behavior of both short and long span
assemblies. The approach assumes the span deflection is based solely on the flexural
deformation, while a modification factor to the effective moment of inertia is used to account
for the different behaviors of the assemblies. For 6 ft (1.83m) short span assemblies where
the stiffness of the assemblies was determined to be less than that predicted, the modification
factor is less than unity. While for long span assemblies where the predicted stiffness was
less than the actual stiffness, the modification factor is greater to unity. The simply support
flexural deformation equations presented previously shall be used with the effective moment
of inertia (Iec) replaced by the equivalent effective moment of inertia (Ieq). Ieq is defined by
Eqs. (2.16) and (2.17) for double and single L-header assemblies, respectively. The
equivalent moment of inertia has been calibrated to cause the predicted load-deflection curve
to pass through the actual load deflection curve at 60% of the ultimate load, which was taken
as the service load level. As a result, this approach will produce slightly conservative
predicted deflections for total loads of less than the service load level, since the predicted
load-deflection curve is linear. However, once the total load exceeds the service load level
the predicted deflections will be underestimated.
For double L-headers: 6ft (0.91m) ≤ L ≤ 16ft (4.88m)
(2.16)
and for single L-headers: 6ft (0.91m) ≤ L ≤ 8ft (2.44m)
(2.17)
Where L is the span length of the assembly, h is the vertical depth of the L-shape, and Iec
is the effective moment of inertia calculated at f = Fy. The empirical equations were
determined using the SAS statistical analysis software. The empirical coefficients
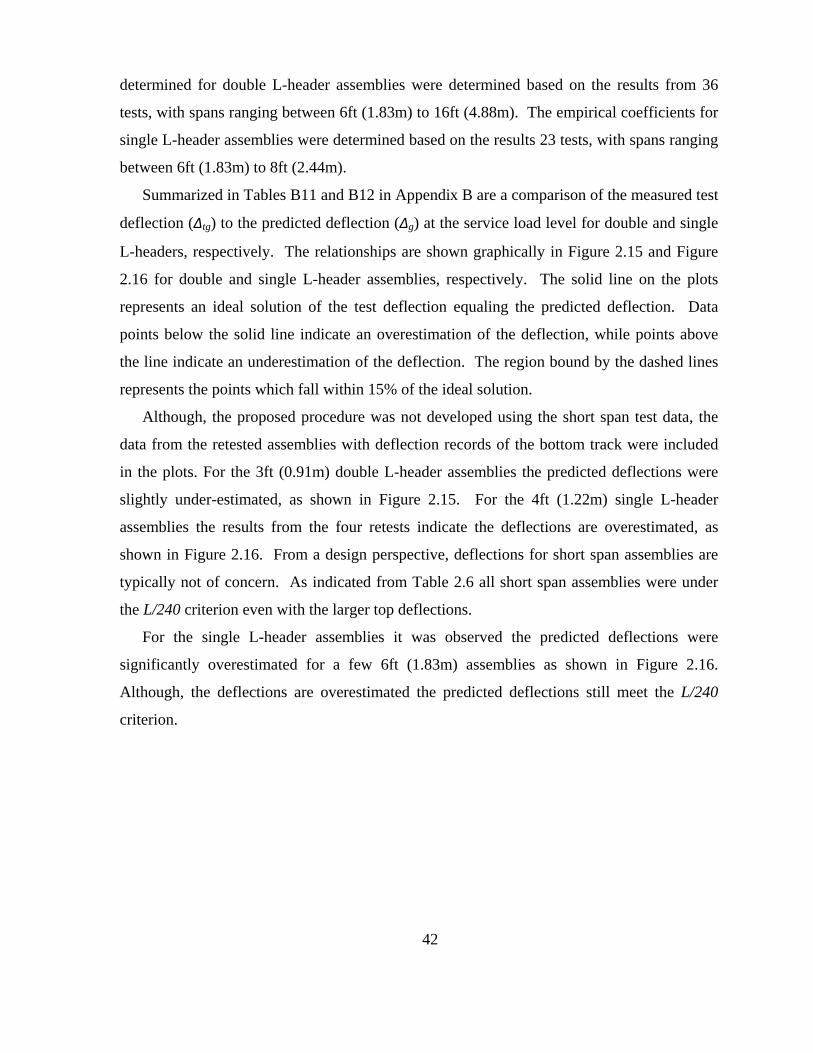
42
determined for double L-header assemblies were determined based on the results from 36
tests, with spans ranging between 6ft (1.83m) to 16ft (4.88m). The empirical coefficients for
single L-header assemblies were determined based on the results 23 tests, with spans ranging
between 6ft (1.83m) to 8ft (2.44m).
Summarized in Tables B11 and B12 in Appendix B are a comparison of the measured test
deflection (Δtg) to the predicted deflection (Δg) at the service load level for double and single
L-headers, respectively. The relationships are shown graphically in Figure 2.15 and Figure
2.16 for double and single L-header assemblies, respectively. The solid line on the plots
represents an ideal solution of the test deflection equaling the predicted deflection. Data
points below the solid line indicate an overestimation of the deflection, while points above
the line indicate an underestimation of the deflection. The region bound by the dashed lines
represents the points which fall within 15% of the ideal solution.
Although, the proposed procedure was not developed using the short span test data, the
data from the retested assemblies with deflection records of the bottom track were included
in the plots. For the 3ft (0.91m) double L-header assemblies the predicted deflections were
slightly under-estimated, as shown in Figure 2.15. For the 4ft (1.22m) single L-header
assemblies the results from the four retests indicate the deflections are overestimated, as
shown in Figure 2.16. From a design perspective, deflections for short span assemblies are
typically not of concern. As indicated from Table 2.6 all short span assemblies were under
the L/240 criterion even with the larger top deflections.
For the single L-header assemblies it was observed the predicted deflections were
significantly overestimated for a few 6ft (1.83m) assemblies as shown in Figure 2.16.
Although, the deflections are overestimated the predicted deflections still meet the L/240
criterion.
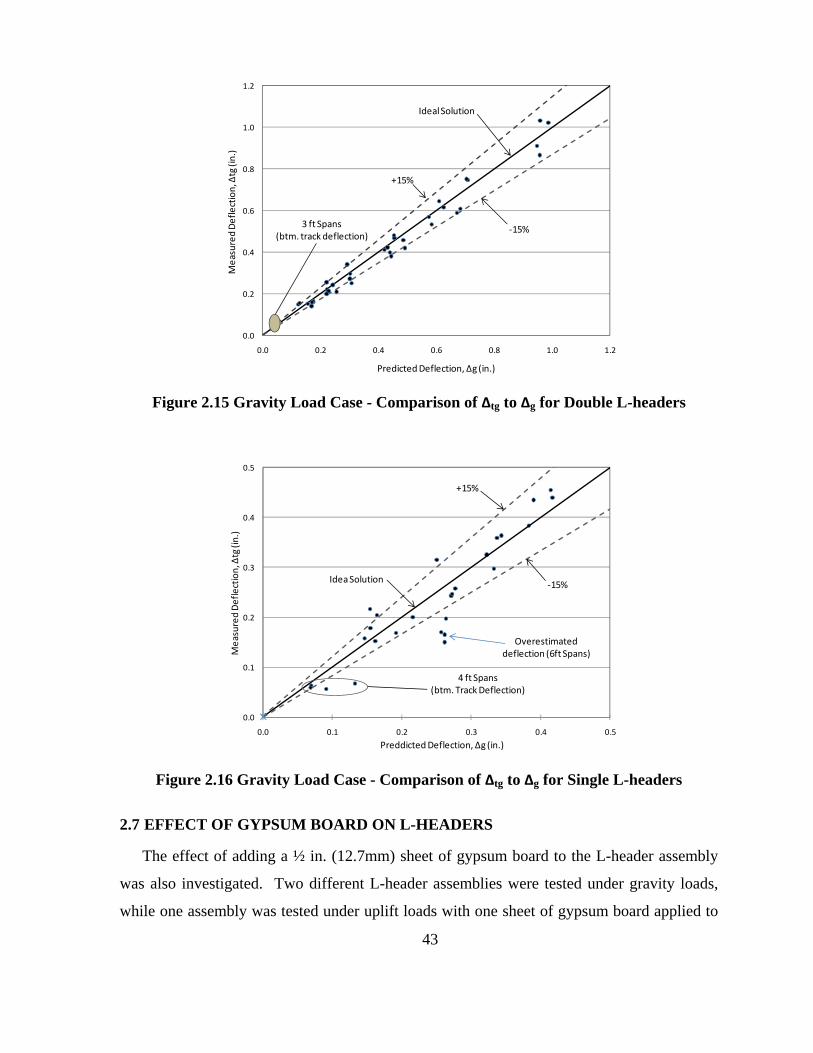
43
0.0
0.2
0.4
0.6
0.8
1.0
1.2
0.0 0.2 0.4 0.6 0.8 1.0 1.2
Measured Deflection, Δtg (in.)
Predicted Deflection, Δg (in.)
3 ft Spans(btm. track deflection)
Ideal Solution
+15%
‐15%
Figure 2.15 Gravity Load Case - Comparison of Δtg to Δg for Double L-headers
0.0
0.1
0.2
0.3
0.4
0.5
0.0 0.1 0.2 0.3 0.4 0.5
Measured Deflection, Δtg (in.)
Preddicted Deflection, Δg (in.)
4 ft Spans(btm. Track Deflection)
Overestimated deflection (6ft Spans)
+15%
Idea Solution ‐15%
Figure 2.16 Gravity Load Case - Comparison of Δtg to Δg for Single L-headers
2.7 EFFECT OF GYPSUM BOARD ON L-HEADERS
The effect of adding a ½ in. (12.7mm) sheet of gypsum board to the L-header assembly
was also investigated. Two different L-header assemblies were tested under gravity loads,
while one assembly was tested under uplift loads with one sheet of gypsum board applied to
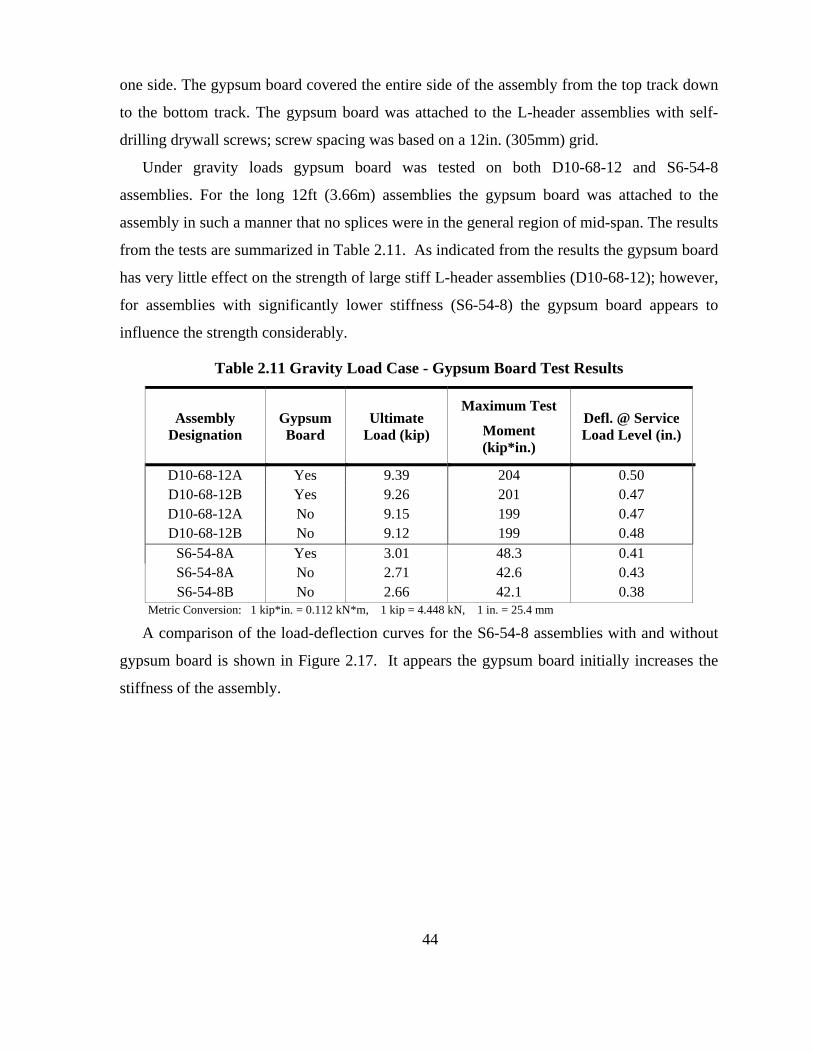
44
one side. The gypsum board covered the entire side of the assembly from the top track down
to the bottom track. The gypsum board was attached to the L-header assemblies with self-
drilling drywall screws; screw spacing was based on a 12in. (305mm) grid.
Under gravity loads gypsum board was tested on both D10-68-12 and S6-54-8
assemblies. For the long 12ft (3.66m) assemblies the gypsum board was attached to the
assembly in such a manner that no splices were in the general region of mid-span. The results
from the tests are summarized in Table 2.11. As indicated from the results the gypsum board
has very little effect on the strength of large stiff L-header assemblies (D10-68-12); however,
for assemblies with significantly lower stiffness (S6-54-8) the gypsum board appears to
influence the strength considerably.
Table 2.11 Gravity Load Case - Gypsum Board Test Results
Assembly Designation
Gypsum Board
Ultimate Load (kip)
Maximum Test
Moment (kip*in.)
Defl. @ Service Load Level (in.)
D10-68-12A Yes 9.39 204 0.50 D10-68-12B Yes 9.26 201 0.47 D10-68-12A No 9.15 199 0.47 D10-68-12B No 9.12 199 0.48
S6-54-8A Yes 3.01 48.3 0.41 S6-54-8A No 2.71 42.6 0.43 S6-54-8B No 2.66 42.1 0.38
Metric Conversion: 1 kip*in. = 0.112 kN*m, 1 kip = 4.448 kN, 1 in. = 25.4 mm A comparison of the load-deflection curves for the S6-54-8 assemblies with and without
gypsum board is shown in Figure 2.17. It appears the gypsum board initially increases the
stiffness of the assembly.
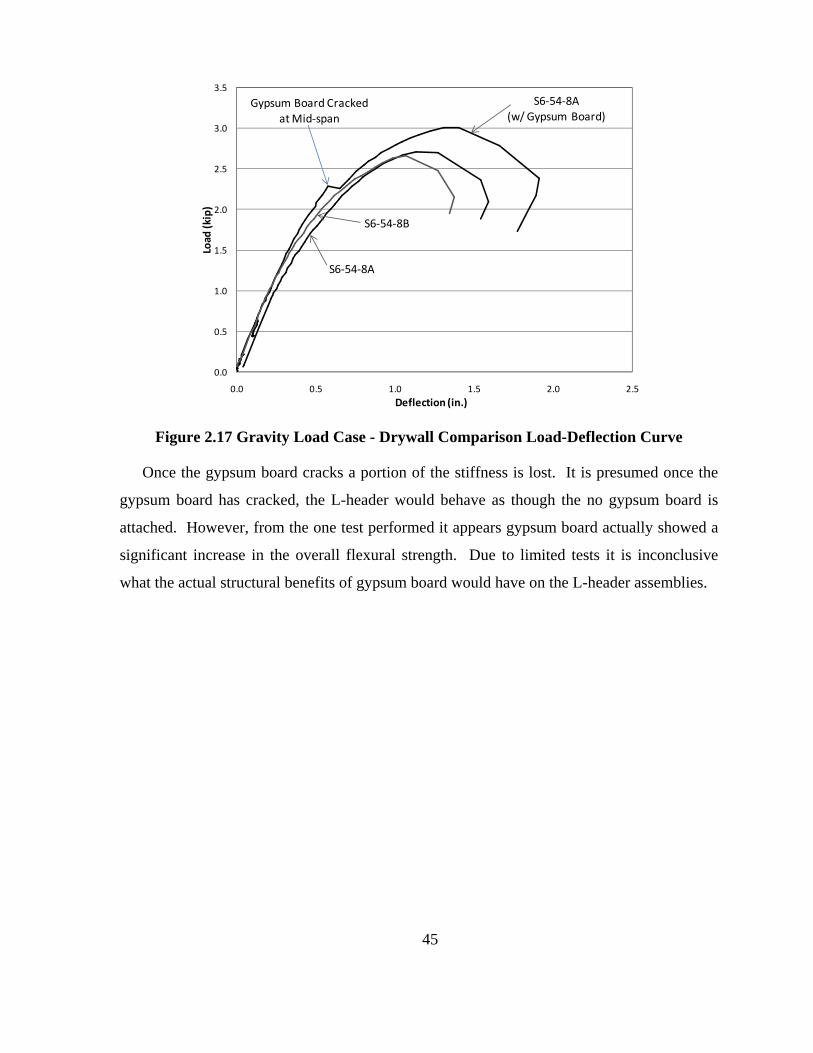
45
0.0
0.5
1.0
1.5
2.0
2.5
3.0
3.5
0.0 0.5 1.0 1.5 2.0 2.5
Load
(kip)
Deflection (in.)
S6‐54‐8A(w/ Gypsum Board)
S6‐54‐8A
S6‐54‐8B
Gypsum Board Cracked at Mid‐span
Figure 2.17 Gravity Load Case - Drywall Comparison Load-Deflection Curve
Once the gypsum board cracks a portion of the stiffness is lost. It is presumed once the
gypsum board has cracked, the L-header would behave as though the no gypsum board is
attached. However, from the one test performed it appears gypsum board actually showed a
significant increase in the overall flexural strength. Due to limited tests it is inconclusive
what the actual structural benefits of gypsum board would have on the L-header assemblies.
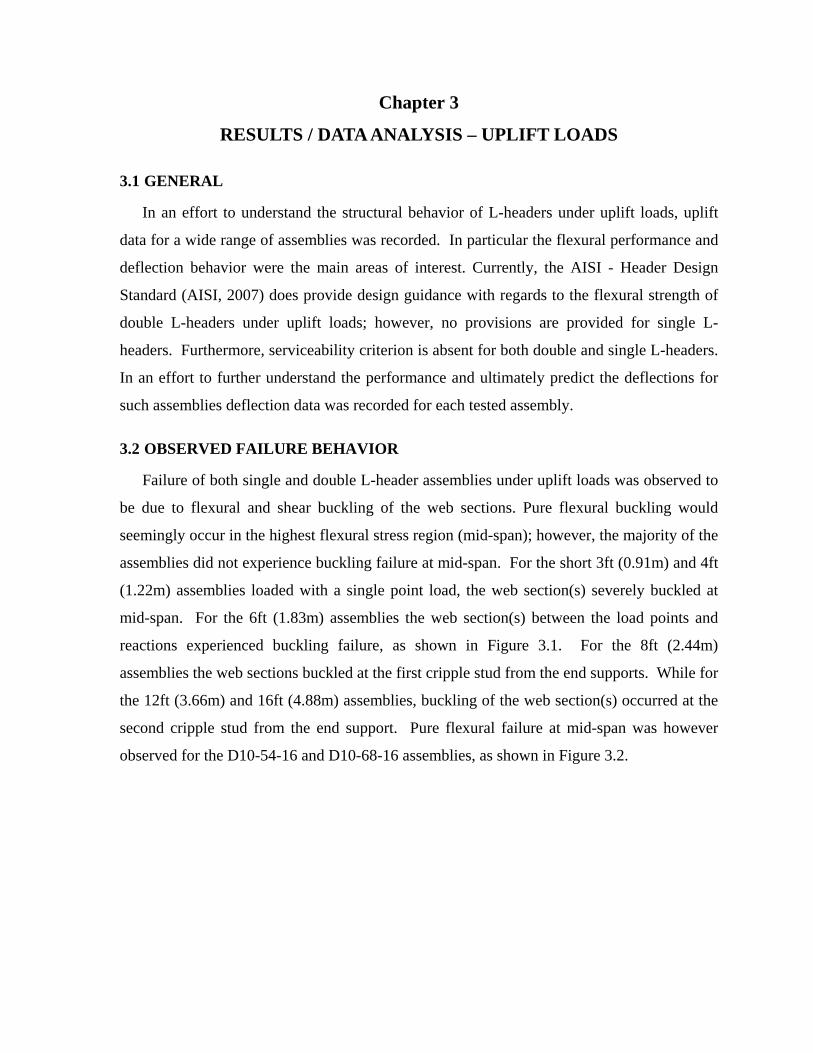
Chapter 3
RESULTS / DATA ANALYSIS – UPLIFT LOADS
3.1 GENERAL
In an effort to understand the structural behavior of L-headers under uplift loads, uplift
data for a wide range of assemblies was recorded. In particular the flexural performance and
deflection behavior were the main areas of interest. Currently, the AISI - Header Design
Standard (AISI, 2007) does provide design guidance with regards to the flexural strength of
double L-headers under uplift loads; however, no provisions are provided for single L-
headers. Furthermore, serviceability criterion is absent for both double and single L-headers.
In an effort to further understand the performance and ultimately predict the deflections for
such assemblies deflection data was recorded for each tested assembly.
3.2 OBSERVED FAILURE BEHAVIOR
Failure of both single and double L-header assemblies under uplift loads was observed to
be due to flexural and shear buckling of the web sections. Pure flexural buckling would
seemingly occur in the highest flexural stress region (mid-span); however, the majority of the
assemblies did not experience buckling failure at mid-span. For the short 3ft (0.91m) and 4ft
(1.22m) assemblies loaded with a single point load, the web section(s) severely buckled at
mid-span. For the 6ft (1.83m) assemblies the web section(s) between the load points and
reactions experienced buckling failure, as shown in Figure 3.1. For the 8ft (2.44m)
assemblies the web sections buckled at the first cripple stud from the end supports. While for
the 12ft (3.66m) and 16ft (4.88m) assemblies, buckling of the web section(s) occurred at the
second cripple stud from the end support. Pure flexural failure at mid-span was however
observed for the D10-54-16 and D10-68-16 assemblies, as shown in Figure 3.2.
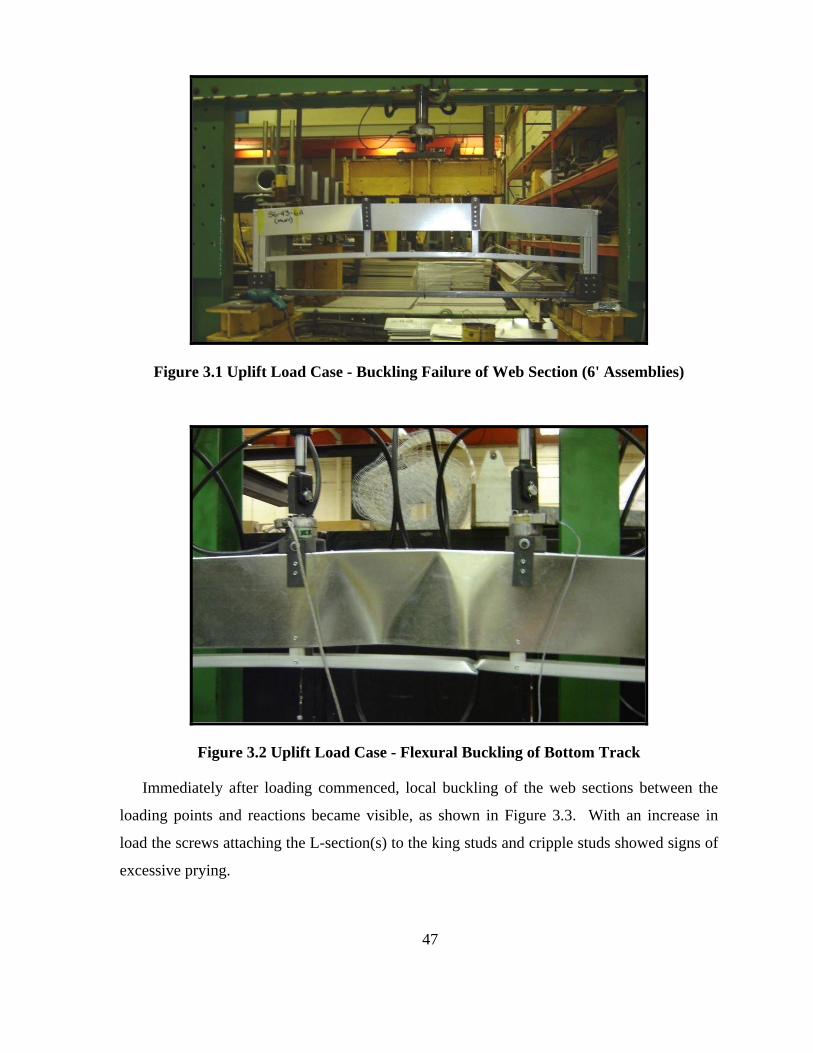
47
Figure 3.1 Uplift Load Case - Buckling Failure of Web Section (6' Assemblies)
Figure 3.2 Uplift Load Case - Flexural Buckling of Bottom Track
Immediately after loading commenced, local buckling of the web sections between the
loading points and reactions became visible, as shown in Figure 3.3. With an increase in
load the screws attaching the L-section(s) to the king studs and cripple studs showed signs of
excessive prying.
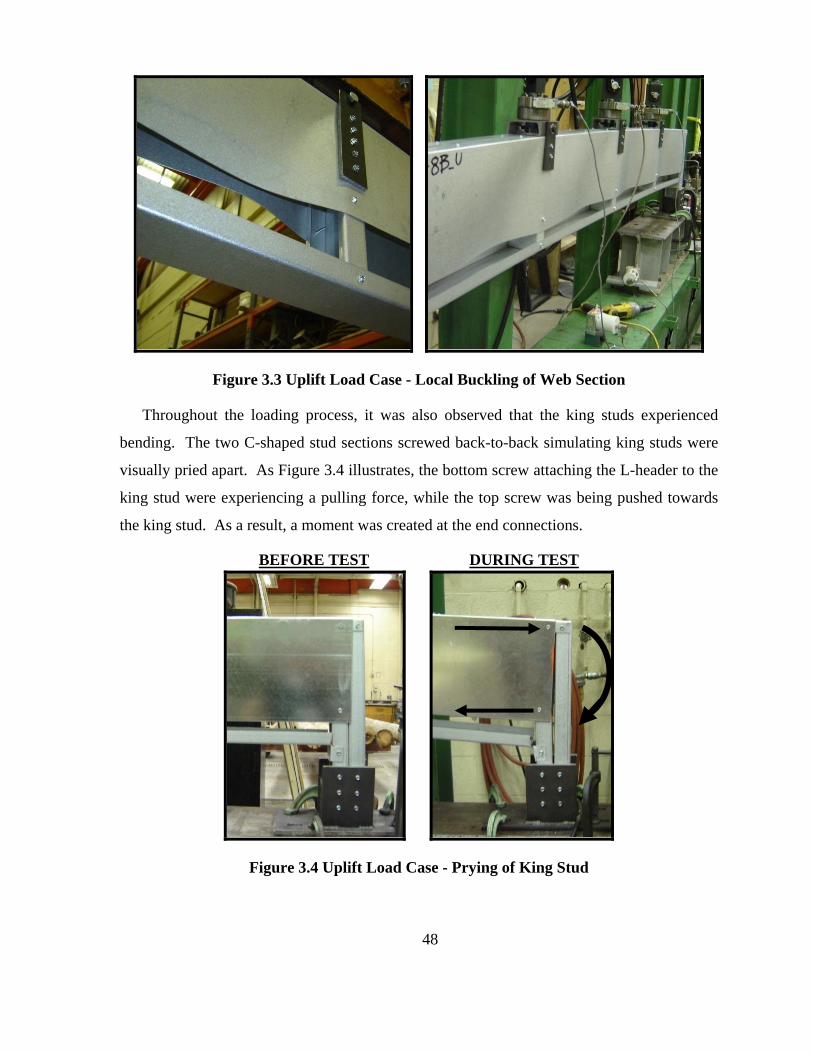
48
Figure 3.3 Uplift Load Case - Local Buckling of Web Section
Throughout the loading process, it was also observed that the king studs experienced
bending. The two C-shaped stud sections screwed back-to-back simulating king studs were
visually pried apart. As Figure 3.4 illustrates, the bottom screw attaching the L-header to the
king stud were experiencing a pulling force, while the top screw was being pushed towards
the king stud. As a result, a moment was created at the end connections.
Figure 3.4 Uplift Load Case - Prying of King Stud
BEFORE TEST DURING TEST
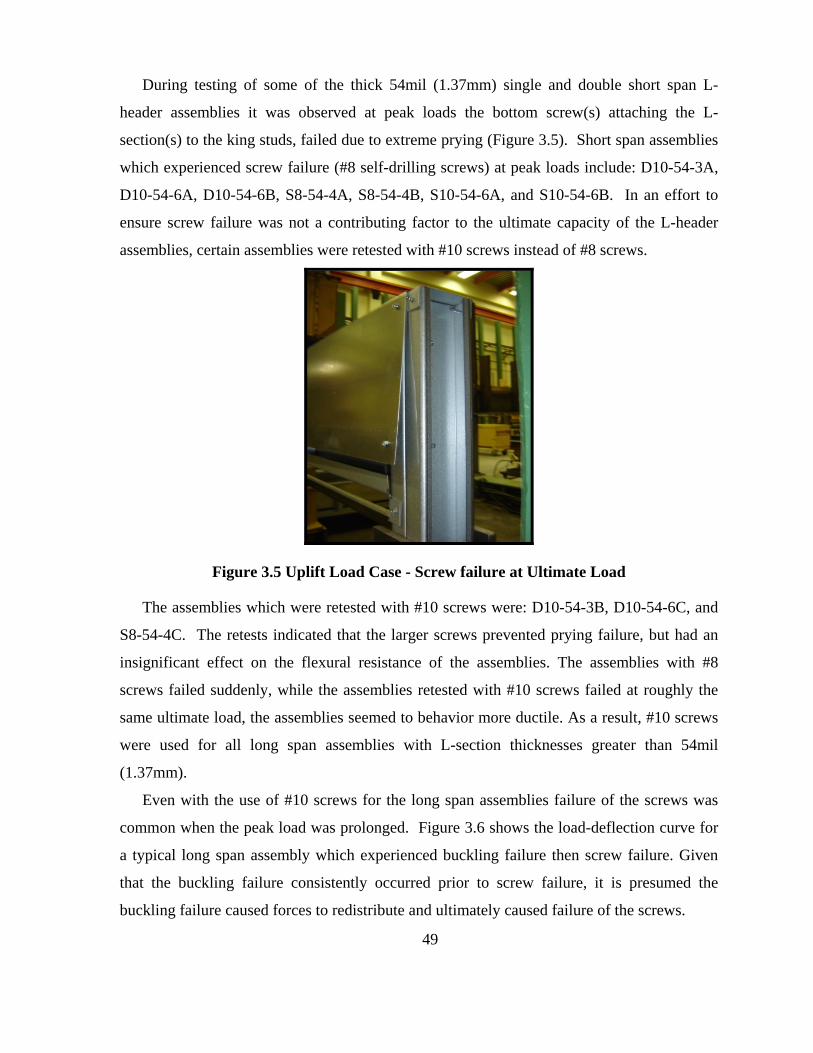
49
During testing of some of the thick 54mil (1.37mm) single and double short span L-
header assemblies it was observed at peak loads the bottom screw(s) attaching the L-
section(s) to the king studs, failed due to extreme prying (Figure 3.5). Short span assemblies
which experienced screw failure (#8 self-drilling screws) at peak loads include: D10-54-3A,
D10-54-6A, D10-54-6B, S8-54-4A, S8-54-4B, S10-54-6A, and S10-54-6B. In an effort to
ensure screw failure was not a contributing factor to the ultimate capacity of the L-header
assemblies, certain assemblies were retested with #10 screws instead of #8 screws.
Figure 3.5 Uplift Load Case - Screw failure at Ultimate Load
The assemblies which were retested with #10 screws were: D10-54-3B, D10-54-6C, and
S8-54-4C. The retests indicated that the larger screws prevented prying failure, but had an
insignificant effect on the flexural resistance of the assemblies. The assemblies with #8
screws failed suddenly, while the assemblies retested with #10 screws failed at roughly the
same ultimate load, the assemblies seemed to behavior more ductile. As a result, #10 screws
were used for all long span assemblies with L-section thicknesses greater than 54mil
(1.37mm).
Even with the use of #10 screws for the long span assemblies failure of the screws was
common when the peak load was prolonged. Figure 3.6 shows the load-deflection curve for
a typical long span assembly which experienced buckling failure then screw failure. Given
that the buckling failure consistently occurred prior to screw failure, it is presumed the
buckling failure caused forces to redistribute and ultimately caused failure of the screws.
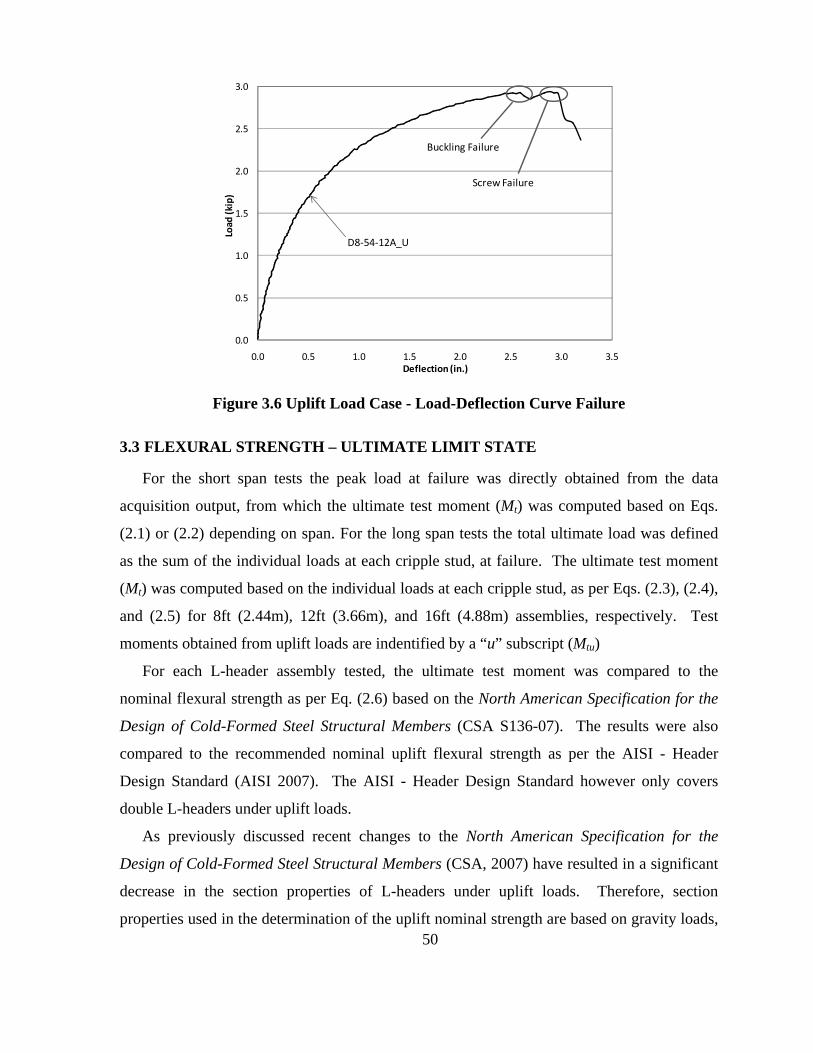
50
0.0
0.5
1.0
1.5
2.0
2.5
3.0
0.0 0.5 1.0 1.5 2.0 2.5 3.0 3.5
Load
(kip)
Deflection (in.)
Buckling Failure
Screw Failure
D8‐54‐12A_U
Figure 3.6 Uplift Load Case - Load-Deflection Curve Failure
3.3 FLEXURAL STRENGTH – ULTIMATE LIMIT STATE
For the short span tests the peak load at failure was directly obtained from the data
acquisition output, from which the ultimate test moment (Mt) was computed based on Eqs.
(2.1) or (2.2) depending on span. For the long span tests the total ultimate load was defined
as the sum of the individual loads at each cripple stud, at failure. The ultimate test moment
(Mt) was computed based on the individual loads at each cripple stud, as per Eqs. (2.3), (2.4),
and (2.5) for 8ft (2.44m), 12ft (3.66m), and 16ft (4.88m) assemblies, respectively. Test
moments obtained from uplift loads are indentified by a “u” subscript (Mtu)
For each L-header assembly tested, the ultimate test moment was compared to the
nominal flexural strength as per Eq. (2.6) based on the North American Specification for the
Design of Cold-Formed Steel Structural Members (CSA S136-07). The results were also
compared to the recommended nominal uplift flexural strength as per the AISI - Header
Design Standard (AISI 2007). The AISI - Header Design Standard however only covers
double L-headers under uplift loads.
As previously discussed recent changes to the North American Specification for the
Design of Cold-Formed Steel Structural Members (CSA, 2007) have resulted in a significant
decrease in the section properties of L-headers under uplift loads. Therefore, section
properties used in the determination of the uplift nominal strength are based on gravity loads,
51
which is currently the approach used in the North American Standard for Cold-Formed Steel
Framing – Header Design (AISI, 2007).
3.3.1 Double L-headers
Currently, the AISI - Header Design Standard (AISI, 2007) suggests the nominal uplift
flexural strength (Mnu) for double L-headers under uplift loads shall be computed based on
Eq. (3.1).
(3.1)
Where R is an uplift modification factor which is based on the depth-to-thickness ratio,
for depth-to-thickness ratios less than or equal to 150, R = 0.25. For depth-to-thickness ratios
greater than or equal to 170, R = 0.20. Linear interpolation shall be used to determine R for
vertical leg-to-thickness ratios between 150 and 170. Mng is the nominal gravity flexural
strength computed in accordance to the AISI – Header Design Standard (AISI, 2007).
Table 3.1, summarizes the average results for double L-headers under uplift loads.
Complete results for each assembly tested are included in Table B13 in Appendix B. For
comparison purposes the nominal flexural capacity is based on the actual measured
mechanical material properties.
The ratio of the ultimate test moment to the nominal flexural strength were found to be
consistently well below unity, which was anticipated since the L-shape geometry under uplift
promotes extensive local buckling, resulting in low ultimate test moments. Average Mtu/Mng
ratios ranged from 0.27 to 0.74, with a mean value of 0.52. Ideally the Mtu/Mng ratio would
be exactly unity, which would imply the predicted nominal flexural strength is equal to the
ultimate test moment. A ratio less than unity implies the nominal strength is over-estimated,
while values greater than unity suggests the nominal strength is conservative.
Further analysis shows the Mtu/Mng ratio generally increases as the span-to-vertical depth
ratio increases. Assemblies with the lowest span-to-vertical depth ratio were also found to
have the lowest Mtu/Mng ratio.
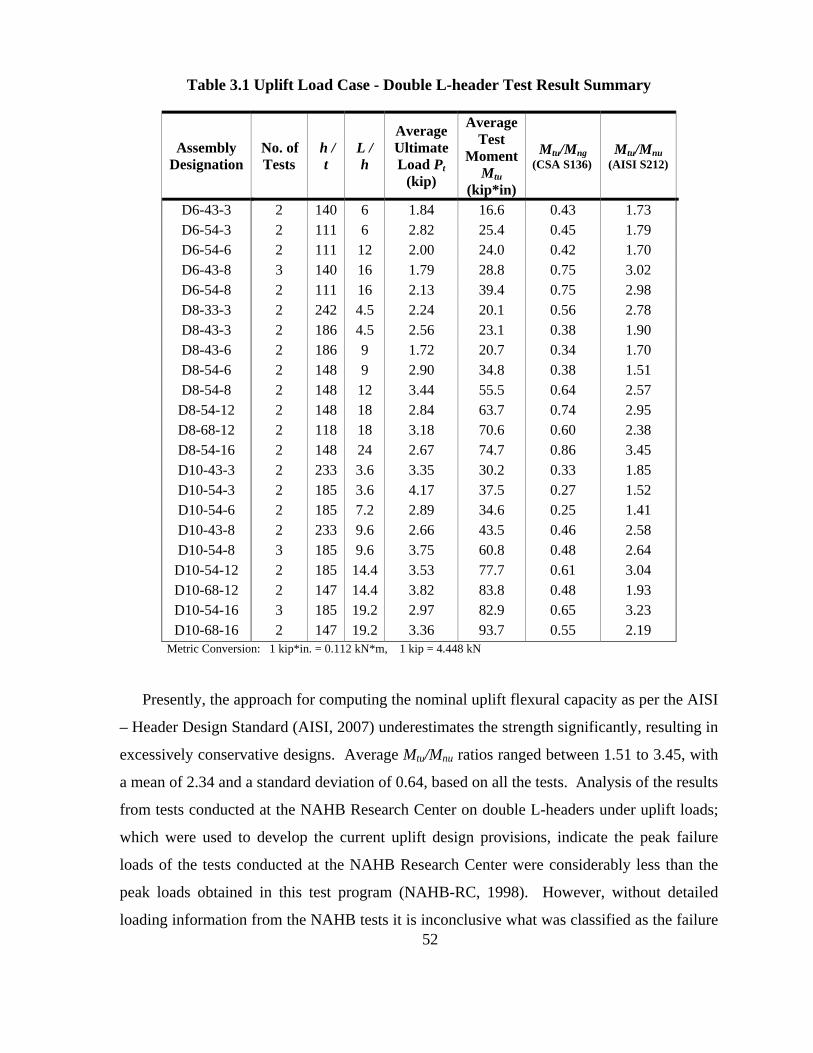
52
Table 3.1 Uplift Load Case - Double L-header Test Result Summary
Assembly Designation
No. of Tests
h / t
L / h
Average Ultimate Load Pt
(kip)
AverageTest
Moment Mtu
(kip*in)
Mtu/Mng (CSA S136)
Mtu/Mnu (AISI S212)
D6-43-3 2 140 6 1.84 16.6 0.43 1.73 D6-54-3 2 111 6 2.82 25.4 0.45 1.79 D6-54-6 2 111 12 2.00 24.0 0.42 1.70 D6-43-8 3 140 16 1.79 28.8 0.75 3.02 D6-54-8 2 111 16 2.13 39.4 0.75 2.98 D8-33-3 2 242 4.5 2.24 20.1 0.56 2.78 D8-43-3 2 186 4.5 2.56 23.1 0.38 1.90 D8-43-6 2 186 9 1.72 20.7 0.34 1.70 D8-54-6 2 148 9 2.90 34.8 0.38 1.51 D8-54-8 2 148 12 3.44 55.5 0.64 2.57
D8-54-12 2 148 18 2.84 63.7 0.74 2.95 D8-68-12 2 118 18 3.18 70.6 0.60 2.38 D8-54-16 2 148 24 2.67 74.7 0.86 3.45 D10-43-3 2 233 3.6 3.35 30.2 0.33 1.85 D10-54-3 2 185 3.6 4.17 37.5 0.27 1.52 D10-54-6 2 185 7.2 2.89 34.6 0.25 1.41 D10-43-8 2 233 9.6 2.66 43.5 0.46 2.58 D10-54-8 3 185 9.6 3.75 60.8 0.48 2.64 D10-54-12 2 185 14.4 3.53 77.7 0.61 3.04 D10-68-12 2 147 14.4 3.82 83.8 0.48 1.93 D10-54-16 3 185 19.2 2.97 82.9 0.65 3.23 D10-68-16 2 147 19.2 3.36 93.7 0.55 2.19
Metric Conversion: 1 kip*in. = 0.112 kN*m, 1 kip = 4.448 kN
Presently, the approach for computing the nominal uplift flexural capacity as per the AISI
– Header Design Standard (AISI, 2007) underestimates the strength significantly, resulting in
excessively conservative designs. Average Mtu/Mnu ratios ranged between 1.51 to 3.45, with
a mean of 2.34 and a standard deviation of 0.64, based on all the tests. Analysis of the results
from tests conducted at the NAHB Research Center on double L-headers under uplift loads;
which were used to develop the current uplift design provisions, indicate the peak failure
loads of the tests conducted at the NAHB Research Center were considerably less than the
peak loads obtained in this test program (NAHB-RC, 1998). However, without detailed
loading information from the NAHB tests it is inconclusive what was classified as the failure
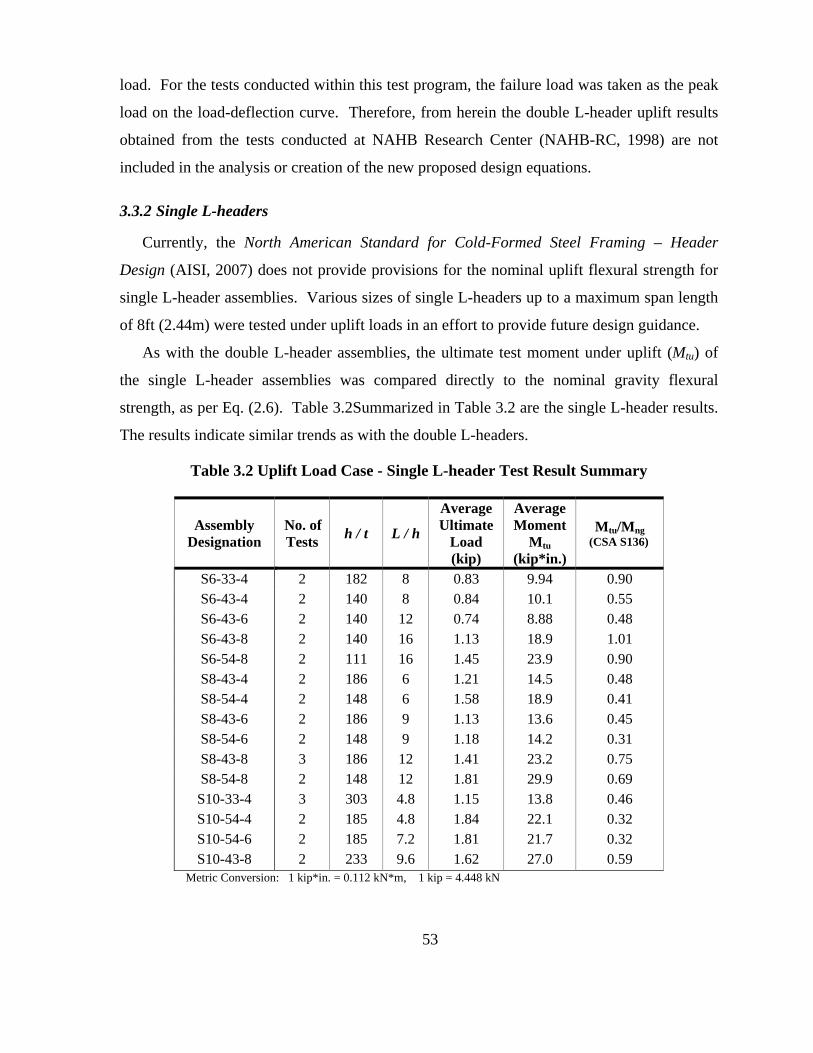
53
load. For the tests conducted within this test program, the failure load was taken as the peak
load on the load-deflection curve. Therefore, from herein the double L-header uplift results
obtained from the tests conducted at NAHB Research Center (NAHB-RC, 1998) are not
included in the analysis or creation of the new proposed design equations.
3.3.2 Single L-headers
Currently, the North American Standard for Cold-Formed Steel Framing – Header
Design (AISI, 2007) does not provide provisions for the nominal uplift flexural strength for
single L-header assemblies. Various sizes of single L-headers up to a maximum span length
of 8ft (2.44m) were tested under uplift loads in an effort to provide future design guidance.
As with the double L-header assemblies, the ultimate test moment under uplift (Mtu) of
the single L-header assemblies was compared directly to the nominal gravity flexural
strength, as per Eq. (2.6). Table 3.2Summarized in Table 3.2 are the single L-header results.
The results indicate similar trends as with the double L-headers.
Table 3.2 Uplift Load Case - Single L-header Test Result Summary
Assembly Designation
No. of Tests h / t L / h
Average Ultimate
Load (kip)
Average Moment
Mtu (kip*in.)
Mtu/Mng (CSA S136)
S6-33-4 2 182 8 0.83 9.94 0.90 S6-43-4 2 140 8 0.84 10.1 0.55 S6-43-6 2 140 12 0.74 8.88 0.48 S6-43-8 2 140 16 1.13 18.9 1.01 S6-54-8 2 111 16 1.45 23.9 0.90 S8-43-4 2 186 6 1.21 14.5 0.48 S8-54-4 2 148 6 1.58 18.9 0.41 S8-43-6 2 186 9 1.13 13.6 0.45 S8-54-6 2 148 9 1.18 14.2 0.31 S8-43-8 3 186 12 1.41 23.2 0.75 S8-54-8 2 148 12 1.81 29.9 0.69 S10-33-4 3 303 4.8 1.15 13.8 0.46 S10-54-4 2 185 4.8 1.84 22.1 0.32 S10-54-6 2 185 7.2 1.81 21.7 0.32 S10-43-8 2 233 9.6 1.62 27.0 0.59
Metric Conversion: 1 kip*in. = 0.112 kN*m, 1 kip = 4.448 kN
54
Average Mtu/Mng ratios ranged from 0.31 to 1.01, with a mean value of 0.56 based on all
the single L-header assemblies tested under uplift loads. The Mtu/Mng ratios were found to
generally increase as the span-to-vertical depth ratio of the assemblies increased. Complete
results for single L-header assemblies under uplift loads are contained in Table B14 in
Appendix B.
3.3.3 Single L-headers vs. Double L-headers
Comparing the flexural strength of single L-headers to that of an equivalent sized double
L-header, the single L-header assemblies have larger Mtu/Mng ratios. Further analyses
showed the capacity of the single L-headers were consistently greater than half that of the
equivalent double L-header assembly. As with gravity loads the actual capacity is to some
degree influenced by the top and bottom track sections; however, under uplift loads it is
presumed the track sections influence the performance of the assembly to a larger degree.
Therefore, adding a second L-shaped section to the assembly only increases the capacity by
some fraction, typically ranging between 1.50 and 1.90.
3.4 SHEAR INFLUENCE ON STRENGTH
The AISI – Header Design Standard (AISI, 2007) provisions provide a simplified
conservative design approach which is based solely on the flexural performance of the L-
header assemblies. However, based on the observed failure modes, buckling failure from
purely flexural stresses did not occur. Rather it was apparent a combination of flexure and
shear stresses influence the behavior of the L-header assemblies under uplift. Failure from
flexural stresses alone would typically occur at mid-span where the flexural stresses are the
highest; although, consistently buckling failure occurred elsewhere. As a result, the shear
capacities of the assemblies were checked.
The nominal shear strength (Vn) for each assembly was computed based on Eq. (3.2) as
per the North American Specification for the Design of Cold-Formed Steel Structural
Members, Section C3.2 (CSA, 2007).
(3.2)
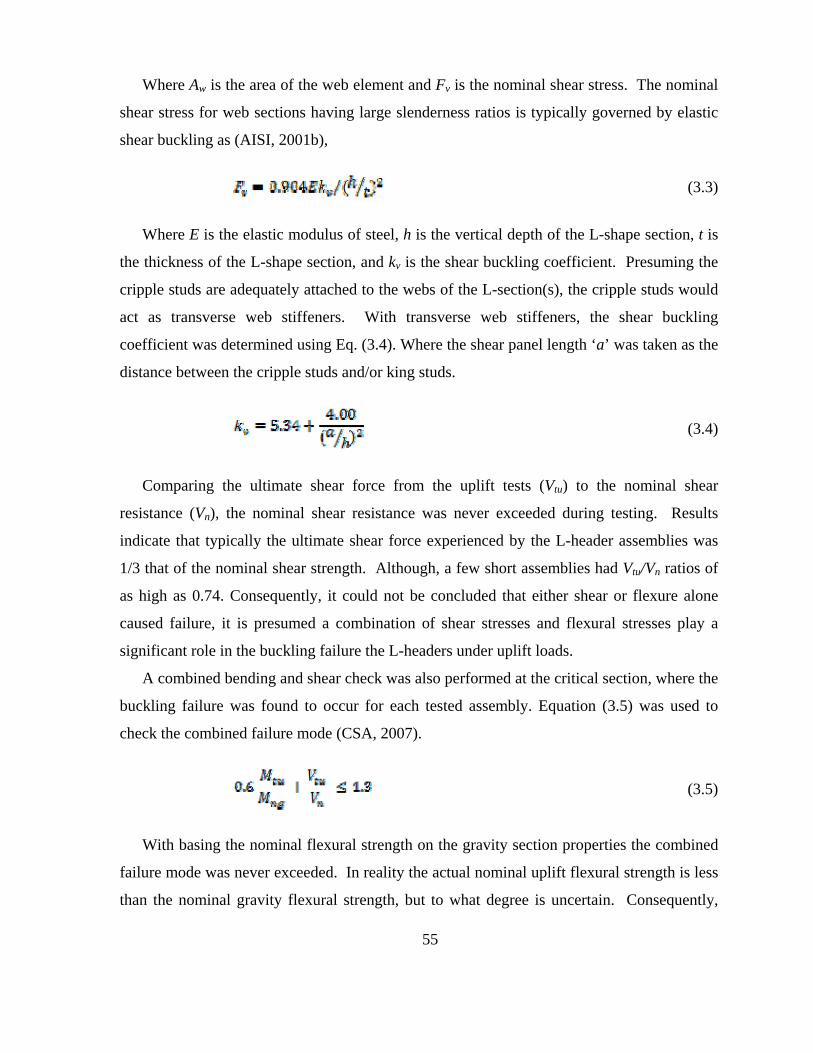
55
Where Aw is the area of the web element and Fv is the nominal shear stress. The nominal
shear stress for web sections having large slenderness ratios is typically governed by elastic
shear buckling as (AISI, 2001b),
(3.3)
Where E is the elastic modulus of steel, h is the vertical depth of the L-shape section, t is
the thickness of the L-shape section, and kv is the shear buckling coefficient. Presuming the
cripple studs are adequately attached to the webs of the L-section(s), the cripple studs would
act as transverse web stiffeners. With transverse web stiffeners, the shear buckling
coefficient was determined using Eq. (3.4). Where the shear panel length ‘a’ was taken as the
distance between the cripple studs and/or king studs.
(3.4)
Comparing the ultimate shear force from the uplift tests (Vtu) to the nominal shear
resistance (Vn), the nominal shear resistance was never exceeded during testing. Results
indicate that typically the ultimate shear force experienced by the L-header assemblies was
1/3 that of the nominal shear strength. Although, a few short assemblies had Vtu/Vn ratios of
as high as 0.74. Consequently, it could not be concluded that either shear or flexure alone
caused failure, it is presumed a combination of shear stresses and flexural stresses play a
significant role in the buckling failure the L-headers under uplift loads.
A combined bending and shear check was also performed at the critical section, where the
buckling failure was found to occur for each tested assembly. Equation (3.5) was used to
check the combined failure mode (CSA, 2007).
(3.5)
With basing the nominal flexural strength on the gravity section properties the combined
failure mode was never exceeded. In reality the actual nominal uplift flexural strength is less
than the nominal gravity flexural strength, but to what degree is uncertain. Consequently,
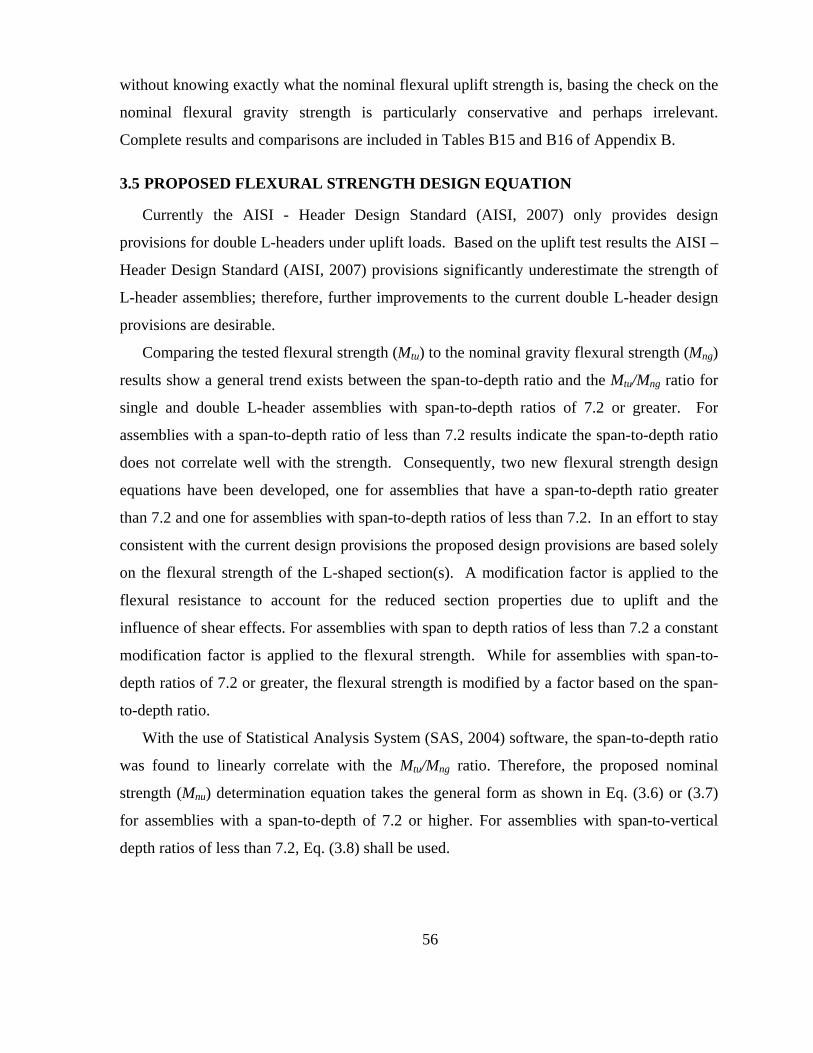
56
without knowing exactly what the nominal flexural uplift strength is, basing the check on the
nominal flexural gravity strength is particularly conservative and perhaps irrelevant.
Complete results and comparisons are included in Tables B15 and B16 of Appendix B.
3.5 PROPOSED FLEXURAL STRENGTH DESIGN EQUATION
Currently the AISI - Header Design Standard (AISI, 2007) only provides design
provisions for double L-headers under uplift loads. Based on the uplift test results the AISI –
Header Design Standard (AISI, 2007) provisions significantly underestimate the strength of
L-header assemblies; therefore, further improvements to the current double L-header design
provisions are desirable.
Comparing the tested flexural strength (Mtu) to the nominal gravity flexural strength (Mng)
results show a general trend exists between the span-to-depth ratio and the Mtu/Mng ratio for
single and double L-header assemblies with span-to-depth ratios of 7.2 or greater. For
assemblies with a span-to-depth ratio of less than 7.2 results indicate the span-to-depth ratio
does not correlate well with the strength. Consequently, two new flexural strength design
equations have been developed, one for assemblies that have a span-to-depth ratio greater
than 7.2 and one for assemblies with span-to-depth ratios of less than 7.2. In an effort to stay
consistent with the current design provisions the proposed design provisions are based solely
on the flexural strength of the L-shaped section(s). A modification factor is applied to the
flexural resistance to account for the reduced section properties due to uplift and the
influence of shear effects. For assemblies with span to depth ratios of less than 7.2 a constant
modification factor is applied to the flexural strength. While for assemblies with span-to-
depth ratios of 7.2 or greater, the flexural strength is modified by a factor based on the span-
to-depth ratio.
With the use of Statistical Analysis System (SAS, 2004) software, the span-to-depth ratio
was found to linearly correlate with the Mtu/Mng ratio. Therefore, the proposed nominal
strength (Mnu) determination equation takes the general form as shown in Eq. (3.6) or (3.7)
for assemblies with a span-to-depth of 7.2 or higher. For assemblies with span-to-vertical
depth ratios of less than 7.2, Eq. (3.8) shall be used.
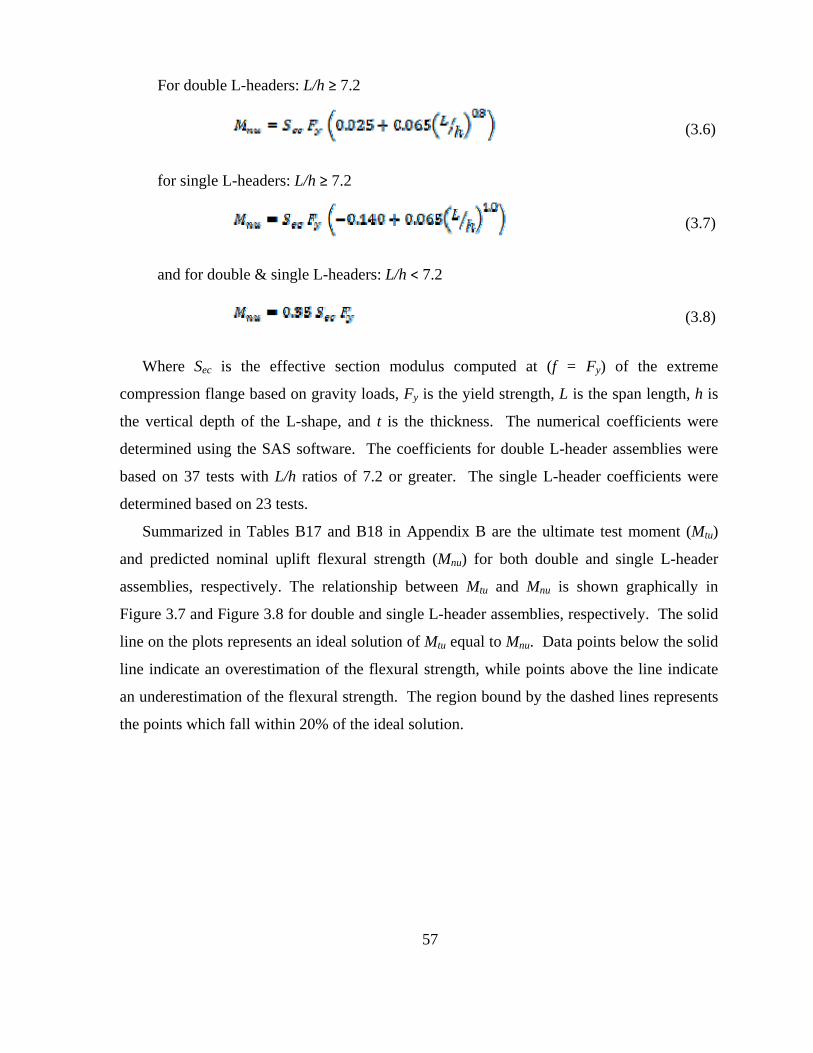
57
For double L-headers: L/h ≥ 7.2
(3.6)
for single L-headers: L/h ≥ 7.2
(3.7)
and for double & single L-headers: L/h < 7.2
(3.8)
Where Sec is the effective section modulus computed at (f = Fy) of the extreme
compression flange based on gravity loads, Fy is the yield strength, L is the span length, h is
the vertical depth of the L-shape, and t is the thickness. The numerical coefficients were
determined using the SAS software. The coefficients for double L-header assemblies were
based on 37 tests with L/h ratios of 7.2 or greater. The single L-header coefficients were
determined based on 23 tests.
Summarized in Tables B17 and B18 in Appendix B are the ultimate test moment (Mtu)
and predicted nominal uplift flexural strength (Mnu) for both double and single L-header
assemblies, respectively. The relationship between Mtu and Mnu is shown graphically in
Figure 3.7 and Figure 3.8 for double and single L-header assemblies, respectively. The solid
line on the plots represents an ideal solution of Mtu equal to Mnu. Data points below the solid
line indicate an overestimation of the flexural strength, while points above the line indicate
an underestimation of the flexural strength. The region bound by the dashed lines represents
the points which fall within 20% of the ideal solution.
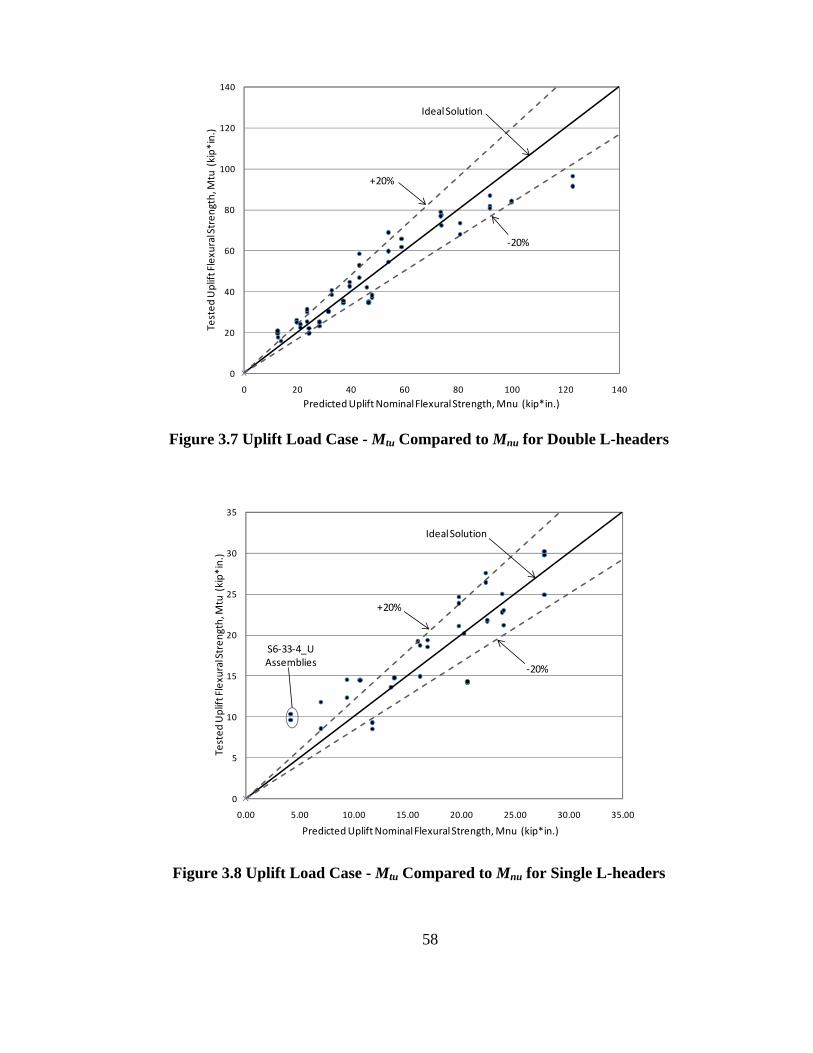
58
0
20
40
60
80
100
120
140
0 20 40 60 80 100 120 140
Tested
Uplift Flexural Stren
gth, Mtu (kip*
in.)
Predicted Uplift Nominal Flexural Strength, Mnu (kip*in.)
Ideal Solution
+20%
‐20%
Figure 3.7 Uplift Load Case - Mtu Compared to Mnu for Double L-headers
0
5
10
15
20
25
30
35
0.00 5.00 10.00 15.00 20.00 25.00 30.00 35.00
Tested
Uplift Flexural Stren
gth, Mtu (kip*
in.)
Predicted Uplift Nominal Flexural Strength, Mnu (kip*in.)
S6‐33‐4_UAssemblies
Ideal Solution
+20%
‐20%
Figure 3.8 Uplift Load Case - Mtu Compared to Mnu for Single L-headers
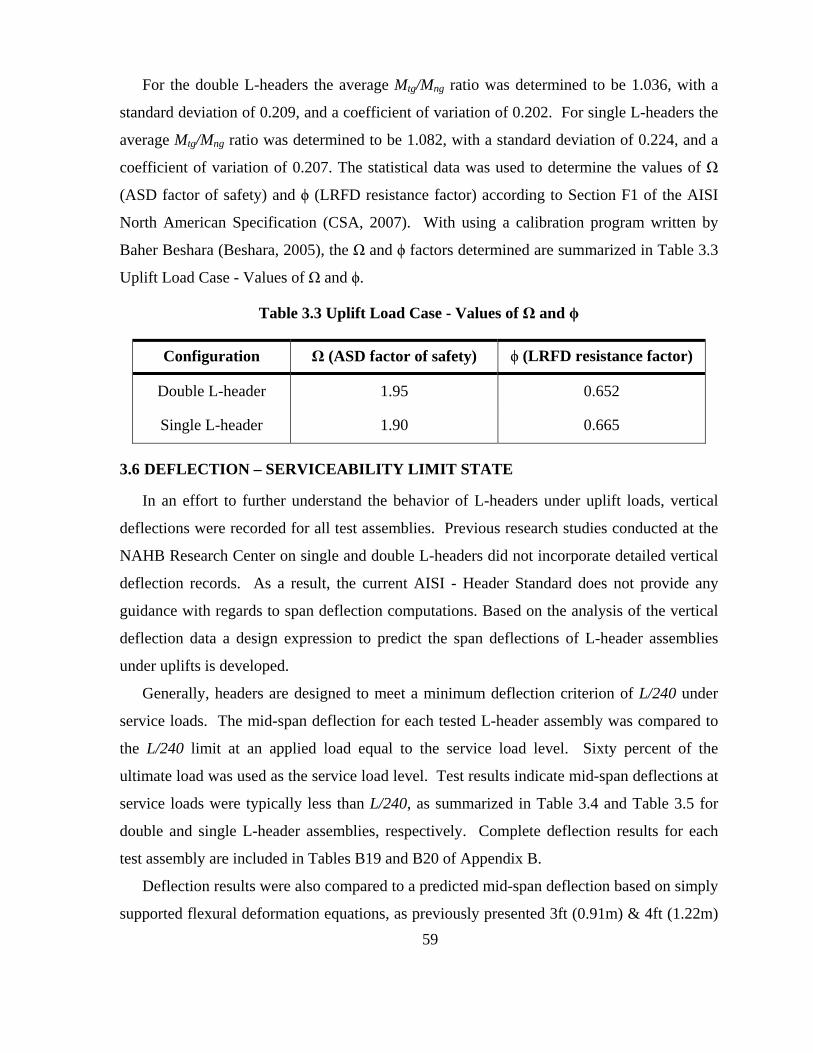
59
For the double L-headers the average Mtg/Mng ratio was determined to be 1.036, with a
standard deviation of 0.209, and a coefficient of variation of 0.202. For single L-headers the
average Mtg/Mng ratio was determined to be 1.082, with a standard deviation of 0.224, and a
coefficient of variation of 0.207. The statistical data was used to determine the values of Ω
(ASD factor of safety) and ϕ (LRFD resistance factor) according to Section F1 of the AISI
North American Specification (CSA, 2007). With using a calibration program written by
Baher Beshara (Beshara, 2005), the Ω and ϕ factors determined are summarized in Table 3.3
Uplift Load Case - Values of Ω and ϕ.
Table 3.3 Uplift Load Case - Values of Ω and ϕ
Configuration Ω (ASD factor of safety) ϕ (LRFD resistance factor)
Double L-header 1.95 0.652
Single L-header 1.90 0.665
3.6 DEFLECTION – SERVICEABILITY LIMIT STATE
In an effort to further understand the behavior of L-headers under uplift loads, vertical
deflections were recorded for all test assemblies. Previous research studies conducted at the
NAHB Research Center on single and double L-headers did not incorporate detailed vertical
deflection records. As a result, the current AISI - Header Standard does not provide any
guidance with regards to span deflection computations. Based on the analysis of the vertical
deflection data a design expression to predict the span deflections of L-header assemblies
under uplifts is developed.
Generally, headers are designed to meet a minimum deflection criterion of L/240 under
service loads. The mid-span deflection for each tested L-header assembly was compared to
the L/240 limit at an applied load equal to the service load level. Sixty percent of the
ultimate load was used as the service load level. Test results indicate mid-span deflections at
service loads were typically less than L/240, as summarized in Table 3.4 and Table 3.5 for
double and single L-header assemblies, respectively. Complete deflection results for each
test assembly are included in Tables B19 and B20 of Appendix B.
Deflection results were also compared to a predicted mid-span deflection based on simply
supported flexural deformation equations, as previously presented 3ft (0.91m) & 4ft (1.22m)
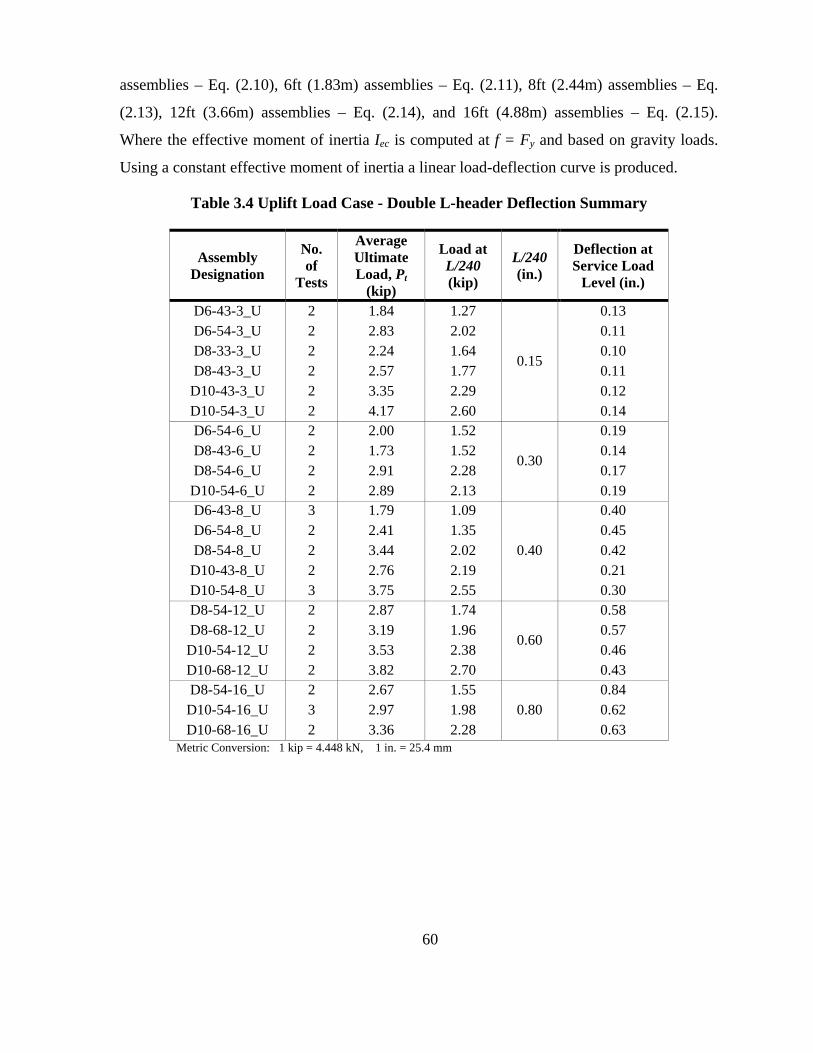
60
assemblies – Eq. (2.10), 6ft (1.83m) assemblies – Eq. (2.11), 8ft (2.44m) assemblies – Eq.
(2.13), 12ft (3.66m) assemblies – Eq. (2.14), and 16ft (4.88m) assemblies – Eq. (2.15).
Where the effective moment of inertia Iec is computed at f = Fy and based on gravity loads.
Using a constant effective moment of inertia a linear load-deflection curve is produced.
Table 3.4 Uplift Load Case - Double L-header Deflection Summary
Assembly Designation
No. of
Tests
Average Ultimate Load, Pt
(kip)
Load at L/240 (kip)
L/240 (in.)
Deflection at Service Load
Level (in.)
D6-43-3_U 2 1.84 1.27
0.15
0.13 D6-54-3_U 2 2.83 2.02 0.11 D8-33-3_U 2 2.24 1.64 0.10 D8-43-3_U 2 2.57 1.77 0.11
D10-43-3_U 2 3.35 2.29 0.12 D10-54-3_U 2 4.17 2.60 0.14 D6-54-6_U 2 2.00 1.52
0.30
0.19 D8-43-6_U 2 1.73 1.52 0.14 D8-54-6_U 2 2.91 2.28 0.17
D10-54-6_U 2 2.89 2.13 0.19 D6-43-8_U 3 1.79 1.09
0.40
0.40 D6-54-8_U 2 2.41 1.35 0.45 D8-54-8_U 2 3.44 2.02 0.42
D10-43-8_U 2 2.76 2.19 0.21 D10-54-8_U 3 3.75 2.55 0.30 D8-54-12_U 2 2.87 1.74
0.60
0.58 D8-68-12_U 2 3.19 1.96 0.57
D10-54-12_U 2 3.53 2.38 0.46 D10-68-12_U 2 3.82 2.70 0.43 D8-54-16_U 2 2.67 1.55
0.80 0.84
D10-54-16_U 3 2.97 1.98 0.62 D10-68-16_U 2 3.36 2.28 0.63
Metric Conversion: 1 kip = 4.448 kN, 1 in. = 25.4 mm
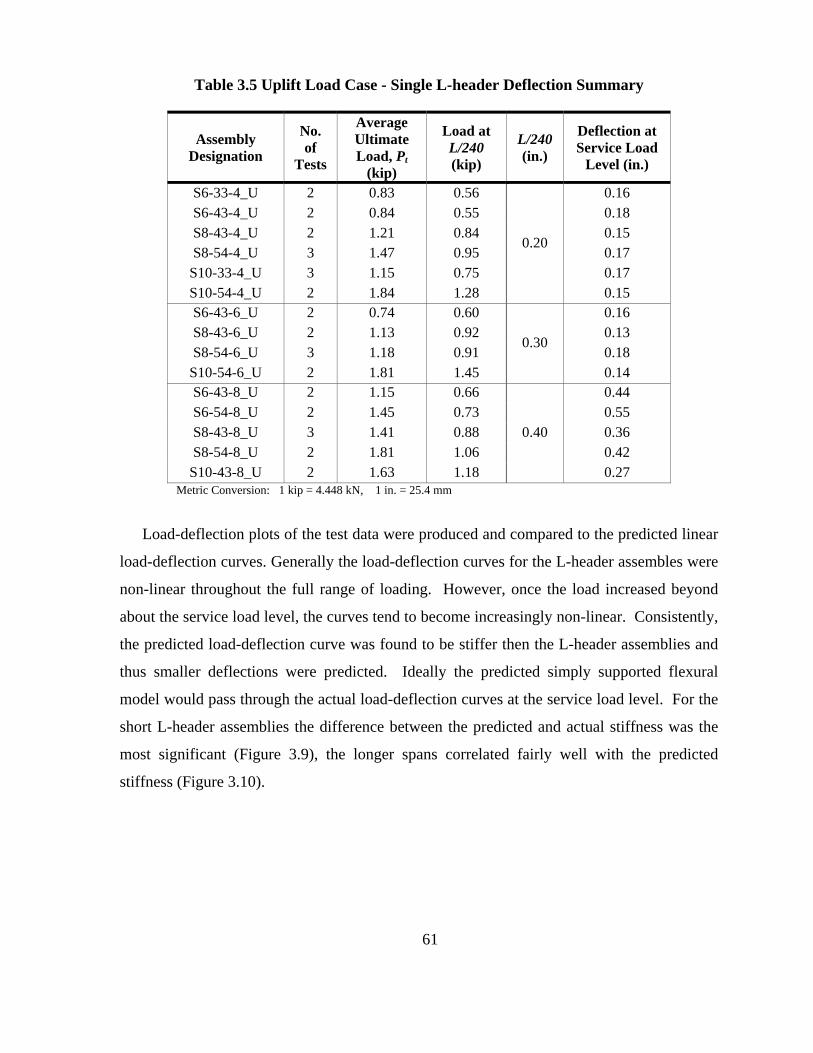
61
Table 3.5 Uplift Load Case - Single L-header Deflection Summary
Assembly Designation
No. of
Tests
Average Ultimate Load, Pt
(kip)
Load at L/240 (kip)
L/240 (in.)
Deflection at Service Load
Level (in.)
S6-33-4_U 2 0.83 0.56
0.20
0.16 S6-43-4_U 2 0.84 0.55 0.18 S8-43-4_U 2 1.21 0.84 0.15 S8-54-4_U 3 1.47 0.95 0.17
S10-33-4_U 3 1.15 0.75 0.17 S10-54-4_U 2 1.84 1.28 0.15 S6-43-6_U 2 0.74 0.60
0.30
0.16 S8-43-6_U 2 1.13 0.92 0.13 S8-54-6_U 3 1.18 0.91 0.18
S10-54-6_U 2 1.81 1.45 0.14 S6-43-8_U 2 1.15 0.66
0.40
0.44 S6-54-8_U 2 1.45 0.73 0.55 S8-43-8_U 3 1.41 0.88 0.36 S8-54-8_U 2 1.81 1.06 0.42
S10-43-8_U 2 1.63 1.18 0.27 Metric Conversion: 1 kip = 4.448 kN, 1 in. = 25.4 mm
Load-deflection plots of the test data were produced and compared to the predicted linear
load-deflection curves. Generally the load-deflection curves for the L-header assembles were
non-linear throughout the full range of loading. However, once the load increased beyond
about the service load level, the curves tend to become increasingly non-linear. Consistently,
the predicted load-deflection curve was found to be stiffer then the L-header assemblies and
thus smaller deflections were predicted. Ideally the predicted simply supported flexural
model would pass through the actual load-deflection curves at the service load level. For the
short L-header assemblies the difference between the predicted and actual stiffness was the
most significant (Figure 3.9), the longer spans correlated fairly well with the predicted
stiffness (Figure 3.10).
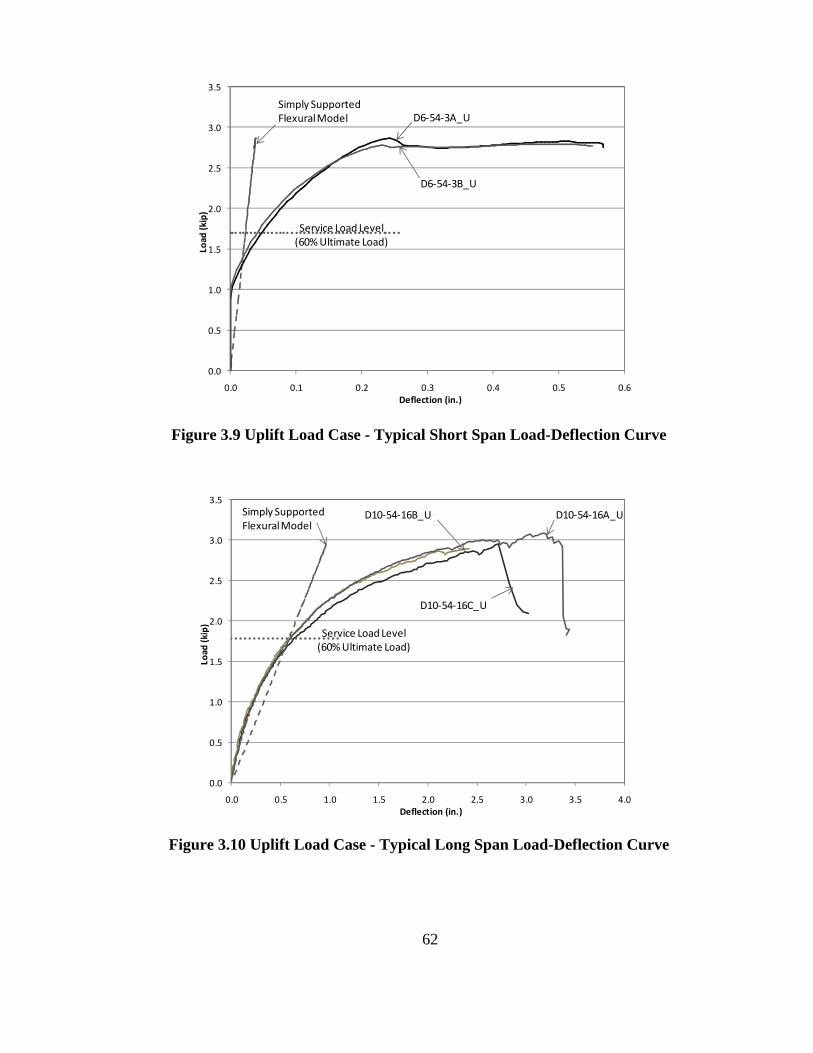
62
0.0
0.5
1.0
1.5
2.0
2.5
3.0
3.5
0.0 0.1 0.2 0.3 0.4 0.5 0.6
Load
(kip)
Deflection (in.)
D6‐54‐3A_U
D6‐54‐3B_U
Service Load Level(60% Ultimate Load)
Simply SupportedFlexuralModel
Figure 3.9 Uplift Load Case - Typical Short Span Load-Deflection Curve
0.0
0.5
1.0
1.5
2.0
2.5
3.0
3.5
0.0 0.5 1.0 1.5 2.0 2.5 3.0 3.5 4.0
Load
(kip)
Deflection (in.)
D10‐54‐16A_UD10‐54‐16B_U
D10‐54‐16C_U
Service Load Level(60% Ultimate Load)
Simply SupportedFlexuralModel
Figure 3.10 Uplift Load Case - Typical Long Span Load-Deflection Curve
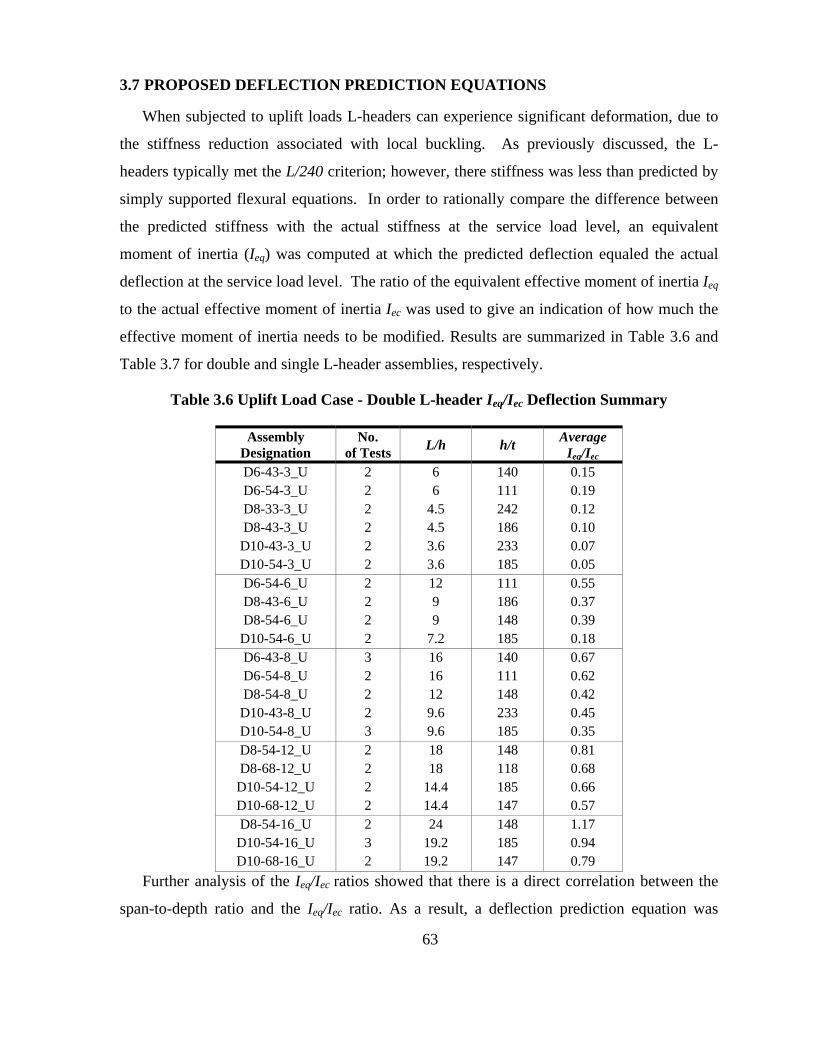
63
3.7 PROPOSED DEFLECTION PREDICTION EQUATIONS
When subjected to uplift loads L-headers can experience significant deformation, due to
the stiffness reduction associated with local buckling. As previously discussed, the L-
headers typically met the L/240 criterion; however, there stiffness was less than predicted by
simply supported flexural equations. In order to rationally compare the difference between
the predicted stiffness with the actual stiffness at the service load level, an equivalent
moment of inertia (Ieq) was computed at which the predicted deflection equaled the actual
deflection at the service load level. The ratio of the equivalent effective moment of inertia Ieq
to the actual effective moment of inertia Iec was used to give an indication of how much the
effective moment of inertia needs to be modified. Results are summarized in Table 3.6 and
Table 3.7 for double and single L-header assemblies, respectively.
Table 3.6 Uplift Load Case - Double L-header Ieq/Iec Deflection Summary
Assembly Designation
No. of Tests L/h h/t Average
Ieq/Iec D6-43-3_U 2 6 140 0.15 D6-54-3_U 2 6 111 0.19 D8-33-3_U 2 4.5 242 0.12 D8-43-3_U 2 4.5 186 0.10 D10-43-3_U 2 3.6 233 0.07 D10-54-3_U 2 3.6 185 0.05 D6-54-6_U 2 12 111 0.55 D8-43-6_U 2 9 186 0.37 D8-54-6_U 2 9 148 0.39 D10-54-6_U 2 7.2 185 0.18 D6-43-8_U 3 16 140 0.67 D6-54-8_U 2 16 111 0.62 D8-54-8_U 2 12 148 0.42 D10-43-8_U 2 9.6 233 0.45 D10-54-8_U 3 9.6 185 0.35 D8-54-12_U 2 18 148 0.81 D8-68-12_U 2 18 118 0.68
D10-54-12_U 2 14.4 185 0.66 D10-68-12_U 2 14.4 147 0.57 D8-54-16_U 2 24 148 1.17
D10-54-16_U 3 19.2 185 0.94 D10-68-16_U 2 19.2 147 0.79
Further analysis of the Ieq/Iec ratios showed that there is a direct correlation between the
span-to-depth ratio and the Ieq/Iec ratio. As a result, a deflection prediction equation was
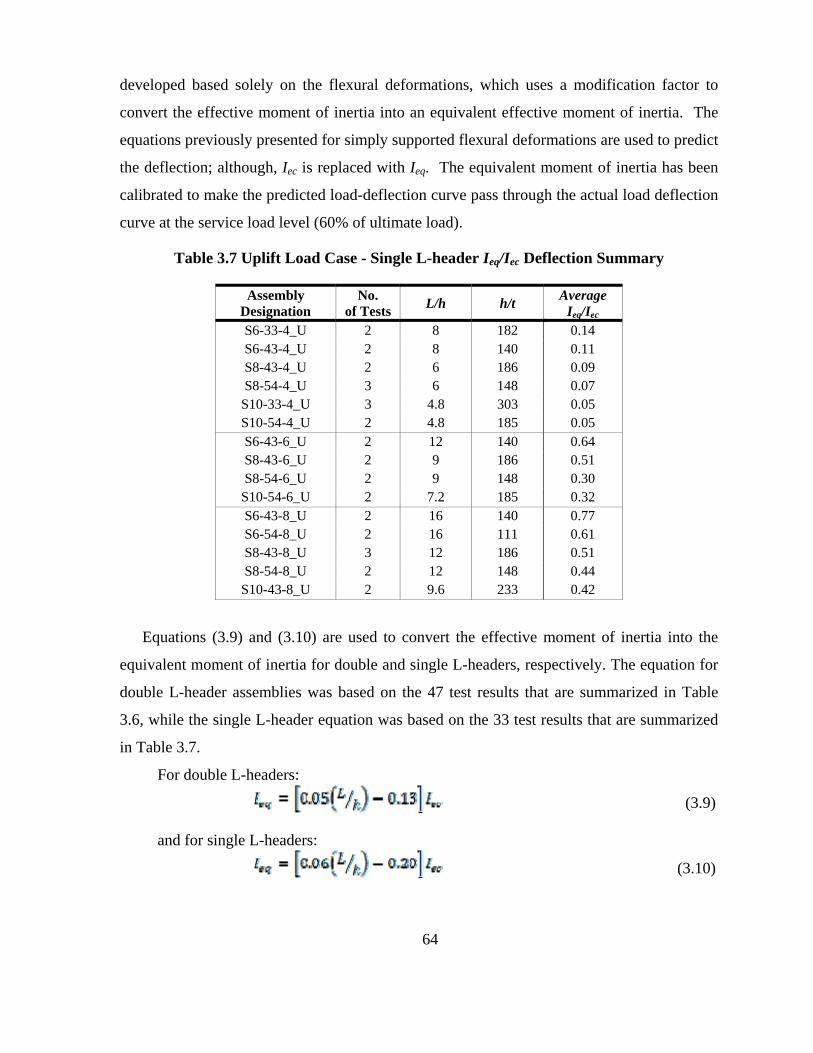
64
developed based solely on the flexural deformations, which uses a modification factor to
convert the effective moment of inertia into an equivalent effective moment of inertia. The
equations previously presented for simply supported flexural deformations are used to predict
the deflection; although, Iec is replaced with Ieq. The equivalent moment of inertia has been
calibrated to make the predicted load-deflection curve pass through the actual load deflection
curve at the service load level (60% of ultimate load).
Table 3.7 Uplift Load Case - Single L-header Ieq/Iec Deflection Summary
Assembly Designation
No. of Tests L/h h/t Average
Ieq/Iec S6-33-4_U 2 8 182 0.14 S6-43-4_U 2 8 140 0.11 S8-43-4_U 2 6 186 0.09 S8-54-4_U 3 6 148 0.07
S10-33-4_U 3 4.8 303 0.05 S10-54-4_U 2 4.8 185 0.05 S6-43-6_U 2 12 140 0.64 S8-43-6_U 2 9 186 0.51 S8-54-6_U 2 9 148 0.30
S10-54-6_U 2 7.2 185 0.32 S6-43-8_U 2 16 140 0.77 S6-54-8_U 2 16 111 0.61 S8-43-8_U 3 12 186 0.51 S8-54-8_U 2 12 148 0.44
S10-43-8_U 2 9.6 233 0.42
Equations (3.9) and (3.10) are used to convert the effective moment of inertia into the
equivalent moment of inertia for double and single L-headers, respectively. The equation for
double L-header assemblies was based on the 47 test results that are summarized in Table
3.6, while the single L-header equation was based on the 33 test results that are summarized
in Table 3.7.
For double L-headers:
(3.9)
and for single L-headers:
(3.10)
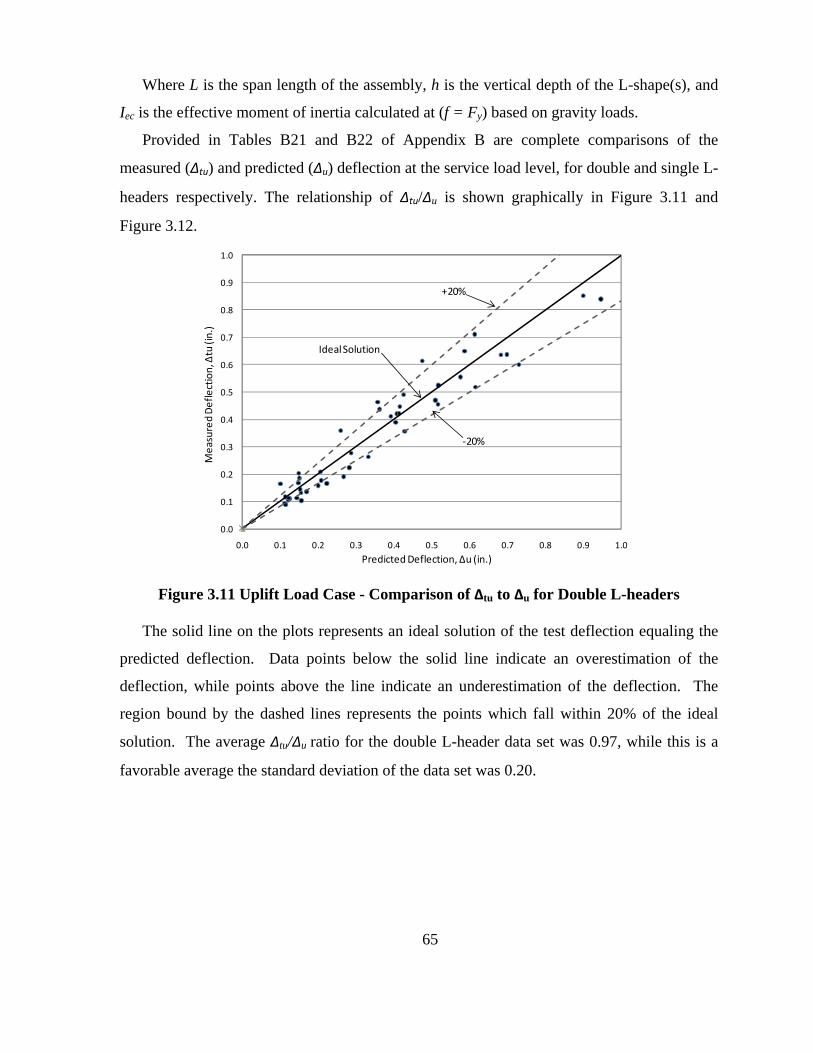
65
Where L is the span length of the assembly, h is the vertical depth of the L-shape(s), and
Iec is the effective moment of inertia calculated at (f = Fy) based on gravity loads.
Provided in Tables B21 and B22 of Appendix B are complete comparisons of the
measured (Δtu) and predicted (Δu) deflection at the service load level, for double and single L-
headers respectively. The relationship of Δtu/Δu is shown graphically in Figure 3.11 and
Figure 3.12.
0.0
0.1
0.2
0.3
0.4
0.5
0.6
0.7
0.8
0.9
1.0
0.0 0.1 0.2 0.3 0.4 0.5 0.6 0.7 0.8 0.9 1.0
Measured Deflection, Δtu (in.)
Predicted Deflection, Δu (in.)
+20%
Ideal Solution
‐20%
Figure 3.11 Uplift Load Case - Comparison of Δtu to Δu for Double L-headers
The solid line on the plots represents an ideal solution of the test deflection equaling the
predicted deflection. Data points below the solid line indicate an overestimation of the
deflection, while points above the line indicate an underestimation of the deflection. The
region bound by the dashed lines represents the points which fall within 20% of the ideal
solution. The average Δtu/Δu ratio for the double L-header data set was 0.97, while this is a
favorable average the standard deviation of the data set was 0.20.
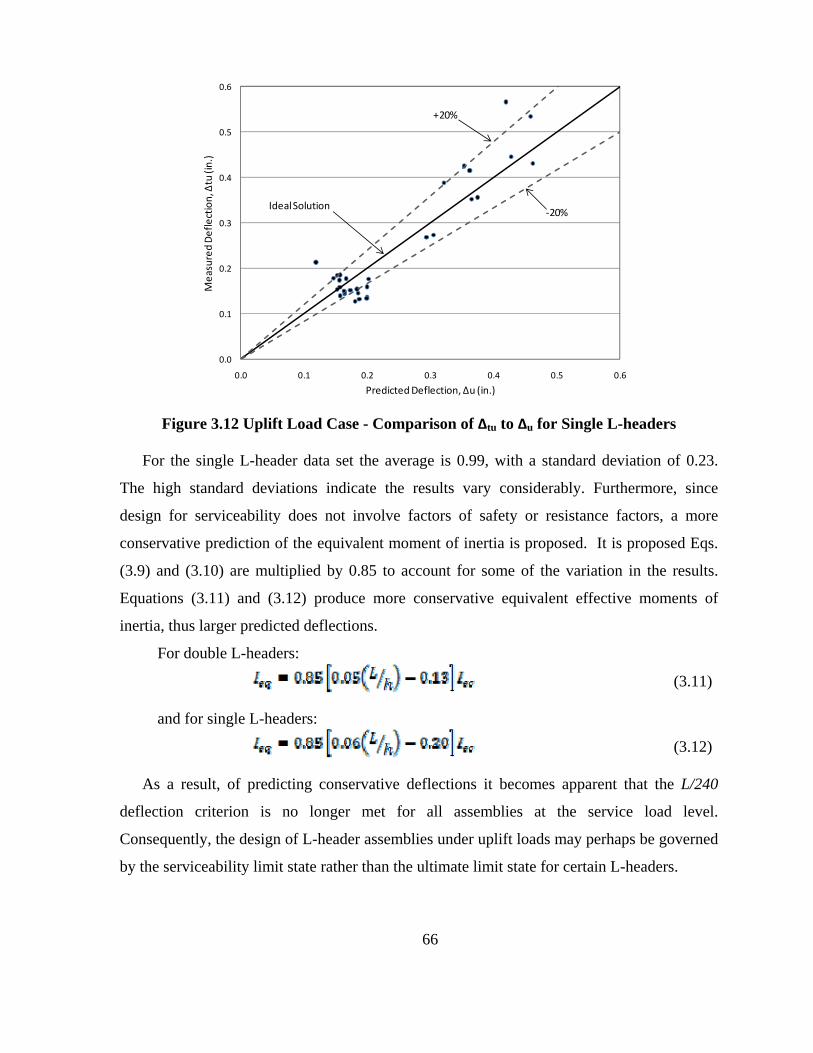
66
0.0
0.1
0.2
0.3
0.4
0.5
0.6
0.0 0.1 0.2 0.3 0.4 0.5 0.6
Measured Deflection, Δtu (in.)
Predicted Deflection, Δu (in.)
+20%
‐20%Ideal Solution
Figure 3.12 Uplift Load Case - Comparison of Δtu to Δu for Single L-headers
For the single L-header data set the average is 0.99, with a standard deviation of 0.23.
The high standard deviations indicate the results vary considerably. Furthermore, since
design for serviceability does not involve factors of safety or resistance factors, a more
conservative prediction of the equivalent moment of inertia is proposed. It is proposed Eqs.
(3.9) and (3.10) are multiplied by 0.85 to account for some of the variation in the results.
Equations (3.11) and (3.12) produce more conservative equivalent effective moments of
inertia, thus larger predicted deflections.
For double L-headers:
(3.11)
and for single L-headers:
(3.12)
As a result, of predicting conservative deflections it becomes apparent that the L/240
deflection criterion is no longer met for all assemblies at the service load level.
Consequently, the design of L-header assemblies under uplift loads may perhaps be governed
by the serviceability limit state rather than the ultimate limit state for certain L-headers.
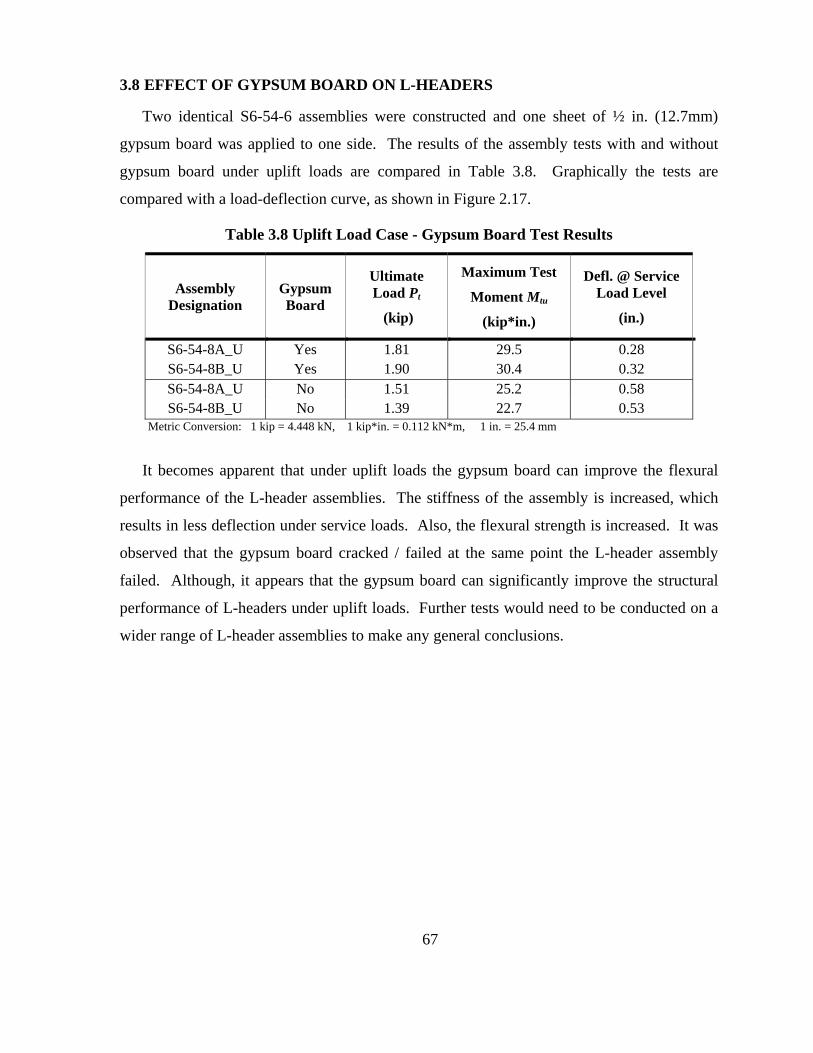
67
3.8 EFFECT OF GYPSUM BOARD ON L-HEADERS
Two identical S6-54-6 assemblies were constructed and one sheet of ½ in. (12.7mm)
gypsum board was applied to one side. The results of the assembly tests with and without
gypsum board under uplift loads are compared in Table 3.8. Graphically the tests are
compared with a load-deflection curve, as shown in Figure 2.17.
Table 3.8 Uplift Load Case - Gypsum Board Test Results
Assembly Designation
Gypsum Board
Ultimate Load Pt
(kip)
Maximum Test
Moment Mtu
(kip*in.)
Defl. @ Service Load Level
(in.)
S6-54-8A_U Yes 1.81 29.5 0.28 S6-54-8B_U Yes 1.90 30.4 0.32 S6-54-8A_U No 1.51 25.2 0.58 S6-54-8B_U No 1.39 22.7 0.53
Metric Conversion: 1 kip = 4.448 kN, 1 kip*in. = 0.112 kN*m, 1 in. = 25.4 mm
It becomes apparent that under uplift loads the gypsum board can improve the flexural
performance of the L-header assemblies. The stiffness of the assembly is increased, which
results in less deflection under service loads. Also, the flexural strength is increased. It was
observed that the gypsum board cracked / failed at the same point the L-header assembly
failed. Although, it appears that the gypsum board can significantly improve the structural
performance of L-headers under uplift loads. Further tests would need to be conducted on a
wider range of L-header assemblies to make any general conclusions.
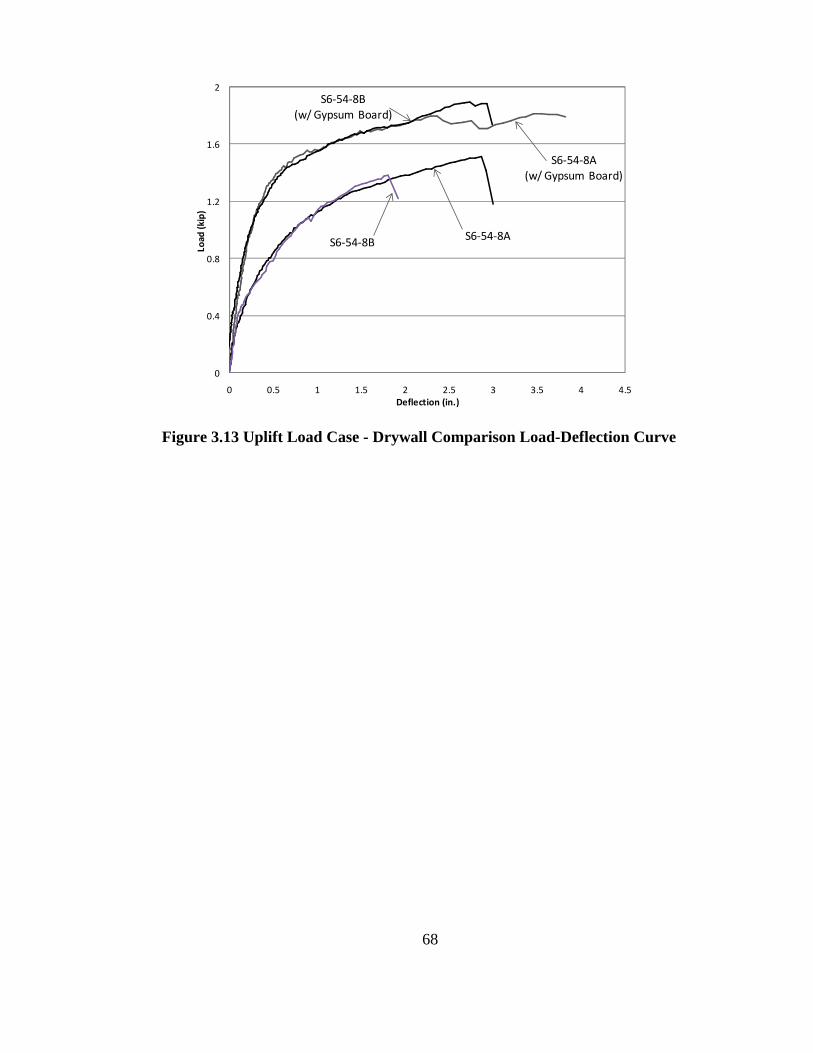
68
0
0.4
0.8
1.2
1.6
2
0 0.5 1 1.5 2 2.5 3 3.5 4 4.5
Load
(kip)
Deflection (in.)
S6‐54‐8A(w/ Gypsum Board)
S6‐54‐8B(w/ Gypsum Board)
S6‐54‐8AS6‐54‐8B
Figure 3.13 Uplift Load Case - Drywall Comparison Load-Deflection Curve
Chapter 4
CONCLUSIONS
Based on a total of 188 tests conducted, new flexural strength equations have been
proposed for both double and single L-headers. The proposed flexural strength equations
provide an improved approximation of the actual flexural strength of the L-header
assemblies, compared to the current AISI – Header Design Standard (AISI, 2007) provisions.
Under gravity loads the proposed equations take into account the effects web-crippling and
shear in short span assemblies and the inherit connection stiffness of long span assemblies.
In the case of uplift loads the proposed flexural strength equations account for both the
effects of shear and the reduced section properties associated with local buckling.
A new formulation to predict vertical deflections of single and double L-header under
gravity and uplift loads has also been proposed. The proposed formulations use general
simply supported flexural deformation equations, with an equivalent effective moment of
inertia term.
Based on the test results and analysis, the following conclusions of the flexural strength
and structural behavior of cold-formed steel L-headers were observed:
1. Gravity Load Case
• Failure of single and double L-header assemblies was observed to be either a
combination of flexure and web-crippling or purely flexural. Short span
assemblies showed signs of web-crippling as well as shear; however, assemblies
longer than 6ft (1.83m) were observed to fail purely in flexure.
• The behavior of short span assemblies is influenced by web-crippling, shear, and
flexure. The current AISI – Header Design Standard (AISI, 2007) bases the
nominal resistance of the assemblies on flexure alone; therefore, the nominal
flexural resistance of short span assemblies is over-estimated.
• Flexural failure is increasingly predominant in long span assemblies. For such
assemblies the nominal flexural resistance calculated as per the AISI - Header
Design Standard (AISI, 2007) results in accurate or underestimated resistance
values. For spans of 8ft (2.44m) or greater, it became evident that the connections
70
between the L-sections and the king studs provide an inherent stiffness; therefore,
acting as semi-rigid connections rather than pinned end connections.
• Flexure, shear, and localized web-crippling deformations play a significant role
in the total deflection of short span assemblies. Assemblies larger than 6ft
(1.83m) act as semi-rigid members. Depending on the assemblies fixity factor
the mid-span deflection can be considerably less than predicted by common
simply supported flexural deformation equations.
• With Gypsum board applied to the assemblies, little effect on the strength was
noticed for stiff L-header assemblies; however, for assemblies with lower
stiffness’ the gypsum board appears to influence the strength considerably.
2. Uplift Load Case
• Failure of single and double L-header assemblies was observed to be due to a
combination of flexural and shear. The unsupported webs showed signs of local
buckling immediately after loading commenced, which causes the strength and
stiffness to be significantly decreased.
• The new effective width formulation for unstiffened compression elements
subjected to stress gradient (Section B3.2 2(ii); CSA, 2007) is not practical for L-
headers under uplift loads. The new formulation produces effective section
properties which are excessively small, instead it is recommend the section
properties based on gravity loads be used for the uplift load case as well.
• Using the current AISI – Header Design Standard (AISI, 2007) to calculate
nominal flexural resistances of double L-headers produces exceptionally
conservative results.
• L-headers typically met the L/240 deflection criterion under service loads;
however, their mid-span deflections were generally greater than predicted by
common simply supported flexural deformation equations.
• Gypsum board can improve the flexural performance of the L-header assemblies.
The stiffness of the assembly is increased, resulting in lower deflections under
service loads. The flexural strength is also increased.
71
4.1 RECOMMENDATIONS FOR FUTURE RESEARCH
Based on the findings of this investigation, the following recommendations for future
research are proposed:
1. Additional experimental work should be carried out on 3ft (0.91m) and 4ft (1.22m)
short span assemblies to develop accurate span deflection expressions. The short span
assemblies meet the L/240 deflection criterion; however, due to inadequate testing a
deflection expression for short span assemblies could not be developed.
2. Verify the proposed design provisions for both single and double L-headers with the
use of 6-inch deep studs and track sections.
3. Additional testing is required to quantify the effect gypsum board has on the overall
strength when applied to L-header assemblies. This study provided an indication that
gypsum board can significantly increase the stiffness of assemblies with low section
properties and sections loaded under uplift. However, only limited testing was
conducted.
4. Further testing is required under uplift loads to successfully understand the combined
failure behavior.
5. Further analysis should be carried out to quantify the effect the track sections have on
the overall assemblies’ strength. As indicated in this investigation the flexural
strength of the L-header assembly is to some degree affected by the track sections.
6. Development of a finite element analysis program to efficiently model the structural
behavior and strength of L-header assemblies.
72
BIBLIOGRAPHY
AISI. (2001b). Commentary on North American Specification for the Design of Cold-
Formed Steel Structural Members, 2001 Edition. Washington, D.C.: American Iron and Steel
Institute.
AISI. (2001a). North American Specification for the Design of Cold-Formed Steel
Structural Members. Washington, D.C.: American Iron and Steel Institute.
AISI. (2007). North American Standard for Cold-Formed Steel Framing - Header Design
AISI S212-07 . Washington, D.C.: American Iron and Steel Institute.
ASTM. (2003). Standard Test Methods and Definitions for Mechanical Testing of Steel
Products (A370) & (A90). West Conshohocken, P.A.: American Society for Testing and
Materials.
Beshara, B. (2005). Calibration Program for Cold Formed Steel Members. Version 2.1.
University of Waterloo, Ontario, Canada.
CSA. (2007). North American Specification for the Design of Cold-Formed Steel
Structural Members S136-07 (AISI S100). Mississauga, Ontario: Canadian Standards
Association.
Elhajj, N. R., & LaBoube, R. A. (2000). L-Header Testing, Evaluation and Design
Methodology. Proceedings of the 15th International Specialty Conference on Cold-Formed
Steel Structures, (pp. 437-456). Department of Civil Engineering University of Missouri-
Rolla, Rolla, MO.
LaBoube, R. (2005). L-Header Testing, Evaluation and Design Methodology. Report
submitted to AISI Cold-Formed Steel Framing Committee.
NAHB-RC. (1997). Cold-Formed Steel Back-to-Back Header Assembly Tests
(Publication RG-9719). Washington, D.C.: American Iron and Steel Institute.
73
NAHB-RC. (1998). L-Shaped Header Testing, Evaluation, and Design Guidance. Upper
Marlboro, M.D.: National Association of Home Builders Research Center.
NAHB-RC. (2003). Testing of Steel Single L-Headers. Upper Marlboro, MD: National
Association of Home Builders Research Center.
SAS. (2004). Statistical Analysis System 9.1.3. Cary, NC, USA: SAS Institute Inc.
Xu, L. (2001). Second-order Analysis for Semirigid Steel Frame Design. Canadian
Journal of Civil Engineering, Vol. 28 , 59-76.
74
Appendix A
ASSEMBLY PROPERTIES
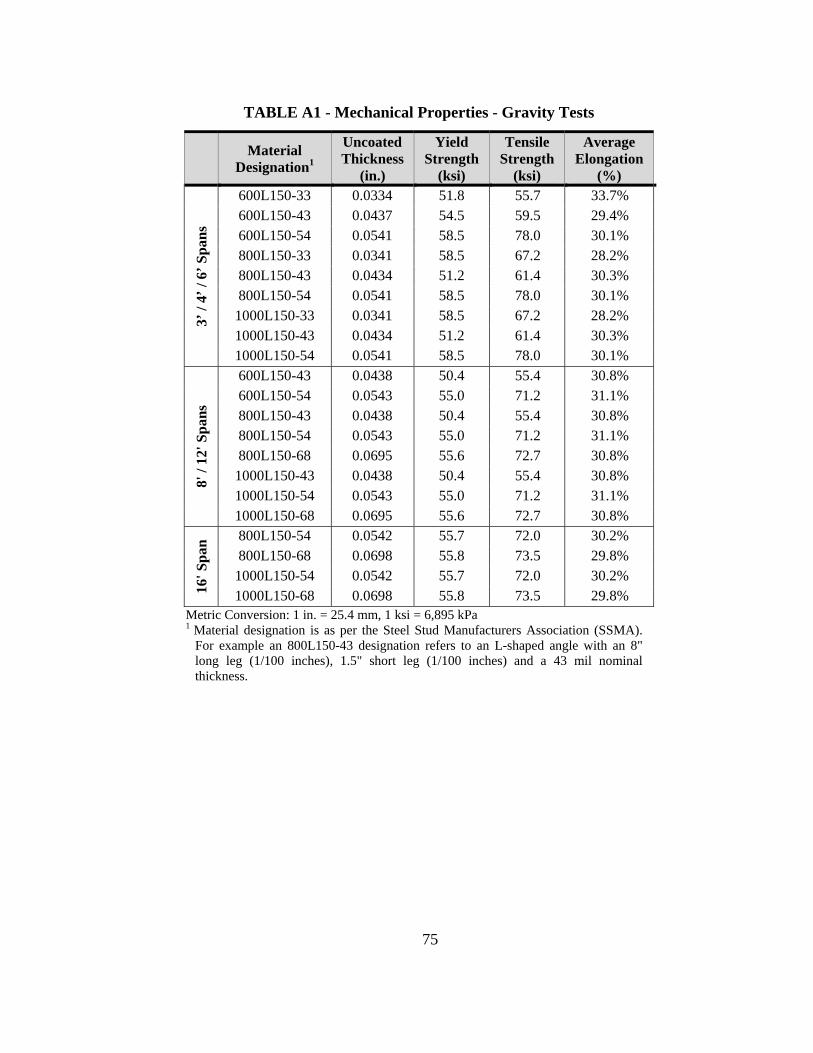
75
TABLE A1 - Mechanical Properties - Gravity Tests
Material Designation1
Uncoated Thickness
(in.)
Yield Strength
(ksi)
Tensile Strength
(ksi)
Average Elongation
(%)
3’ /
4’ /
6’ S
pans
600L150-33 0.0334 51.8 55.7 33.7% 600L150-43 0.0437 54.5 59.5 29.4% 600L150-54 0.0541 58.5 78.0 30.1% 800L150-33 0.0341 58.5 67.2 28.2% 800L150-43 0.0434 51.2 61.4 30.3% 800L150-54 0.0541 58.5 78.0 30.1%
1000L150-33 0.0341 58.5 67.2 28.2% 1000L150-43 0.0434 51.2 61.4 30.3% 1000L150-54 0.0541 58.5 78.0 30.1%
8' /
12' S
pans
600L150-43 0.0438 50.4 55.4 30.8% 600L150-54 0.0543 55.0 71.2 31.1% 800L150-43 0.0438 50.4 55.4 30.8% 800L150-54 0.0543 55.0 71.2 31.1% 800L150-68 0.0695 55.6 72.7 30.8%
1000L150-43 0.0438 50.4 55.4 30.8% 1000L150-54 0.0543 55.0 71.2 31.1% 1000L150-68 0.0695 55.6 72.7 30.8%
16' S
pan 800L150-54 0.0542 55.7 72.0 30.2%
800L150-68 0.0698 55.8 73.5 29.8% 1000L150-54 0.0542 55.7 72.0 30.2% 1000L150-68 0.0698 55.8 73.5 29.8%
Metric Conversion: 1 in. = 25.4 mm, 1 ksi = 6,895 kPa 1 Material designation is as per the Steel Stud Manufacturers Association (SSMA).
For example an 800L150-43 designation refers to an L-shaped angle with an 8" long leg (1/100 inches), 1.5" short leg (1/100 inches) and a 43 mil nominal thickness.
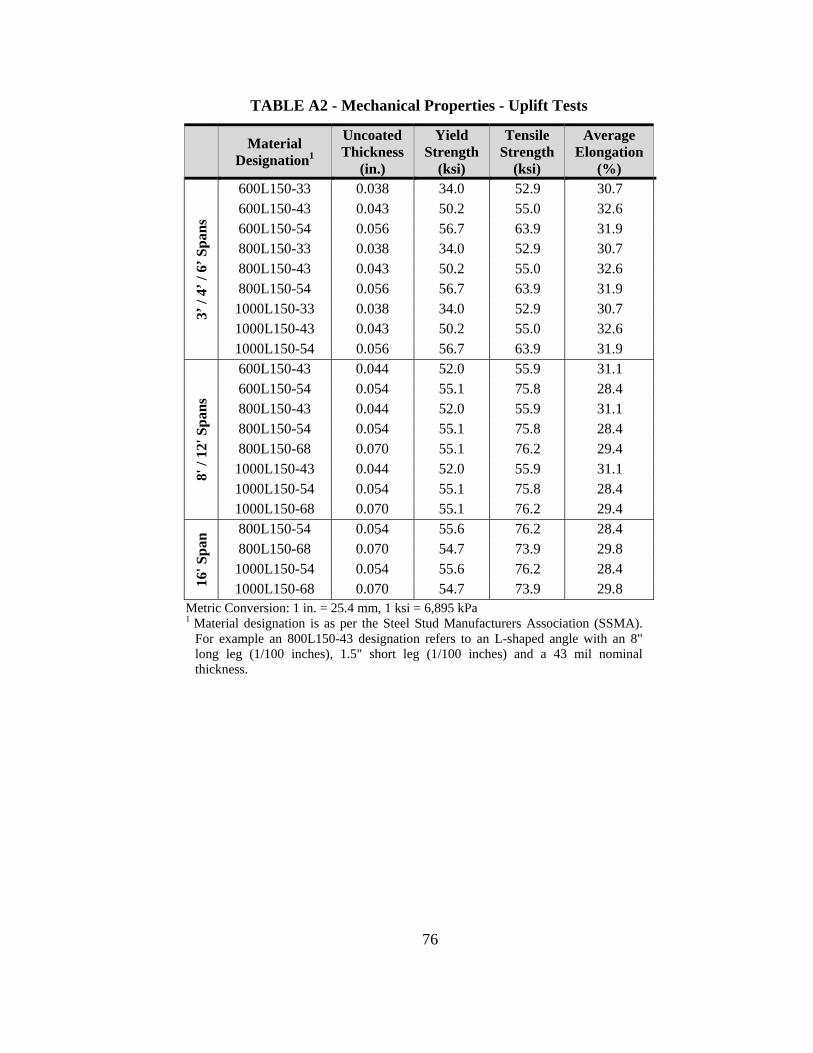
76
TABLE A2 - Mechanical Properties - Uplift Tests
Material Designation1
Uncoated Thickness
(in.)
Yield Strength
(ksi)
Tensile Strength
(ksi)
Average Elongation
(%)
3’ /
4’ /
6’ S
pans
600L150-33 0.038 34.0 52.9 30.7 600L150-43 0.043 50.2 55.0 32.6 600L150-54 0.056 56.7 63.9 31.9 800L150-33 0.038 34.0 52.9 30.7 800L150-43 0.043 50.2 55.0 32.6 800L150-54 0.056 56.7 63.9 31.9
1000L150-33 0.038 34.0 52.9 30.7 1000L150-43 0.043 50.2 55.0 32.6 1000L150-54 0.056 56.7 63.9 31.9
8' /
12' S
pans
600L150-43 0.044 52.0 55.9 31.1 600L150-54 0.054 55.1 75.8 28.4 800L150-43 0.044 52.0 55.9 31.1 800L150-54 0.054 55.1 75.8 28.4 800L150-68 0.070 55.1 76.2 29.4
1000L150-43 0.044 52.0 55.9 31.1 1000L150-54 0.054 55.1 75.8 28.4 1000L150-68 0.070 55.1 76.2 29.4
16' S
pan 800L150-54 0.054 55.6 76.2 28.4
800L150-68 0.070 54.7 73.9 29.8 1000L150-54 0.054 55.6 76.2 28.4 1000L150-68 0.070 54.7 73.9 29.8
Metric Conversion: 1 in. = 25.4 mm, 1 ksi = 6,895 kPa 1 Material designation is as per the Steel Stud Manufacturers Association (SSMA).
For example an 800L150-43 designation refers to an L-shaped angle with an 8" long leg (1/100 inches), 1.5" short leg (1/100 inches) and a 43 mil nominal thickness.

77
TABLE A3 - Section Properties (Gravity Tests)
Material
Designation1
Gross Moment of Inertia, Ig
(in.4)
Effective Moment of Inertia, Iec
(in.4)
Effective Section
Modulus, Sec (in.3)
3’ /
4’ /
6’ S
pans
600L150-33 0.94 0.74 0.27 600L150-43 1.23 1.00 0.37 600L150-54 1.51 1.28 0.48 800L150-33 2.11 1.70 0.45 800L150-43 2.67 2.25 0.61 800L150-54 3.32 2.87 0.78
1000L150-33 3.90 3.22 0.68 1000L150-43 4.95 4.25 0.90 1000L150-54 6.14 5.40 1.16
8' /
12' S
pans
600L150-43 1.23 1.01 0.37 600L150-54 1.52 1.29 0.48 800L150-43 2.70 2.27 0.61 800L150-54 3.33 2.89 0.79 800L150-68 4.23 3.84 1.07
1000L150-43 4.99 4.29 0.91 1000L150-54 6.16 5.44 1.17 1000L150-68 7.84 7.19 1.57
16' S
pan 800L150-54 3.32 2.88 0.79
800L150-68 4.25 3.86 1.07 1000L150-54 6.15 5.43 1.16 1000L150-68 7.87 7.23 1.57
Metric Conversion: 1 in.4 = 416,231 mm4, 1 in.3 = 16,387 mm3
1 Material designation is as per the Steel Stud Manufacturers Association (SSMA). For example an 800L150-43 designation refers to an L-shaped angle with an 8" long leg (1/100 inches), 1.5" short leg (1/100 inches) and a 43 mil nominal thickness.
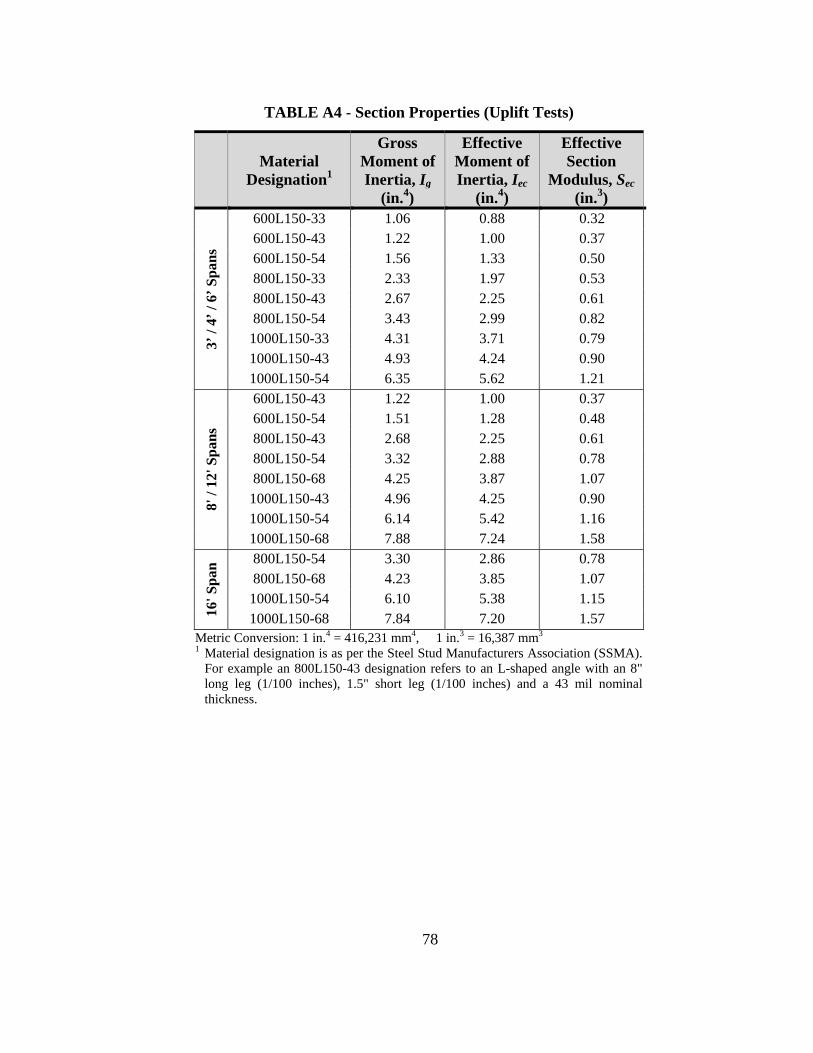
78
TABLE A4 - Section Properties (Uplift Tests)
Material
Designation1
Gross Moment of Inertia, Ig
(in.4)
Effective Moment of Inertia, Iec
(in.4)
Effective Section
Modulus, Sec (in.3)
3’ /
4’ /
6’ S
pans
600L150-33 1.06 0.88 0.32 600L150-43 1.22 1.00 0.37 600L150-54 1.56 1.33 0.50 800L150-33 2.33 1.97 0.53 800L150-43 2.67 2.25 0.61 800L150-54 3.43 2.99 0.82
1000L150-33 4.31 3.71 0.79 1000L150-43 4.93 4.24 0.90 1000L150-54 6.35 5.62 1.21
8' /
12' S
pans
600L150-43 1.22 1.00 0.37 600L150-54 1.51 1.28 0.48 800L150-43 2.68 2.25 0.61 800L150-54 3.32 2.88 0.78 800L150-68 4.25 3.87 1.07
1000L150-43 4.96 4.25 0.90 1000L150-54 6.14 5.42 1.16 1000L150-68 7.88 7.24 1.58
16' S
pan 800L150-54 3.30 2.86 0.78
800L150-68 4.23 3.85 1.07 1000L150-54 6.10 5.38 1.15 1000L150-68 7.84 7.20 1.57
Metric Conversion: 1 in.4 = 416,231 mm4, 1 in.3 = 16,387 mm3 1 Material designation is as per the Steel Stud Manufacturers Association (SSMA).
For example an 800L150-43 designation refers to an L-shaped angle with an 8" long leg (1/100 inches), 1.5" short leg (1/100 inches) and a 43 mil nominal thickness.
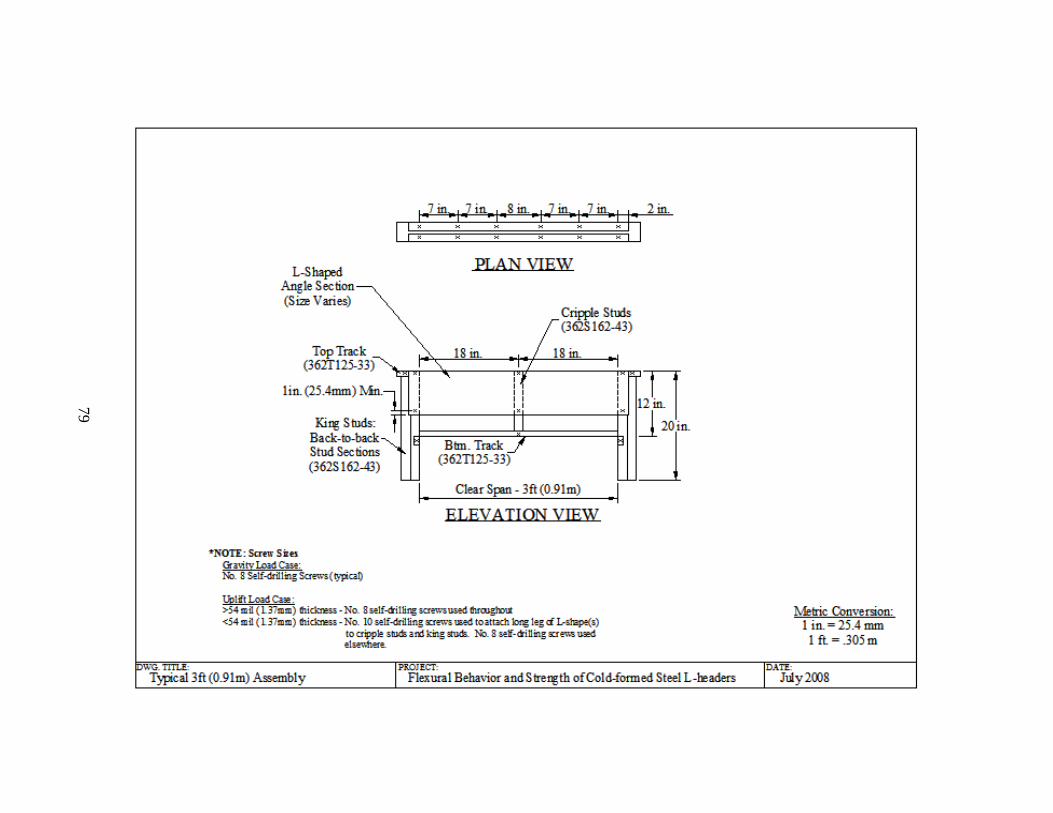
79
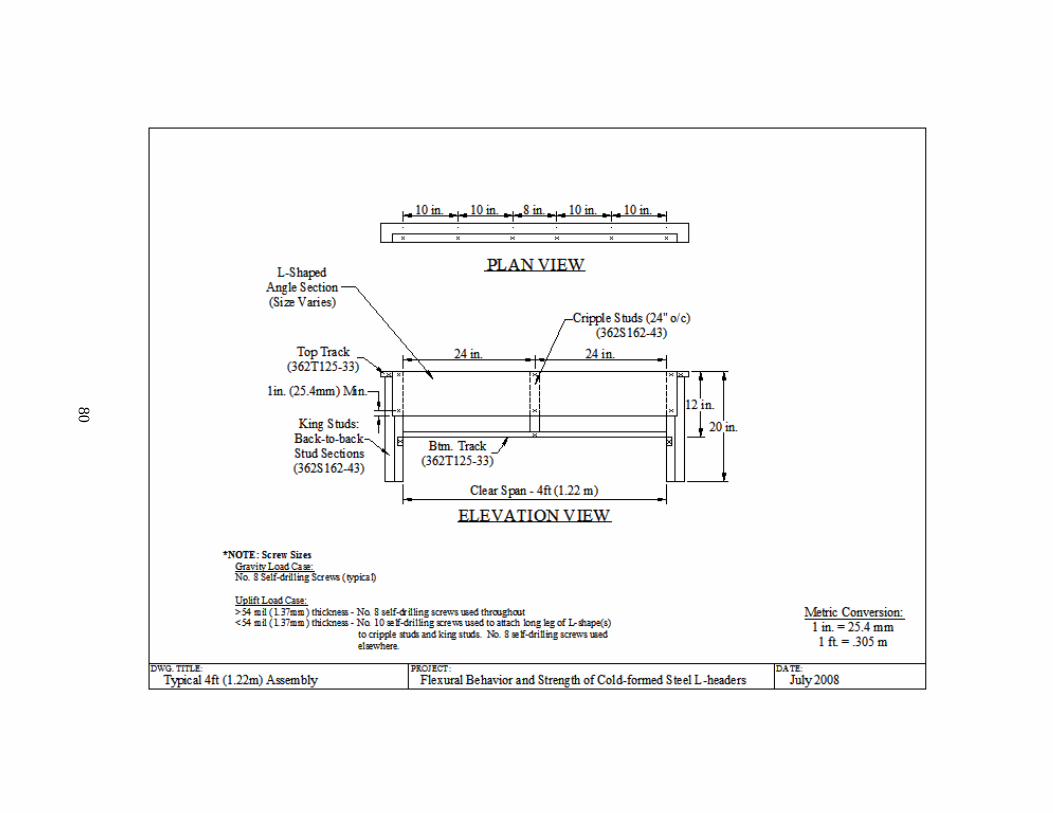
80
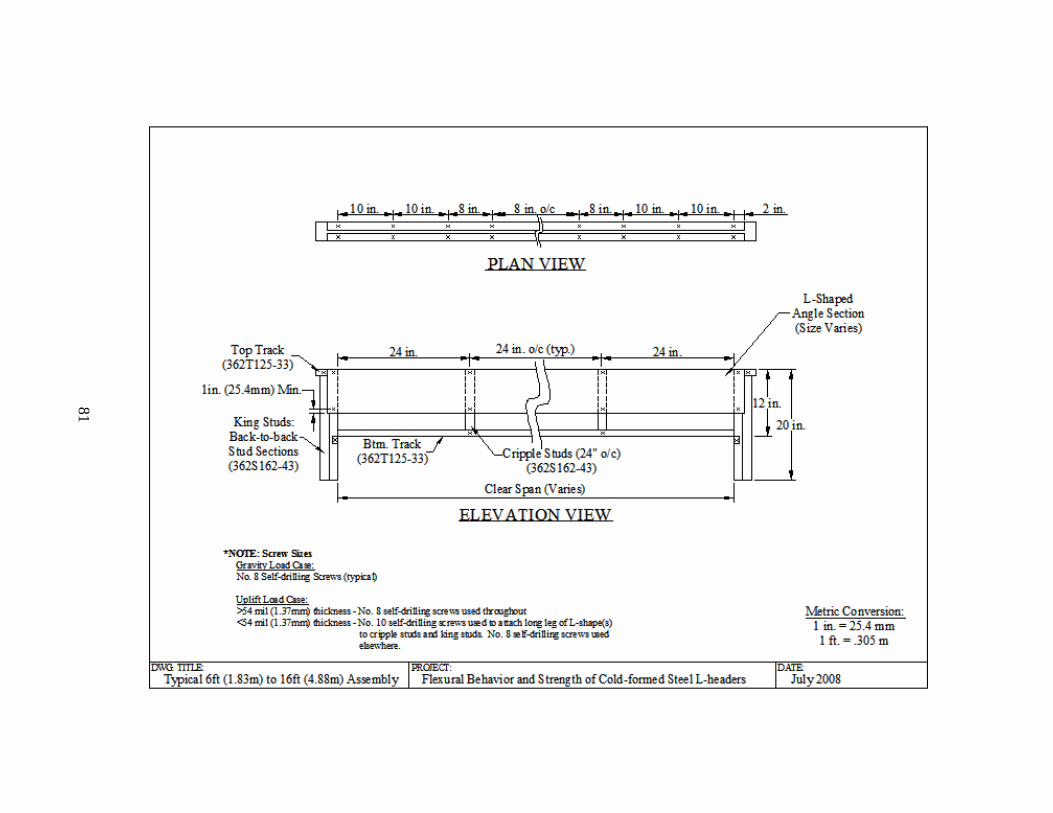
81
82
Appendix B
TEST DATA
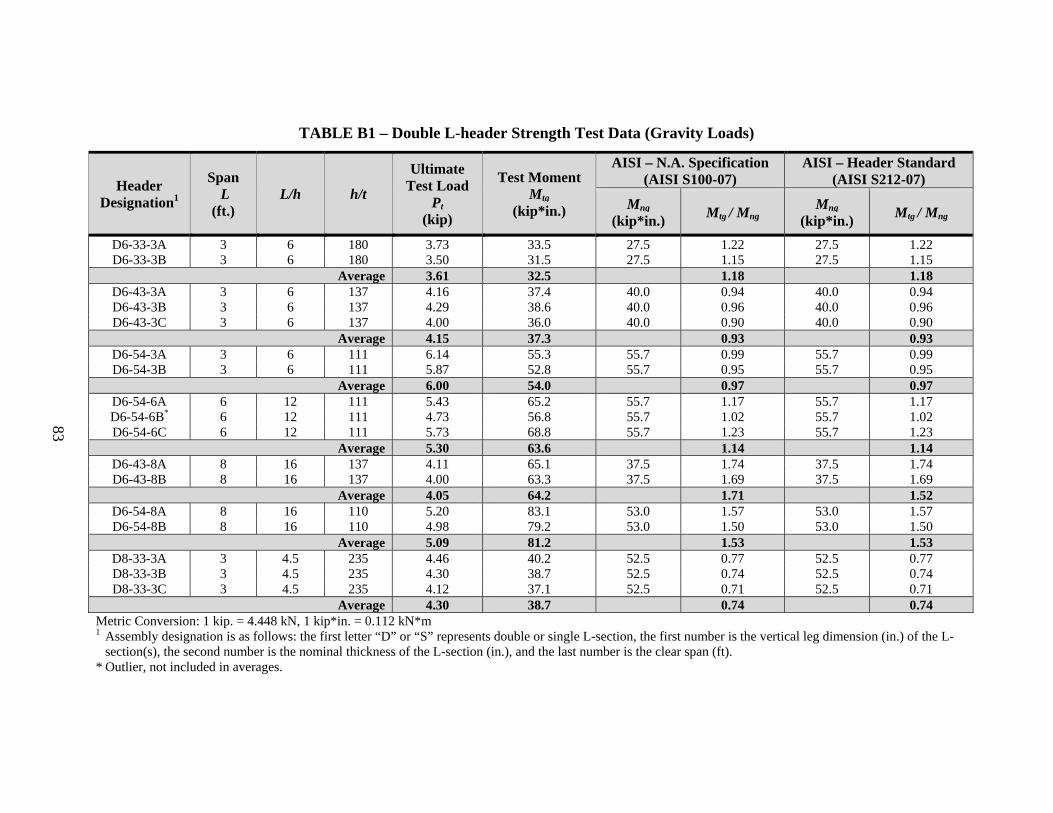
83
TABLE B1 – Double L-header Strength Test Data (Gravity Loads)
Header Designation1
Span L
(ft.) L/h h/t
Ultimate Test Load
Pt (kip)
Test Moment Mtg
(kip*in.)
AISI – N.A. Specification (AISI S100-07)
AISI – Header Standard (AISI S212-07)
Mng (kip*in.) Mtg / Mng
Mng (kip*in.) Mtg / Mng
D6-33-3A 3 6 180 3.73 33.5 27.5 1.22 27.5 1.22 D6-33-3B 3 6 180 3.50 31.5 27.5 1.15 27.5 1.15
Average 3.61 32.5 1.18 1.18 D6-43-3A 3 6 137 4.16 37.4 40.0 0.94 40.0 0.94 D6-43-3B 3 6 137 4.29 38.6 40.0 0.96 40.0 0.96 D6-43-3C 3 6 137 4.00 36.0 40.0 0.90 40.0 0.90
Average 4.15 37.3 0.93 0.93 D6-54-3A 3 6 111 6.14 55.3 55.7 0.99 55.7 0.99 D6-54-3B 3 6 111 5.87 52.8 55.7 0.95 55.7 0.95
Average 6.00 54.0 0.97 0.97 D6-54-6A 6 12 111 5.43 65.2 55.7 1.17 55.7 1.17 D6-54-6B* 6 12 111 4.73 56.8 55.7 1.02 55.7 1.02 D6-54-6C 6 12 111 5.73 68.8 55.7 1.23 55.7 1.23
Average 5.30 63.6 1.14 1.14 D6-43-8A 8 16 137 4.11 65.1 37.5 1.74 37.5 1.74 D6-43-8B 8 16 137 4.00 63.3 37.5 1.69 37.5 1.69
Average 4.05 64.2 1.71 1.52 D6-54-8A 8 16 110 5.20 83.1 53.0 1.57 53.0 1.57 D6-54-8B 8 16 110 4.98 79.2 53.0 1.50 53.0 1.50
Average 5.09 81.2 1.53 1.53 D8-33-3A 3 4.5 235 4.46 40.2 52.5 0.77 52.5 0.77 D8-33-3B 3 4.5 235 4.30 38.7 52.5 0.74 52.5 0.74 D8-33-3C 3 4.5 235 4.12 37.1 52.5 0.71 52.5 0.71
Average 4.30 38.7 0.74 0.74 Metric Conversion: 1 kip. = 4.448 kN, 1 kip*in. = 0.112 kN*m
1 Assembly designation is as follows: the first letter “D” or “S” represents double or single L-section, the first number is the vertical leg dimension (in.) of the L-section(s), the second number is the nominal thickness of the L-section (in.), and the last number is the clear span (ft).
* Outlier, not included in averages.
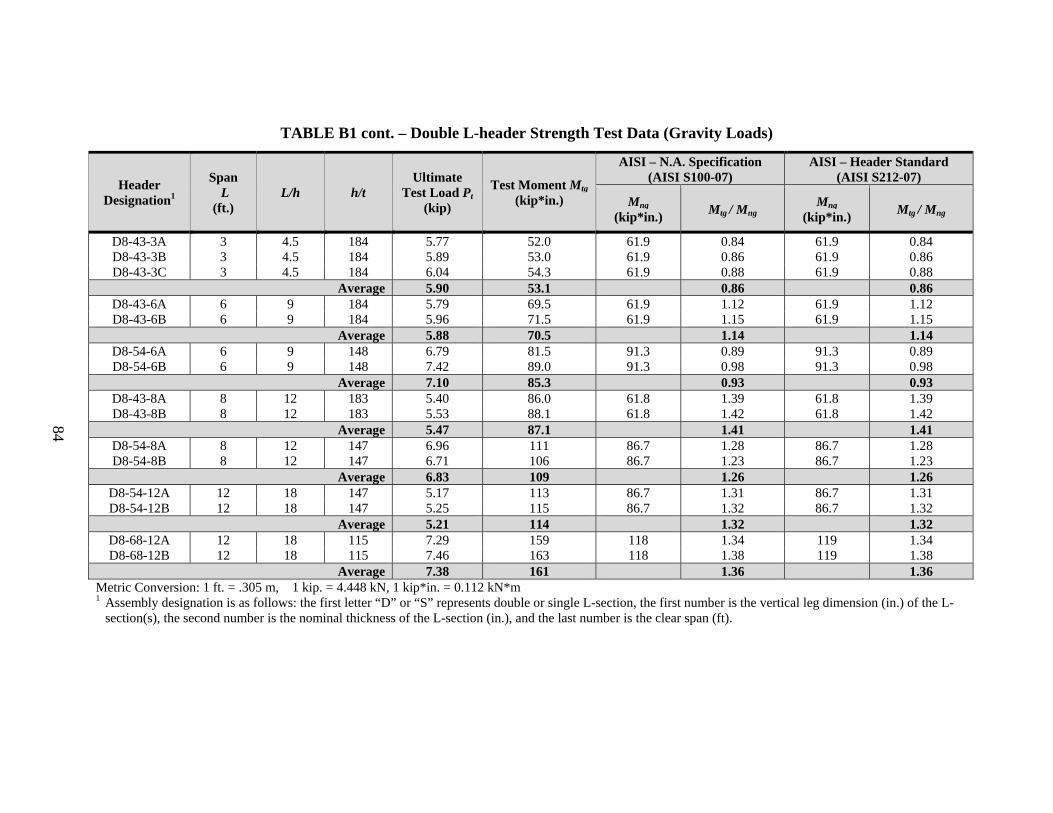
84
TABLE B1 cont. – Double L-header Strength Test Data (Gravity Loads)
Header Designation1
Span L
(ft.) L/h h/t
Ultimate Test Load Pt
(kip)
Test Moment Mtg (kip*in.)
AISI – N.A. Specification (AISI S100-07)
AISI – Header Standard (AISI S212-07)
Mng (kip*in.) Mtg / Mng
Mng (kip*in.) Mtg / Mng
D8-43-3A 3 4.5 184 5.77 52.0 61.9 0.84 61.9 0.84 D8-43-3B 3 4.5 184 5.89 53.0 61.9 0.86 61.9 0.86 D8-43-3C 3 4.5 184 6.04 54.3 61.9 0.88 61.9 0.88
Average 5.90 53.1 0.86 0.86 D8-43-6A 6 9 184 5.79 69.5 61.9 1.12 61.9 1.12 D8-43-6B 6 9 184 5.96 71.5 61.9 1.15 61.9 1.15
Average 5.88 70.5 1.14 1.14 D8-54-6A 6 9 148 6.79 81.5 91.3 0.89 91.3 0.89 D8-54-6B 6 9 148 7.42 89.0 91.3 0.98 91.3 0.98
Average 7.10 85.3 0.93 0.93 D8-43-8A 8 12 183 5.40 86.0 61.8 1.39 61.8 1.39 D8-43-8B 8 12 183 5.53 88.1 61.8 1.42 61.8 1.42
Average 5.47 87.1 1.41 1.41 D8-54-8A 8 12 147 6.96 111 86.7 1.28 86.7 1.28 D8-54-8B 8 12 147 6.71 106 86.7 1.23 86.7 1.23
Average 6.83 109 1.26 1.26 D8-54-12A 12 18 147 5.17 113 86.7 1.31 86.7 1.31 D8-54-12B 12 18 147 5.25 115 86.7 1.32 86.7 1.32
Average 5.21 114 1.32 1.32 D8-68-12A 12 18 115 7.29 159 118 1.34 119 1.34 D8-68-12B 12 18 115 7.46 163 118 1.38 119 1.38
Average 7.38 161 1.36 1.36 Metric Conversion: 1 ft. = .305 m, 1 kip. = 4.448 kN, 1 kip*in. = 0.112 kN*m
1 Assembly designation is as follows: the first letter “D” or “S” represents double or single L-section, the first number is the vertical leg dimension (in.) of the L-section(s), the second number is the nominal thickness of the L-section (in.), and the last number is the clear span (ft).
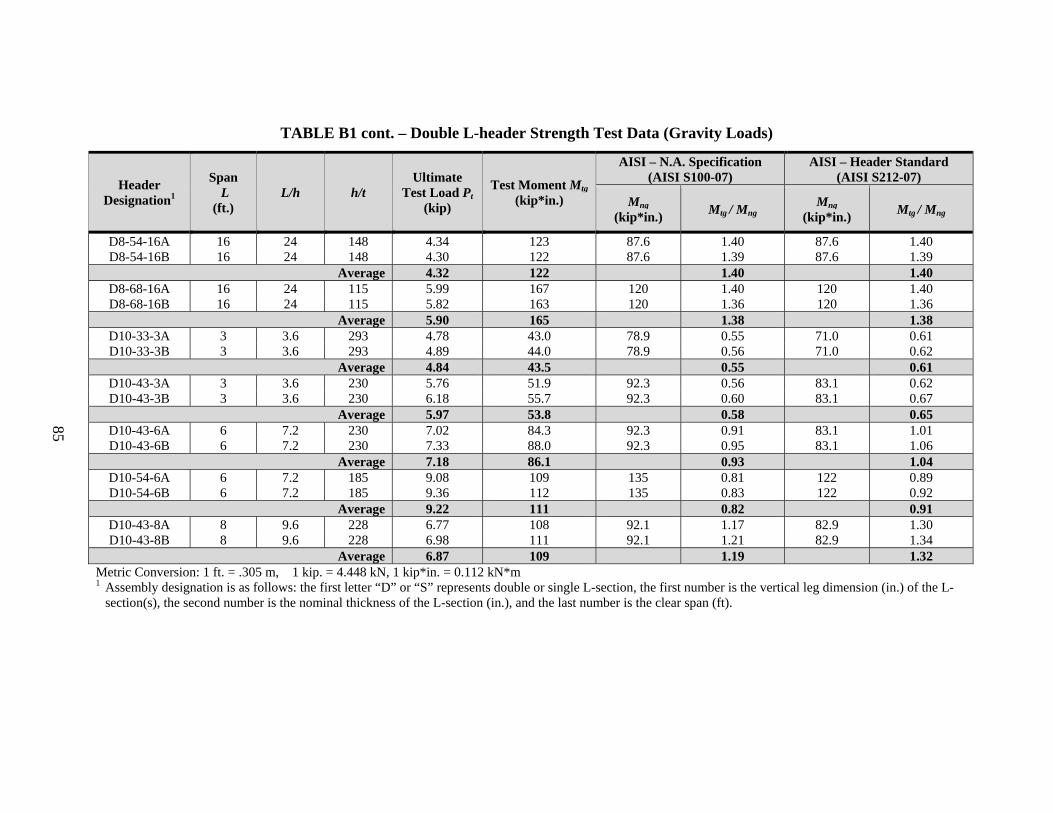
85
TABLE B1 cont. – Double L-header Strength Test Data (Gravity Loads)
Header Designation1
Span L
(ft.) L/h h/t
Ultimate Test Load Pt
(kip)
Test Moment Mtg (kip*in.)
AISI – N.A. Specification (AISI S100-07)
AISI – Header Standard (AISI S212-07)
Mng (kip*in.) Mtg / Mng
Mng (kip*in.) Mtg / Mng
D8-54-16A 16 24 148 4.34 123 87.6 1.40 87.6 1.40 D8-54-16B 16 24 148 4.30 122 87.6 1.39 87.6 1.39
Average 4.32 122 1.40 1.40 D8-68-16A 16 24 115 5.99 167 120 1.40 120 1.40 D8-68-16B 16 24 115 5.82 163 120 1.36 120 1.36
Average 5.90 165 1.38 1.38 D10-33-3A 3 3.6 293 4.78 43.0 78.9 0.55 71.0 0.61 D10-33-3B 3 3.6 293 4.89 44.0 78.9 0.56 71.0 0.62
Average 4.84 43.5 0.55 0.61 D10-43-3A 3 3.6 230 5.76 51.9 92.3 0.56 83.1 0.62 D10-43-3B 3 3.6 230 6.18 55.7 92.3 0.60 83.1 0.67
Average 5.97 53.8 0.58 0.65 D10-43-6A 6 7.2 230 7.02 84.3 92.3 0.91 83.1 1.01 D10-43-6B 6 7.2 230 7.33 88.0 92.3 0.95 83.1 1.06
Average 7.18 86.1 0.93 1.04 D10-54-6A 6 7.2 185 9.08 109 135 0.81 122 0.89 D10-54-6B 6 7.2 185 9.36 112 135 0.83 122 0.92
Average 9.22 111 0.82 0.91 D10-43-8A 8 9.6 228 6.77 108 92.1 1.17 82.9 1.30 D10-43-8B 8 9.6 228 6.98 111 92.1 1.21 82.9 1.34
Average 6.87 109 1.19 1.32 Metric Conversion: 1 ft. = .305 m, 1 kip. = 4.448 kN, 1 kip*in. = 0.112 kN*m
1 Assembly designation is as follows: the first letter “D” or “S” represents double or single L-section, the first number is the vertical leg dimension (in.) of the L-section(s), the second number is the nominal thickness of the L-section (in.), and the last number is the clear span (ft).
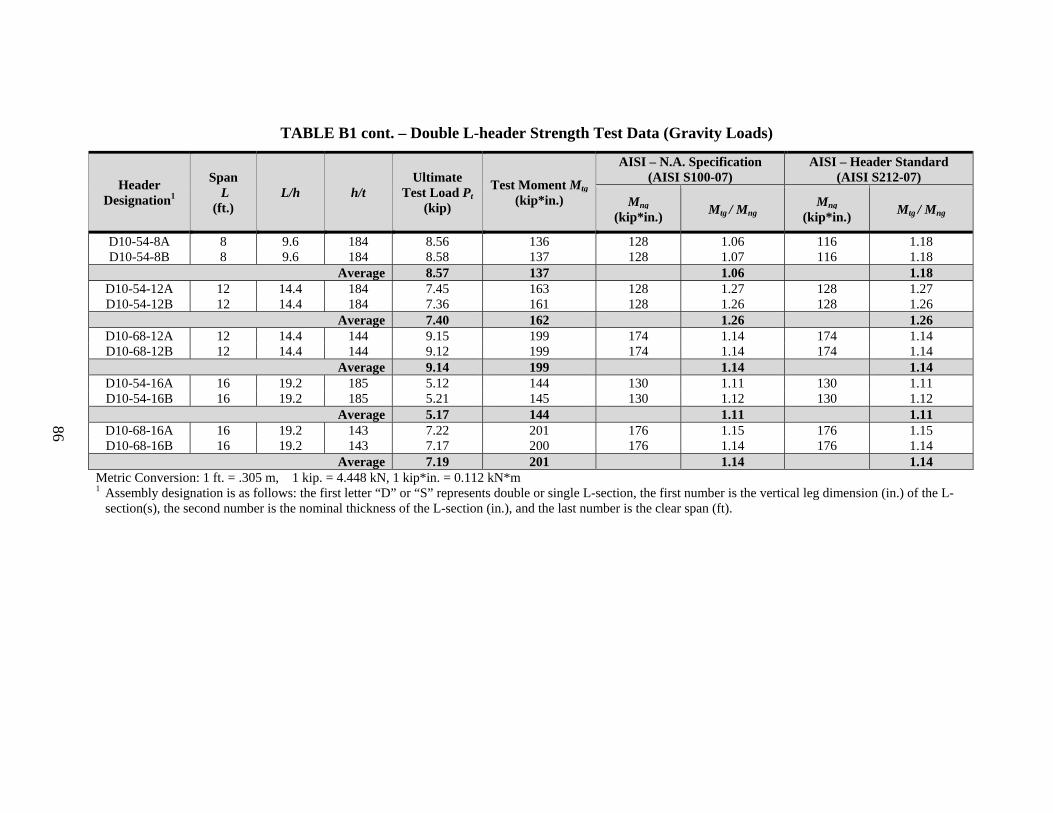
86
TABLE B1 cont. – Double L-header Strength Test Data (Gravity Loads)
Header Designation1
Span L
(ft.) L/h h/t
Ultimate Test Load Pt
(kip)
Test Moment Mtg (kip*in.)
AISI – N.A. Specification (AISI S100-07)
AISI – Header Standard (AISI S212-07)
Mng (kip*in.) Mtg / Mng
Mng (kip*in.) Mtg / Mng
D10-54-8A 8 9.6 184 8.56 136 128 1.06 116 1.18 D10-54-8B 8 9.6 184 8.58 137 128 1.07 116 1.18
Average 8.57 137 1.06 1.18 D10-54-12A 12 14.4 184 7.45 163 128 1.27 128 1.27 D10-54-12B 12 14.4 184 7.36 161 128 1.26 128 1.26
Average 7.40 162 1.26 1.26 D10-68-12A 12 14.4 144 9.15 199 174 1.14 174 1.14 D10-68-12B 12 14.4 144 9.12 199 174 1.14 174 1.14
Average 9.14 199 1.14 1.14 D10-54-16A 16 19.2 185 5.12 144 130 1.11 130 1.11 D10-54-16B 16 19.2 185 5.21 145 130 1.12 130 1.12
Average 5.17 144 1.11 1.11 D10-68-16A 16 19.2 143 7.22 201 176 1.15 176 1.15 D10-68-16B 16 19.2 143 7.17 200 176 1.14 176 1.14
Average 7.19 201 1.14 1.14 Metric Conversion: 1 ft. = .305 m, 1 kip. = 4.448 kN, 1 kip*in. = 0.112 kN*m
1 Assembly designation is as follows: the first letter “D” or “S” represents double or single L-section, the first number is the vertical leg dimension (in.) of the L-section(s), the second number is the nominal thickness of the L-section (in.), and the last number is the clear span (ft).

87
TABLE B2 – Single L-header Strength Test Data (Gravity Loads)
Header Designation1
Span L
(ft.) L/h h/t
Ultimate Test Load Pt
(kip)
Test Moment Mtg (kip*in.)
AISI – N.A. Specification (AISI S100-07)
AISI – Header Standard (AISI S212-07)
Mng (kip*in.) Mtg / Mng
Mng (kip*in.) Mtg / Mng
S6-33-4A 4 8 180 1.37 16.5 13.7 1.20 13.7 1.20 S6-33-4B 4 8 180 1.47 17.6 13.7 1.28 13.7 1.28 S6-33-4C 4 8 180 1.67 20.0 13.7 1.46 13.7 1.46
Average 1.50 18.0 1.31 1.31 S6-43-4A 4 8 137 1.69 20.3 20.0 1.02 20.0 1.02 S6-43-4B 4 8 137 1.61 19.3 20.0 0.97 20.0 0.97 S6-43-4C 4 8 137 2.00 24.0 20.0 1.20 20.0 1.20 S6-43-4D 4 8 137 1.88 22.5 20.0 1.12 20.0 1.12
Average 1.80 21.6 1.08 1.08 S6-33-6A 6 12 180 1.71 20.6 13.7 1.50 N/A S6-33-6B 6 12 180 1.71 20.6 13.7 1.50 N/A S6-33-6C 6 12 180 1.73 20.7 13.7 1.51 N/A
Average 1.72 20.6 1.50 N/A S6-43-6A 6 12 137 1.93 23.1 20.0 1.16 N/A S6-43-6B 6 12 137 2.29 27.5 20.0 1.37 N/A
S6-43-6C* 6 12 137 3.21 38.5 20.0 1.93 N/A Average 2.11 25.3 1.26 N/A
S6-43-8A 8 16 137 2.27 35.7 18.8 1.90 N/A S6-43-8B 8 16 137 2.25 35.5 18.8 1.89 N/A
Average 2.26 35.6 1.90 N/A S6-54-8A 8 16 110 2.71 42.6 26.5 1.61 N/A S6-54-8B 8 16 110 2.66 42.1 26.5 1.59 N/A
Average 2.68 42.3 1.60 N/A Metric Conversion: 1 ft. = .305 m, 1 kip. = 4.448 kN, 1 kip*in. = 0.112 kN*m
1 Assembly designation is as follows: the first letter “D” or “S” represents double or single L-section, the first number is the vertical leg dimension (in.) of the L-section(s), the second number is the nominal thickness of the L-section (in.), and the last number is the clear span (ft).
*Outlier, not included in averages.
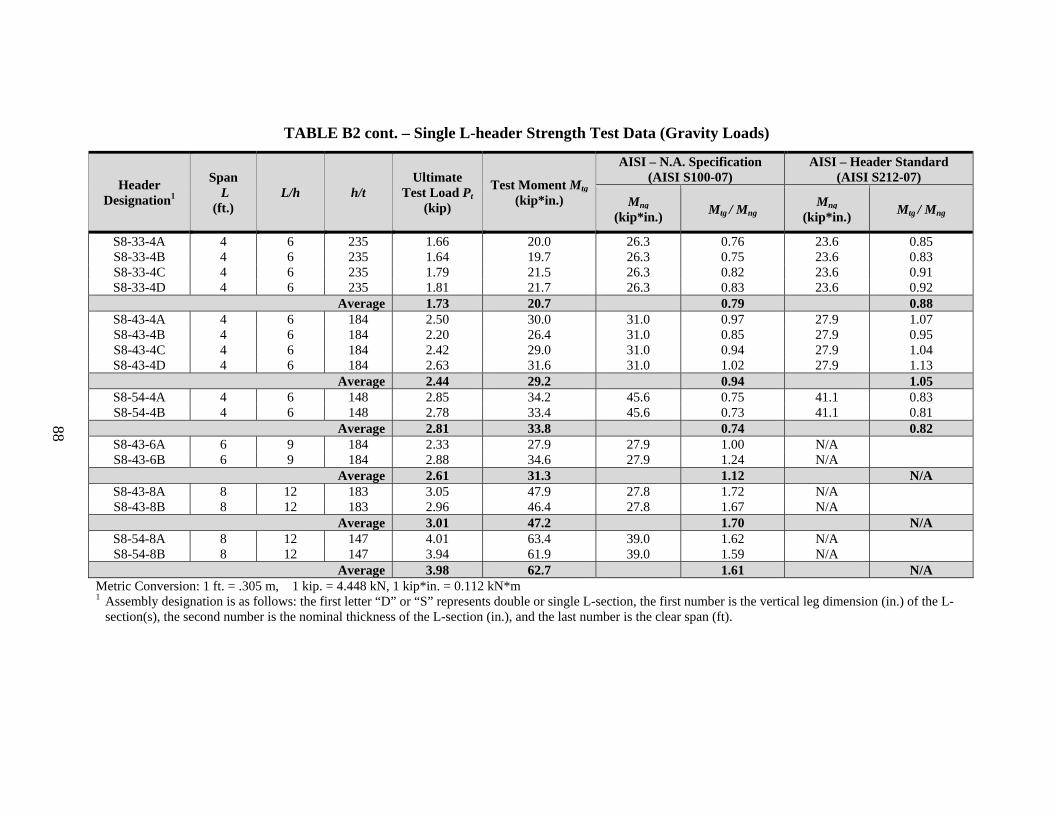
88
TABLE B2 cont. – Single L-header Strength Test Data (Gravity Loads)
Header Designation1
Span L
(ft.) L/h h/t
Ultimate Test Load Pt
(kip)
Test Moment Mtg (kip*in.)
AISI – N.A. Specification (AISI S100-07)
AISI – Header Standard (AISI S212-07)
Mng (kip*in.) Mtg / Mng
Mng (kip*in.) Mtg / Mng
S8-33-4A 4 6 235 1.66 20.0 26.3 0.76 23.6 0.85 S8-33-4B 4 6 235 1.64 19.7 26.3 0.75 23.6 0.83 S8-33-4C 4 6 235 1.79 21.5 26.3 0.82 23.6 0.91 S8-33-4D 4 6 235 1.81 21.7 26.3 0.83 23.6 0.92
Average 1.73 20.7 0.79 0.88 S8-43-4A 4 6 184 2.50 30.0 31.0 0.97 27.9 1.07 S8-43-4B 4 6 184 2.20 26.4 31.0 0.85 27.9 0.95 S8-43-4C 4 6 184 2.42 29.0 31.0 0.94 27.9 1.04 S8-43-4D 4 6 184 2.63 31.6 31.0 1.02 27.9 1.13
Average 2.44 29.2 0.94 1.05 S8-54-4A 4 6 148 2.85 34.2 45.6 0.75 41.1 0.83 S8-54-4B 4 6 148 2.78 33.4 45.6 0.73 41.1 0.81
Average 2.81 33.8 0.74 0.82 S8-43-6A 6 9 184 2.33 27.9 27.9 1.00 N/A S8-43-6B 6 9 184 2.88 34.6 27.9 1.24 N/A
Average 2.61 31.3 1.12 N/A S8-43-8A 8 12 183 3.05 47.9 27.8 1.72 N/A S8-43-8B 8 12 183 2.96 46.4 27.8 1.67 N/A
Average 3.01 47.2 1.70 N/A S8-54-8A 8 12 147 4.01 63.4 39.0 1.62 N/A S8-54-8B 8 12 147 3.94 61.9 39.0 1.59 N/A
Average 3.98 62.7 1.61 N/A Metric Conversion: 1 ft. = .305 m, 1 kip. = 4.448 kN, 1 kip*in. = 0.112 kN*m
1 Assembly designation is as follows: the first letter “D” or “S” represents double or single L-section, the first number is the vertical leg dimension (in.) of the L-section(s), the second number is the nominal thickness of the L-section (in.), and the last number is the clear span (ft).
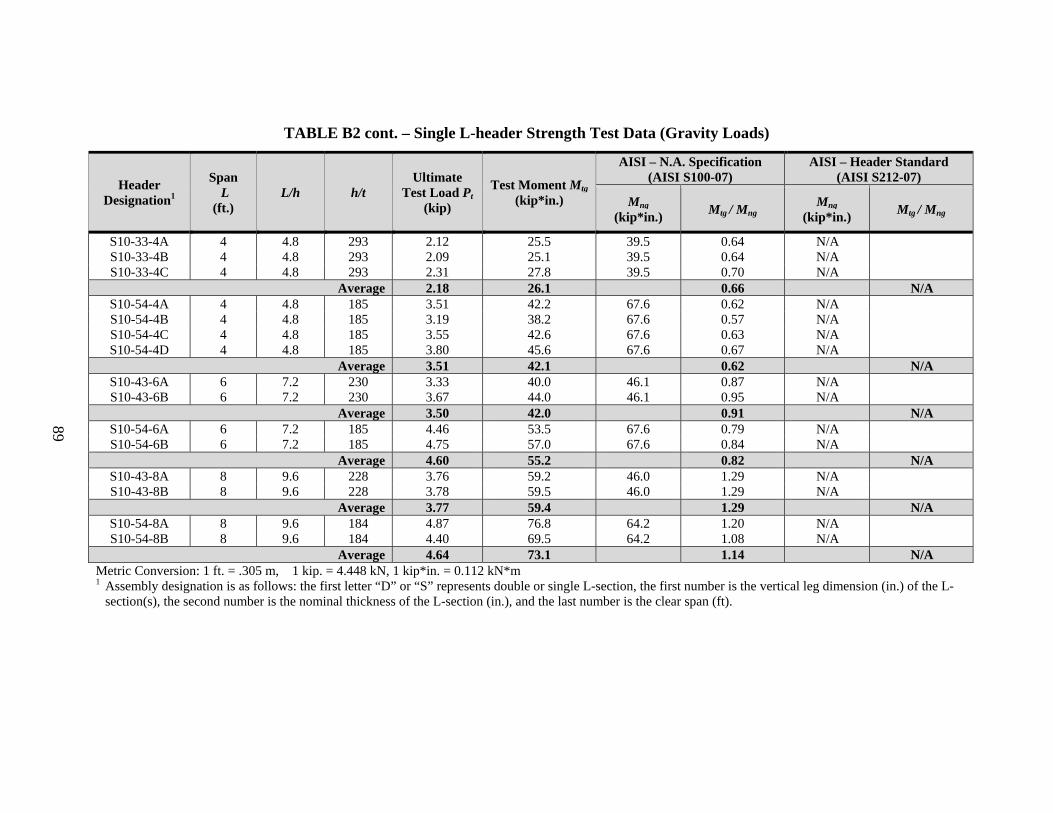
89
TABLE B2 cont. – Single L-header Strength Test Data (Gravity Loads)
Header Designation1
Span L
(ft.) L/h h/t
Ultimate Test Load Pt
(kip)
Test Moment Mtg (kip*in.)
AISI – N.A. Specification (AISI S100-07)
AISI – Header Standard (AISI S212-07)
Mng (kip*in.) Mtg / Mng
Mng (kip*in.) Mtg / Mng
S10-33-4A 4 4.8 293 2.12 25.5 39.5 0.64 N/A S10-33-4B 4 4.8 293 2.09 25.1 39.5 0.64 N/A S10-33-4C 4 4.8 293 2.31 27.8 39.5 0.70 N/A
Average 2.18 26.1 0.66 N/A S10-54-4A 4 4.8 185 3.51 42.2 67.6 0.62 N/A S10-54-4B 4 4.8 185 3.19 38.2 67.6 0.57 N/A S10-54-4C 4 4.8 185 3.55 42.6 67.6 0.63 N/A S10-54-4D 4 4.8 185 3.80 45.6 67.6 0.67 N/A
Average 3.51 42.1 0.62 N/A S10-43-6A 6 7.2 230 3.33 40.0 46.1 0.87 N/A S10-43-6B 6 7.2 230 3.67 44.0 46.1 0.95 N/A
Average 3.50 42.0 0.91 N/A S10-54-6A 6 7.2 185 4.46 53.5 67.6 0.79 N/A S10-54-6B 6 7.2 185 4.75 57.0 67.6 0.84 N/A
Average 4.60 55.2 0.82 N/A S10-43-8A 8 9.6 228 3.76 59.2 46.0 1.29 N/A S10-43-8B 8 9.6 228 3.78 59.5 46.0 1.29 N/A
Average 3.77 59.4 1.29 N/A S10-54-8A 8 9.6 184 4.87 76.8 64.2 1.20 N/A S10-54-8B 8 9.6 184 4.40 69.5 64.2 1.08 N/A
Average 4.64 73.1 1.14 N/A Metric Conversion: 1 ft. = .305 m, 1 kip. = 4.448 kN, 1 kip*in. = 0.112 kN*m
1 Assembly designation is as follows: the first letter “D” or “S” represents double or single L-section, the first number is the vertical leg dimension (in.) of the L-section(s), the second number is the nominal thickness of the L-section (in.), and the last number is the clear span (ft).
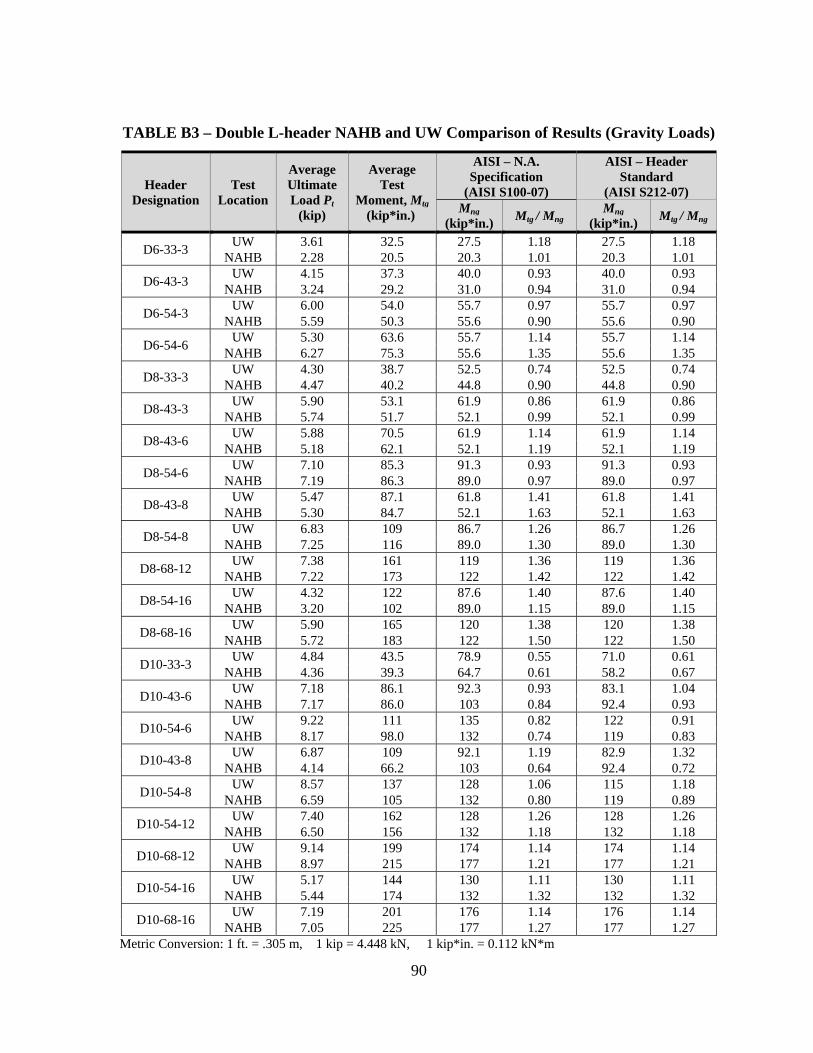
90
TABLE B3 – Double L-header NAHB and UW Comparison of Results (Gravity Loads)
Header Designation
Test Location
Average Ultimate Load Pt
(kip)
Average Test
Moment, Mtg (kip*in.)
AISI – N.A. Specification
(AISI S100-07)
AISI – Header Standard
(AISI S212-07) Mng
(kip*in.) Mtg / Mng Mng
(kip*in.) Mtg / Mng
D6-33-3 UW 3.61 32.5 27.5 1.18 27.5 1.18 NAHB 2.28 20.5 20.3 1.01 20.3 1.01
D6-43-3 UW 4.15 37.3 40.0 0.93 40.0 0.93 NAHB 3.24 29.2 31.0 0.94 31.0 0.94
D6-54-3 UW 6.00 54.0 55.7 0.97 55.7 0.97 NAHB 5.59 50.3 55.6 0.90 55.6 0.90
D6-54-6 UW 5.30 63.6 55.7 1.14 55.7 1.14 NAHB 6.27 75.3 55.6 1.35 55.6 1.35
D8-33-3 UW 4.30 38.7 52.5 0.74 52.5 0.74 NAHB 4.47 40.2 44.8 0.90 44.8 0.90
D8-43-3 UW 5.90 53.1 61.9 0.86 61.9 0.86 NAHB 5.74 51.7 52.1 0.99 52.1 0.99
D8-43-6 UW 5.88 70.5 61.9 1.14 61.9 1.14 NAHB 5.18 62.1 52.1 1.19 52.1 1.19
D8-54-6 UW 7.10 85.3 91.3 0.93 91.3 0.93 NAHB 7.19 86.3 89.0 0.97 89.0 0.97
D8-43-8 UW 5.47 87.1 61.8 1.41 61.8 1.41 NAHB 5.30 84.7 52.1 1.63 52.1 1.63
D8-54-8 UW 6.83 109 86.7 1.26 86.7 1.26 NAHB 7.25 116 89.0 1.30 89.0 1.30
D8-68-12 UW 7.38 161 119 1.36 119 1.36 NAHB 7.22 173 122 1.42 122 1.42
D8-54-16 UW 4.32 122 87.6 1.40 87.6 1.40 NAHB 3.20 102 89.0 1.15 89.0 1.15
D8-68-16 UW 5.90 165 120 1.38 120 1.38 NAHB 5.72 183 122 1.50 122 1.50
D10-33-3 UW 4.84 43.5 78.9 0.55 71.0 0.61 NAHB 4.36 39.3 64.7 0.61 58.2 0.67
D10-43-6 UW 7.18 86.1 92.3 0.93 83.1 1.04 NAHB 7.17 86.0 103 0.84 92.4 0.93
D10-54-6 UW 9.22 111 135 0.82 122 0.91 NAHB 8.17 98.0 132 0.74 119 0.83
D10-43-8 UW 6.87 109 92.1 1.19 82.9 1.32 NAHB 4.14 66.2 103 0.64 92.4 0.72
D10-54-8 UW 8.57 137 128 1.06 115 1.18 NAHB 6.59 105 132 0.80 119 0.89
D10-54-12 UW 7.40 162 128 1.26 128 1.26 NAHB 6.50 156 132 1.18 132 1.18
D10-68-12 UW 9.14 199 174 1.14 174 1.14 NAHB 8.97 215 177 1.21 177 1.21
D10-54-16 UW 5.17 144 130 1.11 130 1.11 NAHB 5.44 174 132 1.32 132 1.32
D10-68-16 UW 7.19 201 176 1.14 176 1.14 NAHB 7.05 225 177 1.27 177 1.27
Metric Conversion: 1 ft. = .305 m, 1 kip = 4.448 kN, 1 kip*in. = 0.112 kN*m
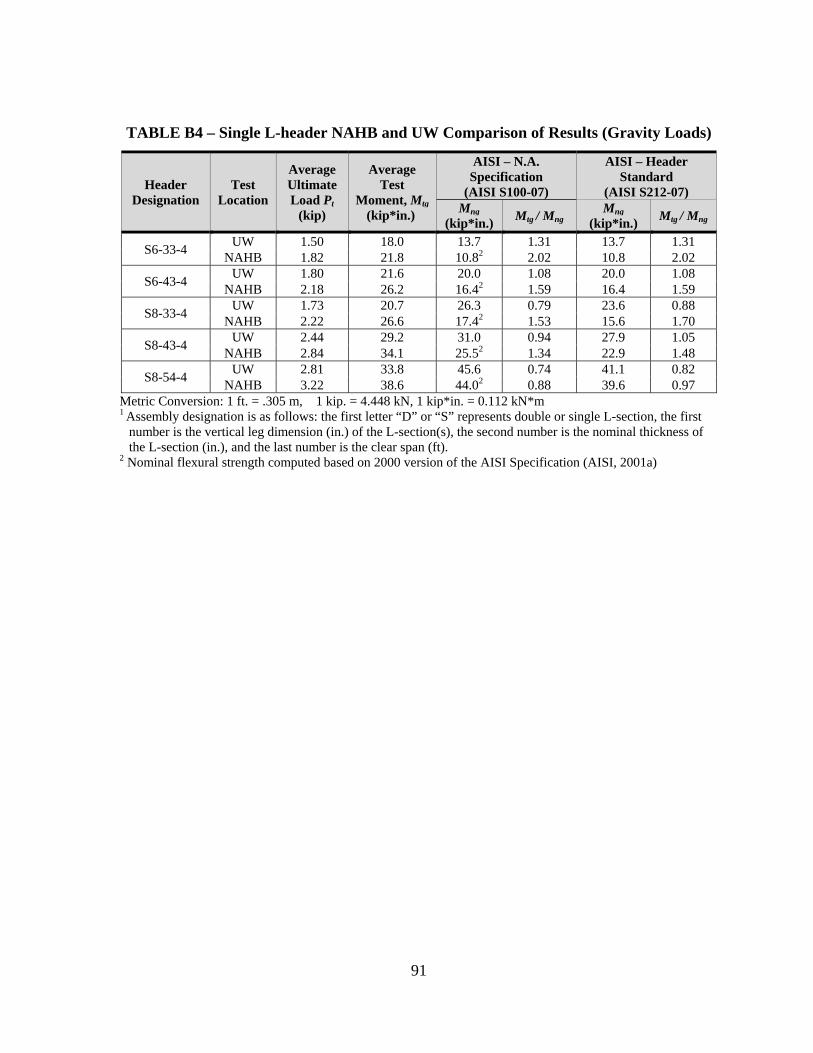
91
TABLE B4 – Single L-header NAHB and UW Comparison of Results (Gravity Loads)
Header Designation
Test Location
Average Ultimate Load Pt
(kip)
Average Test
Moment, Mtg (kip*in.)
AISI – N.A. Specification
(AISI S100-07)
AISI – Header Standard
(AISI S212-07) Mng
(kip*in.) Mtg / Mng Mng
(kip*in.) Mtg / Mng
S6-33-4 UW 1.50 18.0 13.7 1.31 13.7 1.31 NAHB 1.82 21.8 10.82 2.02 10.8 2.02
S6-43-4 UW 1.80 21.6 20.0 1.08 20.0 1.08 NAHB 2.18 26.2 16.42 1.59 16.4 1.59
S8-33-4 UW 1.73 20.7 26.3 0.79 23.6 0.88 NAHB 2.22 26.6 17.42 1.53 15.6 1.70
S8-43-4 UW 2.44 29.2 31.0 0.94 27.9 1.05 NAHB 2.84 34.1 25.52 1.34 22.9 1.48
S8-54-4 UW 2.81 33.8 45.6 0.74 41.1 0.82 NAHB 3.22 38.6 44.02 0.88 39.6 0.97
Metric Conversion: 1 ft. = .305 m, 1 kip. = 4.448 kN, 1 kip*in. = 0.112 kN*m
1 Assembly designation is as follows: the first letter “D” or “S” represents double or single L-section, the first number is the vertical leg dimension (in.) of the L-section(s), the second number is the nominal thickness of the L-section (in.), and the last number is the clear span (ft).
2 Nominal flexural strength computed based on 2000 version of the AISI Specification (AISI, 2001a)
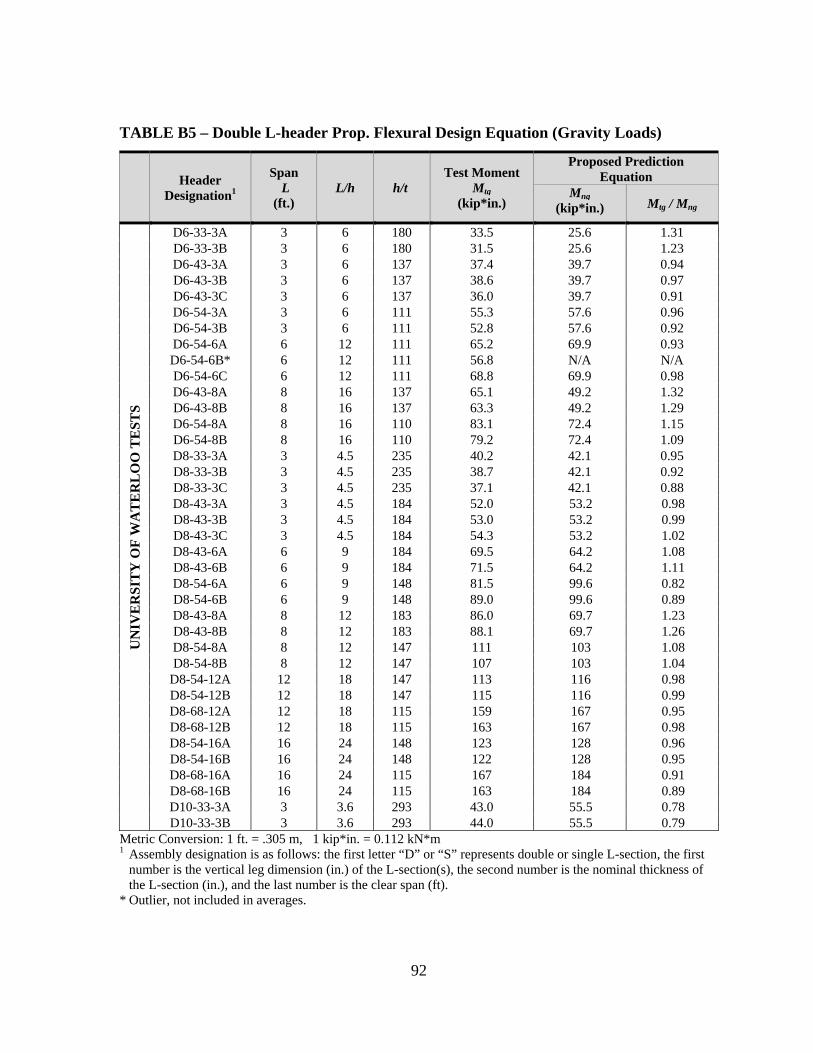
92
TABLE B5 – Double L-header Prop. Flexural Design Equation (Gravity Loads)
Header
Designation1
Span L
(ft.) L/h h/t
Test Moment Mtg
(kip*in.)
Proposed Prediction Equation
Mng (kip*in.) Mtg / Mng
UN
IVE
RSI
TY
OF
WA
TE
RL
OO
TE
STS
D6-33-3A 3 6 180 33.5 25.6 1.31 D6-33-3B 3 6 180 31.5 25.6 1.23 D6-43-3A 3 6 137 37.4 39.7 0.94 D6-43-3B 3 6 137 38.6 39.7 0.97 D6-43-3C 3 6 137 36.0 39.7 0.91 D6-54-3A 3 6 111 55.3 57.6 0.96 D6-54-3B 3 6 111 52.8 57.6 0.92 D6-54-6A 6 12 111 65.2 69.9 0.93 D6-54-6B* 6 12 111 56.8 N/A N/A D6-54-6C 6 12 111 68.8 69.9 0.98 D6-43-8A 8 16 137 65.1 49.2 1.32 D6-43-8B 8 16 137 63.3 49.2 1.29 D6-54-8A 8 16 110 83.1 72.4 1.15 D6-54-8B 8 16 110 79.2 72.4 1.09 D8-33-3A 3 4.5 235 40.2 42.1 0.95 D8-33-3B 3 4.5 235 38.7 42.1 0.92 D8-33-3C 3 4.5 235 37.1 42.1 0.88 D8-43-3A 3 4.5 184 52.0 53.2 0.98 D8-43-3B 3 4.5 184 53.0 53.2 0.99 D8-43-3C 3 4.5 184 54.3 53.2 1.02 D8-43-6A 6 9 184 69.5 64.2 1.08 D8-43-6B 6 9 184 71.5 64.2 1.11 D8-54-6A 6 9 148 81.5 99.6 0.82 D8-54-6B 6 9 148 89.0 99.6 0.89 D8-43-8A 8 12 183 86.0 69.7 1.23 D8-43-8B 8 12 183 88.1 69.7 1.26 D8-54-8A 8 12 147 111 103 1.08 D8-54-8B 8 12 147 107 103 1.04
D8-54-12A 12 18 147 113 116 0.98 D8-54-12B 12 18 147 115 116 0.99 D8-68-12A 12 18 115 159 167 0.95 D8-68-12B 12 18 115 163 167 0.98 D8-54-16A 16 24 148 123 128 0.96 D8-54-16B 16 24 148 122 128 0.95 D8-68-16A 16 24 115 167 184 0.91 D8-68-16B 16 24 115 163 184 0.89 D10-33-3A 3 3.6 293 43.0 55.5 0.78 D10-33-3B 3 3.6 293 44.0 55.5 0.79
Metric Conversion: 1 ft. = .305 m, 1 kip*in. = 0.112 kN*m
1 Assembly designation is as follows: the first letter “D” or “S” represents double or single L-section, the first number is the vertical leg dimension (in.) of the L-section(s), the second number is the nominal thickness of the L-section (in.), and the last number is the clear span (ft).
* Outlier, not included in averages.
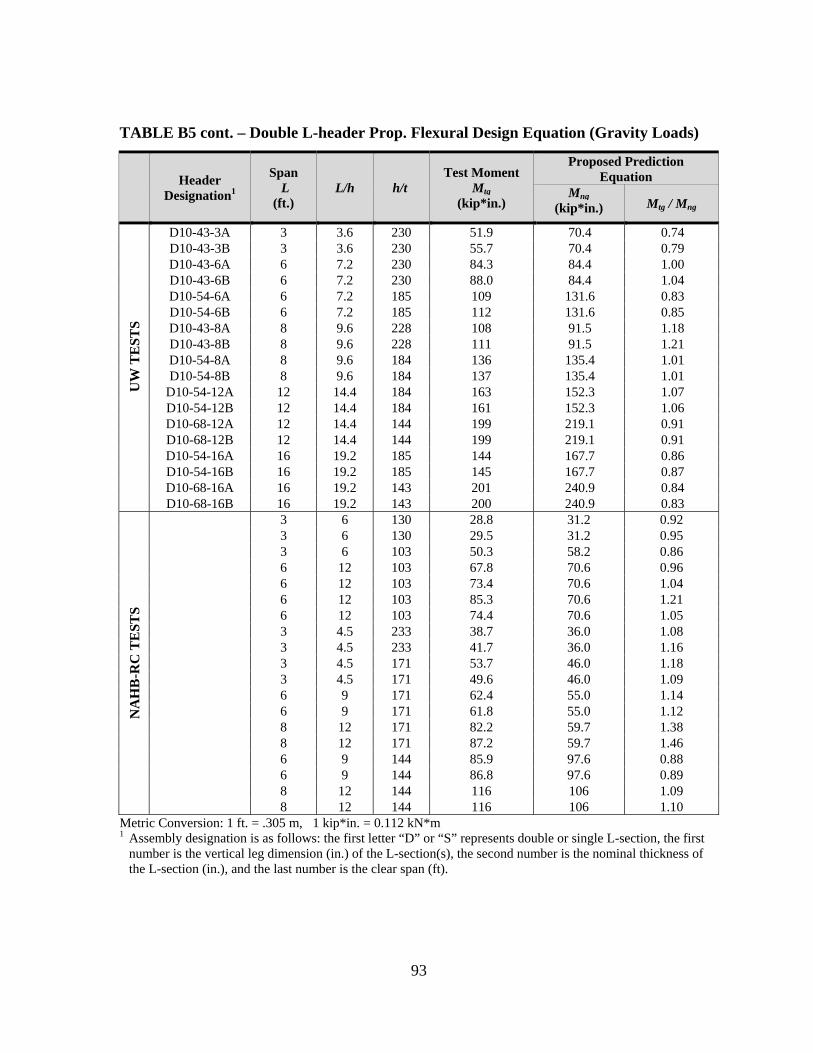
93
TABLE B5 cont. – Double L-header Prop. Flexural Design Equation (Gravity Loads) Header
Designation1
Span L
(ft.) L/h h/t
Test Moment Mtg
(kip*in.)
Proposed Prediction Equation
Mng (kip*in.) Mtg / Mng
UW
TE
STS
D10-43-3A 3 3.6 230 51.9 70.4 0.74 D10-43-3B 3 3.6 230 55.7 70.4 0.79 D10-43-6A 6 7.2 230 84.3 84.4 1.00 D10-43-6B 6 7.2 230 88.0 84.4 1.04 D10-54-6A 6 7.2 185 109 131.6 0.83 D10-54-6B 6 7.2 185 112 131.6 0.85 D10-43-8A 8 9.6 228 108 91.5 1.18 D10-43-8B 8 9.6 228 111 91.5 1.21 D10-54-8A 8 9.6 184 136 135.4 1.01 D10-54-8B 8 9.6 184 137 135.4 1.01
D10-54-12A 12 14.4 184 163 152.3 1.07 D10-54-12B 12 14.4 184 161 152.3 1.06 D10-68-12A 12 14.4 144 199 219.1 0.91 D10-68-12B 12 14.4 144 199 219.1 0.91 D10-54-16A 16 19.2 185 144 167.7 0.86 D10-54-16B 16 19.2 185 145 167.7 0.87 D10-68-16A 16 19.2 143 201 240.9 0.84 D10-68-16B 16 19.2 143 200 240.9 0.83
NA
HB
-RC
TE
STS
3 6 130 28.8 31.2 0.92 3 6 130 29.5 31.2 0.95 3 6 103 50.3 58.2 0.86 6 12 103 67.8 70.6 0.96 6 12 103 73.4 70.6 1.04 6 12 103 85.3 70.6 1.21 6 12 103 74.4 70.6 1.05 3 4.5 233 38.7 36.0 1.08 3 4.5 233 41.7 36.0 1.16 3 4.5 171 53.7 46.0 1.18 3 4.5 171 49.6 46.0 1.09 6 9 171 62.4 55.0 1.14 6 9 171 61.8 55.0 1.12 8 12 171 82.2 59.7 1.38 8 12 171 87.2 59.7 1.46 6 9 144 85.9 97.6 0.88 6 9 144 86.8 97.6 0.89 8 12 144 116 106 1.09 8 12 144 116 106 1.10
Metric Conversion: 1 ft. = .305 m, 1 kip*in. = 0.112 kN*m
1 Assembly designation is as follows: the first letter “D” or “S” represents double or single L-section, the first number is the vertical leg dimension (in.) of the L-section(s), the second number is the nominal thickness of the L-section (in.), and the last number is the clear span (ft).
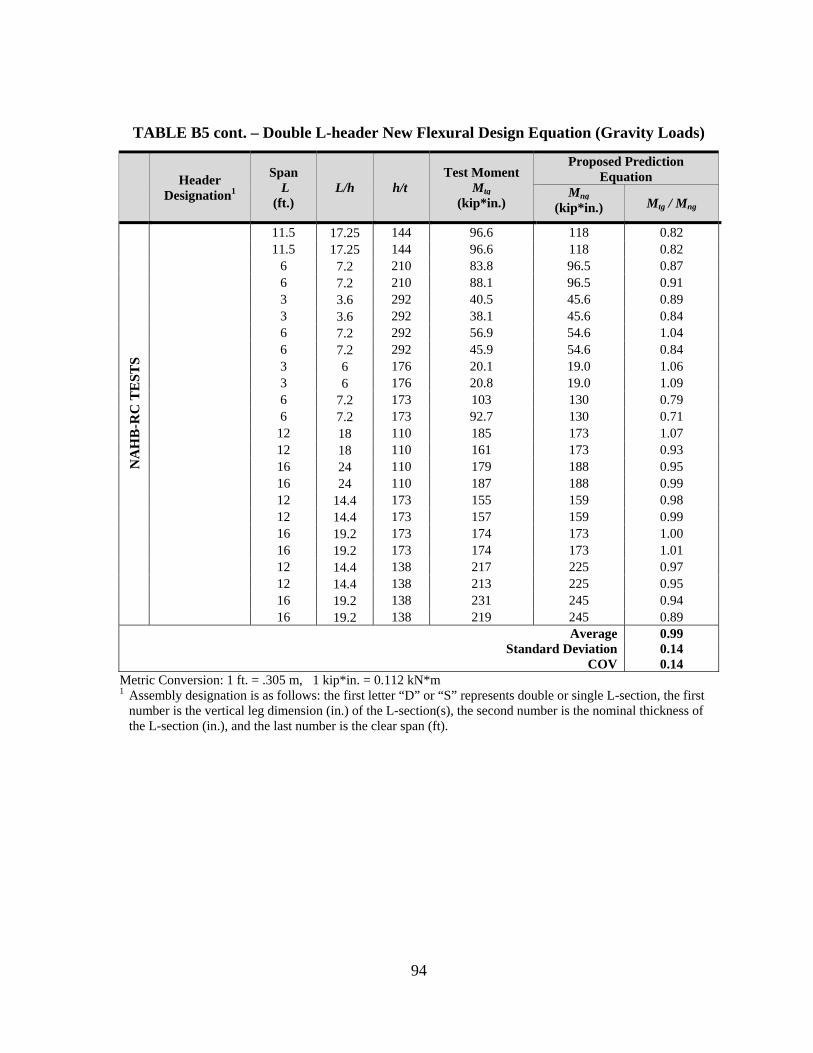
94
TABLE B5 cont. – Double L-header New Flexural Design Equation (Gravity Loads) Header
Designation1
Span L
(ft.) L/h h/t
Test Moment Mtg
(kip*in.)
Proposed Prediction Equation
Mng (kip*in.) Mtg / Mng
NA
HB
-RC
TE
STS
11.5 17.25 144 96.6 118 0.82 11.5 17.25 144 96.6 118 0.82 6 7.2 210 83.8 96.5 0.87 6 7.2 210 88.1 96.5 0.91 3 3.6 292 40.5 45.6 0.89 3 3.6 292 38.1 45.6 0.84 6 7.2 292 56.9 54.6 1.04 6 7.2 292 45.9 54.6 0.84 3 6 176 20.1 19.0 1.06 3 6 176 20.8 19.0 1.09 6 7.2 173 103 130 0.79 6 7.2 173 92.7 130 0.71 12 18 110 185 173 1.07 12 18 110 161 173 0.93 16 24 110 179 188 0.95 16 24 110 187 188 0.99 12 14.4 173 155 159 0.98 12 14.4 173 157 159 0.99 16 19.2 173 174 173 1.00 16 19.2 173 174 173 1.01 12 14.4 138 217 225 0.97 12 14.4 138 213 225 0.95 16 19.2 138 231 245 0.94 16 19.2 138 219 245 0.89
Average 0.99 Standard Deviation 0.14
COV 0.14 Metric Conversion: 1 ft. = .305 m, 1 kip*in. = 0.112 kN*m
1 Assembly designation is as follows: the first letter “D” or “S” represents double or single L-section, the first number is the vertical leg dimension (in.) of the L-section(s), the second number is the nominal thickness of the L-section (in.), and the last number is the clear span (ft).
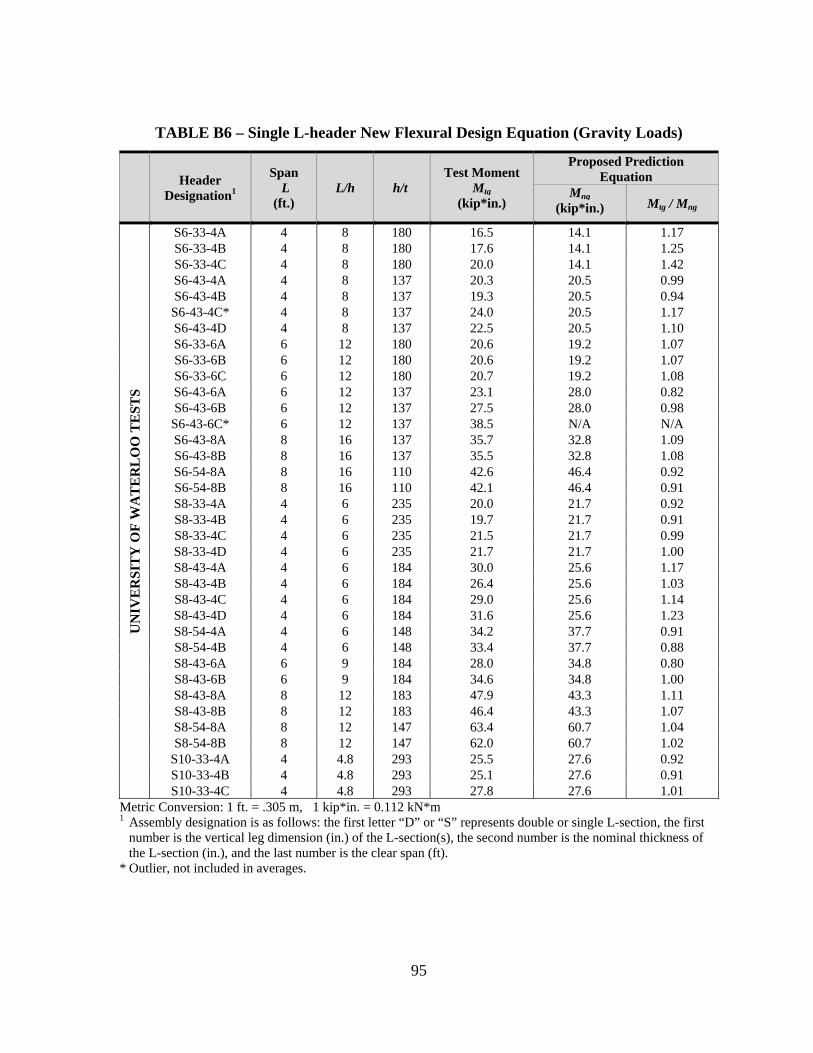
95
TABLE B6 – Single L-header New Flexural Design Equation (Gravity Loads)
Header
Designation1
Span L
(ft.) L/h h/t
Test Moment Mtg
(kip*in.)
Proposed Prediction Equation
Mng (kip*in.) Mtg / Mng
UN
IVE
RSI
TY
OF
WA
TE
RL
OO
TE
STS
S6-33-4A 4 8 180 16.5 14.1 1.17 S6-33-4B 4 8 180 17.6 14.1 1.25 S6-33-4C 4 8 180 20.0 14.1 1.42 S6-43-4A 4 8 137 20.3 20.5 0.99 S6-43-4B 4 8 137 19.3 20.5 0.94
S6-43-4C* 4 8 137 24.0 20.5 1.17 S6-43-4D 4 8 137 22.5 20.5 1.10 S6-33-6A 6 12 180 20.6 19.2 1.07 S6-33-6B 6 12 180 20.6 19.2 1.07 S6-33-6C 6 12 180 20.7 19.2 1.08 S6-43-6A 6 12 137 23.1 28.0 0.82 S6-43-6B 6 12 137 27.5 28.0 0.98
S6-43-6C* 6 12 137 38.5 N/A N/A S6-43-8A 8 16 137 35.7 32.8 1.09 S6-43-8B 8 16 137 35.5 32.8 1.08 S6-54-8A 8 16 110 42.6 46.4 0.92 S6-54-8B 8 16 110 42.1 46.4 0.91 S8-33-4A 4 6 235 20.0 21.7 0.92 S8-33-4B 4 6 235 19.7 21.7 0.91 S8-33-4C 4 6 235 21.5 21.7 0.99 S8-33-4D 4 6 235 21.7 21.7 1.00 S8-43-4A 4 6 184 30.0 25.6 1.17 S8-43-4B 4 6 184 26.4 25.6 1.03 S8-43-4C 4 6 184 29.0 25.6 1.14 S8-43-4D 4 6 184 31.6 25.6 1.23 S8-54-4A 4 6 148 34.2 37.7 0.91 S8-54-4B 4 6 148 33.4 37.7 0.88 S8-43-6A 6 9 184 28.0 34.8 0.80 S8-43-6B 6 9 184 34.6 34.8 1.00 S8-43-8A 8 12 183 47.9 43.3 1.11 S8-43-8B 8 12 183 46.4 43.3 1.07 S8-54-8A 8 12 147 63.4 60.7 1.04 S8-54-8B 8 12 147 62.0 60.7 1.02
S10-33-4A 4 4.8 293 25.5 27.6 0.92 S10-33-4B 4 4.8 293 25.1 27.6 0.91 S10-33-4C 4 4.8 293 27.8 27.6 1.01
Metric Conversion: 1 ft. = .305 m, 1 kip*in. = 0.112 kN*m
1 Assembly designation is as follows: the first letter “D” or “S” represents double or single L-section, the first number is the vertical leg dimension (in.) of the L-section(s), the second number is the nominal thickness of the L-section (in.), and the last number is the clear span (ft).
* Outlier, not included in averages.
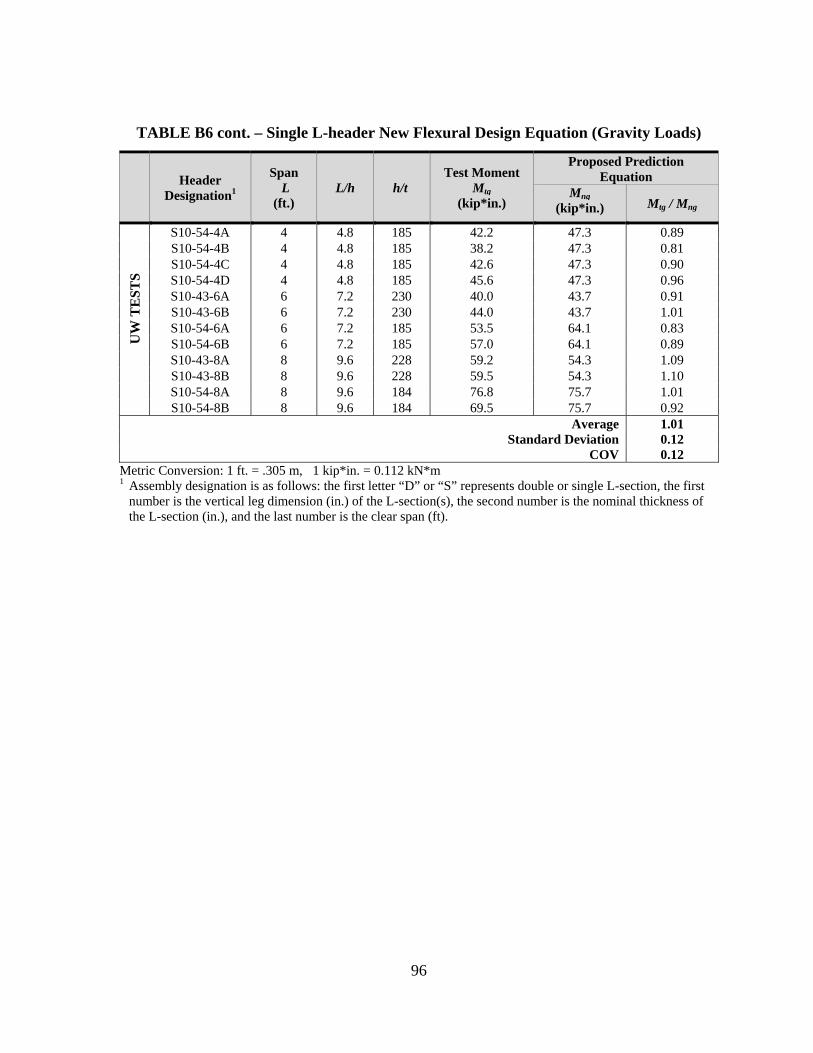
96
TABLE B6 cont. – Single L-header New Flexural Design Equation (Gravity Loads)
Header
Designation1
Span L
(ft.) L/h h/t
Test Moment Mtg
(kip*in.)
Proposed Prediction Equation
Mng (kip*in.) Mtg / Mng
UW
TE
STS
S10-54-4A 4 4.8 185 42.2 47.3 0.89 S10-54-4B 4 4.8 185 38.2 47.3 0.81 S10-54-4C 4 4.8 185 42.6 47.3 0.90 S10-54-4D 4 4.8 185 45.6 47.3 0.96 S10-43-6A 6 7.2 230 40.0 43.7 0.91 S10-43-6B 6 7.2 230 44.0 43.7 1.01 S10-54-6A 6 7.2 185 53.5 64.1 0.83 S10-54-6B 6 7.2 185 57.0 64.1 0.89 S10-43-8A 8 9.6 228 59.2 54.3 1.09 S10-43-8B 8 9.6 228 59.5 54.3 1.10 S10-54-8A 8 9.6 184 76.8 75.7 1.01 S10-54-8B 8 9.6 184 69.5 75.7 0.92
Average 1.01 Standard Deviation 0.12
COV 0.12 Metric Conversion: 1 ft. = .305 m, 1 kip*in. = 0.112 kN*m
1 Assembly designation is as follows: the first letter “D” or “S” represents double or single L-section, the first number is the vertical leg dimension (in.) of the L-section(s), the second number is the nominal thickness of the L-section (in.), and the last number is the clear span (ft).
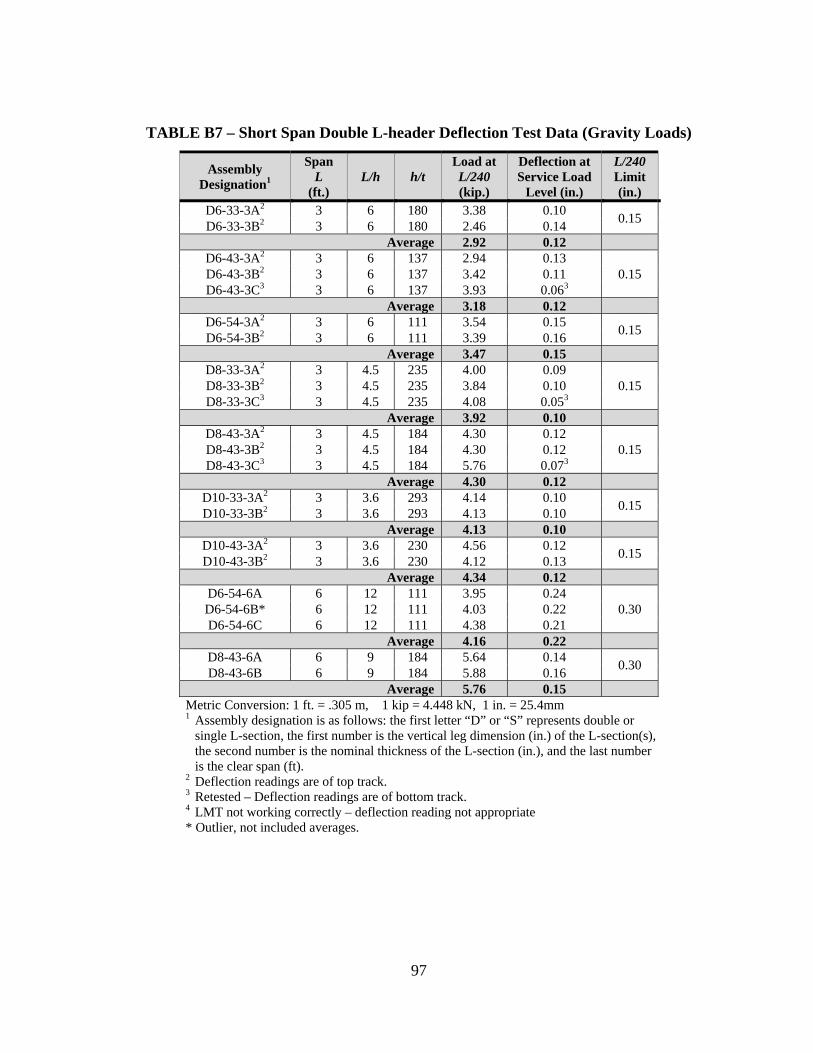
97
TABLE B7 – Short Span Double L-header Deflection Test Data (Gravity Loads)
Assembly Designation1
Span L
(ft.) L/h h/t
Load at L/240 (kip.)
Deflection at Service Load
Level (in.)
L/240 Limit (in.)
D6-33-3A2 3 6 180 3.38 0.10 0.15 D6-33-3B2 3 6 180 2.46 0.14 Average 2.92 0.12
D6-43-3A2 3 6 137 2.94 0.13 0.15 D6-43-3B2 3 6 137 3.42 0.11
D6-43-3C3 3 6 137 3.93 0.063 Average 3.18 0.12
D6-54-3A2 3 6 111 3.54 0.15 0.15 D6-54-3B2 3 6 111 3.39 0.16 Average 3.47 0.15
D8-33-3A2 3 4.5 235 4.00 0.09 0.15 D8-33-3B2 3 4.5 235 3.84 0.10
D8-33-3C3 3 4.5 235 4.08 0.053 Average 3.92 0.10
D8-43-3A2 3 4.5 184 4.30 0.12 0.15 D8-43-3B2 3 4.5 184 4.30 0.12
D8-43-3C3 3 4.5 184 5.76 0.073 Average 4.30 0.12
D10-33-3A2 3 3.6 293 4.14 0.10 0.15 D10-33-3B2 3 3.6 293 4.13 0.10 Average 4.13 0.10
D10-43-3A2 3 3.6 230 4.56 0.12 0.15 D10-43-3B2 3 3.6 230 4.12 0.13 Average 4.34 0.12
D6-54-6A 6 12 111 3.95 0.24 0.30 D6-54-6B* 6 12 111 4.03 0.22
D6-54-6C 6 12 111 4.38 0.21 Average 4.16 0.22
D8-43-6A 6 9 184 5.64 0.14 0.30 D8-43-6B 6 9 184 5.88 0.16 Average 5.76 0.15
Metric Conversion: 1 ft. = .305 m, 1 kip = 4.448 kN, 1 in. = 25.4mm
1 Assembly designation is as follows: the first letter “D” or “S” represents double or single L-section, the first number is the vertical leg dimension (in.) of the L-section(s), the second number is the nominal thickness of the L-section (in.), and the last number is the clear span (ft).
2 Deflection readings are of top track. 3 Retested – Deflection readings are of bottom track. 4 LMT not working correctly – deflection reading not appropriate * Outlier, not included averages.
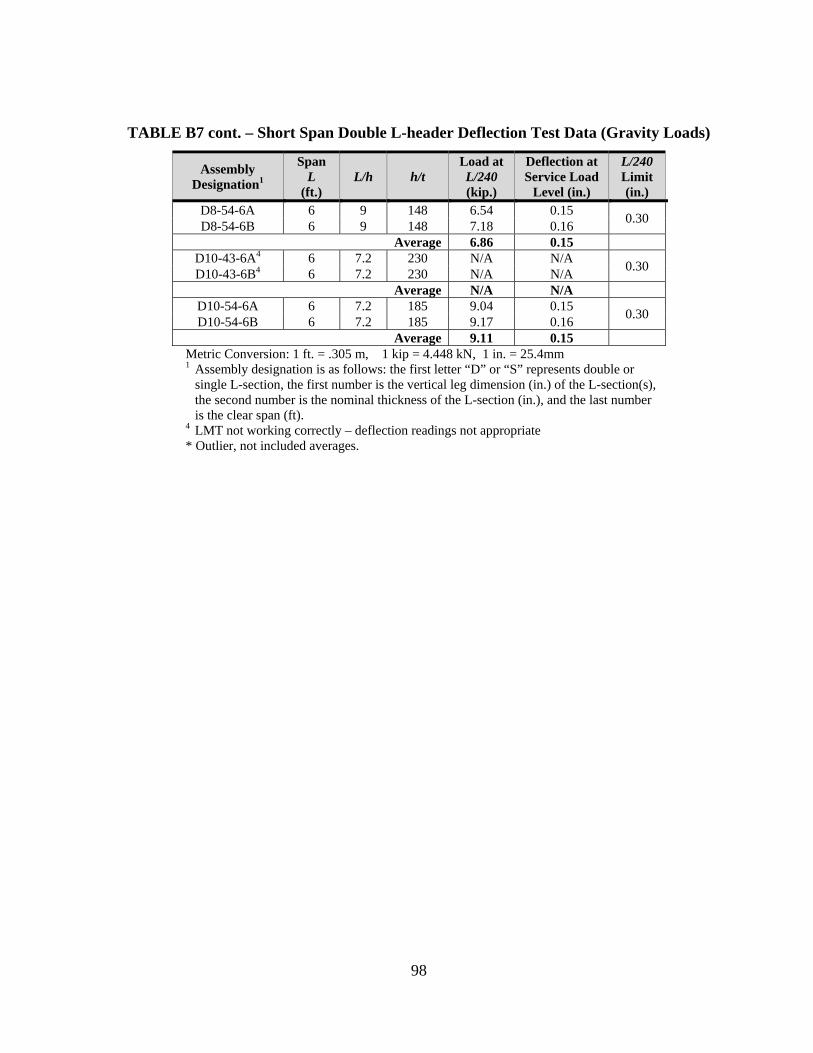
98
TABLE B7 cont. – Short Span Double L-header Deflection Test Data (Gravity Loads)
Assembly Designation1
Span L
(ft.) L/h h/t
Load at L/240 (kip.)
Deflection at Service Load
Level (in.)
L/240 Limit (in.)
D8-54-6A 6 9 148 6.54 0.15 0.30 D8-54-6B 6 9 148 7.18 0.16 Average 6.86 0.15
D10-43-6A4 6 7.2 230 N/A N/A 0.30 D10-43-6B4 6 7.2 230 N/A N/A Average N/A N/A
D10-54-6A 6 7.2 185 9.04 0.15 0.30 D10-54-6B 6 7.2 185 9.17 0.16 Average 9.11 0.15
Metric Conversion: 1 ft. = .305 m, 1 kip = 4.448 kN, 1 in. = 25.4mm
1 Assembly designation is as follows: the first letter “D” or “S” represents double or single L-section, the first number is the vertical leg dimension (in.) of the L-section(s), the second number is the nominal thickness of the L-section (in.), and the last number is the clear span (ft).
4 LMT not working correctly – deflection readings not appropriate * Outlier, not included averages.
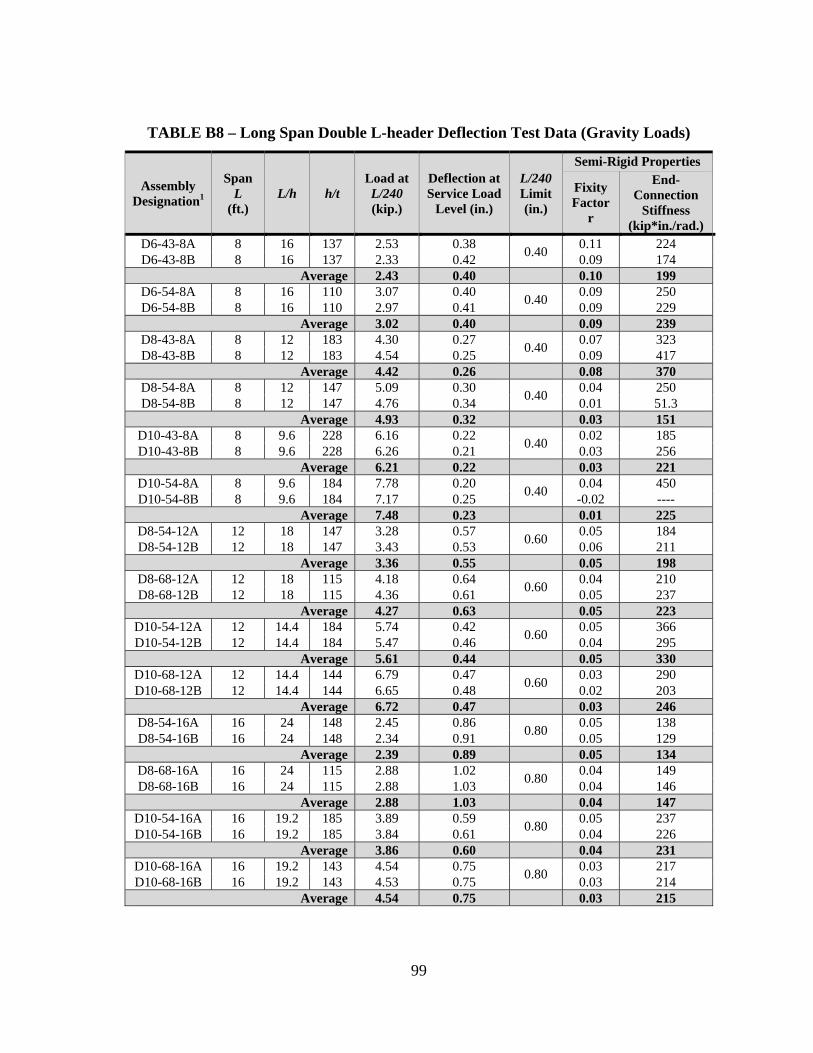
99
TABLE B8 – Long Span Double L-header Deflection Test Data (Gravity Loads)
Assembly Designation1
Span L
(ft.) L/h h/t
Load at L/240 (kip.)
Deflection at Service Load
Level (in.)
L/240 Limit (in.)
Semi-Rigid Properties
Fixity Factor
r
End-Connection
Stiffness (kip*in./rad.)
D6-43-8A 8 16 137 2.53 0.38 0.40 0.11 224 D6-43-8B 8 16 137 2.33 0.42 0.09 174
Average 2.43 0.40 0.10 199 D6-54-8A 8 16 110 3.07 0.40 0.40 0.09 250 D6-54-8B 8 16 110 2.97 0.41 0.09 229
Average 3.02 0.40 0.09 239 D8-43-8A 8 12 183 4.30 0.27 0.40 0.07 323 D8-43-8B 8 12 183 4.54 0.25 0.09 417
Average 4.42 0.26 0.08 370 D8-54-8A 8 12 147 5.09 0.30 0.40 0.04 250 D8-54-8B 8 12 147 4.76 0.34 0.01 51.3
Average 4.93 0.32 0.03 151 D10-43-8A 8 9.6 228 6.16 0.22 0.40 0.02 185 D10-43-8B 8 9.6 228 6.26 0.21 0.03 256
Average 6.21 0.22 0.03 221 D10-54-8A 8 9.6 184 7.78 0.20 0.40 0.04 450 D10-54-8B 8 9.6 184 7.17 0.25 -0.02 ----
Average 7.48 0.23 0.01 225 D8-54-12A 12 18 147 3.28 0.57 0.60 0.05 184 D8-54-12B 12 18 147 3.43 0.53 0.06 211
Average 3.36 0.55 0.05 198 D8-68-12A 12 18 115 4.18 0.64 0.60 0.04 210 D8-68-12B 12 18 115 4.36 0.61 0.05 237
Average 4.27 0.63 0.05 223 D10-54-12A 12 14.4 184 5.74 0.42 0.60 0.05 366 D10-54-12B 12 14.4 184 5.47 0.46 0.04 295
Average 5.61 0.44 0.05 330 D10-68-12A 12 14.4 144 6.79 0.47 0.60 0.03 290 D10-68-12B 12 14.4 144 6.65 0.48 0.02 203
Average 6.72 0.47 0.03 246 D8-54-16A 16 24 148 2.45 0.86 0.80 0.05 138 D8-54-16B 16 24 148 2.34 0.91 0.05 129
Average 2.39 0.89 0.05 134 D8-68-16A 16 24 115 2.88 1.02 0.80 0.04 149 D8-68-16B 16 24 115 2.88 1.03 0.04 146
Average 2.88 1.03 0.04 147 D10-54-16A 16 19.2 185 3.89 0.59 0.80 0.05 237 D10-54-16B 16 19.2 185 3.84 0.61 0.04 226
Average 3.86 0.60 0.04 231 D10-68-16A 16 19.2 143 4.54 0.75 0.80 0.03 217 D10-68-16B 16 19.2 143 4.53 0.75 0.03 214
Average 4.54 0.75 0.03 215
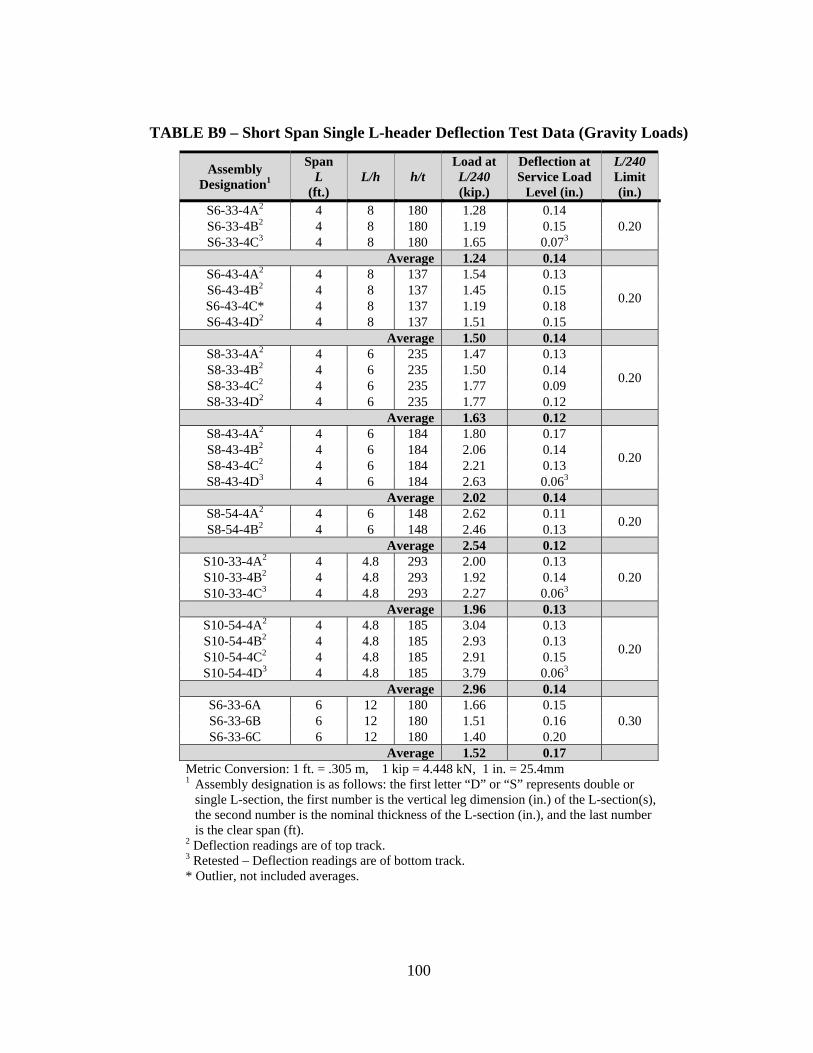
100
TABLE B9 – Short Span Single L-header Deflection Test Data (Gravity Loads)
Assembly Designation1
Span L
(ft.) L/h h/t
Load at L/240 (kip.)
Deflection at Service Load
Level (in.)
L/240 Limit (in.)
S6-33-4A2 4 8 180 1.28 0.14 0.20 S6-33-4B2 4 8 180 1.19 0.15
S6-33-4C3 4 8 180 1.65 0.073 Average 1.24 0.14
S6-43-4A2 4 8 137 1.54 0.13
0.20 S6-43-4B2 4 8 137 1.45 0.15 S6-43-4C* 4 8 137 1.19 0.18 S6-43-4D2 4 8 137 1.51 0.15
Average 1.50 0.14 S8-33-4A2 4 6 235 1.47 0.13
0.20 S8-33-4B2 4 6 235 1.50 0.14 S8-33-4C2 4 6 235 1.77 0.09 S8-33-4D2 4 6 235 1.77 0.12
Average 1.63 0.12 S8-43-4A2 4 6 184 1.80 0.17
0.20 S8-43-4B2 4 6 184 2.06 0.14 S8-43-4C2 4 6 184 2.21 0.13 S8-43-4D3 4 6 184 2.63 0.063
Average 2.02 0.14 S8-54-4A2 4 6 148 2.62 0.11 0.20 S8-54-4B2 4 6 148 2.46 0.13
Average 2.54 0.12 S10-33-4A2 4 4.8 293 2.00 0.13
0.20 S10-33-4B2 4 4.8 293 1.92 0.14 S10-33-4C3 4 4.8 293 2.27 0.063
Average 1.96 0.13 S10-54-4A2 4 4.8 185 3.04 0.13
0.20 S10-54-4B2 4 4.8 185 2.93 0.13 S10-54-4C2 4 4.8 185 2.91 0.15 S10-54-4D3 4 4.8 185 3.79 0.063
Average 2.96 0.14 S6-33-6A 6 12 180 1.66 0.15
0.30 S6-33-6B 6 12 180 1.51 0.16 S6-33-6C 6 12 180 1.40 0.20
Average 1.52 0.17 Metric Conversion: 1 ft. = .305 m, 1 kip = 4.448 kN, 1 in. = 25.4mm
1 Assembly designation is as follows: the first letter “D” or “S” represents double or single L-section, the first number is the vertical leg dimension (in.) of the L-section(s), the second number is the nominal thickness of the L-section (in.), and the last number is the clear span (ft).
2 Deflection readings are of top track. 3 Retested – Deflection readings are of bottom track. * Outlier, not included averages.
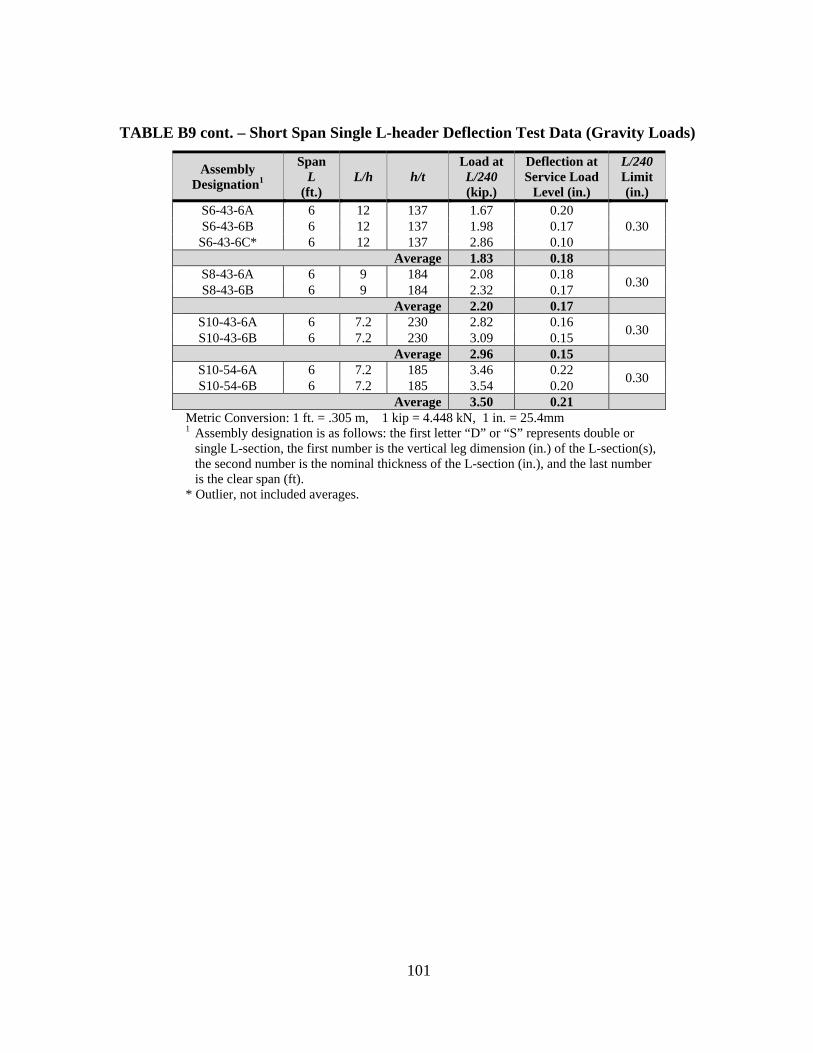
101
TABLE B9 cont. – Short Span Single L-header Deflection Test Data (Gravity Loads)
Assembly Designation1
Span L
(ft.) L/h h/t
Load at L/240 (kip.)
Deflection at Service Load
Level (in.)
L/240 Limit (in.)
S6-43-6A 6 12 137 1.67 0.20 0.30 S6-43-6B 6 12 137 1.98 0.17
S6-43-6C* 6 12 137 2.86 0.10 Average 1.83 0.18
S8-43-6A 6 9 184 2.08 0.18 0.30 S8-43-6B 6 9 184 2.32 0.17 Average 2.20 0.17
S10-43-6A 6 7.2 230 2.82 0.16 0.30 S10-43-6B 6 7.2 230 3.09 0.15 Average 2.96 0.15
S10-54-6A 6 7.2 185 3.46 0.22 0.30 S10-54-6B 6 7.2 185 3.54 0.20 Average 3.50 0.21
Metric Conversion: 1 ft. = .305 m, 1 kip = 4.448 kN, 1 in. = 25.4mm
1 Assembly designation is as follows: the first letter “D” or “S” represents double or single L-section, the first number is the vertical leg dimension (in.) of the L-section(s), the second number is the nominal thickness of the L-section (in.), and the last number is the clear span (ft).
* Outlier, not included averages.
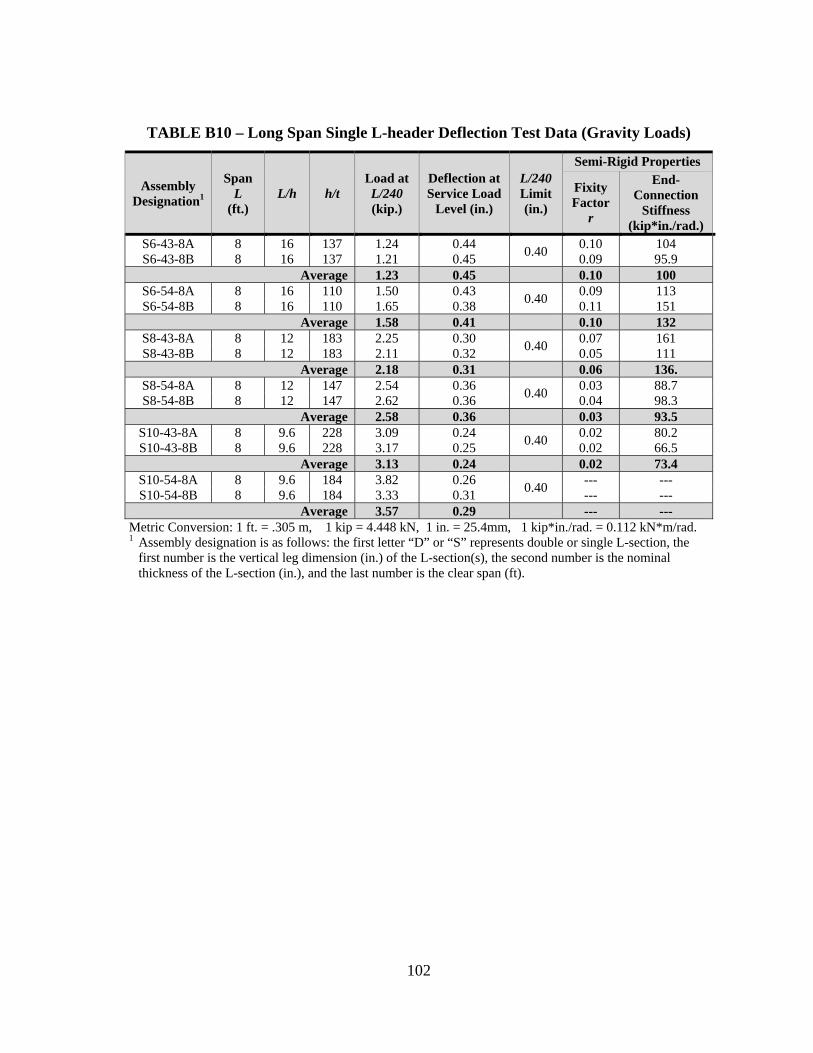
102
TABLE B10 – Long Span Single L-header Deflection Test Data (Gravity Loads)
Assembly Designation1
Span L
(ft.) L/h h/t
Load at L/240 (kip.)
Deflection at Service Load
Level (in.)
L/240 Limit (in.)
Semi-Rigid Properties
Fixity Factor
r
End-Connection
Stiffness (kip*in./rad.)
S6-43-8A 8 16 137 1.24 0.44 0.40 0.10 104 S6-43-8B 8 16 137 1.21 0.45 0.09 95.9
Average 1.23 0.45 0.10 100 S6-54-8A 8 16 110 1.50 0.43 0.40 0.09 113 S6-54-8B 8 16 110 1.65 0.38 0.11 151
Average 1.58 0.41 0.10 132 S8-43-8A 8 12 183 2.25 0.30 0.40 0.07 161 S8-43-8B 8 12 183 2.11 0.32 0.05 111
Average 2.18 0.31 0.06 136. S8-54-8A 8 12 147 2.54 0.36 0.40 0.03 88.7 S8-54-8B 8 12 147 2.62 0.36 0.04 98.3
Average 2.58 0.36 0.03 93.5 S10-43-8A 8 9.6 228 3.09 0.24 0.40 0.02 80.2 S10-43-8B 8 9.6 228 3.17 0.25 0.02 66.5
Average 3.13 0.24 0.02 73.4 S10-54-8A 8 9.6 184 3.82 0.26 0.40 --- --- S10-54-8B 8 9.6 184 3.33 0.31 --- ---
Average 3.57 0.29 --- --- Metric Conversion: 1 ft. = .305 m, 1 kip = 4.448 kN, 1 in. = 25.4mm, 1 kip*in./rad. = 0.112 kN*m/rad. 1 Assembly designation is as follows: the first letter “D” or “S” represents double or single L-section, the
first number is the vertical leg dimension (in.) of the L-section(s), the second number is the nominal thickness of the L-section (in.), and the last number is the clear span (ft).
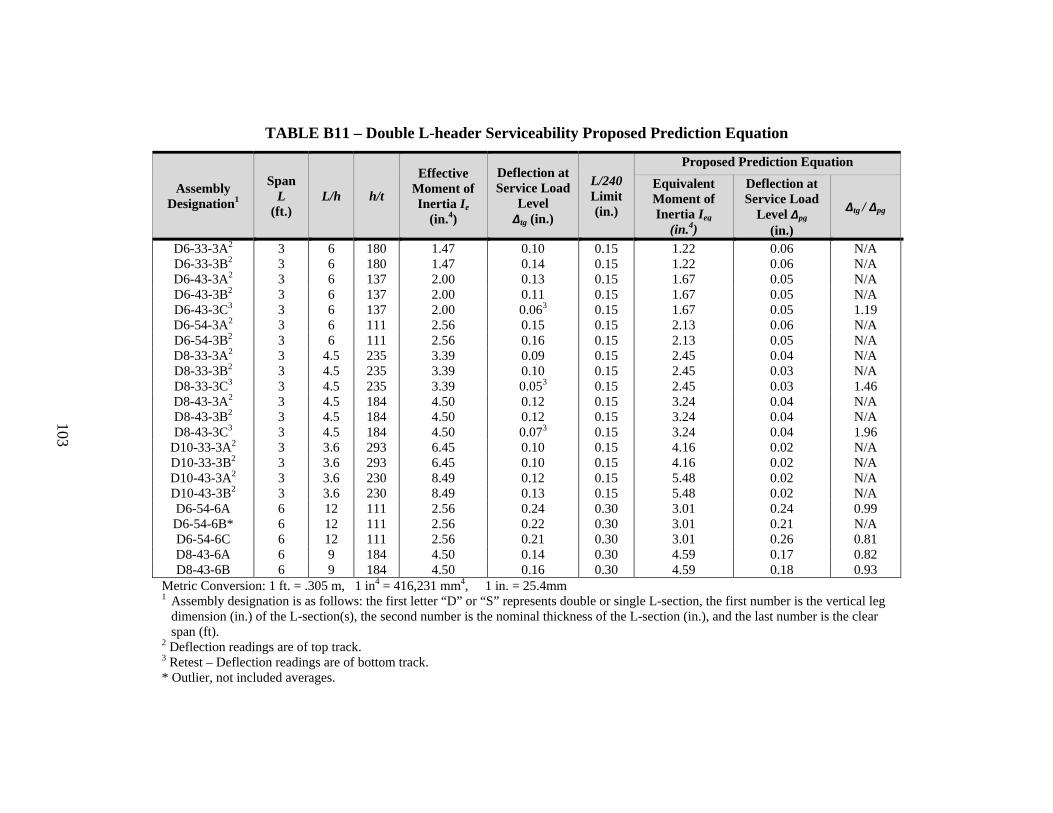
103
TABLE B11 – Double L-header Serviceability Proposed Prediction Equation
Assembly Designation1
Span L
(ft.) L/h h/t
Effective Moment of Inertia Ie
(in.4)
Deflection at Service Load
Level Δtg (in.)
L/240 Limit (in.)
Proposed Prediction Equation Equivalent Moment of Inertia Ieq
(in.4)
Deflection at Service Load
Level Δpg (in.)
Δtg / Δpg
D6-33-3A2 3 6 180 1.47 0.10 0.15 1.22 0.06 N/A D6-33-3B2 3 6 180 1.47 0.14 0.15 1.22 0.06 N/A D6-43-3A2 3 6 137 2.00 0.13 0.15 1.67 0.05 N/A D6-43-3B2 3 6 137 2.00 0.11 0.15 1.67 0.05 N/A D6-43-3C3 3 6 137 2.00 0.063 0.15 1.67 0.05 1.19 D6-54-3A2 3 6 111 2.56 0.15 0.15 2.13 0.06 N/A D6-54-3B2 3 6 111 2.56 0.16 0.15 2.13 0.05 N/A D8-33-3A2 3 4.5 235 3.39 0.09 0.15 2.45 0.04 N/A D8-33-3B2 3 4.5 235 3.39 0.10 0.15 2.45 0.03 N/A D8-33-3C3 3 4.5 235 3.39 0.053 0.15 2.45 0.03 1.46 D8-43-3A2 3 4.5 184 4.50 0.12 0.15 3.24 0.04 N/A D8-43-3B2 3 4.5 184 4.50 0.12 0.15 3.24 0.04 N/A D8-43-3C3 3 4.5 184 4.50 0.073 0.15 3.24 0.04 1.96
D10-33-3A2 3 3.6 293 6.45 0.10 0.15 4.16 0.02 N/A D10-33-3B2 3 3.6 293 6.45 0.10 0.15 4.16 0.02 N/A D10-43-3A2 3 3.6 230 8.49 0.12 0.15 5.48 0.02 N/A D10-43-3B2 3 3.6 230 8.49 0.13 0.15 5.48 0.02 N/A D6-54-6A 6 12 111 2.56 0.24 0.30 3.01 0.24 0.99 D6-54-6B* 6 12 111 2.56 0.22 0.30 3.01 0.21 N/A D6-54-6C 6 12 111 2.56 0.21 0.30 3.01 0.26 0.81 D8-43-6A 6 9 184 4.50 0.14 0.30 4.59 0.17 0.82 D8-43-6B 6 9 184 4.50 0.16 0.30 4.59 0.18 0.93
Metric Conversion: 1 ft. = .305 m, 1 in4 = 416,231 mm4, 1 in. = 25.4mm
1 Assembly designation is as follows: the first letter “D” or “S” represents double or single L-section, the first number is the vertical leg dimension (in.) of the L-section(s), the second number is the nominal thickness of the L-section (in.), and the last number is the clear span (ft).
2 Deflection readings are of top track. 3 Retest – Deflection readings are of bottom track. * Outlier, not included averages.
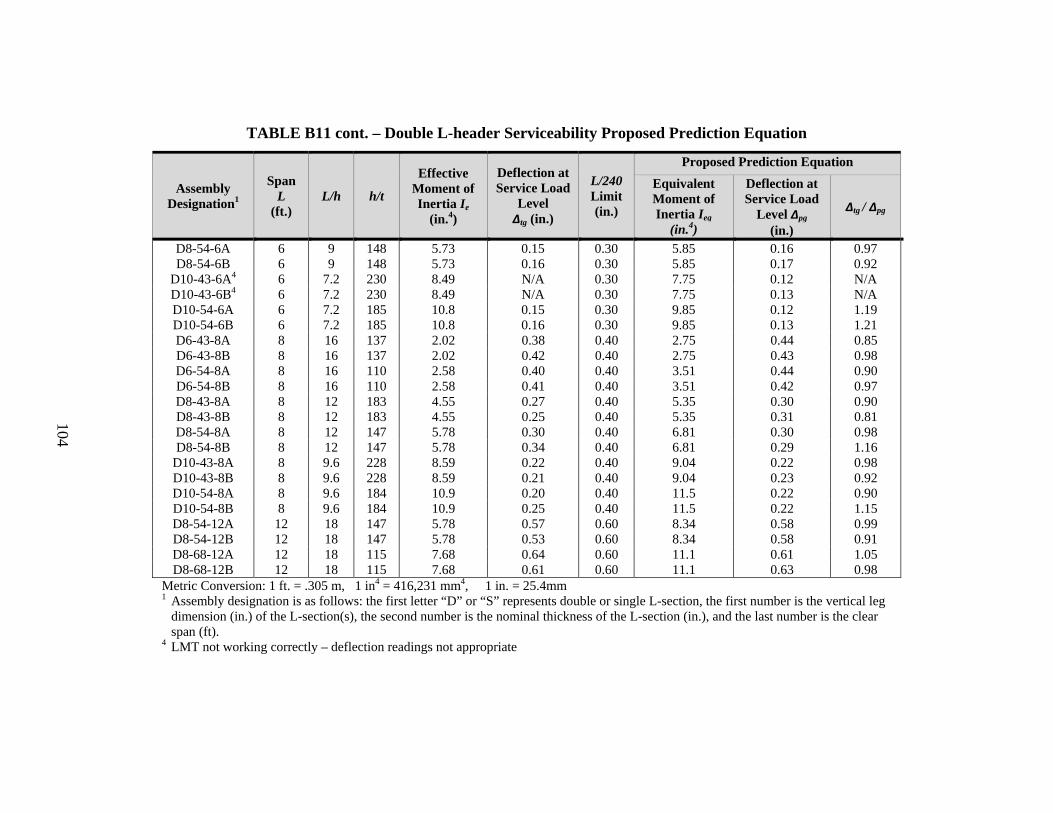
104
TABLE B11 cont. – Double L-header Serviceability Proposed Prediction Equation
Assembly Designation1
Span L
(ft.) L/h h/t
Effective Moment of Inertia Ie
(in.4)
Deflection at Service Load
Level Δtg (in.)
L/240 Limit (in.)
Proposed Prediction Equation Equivalent Moment of Inertia Ieq
(in.4)
Deflection at Service Load
Level Δpg (in.)
Δtg / Δpg
D8-54-6A 6 9 148 5.73 0.15 0.30 5.85 0.16 0.97 D8-54-6B 6 9 148 5.73 0.16 0.30 5.85 0.17 0.92
D10-43-6A4 6 7.2 230 8.49 N/A 0.30 7.75 0.12 N/A D10-43-6B4 6 7.2 230 8.49 N/A 0.30 7.75 0.13 N/A D10-54-6A 6 7.2 185 10.8 0.15 0.30 9.85 0.12 1.19 D10-54-6B 6 7.2 185 10.8 0.16 0.30 9.85 0.13 1.21 D6-43-8A 8 16 137 2.02 0.38 0.40 2.75 0.44 0.85 D6-43-8B 8 16 137 2.02 0.42 0.40 2.75 0.43 0.98 D6-54-8A 8 16 110 2.58 0.40 0.40 3.51 0.44 0.90 D6-54-8B 8 16 110 2.58 0.41 0.40 3.51 0.42 0.97 D8-43-8A 8 12 183 4.55 0.27 0.40 5.35 0.30 0.90 D8-43-8B 8 12 183 4.55 0.25 0.40 5.35 0.31 0.81 D8-54-8A 8 12 147 5.78 0.30 0.40 6.81 0.30 0.98 D8-54-8B 8 12 147 5.78 0.34 0.40 6.81 0.29 1.16
D10-43-8A 8 9.6 228 8.59 0.22 0.40 9.04 0.22 0.98 D10-43-8B 8 9.6 228 8.59 0.21 0.40 9.04 0.23 0.92 D10-54-8A 8 9.6 184 10.9 0.20 0.40 11.5 0.22 0.90 D10-54-8B 8 9.6 184 10.9 0.25 0.40 11.5 0.22 1.15 D8-54-12A 12 18 147 5.78 0.57 0.60 8.34 0.58 0.99 D8-54-12B 12 18 147 5.78 0.53 0.60 8.34 0.58 0.91 D8-68-12A 12 18 115 7.68 0.64 0.60 11.1 0.61 1.05 D8-68-12B 12 18 115 7.68 0.61 0.60 11.1 0.63 0.98
Metric Conversion: 1 ft. = .305 m, 1 in4 = 416,231 mm4, 1 in. = 25.4mm
1 Assembly designation is as follows: the first letter “D” or “S” represents double or single L-section, the first number is the vertical leg dimension (in.) of the L-section(s), the second number is the nominal thickness of the L-section (in.), and the last number is the clear span (ft).
4 LMT not working correctly – deflection readings not appropriate
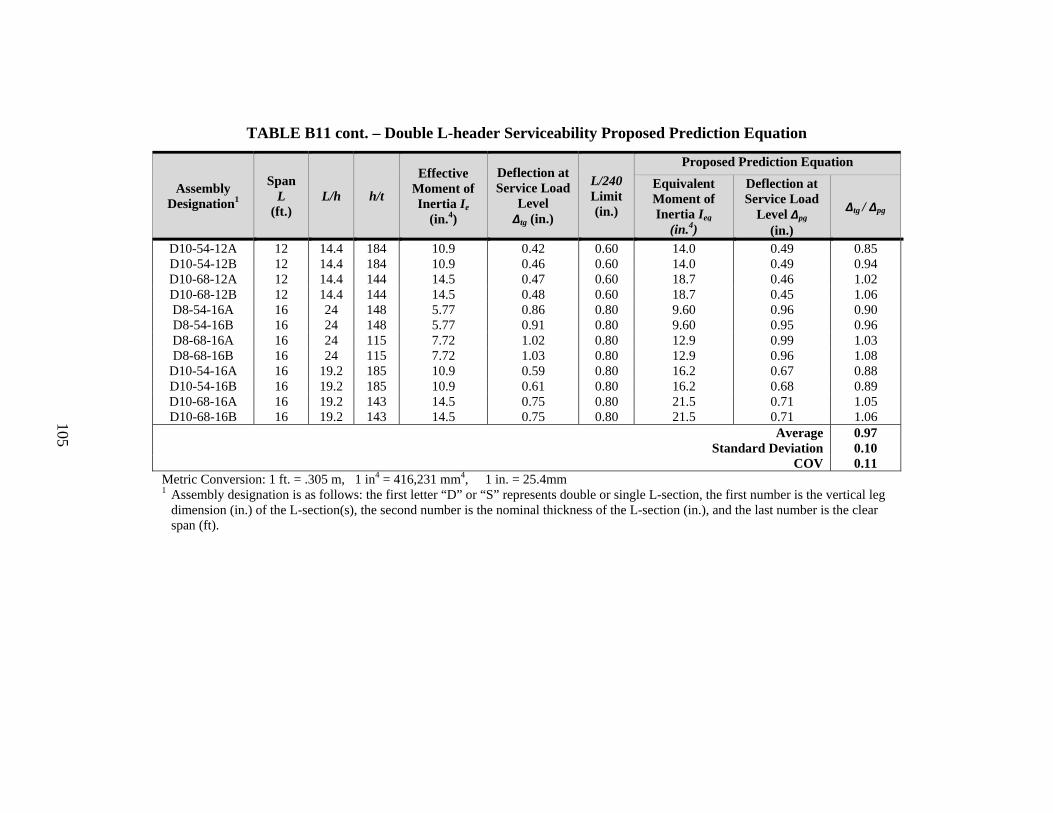
105
TABLE B11 cont. – Double L-header Serviceability Proposed Prediction Equation
Assembly Designation1
Span L
(ft.) L/h h/t
Effective Moment of Inertia Ie
(in.4)
Deflection at Service Load
Level Δtg (in.)
L/240 Limit (in.)
Proposed Prediction Equation Equivalent Moment of Inertia Ieq
(in.4)
Deflection at Service Load
Level Δpg (in.)
Δtg / Δpg
D10-54-12A 12 14.4 184 10.9 0.42 0.60 14.0 0.49 0.85 D10-54-12B 12 14.4 184 10.9 0.46 0.60 14.0 0.49 0.94 D10-68-12A 12 14.4 144 14.5 0.47 0.60 18.7 0.46 1.02 D10-68-12B 12 14.4 144 14.5 0.48 0.60 18.7 0.45 1.06 D8-54-16A 16 24 148 5.77 0.86 0.80 9.60 0.96 0.90 D8-54-16B 16 24 148 5.77 0.91 0.80 9.60 0.95 0.96 D8-68-16A 16 24 115 7.72 1.02 0.80 12.9 0.99 1.03 D8-68-16B 16 24 115 7.72 1.03 0.80 12.9 0.96 1.08
D10-54-16A 16 19.2 185 10.9 0.59 0.80 16.2 0.67 0.88 D10-54-16B 16 19.2 185 10.9 0.61 0.80 16.2 0.68 0.89 D10-68-16A 16 19.2 143 14.5 0.75 0.80 21.5 0.71 1.05 D10-68-16B 16 19.2 143 14.5 0.75 0.80 21.5 0.71 1.06
Average 0.97 Standard Deviation 0.10
COV 0.11 Metric Conversion: 1 ft. = .305 m, 1 in4 = 416,231 mm4, 1 in. = 25.4mm
1 Assembly designation is as follows: the first letter “D” or “S” represents double or single L-section, the first number is the vertical leg dimension (in.) of the L-section(s), the second number is the nominal thickness of the L-section (in.), and the last number is the clear span (ft).
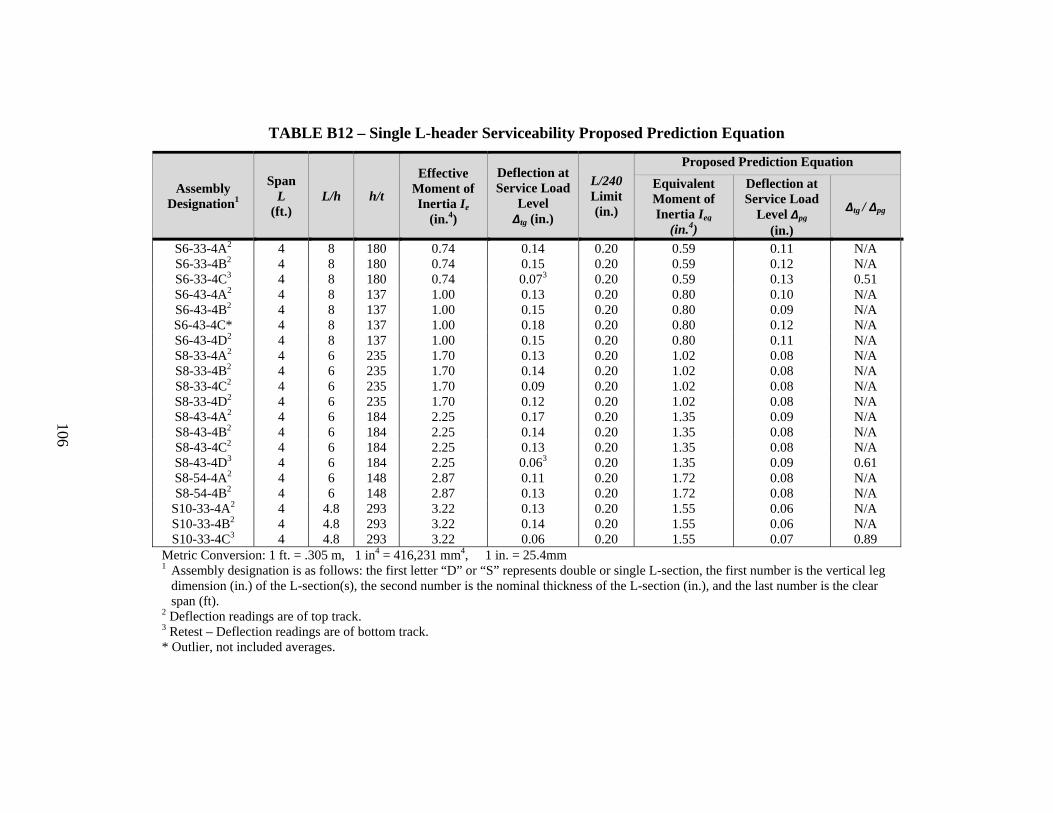
106
TABLE B12 – Single L-header Serviceability Proposed Prediction Equation
Assembly Designation1
Span L
(ft.) L/h h/t
Effective Moment of Inertia Ie
(in.4)
Deflection at Service Load
Level Δtg (in.)
L/240 Limit (in.)
Proposed Prediction Equation Equivalent Moment of Inertia Ieq
(in.4)
Deflection at Service Load
Level Δpg (in.)
Δtg / Δpg
S6-33-4A2 4 8 180 0.74 0.14 0.20 0.59 0.11 N/A S6-33-4B2 4 8 180 0.74 0.15 0.20 0.59 0.12 N/A S6-33-4C3 4 8 180 0.74 0.073 0.20 0.59 0.13 0.51 S6-43-4A2 4 8 137 1.00 0.13 0.20 0.80 0.10 N/A S6-43-4B2 4 8 137 1.00 0.15 0.20 0.80 0.09 N/A S6-43-4C* 4 8 137 1.00 0.18 0.20 0.80 0.12 N/A S6-43-4D2 4 8 137 1.00 0.15 0.20 0.80 0.11 N/A S8-33-4A2 4 6 235 1.70 0.13 0.20 1.02 0.08 N/A S8-33-4B2 4 6 235 1.70 0.14 0.20 1.02 0.08 N/A S8-33-4C2 4 6 235 1.70 0.09 0.20 1.02 0.08 N/A S8-33-4D2 4 6 235 1.70 0.12 0.20 1.02 0.08 N/A S8-43-4A2 4 6 184 2.25 0.17 0.20 1.35 0.09 N/A S8-43-4B2 4 6 184 2.25 0.14 0.20 1.35 0.08 N/A S8-43-4C2 4 6 184 2.25 0.13 0.20 1.35 0.08 N/A S8-43-4D3 4 6 184 2.25 0.063 0.20 1.35 0.09 0.61 S8-54-4A2 4 6 148 2.87 0.11 0.20 1.72 0.08 N/A S8-54-4B2 4 6 148 2.87 0.13 0.20 1.72 0.08 N/A
S10-33-4A2 4 4.8 293 3.22 0.13 0.20 1.55 0.06 N/A S10-33-4B2 4 4.8 293 3.22 0.14 0.20 1.55 0.06 N/A S10-33-4C3 4 4.8 293 3.22 0.06 0.20 1.55 0.07 0.89
Metric Conversion: 1 ft. = .305 m, 1 in4 = 416,231 mm4, 1 in. = 25.4mm
1 Assembly designation is as follows: the first letter “D” or “S” represents double or single L-section, the first number is the vertical leg dimension (in.) of the L-section(s), the second number is the nominal thickness of the L-section (in.), and the last number is the clear span (ft).
2 Deflection readings are of top track. 3 Retest – Deflection readings are of bottom track. * Outlier, not included averages.
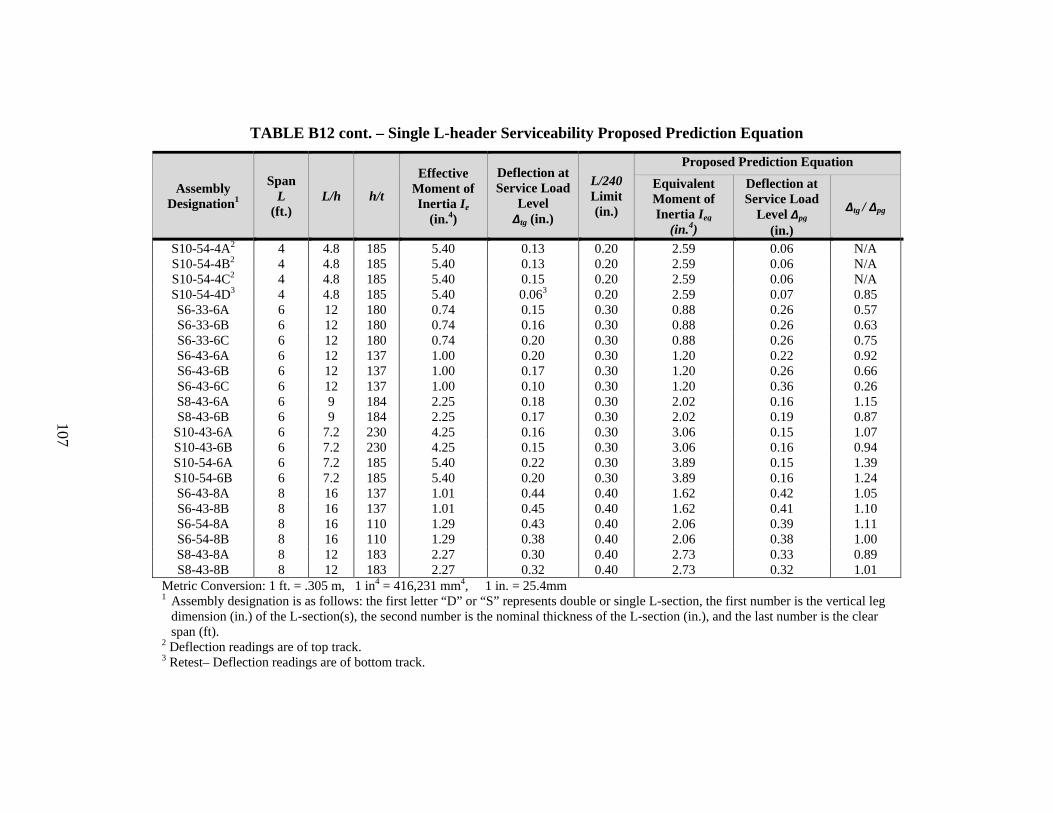
107
TABLE B12 cont. – Single L-header Serviceability Proposed Prediction Equation
Assembly Designation1
Span L
(ft.) L/h h/t
Effective Moment of Inertia Ie
(in.4)
Deflection at Service Load
Level Δtg (in.)
L/240 Limit (in.)
Proposed Prediction Equation Equivalent Moment of Inertia Ieq
(in.4)
Deflection at Service Load
Level Δpg (in.)
Δtg / Δpg
S10-54-4A2 4 4.8 185 5.40 0.13 0.20 2.59 0.06 N/A S10-54-4B2 4 4.8 185 5.40 0.13 0.20 2.59 0.06 N/A S10-54-4C2 4 4.8 185 5.40 0.15 0.20 2.59 0.06 N/A S10-54-4D3 4 4.8 185 5.40 0.063 0.20 2.59 0.07 0.85 S6-33-6A 6 12 180 0.74 0.15 0.30 0.88 0.26 0.57 S6-33-6B 6 12 180 0.74 0.16 0.30 0.88 0.26 0.63 S6-33-6C 6 12 180 0.74 0.20 0.30 0.88 0.26 0.75 S6-43-6A 6 12 137 1.00 0.20 0.30 1.20 0.22 0.92 S6-43-6B 6 12 137 1.00 0.17 0.30 1.20 0.26 0.66 S6-43-6C 6 12 137 1.00 0.10 0.30 1.20 0.36 0.26 S8-43-6A 6 9 184 2.25 0.18 0.30 2.02 0.16 1.15 S8-43-6B 6 9 184 2.25 0.17 0.30 2.02 0.19 0.87
S10-43-6A 6 7.2 230 4.25 0.16 0.30 3.06 0.15 1.07 S10-43-6B 6 7.2 230 4.25 0.15 0.30 3.06 0.16 0.94 S10-54-6A 6 7.2 185 5.40 0.22 0.30 3.89 0.15 1.39 S10-54-6B 6 7.2 185 5.40 0.20 0.30 3.89 0.16 1.24 S6-43-8A 8 16 137 1.01 0.44 0.40 1.62 0.42 1.05 S6-43-8B 8 16 137 1.01 0.45 0.40 1.62 0.41 1.10 S6-54-8A 8 16 110 1.29 0.43 0.40 2.06 0.39 1.11 S6-54-8B 8 16 110 1.29 0.38 0.40 2.06 0.38 1.00 S8-43-8A 8 12 183 2.27 0.30 0.40 2.73 0.33 0.89 S8-43-8B 8 12 183 2.27 0.32 0.40 2.73 0.32 1.01
Metric Conversion: 1 ft. = .305 m, 1 in4 = 416,231 mm4, 1 in. = 25.4mm
1 Assembly designation is as follows: the first letter “D” or “S” represents double or single L-section, the first number is the vertical leg dimension (in.) of the L-section(s), the second number is the nominal thickness of the L-section (in.), and the last number is the clear span (ft).
2 Deflection readings are of top track. 3 Retest– Deflection readings are of bottom track.
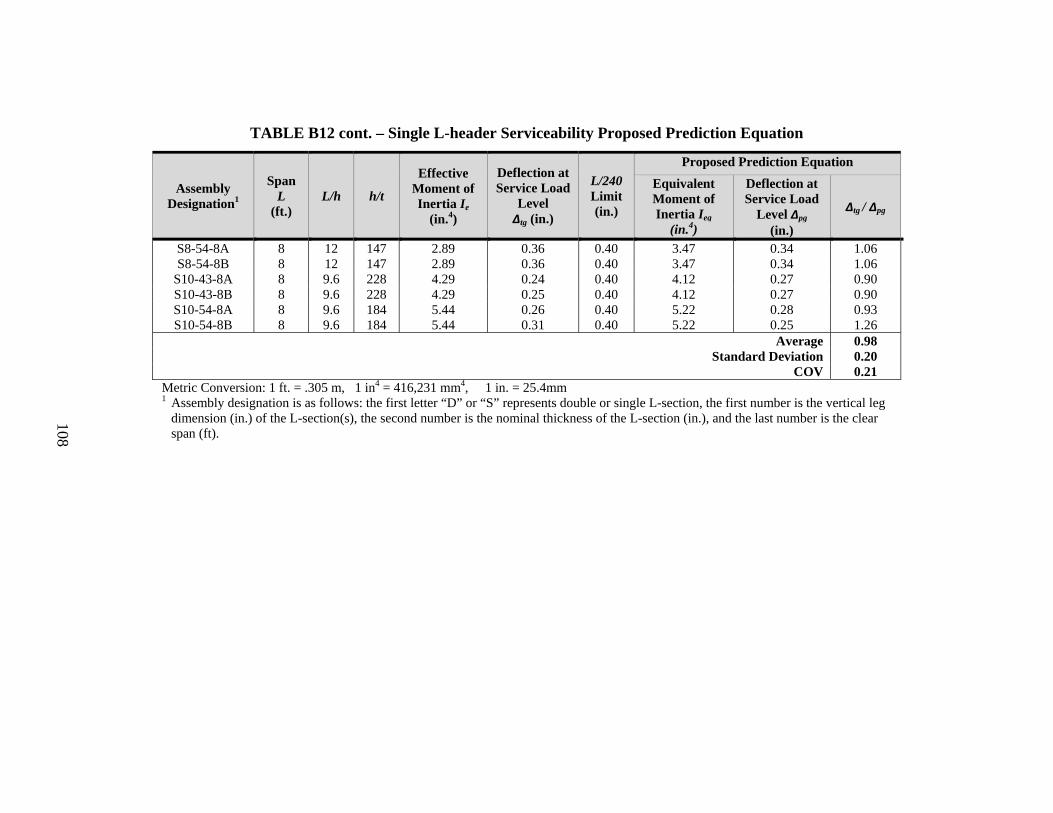
108
TABLE B12 cont. – Single L-header Serviceability Proposed Prediction Equation
Assembly Designation1
Span L
(ft.) L/h h/t
Effective Moment of Inertia Ie
(in.4)
Deflection at Service Load
Level Δtg (in.)
L/240 Limit (in.)
Proposed Prediction Equation Equivalent Moment of Inertia Ieq
(in.4)
Deflection at Service Load
Level Δpg (in.)
Δtg / Δpg
S8-54-8A 8 12 147 2.89 0.36 0.40 3.47 0.34 1.06 S8-54-8B 8 12 147 2.89 0.36 0.40 3.47 0.34 1.06
S10-43-8A 8 9.6 228 4.29 0.24 0.40 4.12 0.27 0.90 S10-43-8B 8 9.6 228 4.29 0.25 0.40 4.12 0.27 0.90 S10-54-8A 8 9.6 184 5.44 0.26 0.40 5.22 0.28 0.93 S10-54-8B 8 9.6 184 5.44 0.31 0.40 5.22 0.25 1.26
Average 0.98 Standard Deviation 0.20
COV 0.21 Metric Conversion: 1 ft. = .305 m, 1 in4 = 416,231 mm4, 1 in. = 25.4mm
1 Assembly designation is as follows: the first letter “D” or “S” represents double or single L-section, the first number is the vertical leg dimension (in.) of the L-section(s), the second number is the nominal thickness of the L-section (in.), and the last number is the clear span (ft).
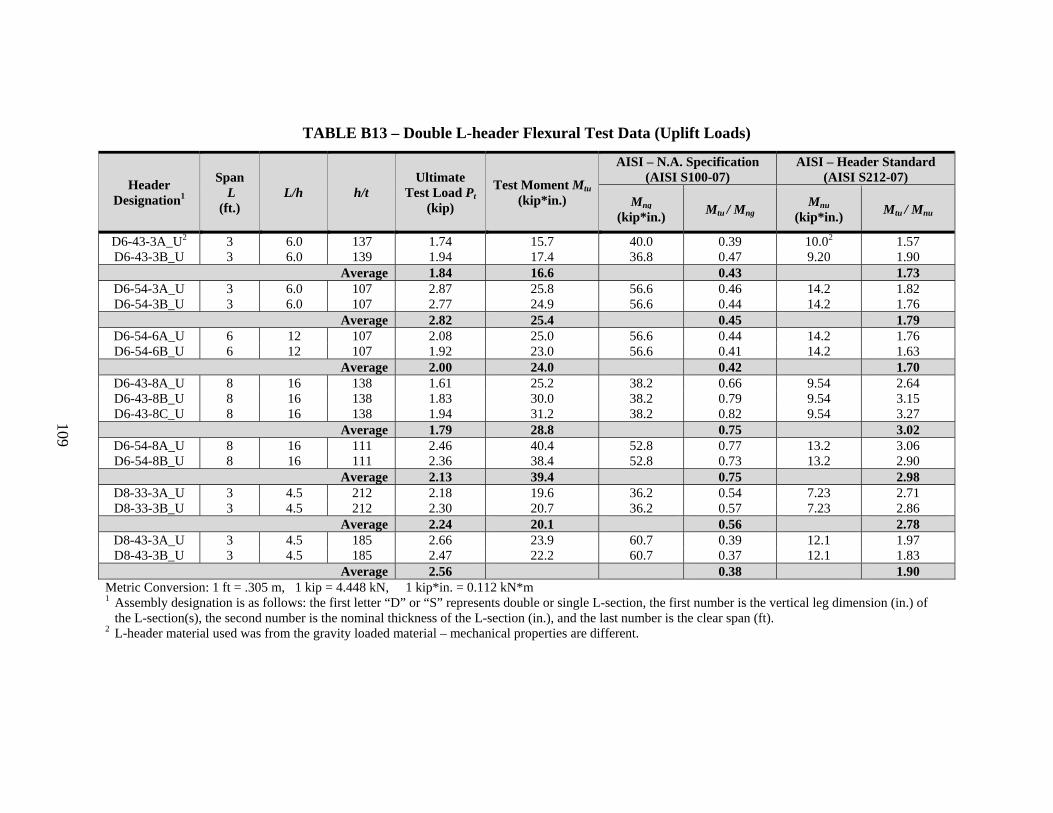
109
TABLE B13 – Double L-header Flexural Test Data (Uplift Loads)
Header Designation1
Span L
(ft.) L/h h/t
Ultimate Test Load Pt
(kip)
Test Moment Mtu (kip*in.)
AISI – N.A. Specification (AISI S100-07)
AISI – Header Standard (AISI S212-07)
Mng (kip*in.) Mtu / Mng
Mnu (kip*in.) Mtu / Mnu
D6-43-3A_U2 3 6.0 137 1.74 15.7 40.0 0.39 10.02 1.57 D6-43-3B_U 3 6.0 139 1.94 17.4 36.8 0.47 9.20 1.90
Average 1.84 16.6 0.43 1.73 D6-54-3A_U 3 6.0 107 2.87 25.8 56.6 0.46 14.2 1.82 D6-54-3B_U 3 6.0 107 2.77 24.9 56.6 0.44 14.2 1.76
Average 2.82 25.4 0.45 1.79 D6-54-6A_U 6 12 107 2.08 25.0 56.6 0.44 14.2 1.76 D6-54-6B_U 6 12 107 1.92 23.0 56.6 0.41 14.2 1.63
Average 2.00 24.0 0.42 1.70 D6-43-8A_U 8 16 138 1.61 25.2 38.2 0.66 9.54 2.64 D6-43-8B_U 8 16 138 1.83 30.0 38.2 0.79 9.54 3.15 D6-43-8C_U 8 16 138 1.94 31.2 38.2 0.82 9.54 3.27
Average 1.79 28.8 0.75 3.02 D6-54-8A_U 8 16 111 2.46 40.4 52.8 0.77 13.2 3.06 D6-54-8B_U 8 16 111 2.36 38.4 52.8 0.73 13.2 2.90
Average 2.13 39.4 0.75 2.98 D8-33-3A_U 3 4.5 212 2.18 19.6 36.2 0.54 7.23 2.71 D8-33-3B_U 3 4.5 212 2.30 20.7 36.2 0.57 7.23 2.86
Average 2.24 20.1 0.56 2.78 D8-43-3A_U 3 4.5 185 2.66 23.9 60.7 0.39 12.1 1.97 D8-43-3B_U 3 4.5 185 2.47 22.2 60.7 0.37 12.1 1.83
Average 2.56 0.38 1.90 Metric Conversion: 1 ft = .305 m, 1 kip = 4.448 kN, 1 kip*in. = 0.112 kN*m
1 Assembly designation is as follows: the first letter “D” or “S” represents double or single L-section, the first number is the vertical leg dimension (in.) of the L-section(s), the second number is the nominal thickness of the L-section (in.), and the last number is the clear span (ft).
2 L-header material used was from the gravity loaded material – mechanical properties are different.
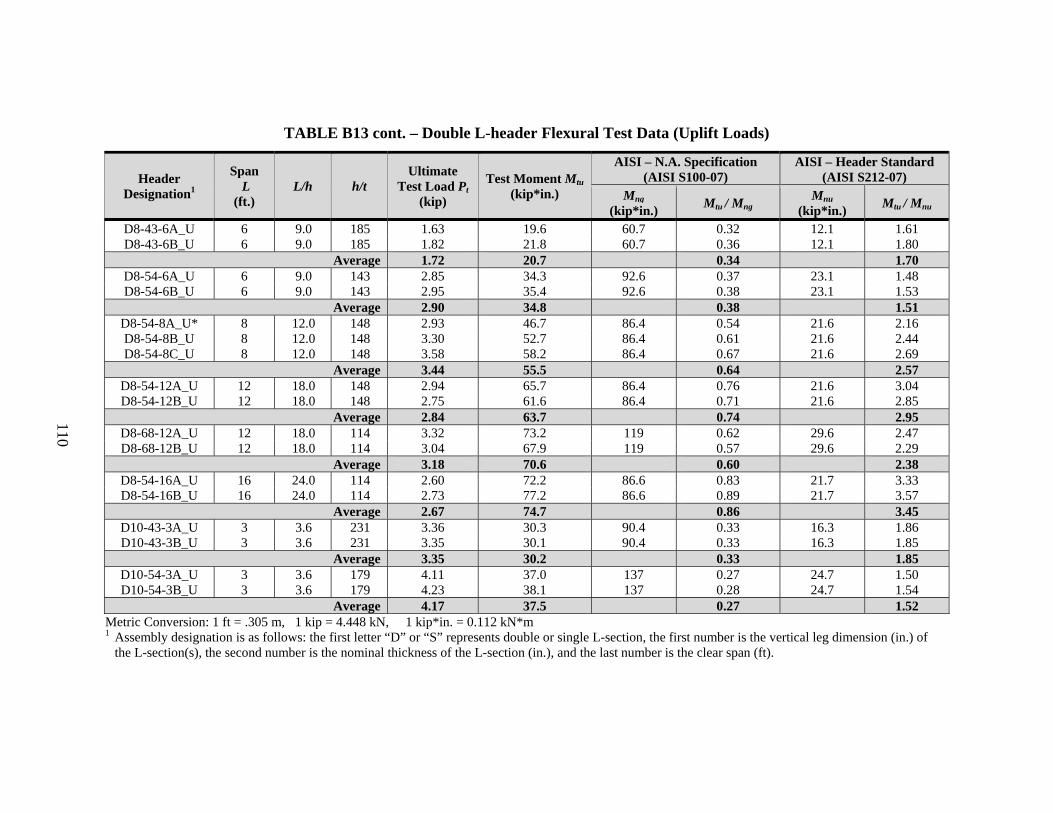
110
TABLE B13 cont. – Double L-header Flexural Test Data (Uplift Loads)
Header Designation1
Span L
(ft.) L/h h/t
Ultimate Test Load Pt
(kip)
Test Moment Mtu (kip*in.)
AISI – N.A. Specification (AISI S100-07)
AISI – Header Standard (AISI S212-07)
Mng (kip*in.) Mtu / Mng
Mnu (kip*in.) Mtu / Mnu
D8-43-6A_U 6 9.0 185 1.63 19.6 60.7 0.32 12.1 1.61 D8-43-6B_U 6 9.0 185 1.82 21.8 60.7 0.36 12.1 1.80
Average 1.72 20.7 0.34 1.70 D8-54-6A_U 6 9.0 143 2.85 34.3 92.6 0.37 23.1 1.48 D8-54-6B_U 6 9.0 143 2.95 35.4 92.6 0.38 23.1 1.53
Average 2.90 34.8 0.38 1.51 D8-54-8A_U* 8 12.0 148 2.93 46.7 86.4 0.54 21.6 2.16 D8-54-8B_U 8 12.0 148 3.30 52.7 86.4 0.61 21.6 2.44 D8-54-8C_U 8 12.0 148 3.58 58.2 86.4 0.67 21.6 2.69
Average 3.44 55.5 0.64 2.57 D8-54-12A_U 12 18.0 148 2.94 65.7 86.4 0.76 21.6 3.04 D8-54-12B_U 12 18.0 148 2.75 61.6 86.4 0.71 21.6 2.85
Average 2.84 63.7 0.74 2.95 D8-68-12A_U 12 18.0 114 3.32 73.2 119 0.62 29.6 2.47 D8-68-12B_U 12 18.0 114 3.04 67.9 119 0.57 29.6 2.29
Average 3.18 70.6 0.60 2.38 D8-54-16A_U 16 24.0 114 2.60 72.2 86.6 0.83 21.7 3.33 D8-54-16B_U 16 24.0 114 2.73 77.2 86.6 0.89 21.7 3.57
Average 2.67 74.7 0.86 3.45 D10-43-3A_U 3 3.6 231 3.36 30.3 90.4 0.33 16.3 1.86 D10-43-3B_U 3 3.6 231 3.35 30.1 90.4 0.33 16.3 1.85
Average 3.35 30.2 0.33 1.85 D10-54-3A_U 3 3.6 179 4.11 37.0 137 0.27 24.7 1.50 D10-54-3B_U 3 3.6 179 4.23 38.1 137 0.28 24.7 1.54
Average 4.17 37.5 0.27 1.52 Metric Conversion: 1 ft = .305 m, 1 kip = 4.448 kN, 1 kip*in. = 0.112 kN*m
1 Assembly designation is as follows: the first letter “D” or “S” represents double or single L-section, the first number is the vertical leg dimension (in.) of the L-section(s), the second number is the nominal thickness of the L-section (in.), and the last number is the clear span (ft).
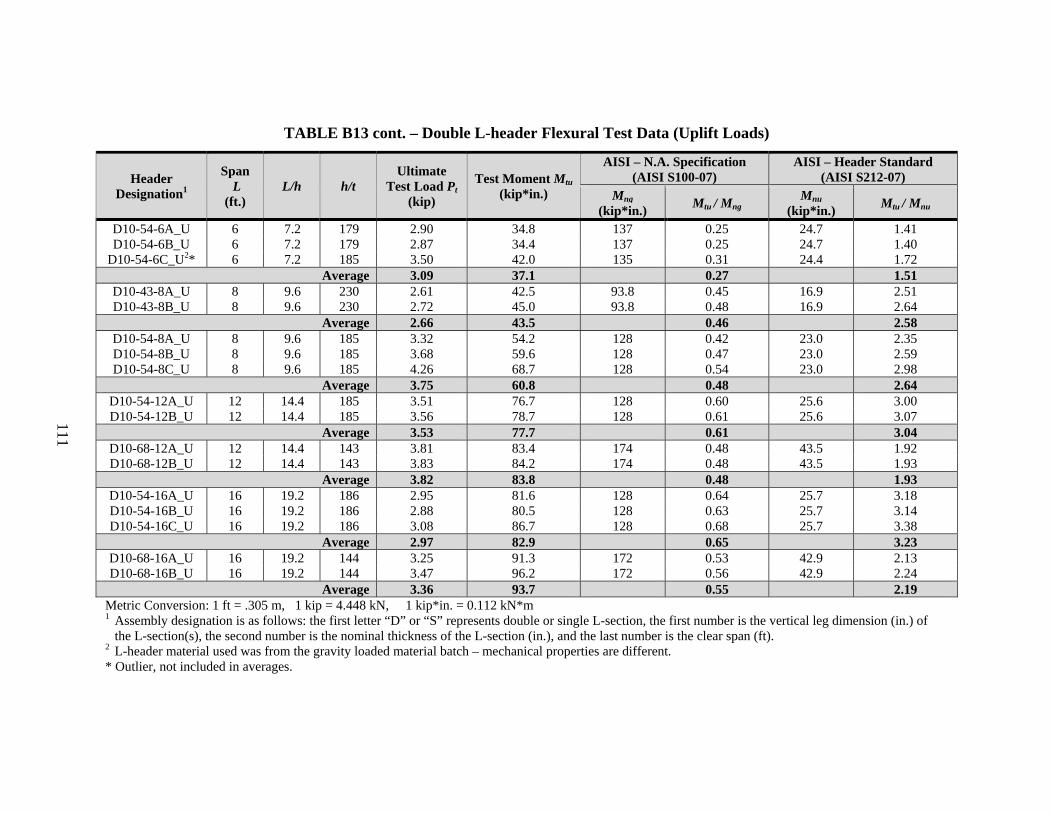
111
TABLE B13 cont. – Double L-header Flexural Test Data (Uplift Loads)
Header Designation1
Span L
(ft.) L/h h/t
Ultimate Test Load Pt
(kip)
Test Moment Mtu (kip*in.)
AISI – N.A. Specification (AISI S100-07)
AISI – Header Standard (AISI S212-07)
Mng (kip*in.) Mtu / Mng
Mnu (kip*in.) Mtu / Mnu
D10-54-6A_U 6 7.2 179 2.90 34.8 137 0.25 24.7 1.41 D10-54-6B_U 6 7.2 179 2.87 34.4 137 0.25 24.7 1.40
D10-54-6C_U2* 6 7.2 185 3.50 42.0 135 0.31 24.4 1.72 Average 3.09 37.1 0.27 1.51
D10-43-8A_U 8 9.6 230 2.61 42.5 93.8 0.45 16.9 2.51 D10-43-8B_U 8 9.6 230 2.72 45.0 93.8 0.48 16.9 2.64
Average 2.66 43.5 0.46 2.58 D10-54-8A_U 8 9.6 185 3.32 54.2 128 0.42 23.0 2.35 D10-54-8B_U 8 9.6 185 3.68 59.6 128 0.47 23.0 2.59 D10-54-8C_U 8 9.6 185 4.26 68.7 128 0.54 23.0 2.98
Average 3.75 60.8 0.48 2.64 D10-54-12A_U 12 14.4 185 3.51 76.7 128 0.60 25.6 3.00 D10-54-12B_U 12 14.4 185 3.56 78.7 128 0.61 25.6 3.07
Average 3.53 77.7 0.61 3.04 D10-68-12A_U 12 14.4 143 3.81 83.4 174 0.48 43.5 1.92 D10-68-12B_U 12 14.4 143 3.83 84.2 174 0.48 43.5 1.93
Average 3.82 83.8 0.48 1.93 D10-54-16A_U 16 19.2 186 2.95 81.6 128 0.64 25.7 3.18 D10-54-16B_U 16 19.2 186 2.88 80.5 128 0.63 25.7 3.14 D10-54-16C_U 16 19.2 186 3.08 86.7 128 0.68 25.7 3.38
Average 2.97 82.9 0.65 3.23 D10-68-16A_U 16 19.2 144 3.25 91.3 172 0.53 42.9 2.13 D10-68-16B_U 16 19.2 144 3.47 96.2 172 0.56 42.9 2.24
Average 3.36 93.7 0.55 2.19 Metric Conversion: 1 ft = .305 m, 1 kip = 4.448 kN, 1 kip*in. = 0.112 kN*m
1 Assembly designation is as follows: the first letter “D” or “S” represents double or single L-section, the first number is the vertical leg dimension (in.) of the L-section(s), the second number is the nominal thickness of the L-section (in.), and the last number is the clear span (ft).
2 L-header material used was from the gravity loaded material batch – mechanical properties are different. * Outlier, not included in averages.
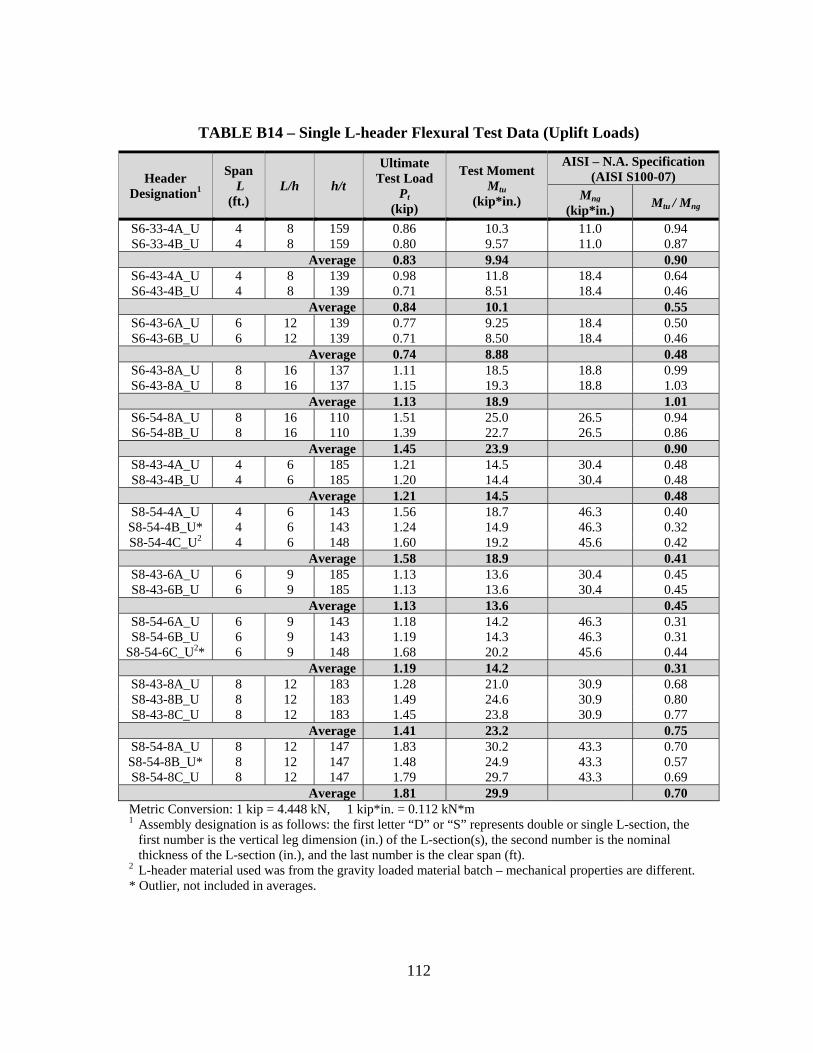
112
TABLE B14 – Single L-header Flexural Test Data (Uplift Loads)
Header Designation1
Span L
(ft.) L/h h/t
Ultimate Test Load
Pt (kip)
Test Moment Mtu
(kip*in.)
AISI – N.A. Specification (AISI S100-07)
Mng (kip*in.) Mtu / Mng
S6-33-4A_U 4 8 159 0.86 10.3 11.0 0.94 S6-33-4B_U 4 8 159 0.80 9.57 11.0 0.87
Average 0.83 9.94 0.90 S6-43-4A_U 4 8 139 0.98 11.8 18.4 0.64 S6-43-4B_U 4 8 139 0.71 8.51 18.4 0.46
Average 0.84 10.1 0.55 S6-43-6A_U 6 12 139 0.77 9.25 18.4 0.50 S6-43-6B_U 6 12 139 0.71 8.50 18.4 0.46
Average 0.74 8.88 0.48 S6-43-8A_U 8 16 137 1.11 18.5 18.8 0.99 S6-43-8A_U 8 16 137 1.15 19.3 18.8 1.03
Average 1.13 18.9 1.01 S6-54-8A_U 8 16 110 1.51 25.0 26.5 0.94 S6-54-8B_U 8 16 110 1.39 22.7 26.5 0.86
Average 1.45 23.9 0.90 S8-43-4A_U 4 6 185 1.21 14.5 30.4 0.48 S8-43-4B_U 4 6 185 1.20 14.4 30.4 0.48
Average 1.21 14.5 0.48 S8-54-4A_U 4 6 143 1.56 18.7 46.3 0.40 S8-54-4B_U* 4 6 143 1.24 14.9 46.3 0.32 S8-54-4C_U2 4 6 148 1.60 19.2 45.6 0.42
Average 1.58 18.9 0.41 S8-43-6A_U 6 9 185 1.13 13.6 30.4 0.45 S8-43-6B_U 6 9 185 1.13 13.6 30.4 0.45
Average 1.13 13.6 0.45 S8-54-6A_U 6 9 143 1.18 14.2 46.3 0.31 S8-54-6B_U 6 9 143 1.19 14.3 46.3 0.31
S8-54-6C_U2* 6 9 148 1.68 20.2 45.6 0.44 Average 1.19 14.2 0.31
S8-43-8A_U 8 12 183 1.28 21.0 30.9 0.68 S8-43-8B_U 8 12 183 1.49 24.6 30.9 0.80 S8-43-8C_U 8 12 183 1.45 23.8 30.9 0.77
Average 1.41 23.2 0.75 S8-54-8A_U 8 12 147 1.83 30.2 43.3 0.70 S8-54-8B_U* 8 12 147 1.48 24.9 43.3 0.57 S8-54-8C_U 8 12 147 1.79 29.7 43.3 0.69
Average 1.81 29.9 0.70 Metric Conversion: 1 kip = 4.448 kN, 1 kip*in. = 0.112 kN*m
1 Assembly designation is as follows: the first letter “D” or “S” represents double or single L-section, the first number is the vertical leg dimension (in.) of the L-section(s), the second number is the nominal thickness of the L-section (in.), and the last number is the clear span (ft).
2 L-header material used was from the gravity loaded material batch – mechanical properties are different. * Outlier, not included in averages.
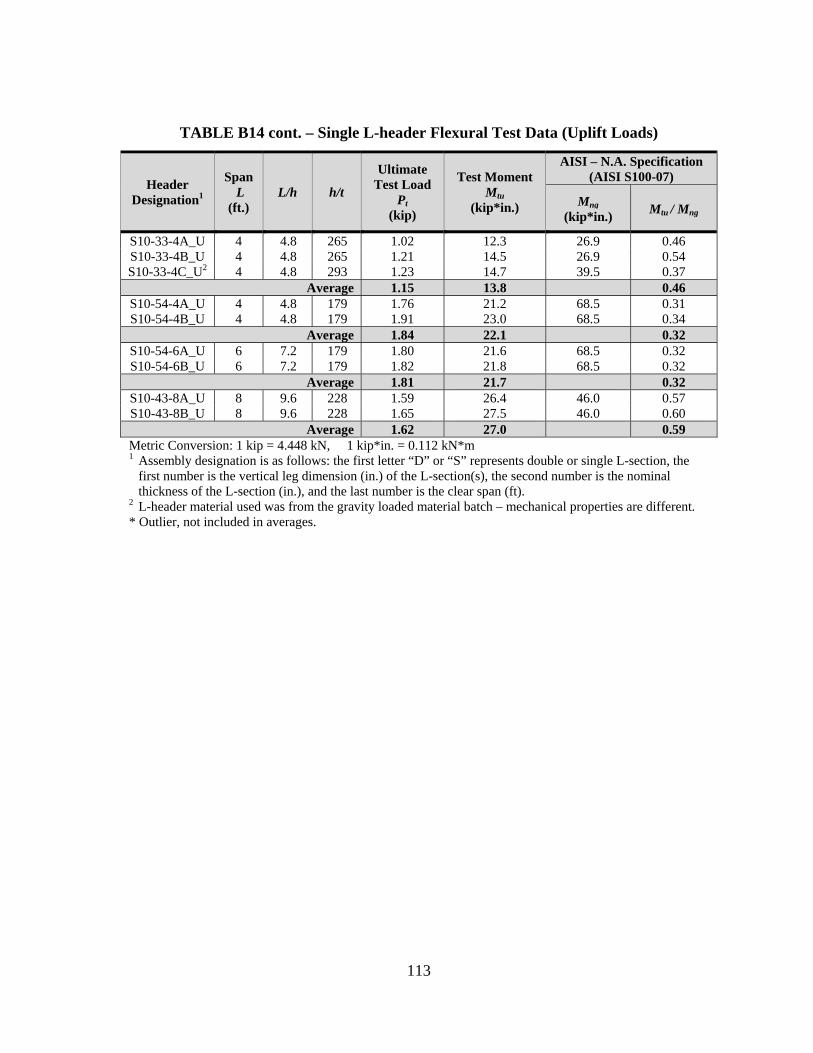
113
TABLE B14 cont. – Single L-header Flexural Test Data (Uplift Loads)
Header Designation1
Span L
(ft.) L/h h/t
Ultimate Test Load
Pt (kip)
Test Moment Mtu
(kip*in.)
AISI – N.A. Specification (AISI S100-07)
Mng (kip*in.) Mtu / Mng
S10-33-4A_U 4 4.8 265 1.02 12.3 26.9 0.46 S10-33-4B_U 4 4.8 265 1.21 14.5 26.9 0.54 S10-33-4C_U2 4 4.8 293 1.23 14.7 39.5 0.37
Average 1.15 13.8 0.46 S10-54-4A_U 4 4.8 179 1.76 21.2 68.5 0.31 S10-54-4B_U 4 4.8 179 1.91 23.0 68.5 0.34
Average 1.84 22.1 0.32 S10-54-6A_U 6 7.2 179 1.80 21.6 68.5 0.32 S10-54-6B_U 6 7.2 179 1.82 21.8 68.5 0.32
Average 1.81 21.7 0.32 S10-43-8A_U 8 9.6 228 1.59 26.4 46.0 0.57 S10-43-8B_U 8 9.6 228 1.65 27.5 46.0 0.60
Average 1.62 27.0 0.59 Metric Conversion: 1 kip = 4.448 kN, 1 kip*in. = 0.112 kN*m
1 Assembly designation is as follows: the first letter “D” or “S” represents double or single L-section, the first number is the vertical leg dimension (in.) of the L-section(s), the second number is the nominal thickness of the L-section (in.), and the last number is the clear span (ft).
2 L-header material used was from the gravity loaded material batch – mechanical properties are different. * Outlier, not included in averages.
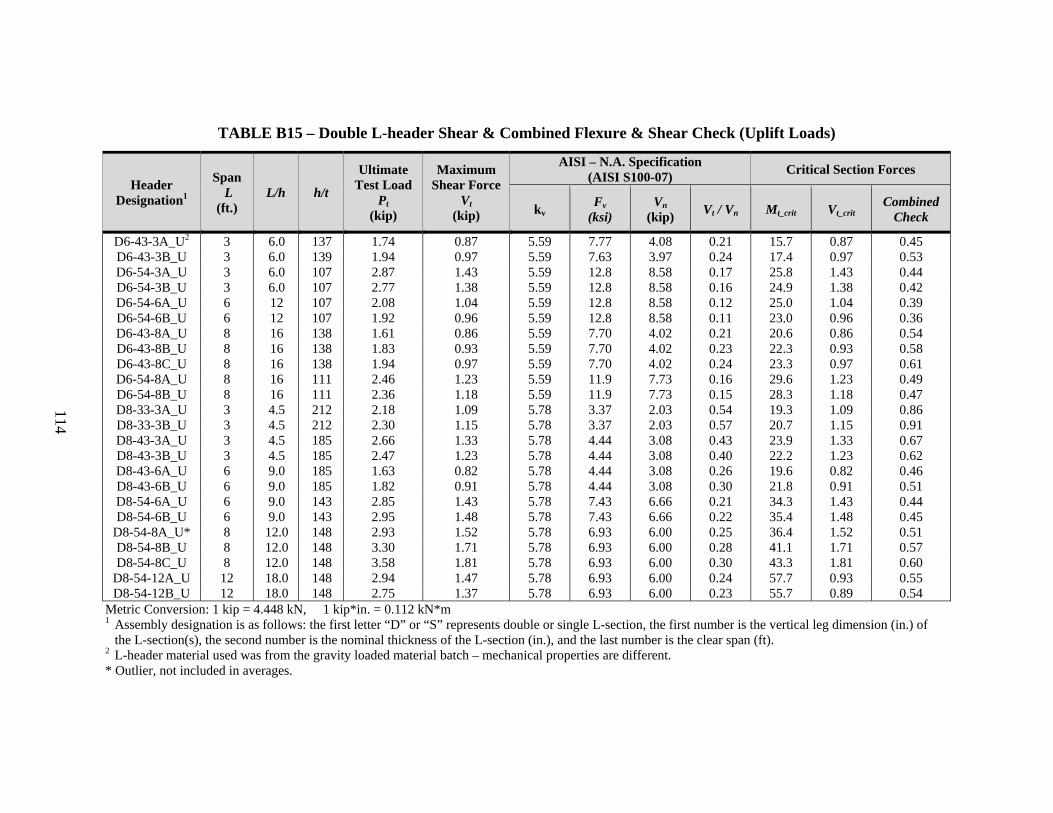
114
TABLE B15 – Double L-header Shear & Combined Flexure & Shear Check (Uplift Loads)
Header Designation1
Span L
(ft.) L/h h/t
Ultimate Test Load
Pt (kip)
Maximum Shear Force
Vt (kip)
AISI – N.A. Specification (AISI S100-07) Critical Section Forces
kv Fv
(ksi) Vn
(kip) Vt / Vn Mt_crit Vt_crit Combined
Check
D6-43-3A_U2 3 6.0 137 1.74 0.87 5.59 7.77 4.08 0.21 15.7 0.87 0.45 D6-43-3B_U 3 6.0 139 1.94 0.97 5.59 7.63 3.97 0.24 17.4 0.97 0.53 D6-54-3A_U 3 6.0 107 2.87 1.43 5.59 12.8 8.58 0.17 25.8 1.43 0.44 D6-54-3B_U 3 6.0 107 2.77 1.38 5.59 12.8 8.58 0.16 24.9 1.38 0.42 D6-54-6A_U 6 12 107 2.08 1.04 5.59 12.8 8.58 0.12 25.0 1.04 0.39 D6-54-6B_U 6 12 107 1.92 0.96 5.59 12.8 8.58 0.11 23.0 0.96 0.36 D6-43-8A_U 8 16 138 1.61 0.86 5.59 7.70 4.02 0.21 20.6 0.86 0.54 D6-43-8B_U 8 16 138 1.83 0.93 5.59 7.70 4.02 0.23 22.3 0.93 0.58 D6-43-8C_U 8 16 138 1.94 0.97 5.59 7.70 4.02 0.24 23.3 0.97 0.61 D6-54-8A_U 8 16 111 2.46 1.23 5.59 11.9 7.73 0.16 29.6 1.23 0.49 D6-54-8B_U 8 16 111 2.36 1.18 5.59 11.9 7.73 0.15 28.3 1.18 0.47 D8-33-3A_U 3 4.5 212 2.18 1.09 5.78 3.37 2.03 0.54 19.3 1.09 0.86 D8-33-3B_U 3 4.5 212 2.30 1.15 5.78 3.37 2.03 0.57 20.7 1.15 0.91 D8-43-3A_U 3 4.5 185 2.66 1.33 5.78 4.44 3.08 0.43 23.9 1.33 0.67 D8-43-3B_U 3 4.5 185 2.47 1.23 5.78 4.44 3.08 0.40 22.2 1.23 0.62 D8-43-6A_U 6 9.0 185 1.63 0.82 5.78 4.44 3.08 0.26 19.6 0.82 0.46 D8-43-6B_U 6 9.0 185 1.82 0.91 5.78 4.44 3.08 0.30 21.8 0.91 0.51 D8-54-6A_U 6 9.0 143 2.85 1.43 5.78 7.43 6.66 0.21 34.3 1.43 0.44 D8-54-6B_U 6 9.0 143 2.95 1.48 5.78 7.43 6.66 0.22 35.4 1.48 0.45
D8-54-8A_U* 8 12.0 148 2.93 1.52 5.78 6.93 6.00 0.25 36.4 1.52 0.51 D8-54-8B_U 8 12.0 148 3.30 1.71 5.78 6.93 6.00 0.28 41.1 1.71 0.57 D8-54-8C_U 8 12.0 148 3.58 1.81 5.78 6.93 6.00 0.30 43.3 1.81 0.60
D8-54-12A_U 12 18.0 148 2.94 1.47 5.78 6.93 6.00 0.24 57.7 0.93 0.55 D8-54-12B_U 12 18.0 148 2.75 1.37 5.78 6.93 6.00 0.23 55.7 0.89 0.54
Metric Conversion: 1 kip = 4.448 kN, 1 kip*in. = 0.112 kN*m
1 Assembly designation is as follows: the first letter “D” or “S” represents double or single L-section, the first number is the vertical leg dimension (in.) of the L-section(s), the second number is the nominal thickness of the L-section (in.), and the last number is the clear span (ft).
2 L-header material used was from the gravity loaded material batch – mechanical properties are different. * Outlier, not included in averages.
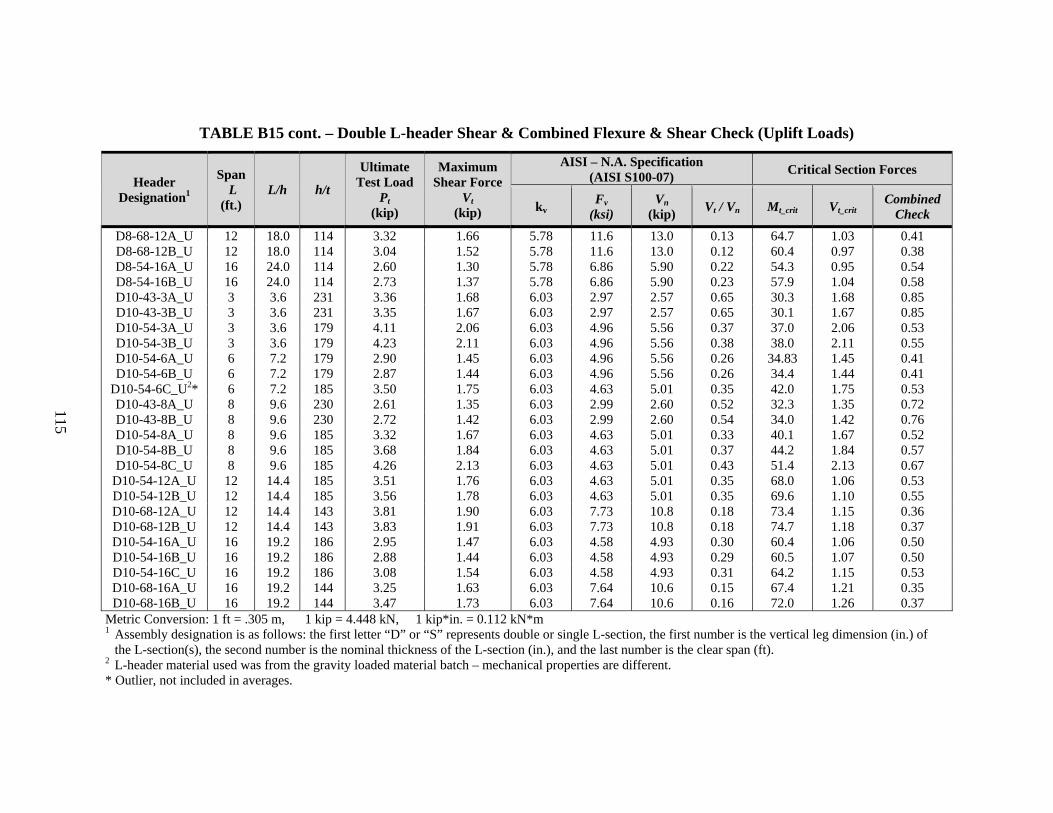
115
TABLE B15 cont. – Double L-header Shear & Combined Flexure & Shear Check (Uplift Loads)
Header Designation1
Span L
(ft.) L/h h/t
Ultimate Test Load
Pt (kip)
Maximum Shear Force
Vt (kip)
AISI – N.A. Specification (AISI S100-07) Critical Section Forces
kv Fv
(ksi) Vn
(kip) Vt / Vn Mt_crit Vt_crit Combined
Check D8-68-12A_U 12 18.0 114 3.32 1.66 5.78 11.6 13.0 0.13 64.7 1.03 0.41 D8-68-12B_U 12 18.0 114 3.04 1.52 5.78 11.6 13.0 0.12 60.4 0.97 0.38 D8-54-16A_U 16 24.0 114 2.60 1.30 5.78 6.86 5.90 0.22 54.3 0.95 0.54 D8-54-16B_U 16 24.0 114 2.73 1.37 5.78 6.86 5.90 0.23 57.9 1.04 0.58 D10-43-3A_U 3 3.6 231 3.36 1.68 6.03 2.97 2.57 0.65 30.3 1.68 0.85 D10-43-3B_U 3 3.6 231 3.35 1.67 6.03 2.97 2.57 0.65 30.1 1.67 0.85 D10-54-3A_U 3 3.6 179 4.11 2.06 6.03 4.96 5.56 0.37 37.0 2.06 0.53 D10-54-3B_U 3 3.6 179 4.23 2.11 6.03 4.96 5.56 0.38 38.0 2.11 0.55 D10-54-6A_U 6 7.2 179 2.90 1.45 6.03 4.96 5.56 0.26 34.83 1.45 0.41 D10-54-6B_U 6 7.2 179 2.87 1.44 6.03 4.96 5.56 0.26 34.4 1.44 0.41
D10-54-6C_U2* 6 7.2 185 3.50 1.75 6.03 4.63 5.01 0.35 42.0 1.75 0.53 D10-43-8A_U 8 9.6 230 2.61 1.35 6.03 2.99 2.60 0.52 32.3 1.35 0.72 D10-43-8B_U 8 9.6 230 2.72 1.42 6.03 2.99 2.60 0.54 34.0 1.42 0.76 D10-54-8A_U 8 9.6 185 3.32 1.67 6.03 4.63 5.01 0.33 40.1 1.67 0.52 D10-54-8B_U 8 9.6 185 3.68 1.84 6.03 4.63 5.01 0.37 44.2 1.84 0.57 D10-54-8C_U 8 9.6 185 4.26 2.13 6.03 4.63 5.01 0.43 51.4 2.13 0.67
D10-54-12A_U 12 14.4 185 3.51 1.76 6.03 4.63 5.01 0.35 68.0 1.06 0.53 D10-54-12B_U 12 14.4 185 3.56 1.78 6.03 4.63 5.01 0.35 69.6 1.10 0.55 D10-68-12A_U 12 14.4 143 3.81 1.90 6.03 7.73 10.8 0.18 73.4 1.15 0.36 D10-68-12B_U 12 14.4 143 3.83 1.91 6.03 7.73 10.8 0.18 74.7 1.18 0.37 D10-54-16A_U 16 19.2 186 2.95 1.47 6.03 4.58 4.93 0.30 60.4 1.06 0.50 D10-54-16B_U 16 19.2 186 2.88 1.44 6.03 4.58 4.93 0.29 60.5 1.07 0.50 D10-54-16C_U 16 19.2 186 3.08 1.54 6.03 4.58 4.93 0.31 64.2 1.15 0.53 D10-68-16A_U 16 19.2 144 3.25 1.63 6.03 7.64 10.6 0.15 67.4 1.21 0.35 D10-68-16B_U 16 19.2 144 3.47 1.73 6.03 7.64 10.6 0.16 72.0 1.26 0.37
Metric Conversion: 1 ft = .305 m, 1 kip = 4.448 kN, 1 kip*in. = 0.112 kN*m
1 Assembly designation is as follows: the first letter “D” or “S” represents double or single L-section, the first number is the vertical leg dimension (in.) of the L-section(s), the second number is the nominal thickness of the L-section (in.), and the last number is the clear span (ft).
2 L-header material used was from the gravity loaded material batch – mechanical properties are different. * Outlier, not included in averages.
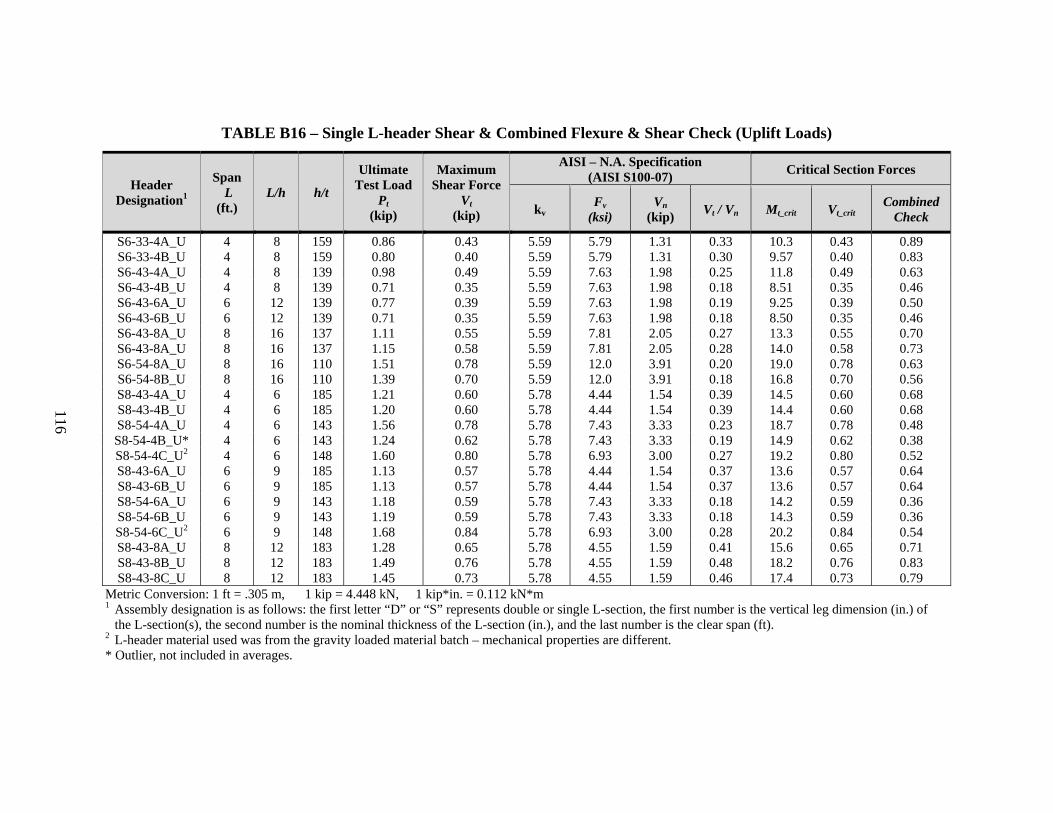
116
TABLE B16 – Single L-header Shear & Combined Flexure & Shear Check (Uplift Loads)
Header Designation1
Span L
(ft.) L/h h/t
Ultimate Test Load
Pt (kip)
Maximum Shear Force
Vt (kip)
AISI – N.A. Specification (AISI S100-07) Critical Section Forces
kv Fv
(ksi) Vn
(kip) Vt / Vn Mt_crit Vt_crit Combined
Check
S6-33-4A_U 4 8 159 0.86 0.43 5.59 5.79 1.31 0.33 10.3 0.43 0.89 S6-33-4B_U 4 8 159 0.80 0.40 5.59 5.79 1.31 0.30 9.57 0.40 0.83 S6-43-4A_U 4 8 139 0.98 0.49 5.59 7.63 1.98 0.25 11.8 0.49 0.63 S6-43-4B_U 4 8 139 0.71 0.35 5.59 7.63 1.98 0.18 8.51 0.35 0.46 S6-43-6A_U 6 12 139 0.77 0.39 5.59 7.63 1.98 0.19 9.25 0.39 0.50 S6-43-6B_U 6 12 139 0.71 0.35 5.59 7.63 1.98 0.18 8.50 0.35 0.46 S6-43-8A_U 8 16 137 1.11 0.55 5.59 7.81 2.05 0.27 13.3 0.55 0.70 S6-43-8A_U 8 16 137 1.15 0.58 5.59 7.81 2.05 0.28 14.0 0.58 0.73 S6-54-8A_U 8 16 110 1.51 0.78 5.59 12.0 3.91 0.20 19.0 0.78 0.63 S6-54-8B_U 8 16 110 1.39 0.70 5.59 12.0 3.91 0.18 16.8 0.70 0.56 S8-43-4A_U 4 6 185 1.21 0.60 5.78 4.44 1.54 0.39 14.5 0.60 0.68 S8-43-4B_U 4 6 185 1.20 0.60 5.78 4.44 1.54 0.39 14.4 0.60 0.68 S8-54-4A_U 4 6 143 1.56 0.78 5.78 7.43 3.33 0.23 18.7 0.78 0.48 S8-54-4B_U* 4 6 143 1.24 0.62 5.78 7.43 3.33 0.19 14.9 0.62 0.38 S8-54-4C_U2 4 6 148 1.60 0.80 5.78 6.93 3.00 0.27 19.2 0.80 0.52 S8-43-6A_U 6 9 185 1.13 0.57 5.78 4.44 1.54 0.37 13.6 0.57 0.64 S8-43-6B_U 6 9 185 1.13 0.57 5.78 4.44 1.54 0.37 13.6 0.57 0.64 S8-54-6A_U 6 9 143 1.18 0.59 5.78 7.43 3.33 0.18 14.2 0.59 0.36 S8-54-6B_U 6 9 143 1.19 0.59 5.78 7.43 3.33 0.18 14.3 0.59 0.36 S8-54-6C_U2 6 9 148 1.68 0.84 5.78 6.93 3.00 0.28 20.2 0.84 0.54 S8-43-8A_U 8 12 183 1.28 0.65 5.78 4.55 1.59 0.41 15.6 0.65 0.71 S8-43-8B_U 8 12 183 1.49 0.76 5.78 4.55 1.59 0.48 18.2 0.76 0.83 S8-43-8C_U 8 12 183 1.45 0.73 5.78 4.55 1.59 0.46 17.4 0.73 0.79
Metric Conversion: 1 ft = .305 m, 1 kip = 4.448 kN, 1 kip*in. = 0.112 kN*m
1 Assembly designation is as follows: the first letter “D” or “S” represents double or single L-section, the first number is the vertical leg dimension (in.) of the L-section(s), the second number is the nominal thickness of the L-section (in.), and the last number is the clear span (ft).
2 L-header material used was from the gravity loaded material batch – mechanical properties are different. * Outlier, not included in averages.
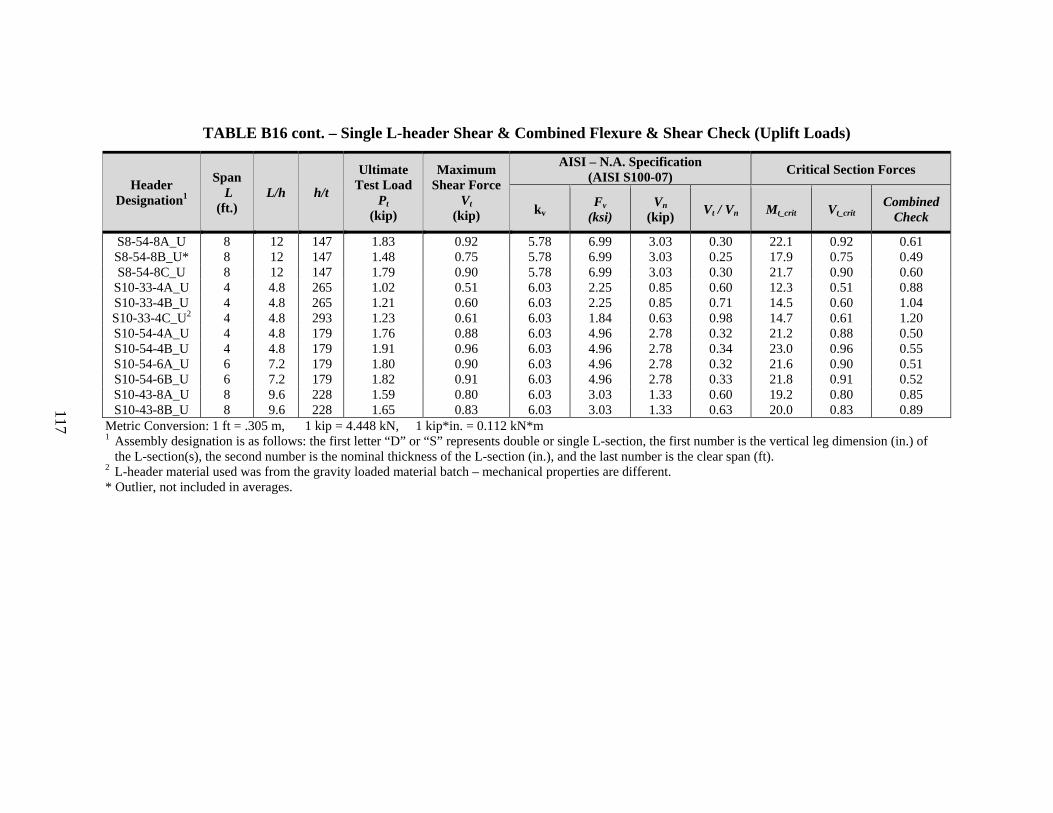
117
TABLE B16 cont. – Single L-header Shear & Combined Flexure & Shear Check (Uplift Loads)
Header Designation1
Span L
(ft.) L/h h/t
Ultimate Test Load
Pt (kip)
Maximum Shear Force
Vt (kip)
AISI – N.A. Specification (AISI S100-07) Critical Section Forces
kv Fv
(ksi) Vn
(kip) Vt / Vn Mt_crit Vt_crit Combined
Check
S8-54-8A_U 8 12 147 1.83 0.92 5.78 6.99 3.03 0.30 22.1 0.92 0.61 S8-54-8B_U* 8 12 147 1.48 0.75 5.78 6.99 3.03 0.25 17.9 0.75 0.49 S8-54-8C_U 8 12 147 1.79 0.90 5.78 6.99 3.03 0.30 21.7 0.90 0.60
S10-33-4A_U 4 4.8 265 1.02 0.51 6.03 2.25 0.85 0.60 12.3 0.51 0.88 S10-33-4B_U 4 4.8 265 1.21 0.60 6.03 2.25 0.85 0.71 14.5 0.60 1.04 S10-33-4C_U2 4 4.8 293 1.23 0.61 6.03 1.84 0.63 0.98 14.7 0.61 1.20 S10-54-4A_U 4 4.8 179 1.76 0.88 6.03 4.96 2.78 0.32 21.2 0.88 0.50 S10-54-4B_U 4 4.8 179 1.91 0.96 6.03 4.96 2.78 0.34 23.0 0.96 0.55 S10-54-6A_U 6 7.2 179 1.80 0.90 6.03 4.96 2.78 0.32 21.6 0.90 0.51 S10-54-6B_U 6 7.2 179 1.82 0.91 6.03 4.96 2.78 0.33 21.8 0.91 0.52 S10-43-8A_U 8 9.6 228 1.59 0.80 6.03 3.03 1.33 0.60 19.2 0.80 0.85 S10-43-8B_U 8 9.6 228 1.65 0.83 6.03 3.03 1.33 0.63 20.0 0.83 0.89
Metric Conversion: 1 ft = .305 m, 1 kip = 4.448 kN, 1 kip*in. = 0.112 kN*m
1 Assembly designation is as follows: the first letter “D” or “S” represents double or single L-section, the first number is the vertical leg dimension (in.) of the L-section(s), the second number is the nominal thickness of the L-section (in.), and the last number is the clear span (ft).
2 L-header material used was from the gravity loaded material batch – mechanical properties are different. * Outlier, not included in averages.
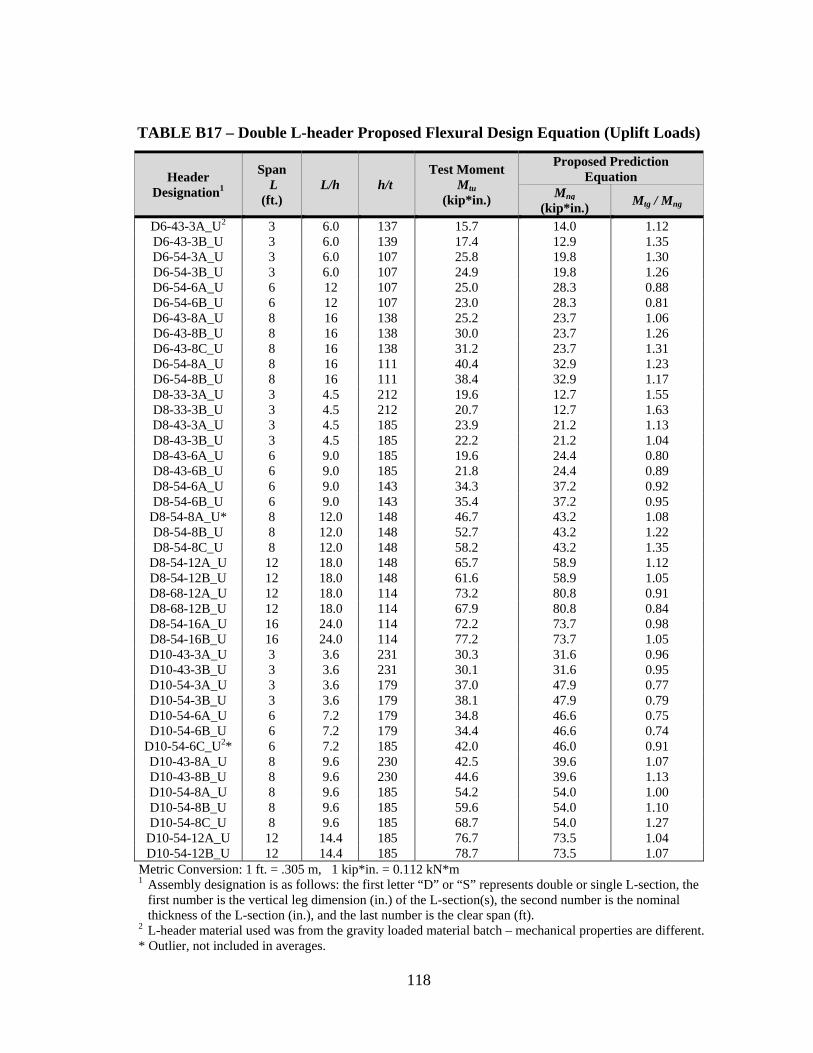
118
TABLE B17 – Double L-header Proposed Flexural Design Equation (Uplift Loads)
Header Designation1
Span L
(ft.) L/h h/t
Test Moment Mtu
(kip*in.)
Proposed Prediction Equation
Mng (kip*in.) Mtg / Mng
D6-43-3A_U2 3 6.0 137 15.7 14.0 1.12 D6-43-3B_U 3 6.0 139 17.4 12.9 1.35 D6-54-3A_U 3 6.0 107 25.8 19.8 1.30 D6-54-3B_U 3 6.0 107 24.9 19.8 1.26 D6-54-6A_U 6 12 107 25.0 28.3 0.88 D6-54-6B_U 6 12 107 23.0 28.3 0.81 D6-43-8A_U 8 16 138 25.2 23.7 1.06 D6-43-8B_U 8 16 138 30.0 23.7 1.26 D6-43-8C_U 8 16 138 31.2 23.7 1.31 D6-54-8A_U 8 16 111 40.4 32.9 1.23 D6-54-8B_U 8 16 111 38.4 32.9 1.17 D8-33-3A_U 3 4.5 212 19.6 12.7 1.55 D8-33-3B_U 3 4.5 212 20.7 12.7 1.63 D8-43-3A_U 3 4.5 185 23.9 21.2 1.13 D8-43-3B_U 3 4.5 185 22.2 21.2 1.04 D8-43-6A_U 6 9.0 185 19.6 24.4 0.80 D8-43-6B_U 6 9.0 185 21.8 24.4 0.89 D8-54-6A_U 6 9.0 143 34.3 37.2 0.92 D8-54-6B_U 6 9.0 143 35.4 37.2 0.95
D8-54-8A_U* 8 12.0 148 46.7 43.2 1.08 D8-54-8B_U 8 12.0 148 52.7 43.2 1.22 D8-54-8C_U 8 12.0 148 58.2 43.2 1.35
D8-54-12A_U 12 18.0 148 65.7 58.9 1.12 D8-54-12B_U 12 18.0 148 61.6 58.9 1.05 D8-68-12A_U 12 18.0 114 73.2 80.8 0.91 D8-68-12B_U 12 18.0 114 67.9 80.8 0.84 D8-54-16A_U 16 24.0 114 72.2 73.7 0.98 D8-54-16B_U 16 24.0 114 77.2 73.7 1.05 D10-43-3A_U 3 3.6 231 30.3 31.6 0.96 D10-43-3B_U 3 3.6 231 30.1 31.6 0.95 D10-54-3A_U 3 3.6 179 37.0 47.9 0.77 D10-54-3B_U 3 3.6 179 38.1 47.9 0.79 D10-54-6A_U 6 7.2 179 34.8 46.6 0.75 D10-54-6B_U 6 7.2 179 34.4 46.6 0.74
D10-54-6C_U2* 6 7.2 185 42.0 46.0 0.91 D10-43-8A_U 8 9.6 230 42.5 39.6 1.07 D10-43-8B_U 8 9.6 230 44.6 39.6 1.13 D10-54-8A_U 8 9.6 185 54.2 54.0 1.00 D10-54-8B_U 8 9.6 185 59.6 54.0 1.10 D10-54-8C_U 8 9.6 185 68.7 54.0 1.27
D10-54-12A_U 12 14.4 185 76.7 73.5 1.04 D10-54-12B_U 12 14.4 185 78.7 73.5 1.07
Metric Conversion: 1 ft. = .305 m, 1 kip*in. = 0.112 kN*m
1 Assembly designation is as follows: the first letter “D” or “S” represents double or single L-section, the first number is the vertical leg dimension (in.) of the L-section(s), the second number is the nominal thickness of the L-section (in.), and the last number is the clear span (ft).
2 L-header material used was from the gravity loaded material batch – mechanical properties are different. * Outlier, not included in averages.
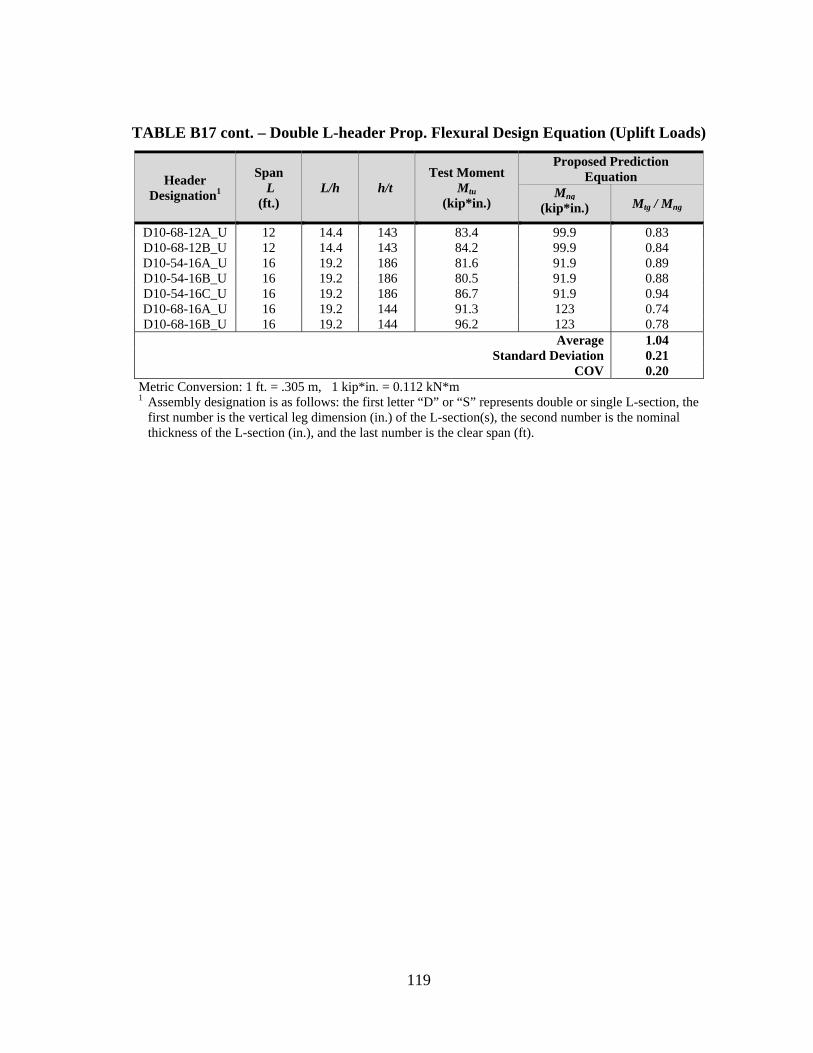
119
TABLE B17 cont. – Double L-header Prop. Flexural Design Equation (Uplift Loads)
Header Designation1
Span L
(ft.) L/h h/t
Test Moment Mtu
(kip*in.)
Proposed Prediction Equation
Mng (kip*in.) Mtg / Mng
D10-68-12A_U 12 14.4 143 83.4 99.9 0.83 D10-68-12B_U 12 14.4 143 84.2 99.9 0.84 D10-54-16A_U 16 19.2 186 81.6 91.9 0.89 D10-54-16B_U 16 19.2 186 80.5 91.9 0.88 D10-54-16C_U 16 19.2 186 86.7 91.9 0.94 D10-68-16A_U 16 19.2 144 91.3 123 0.74 D10-68-16B_U 16 19.2 144 96.2 123 0.78
Average 1.04 Standard Deviation 0.21
COV 0.20 Metric Conversion: 1 ft. = .305 m, 1 kip*in. = 0.112 kN*m
1 Assembly designation is as follows: the first letter “D” or “S” represents double or single L-section, the first number is the vertical leg dimension (in.) of the L-section(s), the second number is the nominal thickness of the L-section (in.), and the last number is the clear span (ft).
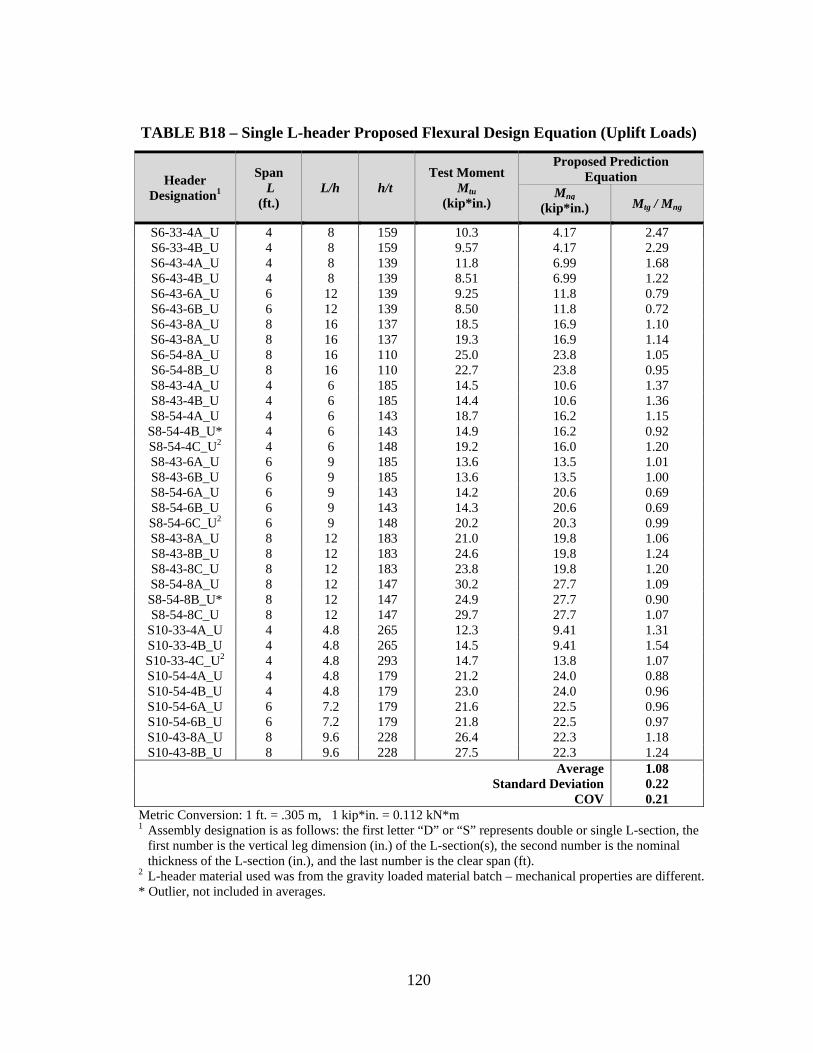
120
TABLE B18 – Single L-header Proposed Flexural Design Equation (Uplift Loads)
Header Designation1
Span L
(ft.) L/h h/t
Test Moment Mtu
(kip*in.)
Proposed Prediction Equation
Mng (kip*in.) Mtg / Mng
S6-33-4A_U 4 8 159 10.3 4.17 2.47 S6-33-4B_U 4 8 159 9.57 4.17 2.29 S6-43-4A_U 4 8 139 11.8 6.99 1.68 S6-43-4B_U 4 8 139 8.51 6.99 1.22 S6-43-6A_U 6 12 139 9.25 11.8 0.79 S6-43-6B_U 6 12 139 8.50 11.8 0.72 S6-43-8A_U 8 16 137 18.5 16.9 1.10 S6-43-8A_U 8 16 137 19.3 16.9 1.14 S6-54-8A_U 8 16 110 25.0 23.8 1.05 S6-54-8B_U 8 16 110 22.7 23.8 0.95 S8-43-4A_U 4 6 185 14.5 10.6 1.37 S8-43-4B_U 4 6 185 14.4 10.6 1.36 S8-54-4A_U 4 6 143 18.7 16.2 1.15 S8-54-4B_U* 4 6 143 14.9 16.2 0.92 S8-54-4C_U2 4 6 148 19.2 16.0 1.20 S8-43-6A_U 6 9 185 13.6 13.5 1.01 S8-43-6B_U 6 9 185 13.6 13.5 1.00 S8-54-6A_U 6 9 143 14.2 20.6 0.69 S8-54-6B_U 6 9 143 14.3 20.6 0.69 S8-54-6C_U2 6 9 148 20.2 20.3 0.99 S8-43-8A_U 8 12 183 21.0 19.8 1.06 S8-43-8B_U 8 12 183 24.6 19.8 1.24 S8-43-8C_U 8 12 183 23.8 19.8 1.20 S8-54-8A_U 8 12 147 30.2 27.7 1.09 S8-54-8B_U* 8 12 147 24.9 27.7 0.90 S8-54-8C_U 8 12 147 29.7 27.7 1.07
S10-33-4A_U 4 4.8 265 12.3 9.41 1.31 S10-33-4B_U 4 4.8 265 14.5 9.41 1.54 S10-33-4C_U2 4 4.8 293 14.7 13.8 1.07 S10-54-4A_U 4 4.8 179 21.2 24.0 0.88 S10-54-4B_U 4 4.8 179 23.0 24.0 0.96 S10-54-6A_U 6 7.2 179 21.6 22.5 0.96 S10-54-6B_U 6 7.2 179 21.8 22.5 0.97 S10-43-8A_U 8 9.6 228 26.4 22.3 1.18 S10-43-8B_U 8 9.6 228 27.5 22.3 1.24
Average 1.08 Standard Deviation 0.22
COV 0.21 Metric Conversion: 1 ft. = .305 m, 1 kip*in. = 0.112 kN*m
1 Assembly designation is as follows: the first letter “D” or “S” represents double or single L-section, the first number is the vertical leg dimension (in.) of the L-section(s), the second number is the nominal thickness of the L-section (in.), and the last number is the clear span (ft).
2 L-header material used was from the gravity loaded material batch – mechanical properties are different. * Outlier, not included in averages.
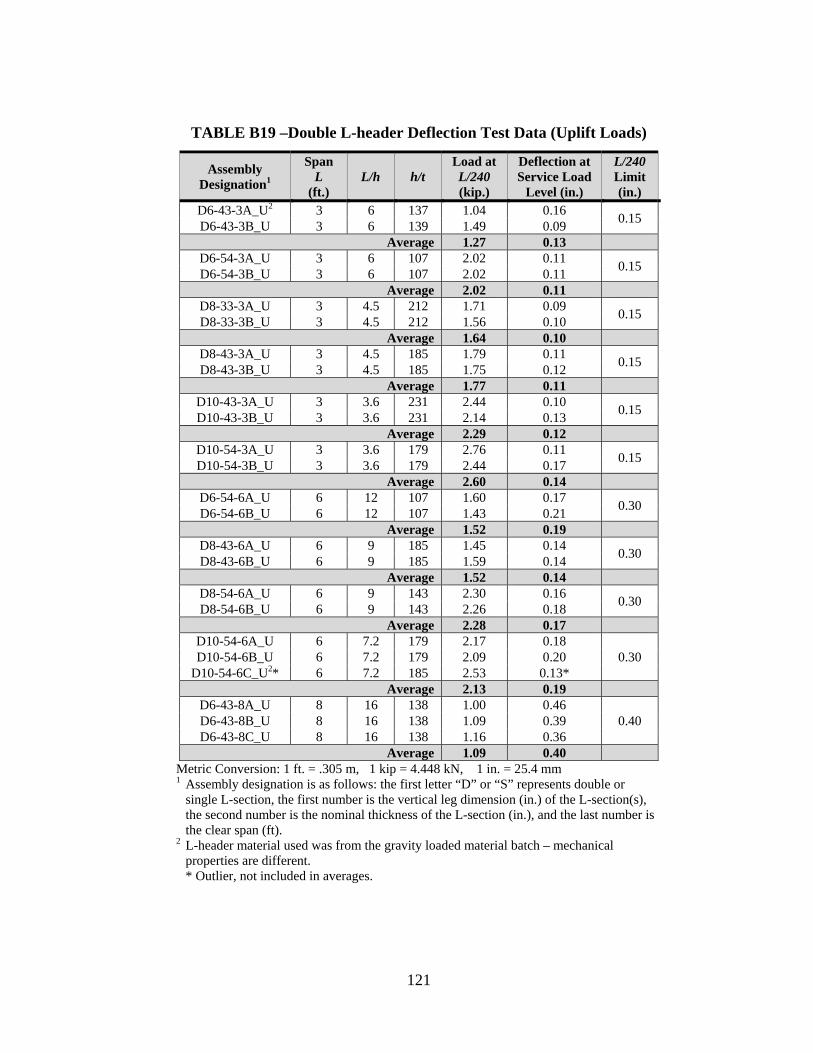
121
TABLE B19 –Double L-header Deflection Test Data (Uplift Loads)
Assembly Designation1
Span L
(ft.) L/h h/t
Load at L/240 (kip.)
Deflection at Service Load
Level (in.)
L/240 Limit (in.)
D6-43-3A_U2 3 6 137 1.04 0.16 0.15 D6-43-3B_U 3 6 139 1.49 0.09 Average 1.27 0.13
D6-54-3A_U 3 6 107 2.02 0.11 0.15 D6-54-3B_U 3 6 107 2.02 0.11 Average 2.02 0.11
D8-33-3A_U 3 4.5 212 1.71 0.09 0.15 D8-33-3B_U 3 4.5 212 1.56 0.10 Average 1.64 0.10
D8-43-3A_U 3 4.5 185 1.79 0.11 0.15 D8-43-3B_U 3 4.5 185 1.75 0.12 Average 1.77 0.11
D10-43-3A_U 3 3.6 231 2.44 0.10 0.15 D10-43-3B_U 3 3.6 231 2.14 0.13 Average 2.29 0.12
D10-54-3A_U 3 3.6 179 2.76 0.11 0.15 D10-54-3B_U 3 3.6 179 2.44 0.17 Average 2.60 0.14
D6-54-6A_U 6 12 107 1.60 0.17 0.30 D6-54-6B_U 6 12 107 1.43 0.21 Average 1.52 0.19
D8-43-6A_U 6 9 185 1.45 0.14 0.30 D8-43-6B_U 6 9 185 1.59 0.14 Average 1.52 0.14
D8-54-6A_U 6 9 143 2.30 0.16 0.30 D8-54-6B_U 6 9 143 2.26 0.18 Average 2.28 0.17
D10-54-6A_U 6 7.2 179 2.17 0.18 0.30 D10-54-6B_U 6 7.2 179 2.09 0.20
D10-54-6C_U2* 6 7.2 185 2.53 0.13* Average 2.13 0.19
D6-43-8A_U 8 16 138 1.00 0.46 0.40 D6-43-8B_U 8 16 138 1.09 0.39
D6-43-8C_U 8 16 138 1.16 0.36 Average 1.09 0.40
Metric Conversion: 1 ft. = .305 m, 1 kip = 4.448 kN, 1 in. = 25.4 mm
1 Assembly designation is as follows: the first letter “D” or “S” represents double or single L-section, the first number is the vertical leg dimension (in.) of the L-section(s), the second number is the nominal thickness of the L-section (in.), and the last number is the clear span (ft).
2 L-header material used was from the gravity loaded material batch – mechanical properties are different. * Outlier, not included in averages.
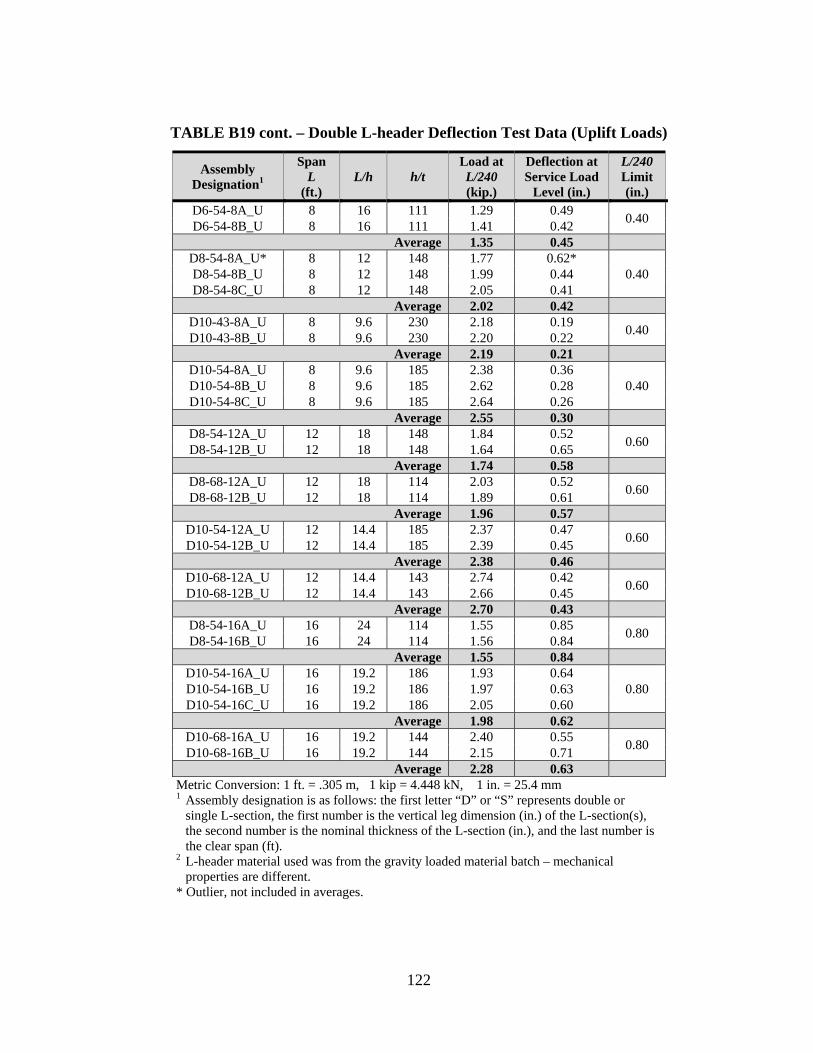
122
TABLE B19 cont. – Double L-header Deflection Test Data (Uplift Loads)
Assembly Designation1
Span L
(ft.) L/h h/t
Load at L/240 (kip.)
Deflection at Service Load
Level (in.)
L/240 Limit (in.)
D6-54-8A_U 8 16 111 1.29 0.49 0.40 D6-54-8B_U 8 16 111 1.41 0.42 Average 1.35 0.45
D8-54-8A_U* 8 12 148 1.77 0.62* 0.40 D8-54-8B_U 8 12 148 1.99 0.44
D8-54-8C_U 8 12 148 2.05 0.41 Average 2.02 0.42
D10-43-8A_U 8 9.6 230 2.18 0.19 0.40 D10-43-8B_U 8 9.6 230 2.20 0.22 Average 2.19 0.21
D10-54-8A_U 8 9.6 185 2.38 0.36 0.40 D10-54-8B_U 8 9.6 185 2.62 0.28
D10-54-8C_U 8 9.6 185 2.64 0.26 Average 2.55 0.30
D8-54-12A_U 12 18 148 1.84 0.52 0.60 D8-54-12B_U 12 18 148 1.64 0.65 Average 1.74 0.58
D8-68-12A_U 12 18 114 2.03 0.52 0.60 D8-68-12B_U 12 18 114 1.89 0.61 Average 1.96 0.57
D10-54-12A_U 12 14.4 185 2.37 0.47 0.60 D10-54-12B_U 12 14.4 185 2.39 0.45 Average 2.38 0.46
D10-68-12A_U 12 14.4 143 2.74 0.42 0.60 D10-68-12B_U 12 14.4 143 2.66 0.45 Average 2.70 0.43
D8-54-16A_U 16 24 114 1.55 0.85 0.80 D8-54-16B_U 16 24 114 1.56 0.84 Average 1.55 0.84
D10-54-16A_U 16 19.2 186 1.93 0.64 0.80 D10-54-16B_U 16 19.2 186 1.97 0.63
D10-54-16C_U 16 19.2 186 2.05 0.60 Average 1.98 0.62
D10-68-16A_U 16 19.2 144 2.40 0.55 0.80 D10-68-16B_U 16 19.2 144 2.15 0.71 Average 2.28 0.63
Metric Conversion: 1 ft. = .305 m, 1 kip = 4.448 kN, 1 in. = 25.4 mm
1 Assembly designation is as follows: the first letter “D” or “S” represents double or single L-section, the first number is the vertical leg dimension (in.) of the L-section(s), the second number is the nominal thickness of the L-section (in.), and the last number is the clear span (ft).
2 L-header material used was from the gravity loaded material batch – mechanical properties are different.
* Outlier, not included in averages.
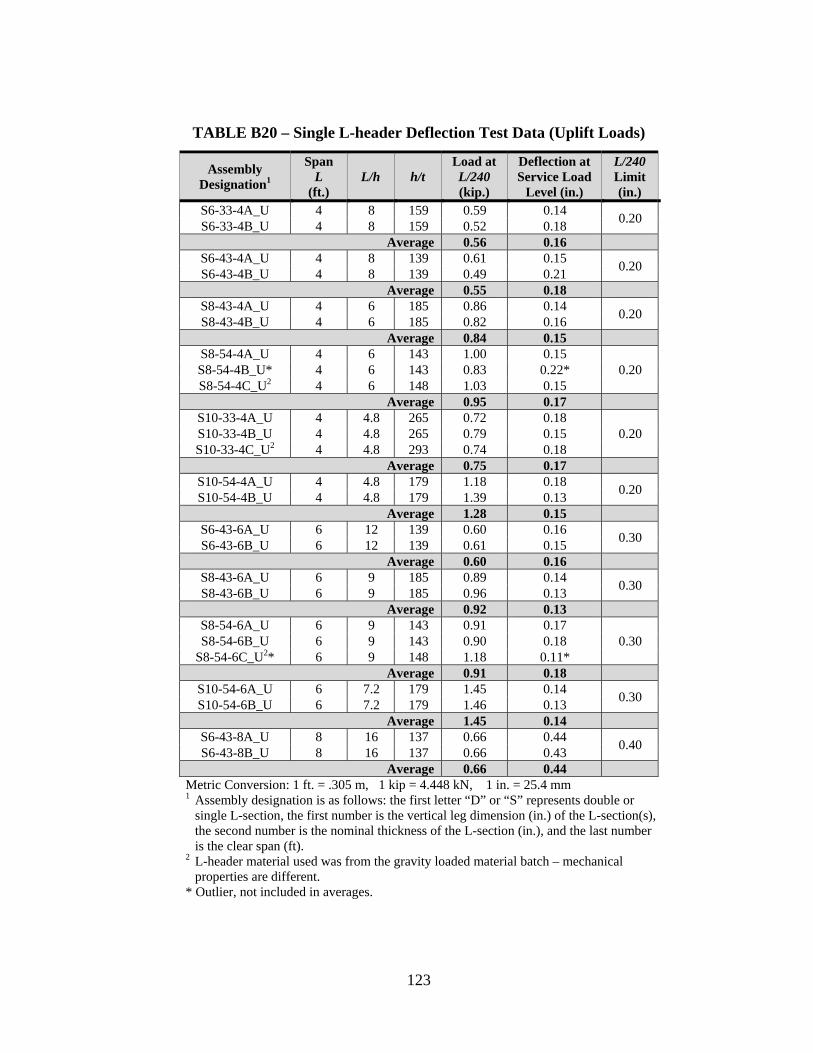
123
TABLE B20 – Single L-header Deflection Test Data (Uplift Loads)
Assembly Designation1
Span L
(ft.) L/h h/t
Load at L/240 (kip.)
Deflection at Service Load
Level (in.)
L/240 Limit (in.)
S6-33-4A_U 4 8 159 0.59 0.14 0.20 S6-33-4B_U 4 8 159 0.52 0.18 Average 0.56 0.16
S6-43-4A_U 4 8 139 0.61 0.15 0.20 S6-43-4B_U 4 8 139 0.49 0.21 Average 0.55 0.18
S8-43-4A_U 4 6 185 0.86 0.14 0.20 S8-43-4B_U 4 6 185 0.82 0.16 Average 0.84 0.15
S8-54-4A_U 4 6 143 1.00 0.15 0.20 S8-54-4B_U* 4 6 143 0.83 0.22*
S8-54-4C_U2 4 6 148 1.03 0.15 Average 0.95 0.17
S10-33-4A_U 4 4.8 265 0.72 0.18 0.20 S10-33-4B_U 4 4.8 265 0.79 0.15
S10-33-4C_U2 4 4.8 293 0.74 0.18 Average 0.75 0.17
S10-54-4A_U 4 4.8 179 1.18 0.18 0.20 S10-54-4B_U 4 4.8 179 1.39 0.13 Average 1.28 0.15
S6-43-6A_U 6 12 139 0.60 0.16 0.30 S6-43-6B_U 6 12 139 0.61 0.15 Average 0.60 0.16
S8-43-6A_U 6 9 185 0.89 0.14 0.30 S8-43-6B_U 6 9 185 0.96 0.13 Average 0.92 0.13
S8-54-6A_U 6 9 143 0.91 0.17 0.30 S8-54-6B_U 6 9 143 0.90 0.18
S8-54-6C_U2* 6 9 148 1.18 0.11* Average 0.91 0.18
S10-54-6A_U 6 7.2 179 1.45 0.14 0.30 S10-54-6B_U 6 7.2 179 1.46 0.13 Average 1.45 0.14
S6-43-8A_U 8 16 137 0.66 0.44 0.40 S6-43-8B_U 8 16 137 0.66 0.43 Average 0.66 0.44
Metric Conversion: 1 ft. = .305 m, 1 kip = 4.448 kN, 1 in. = 25.4 mm
1 Assembly designation is as follows: the first letter “D” or “S” represents double or single L-section, the first number is the vertical leg dimension (in.) of the L-section(s), the second number is the nominal thickness of the L-section (in.), and the last number is the clear span (ft).
2 L-header material used was from the gravity loaded material batch – mechanical properties are different.
* Outlier, not included in averages.
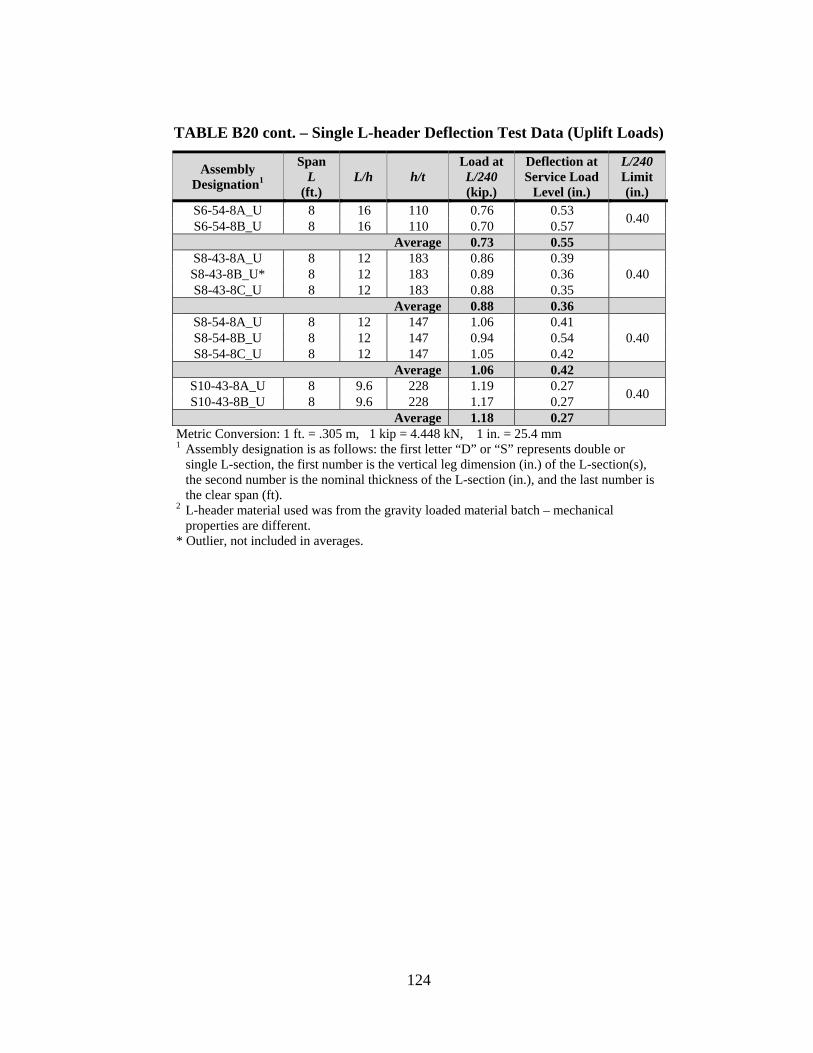
124
TABLE B20 cont. – Single L-header Deflection Test Data (Uplift Loads)
Assembly Designation1
Span L
(ft.) L/h h/t
Load at L/240 (kip.)
Deflection at Service Load
Level (in.)
L/240 Limit (in.)
S6-54-8A_U 8 16 110 0.76 0.53 0.40 S6-54-8B_U 8 16 110 0.70 0.57 Average 0.73 0.55
S8-43-8A_U 8 12 183 0.86 0.39 0.40 S8-43-8B_U* 8 12 183 0.89 0.36
S8-43-8C_U 8 12 183 0.88 0.35 Average 0.88 0.36
S8-54-8A_U 8 12 147 1.06 0.41 0.40 S8-54-8B_U 8 12 147 0.94 0.54
S8-54-8C_U 8 12 147 1.05 0.42 Average 1.06 0.42
S10-43-8A_U 8 9.6 228 1.19 0.27 0.40 S10-43-8B_U 8 9.6 228 1.17 0.27 Average 1.18 0.27
Metric Conversion: 1 ft. = .305 m, 1 kip = 4.448 kN, 1 in. = 25.4 mm
1 Assembly designation is as follows: the first letter “D” or “S” represents double or single L-section, the first number is the vertical leg dimension (in.) of the L-section(s), the second number is the nominal thickness of the L-section (in.), and the last number is the clear span (ft).
2 L-header material used was from the gravity loaded material batch – mechanical properties are different.
* Outlier, not included in averages.
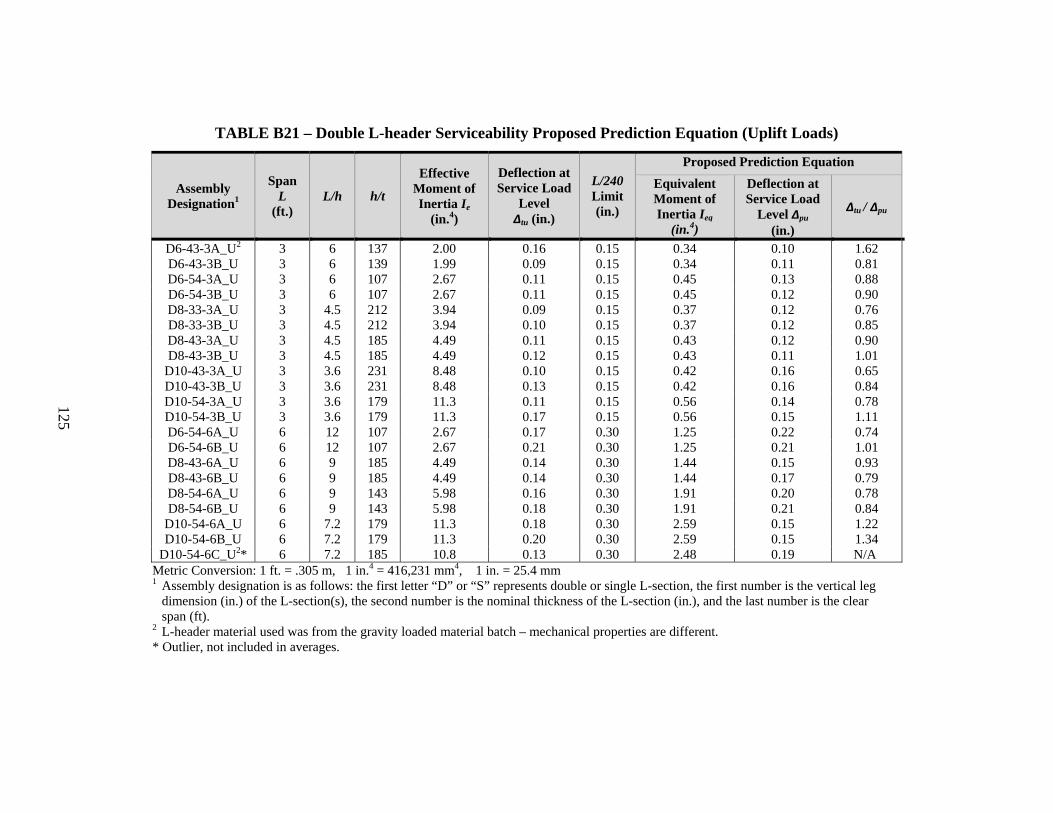
125
TABLE B21 – Double L-header Serviceability Proposed Prediction Equation (Uplift Loads)
Assembly Designation1
Span L
(ft.) L/h h/t
Effective Moment of Inertia Ie
(in.4)
Deflection at Service Load
Level Δtu (in.)
L/240 Limit (in.)
Proposed Prediction Equation Equivalent Moment of Inertia Ieq
(in.4)
Deflection at Service Load
Level Δpu (in.)
Δtu / Δpu
D6-43-3A_U2 3 6 137 2.00 0.16 0.15 0.34 0.10 1.62 D6-43-3B_U 3 6 139 1.99 0.09 0.15 0.34 0.11 0.81 D6-54-3A_U 3 6 107 2.67 0.11 0.15 0.45 0.13 0.88 D6-54-3B_U 3 6 107 2.67 0.11 0.15 0.45 0.12 0.90 D8-33-3A_U 3 4.5 212 3.94 0.09 0.15 0.37 0.12 0.76 D8-33-3B_U 3 4.5 212 3.94 0.10 0.15 0.37 0.12 0.85 D8-43-3A_U 3 4.5 185 4.49 0.11 0.15 0.43 0.12 0.90 D8-43-3B_U 3 4.5 185 4.49 0.12 0.15 0.43 0.11 1.01
D10-43-3A_U 3 3.6 231 8.48 0.10 0.15 0.42 0.16 0.65 D10-43-3B_U 3 3.6 231 8.48 0.13 0.15 0.42 0.16 0.84 D10-54-3A_U 3 3.6 179 11.3 0.11 0.15 0.56 0.14 0.78 D10-54-3B_U 3 3.6 179 11.3 0.17 0.15 0.56 0.15 1.11 D6-54-6A_U 6 12 107 2.67 0.17 0.30 1.25 0.22 0.74 D6-54-6B_U 6 12 107 2.67 0.21 0.30 1.25 0.21 1.01 D8-43-6A_U 6 9 185 4.49 0.14 0.30 1.44 0.15 0.93 D8-43-6B_U 6 9 185 4.49 0.14 0.30 1.44 0.17 0.79 D8-54-6A_U 6 9 143 5.98 0.16 0.30 1.91 0.20 0.78 D8-54-6B_U 6 9 143 5.98 0.18 0.30 1.91 0.21 0.84
D10-54-6A_U 6 7.2 179 11.3 0.18 0.30 2.59 0.15 1.22 D10-54-6B_U 6 7.2 179 11.3 0.20 0.30 2.59 0.15 1.34
D10-54-6C_U2* 6 7.2 185 10.8 0.13 0.30 2.48 0.19 N/A Metric Conversion: 1 ft. = .305 m, 1 in.4 = 416,231 mm4, 1 in. = 25.4 mm
1 Assembly designation is as follows: the first letter “D” or “S” represents double or single L-section, the first number is the vertical leg dimension (in.) of the L-section(s), the second number is the nominal thickness of the L-section (in.), and the last number is the clear span (ft).
2 L-header material used was from the gravity loaded material batch – mechanical properties are different. * Outlier, not included in averages.
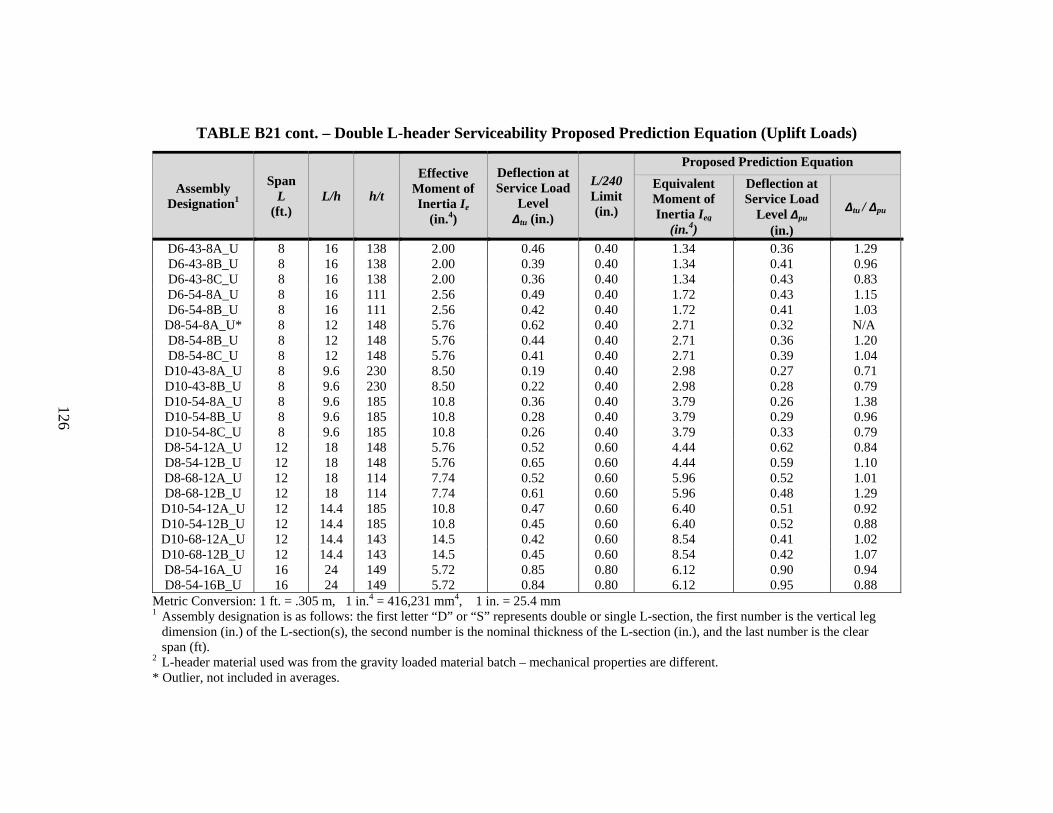
126
TABLE B21 cont. – Double L-header Serviceability Proposed Prediction Equation (Uplift Loads)
Assembly Designation1
Span L
(ft.) L/h h/t
Effective Moment of Inertia Ie
(in.4)
Deflection at Service Load
Level Δtu (in.)
L/240 Limit (in.)
Proposed Prediction Equation Equivalent Moment of Inertia Ieq
(in.4)
Deflection at Service Load
Level Δpu (in.)
Δtu / Δpu
D6-43-8A_U 8 16 138 2.00 0.46 0.40 1.34 0.36 1.29 D6-43-8B_U 8 16 138 2.00 0.39 0.40 1.34 0.41 0.96 D6-43-8C_U 8 16 138 2.00 0.36 0.40 1.34 0.43 0.83 D6-54-8A_U 8 16 111 2.56 0.49 0.40 1.72 0.43 1.15 D6-54-8B_U 8 16 111 2.56 0.42 0.40 1.72 0.41 1.03
D8-54-8A_U* 8 12 148 5.76 0.62 0.40 2.71 0.32 N/A D8-54-8B_U 8 12 148 5.76 0.44 0.40 2.71 0.36 1.20 D8-54-8C_U 8 12 148 5.76 0.41 0.40 2.71 0.39 1.04
D10-43-8A_U 8 9.6 230 8.50 0.19 0.40 2.98 0.27 0.71 D10-43-8B_U 8 9.6 230 8.50 0.22 0.40 2.98 0.28 0.79 D10-54-8A_U 8 9.6 185 10.8 0.36 0.40 3.79 0.26 1.38 D10-54-8B_U 8 9.6 185 10.8 0.28 0.40 3.79 0.29 0.96 D10-54-8C_U 8 9.6 185 10.8 0.26 0.40 3.79 0.33 0.79 D8-54-12A_U 12 18 148 5.76 0.52 0.60 4.44 0.62 0.84 D8-54-12B_U 12 18 148 5.76 0.65 0.60 4.44 0.59 1.10 D8-68-12A_U 12 18 114 7.74 0.52 0.60 5.96 0.52 1.01 D8-68-12B_U 12 18 114 7.74 0.61 0.60 5.96 0.48 1.29
D10-54-12A_U 12 14.4 185 10.8 0.47 0.60 6.40 0.51 0.92 D10-54-12B_U 12 14.4 185 10.8 0.45 0.60 6.40 0.52 0.88 D10-68-12A_U 12 14.4 143 14.5 0.42 0.60 8.54 0.41 1.02 D10-68-12B_U 12 14.4 143 14.5 0.45 0.60 8.54 0.42 1.07 D8-54-16A_U 16 24 149 5.72 0.85 0.80 6.12 0.90 0.94 D8-54-16B_U 16 24 149 5.72 0.84 0.80 6.12 0.95 0.88
Metric Conversion: 1 ft. = .305 m, 1 in.4 = 416,231 mm4, 1 in. = 25.4 mm
1 Assembly designation is as follows: the first letter “D” or “S” represents double or single L-section, the first number is the vertical leg dimension (in.) of the L-section(s), the second number is the nominal thickness of the L-section (in.), and the last number is the clear span (ft).
2 L-header material used was from the gravity loaded material batch – mechanical properties are different. * Outlier, not included in averages.
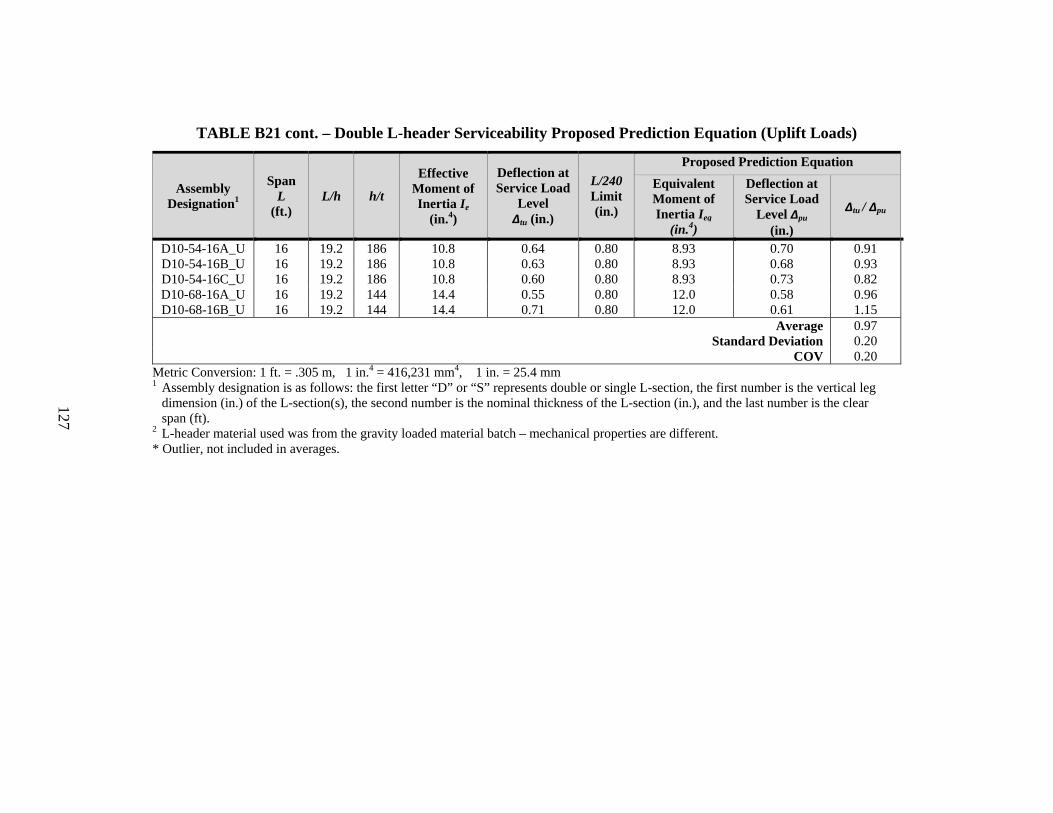
127
TABLE B21 cont. – Double L-header Serviceability Proposed Prediction Equation (Uplift Loads)
Assembly Designation1
Span L
(ft.) L/h h/t
Effective Moment of Inertia Ie
(in.4)
Deflection at Service Load
Level Δtu (in.)
L/240 Limit (in.)
Proposed Prediction Equation Equivalent Moment of Inertia Ieq
(in.4)
Deflection at Service Load
Level Δpu (in.)
Δtu / Δpu
D10-54-16A_U 16 19.2 186 10.8 0.64 0.80 8.93 0.70 0.91 D10-54-16B_U 16 19.2 186 10.8 0.63 0.80 8.93 0.68 0.93 D10-54-16C_U 16 19.2 186 10.8 0.60 0.80 8.93 0.73 0.82 D10-68-16A_U 16 19.2 144 14.4 0.55 0.80 12.0 0.58 0.96 D10-68-16B_U 16 19.2 144 14.4 0.71 0.80 12.0 0.61 1.15
Average 0.97 Standard Deviation 0.20
COV 0.20 Metric Conversion: 1 ft. = .305 m, 1 in.4 = 416,231 mm4, 1 in. = 25.4 mm
1 Assembly designation is as follows: the first letter “D” or “S” represents double or single L-section, the first number is the vertical leg dimension (in.) of the L-section(s), the second number is the nominal thickness of the L-section (in.), and the last number is the clear span (ft).
2 L-header material used was from the gravity loaded material batch – mechanical properties are different. * Outlier, not included in averages.
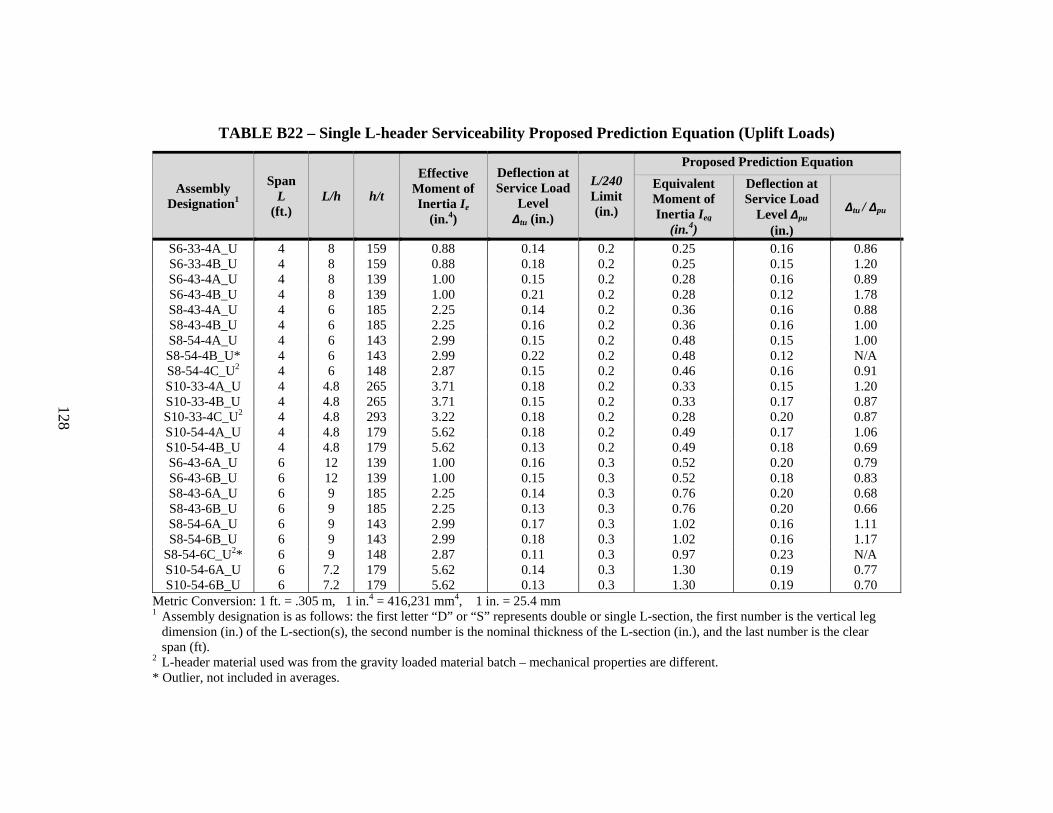
128
TABLE B22 – Single L-header Serviceability Proposed Prediction Equation (Uplift Loads)
Assembly Designation1
Span L
(ft.) L/h h/t
Effective Moment of Inertia Ie
(in.4)
Deflection at Service Load
Level Δtu (in.)
L/240 Limit (in.)
Proposed Prediction Equation Equivalent Moment of Inertia Ieq
(in.4)
Deflection at Service Load
Level Δpu (in.)
Δtu / Δpu
S6-33-4A_U 4 8 159 0.88 0.14 0.2 0.25 0.16 0.86 S6-33-4B_U 4 8 159 0.88 0.18 0.2 0.25 0.15 1.20 S6-43-4A_U 4 8 139 1.00 0.15 0.2 0.28 0.16 0.89 S6-43-4B_U 4 8 139 1.00 0.21 0.2 0.28 0.12 1.78 S8-43-4A_U 4 6 185 2.25 0.14 0.2 0.36 0.16 0.88 S8-43-4B_U 4 6 185 2.25 0.16 0.2 0.36 0.16 1.00 S8-54-4A_U 4 6 143 2.99 0.15 0.2 0.48 0.15 1.00 S8-54-4B_U* 4 6 143 2.99 0.22 0.2 0.48 0.12 N/A S8-54-4C_U2 4 6 148 2.87 0.15 0.2 0.46 0.16 0.91 S10-33-4A_U 4 4.8 265 3.71 0.18 0.2 0.33 0.15 1.20 S10-33-4B_U 4 4.8 265 3.71 0.15 0.2 0.33 0.17 0.87 S10-33-4C_U2 4 4.8 293 3.22 0.18 0.2 0.28 0.20 0.87 S10-54-4A_U 4 4.8 179 5.62 0.18 0.2 0.49 0.17 1.06 S10-54-4B_U 4 4.8 179 5.62 0.13 0.2 0.49 0.18 0.69 S6-43-6A_U 6 12 139 1.00 0.16 0.3 0.52 0.20 0.79 S6-43-6B_U 6 12 139 1.00 0.15 0.3 0.52 0.18 0.83 S8-43-6A_U 6 9 185 2.25 0.14 0.3 0.76 0.20 0.68 S8-43-6B_U 6 9 185 2.25 0.13 0.3 0.76 0.20 0.66 S8-54-6A_U 6 9 143 2.99 0.17 0.3 1.02 0.16 1.11 S8-54-6B_U 6 9 143 2.99 0.18 0.3 1.02 0.16 1.17
S8-54-6C_U2* 6 9 148 2.87 0.11 0.3 0.97 0.23 N/A S10-54-6A_U 6 7.2 179 5.62 0.14 0.3 1.30 0.19 0.77 S10-54-6B_U 6 7.2 179 5.62 0.13 0.3 1.30 0.19 0.70
Metric Conversion: 1 ft. = .305 m, 1 in.4 = 416,231 mm4, 1 in. = 25.4 mm
1 Assembly designation is as follows: the first letter “D” or “S” represents double or single L-section, the first number is the vertical leg dimension (in.) of the L-section(s), the second number is the nominal thickness of the L-section (in.), and the last number is the clear span (ft).
2 L-header material used was from the gravity loaded material batch – mechanical properties are different. * Outlier, not included in averages.
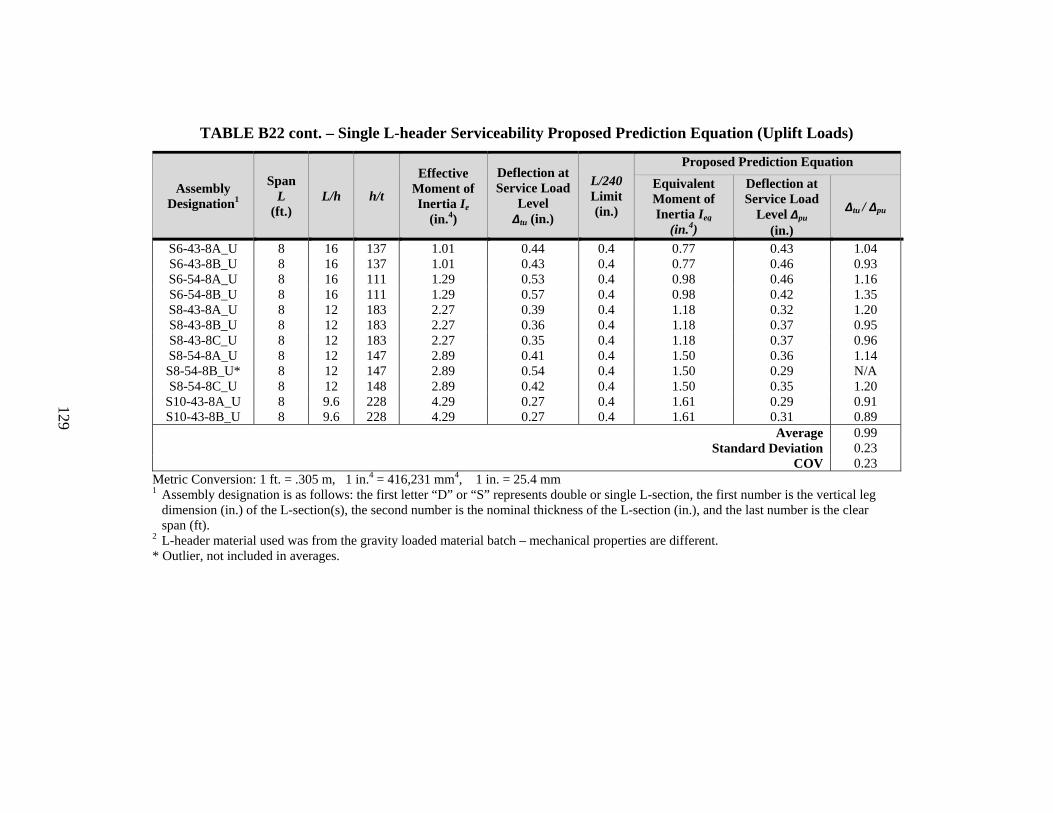
129
TABLE B22 cont. – Single L-header Serviceability Proposed Prediction Equation (Uplift Loads)
Assembly Designation1
Span L
(ft.) L/h h/t
Effective Moment of Inertia Ie
(in.4)
Deflection at Service Load
Level Δtu (in.)
L/240 Limit (in.)
Proposed Prediction Equation Equivalent Moment of Inertia Ieq
(in.4)
Deflection at Service Load
Level Δpu (in.)
Δtu / Δpu
S6-43-8A_U 8 16 137 1.01 0.44 0.4 0.77 0.43 1.04 S6-43-8B_U 8 16 137 1.01 0.43 0.4 0.77 0.46 0.93 S6-54-8A_U 8 16 111 1.29 0.53 0.4 0.98 0.46 1.16 S6-54-8B_U 8 16 111 1.29 0.57 0.4 0.98 0.42 1.35 S8-43-8A_U 8 12 183 2.27 0.39 0.4 1.18 0.32 1.20 S8-43-8B_U 8 12 183 2.27 0.36 0.4 1.18 0.37 0.95 S8-43-8C_U 8 12 183 2.27 0.35 0.4 1.18 0.37 0.96 S8-54-8A_U 8 12 147 2.89 0.41 0.4 1.50 0.36 1.14 S8-54-8B_U* 8 12 147 2.89 0.54 0.4 1.50 0.29 N/A S8-54-8C_U 8 12 148 2.89 0.42 0.4 1.50 0.35 1.20
S10-43-8A_U 8 9.6 228 4.29 0.27 0.4 1.61 0.29 0.91 S10-43-8B_U 8 9.6 228 4.29 0.27 0.4 1.61 0.31 0.89
Average 0.99 Standard Deviation 0.23
COV 0.23 Metric Conversion: 1 ft. = .305 m, 1 in.4 = 416,231 mm4, 1 in. = 25.4 mm
1 Assembly designation is as follows: the first letter “D” or “S” represents double or single L-section, the first number is the vertical leg dimension (in.) of the L-section(s), the second number is the nominal thickness of the L-section (in.), and the last number is the clear span (ft).
2 L-header material used was from the gravity loaded material batch – mechanical properties are different. * Outlier, not included in averages.

130
1201 15th Street, NW
Suite 320
Washington, DC 20005
www.steelframing.org
American Iron and Steel Institute
1140 Connecticut Avenue, NW
Suite 705
Washington, DC 20036
www.steel.org
Re
se
arc
h R
ep
ort
RP
-08
-3