Embed Size (px)
Citation preview

RESEARCH REPORT SEPTEMBER 2017
The Predictive Power of Ninth-Grade GPA
John Q. Easton, Esperanza Johnson, and Lauren Sartain
This report was produced by the UChicago Consortium’s publications and communications staff: Bronwyn McDaniel, Director of Outreach and Communication; Jessica Tansey, Communications Manager; and Jessica Puller, Communications Specialist.
Graphic Design: Jeff Hall Design Photography: Eileen Ryan and Cynthia Howe Editing: Jessica Puller, Katelyn Silva, and Jessica Tansey
09.2017/pdf/[email protected]
ACKNOWLEDGEMENTS
The authors gratefully acknowledge the many people who contributed to this study, especially those who provided much appreciated feedback and constructive criticism. Before we began writing this paper, we presented prelimi-nary findings to several groups, including staff and members of the Network for College Success, members of the UChicago Consortium Steering Committee, the Chicago Education Research Presentation Group, and program staff at the Spencer Foundation. At each presentation, participants peppered us with probing questions and offered helpful improvements to our analysis and subsequent writing. Professor Richard Murnane at Harvard Graduate School of Education and Tim Kautz at Mathematica Policy Research read an early draft and helped us form a more explicit argument in the text. We received extensive written feedback on the final draft from UChicago Consortium Steering Committee members Gina Caneva, Sarah Dickson, Raquel Farmer-Hinton, and Shazia Miller, and thank them for their very careful and thorough comments. Staff at and affiliated with the UChicago Consortium, including Elaine Allensworth, Lucinda Fickel, David W. Johnson, Jenny Nagaoka, Penny Sebring, and Alex Seeskin, provided helpful feedback at all stages of this report. In addition, Todd Rosenkranz conducted a very thorough technical read of the report, and the UChicago Consortium’s communications team, including Bronwyn McDaniel, Jessica Tansey, and Jessica Puller, were instrumental in the production of this report. We are grateful to the Spencer Foundation, which supported this work by providing time and resources for all three authors to conduct the analyses and write the report. The UChicago Consortium greatly appreciates support from the Consortium Investor Council that funds critical work beyond the initial research: putting the research to work, refreshing the data archive, seeding new stud-ies, and replicating previous studies. Members include: Brinson Family Foundation, CME Group Foundation, Crown Family Philanthropies, Lloyd A. Fry Foundation, Joyce Foundation, Lewis-Sebring Family Foundation, McCormick Foundation, McDougal Family Foundation, Osa Family Foundation, Polk Bros. Foundation, Spencer Foundation, Steans Family Foundation, and The Chicago Public Education Fund. We also extend our thanks for the operating grants provided by the Spencer Foundation and the Lewis-Sebring Family Foundation, which support the work of the UChicago Consortium. Finally, we acknowledge the Chicago Public Schools for their commitment to using research evidence in their ceaseless efforts to improve educational experiences and outcomes of students.
1 Introduction
Chapter 1
7 Trends and Patterns in Ninth-Grade GPA
Chapter 2
13 Ninth-Grade GPA as a Predictor of Later Success
Chapter 3
17 Ninth-Grade GPA as a Measure of Student Achievement
19 Interpretive Summary
21 References
22 Appendix
TABLE OF CONTENTS
Cite as: Easton, J.Q., Johnson, E., & Sartain, L. (2017). The predictive power of ninth-grade GPA. Chicago, IL: University of Chicago Consortium on School Research.
UCHICAGO Consortium Research Report | The Predictive Power of Ninth-Grade GPA 1
IntroductionHigh schools in Chicago Public Schools (CPS) emphasize the importance of freshman year, specifically the need for students to earn passing grades. There are two important aspects of this focus: its emphasis on freshman year, and its targeting of grades rather than test scores. A large body of research supports this approach. Much of the research has been conducted in Chicago, but has also been widely replicated across the country.1
1 Allensworth & Easton (2005); Allensworth & Easton (2007); Bowers, Sprott, & Taff (2013).
2 Bowen, Chingos, & McPherson (2009); Roderick, Nagaoka, Allensworth, Coca, Correa, & Stoker (2006); Bowers et al. (2013).
3 This is one conclusion of a recent review of grading research. Brookhart et al. (2016).
4 Allensworth & Easton (2005); Allensworth & Easton (2007).
Overall, the research on high school grades suggests that
grades are not only good predictors of important future
outcomes—such as high school graduation, college
enrollment, and even college graduation—but they are
also better predictors than standardized test scores.2
Among researchers, it is now widely accepted that
grades reflect multiple factors valued by teachers, and
it is this multidimensional quality that makes grades
good predictors of important outcomes.3 In addition to
student achievement, grades may reflect such qualities
as behavior, attitude, willingness to attend class and
turn in assignments, and other indicators of effort.
Grades serve many purposes as indicators of student
performance and aptitude. Schools may use grades to
assign students to subsequent courses (e.g., honors or
regular classes), to bestow recognition on high-per-
forming students, or to direct additional resources to
struggling students. Colleges certainly take grades
into account when making admission and scholar-
ship decisions—both explicitly through GPA, and often
through class rank calculations based on relative
GPA in high school.
Despite the evidence in favor of grades and their wide-
spread use, there are lingering concerns about grades
expressed by both educators and researchers. For ex-
ample, grades are thought to be more subjective than test
scores, since tests are administered under standardized
and consistent conditions. There are also concerns that
grades reflect differences among individual teachers and
schools rather than differences in student performance,
suggesting that grades from one school or one teacher do
not hold the same meaning as grades from another school
or another teacher. In addition, attention to grades may
result in grade inflation as teachers and schools feel pres-
sure to raise students’ grades.
CPS’s special attention to the importance of the
freshman year in high school has a relatively long
history. Research conducted at the University of
Chicago Consortium on School Research (UChicago
Consortium) noted that the ninth grade can be a “make
or break” experience for students.4 Given the right set
of positive experiences during the freshman year, stu-
dents with relatively weak elementary school records
can turn around, do well in high school, and go on to
Introduction 2
5 English, math, science, and social studies.6 Bowers et al. (2013).7 Allensworth, Healey, Gwynne, & Crespin (2016).
graduate. At the same time, students who enter high
school with strong track records in the middle grades
can falter and end up doing poorly, even dropping out.
The research showed that freshman year experiences
are pivotal and success is highly dependent on factors
like high attendance in school and avoiding failures
in coursework. Students’ grades play a major role in
determining whether they are on-track to graduate or
not. Students who earn five full-year credits and do not
receive more than one semester F in a core subject5 are
deemed to be on-track to graduate from high school,
whereas students with more than one core subject
semester F are not on-track. The simple Freshman
OnTrack indicator sets a low bar for success in the
freshman year, yet, it is highly predictive of high school
graduation four or five years later.6
In CPS, the interest in freshman year is reflected
by the inclusion of the Freshman OnTrack indicator in
the School Quality Report Card, which makes it part of
school accountability and visible to prospective parents
and students in a school district with a lot of school
choice. In the early years of the Freshman OnTrack
indicator, CPS developed a rapid reporting system to
alert schools of students with attendance problems and
low grades in the first quarter of the freshman year. Some
schools appointed “on-track coaches” to intervene with
at-risk students with tutoring programs, buddy systems,
after-school help sessions, and a wide range of locally
developed supports.
Recent evidence suggests that the district’s attention
to improving freshman grades has paid off. Citywide
on-track rates have risen considerably and these higher
on-track rates have been followed by higher high school
graduation rates. For example, for students who entered
CPS non-charter high schools in 2009, 71 percent were
on track at the end of their freshman year, and 75 per-
cent graduated five years later in 2014.7 This compares
to on-track and subsequent graduation rates of 60
percent six years earlier. For the most part, the students
who are on-track in their freshman year are the ones
who graduate four or five years later. Although there
are no studies that show a causal relationship between
being on-track and graduating from high school, the
correlational evidence shows a strong relationship.
Part of high schools’ focus on Freshman OnTrack
has been a strong emphasis on earning high grades in
ninth grade. Perhaps because of this focus, ninth grad-
ers’ GPAs increased districtwide for over the last ten
years. There is a need to better understand these GPA
increases. Additionally, as noted above, many people
have concerns about the validity of ninth-grade course
grades as indicators of later achievement. In the face of
these concerns and changes, there is a need to confirm
that the relationship between grades and future aca-
demic success still hold under current practices.
This study examines the degree to which ninth-
grade GPA predicted later outcomes, using rigorous
statistical models that took into account differences in
grading practices across schools and cohorts, as well
as the background characteristics of students entering
CPS high schools. We examine how GPAs changed over
time, and examine GPA differences among students
with varying demographic and academic backgrounds,
as well as across the range of CPS high schools. We also
look closely at how grades were related to test scores to
address questions about the subjectivity of grades. By
learning more about the relationship of grades to test
scores, we can understand whether they are measuring
the same or a different set of skills.
The study focuses exclusively on freshman grades—
not because grades in other years of high school are less
important, but because of the current widespread inter-
est in CPS and other districts on the freshman year. It is
also important given the evidence suggesting that ninth
grade is a critical juncture for students that strongly
influences future patterns of success or failure.

UCHICAGO Consortium Research Report | The Predictive Power of Ninth-Grade GPA 3
This study addresses three sets of research questions
that are motivated by the interest in grades as predictors
of important outcomes, as well as by lingering concerns
about the possibility of grade inflation and other unin-
tended consequences caused by the focus on grades:
1. Trends and Patterns in Freshman GPA
What is the distribution of freshman GPA in CPS?
How has the distribution changed over time, specifically
during a period where CPS had policies focused on fresh-
man GPA? How do GPAs differ from one high school to
another? How are GPAs related to student characteris-
tics, including gender, race, economic background, prior
test scores, and high school course-taking?
2. Freshman GPA as Predictor of Later Success
How well do freshman GPAs predict important student
outcomes like high school graduation and college
enrollment? In comparison to achievement test scores,
are freshman GPAs good predictors of these outcomes?
3. Freshman GPA as a Measure of Student
Achievement
To what extent do freshman GPAs measure student
learning? In other words, are freshman GPAs related
to student test score performance following the fresh-
man year?
Introduction 4
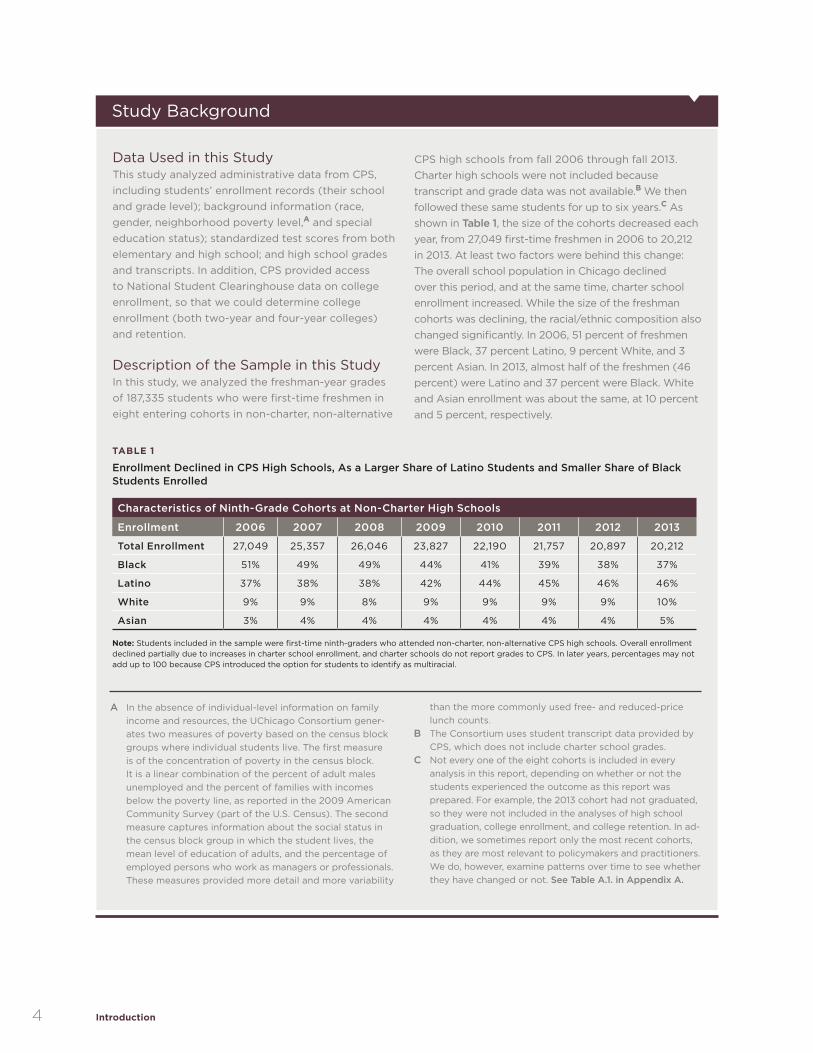
TABLE 1
Enrollment Declined in CPS High Schools, As a Larger Share of Latino Students and Smaller Share of Black Students Enrolled
Characteristics of Ninth-Grade Cohorts at Non-Charter High Schools
Enrollment 2006 2007 2008 2009 2010 2011 2012 2013
Total Enrollment 27,049 25,357 26,046 23,827 22,190 21,757 20,897 20,212
Black 51% 49% 49% 44% 41% 39% 38% 37%
Latino 37% 38% 38% 42% 44% 45% 46% 46%
White 9% 9% 8% 9% 9% 9% 9% 10%
Asian 3% 4% 4% 4% 4% 4% 4% 5% Note: Students included in the sample were first-time ninth-graders who attended non-charter, non-alternative CPS high schools. Overall enrollment declined partially due to increases in charter school enrollment, and charter schools do not report grades to CPS. In later years, percentages may not add up to 100 because CPS introduced the option for students to identify as multiracial.
Study Background
Data Used in this Study This study analyzed administrative data from CPS, including students’ enrollment records (their school and grade level); background information (race, gender, neighborhood poverty level,A and special education status); standardized test scores from both elementary and high school; and high school grades and transcripts. In addition, CPS provided access to National Student Clearinghouse data on college enrollment, so that we could determine college enrollment (both two-year and four-year colleges) and retention.
Description of the Sample in this StudyIn this study, we analyzed the freshman-year grades of 187,335 students who were first-time freshmen in eight entering cohorts in non-charter, non-alternative
CPS high schools from fall 2006 through fall 2013. Charter high schools were not included because transcript and grade data was not available.B We then followed these same students for up to six years.C As shown in Table 1, the size of the cohorts decreased each year, from 27,049 first-time freshmen in 2006 to 20,212 in 2013. At least two factors were behind this change: The overall school population in Chicago declined over this period, and at the same time, charter school enrollment increased. While the size of the freshman cohorts was declining, the racial/ethnic composition also changed significantly. In 2006, 51 percent of freshmen were Black, 37 percent Latino, 9 percent White, and 3 percent Asian. In 2013, almost half of the freshmen (46 percent) were Latino and 37 percent were Black. White and Asian enrollment was about the same, at 10 percent and 5 percent, respectively.
A In the absence of individual-level information on family income and resources, the UChicago Consortium gener-ates two measures of poverty based on the census block groups where individual students live. The first measure is of the concentration of poverty in the census block. It is a linear combination of the percent of adult males unemployed and the percent of families with incomes below the poverty line, as reported in the 2009 American Community Survey (part of the U.S. Census). The second measure captures information about the social status in the census block group in which the student lives, the mean level of education of adults, and the percentage of employed persons who work as managers or professionals. These measures provided more detail and more variability
than the more commonly used free- and reduced-price lunch counts.
B The Consortium uses student transcript data provided by CPS, which does not include charter school grades.
C Not every one of the eight cohorts is included in every analysis in this report, depending on whether or not the students experienced the outcome as this report was prepared. For example, the 2013 cohort had not graduated, so they were not included in the analyses of high school graduation, college enrollment, and college retention. In ad-dition, we sometimes report only the most recent cohorts, as they are most relevant to policymakers and practitioners. We do, however, examine patterns over time to see whether they have changed or not. See Table A.1. in Appendix A.
UCHICAGO Consortium Research Report | The Predictive Power of Ninth-Grade GPA 5
How We Calculate GPA
To calculate students’ GPAs, we averaged together all first and second semester grades in English, math, science, and social studies, assigning a value of 4 to As, 3 to Bs, 2 to Cs, 1 to Ds, and 0 to Fs. There was no special weighting for honors or other advanced classes. Forty-two percent of freshmen had eight grades (four core courses in each of two semesters) contributing to their freshman GPA. Because of double-period math classes and other extra course work in the four major subjects, 31 percent of students had 10 courses contributing to their freshman GPA, and 10 percent had 12 courses. The remaining 17 percent of students took other numbers of semester core courses. To conduct our statistical analyses, we created categories of GPAs that we have labelled A, B,
C, D, and F. Each category is actually a range of GPAs: The F category includes GPAs from 0.00 to 0.49; D is 0.50 to 1.49; C is 1.50 to 2.49; B is 2.50 to 3.49, and A is 3.50 to 4.00. A student who took eight semester courses in the core subjects and received two As, three Bs, two Cs, and one D would have a GPA of 2.75, which falls in the B category. In calculating these GPAs, we noticed that students who get high or low grades in one subject tend to get similarly high or low grades in other subjects. There are exceptions, but the general pattern shows consistency in grades across subjects. The correlations among the subjects range from a low of 0.70 (between math and social studies grades) to a high of 0.75 (between English and social studies grades).

UCHICAGO Consortium Research Report | The Predictive Power of Ninth-Grade GPA 7
CHAPTER 1
Trends and Patterns in Ninth-Grade GPAThis chapter provides an overview of the GPAs that
freshmen receive in CPS—how grades have changed
over time, how grades differ across schools, and how
grades differ for students with different characteristics.
Here, we look at unadjusted GPAs; that is, we do not
account for any other factors that may influence GPA.
This straightforward, descriptive approach enables a
basic understanding of the facts about GPA that then
motivate the more probing analyses later in this report.
The analyses showed that GPAs have been increasing
in CPS over time and that there are substantial differ-
ences among students by school, gender, race/ethnicity,
test scores prior to entering high school, socioeconomic
status (SES), and the level of the course (e.g., honors vs.
regular courses). These differences are important in
their own right and they play a crucial role in the later
investigation of the predictive power of grades, as we
strive to capture the unique aspects of grades that are
independent of these other factors.
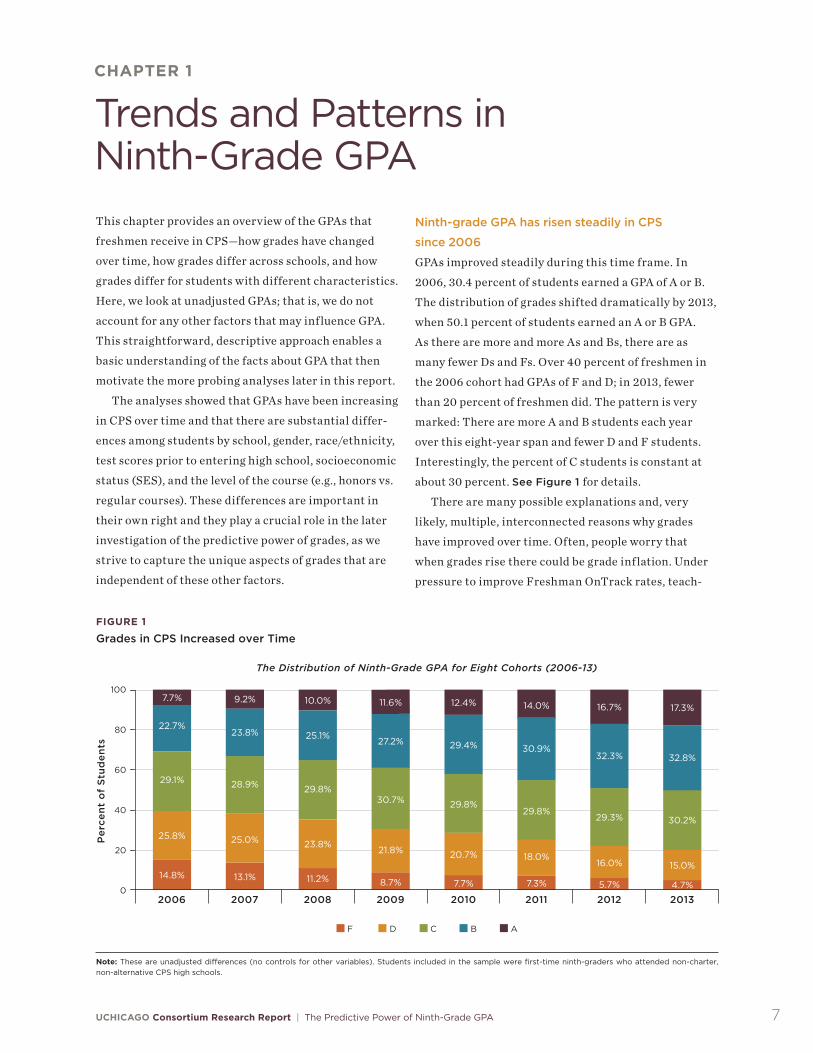
Ninth-grade GPA has risen steadily in CPS
since 2006
GPAs improved steadily during this time frame. In
2006, 30.4 percent of students earned a GPA of A or B.
The distribution of grades shifted dramatically by 2013,
when 50.1 percent of students earned an A or B GPA.
As there are more and more As and Bs, there are as
many fewer Ds and Fs. Over 40 percent of freshmen in
the 2006 cohort had GPAs of F and D; in 2013, fewer
than 20 percent of freshmen did. The pattern is very
marked: There are more A and B students each year
over this eight-year span and fewer D and F students.
Interestingly, the percent of C students is constant at
about 30 percent. See Figure 1 for details.
There are many possible explanations and, very
likely, multiple, interconnected reasons why grades
have improved over time. Often, people worry that
when grades rise there could be grade inflation. Under
pressure to improve Freshman OnTrack rates, teach-
Per
cen
t o
f S
tud
ents
20
0
40
FIGURE 1
Grades in CPS Increased over Time
60
80
100
2006 2007 2008 2009 2010 2011 2012 2013
The Distribution of Ninth-Grade GPA for Eight Cohorts (2006-13)
Note: These are unadjusted di�erences (no controls for other variables). Students included in the sample were first-time ninth-graders who attended non-charter, non-alternative CPS high schools.
7.7%
22.7%
29.1%
25.8%
14.8%
9.2%
23.8%
28.9%
13.1%
25.0%
10.0%
25.1%
29.8%
23.8%
11.2%
11.6%
27.2%
30.7%
21.8%
8.7%
12.4%
29.4%
29.8%
7.7%
20.7%
16.7%
32.3%
29.3%
16.0%
5.7%
17.3%
30.2%
15.0%
32.8%
4.7%
F D C B A
14.0%
18.0%
7.3%
29.8%
30.9%
Chapter 1 | Trends and Patterns in Ninth-Grade GPA8
ers and schools could have simply given higher grades.
Alternatively, the improvements could all be due to
improved student achievement and behavior or to demo-
graphic changes. We are not attempting to explain why
freshmen GPA increased over this time, both because
that would be a very complex undertaking and because it
is not the main purpose of this report. Other researchers
have examined trends in high school GPA from nation-
ally representative data sets and observed increases from
1982 to 2004.8 GPA continued to predict college enroll-
ment despite the increases. In fact, GPA became a stron-
ger predictor of college enrollment in the study using the
national data sets.
The increase in freshmen GPAs in CPS is highly
consistent with other positive trends. For example,
the eighth-grade test scores of entering freshmen have
also steadily increased over this period (see Table 2),
suggesting that students are entering high school better
prepared academically. In the 2006 freshman cohort,
the average eighth-grade combined reading and math
test score9 was 251.5, and in the 2013 freshman cohort
it was 260.9, an increase equal to 0.54 standard devia-
tions.10 Scores on tenth-grade PLAN increased from
15.1 in the 2006 cohort to 16.9 in the 2011 cohort (the
last year it was given), which is another indication
that students are performing better in ninth grade.
Eleventh-grade ACT also improved considerably,
from 17.1 in the 2006 freshman cohort to 18.8 in the
2012 freshman cohort. Similarly, student attendance
improved and the number of suspensions declined
(leading to an increase in instructional time).
Since there is a consistent pattern of improving
achievement on multiple measures among CPS students
in their freshman and subsequent years, we feel confi-
dent that at least part of the improvement in GPA can
be attributed to improved achievement and academic
success, and not solely to grade inflation. A previ-
ous Consortium study also concluded that improved
graduation rates in CPS could be largely attributed to
real improved performance of students in high schools
according to several different measures.11
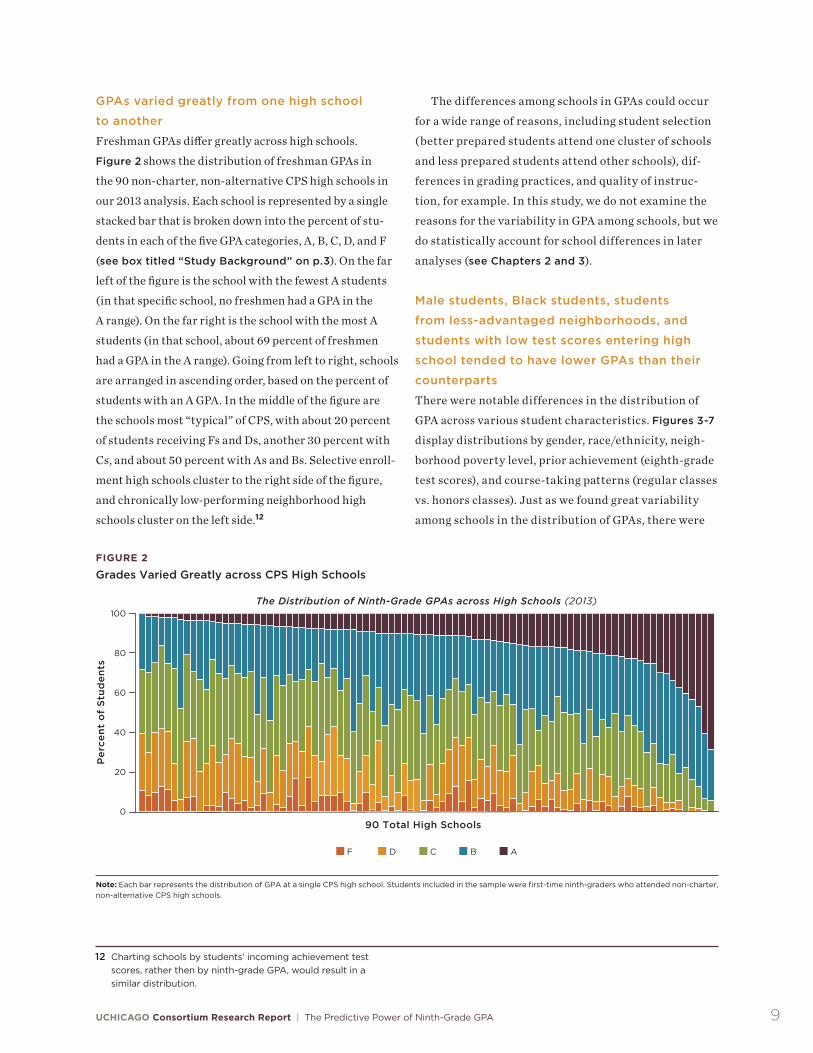
TABLE 2
Ninth-Grade Test Scores, Attendance, and Behavior Improved over Time
Ninth-Grade Cohorts Entering Non-Charter High Schools 2006-13
Test Scores 2006 2007 2008 2009 2010 2011 2012 2013
8th-Grade Test 251.5 252.0 245.0 251.9 254.8 257.5 259.8 260.9
PLAN Fall 15.1 15.4 15.3 15.7 16.3 16.9
ACT 17.1 17.9 17.8 18.3 18.3 18.7 18.8
Attendance
95% to 100% 56% 64% 66% 67% 67% 67%
Below 80% 6% 4% 3% 3% 3% 2%
Behavior
Any Suspensions 30% 31% 27% 26% 27% 24%
Multiple Suspensions
17% 19% 15% 15% 16% 14%
Note: Students included in the sample were first-time ninth-graders who attended non-charter, non-alternative CPS high schools.
8 Pattison, Grodsky, & Muller (2013).9 We use a predicted test score created from a student’s entire
test score trajectory during elementary school. The model controls for the student’s age (and age squared to account for non-linearity) at the time of the test, cumulative number of times the student was retained, cumulative number of times the student skipped a grade, the school, and the student’s cohort. The main advantages of using the predicted score are
(a) it is less subject to noise and random fluctuations than the observed test score, and (b) we have a prediction for any stu-dent who did not take the eighth-grade test, as long as they have previous scores.
10 The standard deviation of the average eighth-grade combined reading and math test score in CPS in 2006 was 17.25.
11 Allensworth et al. (2016).
UCHICAGO Consortium Research Report | The Predictive Power of Ninth-Grade GPA 9
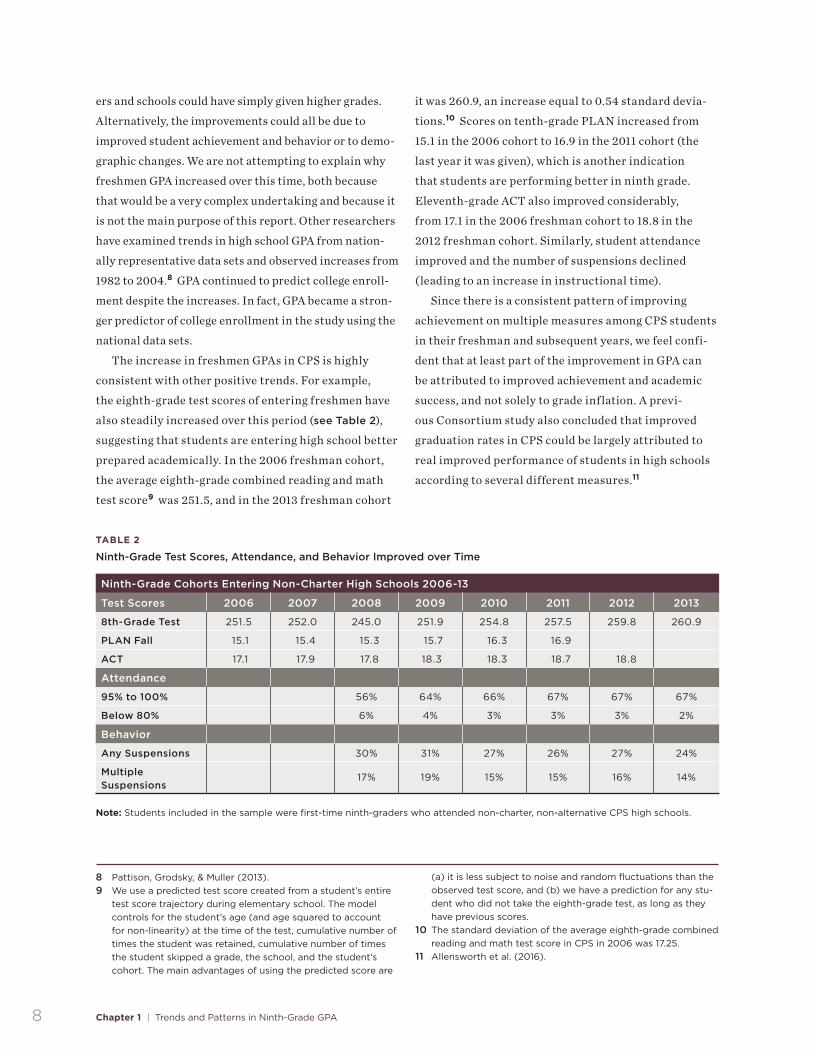
GPAs varied greatly from one high school
to another
Freshman GPAs differ greatly across high schools.
Figure 2 shows the distribution of freshman GPAs in
the 90 non-charter, non-alternative CPS high schools in
our 2013 analysis. Each school is represented by a single
stacked bar that is broken down into the percent of stu-
dents in each of the five GPA categories, A, B, C, D, and F
(see box titled “Study Background” on p.3). On the far
left of the figure is the school with the fewest A students
(in that specific school, no freshmen had a GPA in the
A range). On the far right is the school with the most A
students (in that school, about 69 percent of freshmen
had a GPA in the A range). Going from left to right, schools
are arranged in ascending order, based on the percent of
students with an A GPA. In the middle of the figure are
the schools most “typical” of CPS, with about 20 percent
of students receiving Fs and Ds, another 30 percent with
Cs, and about 50 percent with As and Bs. Selective enroll-
ment high schools cluster to the right side of the figure,
and chronically low-performing neighborhood high
schools cluster on the left side.12
Per
cen
t o
f S
tud
ents
20
0
40
FIGURE 2
Grades Varied Greatly across CPS High Schools
60
80
100The Distribution of Ninth-Grade GPAs across High Schools (2013)
Note: Each bar represents the distribution of GPA at a single CPS high school. Students included in the sample were first-time ninth-graders who attended non-charter, non-alternative CPS high schools.
F D C B A
90 Total High Schools
The differences among schools in GPAs could occur
for a wide range of reasons, including student selection
(better prepared students attend one cluster of schools
and less prepared students attend other schools), dif-
ferences in grading practices, and quality of instruc-
tion, for example. In this study, we do not examine the
reasons for the variability in GPA among schools, but we
do statistically account for school differences in later
analyses (see Chapters 2 and 3).
Male students, Black students, students
from less-advantaged neighborhoods, and
students with low test scores entering high
school tended to have lower GPAs than their
counterparts
There were notable differences in the distribution of
GPA across various student characteristics. Figures 3-7
display distributions by gender, race/ethnicity, neigh-
borhood poverty level, prior achievement (eighth-grade
test scores), and course-taking patterns (regular classes
vs. honors classes). Just as we found great variability
among schools in the distribution of GPAs, there were
12 Charting schools by students’ incoming achievement test scores, rather then by ninth-grade GPA, would result in a similar distribution.
Chapter 1 | Trends and Patterns in Ninth-Grade GPA10
also notable differences among students, depending on
individual characteristics. In the following descriptive
analyses, we do not make any statistical adjustments or
control for any other variables.
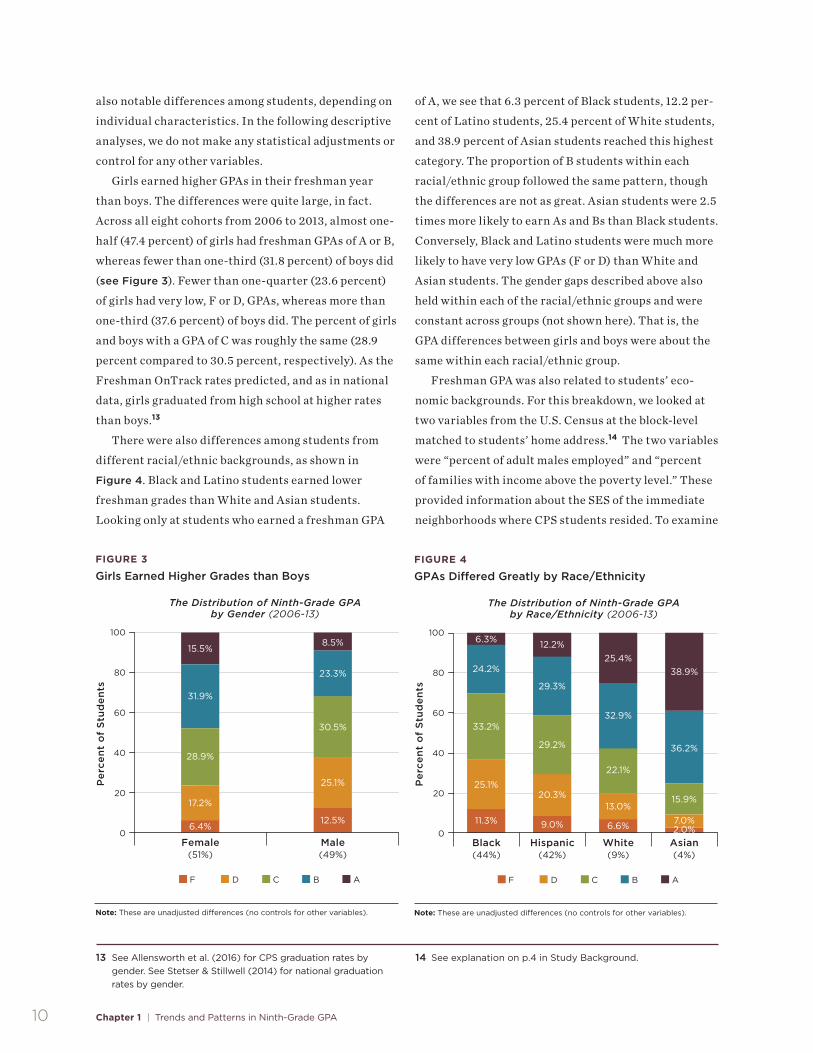
Girls earned higher GPAs in their freshman year
than boys. The differences were quite large, in fact.
Across all eight cohorts from 2006 to 2013, almost one-
half (47.4 percent) of girls had freshman GPAs of A or B,
whereas fewer than one-third (31.8 percent) of boys did
(see Figure 3). Fewer than one-quarter (23.6 percent)
of girls had very low, F or D, GPAs, whereas more than
one-third (37.6 percent) of boys did. The percent of girls
and boys with a GPA of C was roughly the same (28.9
percent compared to 30.5 percent, respectively). As the
Freshman OnTrack rates predicted, and as in national
data, girls graduated from high school at higher rates
than boys.13
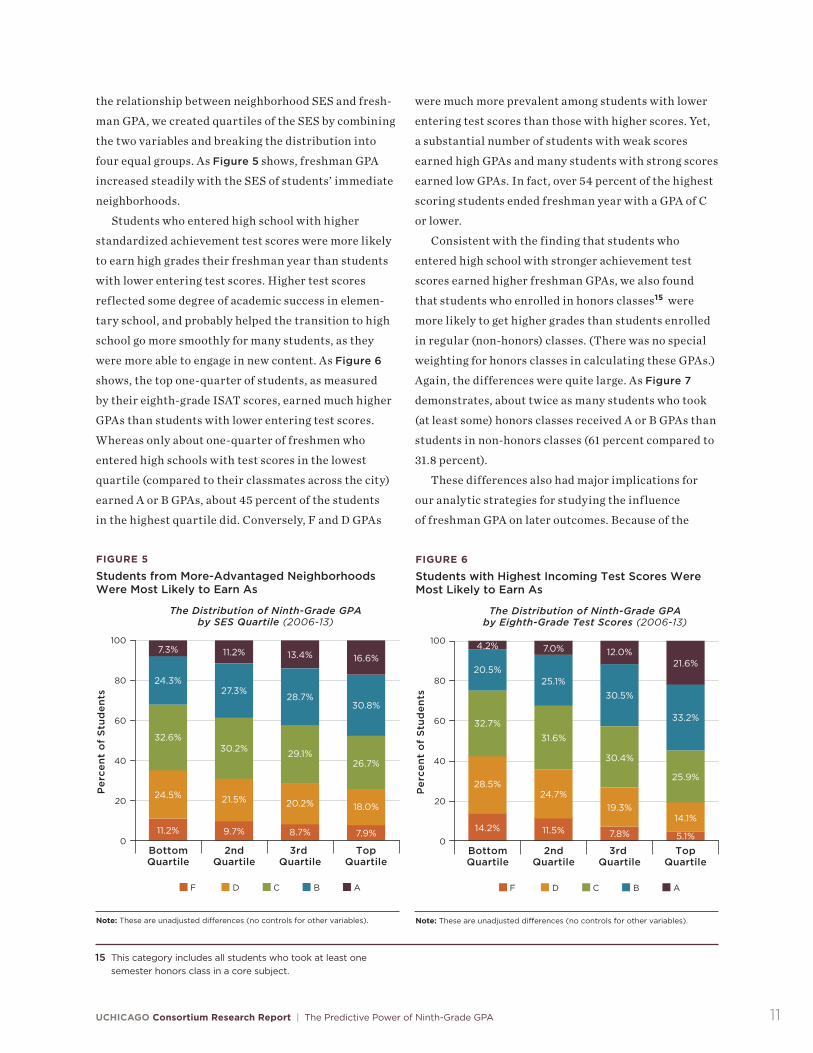
There were also differences among students from
different racial/ethnic backgrounds, as shown in
Figure 4. Black and Latino students earned lower
freshman grades than White and Asian students.
Looking only at students who earned a freshman GPA
Per
cen
t o
f S
tud
ents
20
0
40
FIGURE 3
Girls Earned Higher Grades than Boys
60
80
100
Female(51%)
Male(49%)
The Distribution of Ninth-Grade GPA by Gender (2006-13)
Note: These are unadjusted di�erences (no controls for other variables).
15.5%
31.9%
28.9%
6.4%
17.2%
8.5%
23.3%
30.5%
25.1%
F D C B A
12.5%
Per
cen
t o
f S
tud
ents
20
0
40
FIGURE 4
GPAs Di�ered Greatly by Race/Ethnicity
60
80
100
Black(44%)
Hispanic(42%)
White(9%)
Asian(4%)
The Distribution of Ninth-Grade GPA by Race/Ethnicity (2006-13)
Note: These are unadjusted di�erences (no controls for other variables).
6.3%
24.2%
33.2%
25.1%
11.3%
12.2%
29.3%
29.2%
9.0%
20.3%
25.4%
32.9%
22.1%
13.0%
6.6%
36.2%
15.9%
7.0%
F D C B A
38.9%
2.0%
of A, we see that 6.3 percent of Black students, 12.2 per-
cent of Latino students, 25.4 percent of White students,
and 38.9 percent of Asian students reached this highest
category. The proportion of B students within each
racial/ethnic group followed the same pattern, though
the differences are not as great. Asian students were 2.5
times more likely to earn As and Bs than Black students.
Conversely, Black and Latino students were much more
likely to have very low GPAs (F or D) than White and
Asian students. The gender gaps described above also
held within each of the racial/ethnic groups and were
constant across groups (not shown here). That is, the
GPA differences between girls and boys were about the
same within each racial/ethnic group.
Freshman GPA was also related to students’ eco-
nomic backgrounds. For this breakdown, we looked at
two variables from the U.S. Census at the block-level
matched to students’ home address.14 The two variables
were “percent of adult males employed” and “percent
of families with income above the poverty level.” These
provided information about the SES of the immediate
neighborhoods where CPS students resided. To examine
13 See Allensworth et al. (2016) for CPS graduation rates by gender. See Stetser & Stillwell (2014) for national graduation rates by gender.
14 See explanation on p.4 in Study Background.
UCHICAGO Consortium Research Report | The Predictive Power of Ninth-Grade GPA 11
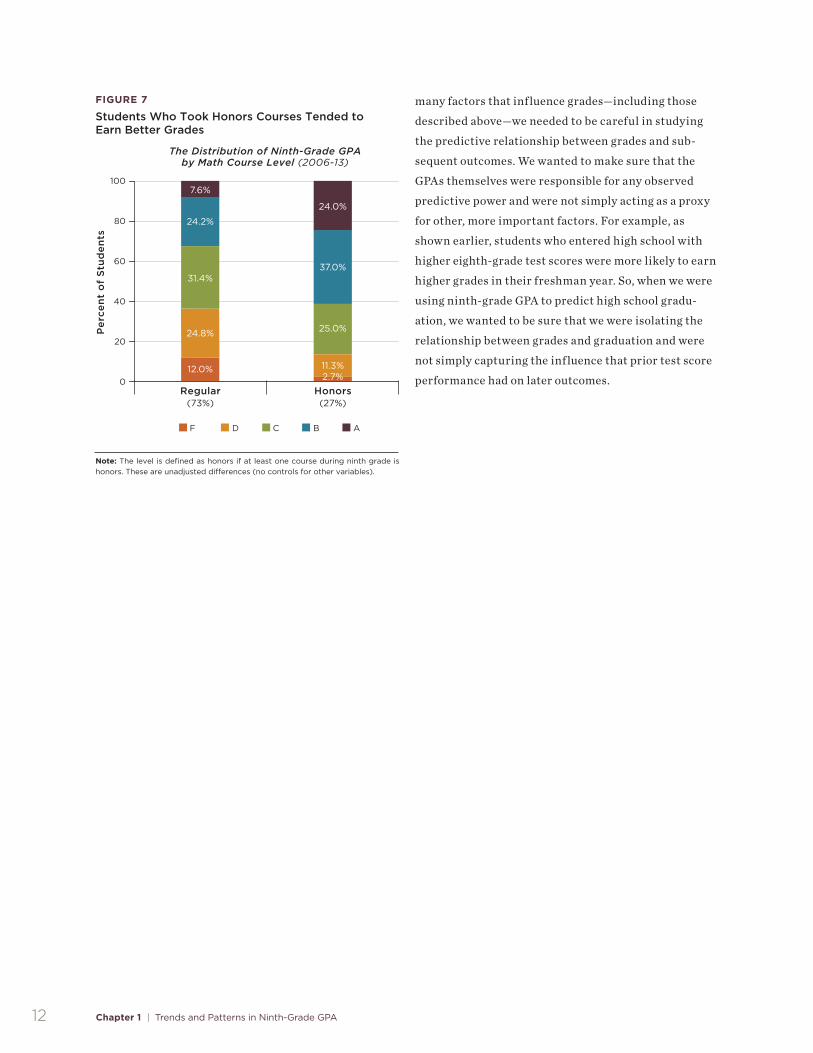
the relationship between neighborhood SES and fresh-
man GPA, we created quartiles of the SES by combining
the two variables and breaking the distribution into
four equal groups. As Figure 5 shows, freshman GPA
increased steadily with the SES of students’ immediate
neighborhoods.
Students who entered high school with higher
standardized achievement test scores were more likely
to earn high grades their freshman year than students
with lower entering test scores. Higher test scores
reflected some degree of academic success in elemen-
tary school, and probably helped the transition to high
school go more smoothly for many students, as they
were more able to engage in new content. As Figure 6
shows, the top one-quarter of students, as measured
by their eighth-grade ISAT scores, earned much higher
GPAs than students with lower entering test scores.
Whereas only about one-quarter of freshmen who
entered high schools with test scores in the lowest
quartile (compared to their classmates across the city)
earned A or B GPAs, about 45 percent of the students
in the highest quartile did. Conversely, F and D GPAs
were much more prevalent among students with lower
entering test scores than those with higher scores. Yet,
a substantial number of students with weak scores
earned high GPAs and many students with strong scores
earned low GPAs. In fact, over 54 percent of the highest
scoring students ended freshman year with a GPA of C
or lower.
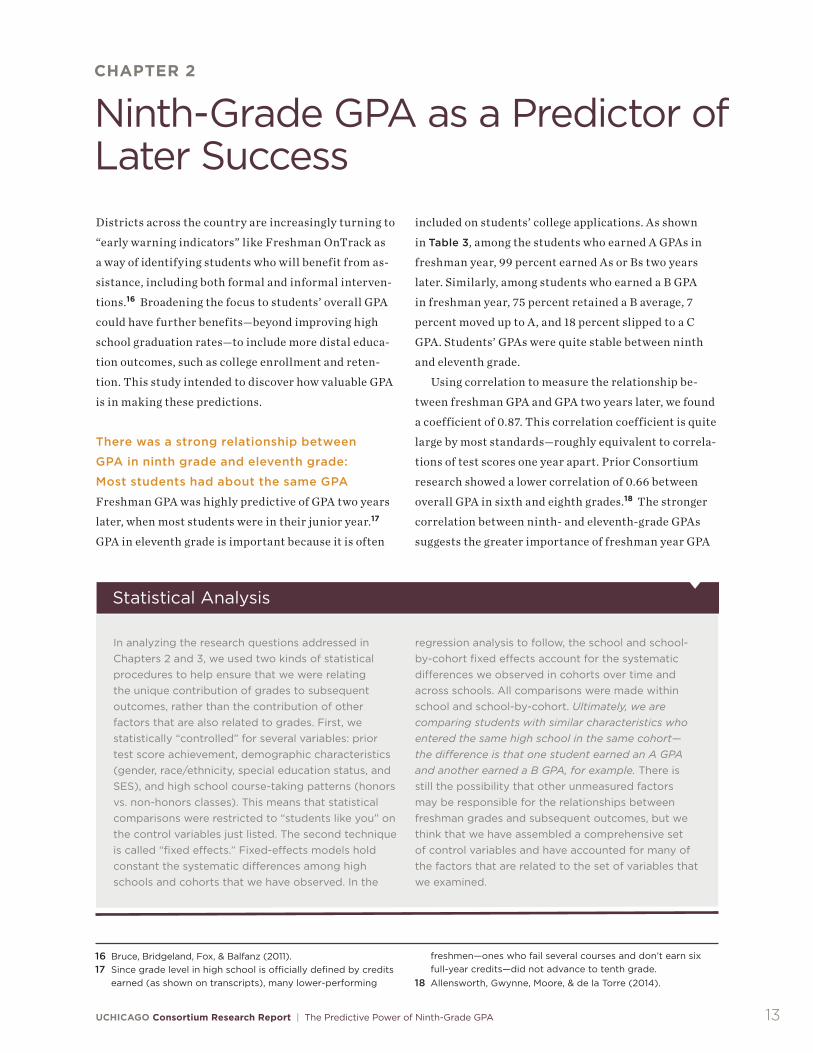
Consistent with the finding that students who
entered high school with stronger achievement test
scores earned higher freshman GPAs, we also found
that students who enrolled in honors classes15 were
more likely to get higher grades than students enrolled
in regular (non-honors) classes. (There was no special
weighting for honors classes in calculating these GPAs.)
Again, the differences were quite large. As Figure 7
demonstrates, about twice as many students who took
(at least some) honors classes received A or B GPAs than
students in non-honors classes (61 percent compared to
31.8 percent).
These differences also had major implications for
our analytic strategies for studying the influence
of freshman GPA on later outcomes. Because of the
Per
cen
t o
f S
tud
ents
20
0
40
FIGURE 5
Students from More-Advantaged Neighborhoods Were Most Likely to Earn As
60
80
100
BottomQuartile
2ndQuartile
3rd Quartile
TopQuartile
The Distribution of Ninth-Grade GPA by SES Quartile (2006-13)
Note: These are unadjusted di�erences (no controls for other variables).
7.3%
24.3%
32.6%
24.5%
11.2%
11.2%
27.3%
30.2%
9.7%
21.5%
13.4%
28.7%
29.1%
20.2%
8.7%
30.8%
26.7%
18.0%
F D C B A
16.6%
7.9%
Per
cen
t o
f S
tud
ents
20
0
40
FIGURE 6
Students with Highest Incoming Test Scores Were Most Likely to Earn As
60
80
100
BottomQuartile
2ndQuartile
3rd Quartile
TopQuartile
The Distribution of Ninth-Grade GPA by Eighth-Grade Test Scores (2006-13)
Note: These are unadjusted di�erences (no controls for other variables).
20.5%
32.7%
28.5%
14.2%
7.0%
25.1%
31.6%
11.5%
24.7%
12.0%
30.5%
30.4%
19.3%
7.8%
33.2%
25.9%
14.1%
F D C B A
21.6%
5.1%
4.2%
15 This category includes all students who took at least one semester honors class in a core subject.
Chapter 1 | Trends and Patterns in Ninth-Grade GPA12
many factors that influence grades—including those
described above—we needed to be careful in studying
the predictive relationship between grades and sub-
sequent outcomes. We wanted to make sure that the
GPAs themselves were responsible for any observed
predictive power and were not simply acting as a proxy
for other, more important factors. For example, as
shown earlier, students who entered high school with
higher eighth-grade test scores were more likely to earn
higher grades in their freshman year. So, when we were
using ninth-grade GPA to predict high school gradu-
ation, we wanted to be sure that we were isolating the
relationship between grades and graduation and were
not simply capturing the influence that prior test score
performance had on later outcomes.
Per
cen
t o
f S
tud
ents
20
0
40
FIGURE 7
Students Who Took Honors Courses Tended to Earn Better Grades
60
80
100
Regular(73%)
Honors(27%)
The Distribution of Ninth-Grade GPA by Math Course Level (2006-13)
Note: The level is defined as honors if at least one course during ninth grade is honors. These are unadjusted di�erences (no controls for other variables).
7.6%
24.2%
31.4%
12.0%
24.8%
24.0%
37.0%
25.0%
11.3%
F D C B A
2.7%
UCHICAGO Consortium Research Report | The Predictive Power of Ninth-Grade GPA 13
CHAPTER 2
Ninth-Grade GPA as a Predictor of Later Success
included on students’ college applications. As shown
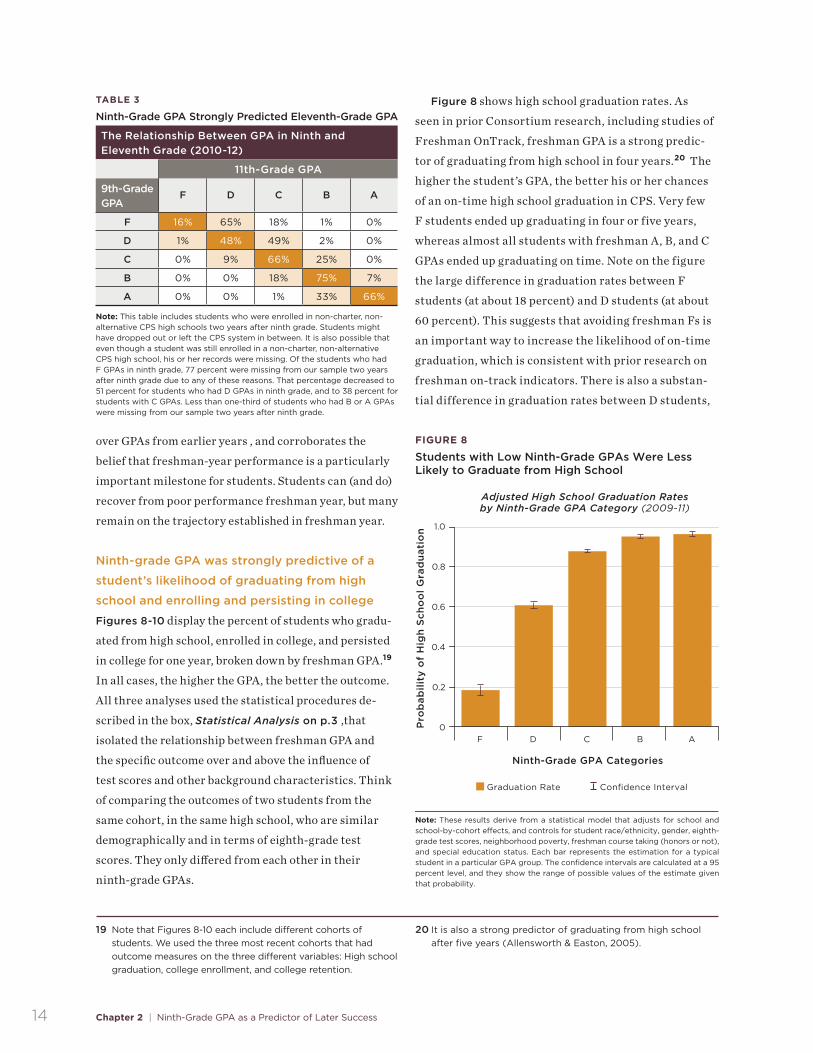
in Table 3, among the students who earned A GPAs in
freshman year, 99 percent earned As or Bs two years
later. Similarly, among students who earned a B GPA
in freshman year, 75 percent retained a B average, 7
percent moved up to A, and 18 percent slipped to a C
GPA. Students’ GPAs were quite stable between ninth
and eleventh grade.
Using correlation to measure the relationship be-
tween freshman GPA and GPA two years later, we found
a coefficient of 0.87. This correlation coefficient is quite
large by most standards—roughly equivalent to correla-
tions of test scores one year apart. Prior Consortium
research showed a lower correlation of 0.66 between
overall GPA in sixth and eighth grades.18 The stronger
correlation between ninth- and eleventh-grade GPAs
suggests the greater importance of freshman year GPA
Districts across the country are increasingly turning to
“early warning indicators” like Freshman OnTrack as
a way of identifying students who will benefit from as-
sistance, including both formal and informal interven-
tions.16 Broadening the focus to students’ overall GPA
could have further benefits—beyond improving high
school graduation rates—to include more distal educa-
tion outcomes, such as college enrollment and reten-
tion. This study intended to discover how valuable GPA
is in making these predictions.
There was a strong relationship between
GPA in ninth grade and eleventh grade:
Most students had about the same GPA
Freshman GPA was highly predictive of GPA two years
later, when most students were in their junior year.17
GPA in eleventh grade is important because it is often
Statistical Analysis
In analyzing the research questions addressed in Chapters 2 and 3, we used two kinds of statistical procedures to help ensure that we were relating the unique contribution of grades to subsequent outcomes, rather than the contribution of other factors that are also related to grades. First, we statistically “controlled” for several variables: prior test score achievement, demographic characteristics (gender, race/ethnicity, special education status, and SES), and high school course-taking patterns (honors vs. non-honors classes). This means that statistical comparisons were restricted to “students like you” on the control variables just listed. The second technique is called “fixed effects.” Fixed-effects models hold constant the systematic differences among high schools and cohorts that we have observed. In the
regression analysis to follow, the school and school-by-cohort fixed effects account for the systematic differences we observed in cohorts over time and across schools. All comparisons were made within school and school-by-cohort. Ultimately, we are comparing students with similar characteristics who entered the same high school in the same cohort— the difference is that one student earned an A GPA and another earned a B GPA, for example. There is still the possibility that other unmeasured factors may be responsible for the relationships between freshman grades and subsequent outcomes, but we think that we have assembled a comprehensive set of control variables and have accounted for many of the factors that are related to the set of variables that we examined.
16 Bruce, Bridgeland, Fox, & Balfanz (2011). 17 Since grade level in high school is officially defined by credits
earned (as shown on transcripts), many lower-performing
freshmen—ones who fail several courses and don’t earn six full-year credits—did not advance to tenth grade.
18 Allensworth, Gwynne, Moore, & de la Torre (2014).
Chapter 2 | Ninth-Grade GPA as a Predictor of Later Success14
over GPAs from earlier years , and corroborates the
belief that freshman-year performance is a particularly
important milestone for students. Students can (and do)
recover from poor performance freshman year, but many
remain on the trajectory established in freshman year.
Ninth-grade GPA was strongly predictive of a
student’s likelihood of graduating from high
school and enrolling and persisting in college
Figures 8-10 display the percent of students who gradu-
ated from high school, enrolled in college, and persisted
in college for one year, broken down by freshman GPA.19
In all cases, the higher the GPA, the better the outcome.
All three analyses used the statistical procedures de-
scribed in the box, Statistical Analysis on p.3 ,that
isolated the relationship between freshman GPA and
the specific outcome over and above the influence of
test scores and other background characteristics. Think
of comparing the outcomes of two students from the
same cohort, in the same high school, who are similar
demographically and in terms of eighth-grade test
scores. They only differed from each other in their
ninth-grade GPAs.
TABLE 3
Ninth-Grade GPA Strongly Predicted Eleventh-Grade GPA
The Relationship Between GPA in Ninth and Eleventh Grade (2010-12)
11th-Grade GPA
9th-Grade GPA
F D C B A
F 16% 65% 18% 1% 0%
D 1% 48% 49% 2% 0%
C 0% 9% 66% 25% 0%
B 0% 0% 18% 75% 7%
A 0% 0% 1% 33% 66% Note: This table includes students who were enrolled in non-charter, non-alternative CPS high schools two years after ninth grade. Students might have dropped out or left the CPS system in between. It is also possible that even though a student was still enrolled in a non-charter, non-alternative CPS high school, his or her records were missing. Of the students who had F GPAs in ninth grade, 77 percent were missing from our sample two years after ninth grade due to any of these reasons. That percentage decreased to 51 percent for students who had D GPAs in ninth grade, and to 38 percent for students with C GPAs. Less than one-third of students who had B or A GPAs were missing from our sample two years after ninth grade.
Figure 8 shows high school graduation rates. As
seen in prior Consortium research, including studies of
Freshman OnTrack, freshman GPA is a strong predic-
tor of graduating from high school in four years.20 The
higher the student’s GPA, the better his or her chances
of an on-time high school graduation in CPS. Very few
F students ended up graduating in four or five years,
whereas almost all students with freshman A, B, and C
GPAs ended up graduating on time. Note on the figure
the large difference in graduation rates between F
students (at about 18 percent) and D students (at about
60 percent). This suggests that avoiding freshman Fs is
an important way to increase the likelihood of on-time
graduation, which is consistent with prior research on
freshman on-track indicators. There is also a substan-
tial difference in graduation rates between D students, P
rob
abili
ty o
f H
igh
Sch
oo
l Gra
du
atio
n
0.2
0
0.4
FIGURE 8
Students with Low Ninth-Grade GPAs Were Less Likely to Graduate from High School
0.6
0.8
1.0
Ninth-Grade GPA Categories
Adjusted High School Graduation Rates by Ninth-Grade GPA Category (2009-11)
Note: These results derive from a statistical model that adjusts for school and school-by-cohort e�ects, and controls for student race/ethnicity, gender, eighth-grade test scores, neighborhood poverty, freshman course taking (honors or not), and special education status. Each bar represents the estimation for a typical student in a particular GPA group. The confidence intervals are calculated at a 95 percent level, and they show the range of possible values of the estimate given that probability.
F D C B A
Graduation Rate Confidence Interval
19 Note that Figures 8-10 each include different cohorts of students. We used the three most recent cohorts that had outcome measures on the three different variables: High school graduation, college enrollment, and college retention.
20 It is also a strong predictor of graduating from high school after five years (Allensworth & Easton, 2005).
UCHICAGO Consortium Research Report | The Predictive Power of Ninth-Grade GPA 15
on the one hand, and C, B, and A students, on the other.
D students probably need as much attention and help as
F students to ensure that they end up graduating.
Freshman grades, independent of other important
factors, were powerful predictors of high school gradua-
tion. Our finding is consistent with other research studies
across the country. One recent article reviewed 110 differ-
ent high school dropout indicators from 36 separate stud-
ies and concluded that indicators based on grades were
the most accurate in predicting high school dropout.21
(In only one case are test scores more predictive. That is
when researchers use a longitudinal trajectory of scores
up to, and including, twelfth-grade scores.)
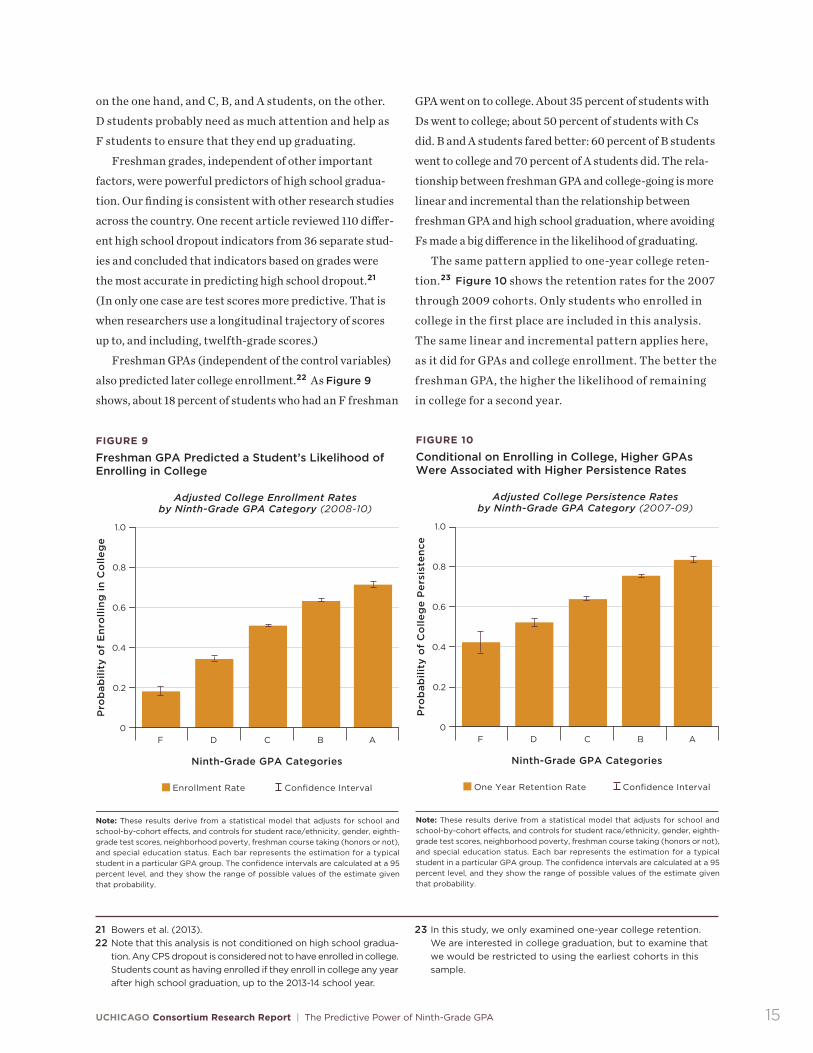
Freshman GPAs (independent of the control variables)
also predicted later college enrollment.22 As Figure 9
shows, about 18 percent of students who had an F freshman
GPA went on to college. About 35 percent of students with
Ds went to college; about 50 percent of students with Cs
did. B and A students fared better: 60 percent of B students
went to college and 70 percent of A students did. The rela-
tionship between freshman GPA and college-going is more
linear and incremental than the relationship between
freshman GPA and high school graduation, where avoiding
Fs made a big difference in the likelihood of graduating.
The same pattern applied to one-year college reten-
tion.23 Figure 10 shows the retention rates for the 2007
through 2009 cohorts. Only students who enrolled in
college in the first place are included in this analysis.
The same linear and incremental pattern applies here,
as it did for GPAs and college enrollment. The better the
freshman GPA, the higher the likelihood of remaining
in college for a second year.
Pro
bab
ility
of
En
rolli
ng
in C
olle
ge
0.2
0
0.4
FIGURE 9
Freshman GPA Predicted a Student’s Likelihood of Enrolling in College
0.6
0.8
1.0
Ninth-Grade GPA Categories
Adjusted College Enrollment Rates by Ninth-Grade GPA Category (2008-10)
Note: These results derive from a statistical model that adjusts for school and school-by-cohort e�ects, and controls for student race/ethnicity, gender, eighth-grade test scores, neighborhood poverty, freshman course taking (honors or not), and special education status. Each bar represents the estimation for a typical student in a particular GPA group. The confidence intervals are calculated at a 95 percent level, and they show the range of possible values of the estimate given that probability.
F D C B A
Enrollment Rate Confidence Interval
Pro
bab
ility
of
Co
lleg
e P
ersi
sten
ce
0.2
0
0.4
FIGURE 10
Conditional on Enrolling in College, Higher GPAs Were Associated with Higher Persistence Rates
0.6
0.8
1.0
Ninth-Grade GPA Categories
Adjusted College Persistence Rates by Ninth-Grade GPA Category (2007-09)
Note: These results derive from a statistical model that adjusts for school and school-by-cohort e�ects, and controls for student race/ethnicity, gender, eighth-grade test scores, neighborhood poverty, freshman course taking (honors or not), and special education status. Each bar represents the estimation for a typical student in a particular GPA group. The confidence intervals are calculated at a 95 percent level, and they show the range of possible values of the estimate given that probability.
F D C B A
One Year Retention Rate Confidence Interval
21 Bowers et al. (2013).22 Note that this analysis is not conditioned on high school gradua-
tion. Any CPS dropout is considered not to have enrolled in college. Students count as having enrolled if they enroll in college any year after high school graduation, up to the 2013-14 school year.
23 In this study, we only examined one-year college retention. We are interested in college graduation, but to examine that we would be restricted to using the earliest cohorts in this sample.
Chapter 2 | Ninth-Grade GPA as a Predictor of Later Success16
The large differences in GPAs by gender and by
race/ethnicity prompted the question of whether the
prediction patterns described above are consistent for
both boys and girls and for students of different race/
ethnicities. The answer is that yes, they are, but with
one exception. Using the same statistical models used
throughout this study, we found boys with high grades
(As, Bs, or Cs) are significantly more likely to gradu-
ate from high school than girls with the same GPAs.
Otherwise, GPAs have similar influences on high school
graduation, college enrollment, and college retention,
regardless of gender or race/ethnicity.
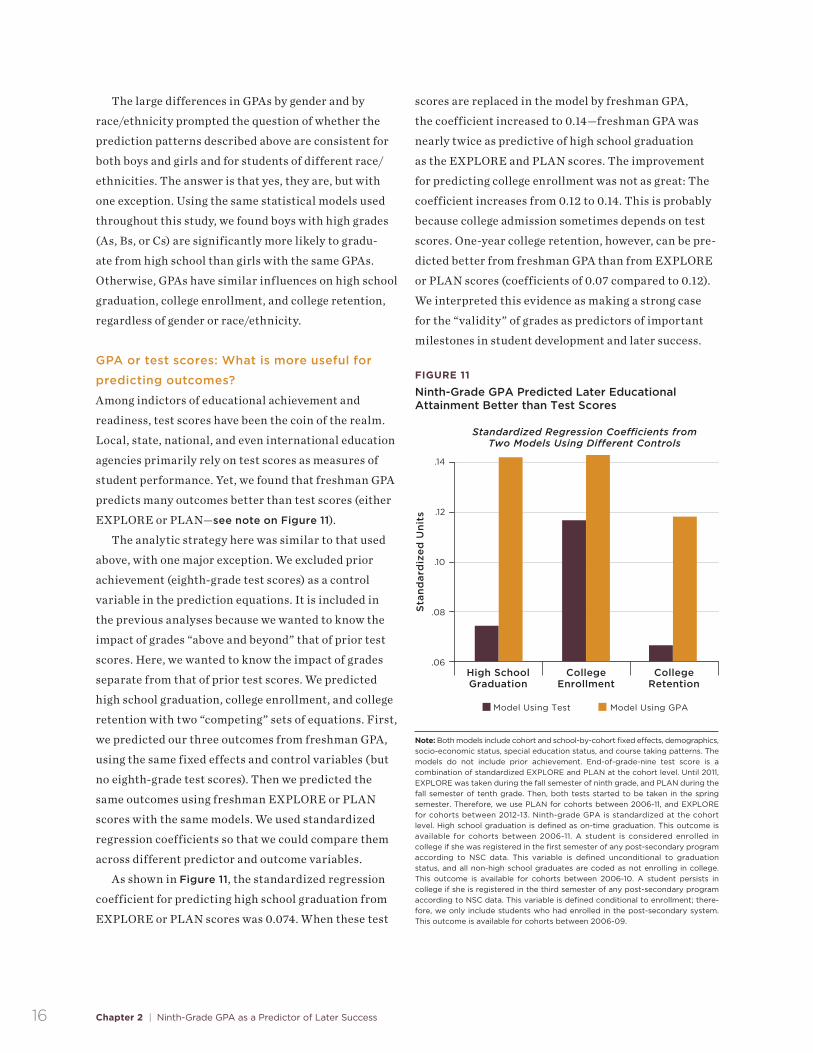
GPA or test scores: What is more useful for
predicting outcomes?
Among indictors of educational achievement and
readiness, test scores have been the coin of the realm.
Local, state, national, and even international education
agencies primarily rely on test scores as measures of
student performance. Yet, we found that freshman GPA
predicts many outcomes better than test scores (either
EXPLORE or PLAN—see note on Figure 11).
The analytic strategy here was similar to that used
above, with one major exception. We excluded prior
achievement (eighth-grade test scores) as a control
variable in the prediction equations. It is included in
the previous analyses because we wanted to know the
impact of grades “above and beyond” that of prior test
scores. Here, we wanted to know the impact of grades
separate from that of prior test scores. We predicted
high school graduation, college enrollment, and college
retention with two “competing” sets of equations. First,
we predicted our three outcomes from freshman GPA,
using the same fixed effects and control variables (but
no eighth-grade test scores). Then we predicted the
same outcomes using freshman EXPLORE or PLAN
scores with the same models. We used standardized
regression coefficients so that we could compare them
across different predictor and outcome variables.
As shown in Figure 11, the standardized regression
coefficient for predicting high school graduation from
EXPLORE or PLAN scores was 0.074. When these test
Sta
nd
ard
ized
Un
its
.08
.06
.10
FIGURE 11
Ninth-Grade GPA Predicted Later Educational Attainment Better than Test Scores
.12
.14
High SchoolGraduation
CollegeEnrollment
CollegeRetention
Standardized Regression Coe�cients from Two Models Using Di�erent Controls
Note: Both models include cohort and school-by-cohort fixed e�ects, demographics, socio-economic status, special education status, and course taking patterns. The models do not include prior achievement. End-of-grade-nine test score is a combination of standardized EXPLORE and PLAN at the cohort level. Until 2011, EXPLORE was taken during the fall semester of ninth grade, and PLAN during the fall semester of tenth grade. Then, both tests started to be taken in the spring semester. Therefore, we use PLAN for cohorts between 2006-11, and EXPLORE for cohorts between 2012-13. Ninth-grade GPA is standardized at the cohort level. High school graduation is defined as on-time graduation. This outcome is available for cohorts between 2006-11. A student is considered enrolled in college if she was registered in the first semester of any post-secondary program according to NSC data. This variable is defined unconditional to graduation status, and all non-high school graduates are coded as not enrolling in college. This outcome is available for cohorts between 2006-10. A student persists in college if she is registered in the third semester of any post-secondary program according to NSC data. This variable is defined conditional to enrollment; there- fore, we only include students who had enrolled in the post-secondary system. This outcome is available for cohorts between 2006-09.
Model Using Test Model Using GPA
scores are replaced in the model by freshman GPA,
the coefficient increased to 0.14—freshman GPA was
nearly twice as predictive of high school graduation
as the EXPLORE and PLAN scores. The improvement
for predicting college enrollment was not as great: The
coefficient increases from 0.12 to 0.14. This is probably
because college admission sometimes depends on test
scores. One-year college retention, however, can be pre-
dicted better from freshman GPA than from EXPLORE
or PLAN scores (coefficients of 0.07 compared to 0.12).
We interpreted this evidence as making a strong case
for the “validity” of grades as predictors of important
milestones in student development and later success.
UCHICAGO Consortium Research Report | The Predictive Power of Ninth-Grade GPA 17
CHAPTER 3
Ninth-Grade GPA as a Measure of Student AchievementIn this chapter, we address the question of whether
grades measured student learning of content matter,
by using freshman GPA to predict beginning-of-tenth-
grade PLAN test scores. By establishing this relation-
ship, we confirmed that at least some aspects of GPAs
are indeed “objective” in the sense that they correspond
with measures obtained under standard conditions for
all students.
The 2011, 2012, and 2013 cohorts in our sample
took the test at the beginning of the tenth grade. PLAN
(no longer administered in CPS) is part of the EPAS
sequence of tests developed and sold by ACT. Both
PLAN and EXPLORE (for students in earlier grades)
are designed to be predictive of ACT and are scored on a
similar scale to enable measuring students’ growth over
time. While valuable for this purpose, both PLAN and
EXPLORE have some shortcomings. First, and prob-
ably most prominent, these tests are not aligned to the
CPS high school curriculum, so it is not always certain
that they are measuring the same content included in
CPS high school courses, and certainly not in the same
sequence.24 Second, both tests have relatively few
items, and the scores fall on a scale with a very limited
range. The range of the ACT is 1 to 36, and the range of
the PLAN is 1 to 32.
Despite these limitations, we wanted to probe the
relationship between freshman GPA and a commonly
used high school standardized achievement test. Even
though CPS freshmen may not be exposed to all the con-
tent on the PLAN test (and conversely, they may have
learned other content that is not included on the test),
it is recognized as part of the ACT series of tests and
has been valued as a predictor and indicator of the ACT,
which for many years was given to all eleventh-graders
in the state of Illinois, and is used in the college applica-
tion process. This analysis used the same control vari-
ables and fixed effects as the analyses used for Figures
8-10. It is important to emphasize that in predicting
beginning-of-tenth-grade test scores from freshman
GPAs, we are also controlling for end-of-eighth-grade
ISAT scores. Although about 18 months apart from each
other, these two test scores are highly correlated (with
a correlation coefficient of 0.87) to each other, and
therefore, prediction of the beginning-of-tenth-grade
test score from the end-of-eighth-grade test is relatively
accurate. From a statistical viewpoint, it is rare to iden-
tify intervening factors that have a significant effect on
future test scores predicted from previous test scores.
Ninth-grade GPA was predictive of a student’s
standardized achievement test scores
We found a statistically significant association between
freshman grades and beginning-of-year tenth-grade
PLAN scores, controlling for eighth-grade ISAT scores
and the other factors discussed previously. Figure 12
displays our findings in points on the PLAN (recall that
the range of possible scores on PLAN is 1 to 32). Given
their eighth-grade test scores, A students scored 1.20
points higher on the PLAN than average students. B
students scored 0.25 points more than average. In
contrast, C, D, and F students scored lower than
average, by 0.46, 1.14, and 1.85 points, respectively.
At first glance, these differences may seem to be
relatively modest, especially in comparison to unad-
justed PLAN scores. On average, A students scored 21.3,
B students 17.5, C students 14.7, D students 13.0, and F
students 11.8; with the overall average being 16.1. The
statistical controls reduced the observed differences
considerably, by accounting for many other factors
that influence test scores, especially eighth-grade
24 Note, however, that many schools and networks of schools in CPS did align their instruction to ACT’s College Readiness Standards
Chapter 3 | Ninth-Grade GPA as a Measure of Student Achievement18
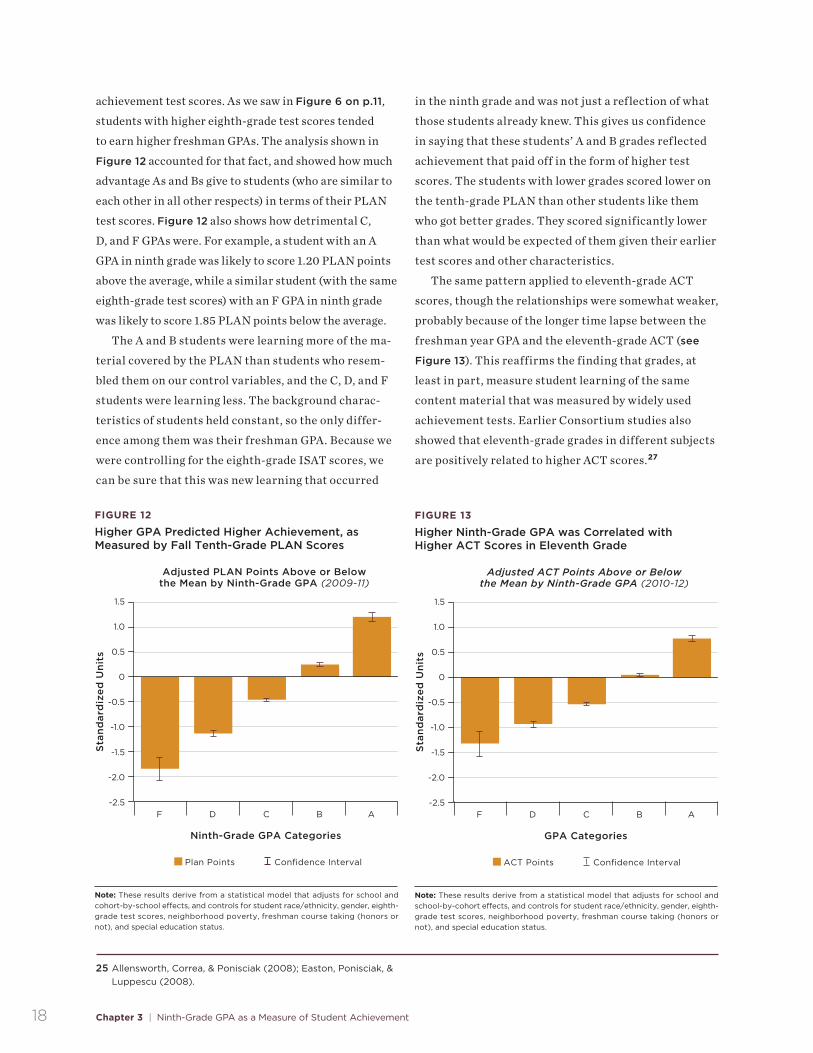
achievement test scores. As we saw in Figure 6 on p.11,
students with higher eighth-grade test scores tended
to earn higher freshman GPAs. The analysis shown in
Figure 12 accounted for that fact, and showed how much
advantage As and Bs give to students (who are similar to
each other in all other respects) in terms of their PLAN
test scores. Figure 12 also shows how detrimental C,
D, and F GPAs were. For example, a student with an A
GPA in ninth grade was likely to score 1.20 PLAN points
above the average, while a similar student (with the same
eighth-grade test scores) with an F GPA in ninth grade
was likely to score 1.85 PLAN points below the average.
The A and B students were learning more of the ma-
terial covered by the PLAN than students who resem-
bled them on our control variables, and the C, D, and F
students were learning less. The background charac-
teristics of students held constant, so the only differ-
ence among them was their freshman GPA. Because we
were controlling for the eighth-grade ISAT scores, we
can be sure that this was new learning that occurred
Sta
nd
ard
ized
Un
its
-1.5
-2.0
-2.5
-0.5
-1.0
FIGURE 12
Higher GPA Predicted Higher Achievement, as Measured by Fall Tenth-Grade PLAN Scores
0
0.5
1.0
1.5
Ninth-Grade GPA Categories
Adjusted PLAN Points Above or Below the Mean by Ninth-Grade GPA (2009-11)
Note: These results derive from a statistical model that adjusts for school and cohort-by-school e�ects, and controls for student race/ethnicity, gender, eighth-grade test scores, neighborhood poverty, freshman course taking (honors or not), and special education status.
F D C B A
Plan Points Confidence Interval
in the ninth grade and was not just a reflection of what
those students already knew. This gives us confidence
in saying that these students’ A and B grades reflected
achievement that paid off in the form of higher test
scores. The students with lower grades scored lower on
the tenth-grade PLAN than other students like them
who got better grades. They scored significantly lower
than what would be expected of them given their earlier
test scores and other characteristics.
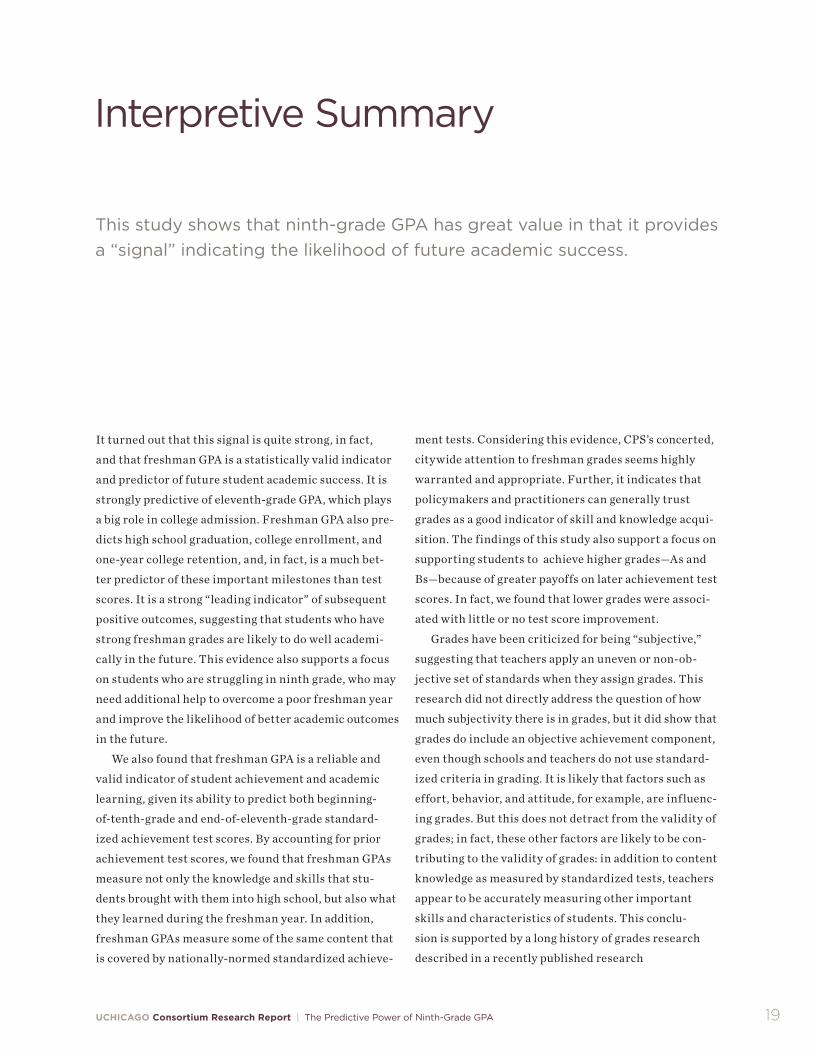
The same pattern applied to eleventh-grade ACT
scores, though the relationships were somewhat weaker,
probably because of the longer time lapse between the
freshman year GPA and the eleventh-grade ACT (see
Figure 13). This reaffirms the finding that grades, at
least in part, measure student learning of the same
content material that was measured by widely used
achievement tests. Earlier Consortium studies also
showed that eleventh-grade grades in different subjects
are positively related to higher ACT scores.27
25 Allensworth, Correa, & Ponisciak (2008); Easton, Ponisciak, & Luppescu (2008).
Sta
nd
ard
ized
Un
its
-1.5
-2.0
-2.5
-0.5
-1.0
FIGURE 13
Higher Ninth-Grade GPA was Correlated with Higher ACT Scores in Eleventh Grade
0
0.5
1.0
1.5
GPA Categories
Adjusted ACT Points Above or Below the Mean by Ninth-Grade GPA (2010-12)
Note: These results derive from a statistical model that adjusts for school and school-by-cohort e�ects, and controls for student race/ethnicity, gender, eighth-grade test scores, neighborhood poverty, freshman course taking (honors or not), and special education status.
F D C B A
ACT Points Confidence Interval
UCHICAGO Consortium Research Report | The Predictive Power of Ninth-Grade GPA 19
Interpretive Summary
It turned out that this signal is quite strong, in fact,
and that freshman GPA is a statistically valid indicator
and predictor of future student academic success. It is
strongly predictive of eleventh-grade GPA, which plays
a big role in college admission. Freshman GPA also pre-
dicts high school graduation, college enrollment, and
one-year college retention, and, in fact, is a much bet-
ter predictor of these important milestones than test
scores. It is a strong “leading indicator” of subsequent
positive outcomes, suggesting that students who have
strong freshman grades are likely to do well academi-
cally in the future. This evidence also supports a focus
on students who are struggling in ninth grade, who may
need additional help to overcome a poor freshman year
and improve the likelihood of better academic outcomes
in the future.
We also found that freshman GPA is a reliable and
valid indicator of student achievement and academic
learning, given its ability to predict both beginning-
of-tenth-grade and end-of-eleventh-grade standard-
ized achievement test scores. By accounting for prior
achievement test scores, we found that freshman GPAs
measure not only the knowledge and skills that stu-
dents brought with them into high school, but also what
they learned during the freshman year. In addition,
freshman GPAs measure some of the same content that
is covered by nationally-normed standardized achieve-
ment tests. Considering this evidence, CPS’s concerted,
citywide attention to freshman grades seems highly
warranted and appropriate. Further, it indicates that
policymakers and practitioners can generally trust
grades as a good indicator of skill and knowledge acqui-
sition. The findings of this study also support a focus on
supporting students to achieve higher grades—As and
Bs—because of greater payoffs on later achievement test
scores. In fact, we found that lower grades were associ-
ated with little or no test score improvement.
Grades have been criticized for being “subjective,”
suggesting that teachers apply an uneven or non-ob-
jective set of standards when they assign grades. This
research did not directly address the question of how
much subjectivity there is in grades, but it did show that
grades do include an objective achievement component,
even though schools and teachers do not use standard-
ized criteria in grading. It is likely that factors such as
effort, behavior, and attitude, for example, are influenc-
ing grades. But this does not detract from the validity of
grades; in fact, these other factors are likely to be con-
tributing to the validity of grades: in addition to content
knowledge as measured by standardized tests, teachers
appear to be accurately measuring other important
skills and characteristics of students. This conclu-
sion is supported by a long history of grades research
described in a recently published research
This study shows that ninth-grade GPA has great value in that it provides a “signal” indicating the likelihood of future academic success.
Interpretive Summary 20
review article.26 The evidence shown here is unequivo-
cal in demonstrating consistent differentiation among
students based on their grades. These other components
of grades are adding useful information to the signal
that grades provide, rather than diminishing the signal.
However, this study did not answer—or even address—
the question of “exactly what other factors are grades
measuring besides the kind of achievement that tests mea-
sure?” Grades may measure student effort, persistence,
good behavior, attendance, attitude, and other related ac-
tors, yet we do not know this for sure. In future research,
we will use additional available data, such as attendance,
discipline records, and student survey reports to identify
and quantify how these other factors influence grades.
This report sidesteps another common concern—
grade inflation. How much of the improvement in
freshman GPA (and on-track rates) can be attributed to
teachers simply giving students higher grades, either
under pressure from administrators or by their own
choice? Other research has shown that accountability
pressures can have negative consequences that corrupt
otherwise useful statistical indicators.27 Our evidence
did show that GPAs were equally predictive of high
school graduation across all eight cohorts in this study,
even as GPAs increased year after year. This finding is
comparable to the national research described earlier
and suggests that increasing GPAs reflect increasing
academic success, and not grade inflation.
We are not sure why freshman GPA is so highly
predictive of so many important outcomes. For most
students in CPS, ninth grade is a major transition from
a K-8 elementary school and presents a new chance to
set expectations for the rest of high school. It is reason-
able to believe that a successful freshman year opens
many future opportunities for students. A strong GPA
may lead to placement in better courses the next year.
Teachers may have higher expectations for students
who demonstrate success early in high school. They
may be more favorably inclined toward these students.
The students themselves may develop greater self-con-
fidence in their abilities and adopt a “growth mindset.”
They may select their peers or their extracurricular ac-
tivities differently. We don’t know which of these paths
are true, but it seems likely that there are elements of
“success breeding success” at play.
This study highlighted a series of related questions
about freshman grades that are highly relevant to CPS
high schools and likely to be of interest elsewhere.
The answers to some of the initial questions may raise
alarms. There are large differences in freshman GPAs
among racial/ethnic groups that reflect “achievement
gaps” usually associated with test score differences.
There is also a large gender gap, with girls earning much
higher GPAs than boys. The many differences between
groups of students noted here are consequential.
Perhaps reducing the “GPA gap” could become a more
deliberate focus of policy and practice, in the same way
that the “achievement gap,” as measured by standard-
ized test scores, has been.
Finally, the study showed that freshman GPA is ris-
ing in CPS, and it continues to be a strong predictor of
future academic success. Sustained attention to fresh-
man GPA may help reduce racial/ethnic and gender
gaps, while leading to better outcomes for all students.
26 Brookhart et al. (2016). 27 See Neal & Schanzenbach (2007) for a Chicago specific example..
“It indicates that policymakers and practitioners can generally trust grades as a good indicator of skill and knowledge acquisition.”
UCHICAGO Consortium Research Report | The Predictive Power of Ninth-Grade GPA 21
References
Allensworth, E., Correa, M., & Ponisciak, S. (2008) From high school to the future: ACT preparation—too much, too late. Chicago, IL: University of Chicago Consortium on Chicago School Research.
Allensworth, E., & Easton, J.Q. (2005)The on-track indicator as a predictor of high school graduation. Chicago, IL: University of Chicago Consortium on Chicago School Research.
Allensworth, E., & Easton, J.Q. (2007)What matters for staying on-track and graduating in Chicago Public Schools. Chicago, IL: University of Chicago Consortium on Chicago School Research.
Allensworth, E.M., Gwynne, J.A., Moore, P., & de la Torre, M. (2014)Looking forward to high school and college: Middle grade indicators of readiness in Chicago Public Schools. Chicago, IL: University of Chicago Consortium on Chicago School Research.
Allensworth, E.M., Healey, K., Gwynne, J.A., & Crespin, R. (2016)High school graduation rates through two decades of district change: The influence of policies, data records, and demographic shifts. Chicago, IL: University of Chicago Consortium on School Research.
Bowen, W.G., Chingos, M.M., & McPherson, M.S. (2009) Crossing the Finish Line: Completing College at America’s Public Universities. Princeton, N.J.: Princeton University.
Bowers, A.J., Sprott, R., Taff, S.A. (2013) Do we know who will drop out? A review of the predictors of dropping out of high school: Precision, sensitivity and specificity. The High School Journal, 96(2), 77-100.
Brookhart, S.M., Guskey, T.R., Bowers, A.J., McMillan, J.H., Smith, J.K., Smith, L.F., Stevens, M.T., Welsh, M.E. (2016)A century of grading research: meaning and value in the most common educational measure. Review of Educational Research, 86(4), 803-848.
Bruce, M., Bridgeland, J.M., Fox, J.H., & Balfanz, R. (2011)On track for success: The use of early warning indicator and intervention systems to build a grad nation. Baltimore, MD: Johns Hopkins University.
Easton, J.Q., Ponisciak, S., & Luppescu, S. (2008)From high school to the future: The pathway to 20. Chicago, IL: University of Chicago Consortium on Chicago School Research.
Neal, D., & Schanzenbach, D.W. (2010)Left behind by design: Proficiency counts and test-based accountability. The Review of Economics and Statistics, 92(2), 263–283.
Pattison, E., Grodsky, E., & Muller, C. (2013)Is the sky falling? Grade inflation and the signaling power of grades. Educational Researcher, 42(5), 259-265.
Roderick, M., Nagaoka, J., Allensworth, E., Coca, V., Correa, M., & Stoker, G. (2006)From high school to the future: A first look at Chicago Public Schools graduates’ college enrollment, college prepara-tion, and graduation from four-year colleges. Chicago, IL: University of Chicago Consortium on Chicago School Research.
Stetser, M.C., & Stillwell, R. (2014)Public high school four-year on-time graduation rates and event dropout rates: School years 2010-11 and 2011-12. Washington, DC: National Center for Education Statistics. Retrieved from https://nces.ed.gov/pubs2014/2014391.pdf
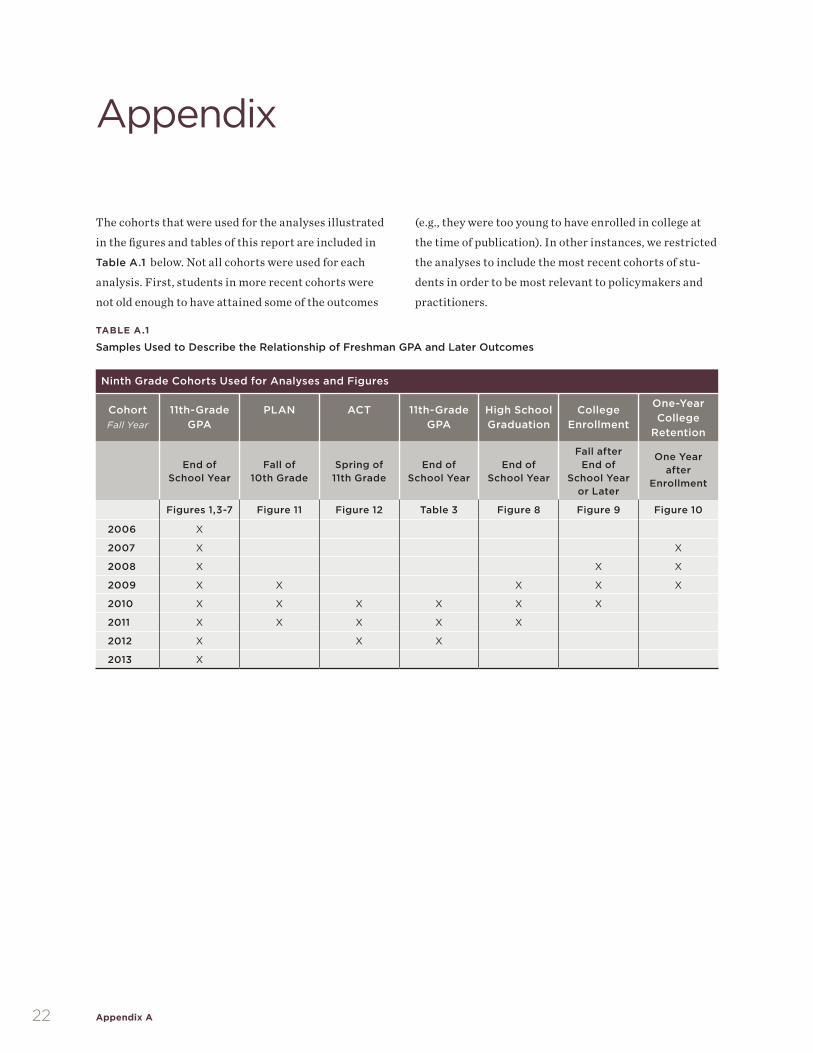
Appendix A 22
TABLE A.1
Samples Used to Describe the Relationship of Freshman GPA and Later Outcomes
Ninth Grade Cohorts Used for Analyses and Figures
Cohort Fall Year
11th-Grade GPA
PLAN ACT 11th-Grade GPA
High School Graduation
College Enrollment
One-Year College
Retention
End of
School Year
Fall of
10th Grade
Spring of
11th Grade
End of
School Year
End of
School Year
Fall after End of
School Year or Later
One Year after
Enrollment
Figures 1,3-7 Figure 11 Figure 12 Table 3 Figure 8 Figure 9 Figure 10
2006 X
2007 X X
2008 X X X
2009 X X X X X
2010 X X X X X X
2011 X X X X X
2012 X X X
2013 X
Appendix
The cohorts that were used for the analyses illustrated
in the figures and tables of this report are included in
Table A.1 below. Not all cohorts were used for each
analysis. First, students in more recent cohorts were
not old enough to have attained some of the outcomes
(e.g., they were too young to have enrolled in college at
the time of publication). In other instances, we restricted
the analyses to include the most recent cohorts of stu-
dents in order to be most relevant to policymakers and
practitioners.

JOHN Q. EASTON is Vice President of Programs at the Spencer Foundation in Chicago. At Spencer, he developed and leads a new grant program for research-practitioner partnerships. From June 2009 through August 2014, he was Director of the Institute of Education Sciences in the U.S. Department of Education. Prior to his government service, Easton was Executive Director of the UChicago Consortium. He was affiliated with the UChicago Consortium since its inception in 1990, and became its Deputy Director in 1997 and Executive Director in 2002. Easton served a term on the National Assessment Governing Board, which sets poli-cies for the National Assessment of Educational Progress (NAEP). He is a member of the Illinois Employment Security Advisory Board, the Illinois Longitudinal Data System Technical Advisory Committee, and the Chicago Public Schools’ School Quality Report Card Steering Committee.
ESPERANZA JOHNSON is a Program Associate at the Spencer Foundation in Chicago. She joined the Spencer Foundation after earning a master’s of public policy from
the University of Chicago Harris School of Public Policy. While at Spencer, she has worked on different issues of edu-cational policy, as well as on developing evidence about the Foundation’s programs. Johnson holds a BA and a master’s degree in economics from Pontificia Universidad Catolica de Chile (PUC) in Santiago, Chile. She worked at PUC as a Lecturer and Research Associate, and taught introductory economics classes for the Department of Economics. In fall 2017, Johnson is starting her PhD in economics at the University of Chicago, where she plans to work on issues of economics of education.
LAUREN SARTAIN is a Senior Research Analyst at the UChicago Consortium. She has a BA from the University of Texas at Austin, as well as a master’s degree in public policy and a PhD from the Harris School of Public Policy at the University of Chicago. She has worked at Chapin Hall and the Federal Reserve Bank of Chicago. Sartain’s research interests include principal and teacher quality, school choice, and urban school reform.
ABOUT THE AUTHORS
This report reflects the interpretation of the authors. Although the UChicago Consortium’s Steering Committee provided technical advice, no formal endorsement by these individuals, organizations, or the full Consortium should be assumed.

RAQUEL FARMER-HINTONCo-Chair University of Wisconsin, Milwaukee
DENNIS LACEWELLCo-Chair Urban Prep Charter Academy for Young Men
Ex-Officio Members
SARA RAY STOELINGAUrban Education Institute
Institutional Members
SARAH DICKSONChicago Public Schools
ELIZABETH KIRBYChicago Public Schools
TROY LARAVIEREChicago Principals and Administrators Association
KAREN G.J. LEWISChicago Teachers Union
ALAN MATHERChicago Public Schools
TONY SMITHIllinois State Board of Education
Individual Members
GINA CANEVALindblom Math & Science
NANCY CHAVEZCity Colleges of Chicago
KATIE HILLOffice of the Cook County State’s Attorney
MEGAN HOUGARDChicago Public Schools
GREG JONESKenwood Academy
PRANAV KOTHARIRevolution Impact, LLC
LILA LEFFUmoja Student Development Corporation & Emerson Collective
RITO MARTINEZSurge Institute
LUISIANA MELÉNDEZErikson Institute
SHAZIA MILLERNORC at the University of Chicago
CRISTINA PACIONE-ZAYASErikson Institute
BEATRIZ PONCE DE LEÓNGeneration All
PAIGE PONDEROne Million Degrees
KATHLEEN ST. LOUIS CALIENTOThe Academy Group
AMY TREADWELLChicago New Teacher Center
REBECCA VONDERLACK-NAVAROLatino Policy Forum
PAM WITMERIllinois Network of Charter Schools
JOHN ZEIGLERDePaul University
DirectorsELAINE M. ALLENSWORTHLewis-Sebring Director
STACY EHRLICHManaging Director and Senior Research Scientist
JULIA A. GWYNNEManaging Director and Senior Research Scientist
HOLLY HARTSurvey Director
KYLIE KLEINDirector of Research Operations
BRONWYN MCDANIELDirector of Outreach and Communication
JENNY NAGAOKADeputy Director
MELISSA RODERICKSenior DirectorHermon Dunlap Smith ProfessorSchool of Social Service Administration
PENNY BENDER SEBRINGCo-Founder
MARISA DE LA TORREManaging Director and Senior Research Associate
Steering Committee

1313 East 60th Street Chicago, Illinois 60637
T 773.702.3364 F 773.702.2010 @UChiConsortiumconsortium.uchicago.edu
OUR MISSION The University of Chicago Consortium on School Research (UChicago Consortium) conducts research of high technical quality that can inform and assess policy and practice in the Chicago Public Schools. We seek to expand communication among researchers, policymakers, and practitioners as we support the search for solutions to the problems of school reform. The UChicago Consortium encourages the use of research in policy action and improvement of practice, but does not argue for particular policies or programs. Rather, we help to build capacity for school reform by identifying what matters for student success and school improvement, creating critical indicators to chart progress, and conducting theory-driven evaluation to identify how programs and policies are working.


![Significant lncrease in Blood Pressure after Discontinuationjsccm.umin.jp/journal_archive/1995.1-2009.2/2000/002101/...Ai]aesthesia 51:312-317,1996 5) Bell J, Sartain J,](https://img.pdfslide.us/doc/110x75/60ea8a43e85e513ae42107fa/significant-lncrease-in-blood-pressure-after-aiaesthesia-51i312i317ioe1996.jpg)