Embed Size (px)
Citation preview
Research Report for Adaptive Testing Assessment
Copyright ©2013 by John Wiley & Sons, Inc. All rights reserved. Permission to reproduce only when used in conjunction with Everything DiSC® assessments. 2
Overview of this Research Report The purpose of this report is to provide the validity research for the Everything DiSC® assessment and
profiles. Section 1 includes background and research on the assessment, specifically on the
Everything DiSC assessment, the DiSC® scales that are derived from this information, and the circumplex representation of the model. Sections 2-6 provide research on the application-specific
models used in Everything DiSC Management, Everything DiSC Sales, Everything DiSC Workplace®,
Everything DiSC Productive Conflict, and Everything DiSC Agile EQ™. Section 7 provides the research for the 18 additional scales in Everything DiSC Work of Leaders®. Section 8 provides the
research for the Everything DiSC Comparison Report. The Appendices contain more detailed
information on the Everything DiSC assessment research.
Table of Contents
Section 1: Everything DiSC® Assessment Research ......................................................................... 4
The DiSC® Model ..................................................................................................................... 4 Assessment and Scoring .......................................................................................................... 5 Overview of the Validation Process ........................................................................................... 6 Reliability ................................................................................................................................. 7 Validity ................................................................................................................................... 12 Summary of the Validation Results .......................................................................................... 25
Section 2: Everything DiSC® Management Research ...................................................................... 26
Background ............................................................................................................................ 26 The Research......................................................................................................................... 26 Summary of the Validation Results .......................................................................................... 32
Section 3: Everything DiSC® Sales Research ................................................................................. 33
Background ............................................................................................................................ 33 The Research......................................................................................................................... 33 Summary of the Validation Results .......................................................................................... 38
Section 4: Everything DiSC Workplace® Research .......................................................................... 39
Background ............................................................................................................................ 39 The Research......................................................................................................................... 39 Summary of the Validation Results .......................................................................................... 42
Section 5: Everything DiSC® Productive Conflict Research.............................................................. 43
Background ............................................................................................................................ 43 The Research......................................................................................................................... 43 Summary of the Validation Results .......................................................................................... 47
Copyright ©2013 by John Wiley & Sons, Inc. All rights reserved. Permission to reproduce only when used in conjunction with Everything DiSC® assessments. 3
Section 6: Everything DiSC® Agile EQ™ Research .......................................................................... 48
Background ............................................................................................................................ 48 Scoring of the Scales .............................................................................................................. 48 Sample Characteristics ........................................................................................................... 50 Internal Reliability ................................................................................................................... 52 Intercorrelations Among the Mindset Scales ............................................................................ 54 Summary of the Validation Results .......................................................................................... 55
Section 7: Everything DiSC Work of Leaders® Research ................................................................. 56
Background ............................................................................................................................ 56 The Validation Process ........................................................................................................... 56 Internal Reliability ................................................................................................................... 56 Intercorrelations Among the Work of Leaders Scales ............................................................... 56 Correlations Among Work of Leaders Scales and DiSC® Scales ............................................... 60
Section 8: Everything DiSC® Comparison Report Research ............................................................ 62
Background ............................................................................................................................ 62 Selection of the Continua within Each Report........................................................................... 62 Scoring of the Continua .......................................................................................................... 63 Internal Reliability ................................................................................................................... 64 Intercorrelations Among the Continua Scales........................................................................... 64 Summary of the Validation Results .......................................................................................... 65
Section 9: Appendices ................................................................................................................... 66
Appendix 1. Everything DiSC® Assessment Development Sample Demographics ..................... 66 Appendix 2. Percent of Variance Accounted for by Gender....................................................... 67 Appendix 3. Correlation Between the Everything DiSC® Assessment and the 16PF® ................. 68 Appendix 4. Correlation Between the Everything DiSC® Assessment and the NEO-PI-R™ ......... 70 Appendix 5. References .......................................................................................................... 72
Note: If you are interested in a deeper overview of the DiSC® model, research, and interpretation, we
encourage you to read the Everything DiSC® Manual—our comprehensive guide to the research that
supports the Everything DiSC suite of assessments. Available through your Everything DiSC Authorized Partner, Amazon, and Wiley.com, this manual is an essential reference tool for anyone
facilitating Everything DiSC solutions.
Section 1: Everything DiSC® Assessment Research
Copyright ©2013 by John Wiley & Sons, Inc. All rights reserved. Permission to reproduce only when used in conjunction with Everything DiSC® assessments. 4
Section 1: Everything DiSC® Assessment Research The DiSC® Model
The foundation of DiSC® was first described by William Moulton Marston in his 1928 book, Emotions of
Normal People. Marston identified what he called four “primary emotions” and associated behavioral
responses, which today we know as Dominance (D), Influence (i), Steadiness (S), and Conscientiousness (C). Since Marston’s time, many instruments have been developed to measure
these attributes. The Everything DiSC® assessment uses the circle, or circumplex, as illustrated below,
as an intuitive way to represent this model. Although all points around the circle are equally meaningful
and interpretable, the DiSC model discusses four specific reference points.
Dominance: direct, strong-willed, and forceful
Influence: sociable, talkative, and lively Steadiness: gentle, accommodating, and soft-hearted
Conscientiousness: private, analytical, and logical
Figure 1. Circumplex DiSC Model
Section 1: Everything DiSC® Assessment Research
Copyright ©2013 by John Wiley & Sons, Inc. All rights reserved. Permission to reproduce only when used in conjunction with Everything DiSC® assessments. 5
Although some people tend equally toward all of these regions, research indicates that most of us lean toward one or two. Each person who takes the Everything DiSC® assessment is plotted on the circle,
also known as the Everything DiSC Map. The example in Figure 1 shows a person (represented by the
dot) who tends toward the D region, but also somewhat toward the i region. This represents a Di style.
This person, therefore, is probably particularly active, bold, outspoken, and persuasive, as these qualities generally describe people who share both the D and i styles. The distance of the dot from the
center of the circle is also meaningful. People whose dots fall toward the edge of the circle, as shown
in Figure 1, are much more inclined toward their DiSC styles and are likely to choose the priorities of
that style over those of other styles. People whose dots fall close to the center of the circle are less inclined toward a particular style and find it fairly easy to relate to the priorities of other styles.
Assessment and Scoring
The Everything DiSC assessment asks participants to respond to statements on a five-point ordered
response scale, indicating how much they agree with each statement. These responses are used to
form scores on eight scales (standardized to have a mean of zero and standard deviation of one) that are located around the DiSC® circle, as shown in Figure 2. The eight scales are as follows:
D measures a direct, dominant disposition using adjectives such as aggressive, strong-willed, and forceful. Di measures an active, fast-paced disposition using adjectives such as dynamic, adventurous, and bold. i measures an interactive, influencing disposition using adjectives such as sociable, lively, and talkative. iS measures an agreeable, warm disposition using adjectives such as trusting, cheerful, and caring. S measures an accommodating, steady disposition using adjectives such as considerate, gentle, and soft-hearted. SC measures a moderate-paced, cautious disposition using adjectives such as careful, soft-spoken, and self-controlled. C measures a private, conscientious disposition using adjectives such as analytical, reserved, and unemotional. CD measures a questioning, skeptical disposition using adjectives such as cynical, stubborn, and critical.
Section 1: Everything DiSC® Assessment Research
Copyright ©2013 by John Wiley & Sons, Inc. All rights reserved. Permission to reproduce only when used in conjunction with Everything DiSC® assessments. 6
Figure 2. Eight DiSC® Scales
During the assessment process, the respondent’s variance on each of the eight scales is calculated. If the variance on a particular scale is above a predetermined cut-off, the participant is presented with
additional items for that scale. In this way, the assessment can gain more certainty with regard to the
respondent’s true score. This process mirrors those used in other adaptive testing assessments. An individual’s scores on the eight scales are then used to plot the individual on the Everything DiSC®
Map, as represented by a dot. (Note that these eight scale scores are not directly reported in the
profiles.) The Everything DiSC Map is divided into 12 sections, or styles, each representing 30 degrees within the circle. Feedback is largely based on the section in which the dot falls. Other factors, such as
the dot’s distance from the center of the circle and the individual’s priorities, are also reflected in the
feedback.
Overview of the Validation Process
Psychological instruments are used to measure abstract qualities that we can’t touch or see. These
are characteristics like intelligence, extroversion, or honesty. So how do researchers evaluate these
instruments? How do we know whether such tools are actually providing accurate information about these characteristics or just generating haphazard feedback that sounds believable? Simply put, if an
instrument is indeed useful and accurate, it should meet a variety of different standards that have been
established by the scientific community. Validation is the process through which researchers
Section 1: Everything DiSC® Assessment Research
Copyright ©2013 by John Wiley & Sons, Inc. All rights reserved. Permission to reproduce only when used in conjunction with Everything DiSC® assessments. 7
assess the quality of a psychological instrument by testing the tool against these different standards. This paper is designed to help you understand these different standards and see how the Everything
DiSC® assessment performs under examination.
Validation asks two fundamental questions:
1. How reliable is the tool? That is, researchers ask if an instrument measures in a consistent and
dependable way. If the results contain a lot of random variation, it is deemed less reliable. 2. How valid is the tool? That is, researchers ask if an instrument measures accurately. The more that a tool measures what it proposes to measure, the more valid the tool is.
Note that no psychometric tool is perfectly reliable or perfectly valid. All psychological instruments are subject to various sources of error. Reliability and validity are seen as matters of degree on continuous
scales, rather than reliable/unreliable and valid/invalid on dichotomous scales. Consequently, it is more
appropriate to ask, “How much evidence is there for the reliability of this tool?” than, “Is this tool reliable?”
Reliability
When we talk of reliability in relation to profiles such as DiSC assessments, then we are referring
partly to the tool’s stability and partly to its internal consistency.
Stability refers to the tool’s ability to yield the same measurements over a period of time. This is
generally tested by having the same people complete the tool’s questionnaire twice, with a suitable
time interval between the two measurements (the so-called test-retest.) The results are then compared
to determine how strongly they relate to each other (or correlate). If a person’s DiSC style remains unchanged, a stable tool should produce results that are quite similar between two different
administrations. In reality, however, it is almost impossible to obtain perfect test-retest reliability on any
sophisticated psychological test, even if the individual in question does not change on the measured attribute. This is because test results are influenced by a variety of extraneous factors that are
unrelated to the characteristics that the test intends to measure. For instance, someone who is tired
during one testing may answer differently than she will on a second testing when she is well-rested. Similarly, another person may respond to a test differently depending on the mood he is in.
Section 1: Everything DiSC® Assessment Research
Copyright ©2013 by John Wiley & Sons, Inc. All rights reserved. Permission to reproduce only when used in conjunction with Everything DiSC® assessments. 8
Generally speaking, the longer the interval between two test administrations, the greater the chance that these random variables can artificially lower the test-retest reliability of an instrument. In other
words, the longer the time period between two testings, the lower we would expect the test-retest
reliability to be.
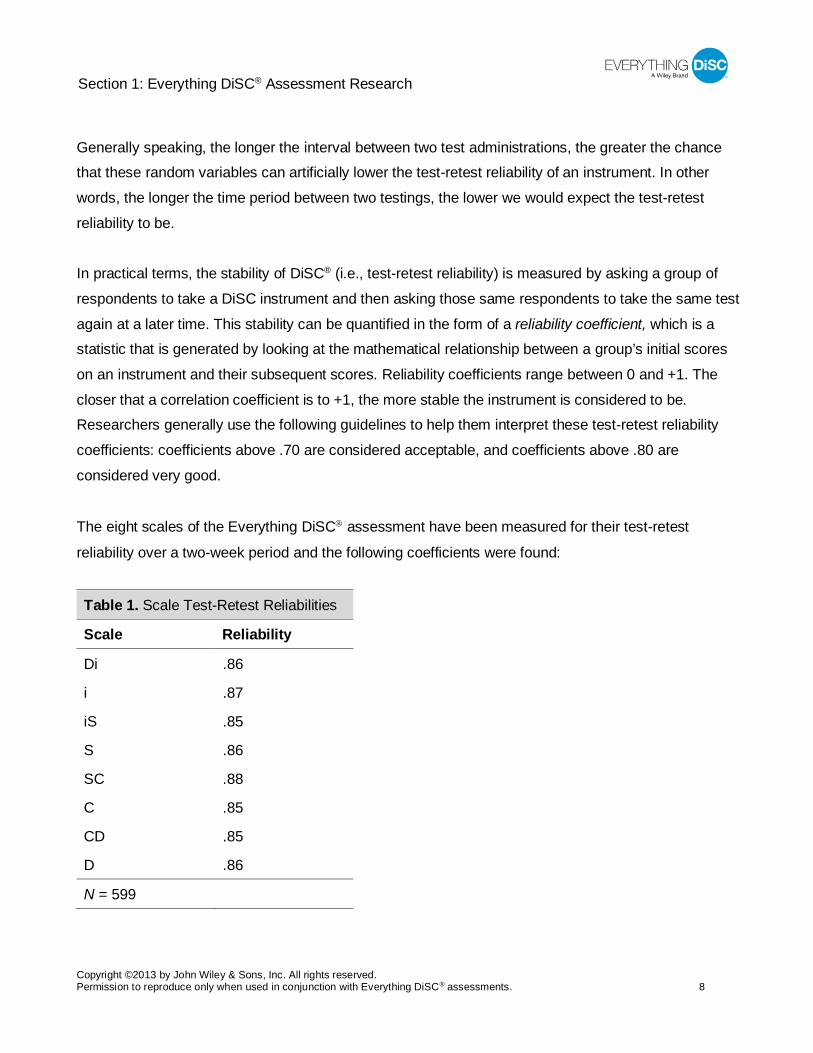
In practical terms, the stability of DiSC® (i.e., test-retest reliability) is measured by asking a group of
respondents to take a DiSC instrument and then asking those same respondents to take the same test
again at a later time. This stability can be quantified in the form of a reliability coefficient, which is a statistic that is generated by looking at the mathematical relationship between a group’s initial scores
on an instrument and their subsequent scores. Reliability coefficients range between 0 and +1. The
closer that a correlation coefficient is to +1, the more stable the instrument is considered to be. Researchers generally use the following guidelines to help them interpret these test-retest reliability
coefficients: coefficients above .70 are considered acceptable, and coefficients above .80 are
considered very good.
The eight scales of the Everything DiSC assessment have been measured for their test-retest
reliability over a two-week period and the following coefficients were found:
Table 1. Scale Test-Retest Reliabilities
Scale Reliability
Di .86
i .87
iS .85
S .86
SC .88
C .85
CD .85
D .86
N = 599
Section 1: Everything DiSC® Assessment Research
Copyright ©2013 by John Wiley & Sons, Inc. All rights reserved. Permission to reproduce only when used in conjunction with Everything DiSC® assessments. 9
These results suggest that results produced by the Everything DiSC® assessment are quite stable over time. Consequently, test takers and test administrators should expect no more than small changes
when instrument is taken at different times. As the period between administrations increases, however,
the divergent results of these administrations will become more and more noticeable.
Note that even over very short intervals an instrument’s results can show small changes. In fact, it is
unlikely that two administrations of a test will yield the exact same results on any sophisticated
psychological instrument. When such changes are observed in DiSC®, however, the fundamental interpretation of the results will usually be the same.
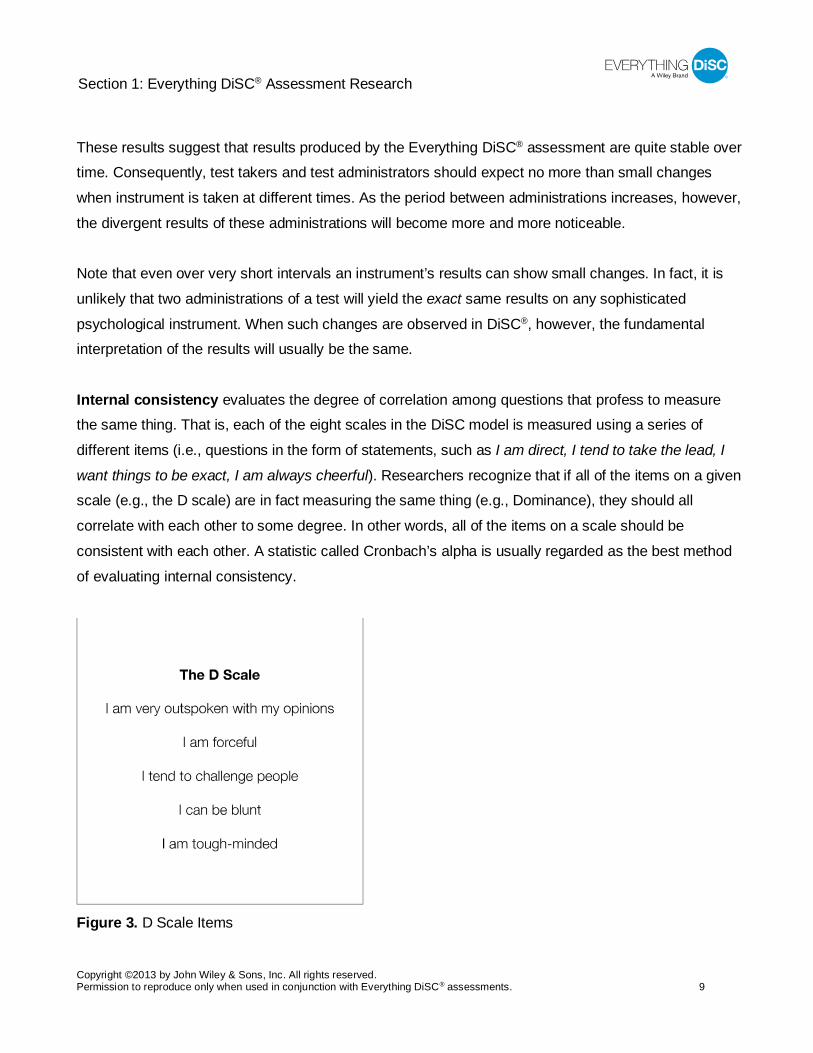
Internal consistency evaluates the degree of correlation among questions that profess to measure the same thing. That is, each of the eight scales in the DiSC model is measured using a series of
different items (i.e., questions in the form of statements, such as I am direct, I tend to take the lead, I
want things to be exact, I am always cheerful). Researchers recognize that if all of the items on a given scale (e.g., the D scale) are in fact measuring the same thing (e.g., Dominance), they should all
correlate with each other to some degree. In other words, all of the items on a scale should be
consistent with each other. A statistic called Cronbach’s alpha is usually regarded as the best method
of evaluating internal consistency.
Figure 3. D Scale Items
Section 1: Everything DiSC® Assessment Research
Copyright ©2013 by John Wiley & Sons, Inc. All rights reserved. Permission to reproduce only when used in conjunction with Everything DiSC® assessments. 10
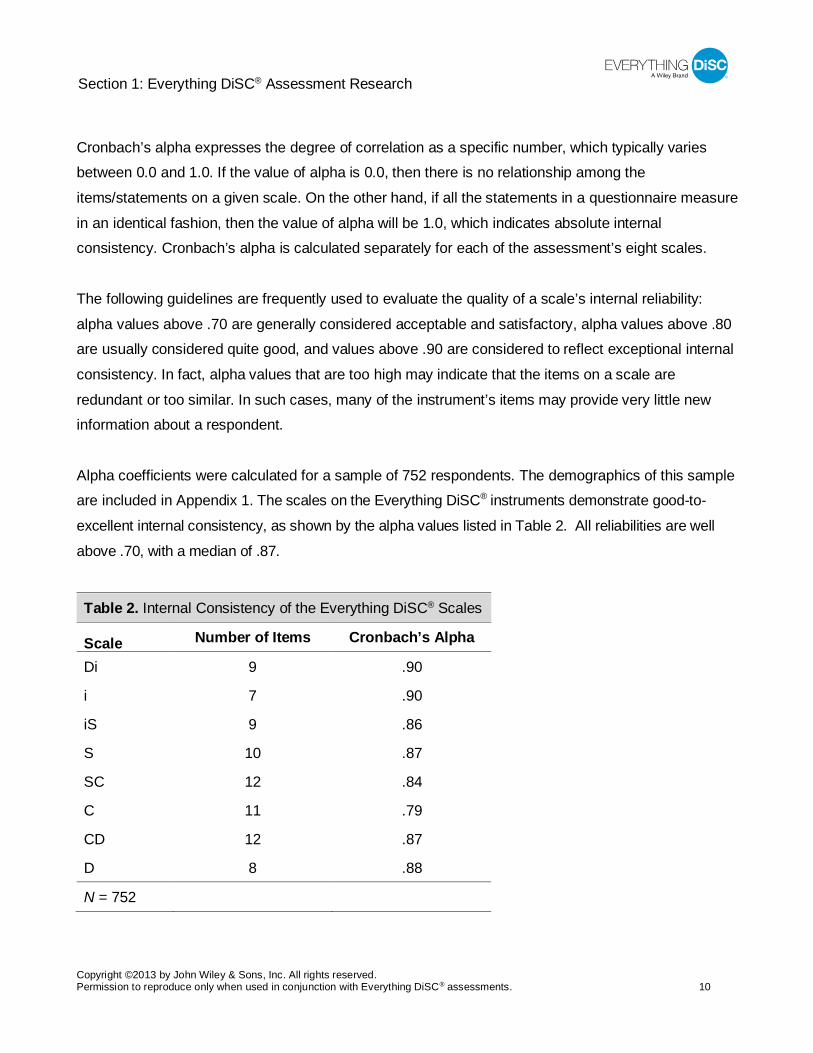
Cronbach’s alpha expresses the degree of correlation as a specific number, which typically varies between 0.0 and 1.0. If the value of alpha is 0.0, then there is no relationship among the
items/statements on a given scale. On the other hand, if all the statements in a questionnaire measure
in an identical fashion, then the value of alpha will be 1.0, which indicates absolute internal consistency. Cronbach’s alpha is calculated separately for each of the assessment’s eight scales.
The following guidelines are frequently used to evaluate the quality of a scale’s internal reliability:
alpha values above .70 are generally considered acceptable and satisfactory, alpha values above .80 are usually considered quite good, and values above .90 are considered to reflect exceptional internal
consistency. In fact, alpha values that are too high may indicate that the items on a scale are
redundant or too similar. In such cases, many of the instrument’s items may provide very little new information about a respondent.
Alpha coefficients were calculated for a sample of 752 respondents. The demographics of this sample are included in Appendix 1. The scales on the Everything DiSC® instruments demonstrate good-to-
excellent internal consistency, as shown by the alpha values listed in Table 2. All reliabilities are well
above .70, with a median of .87.
Table 2. Internal Consistency of the Everything DiSC® Scales
Scale Number of Items Cronbach’s Alpha
Di 9 .90
i 7 .90
iS 9 .86
S 10 .87
SC 12 .84
C 11 .79
CD 12 .87
D 8 .88
N = 752
Section 1: Everything DiSC® Assessment Research
Copyright ©2013 by John Wiley & Sons, Inc. All rights reserved. Permission to reproduce only when used in conjunction with Everything DiSC® assessments. 11
Analyses were also performed to understand the impact of the extra, adaptive questions that some respondents receive if there is a large amount of variation within their responses to a single scale’s
items. That is, if the variance in a respondent’s ratings to a scale’s items is above a certain level, the
respondent is given five to ten extra items that continue to measure the trait assessed by the scale. For convenience, the items that all respondents receive will be called “base items” and the items that
only inconsistent responders receive will be called “extra items.”
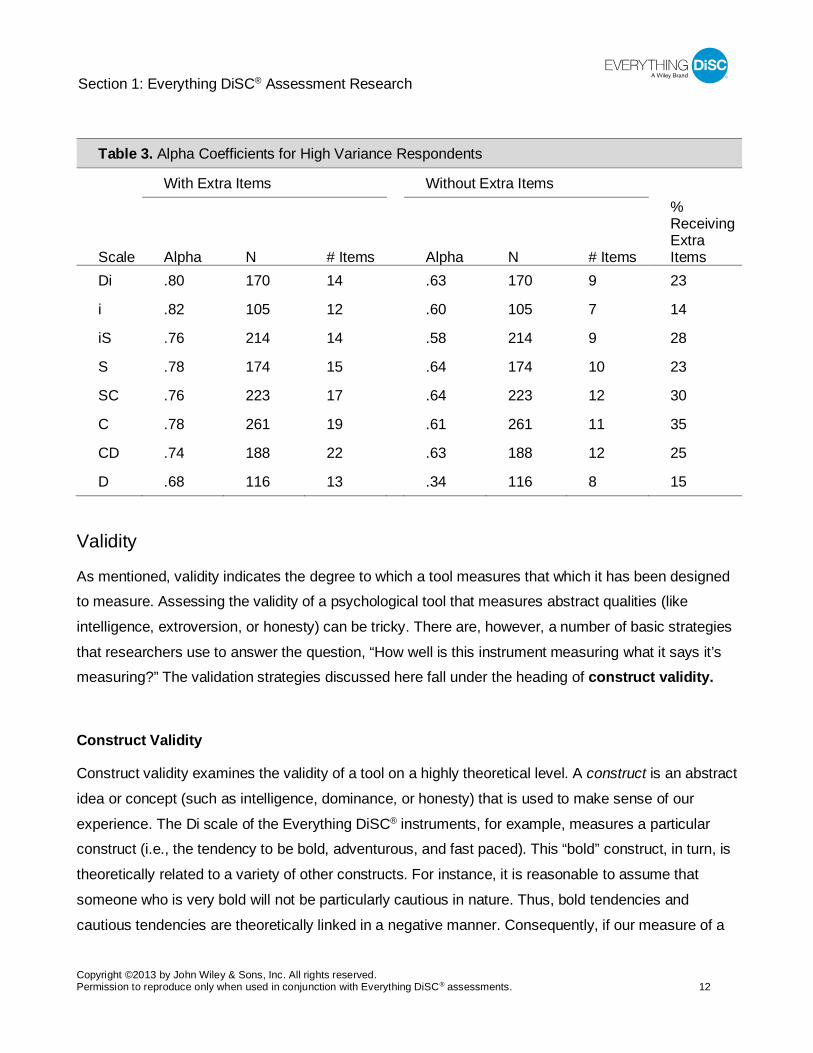
Table 3 shows the internal reliabilities for only those respondents who gave the most inconsistent responses to a given scale’s items, measured by a high degree of response variance. In other words,
these are respondents whose scale preferences seemed most unclear. In the first bold column are the
alphas for those respondents using both the base items and extra items (which reflects how these respondents are measured in the actual assessment). In the second bold column are the alphas for
those respondents using only the base items. With only the base items, the median alpha in this
subsample is .62. The median alpha when the extra items are included is .77. By comparing these two columns, we can see the internal consistency is much higher for these unclear respondents when they
receive the extra items. In essence, these extra items are used to further gauge the target trait when
the normal assessment has produced unclear or variable results. The final column shows the
percentage of respondents in the sample who received extra items on a given scale. On average, 24% of respondents received extra items on an individual scale.
Section 1: Everything DiSC® Assessment Research
Copyright ©2013 by John Wiley & Sons, Inc. All rights reserved. Permission to reproduce only when used in conjunction with Everything DiSC® assessments. 12
Table 3. Alpha Coefficients for High Variance Respondents
With Extra Items Without Extra Items
Scale Alpha N # Items Alpha N # Items
% Receiving Extra Items
Di .80 170 14 .63 170 9 23
i .82 105 12 .60 105 7 14
iS .76 214 14 .58 214 9 28
S .78 174 15 .64 174 10 23
SC .76 223 17 .64 223 12 30
C .78 261 19 .61 261 11 35
CD .74 188 22 .63 188 12 25
D .68 116 13 .34 116 8 15
Validity
As mentioned, validity indicates the degree to which a tool measures that which it has been designed to measure. Assessing the validity of a psychological tool that measures abstract qualities (like
intelligence, extroversion, or honesty) can be tricky. There are, however, a number of basic strategies
that researchers use to answer the question, “How well is this instrument measuring what it says it’s measuring?” The validation strategies discussed here fall under the heading of construct validity.
Construct Validity
Construct validity examines the validity of a tool on a highly theoretical level. A construct is an abstract
idea or concept (such as intelligence, dominance, or honesty) that is used to make sense of our
experience. The Di scale of the Everything DiSC® instruments, for example, measures a particular construct (i.e., the tendency to be bold, adventurous, and fast paced). This “bold” construct, in turn, is
theoretically related to a variety of other constructs. For instance, it is reasonable to assume that
someone who is very bold will not be particularly cautious in nature. Thus, bold tendencies and
cautious tendencies are theoretically linked in a negative manner. Consequently, if our measure of a

Section 1: Everything DiSC® Assessment Research
Copyright ©2013 by John Wiley & Sons, Inc. All rights reserved. Permission to reproduce only when used in conjunction with Everything DiSC® assessments. 13
bold tendency has high validity, people scoring high on the Di scale should score relatively low on a scale measuring cautiousness, such as the SC scale. This is essentially what researchers do when
they examine construct validity. First, they specify a series of theoretical relationships (e.g., the
construct of boldness is theoretically related to the constructs of X, Y, and Z). Then, they test these theoretical relationships empirically to see if the relationships actually exist. If the proposed
relationships do exist, the instrument is thought to have higher validity.
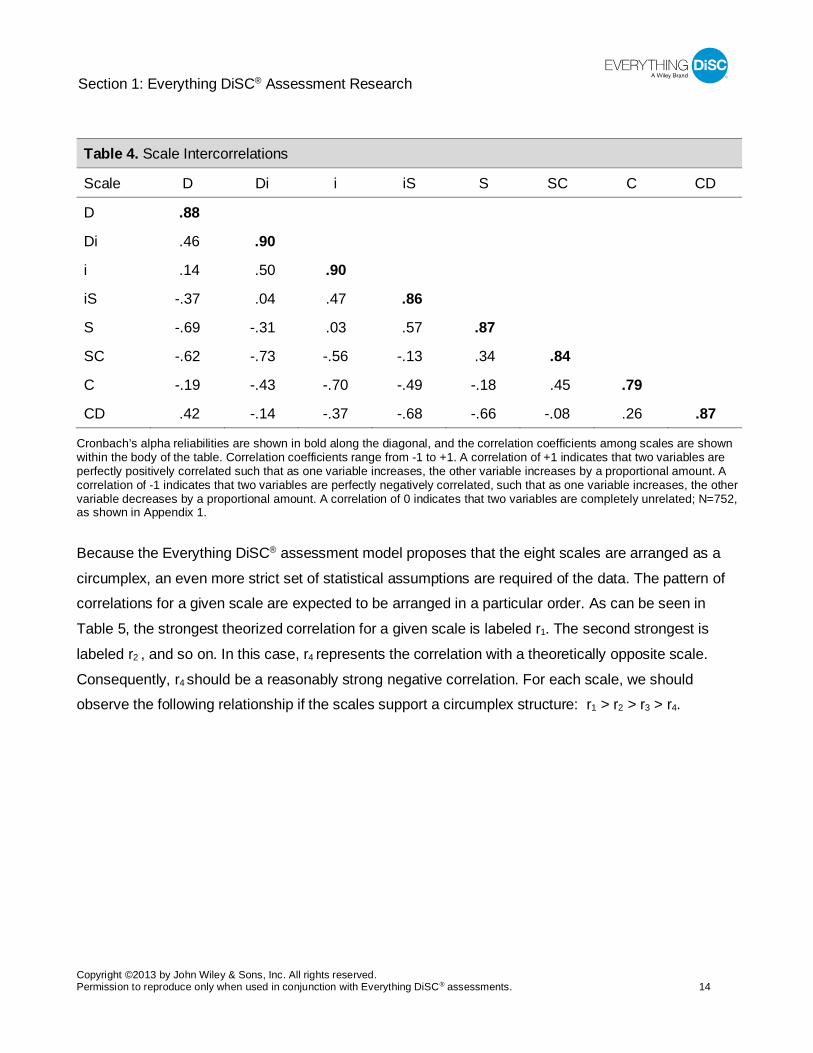
Scale Intercorrelations As you might imagine, there are a variety of different ways to test construct validity. First, we can
examine the validity of an instrument as a whole. Instruments like the Everything DiSC® assessment
propose an underlying model in which the scales have a specific relationship to each other. Researchers examine the actual relationship among the scales to see if they reflect the theoretical
relationship proposed by the model.
The DiSC® model proposes that adjacent scales (e.g., Di and i) will have moderate correlations. That
is, these correlations should be considerably smaller than the alpha reliabilities of the individual scales.
For example, the correlation between the Di and i scales (.50) should be substantially lower than the
alpha reliability of the Di or i scales (both .90). On the other hand, scales that are theoretically opposite (e.g., i and C) should have strong negative correlations. Table 4 shows data obtained from a sample of
752 respondents who completed the Everything DiSC assessment. The correlations among all eight
scales show strong support for the model. That is, moderate positive correlations among adjacent scales and strong negative correlations are observed between opposite scales.
Section 1: Everything DiSC® Assessment Research
Copyright ©2013 by John Wiley & Sons, Inc. All rights reserved. Permission to reproduce only when used in conjunction with Everything DiSC® assessments. 14
Table 4. Scale Intercorrelations
Scale D Di i iS S SC C CD
D .88
Di .46 .90
i .14 .50 .90
iS -.37 .04 .47 .86
S -.69 -.31 .03 .57 .87
SC -.62 -.73 -.56 -.13 .34 .84
C -.19 -.43 -.70 -.49 -.18 .45 .79
CD .42 -.14 -.37 -.68 -.66 -.08 .26 .87
Cronbach’s alpha reliabilities are shown in bold along the diagonal, and the correlation coefficients among scales are shown within the body of the table. Correlation coefficients range from -1 to +1. A correlation of +1 indicates that two variables are perfectly positively correlated such that as one variable increases, the other variable increases by a proportional amount. A correlation of -1 indicates that two variables are perfectly negatively correlated, such that as one variable increases, the other variable decreases by a proportional amount. A correlation of 0 indicates that two variables are completely unrelated; N=752, as shown in Appendix 1.
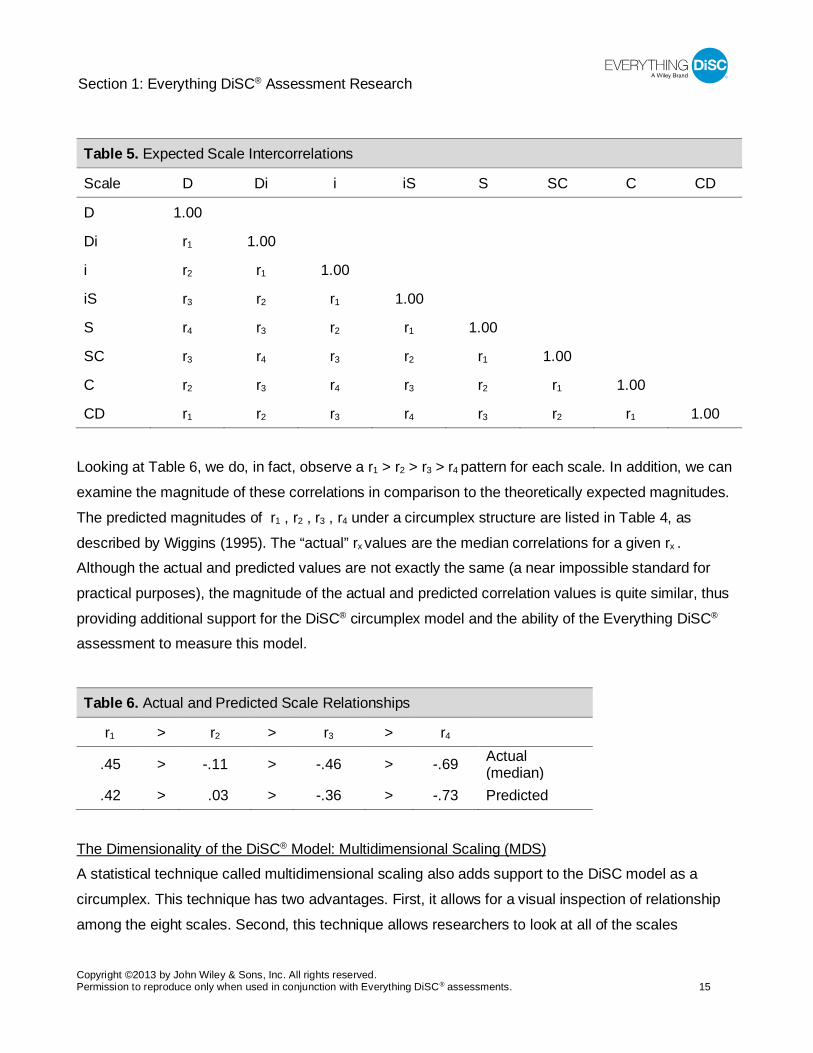
Because the Everything DiSC® assessment model proposes that the eight scales are arranged as a
circumplex, an even more strict set of statistical assumptions are required of the data. The pattern of correlations for a given scale are expected to be arranged in a particular order. As can be seen in
Table 5, the strongest theorized correlation for a given scale is labeled r1. The second strongest is
labeled r2 , and so on. In this case, r4 represents the correlation with a theoretically opposite scale.
Consequently, r4 should be a reasonably strong negative correlation. For each scale, we should observe the following relationship if the scales support a circumplex structure: r1 > r2 > r3 > r4.
Section 1: Everything DiSC® Assessment Research
Copyright ©2013 by John Wiley & Sons, Inc. All rights reserved. Permission to reproduce only when used in conjunction with Everything DiSC® assessments. 15
Table 5. Expected Scale Intercorrelations
Scale D Di i iS S SC C CD
D 1.00
Di r1 1.00
i r2 r1 1.00
iS r3 r2 r1 1.00
S r4 r3 r2 r1 1.00
SC r3 r4 r3 r2 r1 1.00
C r2 r3 r4 r3 r2 r1 1.00
CD r1 r2 r3 r4 r3 r2 r1 1.00
Looking at Table 6, we do, in fact, observe a r1 > r2 > r3 > r4 pattern for each scale. In addition, we can
examine the magnitude of these correlations in comparison to the theoretically expected magnitudes.
The predicted magnitudes of r1 , r2 , r3 , r4 under a circumplex structure are listed in Table 4, as
described by Wiggins (1995). The “actual” rx values are the median correlations for a given rx . Although the actual and predicted values are not exactly the same (a near impossible standard for
practical purposes), the magnitude of the actual and predicted correlation values is quite similar, thus
providing additional support for the DiSC® circumplex model and the ability of the Everything DiSC® assessment to measure this model.
Table 6. Actual and Predicted Scale Relationships
r1 > r2 > r3 > r4
.45 > -.11 > -.46 > -.69 Actual (median)
.42 > .03 > -.36 > -.73 Predicted
The Dimensionality of the DiSC® Model: Multidimensional Scaling (MDS) A statistical technique called multidimensional scaling also adds support to the DiSC model as a
circumplex. This technique has two advantages. First, it allows for a visual inspection of relationship
among the eight scales. Second, this technique allows researchers to look at all of the scales
Section 1: Everything DiSC® Assessment Research
Copyright ©2013 by John Wiley & Sons, Inc. All rights reserved. Permission to reproduce only when used in conjunction with Everything DiSC® assessments. 16
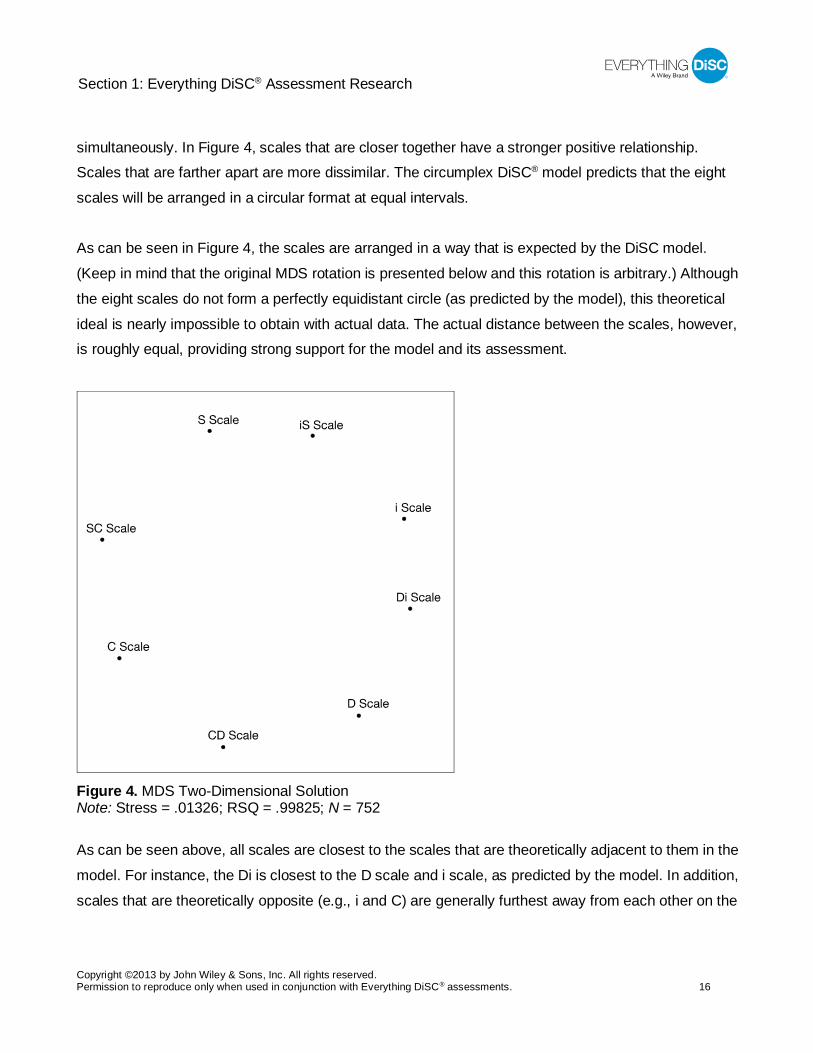
simultaneously. In Figure 4, scales that are closer together have a stronger positive relationship. Scales that are farther apart are more dissimilar. The circumplex DiSC® model predicts that the eight
scales will be arranged in a circular format at equal intervals.
As can be seen in Figure 4, the scales are arranged in a way that is expected by the DiSC model.
(Keep in mind that the original MDS rotation is presented below and this rotation is arbitrary.) Although
the eight scales do not form a perfectly equidistant circle (as predicted by the model), this theoretical
ideal is nearly impossible to obtain with actual data. The actual distance between the scales, however, is roughly equal, providing strong support for the model and its assessment.
Figure 4. MDS Two-Dimensional Solution Note: Stress = .01326; RSQ = .99825; N = 752
As can be seen above, all scales are closest to the scales that are theoretically adjacent to them in the
model. For instance, the Di is closest to the D scale and i scale, as predicted by the model. In addition,
scales that are theoretically opposite (e.g., i and C) are generally furthest away from each other on the
Section 1: Everything DiSC® Assessment Research
Copyright ©2013 by John Wiley & Sons, Inc. All rights reserved. Permission to reproduce only when used in conjunction with Everything DiSC® assessments. 17
plot. Consequently, this analysis adds strong support for the two-dimensional DiSC® model and the ability of the Everything DiSC® assessment to measure that model.
Additionally, the S-stress of the model is .01326 and the RSQ value is .99825. These values reflect the ability of a two-dimensional model to fit the data. Lower S-stress values are preferred (with a minimum
of 0) and higher RSQ values are preferred (with a maximum of 1). Both of these values are almost
ideal in the data, suggesting that the two-dimensional DiSC model fits the participant data
exceptionally well.
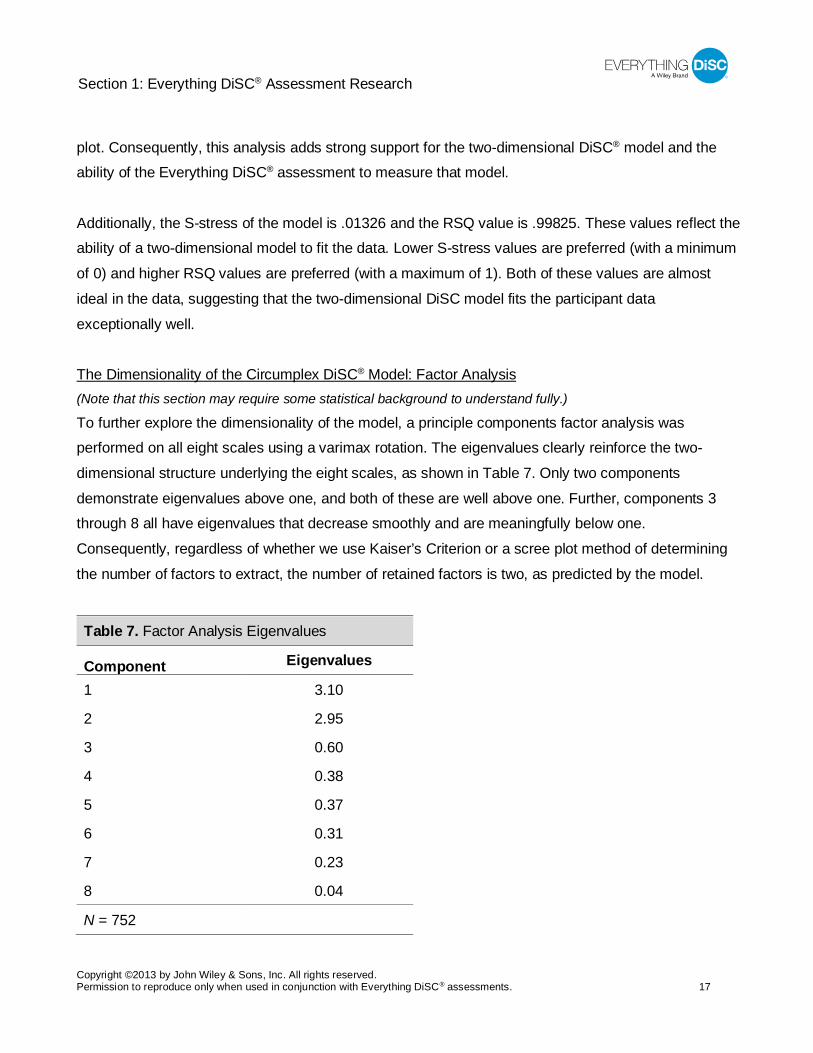
The Dimensionality of the Circumplex DiSC® Model: Factor Analysis (Note that this section may require some statistical background to understand fully.)
To further explore the dimensionality of the model, a principle components factor analysis was performed on all eight scales using a varimax rotation. The eigenvalues clearly reinforce the two-
dimensional structure underlying the eight scales, as shown in Table 7. Only two components
demonstrate eigenvalues above one, and both of these are well above one. Further, components 3 through 8 all have eigenvalues that decrease smoothly and are meaningfully below one.
Consequently, regardless of whether we use Kaiser’s Criterion or a scree plot method of determining
the number of factors to extract, the number of retained factors is two, as predicted by the model.
Table 7. Factor Analysis Eigenvalues
Component Eigenvalues
1 3.10
2 2.95
3 0.60
4 0.38
5 0.37
6 0.31
7 0.23
8 0.04
N = 752
Section 1: Everything DiSC® Assessment Research
Copyright ©2013 by John Wiley & Sons, Inc. All rights reserved. Permission to reproduce only when used in conjunction with Everything DiSC® assessments. 18
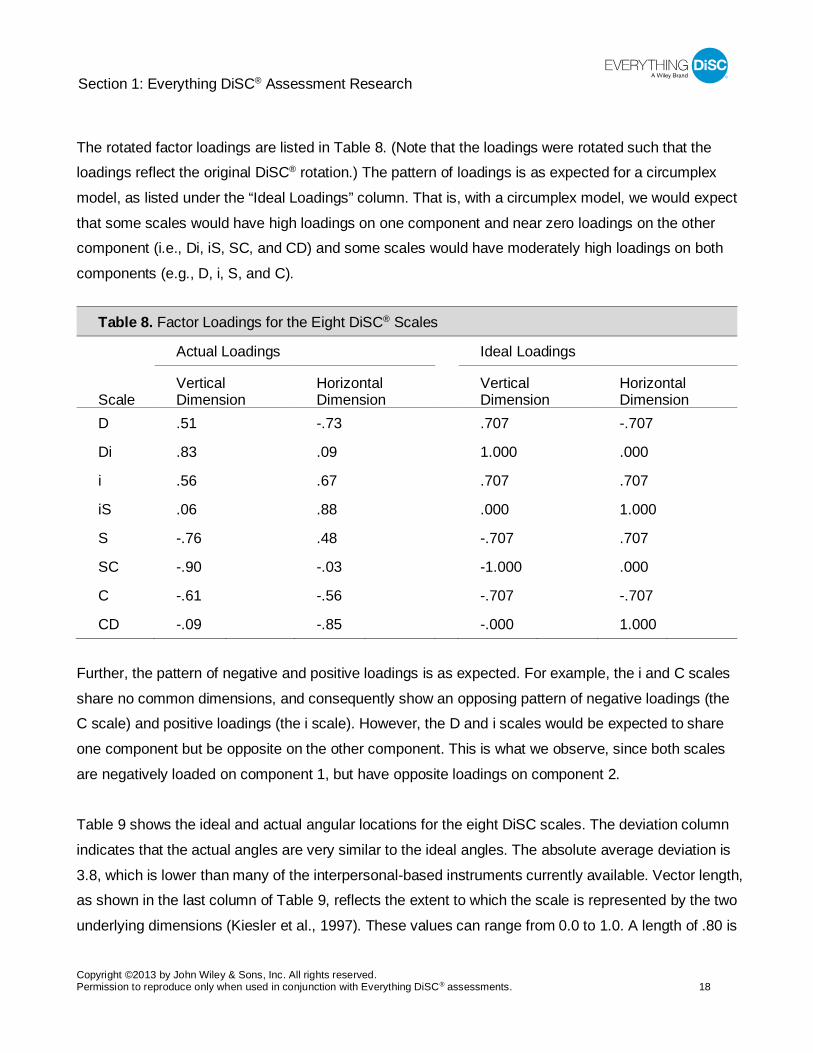
The rotated factor loadings are listed in Table 8. (Note that the loadings were rotated such that the loadings reflect the original DiSC® rotation.) The pattern of loadings is as expected for a circumplex
model, as listed under the “Ideal Loadings” column. That is, with a circumplex model, we would expect
that some scales would have high loadings on one component and near zero loadings on the other component (i.e., Di, iS, SC, and CD) and some scales would have moderately high loadings on both
components (e.g., D, i, S, and C).
Table 8. Factor Loadings for the Eight DiSC® Scales
Actual Loadings Ideal Loadings
Scale Vertical Dimension
Horizontal Dimension
Vertical Dimension
Horizontal Dimension
D .51 -.73 .707 -.707
Di .83 .09 1.000 .000
i .56 .67 .707 .707
iS .06 .88 .000 1.000
S -.76 .48 -.707 .707
SC -.90 -.03 -1.000 .000
C -.61 -.56 -.707 -.707
CD -.09 -.85 -.000 1.000
Further, the pattern of negative and positive loadings is as expected. For example, the i and C scales
share no common dimensions, and consequently show an opposing pattern of negative loadings (the C scale) and positive loadings (the i scale). However, the D and i scales would be expected to share
one component but be opposite on the other component. This is what we observe, since both scales
are negatively loaded on component 1, but have opposite loadings on component 2.
Table 9 shows the ideal and actual angular locations for the eight DiSC scales. The deviation column
indicates that the actual angles are very similar to the ideal angles. The absolute average deviation is
3.8, which is lower than many of the interpersonal-based instruments currently available. Vector length, as shown in the last column of Table 9, reflects the extent to which the scale is represented by the two
underlying dimensions (Kiesler et al., 1997). These values can range from 0.0 to 1.0. A length of .80 is
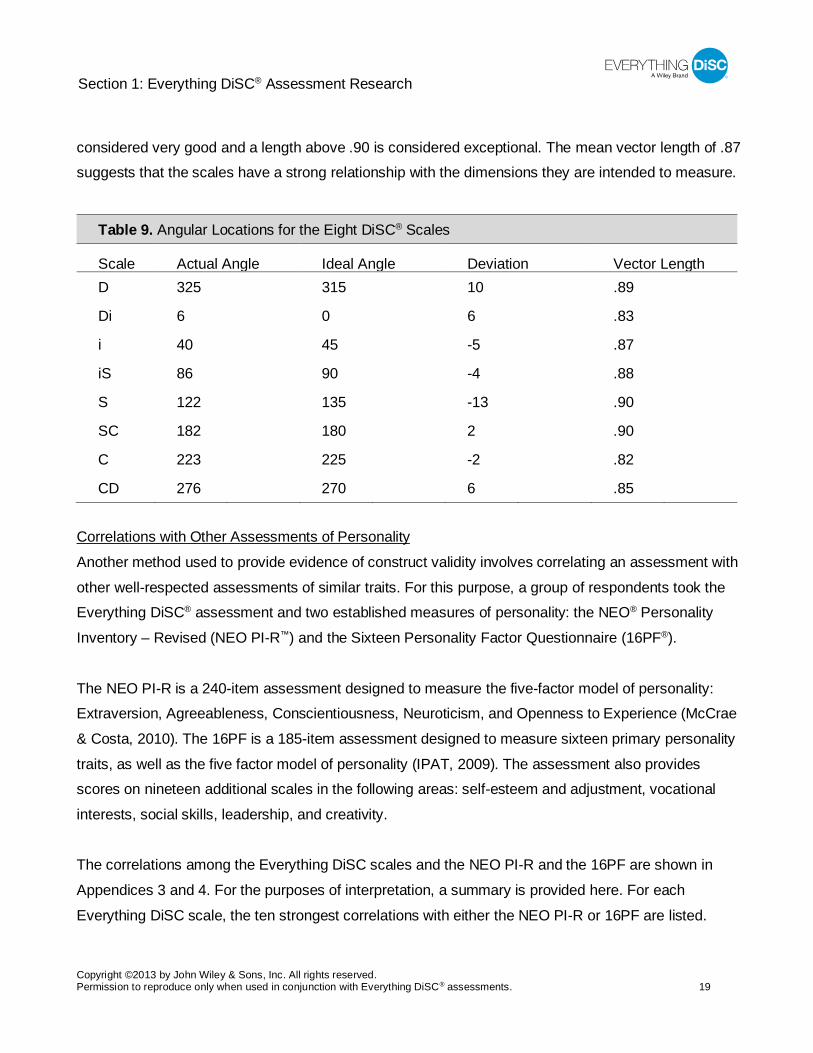
Section 1: Everything DiSC® Assessment Research
Copyright ©2013 by John Wiley & Sons, Inc. All rights reserved. Permission to reproduce only when used in conjunction with Everything DiSC® assessments. 19
considered very good and a length above .90 is considered exceptional. The mean vector length of .87 suggests that the scales have a strong relationship with the dimensions they are intended to measure.
Table 9. Angular Locations for the Eight DiSC® Scales
Scale Actual Angle Ideal Angle Deviation Vector Length D 325 315 10 .89
Di 6 0 6 .83
i 40 45 -5 .87
iS 86 90 -4 .88
S 122 135 -13 .90
SC 182 180 2 .90
C 223 225 -2 .82
CD 276 270 6 .85 Correlations with Other Assessments of Personality
Another method used to provide evidence of construct validity involves correlating an assessment with
other well-respected assessments of similar traits. For this purpose, a group of respondents took the Everything DiSC® assessment and two established measures of personality: the NEO® Personality
Inventory – Revised (NEO PI-R™) and the Sixteen Personality Factor Questionnaire (16PF®).
The NEO PI-R is a 240-item assessment designed to measure the five-factor model of personality: Extraversion, Agreeableness, Conscientiousness, Neuroticism, and Openness to Experience (McCrae
& Costa, 2010). The 16PF is a 185-item assessment designed to measure sixteen primary personality
traits, as well as the five factor model of personality (IPAT, 2009). The assessment also provides scores on nineteen additional scales in the following areas: self-esteem and adjustment, vocational
interests, social skills, leadership, and creativity.
The correlations among the Everything DiSC scales and the NEO PI-R and the 16PF are shown in
Appendices 3 and 4. For the purposes of interpretation, a summary is provided here. For each
Everything DiSC scale, the ten strongest correlations with either the NEO PI-R or 16PF are listed.
Section 1: Everything DiSC® Assessment Research
Copyright ©2013 by John Wiley & Sons, Inc. All rights reserved. Permission to reproduce only when used in conjunction with Everything DiSC® assessments. 20
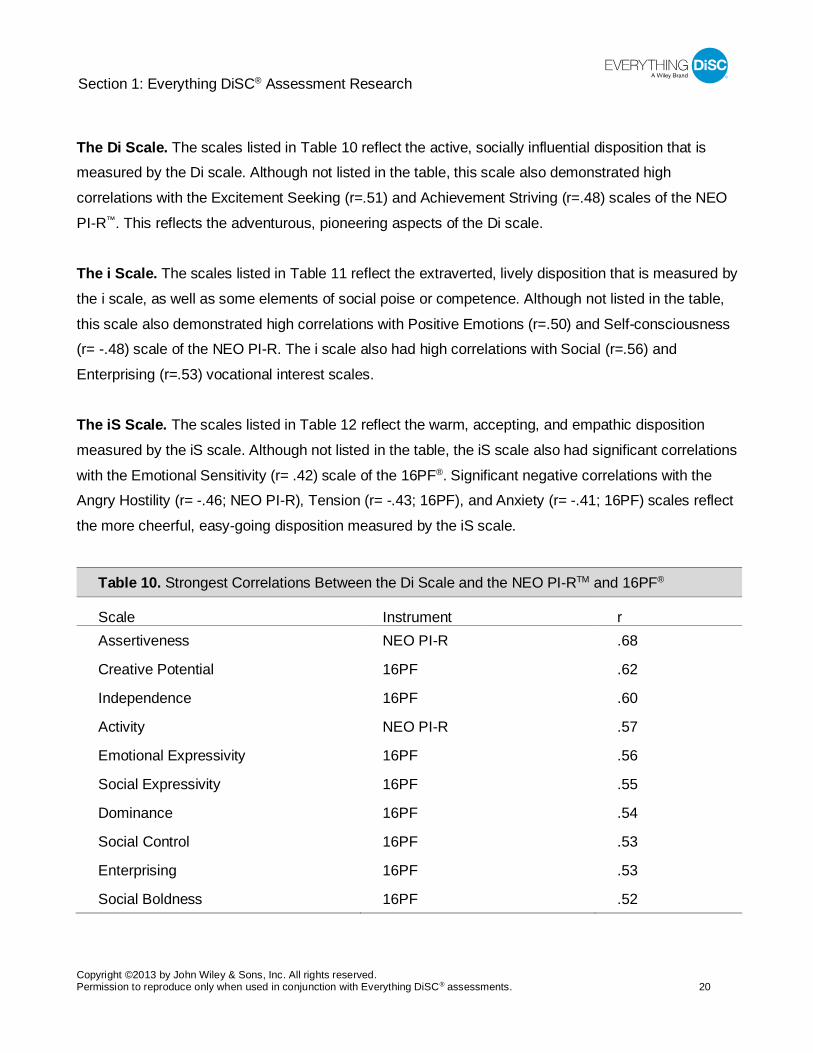
The Di Scale. The scales listed in Table 10 reflect the active, socially influential disposition that is measured by the Di scale. Although not listed in the table, this scale also demonstrated high
correlations with the Excitement Seeking (r=.51) and Achievement Striving (r=.48) scales of the NEO
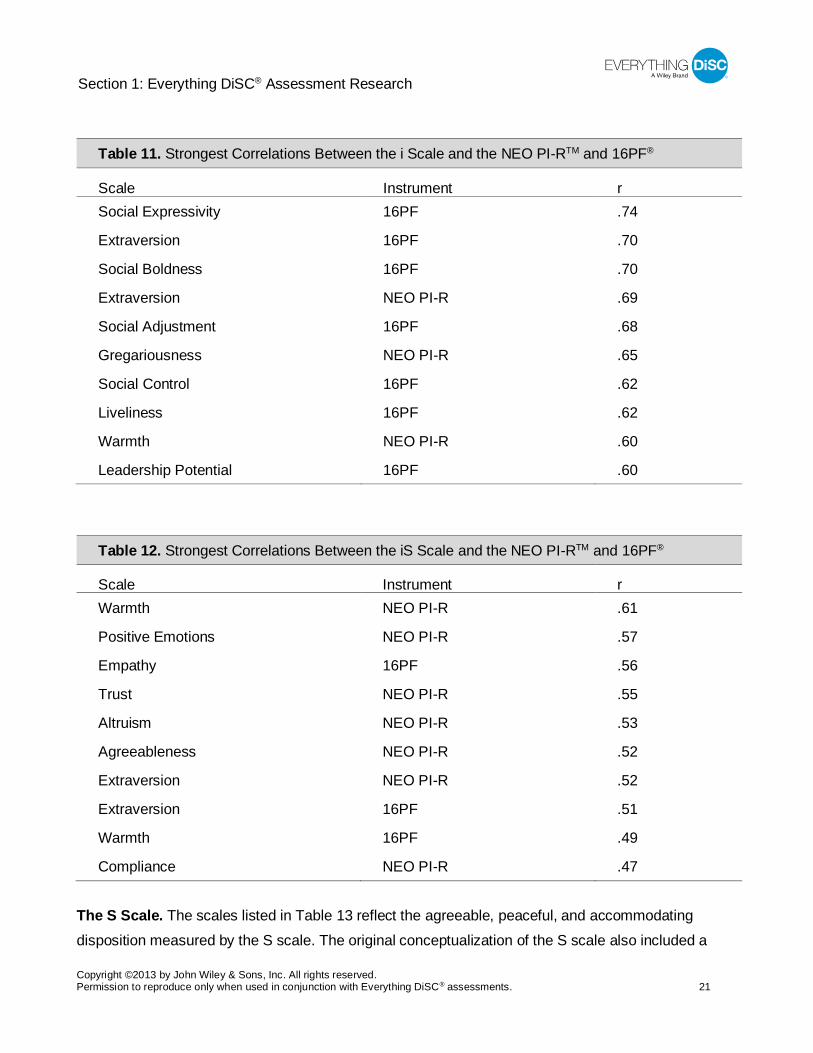
PI-R™. This reflects the adventurous, pioneering aspects of the Di scale. The i Scale. The scales listed in Table 11 reflect the extraverted, lively disposition that is measured by
the i scale, as well as some elements of social poise or competence. Although not listed in the table,
this scale also demonstrated high correlations with Positive Emotions (r=.50) and Self-consciousness (r= -.48) scale of the NEO PI-R. The i scale also had high correlations with Social (r=.56) and
Enterprising (r=.53) vocational interest scales.
The iS Scale. The scales listed in Table 12 reflect the warm, accepting, and empathic disposition
measured by the iS scale. Although not listed in the table, the iS scale also had significant correlations
with the Emotional Sensitivity (r= .42) scale of the 16PF®. Significant negative correlations with the Angry Hostility (r= -.46; NEO PI-R), Tension (r= -.43; 16PF), and Anxiety (r= -.41; 16PF) scales reflect
the more cheerful, easy-going disposition measured by the iS scale.
Table 10. Strongest Correlations Between the Di Scale and the NEO PI-RTM and 16PF®
Scale Instrument r Assertiveness NEO PI-R .68
Creative Potential 16PF .62
Independence 16PF .60
Activity NEO PI-R .57
Emotional Expressivity 16PF .56
Social Expressivity 16PF .55
Dominance 16PF .54
Social Control 16PF .53
Enterprising 16PF .53
Social Boldness 16PF .52
Section 1: Everything DiSC® Assessment Research
Copyright ©2013 by John Wiley & Sons, Inc. All rights reserved. Permission to reproduce only when used in conjunction with Everything DiSC® assessments. 21
Table 11. Strongest Correlations Between the i Scale and the NEO PI-RTM and 16PF®
Scale Instrument r Social Expressivity 16PF .74
Extraversion 16PF .70
Social Boldness 16PF .70
Extraversion NEO PI-R .69
Social Adjustment 16PF .68
Gregariousness NEO PI-R .65
Social Control 16PF .62
Liveliness 16PF .62
Warmth NEO PI-R .60
Leadership Potential 16PF .60
Table 12. Strongest Correlations Between the iS Scale and the NEO PI-RTM and 16PF®
Scale Instrument r Warmth NEO PI-R .61
Positive Emotions NEO PI-R .57
Empathy 16PF .56
Trust NEO PI-R .55
Altruism NEO PI-R .53
Agreeableness NEO PI-R .52
Extraversion NEO PI-R .52
Extraversion 16PF .51
Warmth 16PF .49
Compliance NEO PI-R .47
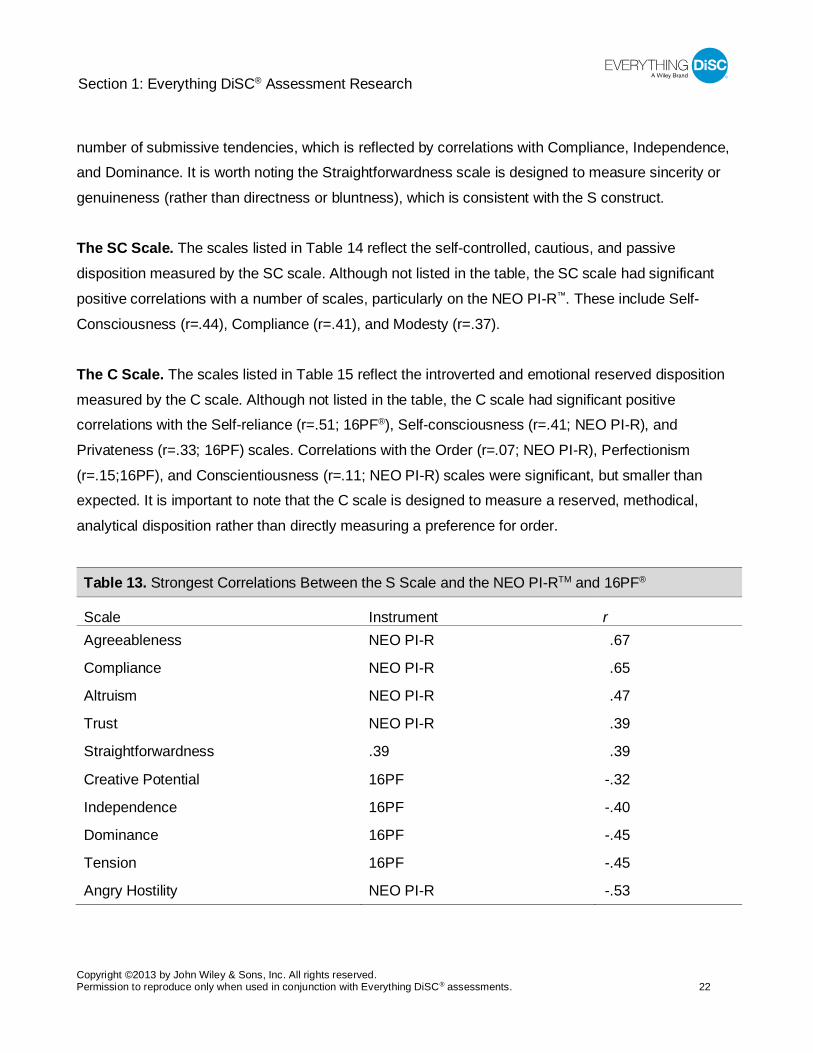
The S Scale. The scales listed in Table 13 reflect the agreeable, peaceful, and accommodating disposition measured by the S scale. The original conceptualization of the S scale also included a
Section 1: Everything DiSC® Assessment Research
Copyright ©2013 by John Wiley & Sons, Inc. All rights reserved. Permission to reproduce only when used in conjunction with Everything DiSC® assessments. 22
number of submissive tendencies, which is reflected by correlations with Compliance, Independence, and Dominance. It is worth noting the Straightforwardness scale is designed to measure sincerity or
genuineness (rather than directness or bluntness), which is consistent with the S construct.
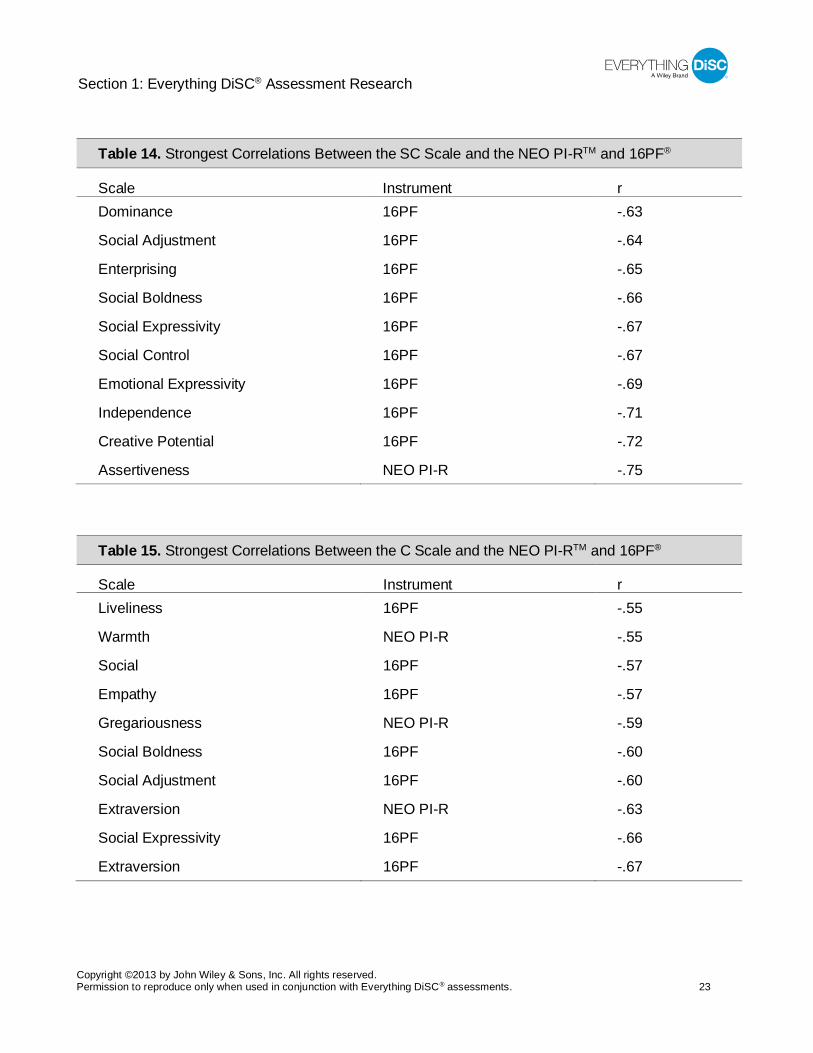
The SC Scale. The scales listed in Table 14 reflect the self-controlled, cautious, and passive
disposition measured by the SC scale. Although not listed in the table, the SC scale had significant
positive correlations with a number of scales, particularly on the NEO PI-R™. These include Self-
Consciousness (r=.44), Compliance (r=.41), and Modesty (r=.37).
The C Scale. The scales listed in Table 15 reflect the introverted and emotional reserved disposition
measured by the C scale. Although not listed in the table, the C scale had significant positive correlations with the Self-reliance (r=.51; 16PF®), Self-consciousness (r=.41; NEO PI-R), and
Privateness (r=.33; 16PF) scales. Correlations with the Order (r=.07; NEO PI-R), Perfectionism
(r=.15;16PF), and Conscientiousness (r=.11; NEO PI-R) scales were significant, but smaller than expected. It is important to note that the C scale is designed to measure a reserved, methodical,
analytical disposition rather than directly measuring a preference for order.
Table 13. Strongest Correlations Between the S Scale and the NEO PI-RTM and 16PF®
Scale Instrument r Agreeableness NEO PI-R .67
Compliance NEO PI-R .65
Altruism NEO PI-R .47
Trust NEO PI-R .39
Straightforwardness .39 .39
Creative Potential 16PF -.32
Independence 16PF -.40
Dominance 16PF -.45
Tension 16PF -.45
Angry Hostility NEO PI-R -.53
Section 1: Everything DiSC® Assessment Research
Copyright ©2013 by John Wiley & Sons, Inc. All rights reserved. Permission to reproduce only when used in conjunction with Everything DiSC® assessments. 23
Table 14. Strongest Correlations Between the SC Scale and the NEO PI-RTM and 16PF®
Scale Instrument r Dominance 16PF -.63
Social Adjustment 16PF -.64
Enterprising 16PF -.65
Social Boldness 16PF -.66
Social Expressivity 16PF -.67
Social Control 16PF -.67
Emotional Expressivity 16PF -.69
Independence 16PF -.71
Creative Potential 16PF -.72
Assertiveness NEO PI-R -.75
Table 15. Strongest Correlations Between the C Scale and the NEO PI-RTM and 16PF®
Scale Instrument r Liveliness 16PF -.55
Warmth NEO PI-R -.55
Social 16PF -.57
Empathy 16PF -.57
Gregariousness NEO PI-R -.59
Social Boldness 16PF -.60
Social Adjustment 16PF -.60
Extraversion NEO PI-R -.63
Social Expressivity 16PF -.66
Extraversion 16PF -.67
Section 1: Everything DiSC® Assessment Research
Copyright ©2013 by John Wiley & Sons, Inc. All rights reserved. Permission to reproduce only when used in conjunction with Everything DiSC® assessments. 24
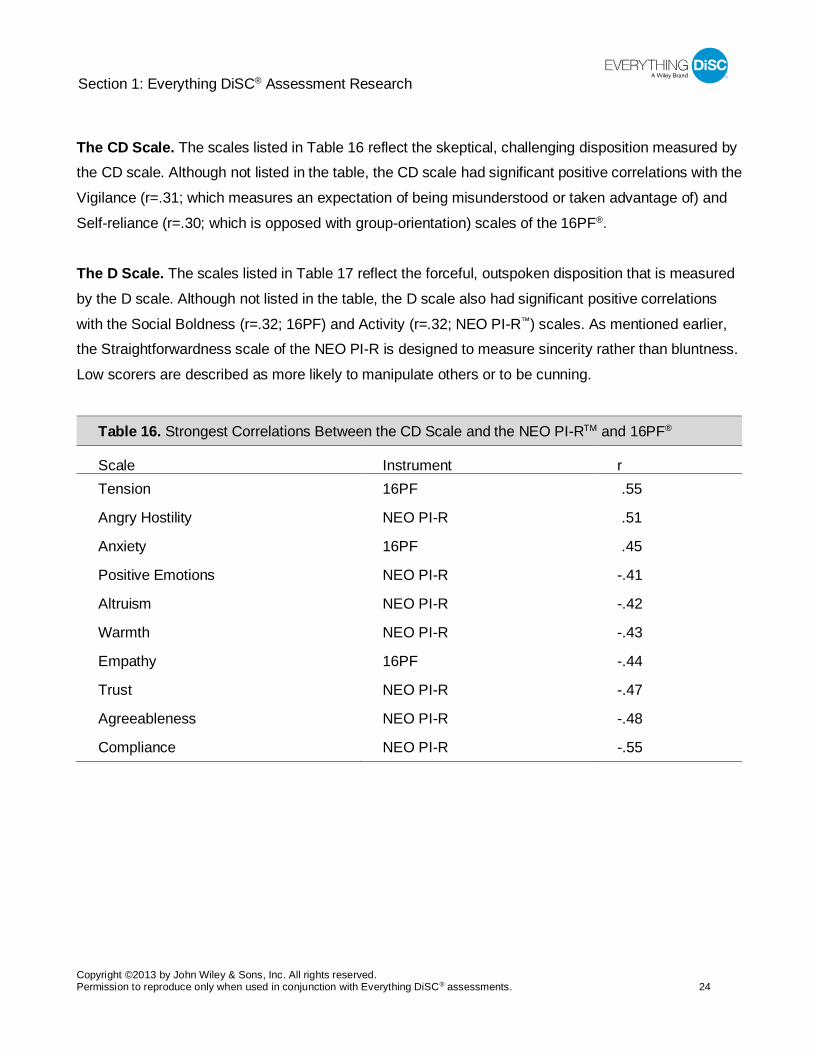
The CD Scale. The scales listed in Table 16 reflect the skeptical, challenging disposition measured by the CD scale. Although not listed in the table, the CD scale had significant positive correlations with the
Vigilance (r=.31; which measures an expectation of being misunderstood or taken advantage of) and
Self-reliance (r=.30; which is opposed with group-orientation) scales of the 16PF®.
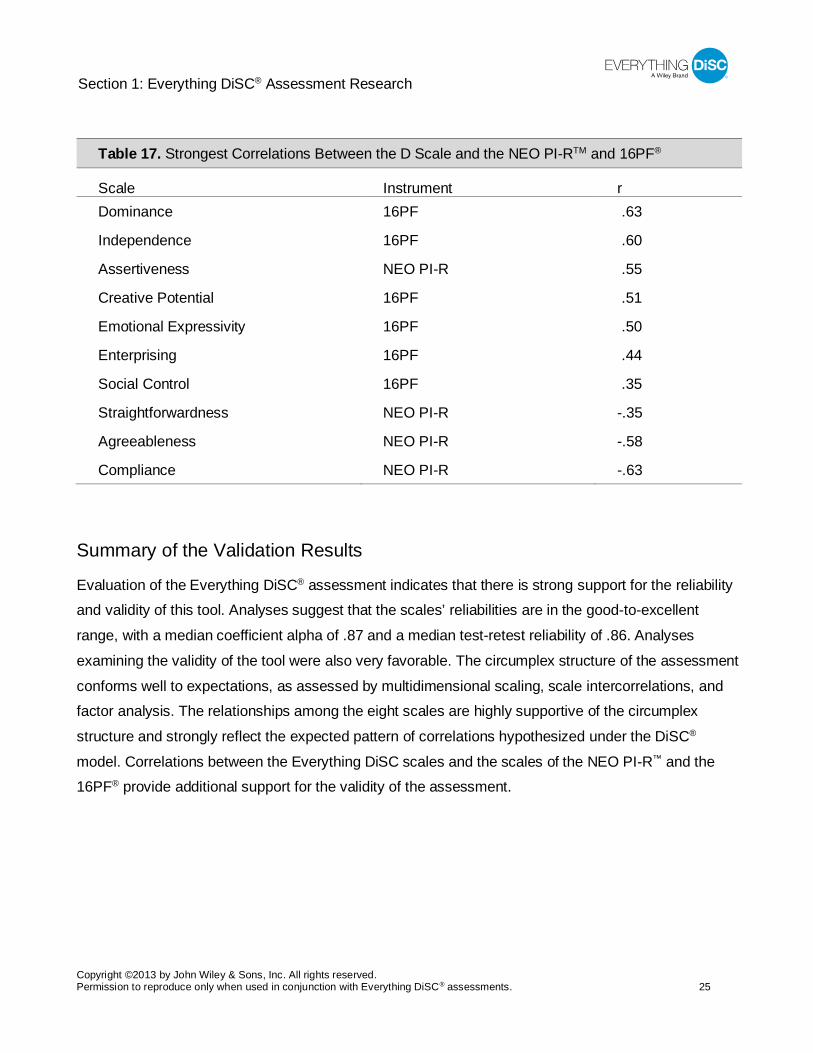
The D Scale. The scales listed in Table 17 reflect the forceful, outspoken disposition that is measured
by the D scale. Although not listed in the table, the D scale also had significant positive correlations
with the Social Boldness (r=.32; 16PF) and Activity (r=.32; NEO PI-R™) scales. As mentioned earlier, the Straightforwardness scale of the NEO PI-R is designed to measure sincerity rather than bluntness.
Low scorers are described as more likely to manipulate others or to be cunning.
Table 16. Strongest Correlations Between the CD Scale and the NEO PI-RTM and 16PF®
Scale Instrument r Tension 16PF .55
Angry Hostility NEO PI-R .51
Anxiety 16PF .45
Positive Emotions NEO PI-R -.41
Altruism NEO PI-R -.42
Warmth NEO PI-R -.43
Empathy 16PF -.44
Trust NEO PI-R -.47
Agreeableness NEO PI-R -.48
Compliance NEO PI-R -.55
Section 1: Everything DiSC® Assessment Research
Copyright ©2013 by John Wiley & Sons, Inc. All rights reserved. Permission to reproduce only when used in conjunction with Everything DiSC® assessments. 25
Table 17. Strongest Correlations Between the D Scale and the NEO PI-RTM and 16PF®
Scale Instrument r Dominance 16PF .63
Independence 16PF .60
Assertiveness NEO PI-R .55
Creative Potential 16PF .51
Emotional Expressivity 16PF .50
Enterprising 16PF .44
Social Control 16PF .35
Straightforwardness NEO PI-R -.35
Agreeableness NEO PI-R -.58
Compliance NEO PI-R -.63
Summary of the Validation Results
Evaluation of the Everything DiSC® assessment indicates that there is strong support for the reliability and validity of this tool. Analyses suggest that the scales’ reliabilities are in the good-to-excellent
range, with a median coefficient alpha of .87 and a median test-retest reliability of .86. Analyses
examining the validity of the tool were also very favorable. The circumplex structure of the assessment
conforms well to expectations, as assessed by multidimensional scaling, scale intercorrelations, and factor analysis. The relationships among the eight scales are highly supportive of the circumplex
structure and strongly reflect the expected pattern of correlations hypothesized under the DiSC®
model. Correlations between the Everything DiSC scales and the scales of the NEO PI-R™ and the 16PF® provide additional support for the validity of the assessment.
Section 2: Everything DiSC® Management Research
Copyright ©2013 by John Wiley & Sons, Inc. All rights reserved. Permission to reproduce only when used in conjunction with Everything DiSC® assessments. 26
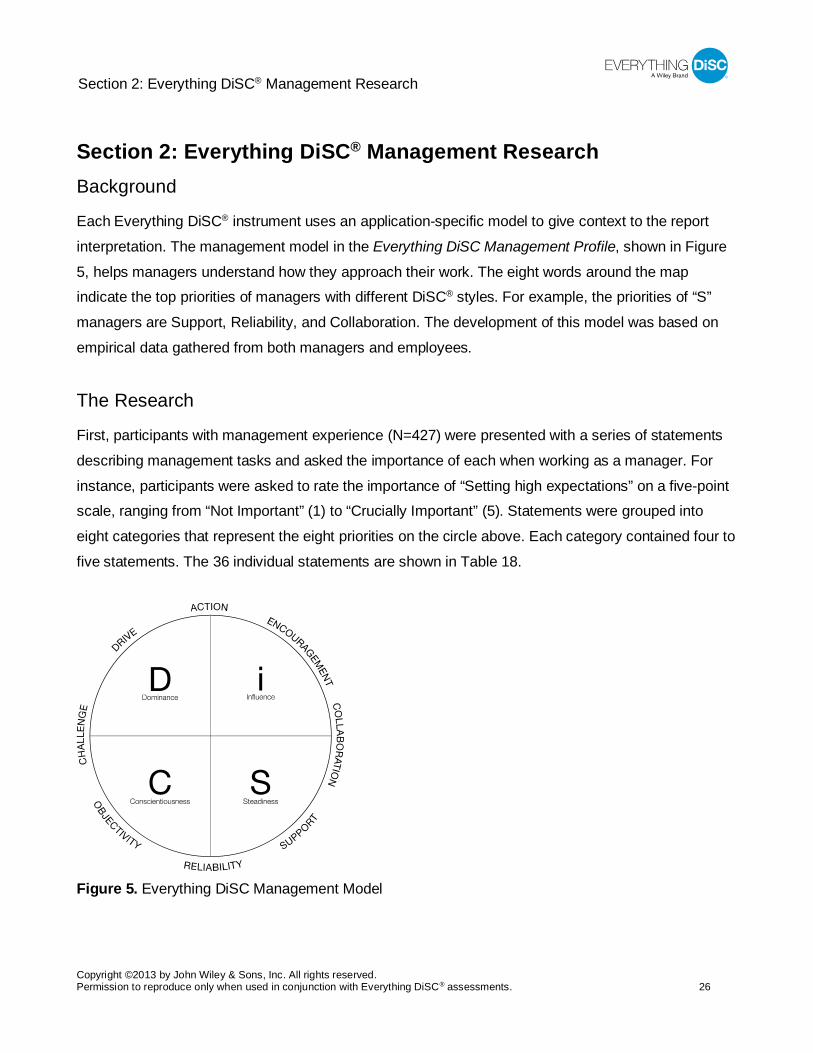
Section 2: Everything DiSC® Management Research Background
Each Everything DiSC® instrument uses an application-specific model to give context to the report
interpretation. The management model in the Everything DiSC Management Profile, shown in Figure
5, helps managers understand how they approach their work. The eight words around the map indicate the top priorities of managers with different DiSC® styles. For example, the priorities of “S”
managers are Support, Reliability, and Collaboration. The development of this model was based on
empirical data gathered from both managers and employees.
The Research
First, participants with management experience (N=427) were presented with a series of statements
describing management tasks and asked the importance of each when working as a manager. For
instance, participants were asked to rate the importance of “Setting high expectations” on a five-point scale, ranging from “Not Important” (1) to “Crucially Important” (5). Statements were grouped into
eight categories that represent the eight priorities on the circle above. Each category contained four to
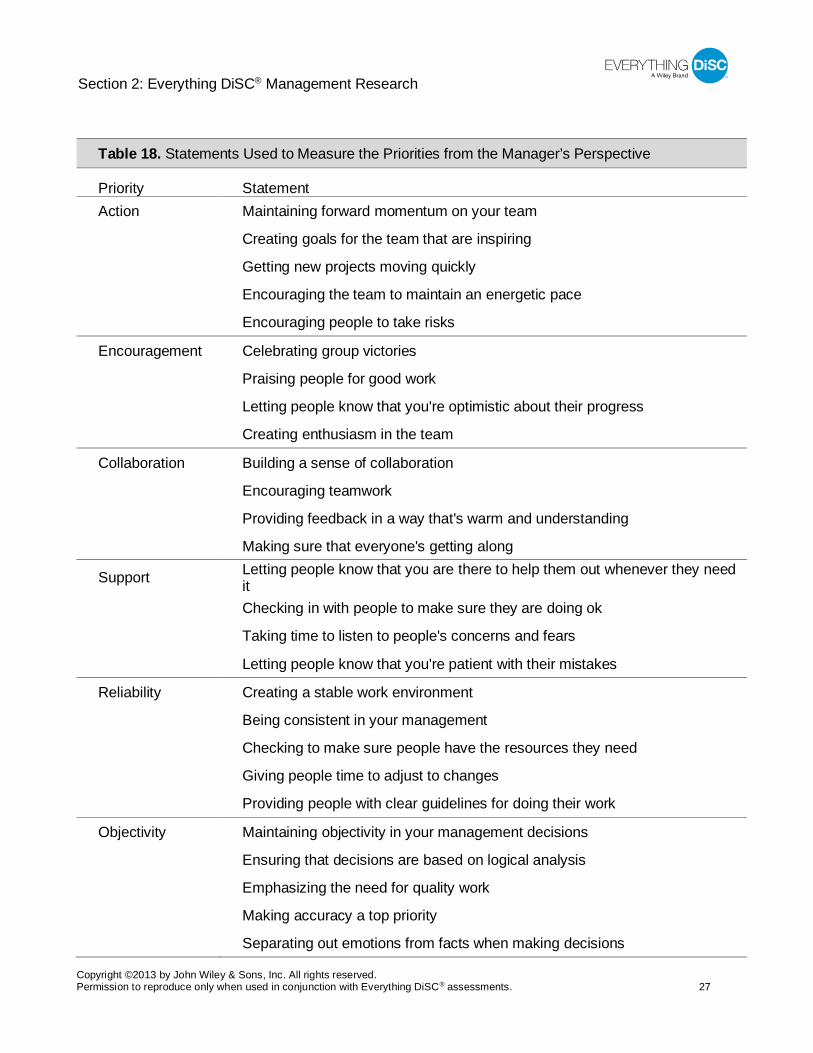
five statements. The 36 individual statements are shown in Table 18.
Figure 5. Everything DiSC Management Model
Section 2: Everything DiSC® Management Research
Copyright ©2013 by John Wiley & Sons, Inc. All rights reserved. Permission to reproduce only when used in conjunction with Everything DiSC® assessments. 27
Table 18. Statements Used to Measure the Priorities from the Manager’s Perspective
Priority Statement Action Maintaining forward momentum on your team
Creating goals for the team that are inspiring
Getting new projects moving quickly
Encouraging the team to maintain an energetic pace
Encouraging people to take risks
Encouragement Celebrating group victories
Praising people for good work
Letting people know that you're optimistic about their progress
Creating enthusiasm in the team
Collaboration Building a sense of collaboration
Encouraging teamwork
Providing feedback in a way that's warm and understanding
Making sure that everyone's getting along
Support Letting people know that you are there to help them out whenever they need it
Checking in with people to make sure they are doing ok
Taking time to listen to people's concerns and fears
Letting people know that you're patient with their mistakes
Reliability Creating a stable work environment
Being consistent in your management
Checking to make sure people have the resources they need
Giving people time to adjust to changes
Providing people with clear guidelines for doing their work
Objectivity Maintaining objectivity in your management decisions
Ensuring that decisions are based on logical analysis
Emphasizing the need for quality work
Making accuracy a top priority
Separating out emotions from facts when making decisions
Section 2: Everything DiSC® Management Research
Copyright ©2013 by John Wiley & Sons, Inc. All rights reserved. Permission to reproduce only when used in conjunction with Everything DiSC® assessments. 28
Table 18. Continued
Priority Statement Challenge Challenging ideas that don't make sense to you
Questioning employee's actions when they don't seem logical to you
Letting people know when they aren't performing up to your standards
Questioning procedures or practices that aren't efficient
Providing people with new challenges
Drive Constantly pushing yourself and others toward results
Creating a sense of urgency in the team
Getting results that are practical and concrete
Setting high expectations
After participants rated each statement, the average response for statements within a priority category was calculated. Consequently, all participants had a category score for all eight priorities. These
category scores were then ipsatized by subtracting a mean score across all statements. Ipsatizing
controls for response bias and ensures that the category scores reflect the relative importance of the eight priorities for a particular participant.
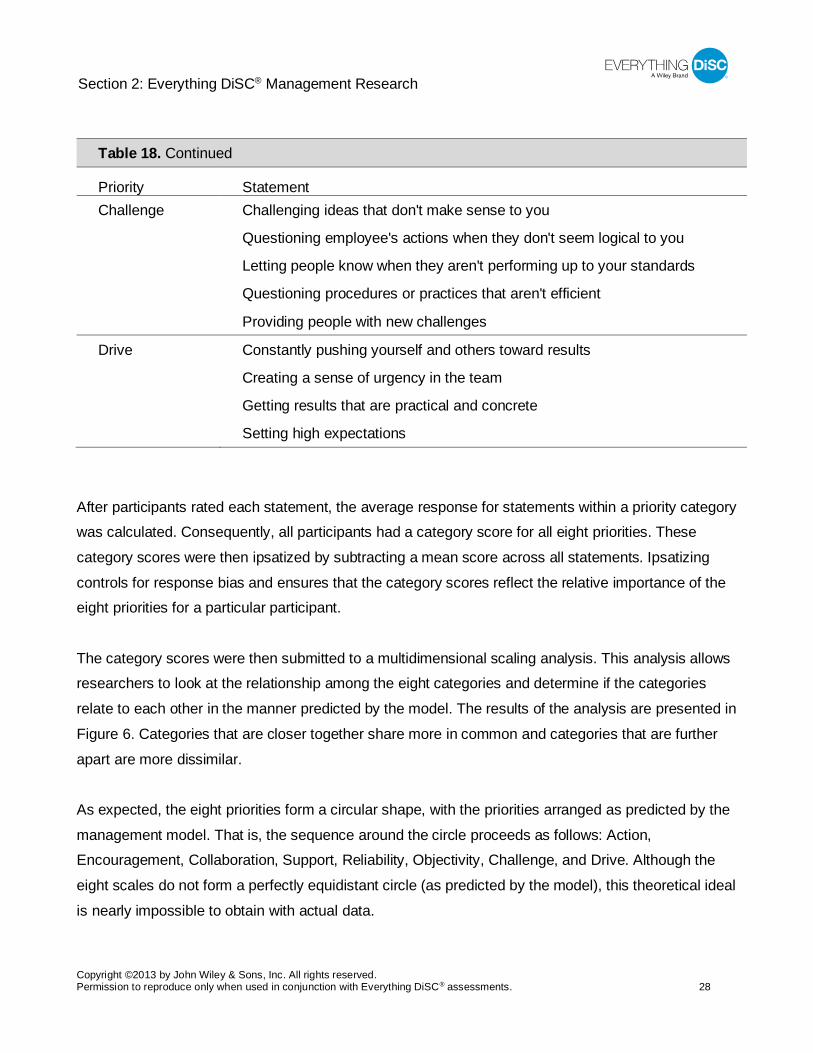
The category scores were then submitted to a multidimensional scaling analysis. This analysis allows researchers to look at the relationship among the eight categories and determine if the categories
relate to each other in the manner predicted by the model. The results of the analysis are presented in
Figure 6. Categories that are closer together share more in common and categories that are further
apart are more dissimilar.
As expected, the eight priorities form a circular shape, with the priorities arranged as predicted by the
management model. That is, the sequence around the circle proceeds as follows: Action, Encouragement, Collaboration, Support, Reliability, Objectivity, Challenge, and Drive. Although the
eight scales do not form a perfectly equidistant circle (as predicted by the model), this theoretical ideal
is nearly impossible to obtain with actual data.
Section 2: Everything DiSC® Management Research
Copyright ©2013 by John Wiley & Sons, Inc. All rights reserved. Permission to reproduce only when used in conjunction with Everything DiSC® assessments. 29
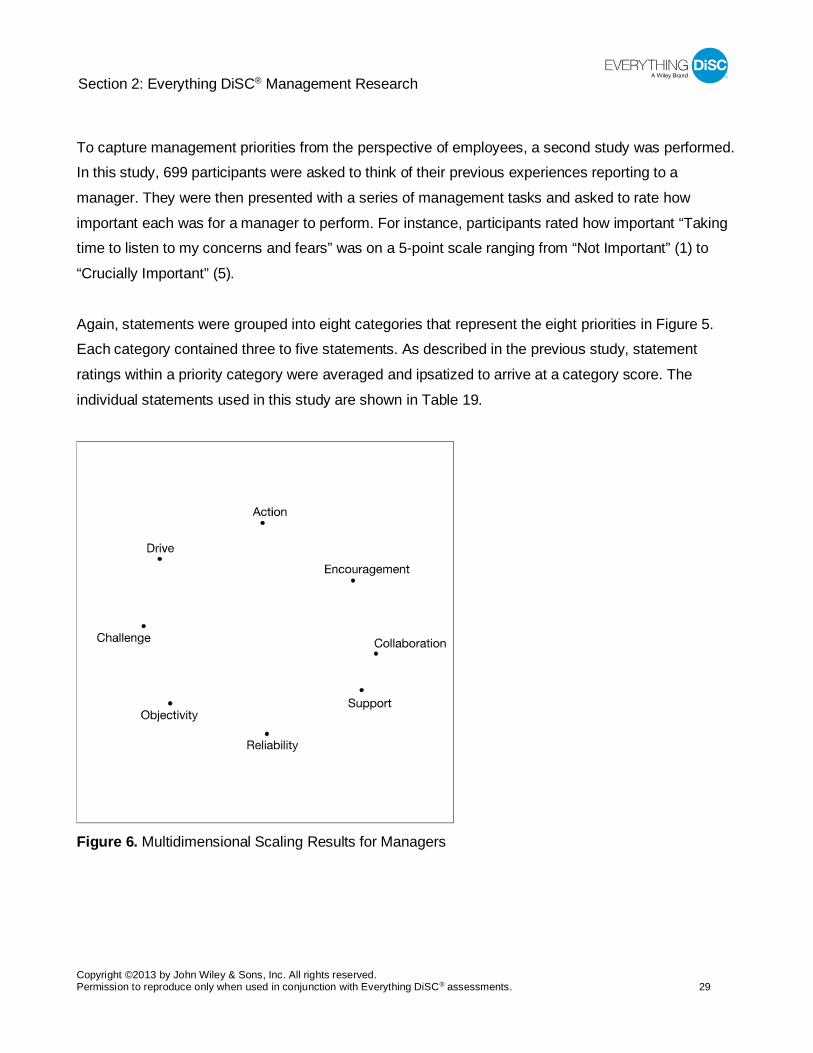
To capture management priorities from the perspective of employees, a second study was performed. In this study, 699 participants were asked to think of their previous experiences reporting to a
manager. They were then presented with a series of management tasks and asked to rate how
important each was for a manager to perform. For instance, participants rated how important “Taking time to listen to my concerns and fears” was on a 5-point scale ranging from “Not Important” (1) to
“Crucially Important” (5).
Again, statements were grouped into eight categories that represent the eight priorities in Figure 5. Each category contained three to five statements. As described in the previous study, statement
ratings within a priority category were averaged and ipsatized to arrive at a category score. The
individual statements used in this study are shown in Table 19.
Figure 6. Multidimensional Scaling Results for Managers
Section 2: Everything DiSC® Management Research
Copyright ©2013 by John Wiley & Sons, Inc. All rights reserved. Permission to reproduce only when used in conjunction with Everything DiSC® assessments. 30
Table 19. Statements Used to Measure the Priorities from an Employee’s Perspective
Priority Statement Drive Setting high expectations
Creating a sense of urgency in the team
Getting quick results
Constantly pushing himself/herself and others toward results
Action Maintaining forward momentum on our team
Creating goals for the team that are inspiring
Encouraging the team to maintain an energetic pace
Encouraging me to take risks
Encouragement Celebrating group victories
Letting me know that he/she is optimistic about my progress
Creating enthusiasm in the team
Collaboration Providing feedback in a way that's warm and understanding
Building a sense of collaboration
Encouraging teamwork
Making sure that everyone's getting along
Support Letting me know that he/she is there to help me out whenever I need it
Checking in with me to make sure I'm doing ok
Taking time to listen to my concerns and fears
Letting me know that he/she is patient with my mistakes
Reliability Creating a stable work environment
Being consistent in his/her management
Checking to make sure I have the resources I need
Giving me time to adjust to changes
Providing me with clear guidelines for doing my work
Section 2: Everything DiSC® Management Research
Copyright ©2013 by John Wiley & Sons, Inc. All rights reserved. Permission to reproduce only when used in conjunction with Everything DiSC® assessments. 31
Table 19. Continued
Priority Statement Objectivity Emphasizing the need for quality work
Ensuring that decisions are based on logical analysis
Maintaining objectivity in his/her management decisions
Making accuracy a top priority
Separating out emotions from facts when making decisions
Challenge Challenging ideas that don't make sense to him/her
Questioning employee's actions when they don't seem logical
Questioning procedures or practices that aren't efficient
Providing me with new challenges
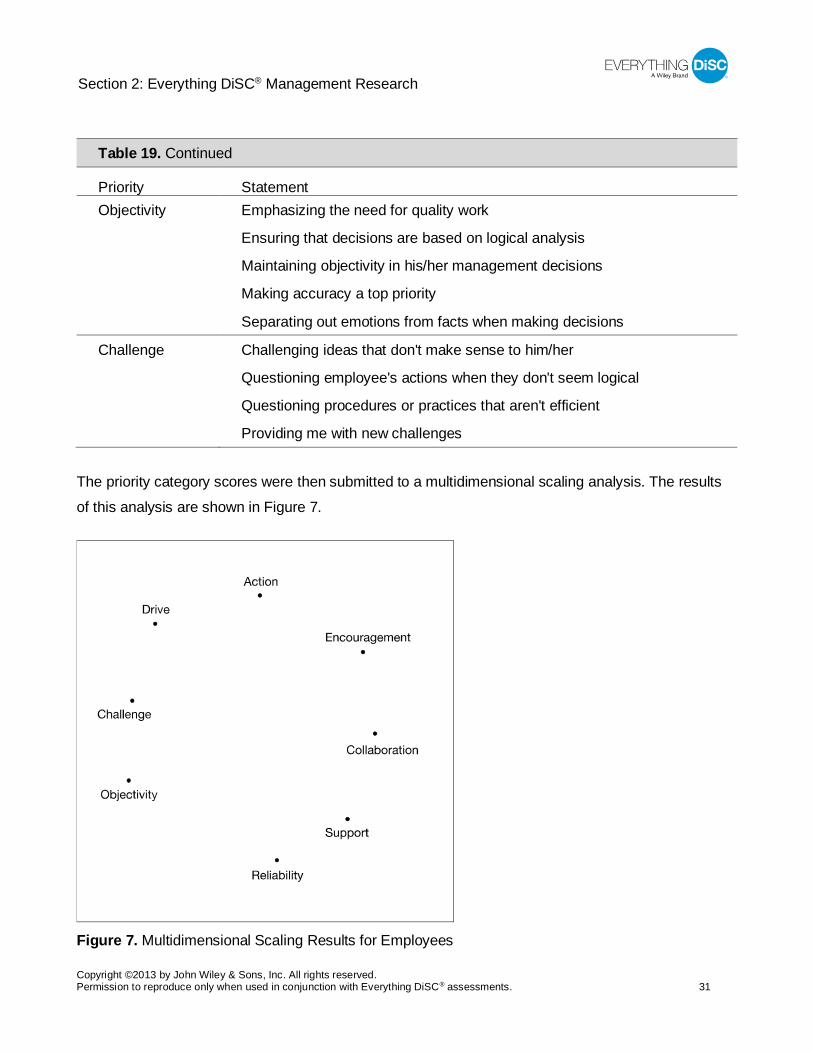
The priority category scores were then submitted to a multidimensional scaling analysis. The results
of this analysis are shown in Figure 7.
Figure 7. Multidimensional Scaling Results for Employees
Section 2: Everything DiSC® Management Research
Copyright ©2013 by John Wiley & Sons, Inc. All rights reserved. Permission to reproduce only when used in conjunction with Everything DiSC® assessments. 32
As with the manager data, the priority categories are arranged in a circle. Further, the categories are plotted in the expected order: Action, Encouragement, Collaboration, Support, Reliability, Objectivity,
Challenge, and Drive. The categories are not spaced in a perfectly even manner, but, again, this
standard is almost impossible to meet with real data.
Summary of the Validation Results
Overall, both of these studies provide strong support for the Everything DiSC® Management model.
Two separate data sets addressing management priorities from the perspective of both managers and
employees confirm that the eight priorities are arranged in a circular fashion in the predicted order. This type of empirical support should give managers confidence that the Everything DiSC
Management model accurately reflects real-life management environments and is useful for
understanding various approaches to management.
Section 3: Everything DiSC® Sales Research
Copyright ©2013 by John Wiley & Sons, Inc. All rights reserved. Permission to reproduce only when used in conjunction with Everything DiSC® assessments. 33
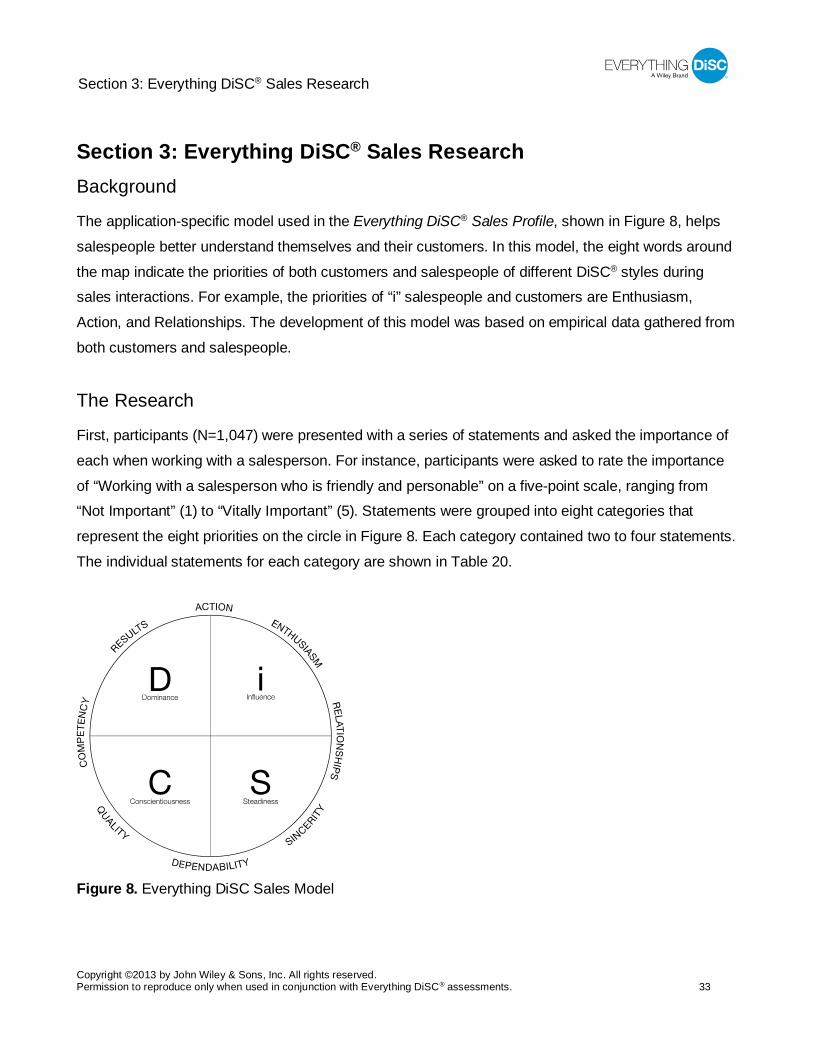
Section 3: Everything DiSC® Sales Research Background
The application-specific model used in the Everything DiSC® Sales Profile, shown in Figure 8, helps
salespeople better understand themselves and their customers. In this model, the eight words around
the map indicate the priorities of both customers and salespeople of different DiSC® styles during sales interactions. For example, the priorities of “i” salespeople and customers are Enthusiasm,
Action, and Relationships. The development of this model was based on empirical data gathered from
both customers and salespeople.
The Research
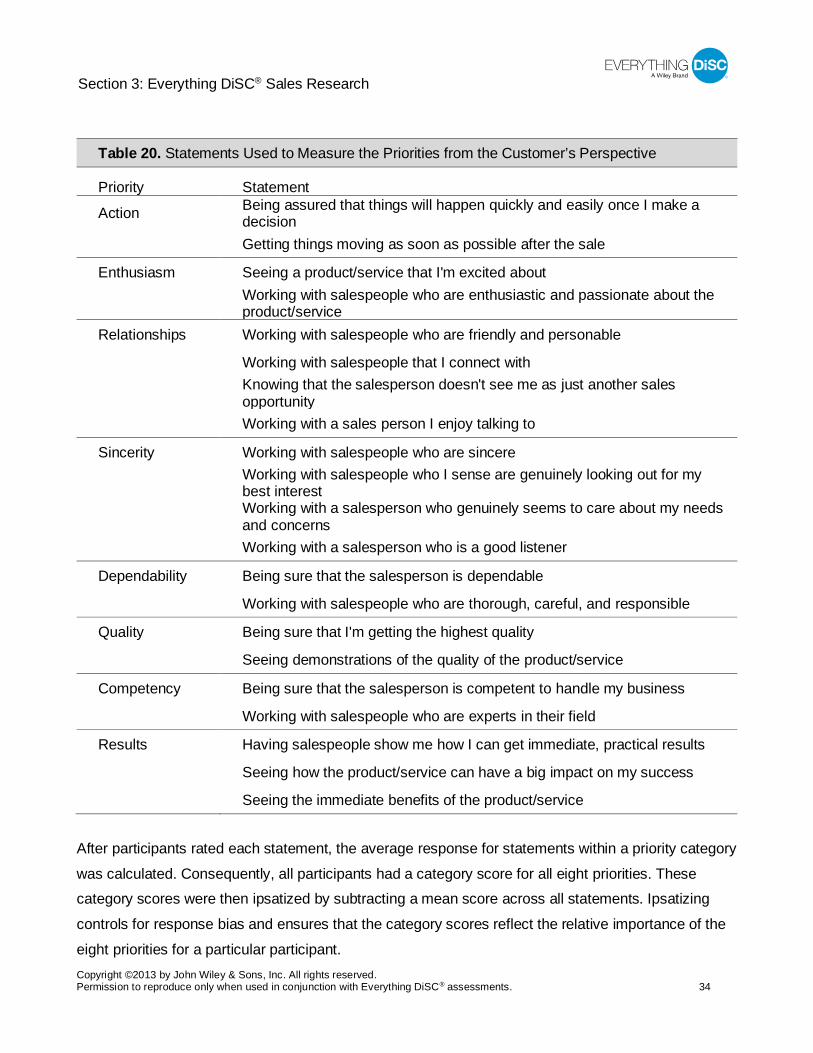
First, participants (N=1,047) were presented with a series of statements and asked the importance of
each when working with a salesperson. For instance, participants were asked to rate the importance
of “Working with a salesperson who is friendly and personable” on a five-point scale, ranging from “Not Important” (1) to “Vitally Important” (5). Statements were grouped into eight categories that
represent the eight priorities on the circle in Figure 8. Each category contained two to four statements.
The individual statements for each category are shown in Table 20.
Figure 8. Everything DiSC Sales Model
Section 3: Everything DiSC® Sales Research
Copyright ©2013 by John Wiley & Sons, Inc. All rights reserved. Permission to reproduce only when used in conjunction with Everything DiSC® assessments. 34
Table 20. Statements Used to Measure the Priorities from the Customer’s Perspective
Priority Statement
Action Being assured that things will happen quickly and easily once I make a decision
Getting things moving as soon as possible after the sale
Enthusiasm Seeing a product/service that I'm excited about
Working with salespeople who are enthusiastic and passionate about the product/service
Relationships Working with salespeople who are friendly and personable
Working with salespeople that I connect with
Knowing that the salesperson doesn't see me as just another sales opportunity
Working with a sales person I enjoy talking to
Sincerity Working with salespeople who are sincere
Working with salespeople who I sense are genuinely looking out for my best interest
Working with a salesperson who genuinely seems to care about my needs and concerns
Working with a salesperson who is a good listener
Dependability Being sure that the salesperson is dependable
Working with salespeople who are thorough, careful, and responsible
Quality Being sure that I'm getting the highest quality
Seeing demonstrations of the quality of the product/service
Competency Being sure that the salesperson is competent to handle my business
Working with salespeople who are experts in their field
Results Having salespeople show me how I can get immediate, practical results
Seeing how the product/service can have a big impact on my success
Seeing the immediate benefits of the product/service
After participants rated each statement, the average response for statements within a priority category
was calculated. Consequently, all participants had a category score for all eight priorities. These category scores were then ipsatized by subtracting a mean score across all statements. Ipsatizing
controls for response bias and ensures that the category scores reflect the relative importance of the
eight priorities for a particular participant.
Section 3: Everything DiSC® Sales Research
Copyright ©2013 by John Wiley & Sons, Inc. All rights reserved. Permission to reproduce only when used in conjunction with Everything DiSC® assessments. 35
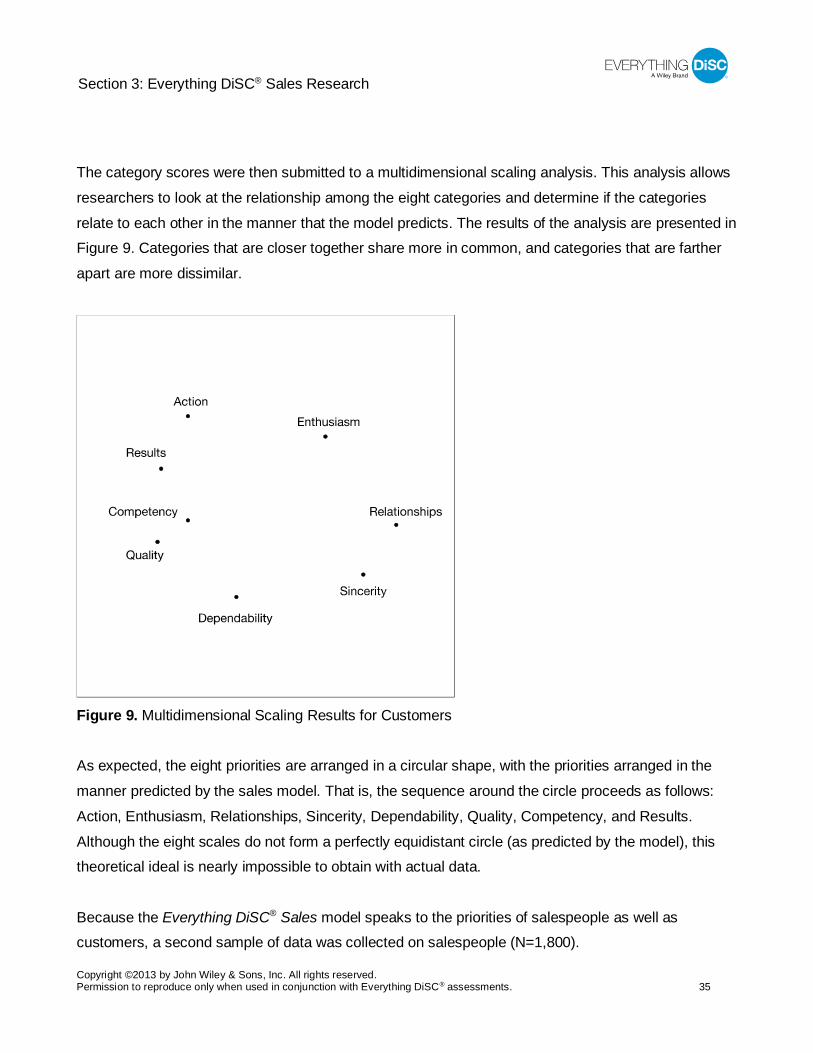
The category scores were then submitted to a multidimensional scaling analysis. This analysis allows
researchers to look at the relationship among the eight categories and determine if the categories
relate to each other in the manner that the model predicts. The results of the analysis are presented in Figure 9. Categories that are closer together share more in common, and categories that are farther
apart are more dissimilar.
Figure 9. Multidimensional Scaling Results for Customers
As expected, the eight priorities are arranged in a circular shape, with the priorities arranged in the
manner predicted by the sales model. That is, the sequence around the circle proceeds as follows:
Action, Enthusiasm, Relationships, Sincerity, Dependability, Quality, Competency, and Results.
Although the eight scales do not form a perfectly equidistant circle (as predicted by the model), this theoretical ideal is nearly impossible to obtain with actual data.
Because the Everything DiSC® Sales model speaks to the priorities of salespeople as well as customers, a second sample of data was collected on salespeople (N=1,800).
Section 3: Everything DiSC® Sales Research
Copyright ©2013 by John Wiley & Sons, Inc. All rights reserved. Permission to reproduce only when used in conjunction with Everything DiSC® assessments. 36
In this study, salespeople were presented with sales behaviors such as “Showing the customer that
you're an expert in your field,” and asked to rate the importance of each statement on a five-point
scale, ranging from “Not Important” (1) to “Vitally Important” (5). Each category contained three to five statements. Sample statements for each category are shown in Table 21.
Table 21. Statements Used to Measure the Priorities from the Salesperson’s Perspective
Priority Statement Action Showing the customer that you can make things happen quickly and easily
Helping the customer see how they can use your product/service immediately
Inspiring the customer that your product/service can help them right away
Enthusiasm Getting the customer excited about your product/service
Creating enthusiasm in the customer
Having fun with the customer
Relationships Developing a comfortable, friendly relationship with the customer
Building a personal connection with the customer
Being friendly, warm, and personable
Showing that you care about the customer as a person, not just as a customer
Showing the customer that you empathize with his/her needs and concerns
Sincerity Showing that you're sincere
Showing that you're genuinely looking out for the customer's best interest
Showing that you truly care about the customer's problems
Dependability Showing that you and your product/service are a dependable choice
Showing that you'll be available to provide support after the sale
Showing that you're thorough and careful
Section 3: Everything DiSC® Sales Research
Copyright ©2013 by John Wiley & Sons, Inc. All rights reserved. Permission to reproduce only when used in conjunction with Everything DiSC® assessments. 37
Table 21. Continued
Priority Statement Quality Explaining the quality of your product/service
Showing that you can back up your claims with evidence
Making sure customers get all of the information they need to make an informed decision
Competency Demonstrating your expertise on the product/service you're selling
Showing the customer that you're an expert in your field
Showing the customer that you can get things done without wasting a lot of their time
Backing up claims with specific information
Results Showing the customer how you can get them immediate, practical results
Showing the customer that you can have an impact on their success
Getting the customer to see the benefits of your product/service
As described in the previous study, statement ratings within a priority category were averaged and ipsatized to arrive at a category score. The category scores were then submitted to a
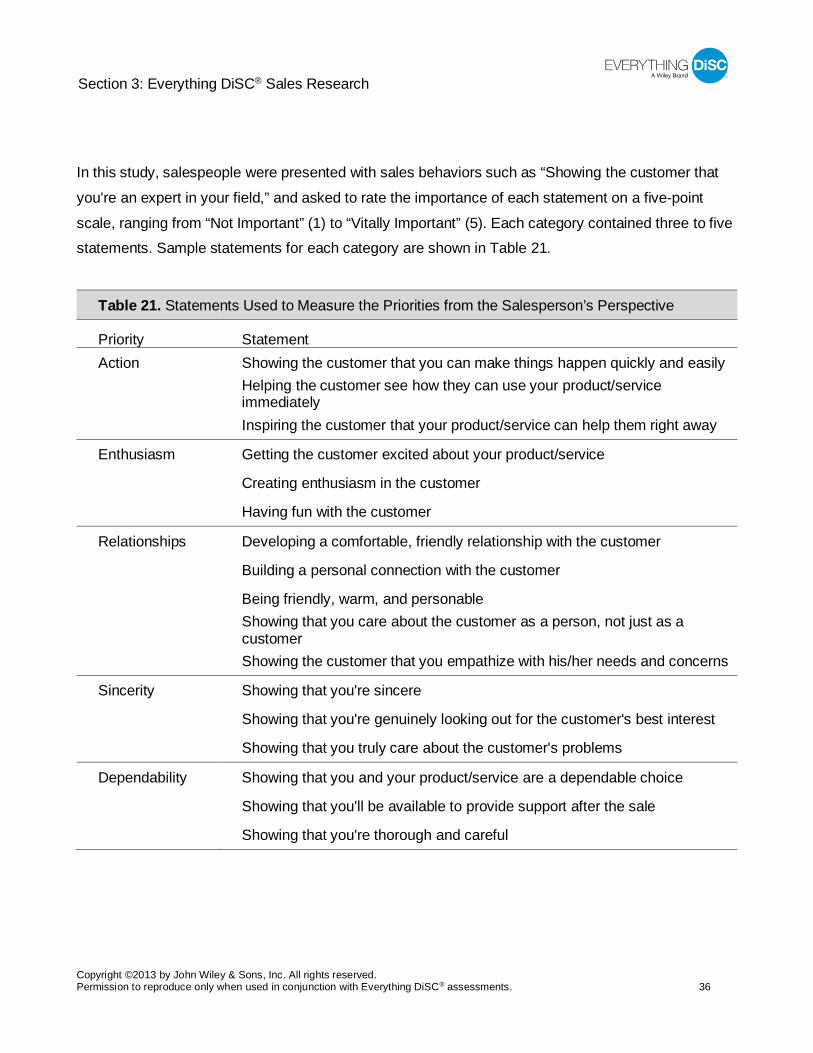
multidimensional scaling analysis. The results of this analysis are shown in Figure 10.
As with the customer data, the priority categories are arranged in a circle. Further, the categories are
plotted in the expected order: Action, Enthusiasm, Relationships, Sincerity, Dependability, Quality,
Competency, and Results. The categories are not spaced in a perfectly even manner, but again, this standard is almost impossible to meet with real data.
Section 3: Everything DiSC® Sales Research
Copyright ©2013 by John Wiley & Sons, Inc. All rights reserved. Permission to reproduce only when used in conjunction with Everything DiSC® assessments. 38
Figure 10. Multidimensional Scaling Results for Salespeople
Summary of the Validation Results
Overall, both of these studies provide strong support for the Everything DiSC Sales® model. Two separate data sets addressing both customers’ and salespeople’s priorities confirm that the eight
priorities are arranged in a circular fashion in the predicted order. This type of empirical support
should give salespeople confidence that the Everything DiSC Sales model accurately reflects real-life sales environments and is useful for understanding themselves and their customers.
Section 4: Everything DiSC Workplace® Research
Copyright ©2013 by John Wiley & Sons, Inc. All rights reserved. Permission to reproduce only when used in conjunction with Everything DiSC® assessments. 39
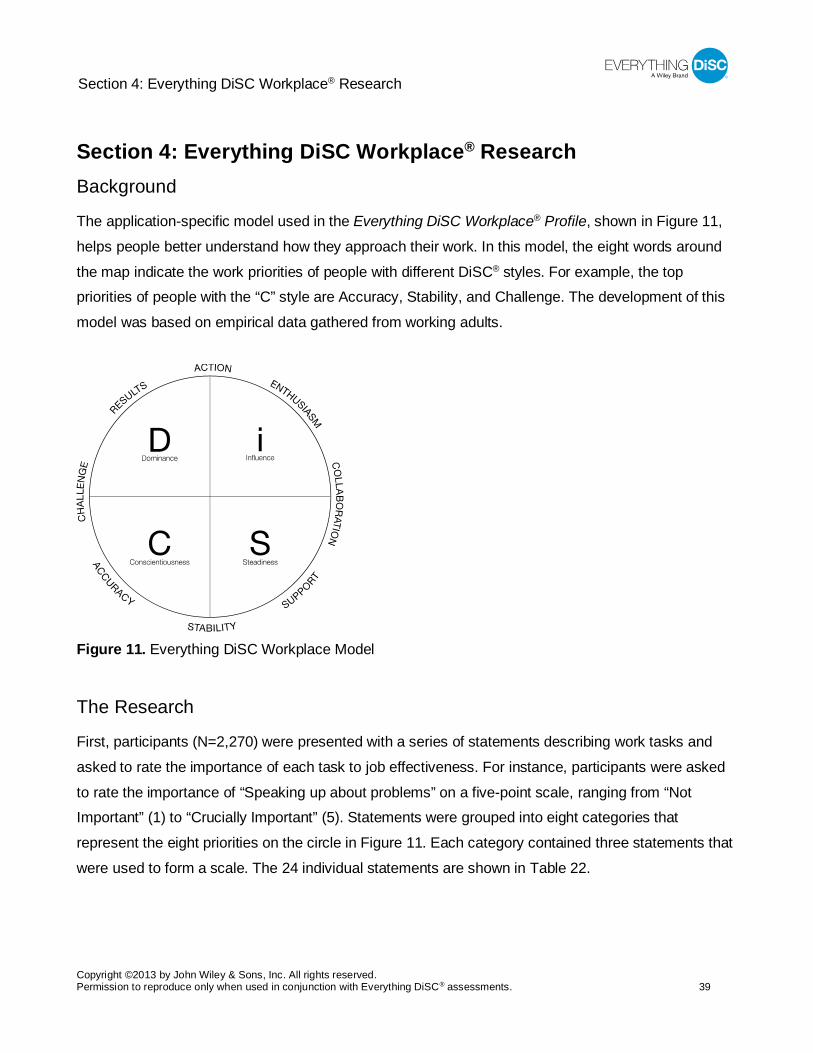
Section 4: Everything DiSC Workplace® Research Background
The application-specific model used in the Everything DiSC Workplace® Profile, shown in Figure 11,
helps people better understand how they approach their work. In this model, the eight words around
the map indicate the work priorities of people with different DiSC® styles. For example, the top priorities of people with the “C” style are Accuracy, Stability, and Challenge. The development of this
model was based on empirical data gathered from working adults.
Figure 11. Everything DiSC Workplace Model
The Research
First, participants (N=2,270) were presented with a series of statements describing work tasks and
asked to rate the importance of each task to job effectiveness. For instance, participants were asked
to rate the importance of “Speaking up about problems” on a five-point scale, ranging from “Not Important” (1) to “Crucially Important” (5). Statements were grouped into eight categories that
represent the eight priorities on the circle in Figure 11. Each category contained three statements that
were used to form a scale. The 24 individual statements are shown in Table 22.
Section 4: Everything DiSC Workplace® Research
Copyright ©2013 by John Wiley & Sons, Inc. All rights reserved. Permission to reproduce only when used in conjunction with Everything DiSC® assessments. 40
After participants rated each statement, these statements were ipsatized by subtracting a mean score across all statements. Ipsatizing controls for response bias and ensures that the item ratings reflect
the relative importance of the eight priorities for a particular participant. The average ipsatized
response for statements within a priority category was then calculated. Consequently, all participants had a category score for all eight priorities.
Table 22. Statements Used to Measure Each of the Eight Workplace Priorities
Priority Statement Action Remaining active Being on the lookout for new opportunities Being open to taking risks
Enthusiasm Showing enthusiasm for the projects you are working on Being optimistic about the work you are doing Encouraging people to have fun at work
Collaboration Communicating frequently with the people you work with Taking opportunities to collaborate with other people Encouraging teamwork
Support Letting people know that you are there to help out if they need it Being patient with other people's mistakes Delivering feedback in a tactful manner
Stability Working at a consistent, steady pace Creating schedules for projects Following established rules or procedures
Accuracy Taking extra time to ensure quality Making decisions that are based on logic, not emotion Taking time to analyze choices in-depth before making a decision
Challenge Speaking up about problems Questioning ideas that don't seem logical Questioning procedures or practices that aren't efficient
Results Being direct with your opinions and ideas Constantly pushing yourself toward new goals Setting high expectations for yourself and others
Section 4: Everything DiSC Workplace® Research
Copyright ©2013 by John Wiley & Sons, Inc. All rights reserved. Permission to reproduce only when used in conjunction with Everything DiSC® assessments. 41
The category scores were then submitted to a multidimensional scaling analysis. This analysis allows
researchers to look at the relationship among the eight categories and determine if the categories
relate to each other in the manner predicted by the model. The results of the analysis are presented in Figure 12. Categories that are closer together share more in common and categories that are farther
apart are more dissimilar.
Figure 12. Multidimensional Scaling Results
As expected, the eight priorities are arranged in a circular shape, with the priorities arranged in the
manner predicted by the Everything DiSC Workplace® model. That is, the sequence around the circle
proceeds: Action, Enthusiasm, Collaboration, Support, Stability, Accuracy, Challenge, and Results.
Although the eight priority scales do not form a perfectly equidistant circle, this theoretical ideal is nearly impossible to obtain with actual data.
Section 4: Everything DiSC Workplace® Research
Copyright ©2013 by John Wiley & Sons, Inc. All rights reserved. Permission to reproduce only when used in conjunction with Everything DiSC® assessments. 42
Summary of the Validation Results
Overall, this study provides strong support for the Everything DiSC Workplace® model. Data from a large sample of working adults suggest that the eight priorities are arranged in a circular fashion in the
predicted order. This type of empirical support should give DiSC® participants confidence that the
Everything DiSC Workplace model accurately reflects real-life workplace environments and is useful for understanding various approaches to work.
Section 5: Everything DiSC® Productive Conflict Research
Copyright ©2013 by John Wiley & Sons, Inc. All rights reserved. Permission to reproduce only when used in conjunction with Everything DiSC® assessments. 43
Section 5: Everything DiSC® Productive Conflict Research Background
The application-specific model used in the Everything DiSC® Productive Conflict Profile, shown in
Figure 13, helps learners understand how they approach conflict situations. The eight words around
the map indicate the top priorities of learners with different DiSC® styles. For example, the priorities of “S” individuals are Harmony, Stability, and Reassurance. The development of this model was based
on empirical data.
Figure 13. Everything DiSC Productive Conflict Model
The Research
A total of 8,332 participants were asked to take the Everything DiSC Productive Conflict assessment in preparation for an upcoming classroom training session. This assessment measured the eight DiSC
scales as well as eight Productive Conflict priority scales. These scales are shown in Table 23, along
with sample items included within each scale. Items were rated on a five-point Likert scale ranging from Strongly Disagree to Strongly Agree. The Productive Conflict priority scales are standardized to
have a mean of zero and standard deviation of one.

Section 5: Everything DiSC® Productive Conflict Research
Copyright ©2013 by John Wiley & Sons, Inc. All rights reserved. Permission to reproduce only when used in conjunction with Everything DiSC® assessments. 44
Table 23. Sample Items for the Productive Conflict Priority Scales
Scale Sample Items Assertion When I'm in a conflict, I confront the topic without waiting
When I'm in a conflict, I tackle the issue head on
Expression When I'm in a conflict, I tend to verbalize my emotions
When I'm in a conflict, I have a strong need to express my feelings
Reassurance When I'm in a conflict, I'm still very empathetic with the other person
When I'm in a conflict, I'm eager to forgive the other person (even if I probably shouldn't)
Harmony When I'm in a conflict, the lack of harmony in the relationship really bothers me
When I'm in a conflict, I do whatever it takes to calm the situation down
Stability When I'm in a conflict, the lack of stability in my world is very unnerving for me
When I'm in a conflict, I sometimes cave in just to make things stable again
Objectivity When I'm in a conflict, I'm very disciplined at stepping outside myself and analyzing the situation objectively
When I'm in a conflict, I sometimes cave in just to make things stable again
Justification When I'm in a conflict, I'm great at quickly coming up with an airtight justification for my position
When I'm in a conflict, I'm very good at logically dissecting and dismantling the other person's argument
Control When I'm in a conflict, I make sure I'm in control
When I'm in a conflict, I often take charge of the conversation
The priority scales were first submitted to a multidimensional scaling analysis, which allows
researchers to look at the relationship among the eight scales and compare this against the expected relationships, as predicted by the model. The results of this analysis are presented in Figure 14.
Scales that are closer together share more in common and scales that are farther apart are more
dissimilar.
Section 5: Everything DiSC® Productive Conflict Research
Copyright ©2013 by John Wiley & Sons, Inc. All rights reserved. Permission to reproduce only when used in conjunction with Everything DiSC® assessments. 45
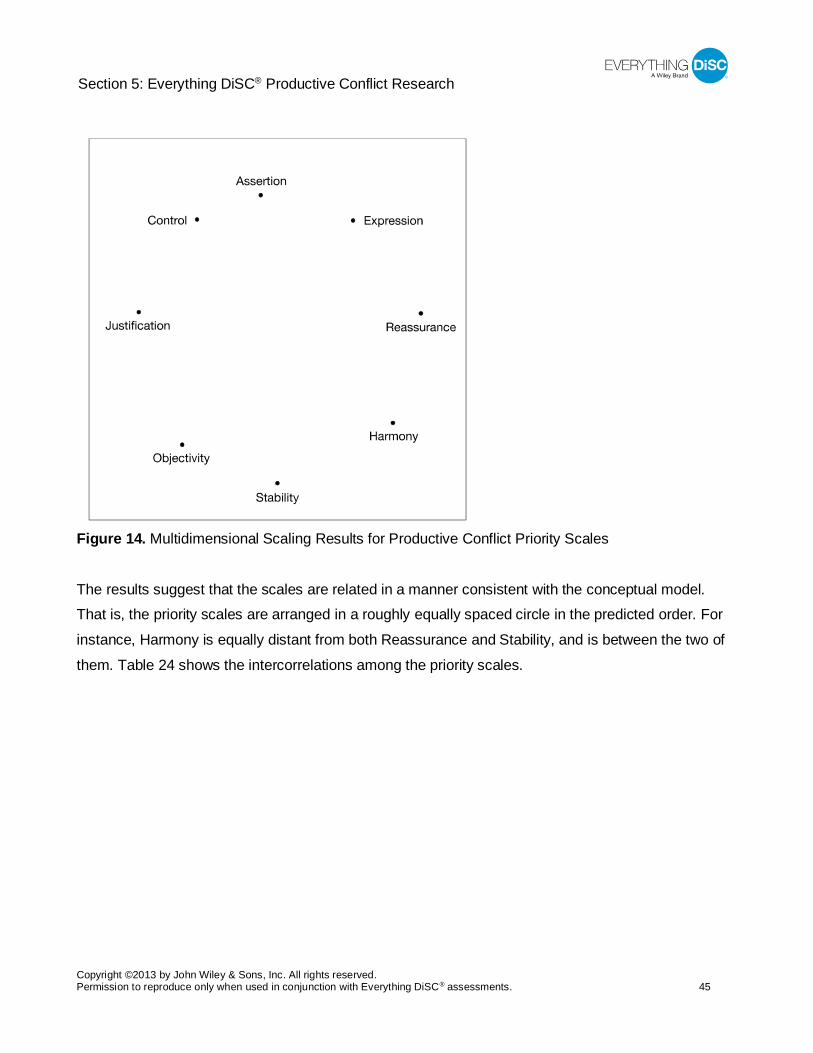
Figure 14. Multidimensional Scaling Results for Productive Conflict Priority Scales
The results suggest that the scales are related in a manner consistent with the conceptual model. That is, the priority scales are arranged in a roughly equally spaced circle in the predicted order. For
instance, Harmony is equally distant from both Reassurance and Stability, and is between the two of
them. Table 24 shows the intercorrelations among the priority scales.
Section 5: Everything DiSC® Productive Conflict Research
Copyright ©2013 by John Wiley & Sons, Inc. All rights reserved. Permission to reproduce only when used in conjunction with Everything DiSC® assessments. 46
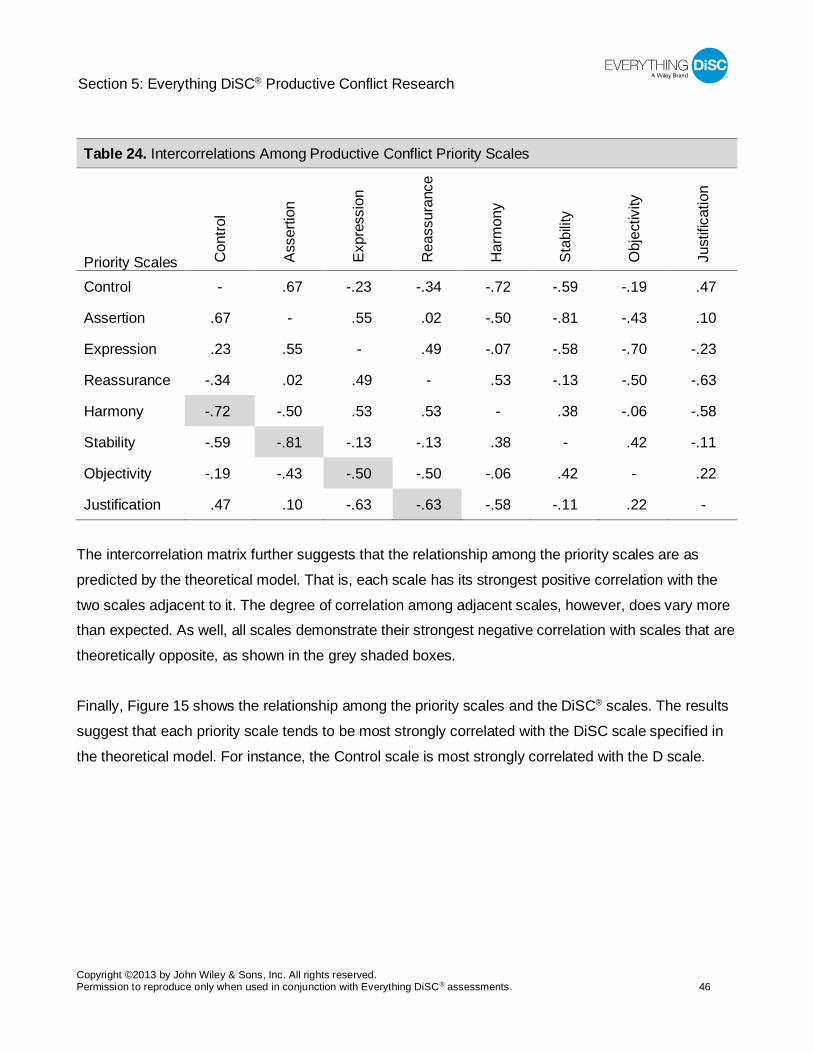
Table 24. Intercorrelations Among Productive Conflict Priority Scales
Priority Scales Con
trol
Asse
rtion
Expr
essi
on
Rea
ssur
ance
Har
mon
y
Stab
ility
Obj
ectiv
ity
Just
ificat
ion
Control - .67 -.23 -.34 -.72 -.59 -.19 .47
Assertion .67 - .55 .02 -.50 -.81 -.43 .10
Expression .23 .55 - .49 -.07 -.58 -.70 -.23
Reassurance -.34 .02 .49 - .53 -.13 -.50 -.63
Harmony -.72 -.50 .53 .53 - .38 -.06 -.58
Stability -.59 -.81 -.13 -.13 .38 - .42 -.11
Objectivity -.19 -.43 -.50 -.50 -.06 .42 - .22
Justification .47 .10 -.63 -.63 -.58 -.11 .22 -
The intercorrelation matrix further suggests that the relationship among the priority scales are as
predicted by the theoretical model. That is, each scale has its strongest positive correlation with the
two scales adjacent to it. The degree of correlation among adjacent scales, however, does vary more than expected. As well, all scales demonstrate their strongest negative correlation with scales that are
theoretically opposite, as shown in the grey shaded boxes.
Finally, Figure 15 shows the relationship among the priority scales and the DiSC® scales. The results
suggest that each priority scale tends to be most strongly correlated with the DiSC scale specified in
the theoretical model. For instance, the Control scale is most strongly correlated with the D scale.
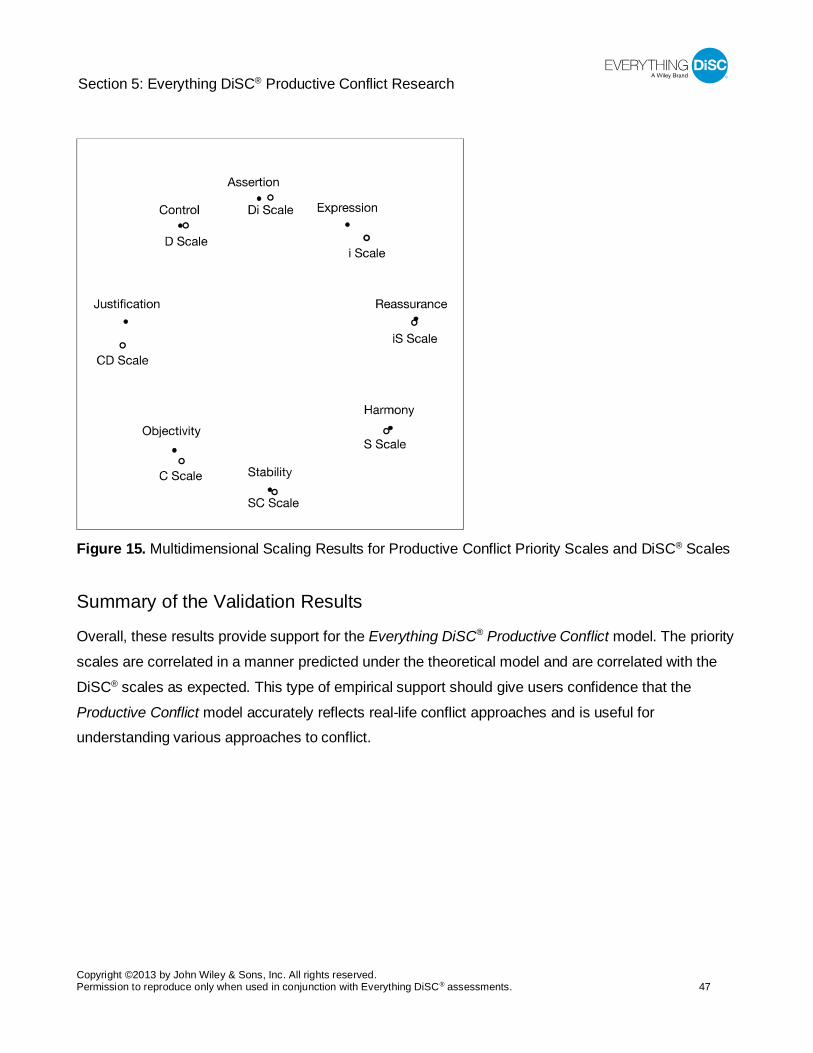
Section 5: Everything DiSC® Productive Conflict Research
Copyright ©2013 by John Wiley & Sons, Inc. All rights reserved. Permission to reproduce only when used in conjunction with Everything DiSC® assessments. 47
Figure 15. Multidimensional Scaling Results for Productive Conflict Priority Scales and DiSC® Scales
Summary of the Validation Results
Overall, these results provide support for the Everything DiSC® Productive Conflict model. The priority
scales are correlated in a manner predicted under the theoretical model and are correlated with the
DiSC® scales as expected. This type of empirical support should give users confidence that the
Productive Conflict model accurately reflects real-life conflict approaches and is useful for understanding various approaches to conflict.
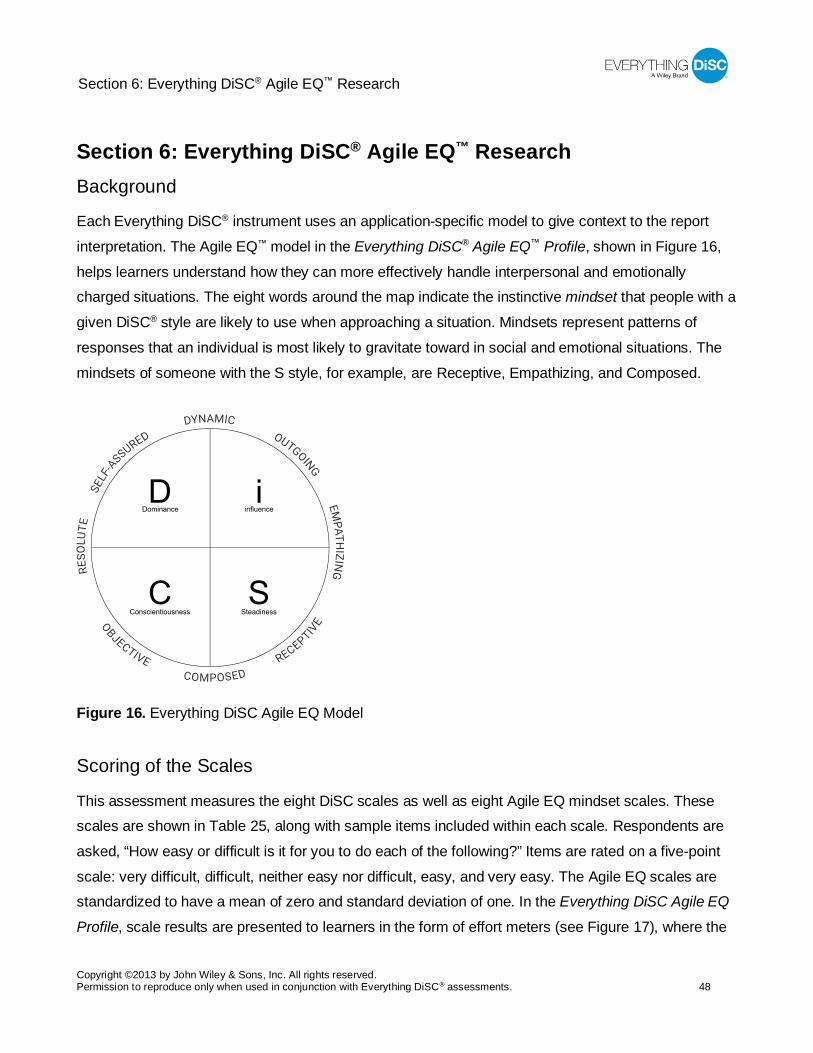
Section 6: Everything DiSC® Agile EQ™ Research
Copyright ©2013 by John Wiley & Sons, Inc. All rights reserved. Permission to reproduce only when used in conjunction with Everything DiSC® assessments. 48
Section 6: Everything DiSC® Agile EQ™ Research Background
Each Everything DiSC® instrument uses an application-specific model to give context to the report
interpretation. The Agile EQ™ model in the Everything DiSC® Agile EQ™ Profile, shown in Figure 16,
helps learners understand how they can more effectively handle interpersonal and emotionally charged situations. The eight words around the map indicate the instinctive mindset that people with a
given DiSC® style are likely to use when approaching a situation. Mindsets represent patterns of
responses that an individual is most likely to gravitate toward in social and emotional situations. The
mindsets of someone with the S style, for example, are Receptive, Empathizing, and Composed.
Figure 16. Everything DiSC Agile EQ Model
Scoring of the Scales
This assessment measures the eight DiSC scales as well as eight Agile EQ mindset scales. These scales are shown in Table 25, along with sample items included within each scale. Respondents are
asked, “How easy or difficult is it for you to do each of the following?” Items are rated on a five-point
scale: very difficult, difficult, neither easy nor difficult, easy, and very easy. The Agile EQ scales are standardized to have a mean of zero and standard deviation of one. In the Everything DiSC Agile EQ
Profile, scale results are presented to learners in the form of effort meters (see Figure 17), where the
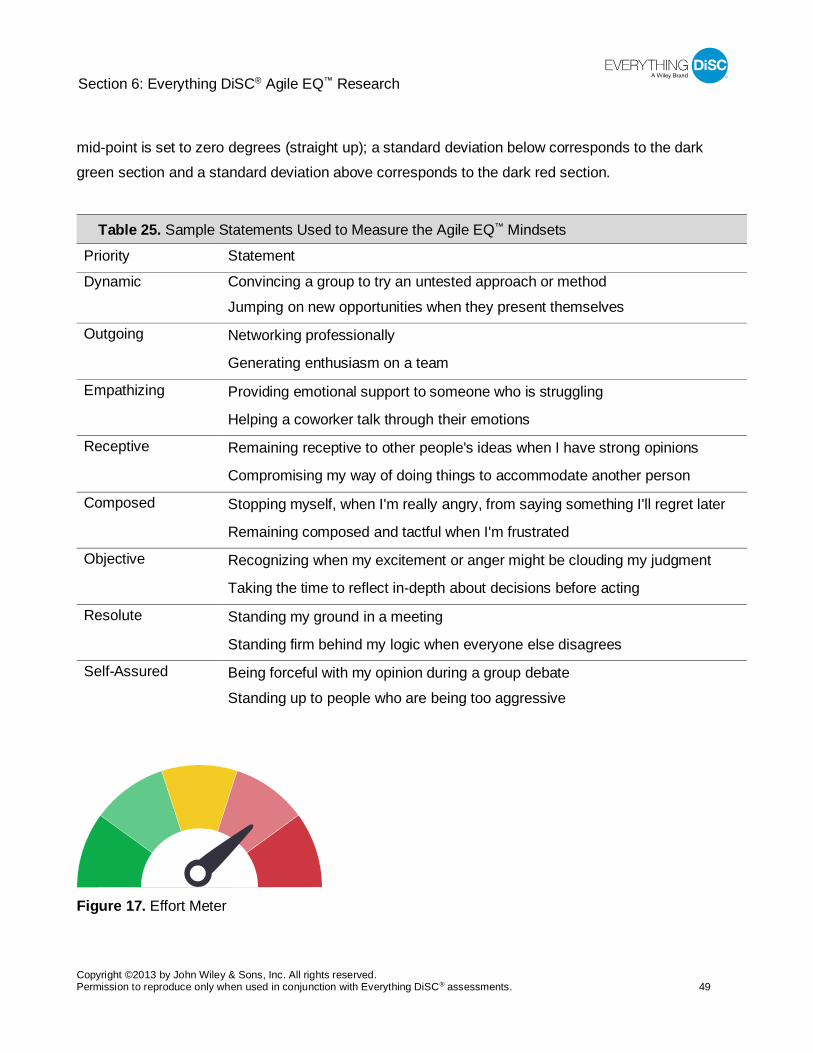
Section 6: Everything DiSC® Agile EQ™ Research
Copyright ©2013 by John Wiley & Sons, Inc. All rights reserved. Permission to reproduce only when used in conjunction with Everything DiSC® assessments. 49
mid-point is set to zero degrees (straight up); a standard deviation below corresponds to the dark green section and a standard deviation above corresponds to the dark red section.
Table 25. Sample Statements Used to Measure the Agile EQ™ Mindsets
Priority Statement
Dynamic Convincing a group to try an untested approach or method
Jumping on new opportunities when they present themselves
Outgoing Networking professionally
Generating enthusiasm on a team
Empathizing Providing emotional support to someone who is struggling
Helping a coworker talk through their emotions
Receptive Remaining receptive to other people's ideas when I have strong opinions
Compromising my way of doing things to accommodate another person
Composed Stopping myself, when I'm really angry, from saying something I'll regret later
Remaining composed and tactful when I'm frustrated
Objective Recognizing when my excitement or anger might be clouding my judgment
Taking the time to reflect in-depth about decisions before acting
Resolute Standing my ground in a meeting
Standing firm behind my logic when everyone else disagrees
Self-Assured Being forceful with my opinion during a group debate
Standing up to people who are being too aggressive
Figure 17. Effort Meter
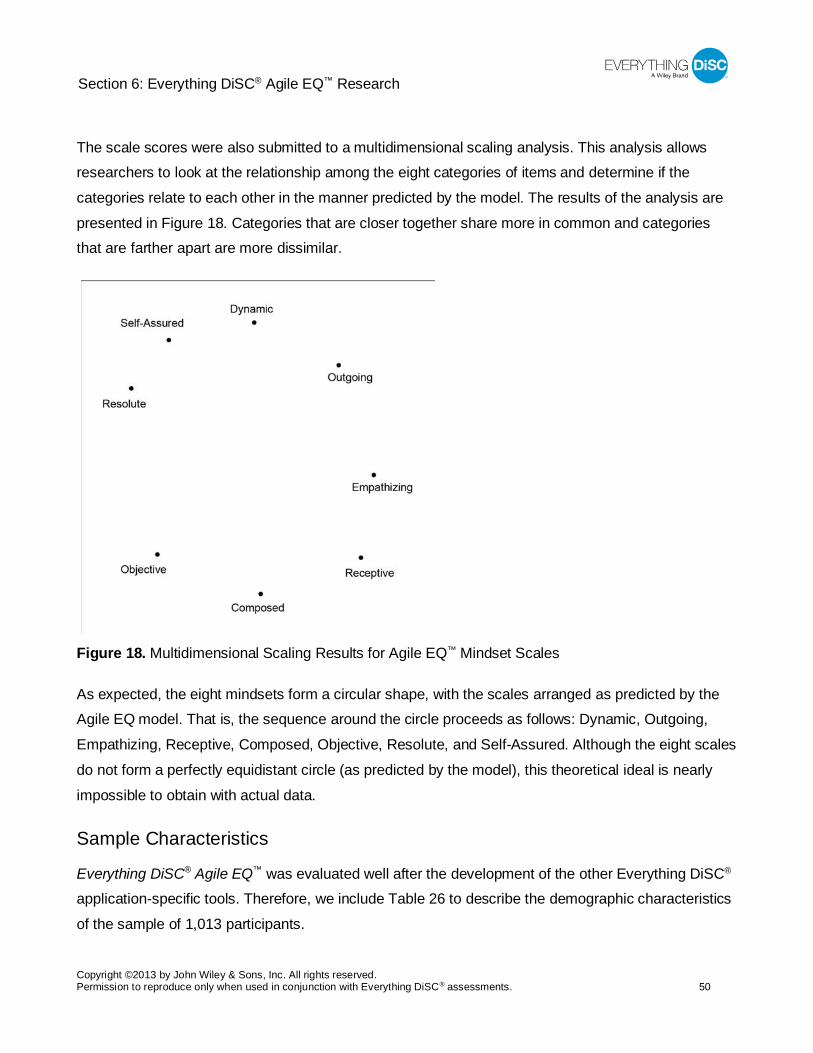
Section 6: Everything DiSC® Agile EQ™ Research
Copyright ©2013 by John Wiley & Sons, Inc. All rights reserved. Permission to reproduce only when used in conjunction with Everything DiSC® assessments. 50
The scale scores were also submitted to a multidimensional scaling analysis. This analysis allows researchers to look at the relationship among the eight categories of items and determine if the
categories relate to each other in the manner predicted by the model. The results of the analysis are
presented in Figure 18. Categories that are closer together share more in common and categories that are farther apart are more dissimilar.
Figure 18. Multidimensional Scaling Results for Agile EQ™ Mindset Scales
As expected, the eight mindsets form a circular shape, with the scales arranged as predicted by the Agile EQ model. That is, the sequence around the circle proceeds as follows: Dynamic, Outgoing,
Empathizing, Receptive, Composed, Objective, Resolute, and Self-Assured. Although the eight scales
do not form a perfectly equidistant circle (as predicted by the model), this theoretical ideal is nearly
impossible to obtain with actual data.
Sample Characteristics
Everything DiSC® Agile EQ™ was evaluated well after the development of the other Everything DiSC® application-specific tools. Therefore, we include Table 26 to describe the demographic characteristics
of the sample of 1,013 participants.
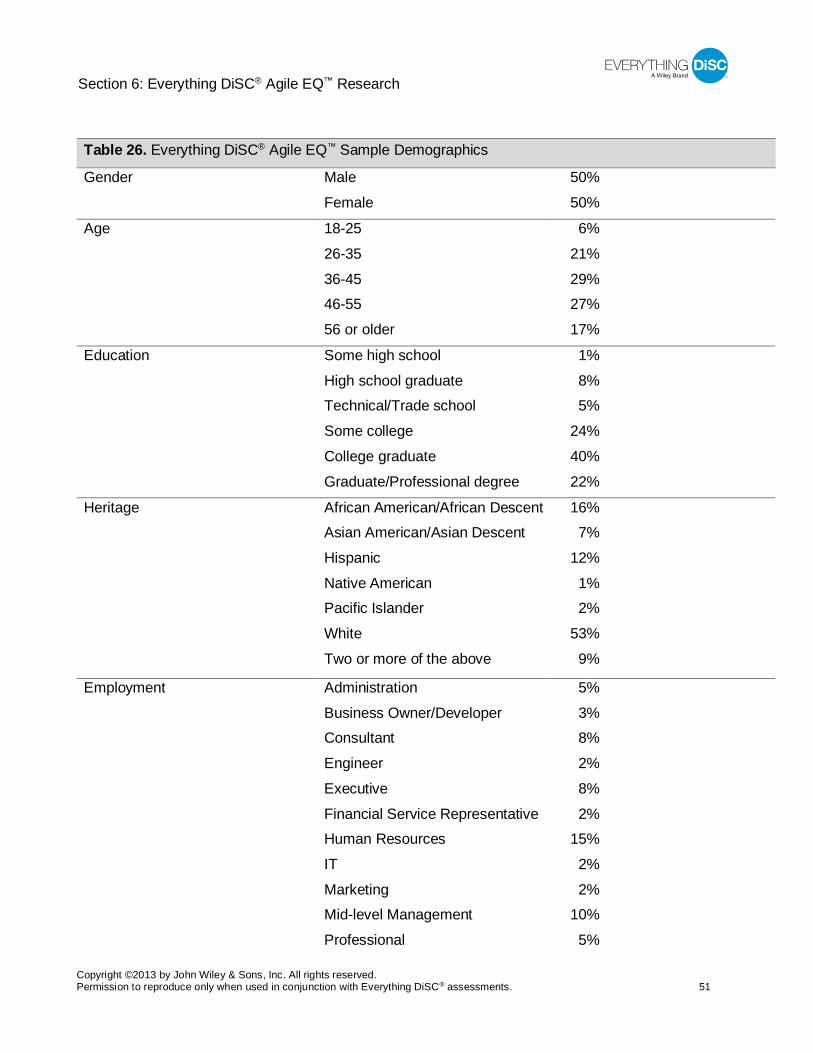
Section 6: Everything DiSC® Agile EQ™ Research
Copyright ©2013 by John Wiley & Sons, Inc. All rights reserved. Permission to reproduce only when used in conjunction with Everything DiSC® assessments. 51
Table 26. Everything DiSC® Agile EQ™ Sample Demographics
Gender Male 50 %
Female 50 %
Age 18-25 6 %
26-35 21 %
36-45 29 % 46-55 27 %
56 or older 17 %
Education Some high school 1 %
High school graduate 8 % Technical/Trade school 5 %
Some college 24 %
College graduate 40 %
Graduate/Professional degree 22 %
Heritage African American/African Descent 16 % Asian American/Asian Descent 7 %
Hispanic 12 %
Native American 1 % Pacific Islander 2 %
White 53 %
Two or more of the above 9 %
Employment Administration 5 %
Business Owner/Developer 3 % Consultant 8 %
Engineer 2 %
Executive 8 %
Financial Service Representative 2 % Human Resources 15 %
IT 2 %
Marketing 2 % Mid-level Management 10 %
Professional 5 %
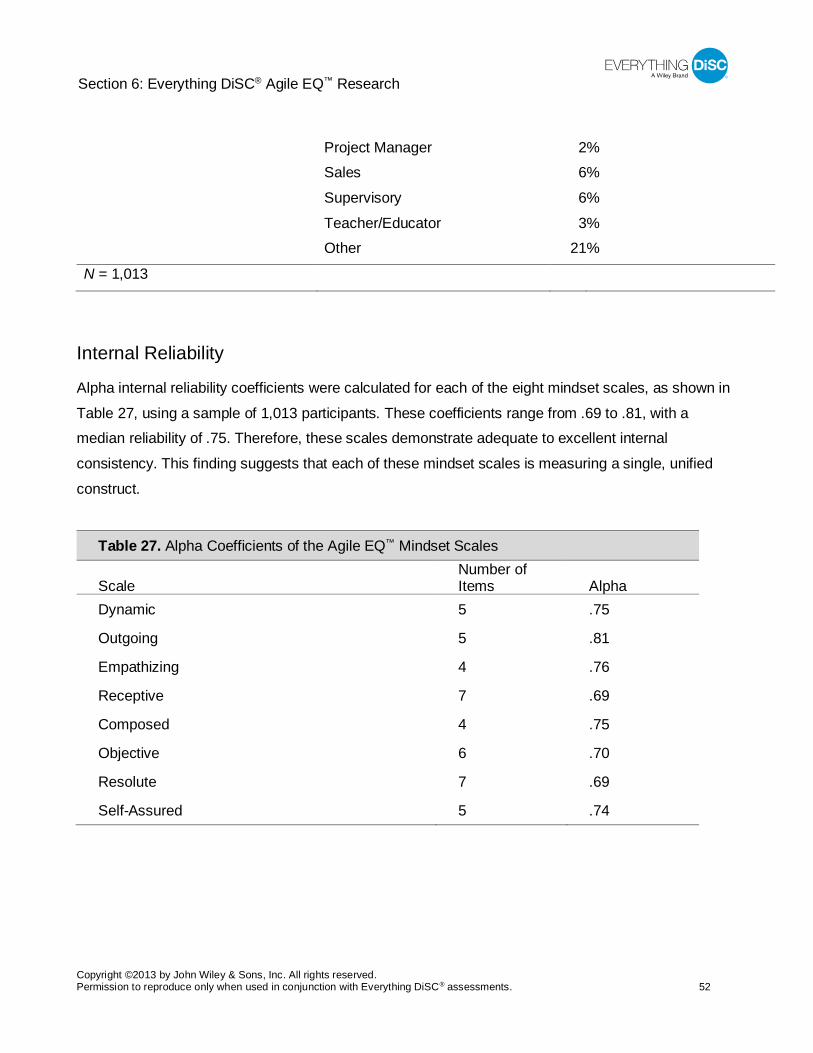
Section 6: Everything DiSC® Agile EQ™ Research
Copyright ©2013 by John Wiley & Sons, Inc. All rights reserved. Permission to reproduce only when used in conjunction with Everything DiSC® assessments. 52
Project Manager 2 % Sales 6 %
Supervisory 6 %
Teacher/Educator 3 % Other 21 %
N = 1,013
Internal Reliability
Alpha internal reliability coefficients were calculated for each of the eight mindset scales, as shown in
Table 27, using a sample of 1,013 participants. These coefficients range from .69 to .81, with a median reliability of .75. Therefore, these scales demonstrate adequate to excellent internal
consistency. This finding suggests that each of these mindset scales is measuring a single, unified
construct.
Table 27. Alpha Coefficients of the Agile EQ™ Mindset Scales
Scale Number of Items Alpha
Dynamic 5 .75
Outgoing 5 .81
Empathizing 4 .76
Receptive 7 .69
Composed 4 .75
Objective 6 .70
Resolute 7 .69
Self-Assured 5 .74
Section 6: Everything DiSC® Agile EQ™ Research
Copyright ©2013 by John Wiley & Sons, Inc. All rights reserved. Permission to reproduce only when used in conjunction with Everything DiSC® assessments. 53
While the proportion of gender, age, and ethnicity representations shown in Table 26 approximate that of overall Everything DiSC® sample described in Appendix 1, a higher proportion of Agile EQ™
participants held graduate/professional degrees than in the overall Everything DiSC sample. Given
this, we also include an additional reliability study comparing results of those holding graduate/professional degrees with those of everyone else, shown in Table 28. The results of this
reliability study do not systematically differ with respect to education at the graduate/professional
degree level. We can conclude there is no systematic impact of educational level on the mindset
scales’ measurement stability across educational groups.
Table 28. Alpha Coefficients of the Agile EQ™ Mindset Scales for Those Holding Graduate/Professional Degrees
Scale Number of Items
Alpha (Graduate/Professional degree, N = 222)
Alpha (All others, N = 791)
Dynamic 5 .72 .76
Outgoing 5 .81 .81
Empathizing 4 .76 .76
Receptive 7 .68 .70
Composed 4 .75 .75
Objective 6 .69 .70
Resolute 7 .74 .67
Self-Assured 5 .75 .74
In addition to the internal reliability studies, it is also important to understand the relationship between
the level of education and profile score. An analysis of variance (ANOVA) was performed on the eight scale means across education groups to determine any differences. These differences are very small
for the Dynamic and Objective scales, and non-existent for all other scales, as shown in Table 29.
Section 6: Everything DiSC® Agile EQ™ Research
Copyright ©2013 by John Wiley & Sons, Inc. All rights reserved. Permission to reproduce only when used in conjunction with Everything DiSC® assessments. 54
Table 29. Percent of Variance Accounted for by Graduate/Professional Degree Scale Percent
Dynamic 0.2
Outgoing 0.0
Empathizing 0.0
Receptive 0.0
Composed 0.0
Objective 0.2
Resolute 0.0
Self-Assured 0.0
N = 1,013
Intercorrelations Among the Mindset Scales
Intercorrelations among the eight mindset scales were also calculated, using a sample of 1,013
participants, as shown in Table 30. Coefficients range from -.76 to .77, with a median of -.03. Overall,
correlations are as expected. For instance, the Agile EQ model hypothesizes a high positive
correlation between the Dynamic scale and the Outgoing scale, and a high negative correlation between the Empathizing scale and the Resolute scale.
Section 6: Everything DiSC® Agile EQ™ Research
Copyright ©2013 by John Wiley & Sons, Inc. All rights reserved. Permission to reproduce only when used in conjunction with Everything DiSC® assessments. 55
Table 30. Intercorrelations Among Agile EQ™ Mindset Scales
Mindset Scales D
ynam
ic
Out
goin
g
Empa
thiz
ing
Rec
eptiv
e
Com
pose
d
Obj
ectiv
e
Res
olut
e
Self-
Assu
red
Dynamic - .65 .01 -.40 -.58 -.47 .30 .64
Outgoing .65 - .49 .07 -.39 -.62 -.13 .14
Empathizing .01 .49 - .62 .18 -.35 -.53 -.40
Receptive -.40 .07 .62 - .47 -.06 -.72 -.76
Composed -.58 -.39 .18 .47 - .38 -.38 -.52
Objective -.47 -.62 .35 -.06 .38 - .15 -.13
Resolute .30 -.13 -.53 -.72 -.38 .15 - .77
Self-Assured .64 .14 -.40 -.76 -.52 -.13 .77 -
Summary of the Validation Results
Overall, this research provides strong support for the Everything DiSC® Agile EQ™ mindset scales.
Data from a large sample of working adults suggest these scales have good internal reliability and
accurately reflect participants’ self-perceptions. This type of empirical support should give DiSC® participants confidence that the Everything DiSC Agile EQ Profile provides reliable, accurate, and
useful information about their instinctive responses to emotional and social situations and how they
can adapt them to any circumstance for the best outcome.
Section 7: Everything DiSC Work of Leaders® Research
Copyright ©2013 by John Wiley & Sons, Inc. All rights reserved. Permission to reproduce only when used in conjunction with Everything DiSC® assessments. 56
Section 7: Everything DiSC Work of Leaders® Research Background
The Everything DiSC Work of Leaders® assessment includes 75 items in addition to the basic
Everything DiSC® assessment. These items are necessary to measure the 18 additional scales
included on the Everything DiSC Work of Leaders Profile.
Each of these items is comprised of two statements placed at opposite ends of a four-point
continuum. The rater is asked to choose the point on the continuum that best describes him or her.
For instance, one continuum has the statement “I am an optimist” on one end and the statement “I am a realist” on the other. Each scale is standardized to have a mean of 0 and standard deviation of 1.
The Validation Process
The analyses presented below are based on a sample of 349 participants. The sample is 52% female and 48% male. Within the sample, 90% of participants are between the ages of 25 and 60. The
majority of participants (52%) have at least some college. Ethnic backgrounds are as follows: African
American (6%), Asian American (5%), Caucasian (79%), Hispanic (6%), Native American (1%), and other (3%).
Internal Reliability
The median internal reliability alpha coefficient for these 18 scales was .81, as shown in Table 31.
The alphas range from .69 to .89. These results indicate that the Work of Leaders scales demonstrate good to excellent internal reliability. These findings also suggest that each of these scales measures a
single, unified construct.
Intercorrelations Among the Work of Leaders Scales
Intercorrelations among the 18 Work of Leaders scales are shown in Tables 32 and 33. Coefficients range from -.90 to .80, with a median of .04. Many of the stronger correlations are the result of
overlapping items among the scales. For instance, the Praise scale, which measures a tendency to
give praise to others at work, has many items in common with the Receptive scale, which measures a tendency to come across as warm and welcoming.
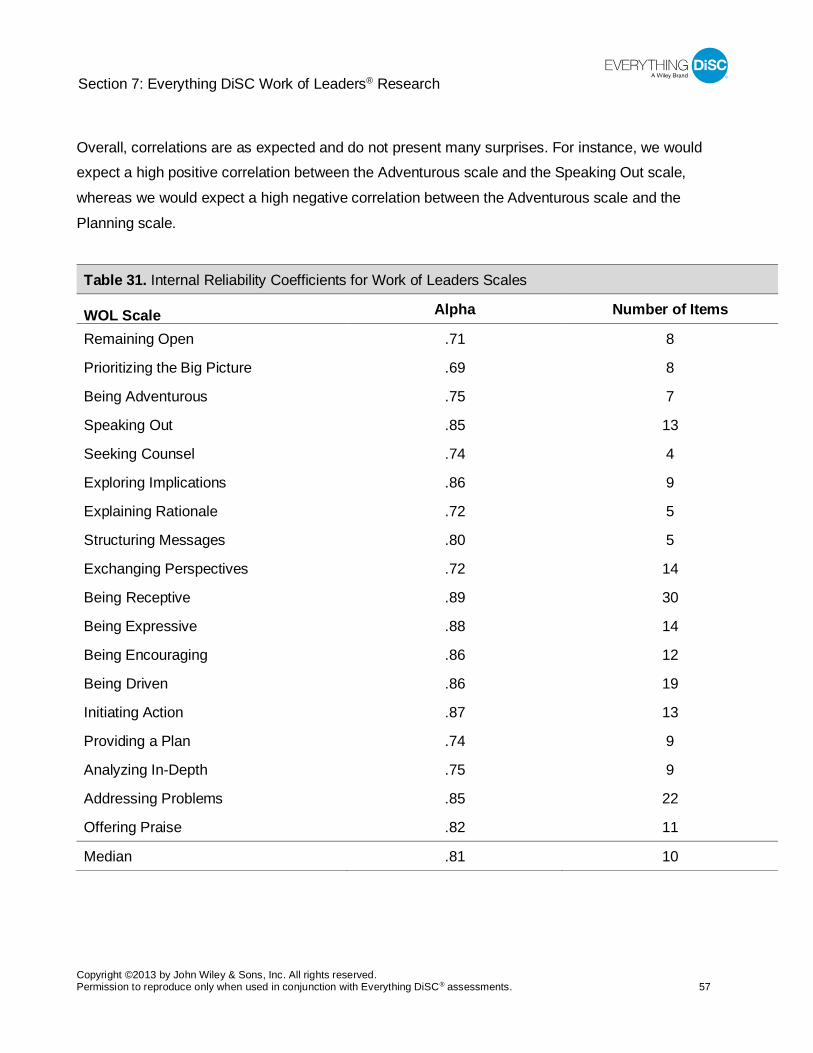
Section 7: Everything DiSC Work of Leaders® Research
Copyright ©2013 by John Wiley & Sons, Inc. All rights reserved. Permission to reproduce only when used in conjunction with Everything DiSC® assessments. 57
Overall, correlations are as expected and do not present many surprises. For instance, we would expect a high positive correlation between the Adventurous scale and the Speaking Out scale,
whereas we would expect a high negative correlation between the Adventurous scale and the
Planning scale.
Table 31. Internal Reliability Coefficients for Work of Leaders Scales
WOL Scale Alpha Number of Items
Remaining Open .71 8
Prioritizing the Big Picture .69 8
Being Adventurous .75 7
Speaking Out .85 13
Seeking Counsel .74 4
Exploring Implications .86 9
Explaining Rationale .72 5
Structuring Messages .80 5
Exchanging Perspectives .72 14
Being Receptive .89 30
Being Expressive .88 14
Being Encouraging .86 12
Being Driven .86 19
Initiating Action .87 13
Providing a Plan .74 9
Analyzing In-Depth .75 9
Addressing Problems .85 22
Offering Praise .82 11
Median .81 10
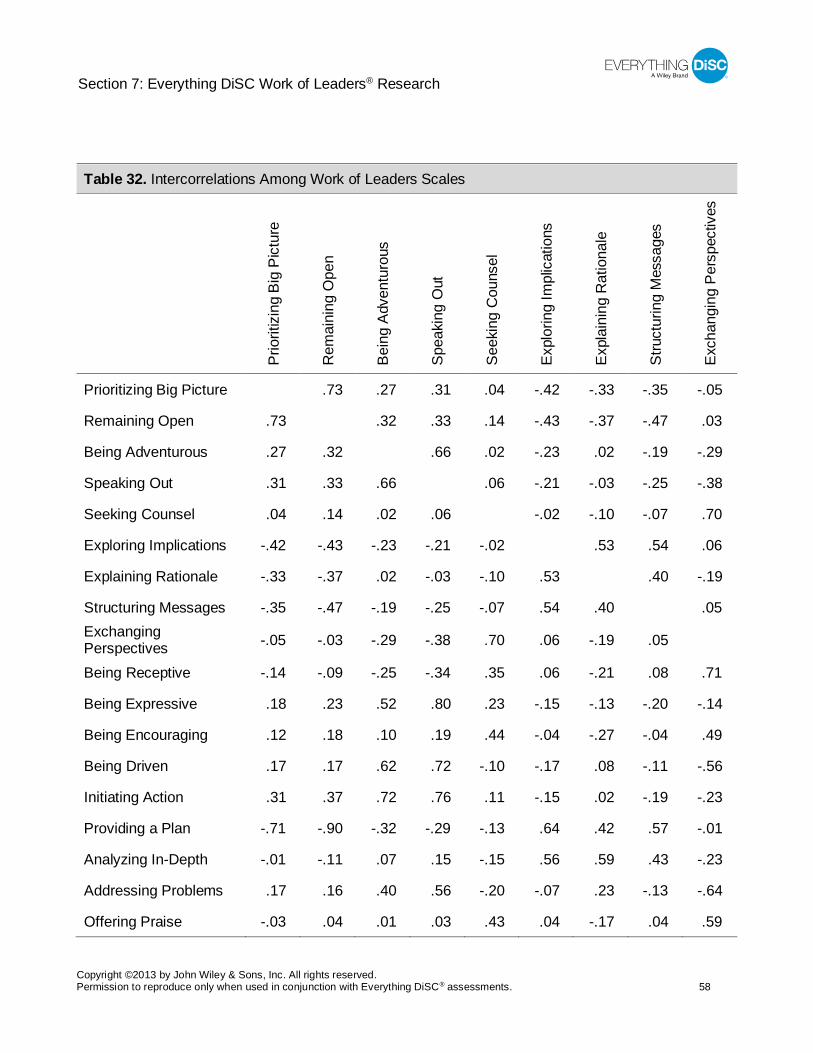
Section 7: Everything DiSC Work of Leaders® Research
Copyright ©2013 by John Wiley & Sons, Inc. All rights reserved. Permission to reproduce only when used in conjunction with Everything DiSC® assessments. 58
Table 32. Intercorrelations Among Work of Leaders Scales
Prio
ritiz
ing
Big
Pict
ure
Rem
aini
ng O
pen
Bein
g Ad
vent
urou
s
Spea
king
Out
Seek
ing
Cou
nsel
Expl
orin
g Im
plic
atio
ns
Expl
aini
ng R
atio
nale
Stru
ctur
ing
Mes
sage
s
Exch
angi
ng P
ersp
ectiv
es
Prioritizing Big Picture .73 .27 .31 .04 -.42 -.33 -.35 -.05
Remaining Open .73 .32 .33 .14 -.43 -.37 -.47 .03
Being Adventurous .27 .32 .66 .02 -.23 .02 -.19 -.29
Speaking Out .31 .33 .66 .06 -.21 -.03 -.25 -.38
Seeking Counsel .04 .14 .02 .06 -.02 -.10 -.07 .70
Exploring Implications -.42 -.43 -.23 -.21 -.02 .53 .54 .06
Explaining Rationale -.33 -.37 .02 -.03 -.10 .53 .40 -.19
Structuring Messages -.35 -.47 -.19 -.25 -.07 .54 .40 .05 Exchanging Perspectives -.05 -.03 -.29 -.38 .70 .06 -.19 .05
Being Receptive -.14 -.09 -.25 -.34 .35 .06 -.21 .08 .71
Being Expressive .18 .23 .52 .80 .23 -.15 -.13 -.20 -.14
Being Encouraging .12 .18 .10 .19 .44 -.04 -.27 -.04 .49
Being Driven .17 .17 .62 .72 -.10 -.17 .08 -.11 -.56
Initiating Action .31 .37 .72 .76 .11 -.15 .02 -.19 -.23
Providing a Plan -.71 -.90 -.32 -.29 -.13 .64 .42 .57 -.01
Analyzing In-Depth -.01 -.11 .07 .15 -.15 .56 .59 .43 -.23
Addressing Problems .17 .16 .40 .56 -.20 -.07 .23 -.13 -.64
Offering Praise -.03 .04 .01 .03 .43 .04 -.17 .04 .59
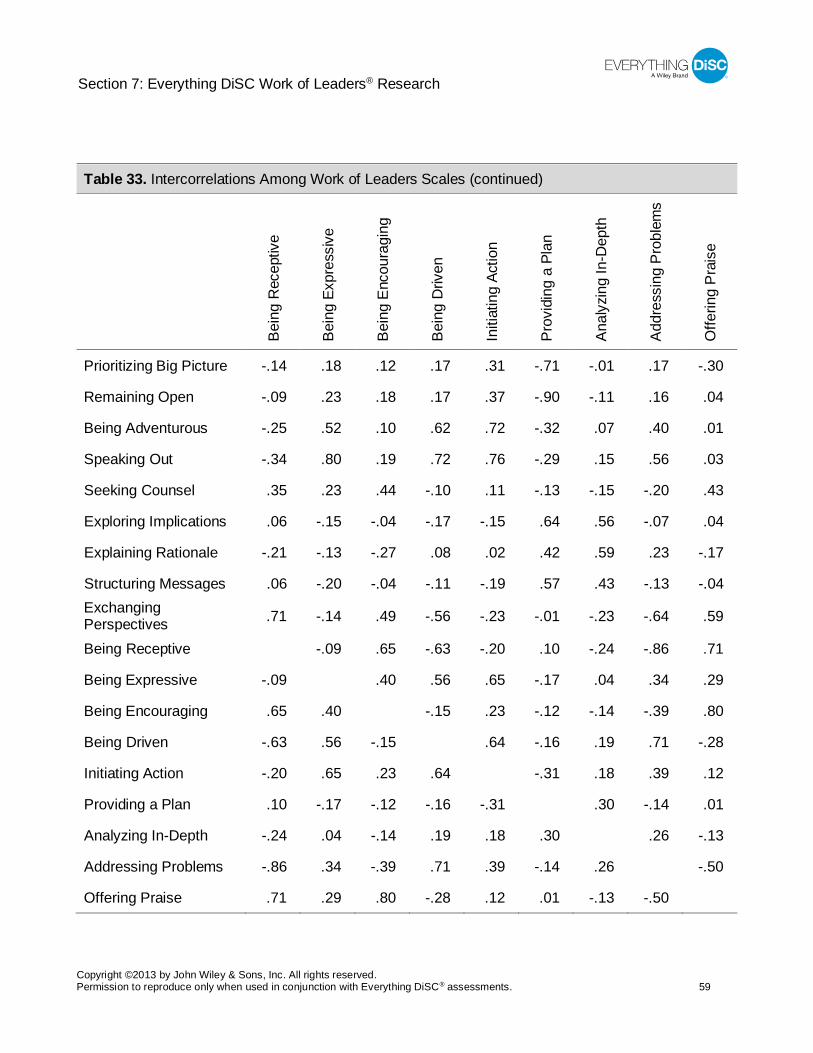
Section 7: Everything DiSC Work of Leaders® Research
Copyright ©2013 by John Wiley & Sons, Inc. All rights reserved. Permission to reproduce only when used in conjunction with Everything DiSC® assessments. 59
Table 33. Intercorrelations Among Work of Leaders Scales (continued)
Bein
g R
ecep
tive
Bein
g Ex
pres
sive
Bein
g En
cour
agin
g
Bein
g D
riven
Initi
atin
g Ac
tion
Prov
idin
g a
Plan
Anal
yzin
g In
-Dep
th
Addr
essi
ng P
robl
ems
Offe
ring
Prai
se
Prioritizing Big Picture -.14 .18 .12 .17 .31 -.71 -.01 .17 -.30
Remaining Open -.09 .23 .18 .17 .37 -.90 -.11 .16 .04
Being Adventurous -.25 .52 .10 .62 .72 -.32 .07 .40 .01
Speaking Out -.34 .80 .19 .72 .76 -.29 .15 .56 .03
Seeking Counsel .35 .23 .44 -.10 .11 -.13 -.15 -.20 .43
Exploring Implications .06 -.15 -.04 -.17 -.15 .64 .56 -.07 .04
Explaining Rationale -.21 -.13 -.27 .08 .02 .42 .59 .23 -.17
Structuring Messages .06 -.20 -.04 -.11 -.19 .57 .43 -.13 -.04 Exchanging Perspectives .71 -.14 .49 -.56 -.23 -.01 -.23 -.64 .59
Being Receptive -.09 .65 -.63 -.20 .10 -.24 -.86 .71
Being Expressive -.09 .40 .56 .65 -.17 .04 .34 .29
Being Encouraging .65 .40 -.15 .23 -.12 -.14 -.39 .80
Being Driven -.63 .56 -.15 .64 -.16 .19 .71 -.28
Initiating Action -.20 .65 .23 .64 -.31 .18 .39 .12
Providing a Plan .10 -.17 -.12 -.16 -.31 .30 -.14 .01
Analyzing In-Depth -.24 .04 -.14 .19 .18 .30 .26 -.13
Addressing Problems -.86 .34 -.39 .71 .39 -.14 .26 -.50
Offering Praise .71 .29 .80 -.28 .12 .01 -.13 -.50
Section 7: Everything DiSC Work of Leaders® Research
Copyright ©2013 by John Wiley & Sons, Inc. All rights reserved. Permission to reproduce only when used in conjunction with Everything DiSC® assessments. 60
Correlations Among Work of Leaders Scales and DiSC® Scales
Correlations among the Everything DiSC Work of Leaders® scales and the DiSC® scales are shown in Table 34. These correlations are largely as expected. The largest positive correlation for each of the
DiSC scales is as follows: Di-Adventurous, i-Expressive, iS-Encouraging, S-Receptive, SC-
Exchanging Perspectives, C-Providing a Plan, CD-Addressing Problems, D-Addressing Problems. Most Work of Leaders scales show a significant correlation with several of the DiSC scales. Further,
the pattern of these correlations is consistent with the DiSC circumplex model. That is, if a given Work
of Leaders scale has a high positive correlation with a particular DiSC scale, then the Work of Leaders
scale has a high negative correlation with the DiSC scale on the opposite side of the DiSC circumplex. The correlations range from -.85 to .87, with a median of .81.
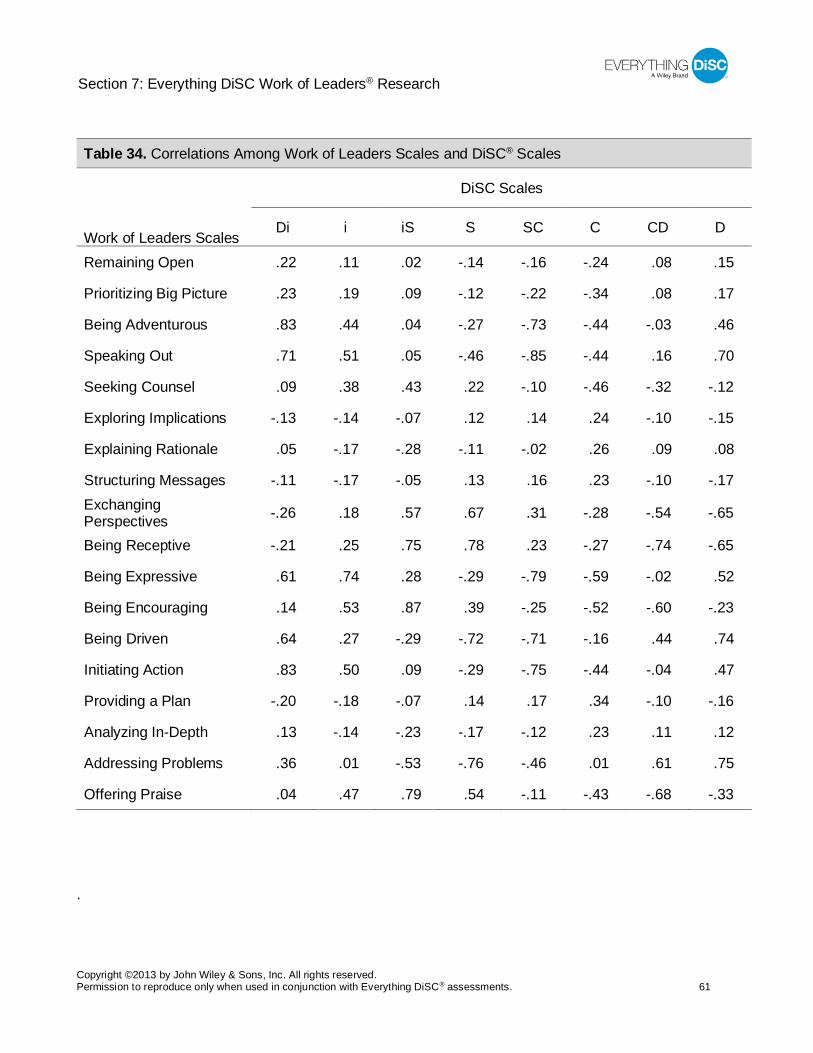
Section 7: Everything DiSC Work of Leaders® Research
Copyright ©2013 by John Wiley & Sons, Inc. All rights reserved. Permission to reproduce only when used in conjunction with Everything DiSC® assessments. 61
Table 34. Correlations Among Work of Leaders Scales and DiSC® Scales
Work of Leaders Scales
DiSC Scales
Di i iS S SC C CD D
Remaining Open .22 .11 .02 -.14 -.16 -.24 .08 .15
Prioritizing Big Picture .23 .19 .09 -.12 -.22 -.34 .08 .17
Being Adventurous .83 .44 .04 -.27 -.73 -.44 -.03 .46
Speaking Out .71 .51 .05 -.46 -.85 -.44 .16 .70
Seeking Counsel .09 .38 .43 .22 -.10 -.46 -.32 -.12
Exploring Implications -.13 -.14 -.07 .12 .14 .24 -.10 -.15
Explaining Rationale .05 -.17 -.28 -.11 -.02 .26 .09 .08
Structuring Messages -.11 -.17 -.05 .13 .16 .23 -.10 -.17 Exchanging Perspectives -.26 .18 .57 .67 .31 -.28 -.54 -.65
Being Receptive -.21 .25 .75 .78 .23 -.27 -.74 -.65
Being Expressive .61 .74 .28 -.29 -.79 -.59 -.02 .52
Being Encouraging .14 .53 .87 .39 -.25 -.52 -.60 -.23
Being Driven .64 .27 -.29 -.72 -.71 -.16 .44 .74
Initiating Action .83 .50 .09 -.29 -.75 -.44 -.04 .47
Providing a Plan -.20 -.18 -.07 .14 .17 .34 -.10 -.16
Analyzing In-Depth .13 -.14 -.23 -.17 -.12 .23 .11 .12
Addressing Problems .36 .01 -.53 -.76 -.46 .01 .61 .75
Offering Praise .04 .47 .79 .54 -.11 -.43 -.68 -.33
.
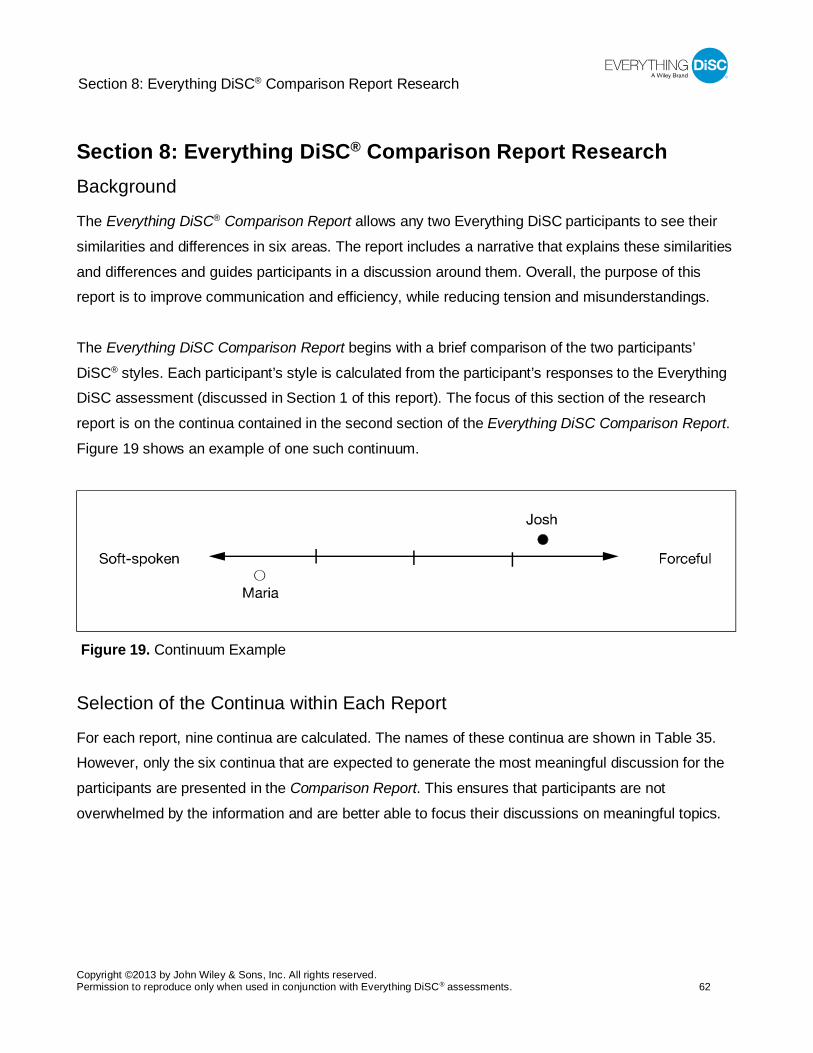
Section 8: Everything DiSC® Comparison Report Research
Copyright ©2013 by John Wiley & Sons, Inc. All rights reserved. Permission to reproduce only when used in conjunction with Everything DiSC® assessments. 62
Section 8: Everything DiSC® Comparison Report Research Background
The Everything DiSC® Comparison Report allows any two Everything DiSC participants to see their
similarities and differences in six areas. The report includes a narrative that explains these similarities
and differences and guides participants in a discussion around them. Overall, the purpose of this report is to improve communication and efficiency, while reducing tension and misunderstandings.
The Everything DiSC Comparison Report begins with a brief comparison of the two participants’
DiSC® styles. Each participant’s style is calculated from the participant’s responses to the Everything DiSC assessment (discussed in Section 1 of this report). The focus of this section of the research
report is on the continua contained in the second section of the Everything DiSC Comparison Report.
Figure 19 shows an example of one such continuum.
Figure 19. Continuum Example
Selection of the Continua within Each Report
For each report, nine continua are calculated. The names of these continua are shown in Table 35. However, only the six continua that are expected to generate the most meaningful discussion for the
participants are presented in the Comparison Report. This ensures that participants are not
overwhelmed by the information and are better able to focus their discussions on meaningful topics.
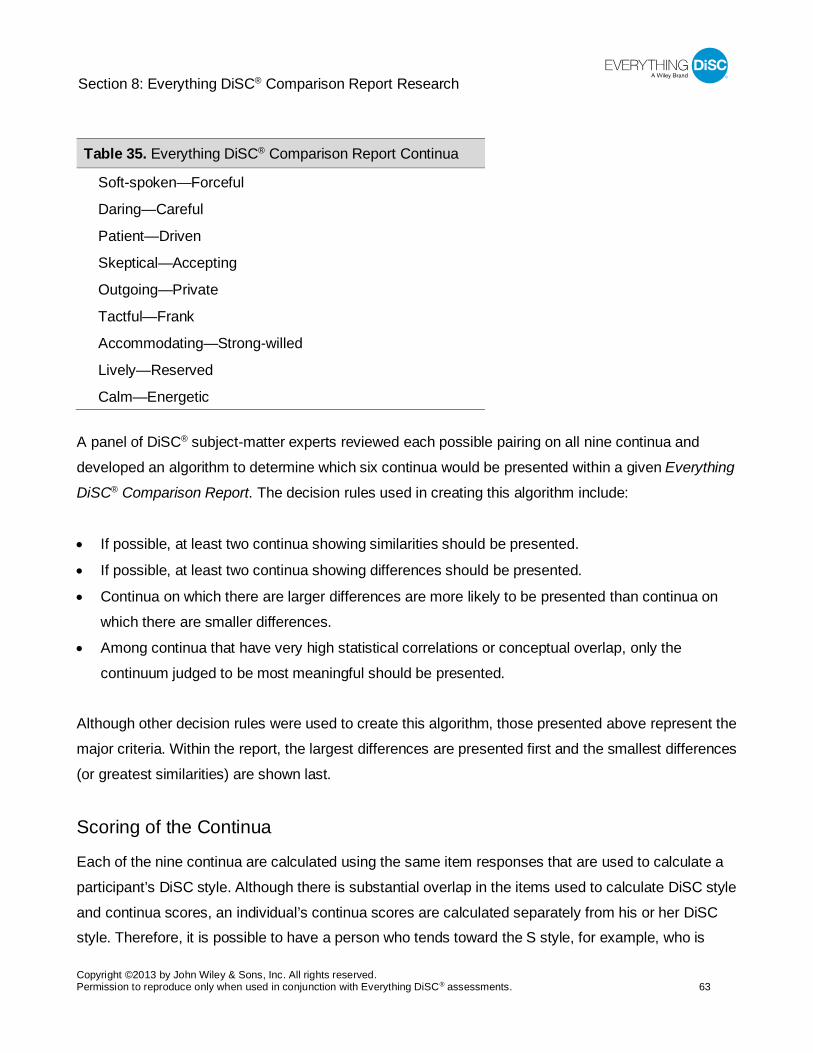
Section 8: Everything DiSC® Comparison Report Research
Copyright ©2013 by John Wiley & Sons, Inc. All rights reserved. Permission to reproduce only when used in conjunction with Everything DiSC® assessments. 63
Table 35. Everything DiSC® Comparison Report Continua
Soft-spoken—Forceful
Daring—Careful
Patient—Driven
Skeptical—Accepting
Outgoing—Private
Tactful—Frank
Accommodating—Strong-willed
Lively—Reserved
Calm—Energetic
A panel of DiSC® subject-matter experts reviewed each possible pairing on all nine continua and
developed an algorithm to determine which six continua would be presented within a given Everything
DiSC® Comparison Report. The decision rules used in creating this algorithm include:
• If possible, at least two continua showing similarities should be presented.
• If possible, at least two continua showing differences should be presented.
• Continua on which there are larger differences are more likely to be presented than continua on
which there are smaller differences.
• Among continua that have very high statistical correlations or conceptual overlap, only the
continuum judged to be most meaningful should be presented.
Although other decision rules were used to create this algorithm, those presented above represent the
major criteria. Within the report, the largest differences are presented first and the smallest differences
(or greatest similarities) are shown last.
Scoring of the Continua
Each of the nine continua are calculated using the same item responses that are used to calculate a
participant’s DiSC style. Although there is substantial overlap in the items used to calculate DiSC style
and continua scores, an individual’s continua scores are calculated separately from his or her DiSC style. Therefore, it is possible to have a person who tends toward the S style, for example, who is
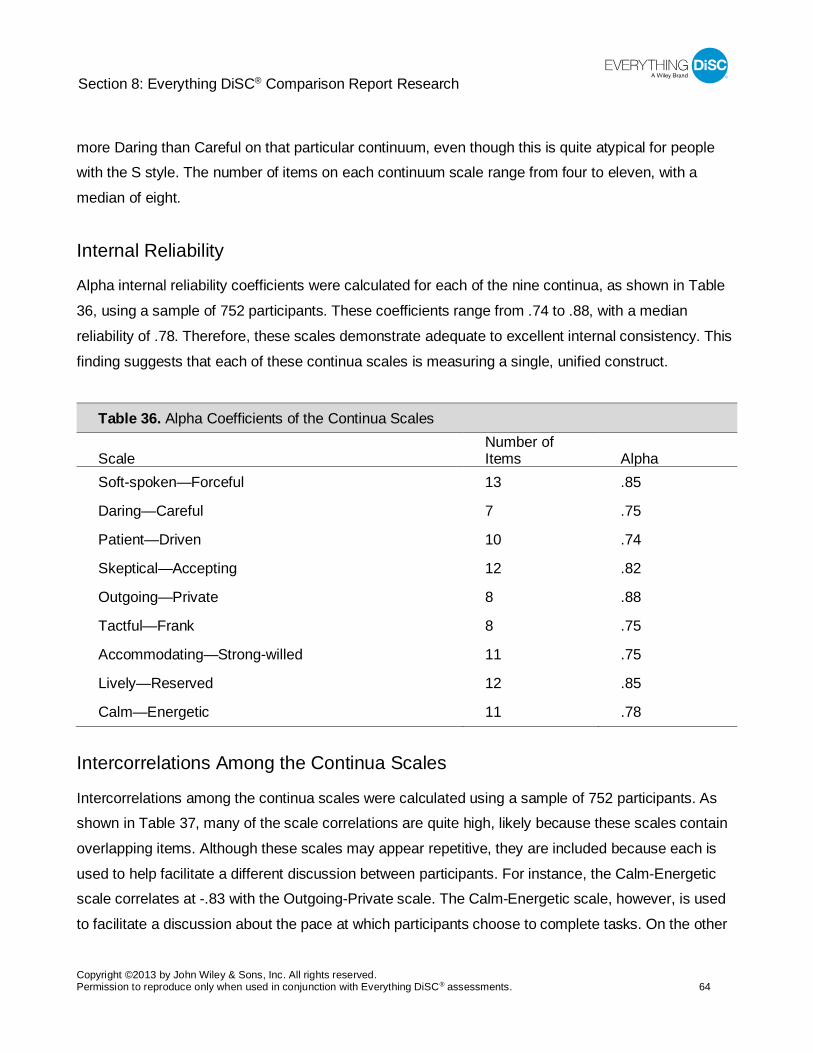
Section 8: Everything DiSC® Comparison Report Research
Copyright ©2013 by John Wiley & Sons, Inc. All rights reserved. Permission to reproduce only when used in conjunction with Everything DiSC® assessments. 64
more Daring than Careful on that particular continuum, even though this is quite atypical for people with the S style. The number of items on each continuum scale range from four to eleven, with a
median of eight.
Internal Reliability
Alpha internal reliability coefficients were calculated for each of the nine continua, as shown in Table
36, using a sample of 752 participants. These coefficients range from .74 to .88, with a median
reliability of .78. Therefore, these scales demonstrate adequate to excellent internal consistency. This
finding suggests that each of these continua scales is measuring a single, unified construct.
Table 36. Alpha Coefficients of the Continua Scales
Scale Number of Items Alpha
Soft-spoken—Forceful 13 .85
Daring—Careful 7 .75
Patient—Driven 10 .74
Skeptical—Accepting 12 .82
Outgoing—Private 8 .88
Tactful—Frank 8 .75
Accommodating—Strong-willed 11 .75
Lively—Reserved 12 .85
Calm—Energetic 11 .78
Intercorrelations Among the Continua Scales
Intercorrelations among the continua scales were calculated using a sample of 752 participants. As shown in Table 37, many of the scale correlations are quite high, likely because these scales contain
overlapping items. Although these scales may appear repetitive, they are included because each is
used to help facilitate a different discussion between participants. For instance, the Calm-Energetic scale correlates at -.83 with the Outgoing-Private scale. The Calm-Energetic scale, however, is used
to facilitate a discussion about the pace at which participants choose to complete tasks. On the other
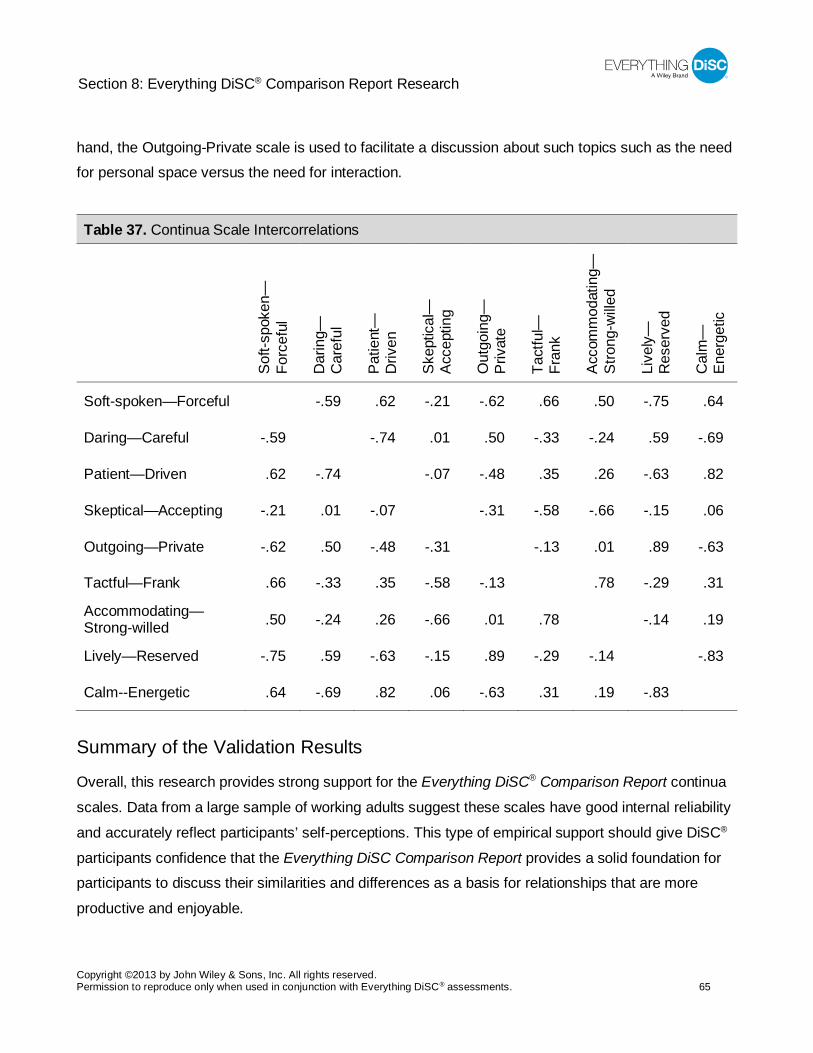
Section 8: Everything DiSC® Comparison Report Research
Copyright ©2013 by John Wiley & Sons, Inc. All rights reserved. Permission to reproduce only when used in conjunction with Everything DiSC® assessments. 65
hand, the Outgoing-Private scale is used to facilitate a discussion about such topics such as the need for personal space versus the need for interaction.
Table 37. Continua Scale Intercorrelations
Soft-
spok
en—
Fo
rcef
ul
Dar
ing—
C
aref
ul
Patie
nt—
D
riven
Skep
tical
—
Acce
ptin
g
Out
goin
g—
Priv
ate
Tact
ful—
Fr
ank
Acco
mm
odat
ing—
St
rong
-wille
d
Live
ly—
R
eser
ved
Cal
m—
En
erge
tic
Soft-spoken—Forceful -.59 .62 -.21 -.62 .66 .50 -.75 .64
Daring—Careful -.59 -.74 .01 .50 -.33 -.24 .59 -.69
Patient—Driven .62 -.74 -.07 -.48 .35 .26 -.63 .82
Skeptical—Accepting -.21 .01 -.07 -.31 -.58 -.66 -.15 .06
Outgoing—Private -.62 .50 -.48 -.31 -.13 .01 .89 -.63
Tactful—Frank .66 -.33 .35 -.58 -.13 .78 -.29 .31
Accommodating—Strong-willed .50 -.24 .26 -.66 .01 .78 -.14 .19
Lively—Reserved -.75 .59 -.63 -.15 .89 -.29 -.14 -.83
Calm--Energetic .64 -.69 .82 .06 -.63 .31 .19 -.83
Summary of the Validation Results
Overall, this research provides strong support for the Everything DiSC® Comparison Report continua
scales. Data from a large sample of working adults suggest these scales have good internal reliability
and accurately reflect participants’ self-perceptions. This type of empirical support should give DiSC®
participants confidence that the Everything DiSC Comparison Report provides a solid foundation for participants to discuss their similarities and differences as a basis for relationships that are more
productive and enjoyable.
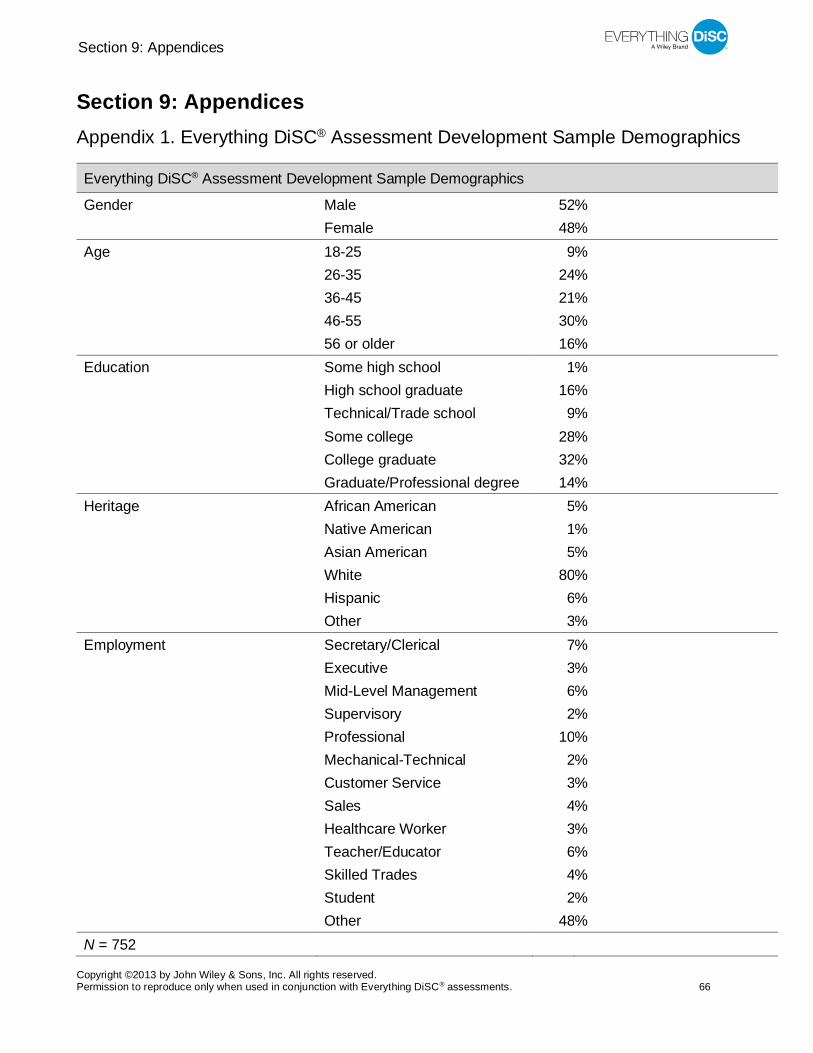
Section 9: Appendices
Copyright ©2013 by John Wiley & Sons, Inc. All rights reserved. Permission to reproduce only when used in conjunction with Everything DiSC® assessments. 66
Section 9: Appendices Appendix 1. Everything DiSC® Assessment Development Sample Demographics
Everything DiSC® Assessment Development Sample Demographics Gender Male 52 % Female 48 % Age 18-25 9 % 26-35 24 % 36-45 21 % 46-55 30 % 56 or older 16 % Education Some high school 1 % High school graduate 16 % Technical/Trade school 9 % Some college 28 % College graduate 32 % Graduate/Professional degree 14 % Heritage African American 5 % Native American 1 % Asian American 5 % White 80 % Hispanic 6 % Other 3 % Employment Secretary/Clerical 7 % Executive 3 % Mid-Level Management 6 % Supervisory 2 % Professional 10 % Mechanical-Technical 2 % Customer Service 3 % Sales 4 % Healthcare Worker 3 % Teacher/Educator 6 % Skilled Trades 4 % Student 2 % Other 48 % N = 752
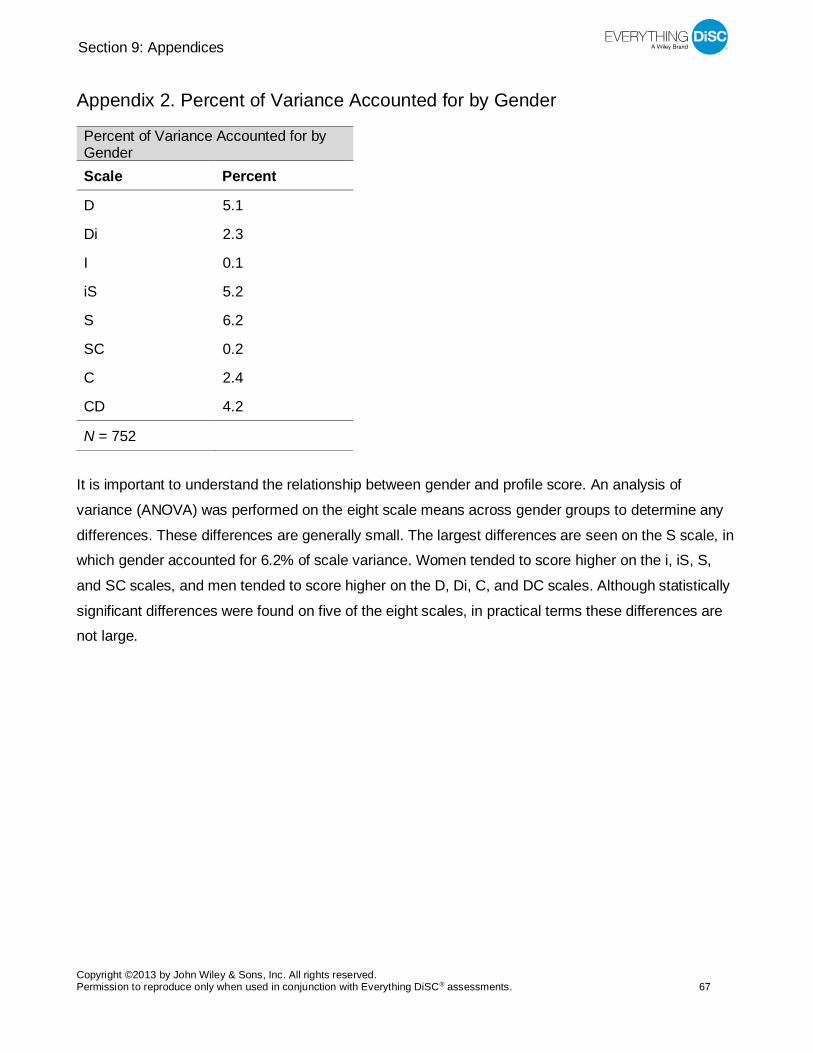
Section 9: Appendices
Copyright ©2013 by John Wiley & Sons, Inc. All rights reserved. Permission to reproduce only when used in conjunction with Everything DiSC® assessments. 67
Appendix 2. Percent of Variance Accounted for by Gender
Percent of Variance Accounted for by Gender Scale Percent
D 5.1
Di 2.3
I 0.1
iS 5.2
S 6.2
SC 0.2
C 2.4
CD 4.2
N = 752 It is important to understand the relationship between gender and profile score. An analysis of
variance (ANOVA) was performed on the eight scale means across gender groups to determine any
differences. These differences are generally small. The largest differences are seen on the S scale, in which gender accounted for 6.2% of scale variance. Women tended to score higher on the i, iS, S,
and SC scales, and men tended to score higher on the D, Di, C, and DC scales. Although statistically
significant differences were found on five of the eight scales, in practical terms these differences are not large.
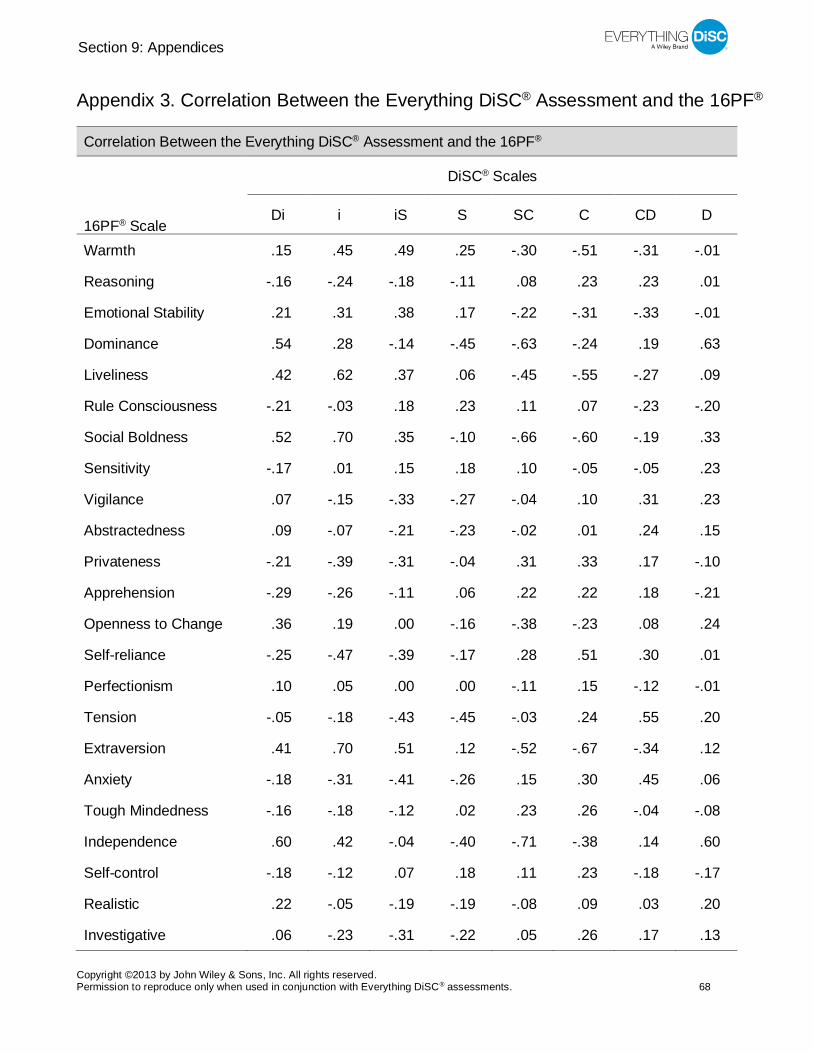
Section 9: Appendices
Copyright ©2013 by John Wiley & Sons, Inc. All rights reserved. Permission to reproduce only when used in conjunction with Everything DiSC® assessments. 68
Appendix 3. Correlation Between the Everything DiSC® Assessment and the 16PF®
Correlation Between the Everything DiSC® Assessment and the 16PF®
16PF® Scale
DiSC® Scales
Di i iS S SC C CD D
Warmth .15 .45 .49 .25 -.30 -.51 -.31 -.01
Reasoning -.16 -.24 -.18 -.11 .08 .23 .23 .01
Emotional Stability .21 .31 .38 .17 -.22 -.31 -.33 -.01
Dominance .54 .28 -.14 -.45 -.63 -.24 .19 .63
Liveliness .42 .62 .37 .06 -.45 -.55 -.27 .09
Rule Consciousness -.21 -.03 .18 .23 .11 .07 -.23 -.20
Social Boldness .52 .70 .35 -.10 -.66 -.60 -.19 .33
Sensitivity -.17 .01 .15 .18 .10 -.05 -.05 .23
Vigilance .07 -.15 -.33 -.27 -.04 .10 .31 .23
Abstractedness .09 -.07 -.21 -.23 -.02 .01 .24 .15
Privateness -.21 -.39 -.31 -.04 .31 .33 .17 -.10
Apprehension -.29 -.26 -.11 .06 .22 .22 .18 -.21
Openness to Change .36 .19 .00 -.16 -.38 -.23 .08 .24
Self-reliance -.25 -.47 -.39 -.17 .28 .51 .30 .01
Perfectionism .10 .05 .00 .00 -.11 .15 -.12 -.01
Tension -.05 -.18 -.43 -.45 -.03 .24 .55 .20
Extraversion .41 .70 .51 .12 -.52 -.67 -.34 .12
Anxiety -.18 -.31 -.41 -.26 .15 .30 .45 .06
Tough Mindedness -.16 -.18 -.12 .02 .23 .26 -.04 -.08
Independence .60 .42 -.04 -.40 -.71 -.38 .14 .60
Self-control -.18 -.12 .07 .18 .11 .23 -.18 -.17
Realistic .22 -.05 -.19 -.19 -.08 .09 .03 .20
Investigative .06 -.23 -.31 -.22 .05 .26 .17 .13
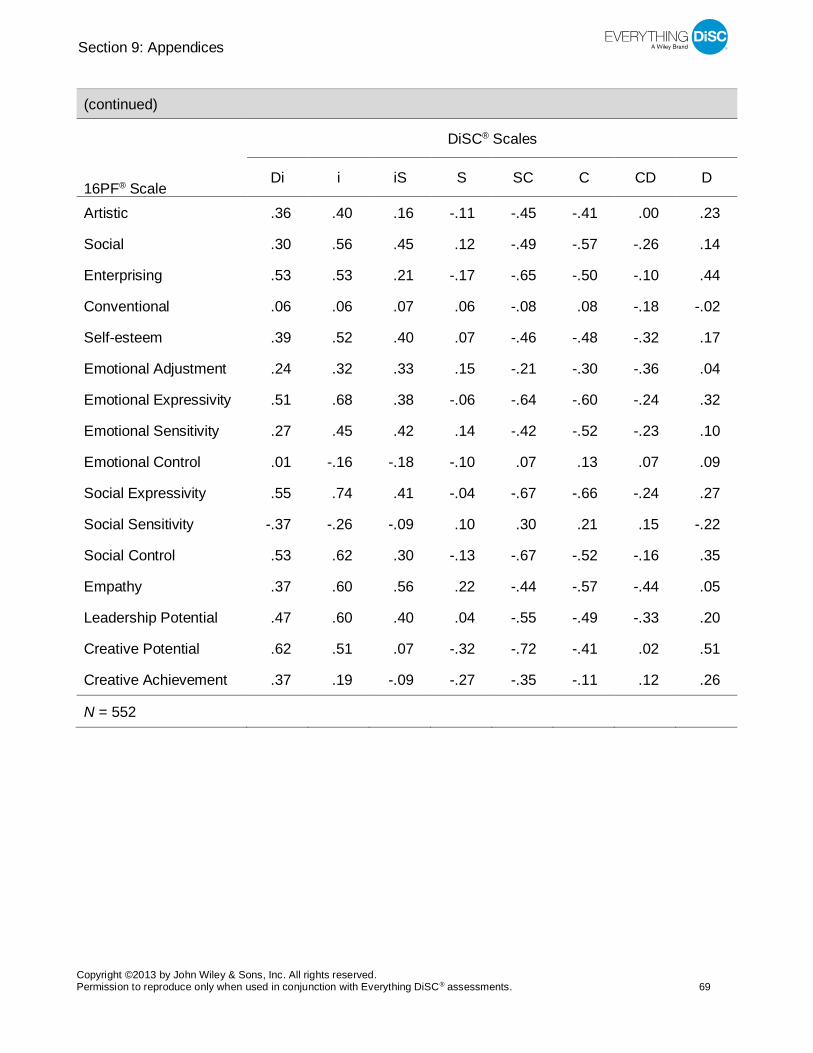
Section 9: Appendices
Copyright ©2013 by John Wiley & Sons, Inc. All rights reserved. Permission to reproduce only when used in conjunction with Everything DiSC® assessments. 69
(continued)
16PF® Scale
DiSC® Scales
Di i iS S SC C CD D
Artistic .36 .40 .16 -.11 -.45 -.41 .00 .23
Social .30 .56 .45 .12 -.49 -.57 -.26 .14
Enterprising .53 .53 .21 -.17 -.65 -.50 -.10 .44
Conventional .06 .06 .07 .06 -.08 .08 -.18 -.02
Self-esteem .39 .52 .40 .07 -.46 -.48 -.32 .17
Emotional Adjustment .24 .32 .33 .15 -.21 -.30 -.36 .04
Emotional Expressivity .51 .68 .38 -.06 -.64 -.60 -.24 .32
Emotional Sensitivity .27 .45 .42 .14 -.42 -.52 -.23 .10
Emotional Control .01 -.16 -.18 -.10 .07 .13 .07 .09
Social Expressivity .55 .74 .41 -.04 -.67 -.66 -.24 .27
Social Sensitivity -.37 -.26 -.09 .10 .30 .21 .15 -.22
Social Control .53 .62 .30 -.13 -.67 -.52 -.16 .35
Empathy .37 .60 .56 .22 -.44 -.57 -.44 .05
Leadership Potential .47 .60 .40 .04 -.55 -.49 -.33 .20
Creative Potential .62 .51 .07 -.32 -.72 -.41 .02 .51
Creative Achievement .37 .19 -.09 -.27 -.35 -.11 .12 .26
N = 552
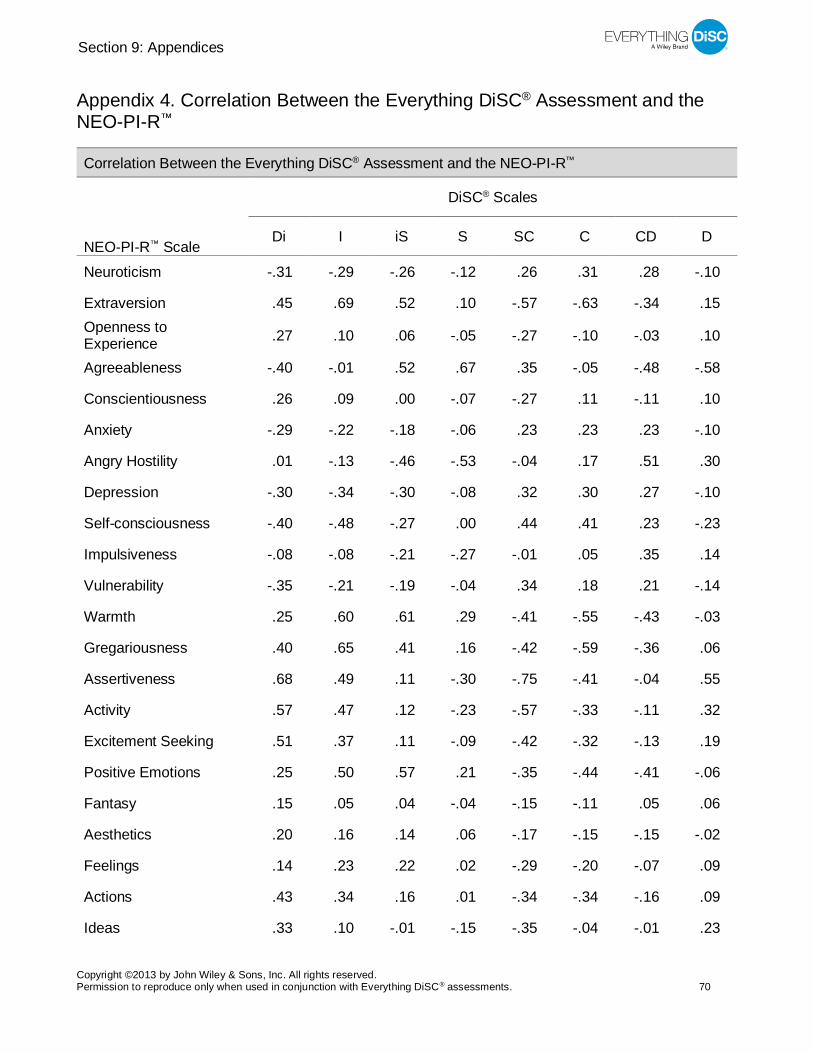
Section 9: Appendices
Copyright ©2013 by John Wiley & Sons, Inc. All rights reserved. Permission to reproduce only when used in conjunction with Everything DiSC® assessments. 70
Appendix 4. Correlation Between the Everything DiSC® Assessment and the NEO-PI-R™
Correlation Between the Everything DiSC® Assessment and the NEO-PI-R™
NEO-PI-R™ Scale
DiSC® Scales
Di I iS S SC C CD D
Neuroticism -.31 -.29 -.26 -.12 .26 .31 .28 -.10
Extraversion .45 .69 .52 .10 -.57 -.63 -.34 .15 Openness to Experience .27 .10 .06 -.05 -.27 -.10 -.03 .10
Agreeableness -.40 -.01 .52 .67 .35 -.05 -.48 -.58
Conscientiousness .26 .09 .00 -.07 -.27 .11 -.11 .10
Anxiety -.29 -.22 -.18 -.06 .23 .23 .23 -.10
Angry Hostility .01 -.13 -.46 -.53 -.04 .17 .51 .30
Depression -.30 -.34 -.30 -.08 .32 .30 .27 -.10
Self-consciousness -.40 -.48 -.27 .00 .44 .41 .23 -.23
Impulsiveness -.08 -.08 -.21 -.27 -.01 .05 .35 .14
Vulnerability -.35 -.21 -.19 -.04 .34 .18 .21 -.14
Warmth .25 .60 .61 .29 -.41 -.55 -.43 -.03
Gregariousness .40 .65 .41 .16 -.42 -.59 -.36 .06
Assertiveness .68 .49 .11 -.30 -.75 -.41 -.04 .55
Activity .57 .47 .12 -.23 -.57 -.33 -.11 .32
Excitement Seeking .51 .37 .11 -.09 -.42 -.32 -.13 .19
Positive Emotions .25 .50 .57 .21 -.35 -.44 -.41 -.06
Fantasy .15 .05 .04 -.04 -.15 -.11 .05 .06
Aesthetics .20 .16 .14 .06 -.17 -.15 -.15 -.02
Feelings .14 .23 .22 .02 -.29 -.20 -.07 .09
Actions .43 .34 .16 .01 -.34 -.34 -.16 .09
Ideas .33 .10 -.01 -.15 -.35 -.04 -.01 .23
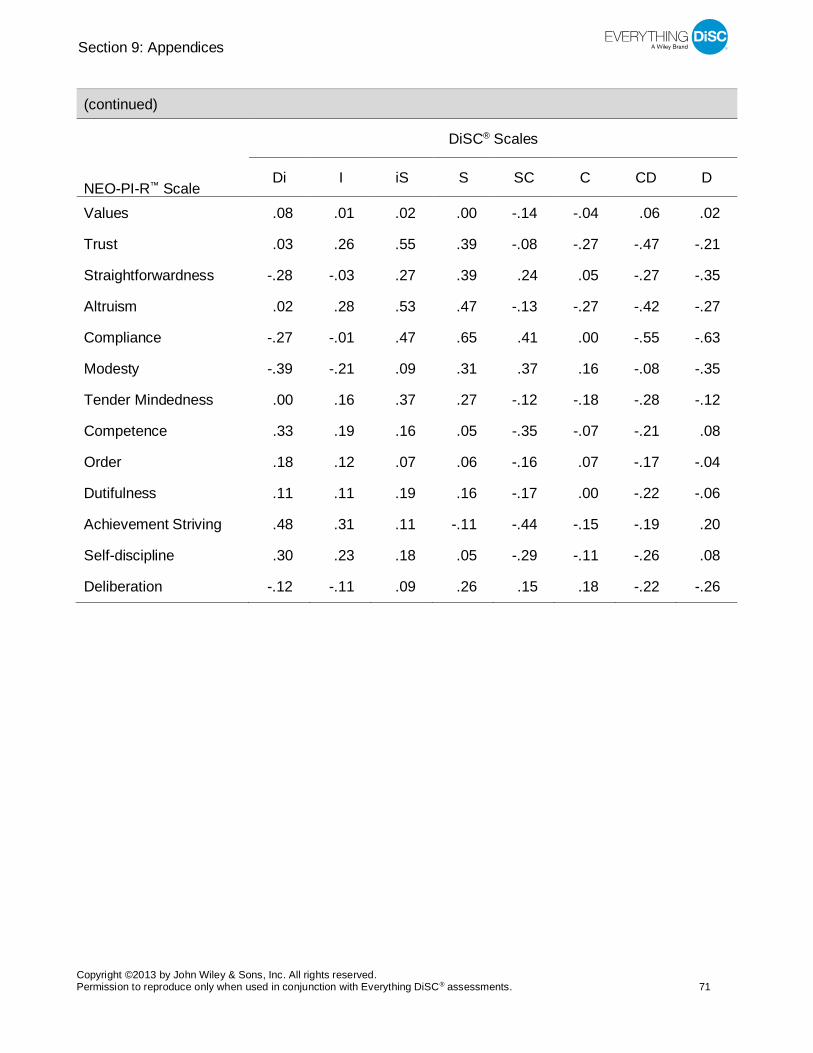
Section 9: Appendices
Copyright ©2013 by John Wiley & Sons, Inc. All rights reserved. Permission to reproduce only when used in conjunction with Everything DiSC® assessments. 71
(continued)
NEO-PI-R™ Scale
DiSC® Scales
Di I iS S SC C CD D
Values .08 .01 .02 .00 -.14 -.04 .06 .02
Trust .03 .26 .55 .39 -.08 -.27 -.47 -.21
Straightforwardness -.28 -.03 .27 .39 .24 .05 -.27 -.35
Altruism .02 .28 .53 .47 -.13 -.27 -.42 -.27
Compliance -.27 -.01 .47 .65 .41 .00 -.55 -.63
Modesty -.39 -.21 .09 .31 .37 .16 -.08 -.35
Tender Mindedness .00 .16 .37 .27 -.12 -.18 -.28 -.12
Competence .33 .19 .16 .05 -.35 -.07 -.21 .08
Order .18 .12 .07 .06 -.16 .07 -.17 -.04
Dutifulness .11 .11 .19 .16 -.17 .00 -.22 -.06
Achievement Striving .48 .31 .11 -.11 -.44 -.15 -.19 .20
Self-discipline .30 .23 .18 .05 -.29 -.11 -.26 .08
Deliberation -.12 -.11 .09 .26 .15 .18 -.22 -.26
Section 9: Appendices
Copyright ©2013 by John Wiley & Sons, Inc. All rights reserved. Permission to reproduce only when used in conjunction with Everything DiSC® assessments. 72
Appendix 5. References
IPAT (2009). 16PF fifth edition questionnaire manual. Champaign, IL: Institute for Personality and
Ability Testing.
Kiesler, D.J., Schmidt, J.A., & Wagner, C.C. (1997). A circumplex inventory of impact messages: An
operational bridge between emotion and interpersonal behavior. In R. Plutchik & H. Conte (Eds.),
Circumplex models of personality and emotions. Washington, DC: American Psychological Association.
McCrae, R.R., & Costa, P.T., Jr. (2010). NEO inventories: Professional manual. Odessa, FL: Psychological Assessment Resources.
Wiggins, J.S. (1995). Interpersonal adjective scales: Professional manual. Odessa, FL: Psychological Assessment Resources.
0921