Embed Size (px)
Citation preview
HSEHealth & Safety
Executive
Development of functional magnetic resonance imaging (fMRI) to measure the
central nervous system response to chronic back pain
Prepared by the University of Liverpool and University Hospital Aintree
for the Health and Safety Executive 2005
RESEARCH REPORT 394
HSEHealth & Safety
Executive
Development of functional magnetic resonance imaging (fMRI) to measure the
central nervous system response to chronic back pain
†*Dr Donna Lloyd BSc(Hons) D Phil (Oxon) †Professor Turo Nurmikko MBBS MD PhD
*Professor Neil Roberts BSc(Hons) MSc PhD *Magnetic Resonance Image Analysis Research Centre (MARIARC)
Pembroke Place University of Liverpool
Liverpool L69 3BX
†Pain Research Institute Clinical Sciences Centre
University Hospital Aintree Lower Lane
Liverpool L9 7AL
Aim of Investigation: To investigate evidence of brain hyper-responsivity and cortical reorganization in response to actual and anticipated pain using fMRI in patients with chronic low back pain vs. healthy controls.
Methods: 17 healthy controls and 20 chronic lower back pain patients were tested. To determine whether patients (vs. controls) were hypersensitive to actual (but clinically nonspecific) pain we applied noxious thermal stimulation to the right hand and mechanical stimulation to the lower back. Innocuous warm stimulation of the hand was also tested. To determine whether patients activate more in response to visual cues signalling expected vs anticipated clinically-relevant pain we presented coloured visual cues to the patient prior to lifting the patient’s leg to an elevation predetermined to cause discomfort and slight pain. Random effects group analyses are reported at a threshold of Z > 2.3, P <.01 (corrected) unless otherwise stated.
Results: Patients (vs controls) demonstrated significantly more activation of the contralateral parietal and prefrontal cortex in response to painful (and non-painful) thermal stimulation (vs rest) of the right hand plus ipsilateral activation of the anterior cingulate and insula cortices. An enlarged cortical reorganization of the somatosensory representation of the back following mechanical stimulation was observed with a medial shift of activation from healthy controls to patients. Finally, significantly more activation in response to a visual cue signalling expected painful movement of the leg (vs unexpected movement) was seen in right parietal and prefrontal cortices and the primary sensorimotor representation of the leg.
Conclusions: Cortical hyper-responsiveness is seen in response to actual and anticipated painful stimulation in patients with NSLBP vs. healthy controls in regions of the brain known to represent the sensory and emotive processing of pain and may suggest patients attend more generally to pain or to cues signalling pain (even in the absence of painful stimulation). Furthermore, the somatosensory region corresponding to the lower back is enlarged, which may suggest re-organisation of the brain in response to long-term pain or increased attention to this part of the body.
This work was part-funded by a grant from the Pain Relief Foundation.
This report and the work it describes were funded by the Health and Safety Executive (HSE). Its contents, including any opinions and/or conclusions expressed, are those of the authors alone and do not necessarily reflect HSE policy.
HSE BOOKS
© Crown copyright 2005
First published 2005
ISBN 0 7176 6170 9
All rights reserved. No part of this publication may bereproduced, stored in a retrieval system, or transmitted inany form or by any means (electronic, mechanical,photocopying, recording or otherwise) without the priorwritten permission of the copyright owner.
Applications for reproduction should be made in writing to:Licensing Division, Her Majesty's Stationery Office, St Clements House, 2-16 Colegate, Norwich NR3 1BQ or by e-mail to [email protected]
ii
ACKNOWLEDGEMENTS
The authors would like to thank all the volunteers who kindly participated in this study and the
team of Radiographers at the Walton Centre for Neurology and Neurosurgery who conducted
the MRI scanning of the volunteers.
The authors are also grateful to the team of pain clinicians at the Walton Centre for Neurology
and Neurosurgery for the referral of patients.
Finally, we would like to acknowledge the involvement of several members of the Pain
Research Institute and MARIARC staff who have helped with the successful running of this
project: Mr Bill Bimson (Senior Experimental Officer), Dr Niamh Redmond (now lecturer at
the Department of Medical Imaging, University of Liverpool), Mrs Kate MacIver (Specialist
Pain Nurse), Ms Heather Cameron (Specialist Pain Physiotherapist) and Ms Sioban Kelly
(Research Assistant).
iii

iv
CONTENTS
ACKNOWLEDGEMENTS iii
CONTENTS v
EXECUTIVE SUMMARY vii
1 INTRODUCTION 1
1.1 Background to the study 1
1.2 Aims and Objectives 3
2 METHODS 6
2.1 Participants 6
2.2 Clinical differentiation of patients 6
2.3 Psychological testing of patients 7
2.4 Psychophysical testing of patients 7
2.5 FMRI experimental protocol and apparatus 7
2.6 MRI scanning protocol 8
2.7 Analysis overview 8
3 RESULTS 10
3.1 Behavioural results 1: Questionnaire data 10
3.2 Behavioural results 2: Pain tolerance thresholds 12
3.3 FMRI results 14
4 DISCUSSION 21
5 CONCLUSIONS AND FUTURE PREDICTIONS 29
6 REFERENCES 30
APPENDIX 37
v

vi
EXECUTIVE SUMMARY
Between 1987-1990 the Magnetic Resonance and Image Analysis Research Centre
(MARIARC) at the University of Liverpool carried out a study funded by the Health and Safety
Executive (HSE) entitled “Development of functional magnetic resonance imaging (fMRI)
techniques to study lumbar disc disease in manual workers”. Subsequently a HSE funded
follow-up study commenced to determine the prevalence of low back pain and disc damage
among the working population (“Ten-year follow-up study of MR imaging appearance of the
lumbar spine with image analysis and back pain history” Ref: 2392/R56.87). In addition to
determining occupational risk groups for non-specific low back pain (NSLBP), we were also
interested in the manifestation of NSLBP. Specifically, we wanted to assess whether patients
with NSLBP would have an exaggerated brain response to a non-clinical pain when compared
to healthy controls, or even to the anticipation of a painful event, and whether this increase
would occur in areas of the brain responsible for encoding the sensory, emotive or cognitive
aspects of pain processing (commonly known as the ‘the pain matrix’).
In order to assess the relative contribution of the different components of the pain matrix in the
central response to pain in patients with NSLBP, the following report describes three
experimental paradigms designed to target the sensory-discriminative, affective-motivational
and cognitive-evaluative axes of pain processing. Through the application of these paradigms
we aim to find a reliable objective measure of the amount of pain felt by the patient and in doing
so form the basis for discerning whether a patient may have a motive for making things sound
better or worse than they are. For example, there is some evidence to suggest an increase in the
cortical response to non-specific pain in patients with idiopathic chronic low back pain, with
increased activation seen in the contralateral primary (SI) and secondary (SII) somatosensory
cortices, inferior parietal lobe, cerebellum and ipsilateral SII (Giesecke et al., 2004). These areas
are largely within the sensory dimension of pain processing and may suggest there is a
hyperactive response in these areas in individuals with chronic low back pain. This would
support the idea that these areas have become hyper-sensitised to painful sensory information
from the periphery such that patients with NSLBP do in fact ‘feel more’ pain than controls. We
also aim to show that the somatosensory representation of the lower back is reorganised as a
result of chronic back pain and thus provide a marker for monitoring the progressive beneficial
effect of rehabilitation therapy or surgery. Evidence that this may be the case has been reported
in studies using electroencephalography (EEG), which is a brain imaging tool with good
temporal but poor spatial resolution (Flor, Braun, Elbert, & Birbaumer, 1997). Finally, we aim
to show that the response to expected pain is greater than anticipated pain in patients with
NSLBP, which could be used to inform cognitive behavioural therapies for developing coping
strategies for expected pain to assist movement and reduce disability.
In order to identify those regions showing increased signal change to painful stimuli in patients
vs. controls and to measure the extent to which brain function may have been reorganised in
patients we developed three specific paradigms and tested seventeen healthy controls and
twenty patients with NSLBP. To determine whether patients (vs. controls) were hypersensitive
to actual (but clinically non-specific) pain in regions of the pain matrix seen previously to
respond to painful thermal stimulation in healthy controls, we applied noxious thermal
stimulation to the right hand during fMRI scanning. We also applied alternating blocks of
innocuous warm stimulation with the intent of testing whether patients would furthermore show
an increased response to a non-painful stimulus in the same areas of the brain activated in
response to a painful stimulus, suggestive of a physiological abnormality of sensory processing
(such as allodynia). Mechanical stimulation of the lower back in a second paradigm enabled us
to determine whether the somatosensory cortex of patients with NSLBP (vs. healthy controls) is
vii
re-organised as the result of NSLBP with enlargement and extension of the primary (and
possibly secondary) somatosensory cortex. This may be indicative of abnormal processing of
somatosensory information from the periphery in response to excessive nociceptive barrage or
increased attention to this part of the body. Finally, to understand better the role anticipation of
pain plays in chronic low back pain we adapted the ‘straight-leg raise’ used clinically as one of
the signs of excessive pain behaviour (‘Waddell Signs’) to the scanner. Participants were
visually-cued as to the nature of the upcoming event. This could be a straight-leg raise of the leg
deemed to be the most painful by the patient to an elevation pre-determined by the patient
(painful but not so much as to induce movement), where they were to expect that the leg would
be lifted (signified by the colour ‘green’) as this occurred with certainty on all trials or they
were to anticipate their leg would be raised (signified by the colour ‘yellow’) as this occurred
only on an unpredictable number of trials.
The results show patients demonstrated significantly more activation of the pain matrix in
response to both noxious thermal and mechanical stimulation when compared to healthy
controls (despite a lack of significant difference in peripheral pain tolerance thresholds to these
stimuli). Specifically, patients demonstrated increased activation of the contralateral parietal and
prefrontal cortex in response to painful (and non-painful) thermal stimulation (vs. rest) of the
right hand plus ipsilateral activation of the anterior cingulate and insula cortices. Furthermore,
in response to warm stimulation of the hand, patients demonstrated significantly more activation
of primary somatosensory cortex. An enlarged cortical reorganization of the somatosensory
representation of the back following mechanical stimulation was also observed with a medial
shift of activation from healthy controls to patients. Finally, significantly more activation in
response to a visual cue signalling expected painful movement of the leg (vs. unexpected
movement) was seen in right parietal and prefrontal cortices, the primary sensorimotor
representation of the leg, cingulate cortex, visual association areas and the sub-cortex largely in
the cerebellum and periaquaductal gray.
We interpret these results to suggest that patients with NSLBP demonstrate cortical hyper-
responsiveness in response to actual and anticipated painful stimulation (vs. healthy controls) in
regions of the brain known to represent the sensory and emotive processing of pain.
Specifically, increased activation in response to a noxious thermal stimulus in the parietal and
prefrontal cortices suggests increased attentional processing of painful stimuli whilst activation
of the cingulate and insula cortices suggests increased affective processing although patients did
not subjectively rate the stimulus as any more unpleasant. Increased sensory processing of the
warm stimulus may suggest a changed physiological response to somatic sensory information in
patients with NSLBP and this interpretation is corroborated by the finding of an enlarged cluster
of activation in the somatosensory cortex in patients vs. healthy controls in response to
mechanical stimulation of the lower back. Of potential therapeutic value is the finding that
patients activate similar areas in the expectation of pain as were seen to activate in the response
to actual physical pain. Specifically, increased activation in response to a visual cue signalling
when to expect a painful stimulus (vs. unknown anticipation of the painful event) activated
regions of the parietal, frontal and cingulate cortices, seen to activate in response to noxious
thermal stimulation of the hand, as well as a large extent of sensorimotor cortex. We interpret
these findings as suggesting that regions of the brain involved in the actual response to pain are
also activated in the anticipated response to pain and that innocuous cues (such as a visual
stimulus) can trigger a pain-reaction in the brain of patients with NSLBP. Further work will be
needed to qualify this interpretation; however, knowing that the mere thought of pain can induce
a cortical pain response in patients and that this can be triggered through innocuous cues may
provide a number of plausible treatment options in order to ‘de-sensitise’ patients to what they
perceive as cues to pain.
viii
1 INTRODUCTION
1.1 BACKGROUND TO THE STUDY
Non-specific low back pain (NSLBP) is highly prevalent with 80-90% of the population
experiencing low back pain at some point in their lives (Andersson, 1997). It can cause many
people to leave work due to repeated episodes of pain, resulting in financial burden, not only for
the family but also for the state in terms of increased long-term social security benefits and NHS
treatment. Many possible causative factors have been proposed, mostly focusing on various
occupational, lifestyle and psychological characteristics as well as pathology of the lumbar
spine (see companion report “Ten-year follow-up study of MR imaging appearance of the
lumbar spine with image analysis and back pain history” Ref: 2392/R56.87). However, few
firm conclusions have been drawn about the involvement of lumbar spine pathology in the
development and progression of pain, with a number of asymptomatic subjects having MRI-
diagnosed pathological features present in their lumbar spines whilst symptomatic subjects may
show little or no disc degeneration (Jensen et al., 1994; Jensen, Kelly, & Brant-Zawadzki,
1994). NSLBP, as well as the lack of observable pathology, is also largely resistant to treatment
and is associated with affect and illness behaviour (Fordyce, 1995; Waddell, 1992; Waddell,
Main, Morris, Di, & Gray, 1984; Waddell, McCulloch, Kummel, & Venner, 1980a). The
biopsychosocial model of NSLBP acknowledges the interaction between the patients’
cognitions about their pain and their experience of it. This interaction suggests there may be a
largely cerebral component to the pain experienced by patients with NSLBP, supported by the
fact that interventions aimed at reducing the emotional and cognitive burdens of the patients
back pain have shown consistent modest therapeutic success compared with more standard
medical procedures (Fordyce, 1995; Loeser, 1996).
The aim of this project was to use functional magnetic resonance imaging (fMRI) to define
objective differences in cerebral function arising from painful stimuli in patients with chronic
low back pain vs. healthy controls and in doing so, provide support for a central (i.e., the brain)
vs. peripheral (the back) causative factor for the ongoing pain felt by these patients. FMRI is a
non-invasive brain imaging technique, which allows high spatial resolution of both cortical and
sub-cortical brain structures without the need for ionising radiation (as used in positron emission
tomography). This technique has now been used in a number of studies investigating the central
response to noxious (typically thermal) stimuli in healthy volunteers with a great deal of
consensus on the structures involved in the sensory, emotional and cognitive aspects of pain
information processing, known commonly as ‘the pain matrix’ (for a recent meta-analysis see
(Peyron, Laurent, & Garcia-Larrea, 2000)). Painful stimulation is typically associated with
activation in secondary somatosensory cortex (SII), insula and anterior cingulate cortex (ACC;
(Derbyshire, 1999; Treede, Kenshalo, Gracely, & Jones, 1999)). Activation in the contralateral
thalamus and primary somatosensory (SI) cortex is also observed but less consistently (Disbrow
et al., 1995). More specifically, the sensory discriminatory aspects of the pain experience are
thought to be processed in the lateral thalamus and its subsequent projection to SI and perhaps
SII. The cognitive components are thought to be mediated in part by projections of the medial
thalamic system to the ACC and further regulated by prefrontal cortex. Affective responses to
pain are associated with activity in the more rostral section of the ACC (Rainville, Duncan,
Price, Carrier, & Bushnell, 1997; Vogt & Sikes, 2000). In addition, motor priming (resulting in
facilitation of a motor response) and motor inhibition may be reflected by activity in the motor
cortices, lentiform nucleus and cingulate motor areas, while responses in the anterior insula may
reflect affective responses and/or autonomic regulation combined with responses in the rostral
cingulate.
1
In order to assess the relative contribution of these different components of the pain matrix in
the central response to pain in patients with NSLBP, the following report describes three
experimental paradigms designed to target the sensory-discriminative, affective-motivational
and cognitive-evaluative axes of pain processing in this clinical group. Through the application
of these paradigms we aim to find a reliable objective measure of the amount of pain felt by the
patient and in doing so form the basis for discerning whether a patient may have a motive for
making things sound better or worse than they are. We also aim to show that the somatosensory
representation of the lower back is reorganised as a result of chronic back pain and thus provide
a marker for monitoring the progressive beneficial effect of rehabilitation therapy or surgery.
Evidence that this may be the case has been reported in studies using electroencephalography
(EEG), which is a brain imaging tool with good temporal but poor spatial resolution (Flor,
Braun, Elbert, & Birbaumer, 1997). This result therefore remains to be confirmed with the use
of a better spatial imaging modality such as fMRI. Finally, we aim to show that the response to
expected pain is greater than anticipated pain in patients with NSLBP, which could be used to
inform cognitive behavioural therapies for developing coping strategies for expected pain to
assist movement and reduce disability.
The symptoms of chronic low back pain share many similarities with other ‘central’ or ‘non
nociceptive’ idiopathic pain conditions such as irritable bowel syndrome (IBS) and fibromyalgia
syndrome (FMS). A common finding in these pain conditions is an increased pain response to
normally painful stimuli (‘mechanical hyperalgesia’) and/or a pain response to normally non-
painful stimuli (‘mechanical allodynia’). These characteristics may implicate central
mechanisms that exacerbate pain or that attenuate pain pathways in the central nervous system
(CNS). A handful of studies have now measured augmented central pain processing in cases of
idiopathic chronic low back pain, FMS and IBS using fMRI (Giesecke et al., 2004; Gracely et
al., 2004; Gracely, Petzke, Wolf, & Clauw, 2002) with a consensus of activation seen in all
three conditions in the contralateral SI and SII, inferior parietal lobe, cerebellum and ipsilateral
SII. These findings suggest there may be CNS dysfunction in these syndromes, which is
characterised by increased cortical excitability in areas of sensory, motor and association cortex.
One possible explanation for such increased response is that these areas have become hyper
sensitised to painful information from the periphery in patients with these types of pain
syndromes, which typically have extended illness duration. Although it is at present impossible
to test the changes in CNS function within the dorsal columns of the spinal cord, it is our aim
that with the high spatial resolution of fMRI we can provide insights into the extent and location
of cortical and sub-cortical activity in patients with low back pain to increase our theoretical
understanding of whether the brain changes as a consequence of chronic pain.
Despite the relatively little neuroimaging evidence for altered pain processing in patients with
NSLBP, there is significantly more clinical and behavioural evidence. There is no question that
patients with chronic pain experience a mixture of emotions including anxiety, depression, fear,
frustration and anger. However, two psychological factors in particular have been shown to
contribute significantly to the physical representation of pain; pain-related fear and
catastrophising (defined as the negative appraisal of pain and its meaning) have both been
indicated as predictors for future pain chronicity (Burton, Tillotson, Main, & Hollis, 1995; Fritz,
George, & Delitto, 2001; Klenerman et al., 1995; Peters, Vlaeyen, & Weber, 2005; Picavet,
Vlaeyen, & Schouten, 2002). In addition, fear and catastrophising have been shown to augment
physical disability more than the level of reported pain (McCracken, Gross, Aikens, & Carnrike,
Jr., 1996; McCracken, Zayfert, & Gross, 1992) and whereas physical pathology is not predictive
of disability, pain-related fear is (Vlaeyen, Kole-Snijders, Boeren, & van, 1995). Related to this,
NSLBP patients with high anxiety sensitivity (but low levels of pain) are more negatively
affected by the pain experience than patients who score low on measures of anxiety
(Asmundson & Norton, 1995). The manifestation of increased anxiety and negative appraisal of
the pain experience may result in patients with chronic pain selectively processing pain-related
2
information vs. other types of information (Pincus & Morley, 2001). For example, Crombez et
al., (Crombez, Vervaet, Lysens, Baeyens, & Eelen, 1998) have shown that patients with pain
who avoid and are fearful of re-injury pay more attention to painful and non-painful sensation
located in the back than those who are non-fearful. Therefore, any account of the neural
correlates of NSLBP must take into account psychological factors such as catastrophising and
fear as potential mediators of increased attentional processing of sensory information. To date,
only one neuroimaging study of a functional pain syndrome (fibromyalgia syndrome) has done
that (Gracely et al., 2004). Gracely et al., proposed that pain catastrophising would be associated
with greater activation in areas associated with the attentional and affective aspects of pain
among chronic pain patients undergoing painful stimulation. Analysis of subjects classified as
high or low catastrophisers showed that both groups displayed significant increases in
contralateral insula, SII, SI, inferior parietal lobe and thalamus in response to a normally painful
stimulus, but that high catastrophisers displayed unique activation in the contralateral anterior
ACC, and the lentiform nucleus bilaterally. These results support the hypothesis that
catastrophising influences pain perception through altering attention and anticipation (although
this was not measured directly) leading to an increased central response to a normal painful
stimulus.
1.2 AIMS AND OBJECTIVES
In order to build a detailed picture of the cortical response to painful stimulation in patients with
NSLBP, the current study has used three approaches; a) clinical differentiation of the patients in
terms of non-organic physical signs in the lower back (the so called ‘Waddell Signs’ see
Methods for details) used widely as a clinical marker of pain-related distress and psychological
disturbance b) behavioural markers of patients peripheral pain tolerance thresholds to thermal
pain applied to the hand and mechanical stimulation applied to the lower back as well as a series
of questionnaires designed to measure patients current pain levels and amount of pain-related
distress. In particular, we were interested in patients’ scores on the Pain Catastrophising Scale
(PCS; (Jensen, Turner, Romano, & Strom, 1995) a 13-item questionnaire measuring negative
thoughts about the meaning of pain with items scored on a 5 point scale of how much patients
think about their pain ‘from not at all’ to ‘all the time’, which should correlate with the Waddell
score assigned to the patient. Finally, in c) we aimed to provide neuroimaging evidence for a
difference in CNS function between all patients with NSLBP and healthy controls in response to
perception of site specific (the lower back) and non-specific (the hand) pain and anticipation of
pain using three specific paradigms (detailed below).
By collecting information on the clinical diagnosis of pain-related distress (the Waddell Sign)
assigned to each of our patients our future aim is to measure the difference in CNS function
between patients with high catastrophising scores and pain-related illness behaviour as
measured through the Waddell Signs and those patients with little or no pain-related distress or
illness behaviour. Due to the inherent problems of individual variability in group fMRI results, a
larger number of patients than reported here are needed to confirm any differences between
these groups of patients and will form the basis of a subsequent companion report. However,
our first aim of this study is to establish that there is indeed a behavioural difference (through
the measurement of peripheral pain tolerance thresholds and questionnaire scores) to support
this clinical diagnosis.
Aim I: We aim to identify whether patients assessed clinically as scoring high on the Waddell
Signs for pain-related illness behaviour also score high on behavioural self-report questionnaire
measures of pain catastrophising, anxiety, depression, and disability and fear-avoidance beliefs
relating to activities associated with their pain. Furthermore, we predict that these patients may
also have lowered thresholds for pain tolerance, not only at the peripheral site of pain (i.e., the
3
back) but also at a non-specific peripheral site (the hand) when compared to patients with
NSLBP who are assessed by the clinician as having little or no pain-related illness behaviour
and healthy controls. These will be measured using mechanical stimulation applied to the back,
which feels subjectively like an intense, deep low frequency vibration and a noxious thermal
stimulus applied to the hand, both set by the patients (and healthy controls) to a pain tolerance
threshold of 7/10. This is the level at which pain can be tolerated, not at which a stimulus is first
felt as painful.
Our next set of hypotheses relate specifically to the predicted differences in cerebral processing
between patients with NSLBP and healthy controls in terms of their response to noxious thermal
and mechanical stimuli applied to the hand and back and in their response to anticipated pain.
Validation of the clinical diagnosis with the behavioural measures will justify further
segregation of the results from the fMRI findings into groups based on their Waddell
classification. Therefore, the fMRI findings from the NSLBP groups as a whole in terms of their
cerebral response to actual and anticipated pain will provide an important understanding of the
putative regions involved.
Aim II: To investigate whether the cerebral response of the somatosensory system to noxious
(e.g., painful heat) and non-noxious (e.g. warmth) stimuli applied to the hand differed between
patients and healthy controls we used a noxious thermal stimulus (46-49oC) and an innocuous
warm stimulus (40oC) applied to the right hand and measured the fMRI response. This paradigm
enabled us to test the hypothesis that patients with NSLBP have increased cortical excitability to
both painful and non-painful stimuli compared to healthy controls, indicative of an alteration in
the basic cerebral function of the patient as a result of chronic low back pain. Previous studies in
healthy controls have identified a network of areas involved in the neural response to hot
thermal pain applied to the hand (Brooks, Nurmikko, Bimson, Singh, & Roberts, 2002a; Davis,
Kwan, Crawley, & Mikulis, 1998; Tracey et al., 2000). The areas identified include the insula,
inferior frontal gyrus, cingulate gyrus, SII, cerebellum, thalamus and medial frontal gyrus. In a
study by Derbyshire et al., (Derbyshire et al., 2002) patients (vs. controls) did not differ in their
response to a noxious thermal stimulus applied to the hand. However, their patient group had
only mild pain and Waddell Scores of on average 1.8 (implying little or no abnormal illness
behaviour). In patients with higher VAS scores and /or more extreme pain-related illness
behaviour we would expect more pronounced differences in the cortical response to painful and
non-painful thermal stimulation.
Aim III: To investigate whether, as a result of brain plasticity, somatosensory representation is
reorganised in patients with chronic low back pain (vs. controls) we applied mechanical
stimulation to the lower back during fMRI. Research in animals and humans has shown that
lesions of the afferent nerves may lead to extensive re-organisation of the spinal and cortical
zones that represent the de-afferented body region (e.g., phantom limb pain). Likewise, animal
and human research has shown that extensive tactile stimulation or training leads to an
expansion of the respective cortical area. Based on these findings Flor et al., (Flor et al., 1997)
hypothesised that ongoing painful stimulation might result in cortical re-organisation due to
excessive nociceptive barrage entering the nervous system. The resulting expansion of the
primary somatosensory cortex should be specific to the site of pain and should result in an
exaggerated cortical response to tactile stimuli from the painful body region. Their results show
that the maximum activity elicited in primary somatosensory cortex was shifted more medially
in the very chronic back pain subjects. Using the increased spatial resolution of fMRI we aim to
classify with the current paradigm the spatial extent of any shift in somatosensory activation
between patients and healthy controls.
Aim IV: Finally, to understand better the neural correlates of expectation vs. anticipation of pain
in patients with NSLBP we adapted the ‘straight-leg raise’ used clinically as one of the signs of
4
excessive pain behaviour for use within the confines of the scanning environment. Participants
were visually-cued as to the nature of the upcoming event. This could be a straight raise of the
leg deemed to be the most painful by the patient to an elevation pre-determined by the patient
(painful but not so much as to induce movement), where they were to EXPECT that the leg
would be lifted (signified by the colour ‘green’) as this occurred with certainty on all trials or
they were to ANTICPATE their leg would be raised (signified by the colour ‘yellow’) as this
occurred only on an unpredictable number of trials. Finally, the colour ‘red’ was used to
indicate when the leg would DEFINITELY NOT be raised. This paradigm provides unique
information on the cerebral structures involved in expecting and anticipating pain and
specifically, we predict the response to expected pain to be greater than anticipated pain in
patients. Studies investigating the anticipation and expectation of pain in healthy controls have
identified a network of areas involved in the response to expected and anticipated pain including
the rostral anterior cingulate cortex, posterior cerebellum, ventral premotor cortex,
periaquaductal grey, ventromedial prefrontal cortex, mid-cingulate cortex and hippocampus
(Bantick et al., 2002; Hsieh, Stone-Elander, & Ingvar, 1999; Ploghaus et al., 2001; Ploghaus et
al., 1999; Ploghaus, Becerra, Borras, & Borsook, 2003). The aim of this study was to investigate
whether these same regions would activate more in patients when expecting (vs. anticipating)
pain and thus identify neural correlates of increased pain-related anxiety.
To summarise, these aims ((ii) to (iv)) based on evidence from three neuroimaging paradigms
are likely to provide important information to assist in rehabilitation and treatment planning,
providing reliable objective measures of the amount of pain felt by the patient, whether the brain
is reorganised as a result of chronic back pain and whether there are significant differences in
the neural response to expected vs. anticipated pain (when compared to healthy controls), which
could be used to inform cognitive behavioural therapies for developing coping strategies for
pain to assist movement and reduce disability. Aim I is a crucial first step in determining
whether clinical differentiation of patients into those likely to have pain-related illness (and thus
pose potential treatment difficulties) validate their diagnosis through questionnaire measures of
anxiety, disability and distress or though altered peripheral sensation of site-specific vs. non
specific painful stimulation.
5
2 METHODS
2.1 PARTICIPANTS
Twenty chronic low back pain patients were recruited from out-patient clinical and non-surgical
referrals at the Walton Centre for Neurology and Neurosurgery (13 male: 7 female, age 36 –
67yrs, mean = 53yrs, SD = 9.97). Thus far twelve of these patients who have been assessed by
two pain clinicians, have met the criteria for little or no pain behaviour (0/5 or 1/5) based on the
Waddell Signs (see below), whilst the remaining eight patients have met the criteria for
exaggerated/abnormal pain behaviour (4/5 or 5/5). The patient inclusion criteria were:
x� Pain over 6 months
x� Mechanical back pain without sciatica
x� No previous operations for back pain (including facet denervation)
x� MRI (3 or less degenerate discs)
x� Straight Leg Raise associated with back pain (not leg pain)
The patient exclusion criteria were:
x� Positive result in 2 or 3 out of 5 Waddell tests
x� Pain behaviour pattern obscure or impossible to determine
x� No consent
x� On high doses of opioids
x� MR contraindications
In addition, seventeen healthy right-handed control participants were also scanned using the
same protocols as the patients (8 male: 9 female, age 26 – 53yrs, mean = 31yrs, SD = 8.1).
2.2 CLINICAL DIFFERENTIATION OF PATIENTS
In order to clinically differentiate patients with NSLPB on the basis of whether they
demonstrated significant abnormal pain-related illness behaviour or not the method of ‘Waddell
Signs’ was applied by two clinical specialists (TJN/GF) and cross-referenced by both to
determine the final categorisation of the patient into those with high vs. low abnormal pain
behaviour. The Waddell Signs are a series of physical signs frequently found in chronic pain
patients, particularly patients with chronic low back pain (Waddell, McCulloch, Kummel, &
Venner, 1980b). It was originally proposed that Waddell Signs should draw attention to the
possibility of abnormal illness behaviour (defined by Waddell as ‘maladaptive overt illness-
related behaviour which is out of proportion to the underlying physical disease and more readily
attributable to associated cognitive and affective disturbance’ (Waddell, 1987)). Specifically,
the Waddell Signs are; Tenderness (superficial skin tender to light touch or non-anatomic deep
tenderness not localised to one area); Simulation (axial loading pressure on the skull of a
standing patient induces lower back pain or rotation where the shoulders and pelvis rotated in
the same plane induces pain); Distraction (Difference in straight leg raising in supine and sitting
positions); Regional (weakness in many muscle groups i.e., ‘give-away weakness’ or where the
patient does not give full effort on minor muscle testing or sensory loss in a stocking or glove
distribution i.e., non-dermatomal); and Overreaction (disproportionate facial or verbal
expression i.e., pain behaviour).
In order to meet the criteria for little or no pain behaviour in the current study, participants must
score 0/5 or 1/5 when tested against all of the above and must have limited or no stereotyped
behaviour. In order to meet the criteria for high or exaggerated pain behaviour, participants must
6
score 4/5 or 5/5 when tested against the above and have major stereotyped pain behaviour.
Patients were then separated into Waddell Group 1 (little or no pain behaviour) or Group 2
(extreme pain behaviour).
2.3 PSYCHOLOGICAL TESTING OF PATIENTS
Each participant in the study was given a battery of questionnaires to be filled in prior to the
fMRI scan. This included the 11-point (ranging from 0 -10) now and 5-day visual analogue
scale (VAS; Price, McGrath, Rafii, & Buckingham, 1983), used by patients to indicate how
much pain they are feeling (by making a vertical mark across a horizontal line); the Fear-
Avoidance Beliefs Questionnaire (FABQ; Waddell, Newton, Henderson, Somerville, & Main,
1993), which tests patients beliefs about how much their pain interferes with their normal work
and social activities; the Pain Catastrophising Scale (PCS; Jensen et al., 1995), which indicates
whether patients have negative cognitions about their pain and, if so, what form these cognitions
are likely to take (i.e., rumination, magnification etc); the Pain Coping Strategies Questionnaire
(CSQ; Rosenstiel & Keefe, 1983) asks patients to identify what methods they employ to cope
with their pain (i.e., distraction, praying etc); whilst the Roland and Morris Disability
Questionnaire (RMDQ; Roland & Morris, 1983) and the SF-36 General Health Survey test
patients global opinions of their own health and disability. Finally, the Hospital Anxiety and
Depression Scale (HADS; Zigmond & Snaith, 1983) is used to indicate whether patients have
significant levels of anxiety or depression. Healthy controls were asked to fill in only the
HADS, SF-36 and VAS to ensure they had no significant levels of pain, ill-health or anxiety and
depression.
2.4 PSYCHOPHYSICAL TESTING OF PATIENTS
Immediately prior to fMRI scanning participants were tested for their individual pain-tolerance
thresholds to noxious thermal and mechanical stimulation. Whilst inside the scanner room, a
peltier thermode (see below for details) was attached to the participants’ right hand and
incremental steps in temperature were applied (starting at 32°C and increasing 2°C every 6
seconds from 44°C to a maximum temperature of 50°C). Participants rated the temperature from
5/10 (the point at which the stimulus was first noted as painful) until 7/10 (the point at which
the participant could not tolerate an increase in temperature). This value was then taken as the
participants’ pain-tolerance threshold for the fMRI scan. Similarly, to measure participants’
mechanical stimulation tolerance thresholds a custom-built stimulator (see below for details)
was applied to the lower back and incremental steps in voltage were applied until the
participants’ registered 7/10 (i.e., the point at which the mechanical stimulation had become
painfully intense but could be tolerated). This value was also used in the subsequent fMRI scan.
Finally, before the scan started, both stimuli were applied again to ensure the participants’ were
comfortable with the levels they had set.
2.5 FMRI EXPERIMENTAL PROTOCOL AND APPARATUS
Three experimental tasks were performed by each subject whilst inside the MR scanner. These
were:
Experiment 1: Hot thermal stimulation (44-49qC, measured pain intensity of 7/10) of the
thenar eminence of the right hand alternating with periods of warm (40°C) stimulation in an
ABAC blocked design where A is rest, B is hot painful stimulation and C is warm stimulation
(order counter-balanced between patients) (A = 15secs; B and C = 9secs; repeated 10 times).
7
Total scan time = 5 mins 51 secs. To deliver the thermal stimulation we used a Thermal Sensory
Analyzer (TSA-II, Medoc, Haifa, Israel; http://www.medoc-web.com), which uses a peltier
thermode to deliver hot, warm or cold stimuli; the timings for the stimuli are controlled via
custom software running on a Dell laptop.
Experiment 2: Mechanical stimulation of the lower back using phasic electrical stimulation
(0.25Hz) for 10 repeats of 15-second on/off epochs (ABAB design). Total scan time = 5 mins
15 secs. To deliver the mechanical stimulation a custom-made contact plate (to place on the
lower back) was made that was safe to use in the MRI environment and did not result in
degradation of the quality of the MRI image. This was controlled by a Thandor TG503 5MHz
Pulse/Function Generator with a Digitimer Constant Current Stimulator (model D57A) to
deliver the same frequency of stimulation (0.25Hz) at a mechanical intensity threshold
determined for each subject.
Experiment 3: Visually-cued raising of the leg (deemed to be the most painful by the patient)
to an elevation pre-determined by the patient (painful but not so much as to induce movement).
The colours used to signify expectation of movement (and thus pain) were: Green – expect
CERTAIN movement; Red – expect CERTAIN NO movement; Yellow – expect UNCERTAIN
movement. Each colour was presented 3 times for 15 seconds (interspersed with 15 seconds of
rest) in a pseudo-randomised order. To reduce movement-related artefacts this epoch was
further sub-divided into 10 seconds of colour observation followed by 5 seconds of movement.
These events were then modelled separately within the framework of the General Linear Model.
Total scan time = 7 mins 30 secs. For delivery of visual stimuli, an LCD projector (Epson
LMP7300) was connected to a Dell laptop computer running E-Prime software to enable images
to be back-projected onto a screen visible to patients/controls in the scanner. A trained
physiotherapist conducted the lifting of the patients’ leg.
2.6 MRI SCANNING PROTOCOL
MR data were acquired using a 1.5 T Signa LX/Nvi neuro-optimised system (General Electric,
Milwaukee, WI). FMRI was performed with a blood oxygenation level-dependent (BOLD) * sensitive T2 -weighted multislice gradient echo EPI sequence (TE = 40 ms, TR = 3 s, flip angle
= 90º, FOV = 19 cm, 64 x 64 matrix). Twenty-four contiguous 5-mm thick axial slices were
prescribed parallel to the AC-PC line and covered the whole brain. For the purpose of
anatomical referencing and visualisation of brain activation, a high-resolution T1-weighted 3D
inversion recovery prepared gradient echo (IRp-GRASS) sequence was acquired (TE = 5.4 ms,
TR = 12.3 ms, TI = 450 ms, 1.6-mm slice thickness, FOV = 20 cm, 256 x 192 matrix), with 124
axial slices covering the whole brain.
2.7 ANALYSIS OVERVIEW
2.7.1 Questionnaire data analysis Questionnaire data collected from all participants’ including the 11-point VAS (Price, McGrath,
Rafii, & Buckingham, 1983); the FABQ (Waddell, Newton, Henderson, Somerville, & Main,
1993); the PCS (Jensen et al., 1995); the CSQ (Rosenstiel & Keefe, 1983); the RMDQ (Roland
& Morris, 1983); the SF-36 General Health Survey and the HADS (Zigmond & Snaith, 1983)
were entered into Excel spreadsheets (Microsoft Office®) for graphical visualisation of the data
before calculating group mean differences using independent t-tests within SPSS v10 (SPSS
Inc., Chicago, IL).
2.7.2 Pain-tolerance threshold (PTT) data analysis
8
Each participants noxious thermal and mechanical PTT was entered into an Excel spreadsheet
(Microsoft Office®) for graphical visualisation of the data before calculating group mean
differences using independent t-tests within SPSS v10 (SPSS Inc., Chicago, IL).
2.7.3 FMRI data analysis FMRI data analysis was carried out using FEAT5 software (FMRI Expert Analysis Tool,
version 5, Oxford Centre for Functional Magnetic Resonance Imaging Analysis of the Brain –
FMRIB - University of Oxford), part of the FMRIB software library (FSL 3.1;
www.fmrib.ox.ac.uk/fsl). The following pre-statistics processing was applied; Motion
correction using MCFLIRT (Jenkinson & Smith, 2001); spatial smoothing using a Gaussian
kernel of FWHM 5mm; mean-based intensity normalisation of all volumes by the same factor;
non-linear highpass temporal filtering (Gaussian-weighted LSF straight line fitting). Statistical
analysis was carried out using FILM (FMRIB’s Improved Linear Model) with local
autocorrelation correction of the data (non-linear spatial smoothing and prewhitening – (Smith
& Brady, 1997; Woolrich, Ripley, Brady, & Smith, 2001)). Mixed effects group analysis (also
known as random effects) was carried out using FEAT5 software with statistic images
thresholded using clusters determined by Z > 2.3, P = 0.01 cluster-corrected (unless otherwise
stated) and transformed into the stereotaxic space of the Montreal Neurological Institute (MNI)
using FLIRT (FMRIB’s Linear Image Registration Tool; (Jenkinson et al., 2001). Between-
subject group level analyses were specified to test for explicit differences in the BOLD signal in
patients (collapsed across Waddell group) vs. healthy controls. Specifically, contrasts for each
Experiment were defined as follows:
Experiment 1: Firstly to determine the cerebral response to noxious thermal stimulation and
innocuous stimulation of the hand in healthy controls and patients we specified the contrasts
Noxious Heat vs. Rest [C1] Innocuous Warm vs. Rest [C2]. Then, to test whether patients had a
greater cortical response to noxious and innocuous thermal stimulation than healthy controls we
tested [C1] and [C2] at the second level between Patients vs. Controls and the contrast of
directionality [C1] – [C2] to identify those areas where activation to the noxious stimulus was
greater than the innocuous stimulus in patients vs. controls.
Experiment 2: To determine the somatosensory response to mechanical stimulation of the
lower back we specified the contrast Stimulation vs. Rest [C1] in both patients and healthy
controls and mapped these at the group level onto the same standardised image to determine
cortical location. Then, to test whether patients had a greater cortical response to noxious
mechanical stimulation than healthy controls we tested [C1] at the second level between
Patients vs. Controls.
Experiment 3: Finally, to determine the cortical response to the certainty of expecting a painful
event vs. an unexpected painful event we specified the contrasts of main effects ‘expected pain
(Green) [C1], ‘unexpected pain’ (Yellow) [C2] and ‘no pain’ (red) [C3] in patients vs. controls.
Then to test whether patients had significantly more activation to the expectation vs.
anticipation of a painful event we compared [C1] – [C2].
9
3 RESULTS
3.1 Behavioural Results 1: Questionnaire Data Patients completed a set of questionnaires designed to assess the degree of anxiety, depression,
distress and disability caused by their pain condition, and any pain-related behaviour. Healthy
controls completed only measures of anxiety and depression (HADS), general health (SF-36)
and pain level (VAS). In line with our predictions from Aim I, we have further sub-divided the
results from each questionnaire depending on whether the patient was categorised clinically as
having either low pain-related illness behaviour as measured through Waddell Signs (known
henceforth as Group 1) or high pain-related illness behaviour (denoted by Group 2). In doing so
we can answer whether patients clinically differentiated on the basis of meeting the Waddell
Signs for high pain-related illness behaviour also show a typical pattern of response through
self-report measures of high anxiety, depression, catastrophising, disability and fear of
movement.
3.1.1 Coping Strategies Questionnaire (CSQ) Independent t-test analysis with Waddell group and CSQ scores sub-set into Diverting
Attention, Reinterpreting Pain Sensation, Catastrophising, Ignoring Sensations, Praying/Hoping,
Coping Self Statements and Increased Behavioural Activities revealed significant differences
between the Group 1 and Group 2 patients on measures of Catastrophising (Group 1 Mean
Score = 8 (SE = 2.0); Group 2 Mean Score = 19 (SE = 2.4); p = .002), Ignoring Sensation
(Group 1 Mean Score = 18 (SE = 2.1); Group 2 Mean Score = 10 (SE = 2.1); p = .046) and an
approaching significant difference on Praying/Hoping (Group 1 Mean Score = 11 (SE = 2.0);
Group 2 Mean Score = 15 (SE = 3.6); p = .097 n.s.). All other factors were non-significant.
Healthy controls did not complete this questionnaire.
3.1.2 Pain Catastrophising Scale (PCS) Independent t-test analysis with Waddell group and PCS scores sub-set into Rumination,
Magnification, Helplessness and total PCS score revealed significant differences between the
Group 1 and Group 2 patients on measures of Rumination (Group 1 Mean Score = 6 (SE = 1.4);
Group 2 Mean Score = 13 (SE = 0.9); p = .001), Magnification (Group 1 Mean Score = 2 (SE =
0.6); Group 2 Mean Score = 5 (SE = 0.7); p = .007) and the total PCS score (Group 1 Mean
Score = 16 (SE = 3.8); Group 2 Mean Score = 33 (SE = 4.3); p = .018). Healthy controls did not
complete this questionnaire.
3.1.3 Roland and Morris Disability Questionnaire (RMDQ) Independent t-test analysis with Waddell group and total RMDQ score as related measures
revealed a significant overall difference between the Group 1 and Group 2 patients (Group 1
Mean Score = 13 (SE = 1.8); Group 2 Mean Score = 20 (SE = 0.9); p = .02). Healthy controls
did not complete this questionnaire.
3.1.4 Fear – Avoidance Beliefs Questionnaire (FABQ) Independent t-test analysis with Waddell group and FABQ scores sub-set into work and
activity-related constructs revealed a significant overall difference between the Group 1 and
Group 2 patients in fear-avoidance beliefs related to work only (Group 1 Mean Score = 19 (SE
= 4.9); Group 2 Mean Score = 44 (SE = 5.4); p = .0001) and not to general activity level.
Healthy controls did not complete this questionnaire.
3.1.5 Hospital Anxiety and Depression Scale (HADS) Independent t-test analysis with Waddell group and HADS scores sub-set into anxiety and
depression revealed a significant overall difference between the Group 1 and Group 2 patients in
10
measures of anxiety (Group 1 Mean Score = 7.3 (SE = 0.9); Group 2 Mean Score = 10.7 (SE =
0.9); p = .019), depression (Group 1 Mean Score = 15.7 (SE = 1.1); Group 2 Mean Score = 23.1
(SE = 1.7); p = .004) and HADS total score (Group 1 Mean Score = 8.5 (SE = 0.8); Group 2
Mean Score = 12.4 (SE = 1.2); p = .016). Compared to patients with low Waddell Scores
(Group 1) healthy control participants had significantly lower scores on measures of anxiety
(Controls Mean Score = 4.9 (SE = 0.7); Group 1 Mean Score = 7.3 (SE = 0.9); p = .045) and
depression (Controls Mean Score = 1.6 (SE = 0.5); Group 1 Mean Score = 15.7 (SE = 1.1); p <
.001). Compared to patients with high Waddell Scores (Group 2) healthy control participants
had significantly lower scores on measures of anxiety (Controls Mean Score = 4.9 (SE = 0.7);
Group 2 Mean Score = 10.7 (SE = 0.9); p < .001), depression (Controls Mean Score = 1.6 (SE =
0.5); Group 2 Mean Score = 23.1 (SE = 1.2); p < .001) and total HADS score (Controls Mean
Score = 6.5 (SE = 1.1); Group 2 Mean Score = 12.4 (SE = 1.2); p = .002).
3.1.6 Visual Analogue Scale (VAS): Now and 5-day Independent t-test analysis with Waddell group and total VAS scores sub-set into VAS – now
and VAS - 5 day revealed a significant overall difference between the Group 1 and Group 2
patients in the VAS – now score only (Group 1 Mean Score = 4.2 (SE = 0.6); Group 2 Mean
Score = 6.4 (SE = 0.6); p = .021). Compared to patients with low Waddell Scores (Group 1)
healthy control participants had significantly lower VAS - now scores (Controls Mean Score =
1.3 (SE = 0.7); Group 1 Mean Score = 4.2 (SE = 0.6); p = .005) and the VAS – 5 day (Controls
Mean Score = 1.1 (SE = 0.5); Group 1 Mean Score = 5.1 (SE = 0.6); p = < .001). Compared to
patients with high Waddell Scores (Group 2) healthy control participants had significantly lower
VAS - now scores (Controls Mean Score = 1.3 (SE = 0.7); Group 2 Mean Score = 6.4 (SE =
0.6); p < .001) and the VAS – 5 day (Controls Mean Score = 1.1 (SE = 0.5); Group 2 Mean
Score = 5.6 (SE = 1.1); p = < .001).
3.1.7 SF – 36 General Health SurveyIndependent t-test analysis with Waddell group and health constructs as related measures
revealed significant differences between Group 1 and Group 2 patients on measures of Role
Limitation – Physical (Group 1 Mean Score = 20.5 (SE = 10.0); Group 2 Mean Score = 0 (SE =
0.0); p = .068), Role Limitation – Emotion (Group 1 Mean Score = 63.6 (SE = 12.3); Group 2
Mean Score = 14.3 (SE = 14.3); p = .02), Social Functioning (Group 1 Mean Score = 57.7 (SE =
7.8); Group 2 Mean Score = 20.7 (SE = 10.5); p = .011), Energy (Group 1 Mean Score = 34.5
(SE = 7.5); Group 2 Mean Score = 10.3 (SE = 6.8); p = .041) and Pain (Group 1 Mean Score =
33.0 (SE = 3.0); Group 2 Mean Score = 15.7 (SE = 4.7); p = .005). Compared to patients with
low Waddell Scores (Group 1) healthy control participants had significantly higher scores on all
measures of the SF-36 (p < .001) except for Role Limitation – Emotion (p = 1.0, n.s.), Mental
Health (Controls Mean Score = 84.2 (SE = 2.7); Group 1 Mean Score = 61.0 (SE = 9.2); p =
.033), General Health (p = .19, n.s.) and Change in Health (Controls Mean Score = 58.8 (SE =
4.8); Group 1 Mean Score = 34.1 (SE = 5.1); p = .002). Compared to patients with high Waddell
Scores (Group 2) healthy control participants had significantly higher scores on all measures of
the SF-36 (p < .001) except for General Health (Controls Mean Score = 58.8 (SE = 4.8); Group
2 Mean Score = 34.1 (SE = 8.0); p = .012).
To summarise, all patients had higher levels of anxiety and depression than healthy controls
with higher pain ratings on the VAS now and 5-day and worse general health overall (as
measured with the SF-36). On all questionnaires completed only by the patients, those assessed
clinically as having high levels of pain-related illness behaviour (Group 2) showing 4/5 of the
Waddell Signs also scored higher on tests of pain catastrophising, disability, fear-avoidance
beliefs and anxiety and depression than patients assessed clinically as having low levels of pain-
related illness behaviour. The SF-36 general health survey revealed that Group 2 patients also
scored significantly lower on measures of social functioning, energy and pain and role
limitation related to physical and emotional functioning. VAS scores revealed significant
11
0 1 2 3 4
differences between the patient groups only in terms of their VAS – now scores and not their
VAS – 5 day scores.
3.2 Behavioural Results 2: Pain Tolerance Thresholds In order to test the hypothesis that patients have lowered thresholds for pain tolerance, not only
at the peripheral site of pain (i.e., the back) but also at a non-specific peripheral site (the hand)H
eat
To
lera
nce (
deg
C)
compared to healthy controls (Aim I) we measured peripheral pain tolerance thresholds to
mechanical stimulation applied to the back, which feels subjectively like an intense, deep low
frequency vibration and a noxious thermal stimulus applied to the hand, both set by the patients
(and healthy controls) to a pain tolerance threshold of 7/10. This is the level at which pain can
be tolerated, not at which a stimulus is first felt as painful. As with the questionnaire data, we
then further sub-divided the patients into those who had been assessed clinically as having high
levels of pain-related illness behaviour as measured through the Waddell Signs and those with
little or no pain-related illness behaviour as we predict lowered pain tolerance thresholds in
those patients with high levels of pain-related anxiety.
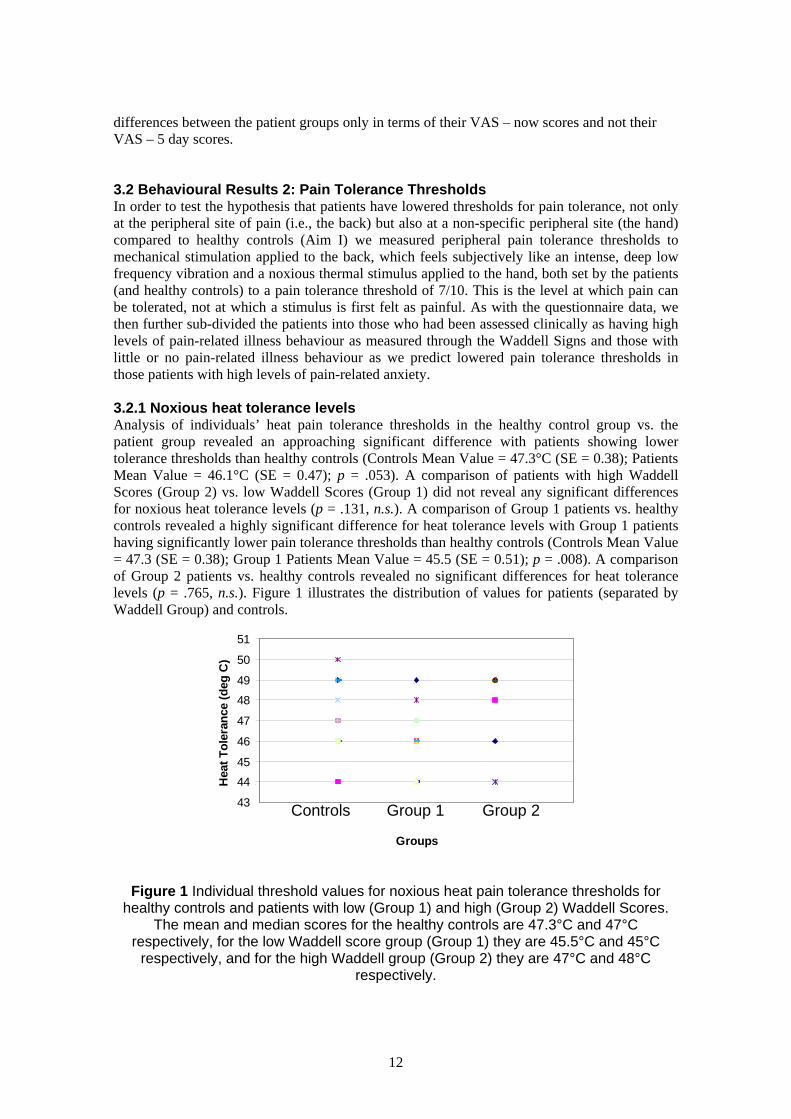
3.2.1 Noxious heat tolerance levels Analysis of individuals’ heat pain tolerance thresholds in the healthy control group vs. the
patient group revealed an approaching significant difference with patients showing lower
tolerance thresholds than healthy controls (Controls Mean Value = 47.3°C (SE = 0.38); Patients
Mean Value = 46.1°C (SE = 0.47); p = .053). A comparison of patients with high Waddell
Scores (Group 2) vs. low Waddell Scores (Group 1) did not reveal any significant differences
for noxious heat tolerance levels (p = .131, n.s.). A comparison of Group 1 patients vs. healthy
controls revealed a highly significant difference for heat tolerance levels with Group 1 patients
having significantly lower pain tolerance thresholds than healthy controls (Controls Mean Value
= 47.3 (SE = 0.38); Group 1 Patients Mean Value = 45.5 (SE = 0.51); p = .008). A comparison
of Group 2 patients vs. healthy controls revealed no significant differences for heat tolerance
levels (p = .765, n.s.). Figure 1 illustrates the distribution of values for patients (separated by
Waddell Group) and controls.
51
50
49
48
47
46
45
44
43 Controls Group 1 Group 2
Groups
Figure 1 Individual threshold values for noxious heat pain tolerance thresholds for healthy controls and patients with low (Group 1) and high (Group 2) Waddell Scores.
The mean and median scores for the healthy controls are 47.3°C and 47°C respectively, for the low Waddell score group (Group 1) they are 45.5°C and 45°C
respectively, and for the high Waddell group (Group 2) they are 47°C and 48°C respectively.
12
0 1 2 3 4
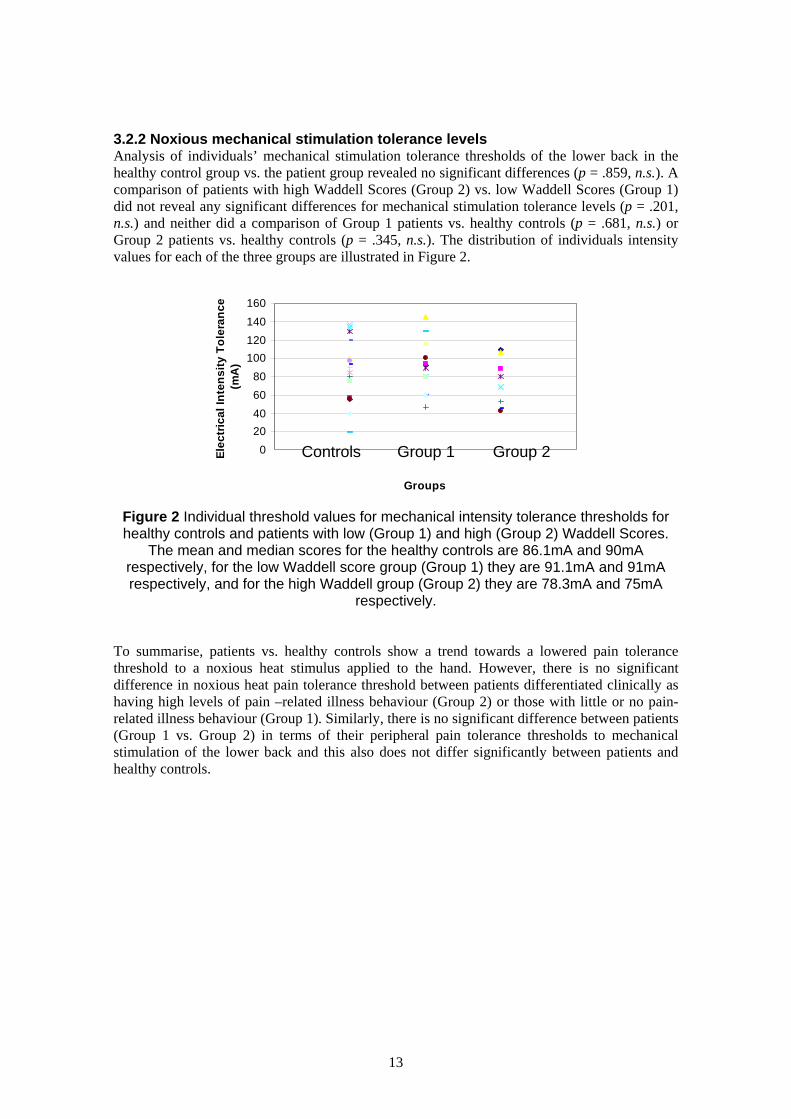
3.2.2 Noxious mechanical stimulation tolerance levels Analysis of individuals’ mechanical stimulation tolerance thresholds of the lower back in the
healthy control group vs. the patient group revealed no significant differences (p = .859, n.s.). A
comparison of patients with high Waddell Scores (Group 2) vs. low Waddell Scores (Group 1)
did not reveal any significant differences for mechanical stimulation tolerance levels (p = .201, E
lec
tric
al
Inte
ns
ity
To
lera
nc
e
n.s.) and neither did a comparison of Group 1 patients vs. healthy controls (p = .681, n.s.) or (m
A)
Group 2 patients vs. healthy controls (p = .345, n.s.). The distribution of individuals intensity
values for each of the three groups are illustrated in Figure 2.
160
140
120
100
80
60
40
20
0 Controls Group 1 Group 2
Groups
Figure 2 Individual threshold values for mechanical intensity tolerance thresholds for healthy controls and patients with low (Group 1) and high (Group 2) Waddell Scores.
The mean and median scores for the healthy controls are 86.1mA and 90mA respectively, for the low Waddell score group (Group 1) they are 91.1mA and 91mA respectively, and for the high Waddell group (Group 2) they are 78.3mA and 75mA
respectively.
To summarise, patients vs. healthy controls show a trend towards a lowered pain tolerance
threshold to a noxious heat stimulus applied to the hand. However, there is no significant
difference in noxious heat pain tolerance threshold between patients differentiated clinically as
having high levels of pain –related illness behaviour (Group 2) or those with little or no pain-
related illness behaviour (Group 1). Similarly, there is no significant difference between patients
(Group 1 vs. Group 2) in terms of their peripheral pain tolerance thresholds to mechanical
stimulation of the lower back and this also does not differ significantly between patients and
healthy controls.
13
3.3 FMRI Results
3.3.1 Noxious Thermal Stimulation of the HandIn order to test Aim II we measured, using fMRI, the cerebral response to noxious (e.g., painful
heat) and non-noxious (e.g. warmth) stimuli applied to the right hand in patients and healthy
controls. We predicted increased cortical excitability to both painful and non-painful stimuli in
patients compared to healthy controls in areas previously implicated in the neural response to
hot thermal pain applied to the hand (Brooks, Nurmikko, Bimson, Singh, & Roberts, 2002a;
Davis, Kwan, Crawley, & Mikulis, 1998; Tracey et al., 2000) including the insula, inferior
frontal gyrus, cingulate gyrus, secondary somatosensory cortex and posterior parietal lobe,
cerebellum, thalamus and medial frontal gyrus.
The main effect of noxious stimulation of the hand (vs. rest) in patients revealed bilateral
activation of the frontal, temporal and parietal cortices, the hippocampus and the anterior
cingulate cortex (for details see Table 1 of the Appendix). Ipsilateral activation was seen in the
insula and ventro-lateral nucleus of the thalamus, whilst contralateral activation was seen in the
primary somatosensory cortex and dorsomedial nucleus of the thalamus. Innocuous stimulation
of the hand (vs. rest) in patients revealed contralateral activation of the insula and premotor
cortex and ipsilateral activation of the supramarginal gyrus, the hippocampus, anterior cingulate
cortex and thalamus. The main effect of noxious stimulation of the hand in healthy controls
revealed a similar pattern of bilateral activation of the frontal and parietal cortices with
ipsilateral activation of the anterior and posterior cingulate cortices, temporal and parietal
cortex. Innocuous stimulation of the hand in healthy controls revealed contralateral activation of
the frontal and temporal cortex.
In order to define more accurately the similarity in response to a noxious thermal stimulus
applied to the hand in patients and controls, we overlapped (or superimposed) the main effect
group activation maps produced in response to noxious thermal stimulation of the hand vs. rest
in patients and controls (for details see Table 2 of the Appendix). Activity common to both
populations was seen in the cerebellum, temporal and frontal cortices, hippocampus and
putamen. No overlapping activation between patients and controls was seen to an innocuous
thermal stimulus. Healthy controls showed overlapping activation to both noxious and
innocuous thermal stimulation in the cerebellum, temporal and occipital lobes whilst patients
showed overlapping activation in the hippocampus and anterior cingulate sulcus (BA32/9).
To examine whether there were any significant differences between the response to noxious and
innocuous thermal stimulation in patients vs. healthy controls an independent t-test between
these two populations was conducted (see Methods for details). This analysis revealed
significantly more activation in the patient group vs. healthy controls in response to painful
thermal stimulation (vs. rest) of the right hand (for details see Table 3 of the Appendix). This
activation was seen mainly in the sulcus of the left supramarginal gyrus (BA40), with clusters
extending into the intraparietal sulcus and superior parietal lobe (BA7). A second cluster of
activation was seen bilaterally in the middle frontal gyrus (BA9/10/46), extending into the left
inferior frontal sulcus (BA44/6) and superior frontal gyrus. Two further peaks of activation
were seen, one in the right anterior insula cortex and one in the right anterior cingulate cortex
(illustrated in Figure 3). No regions activated more in response to noxious stimulation in healthy
controls than patients.
In response to warm stimulation of the hand (vs. rest) patients vs. controls again demonstrated
significantly more activation, this time of the supramarginal gyrus and middle frontal gyrus (for
details see Table 3 of the Appendix). Activation was also seen in the right anterior cingulate
cortex but not the insula. Further widespread activation was seen in the cerebellum, posterior
14
cingulate cortex and sub-cortical sites as well as the contralateral primary somatosensory area.
No regions activated more in response to noxious stimulation in healthy controls than patients.
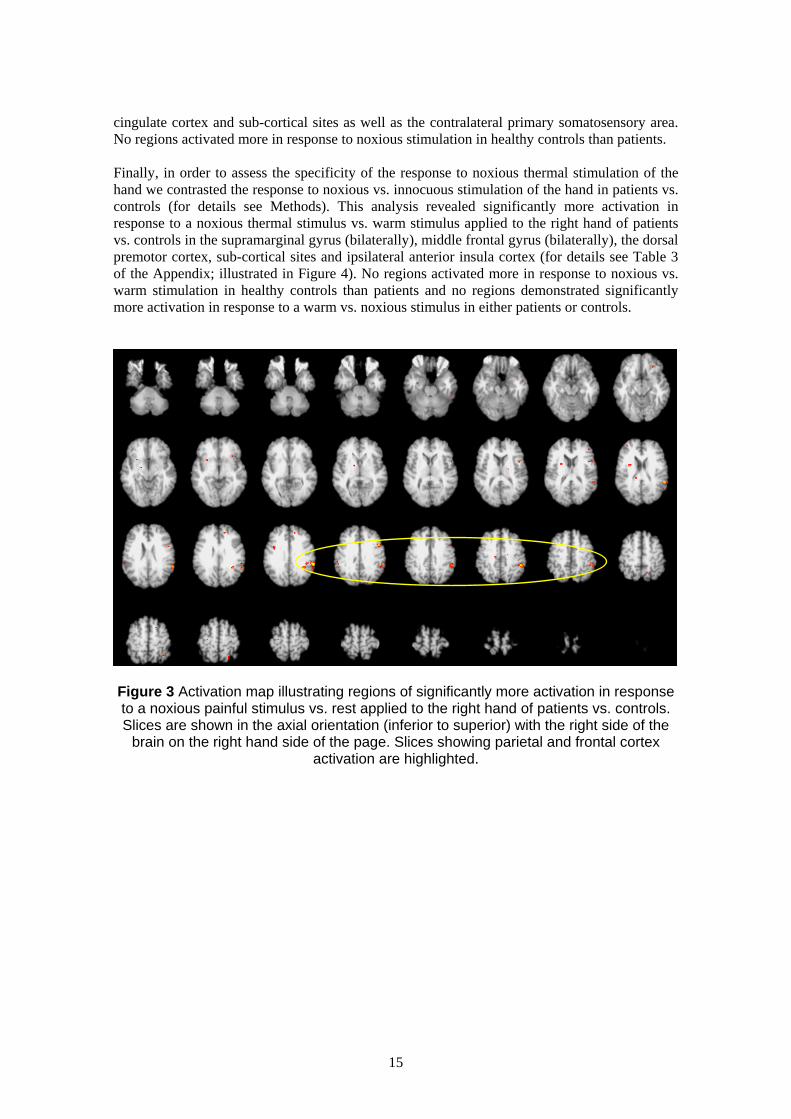
Finally, in order to assess the specificity of the response to noxious thermal stimulation of the
hand we contrasted the response to noxious vs. innocuous stimulation of the hand in patients vs.
controls (for details see Methods). This analysis revealed significantly more activation in
response to a noxious thermal stimulus vs. warm stimulus applied to the right hand of patients
vs. controls in the supramarginal gyrus (bilaterally), middle frontal gyrus (bilaterally), the dorsal
premotor cortex, sub-cortical sites and ipsilateral anterior insula cortex (for details see Table 3
of the Appendix; illustrated in Figure 4). No regions activated more in response to noxious vs.
warm stimulation in healthy controls than patients and no regions demonstrated significantly
more activation in response to a warm vs. noxious stimulus in either patients or controls.
Figure 3 Activation map illustrating regions of significantly more activation in response to a noxious painful stimulus vs. rest applied to the right hand of patients vs. controls. Slices are shown in the axial orientation (inferior to superior) with the right side of the
brain on the right hand side of the page. Slices showing parietal and frontal cortex activation are highlighted.
15
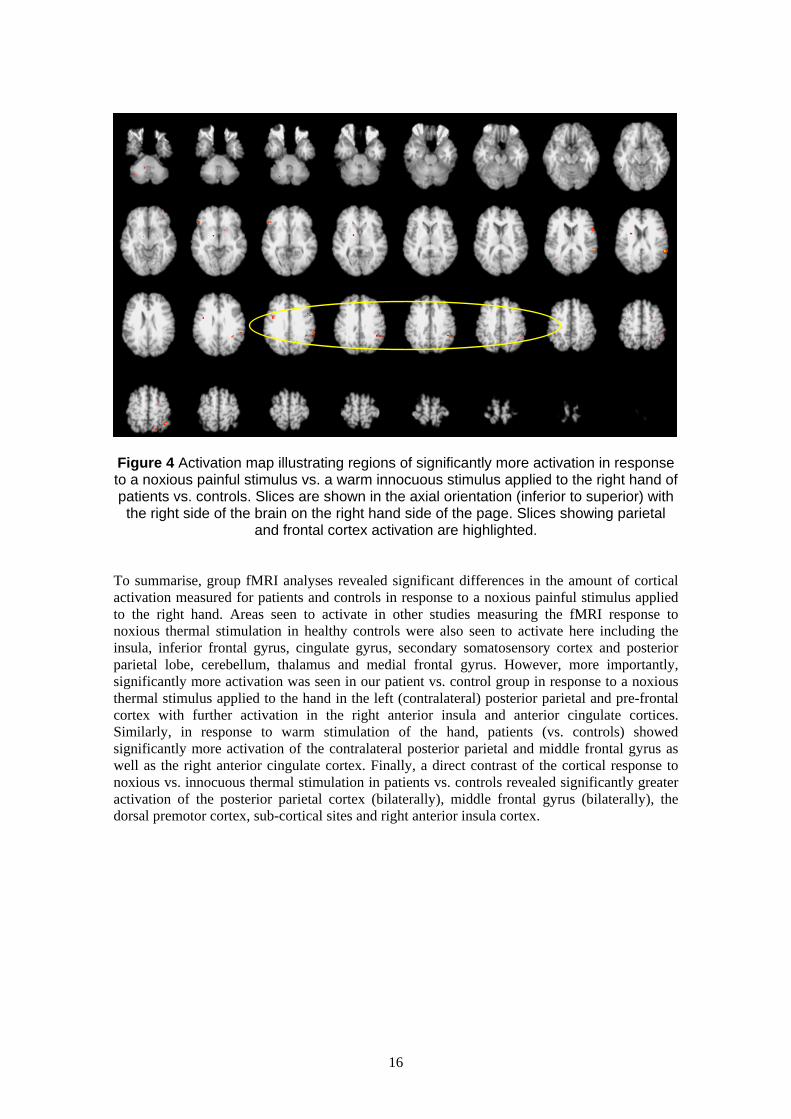
Figure 4 Activation map illustrating regions of significantly more activation in response to a noxious painful stimulus vs. a warm innocuous stimulus applied to the right hand of patients vs. controls. Slices are shown in the axial orientation (inferior to superior) with the right side of the brain on the right hand side of the page. Slices showing parietal
and frontal cortex activation are highlighted.
To summarise, group fMRI analyses revealed significant differences in the amount of cortical
activation measured for patients and controls in response to a noxious painful stimulus applied
to the right hand. Areas seen to activate in other studies measuring the fMRI response to
noxious thermal stimulation in healthy controls were also seen to activate here including the
insula, inferior frontal gyrus, cingulate gyrus, secondary somatosensory cortex and posterior
parietal lobe, cerebellum, thalamus and medial frontal gyrus. However, more importantly,
significantly more activation was seen in our patient vs. control group in response to a noxious
thermal stimulus applied to the hand in the left (contralateral) posterior parietal and pre-frontal
cortex with further activation in the right anterior insula and anterior cingulate cortices.
Similarly, in response to warm stimulation of the hand, patients (vs. controls) showed
significantly more activation of the contralateral posterior parietal and middle frontal gyrus as
well as the right anterior cingulate cortex. Finally, a direct contrast of the cortical response to
noxious vs. innocuous thermal stimulation in patients vs. controls revealed significantly greater
activation of the posterior parietal cortex (bilaterally), middle frontal gyrus (bilaterally), the
dorsal premotor cortex, sub-cortical sites and right anterior insula cortex.
16
3.3.2 Mechanical stimulation of the lower back
In order to test Aim III we assessed, using fMRI, whether the somatosensory representation of
the lower back is reorganised is patients with NSLBP vs. healthy controls by stimulating the
lower back of both patients and controls with an intense mechanical stimulus (which feels
subjectively like an intense low-frequency vibration).
The main effect of stimulation of the lower back of patients revealed bilateral activation of
secondary somatosensory cortex (at the level of the parietal operculum) and inferior parietal
lobe and right-lateralised activation of the ventral premotor cortex, primary somatosensory
cortex and superior temporal gyrus (for details see Table 4 of the Appendix). The main effect of
stimulation of the lower back in healthy controls revealed entirely right-lateralised activation of
the primary and secondary somatosensory cortices, mid-insula cortex, inferior parietal lobe,
superior temporal gyrus and parahippocampal gyrus. The extent of activity within the primary
(SI) and secondary (SII) somatosensory cortices in both patients and controls is illustrated in
Figure 5.
As before, a superimposition of the above group maps of main effects revealed that patients and
healthy controls conjointly activated the right mid-anterior insula cortex, superior temporal
gyrus, premotor cortex and sylvian fissure and the inferior frontal gyrus, parietal operculum and
inferior parietal lobe bilaterally (for details see Table 4 of the Appendix).
A between groups t-test of the response to stimulation of the lower back in patients vs. controls
revealed significantly more activation in response to noxious mechanical stimulation of the
lower back in patients vs. healthy controls in the superior, middle and medial frontal gyri,
dorsomedial superior parietal lobe, temporal and occipital cortices, mid-insula and posterior
cingulate cortex (for details see Table 4 of the Appendix). Conversely, controls revealed
significantly more activation than patients in response to noxious mechanical stimulation of the
lower back across the temporal cortices, the inferior frontal gyrus (premotor cortex and
precentral sulcus), anterior cingulate gyrus and primary motor cortex and sub-cortical sites in
the periaquaductal gray (PAG), midbrain, thalamus and parahippocampal gyrus (for details see
Table 4 of the Appendix).
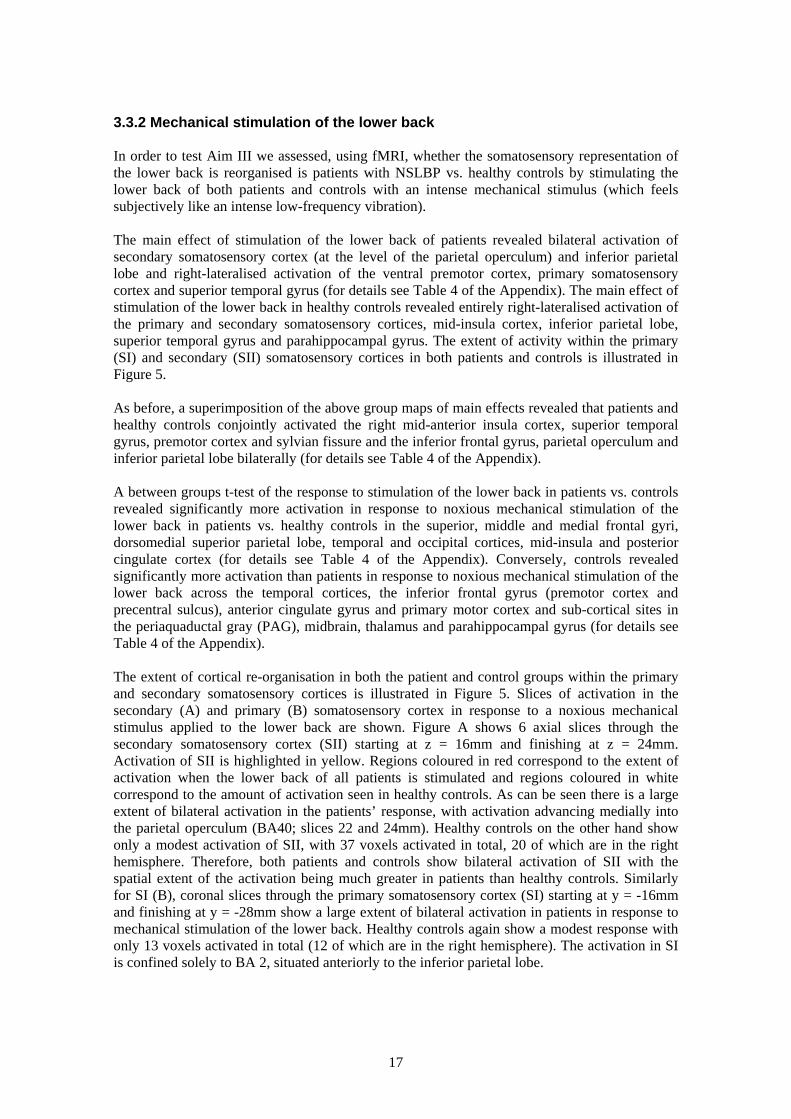
The extent of cortical re-organisation in both the patient and control groups within the primary
and secondary somatosensory cortices is illustrated in Figure 5. Slices of activation in the
secondary (A) and primary (B) somatosensory cortex in response to a noxious mechanical
stimulus applied to the lower back are shown. Figure A shows 6 axial slices through the
secondary somatosensory cortex (SII) starting at z = 16mm and finishing at z = 24mm.
Activation of SII is highlighted in yellow. Regions coloured in red correspond to the extent of
activation when the lower back of all patients is stimulated and regions coloured in white
correspond to the amount of activation seen in healthy controls. As can be seen there is a large
extent of bilateral activation in the patients’ response, with activation advancing medially into
the parietal operculum (BA40; slices 22 and 24mm). Healthy controls on the other hand show
only a modest activation of SII, with 37 voxels activated in total, 20 of which are in the right
hemisphere. Therefore, both patients and controls show bilateral activation of SII with the
spatial extent of the activation being much greater in patients than healthy controls. Similarly
for SI (B), coronal slices through the primary somatosensory cortex (SI) starting at y = -16mm
and finishing at y = -28mm show a large extent of bilateral activation in patients in response to
mechanical stimulation of the lower back. Healthy controls again show a modest response with
only 13 voxels activated in total (12 of which are in the right hemisphere). The activation in SI
is confined solely to BA 2, situated anteriorly to the inferior parietal lobe.
17
AAA
16mm 18mm 20mm 22mm 24mm
B
RIGHT LEFT
R L
16mm 18mm 20mm 22mm 24mm
B
RIGHT LEFT
R L
16mm 18mm 20mm 22mm 24mm16mm 18mm 20mm 22mm 24mm
B
RIGHT LEFT
R L
-16mm -18mm -20mm -22mm -28mm-16mm -18mm -20mm -22mm -28mm-16mm -18mm -20mm -22mm -28mm-16mm -18mm -20mm -22mm -28mm
Figure 5 Slices of activation in the secondary (A) and primary (B) somatosensory cortex in response to a noxious mechanical stimulus applied to the lower back. Figure
A shows 6 axial slices through the secondary somatosensory cortex (SII) starting at z = 16mm and finishing at z = 24mm. Activation of SII is highlighted in yellow, with regions
coloured in red corresponding to the extent of activation when the lover back of patients is stimulated and regions coloured in white corresponding to the amount of
activation seen in healthy controls. Figure B shows 6 coronal slices through the primary somatosensory cortex (SI) starting at y = -16mm and finishing at y = -28mm. Activation of SI is again highlighted in yellow, with regions coloured in red corresponding to the
extent of activation when the lover back of patients is stimulated and regions coloured in white corresponding to the amount of activation seen in healthy controls.
To summarise, patients show a greater extent of activation of both the primary and secondary
somatosensory cortices when stimulating the lower back as compared to the activation produced
by healthy controls. In addition, increased activation outside of the somatosensory cortices is
seen, predominantly in the frontal cortex in patients and sub-cortical sites in healthy controls.
18
3.3.3 Visually-cued raising of the lower leg In order to test Aim IV, namely that patients would activate more in response to a visual cue
signalling a CERTAIN up-coming painful event vs. a visual cue signalling an UNCERTAIN
up-coming painful event, we adapted the straight-leg raise used clinically as a measure of pain-
related anxiety. Studies investigating the anticipation and expectation of pain in healthy controls
have identified a network of areas involved including the rostral anterior cingulate cortex,
posterior cerebellum, ventral premotor cortex, periaquaductal grey, ventromedial prefrontal
cortex, mid-cingulate cortex and hippocampus (Bantick et al., 2002; Hsieh, Stone-Elander, &
Ingvar, 1999; Ploghaus et al., 2001; Ploghaus et al., 1999; Ploghaus, Becerra, Borras, &
Borsook, 2003). We expected to see similar areas activated in patients in response to expected
and anticipated pain only more so in response to expected pain.
Our results show activation in patients in response to a visual cue signalling expected raising of
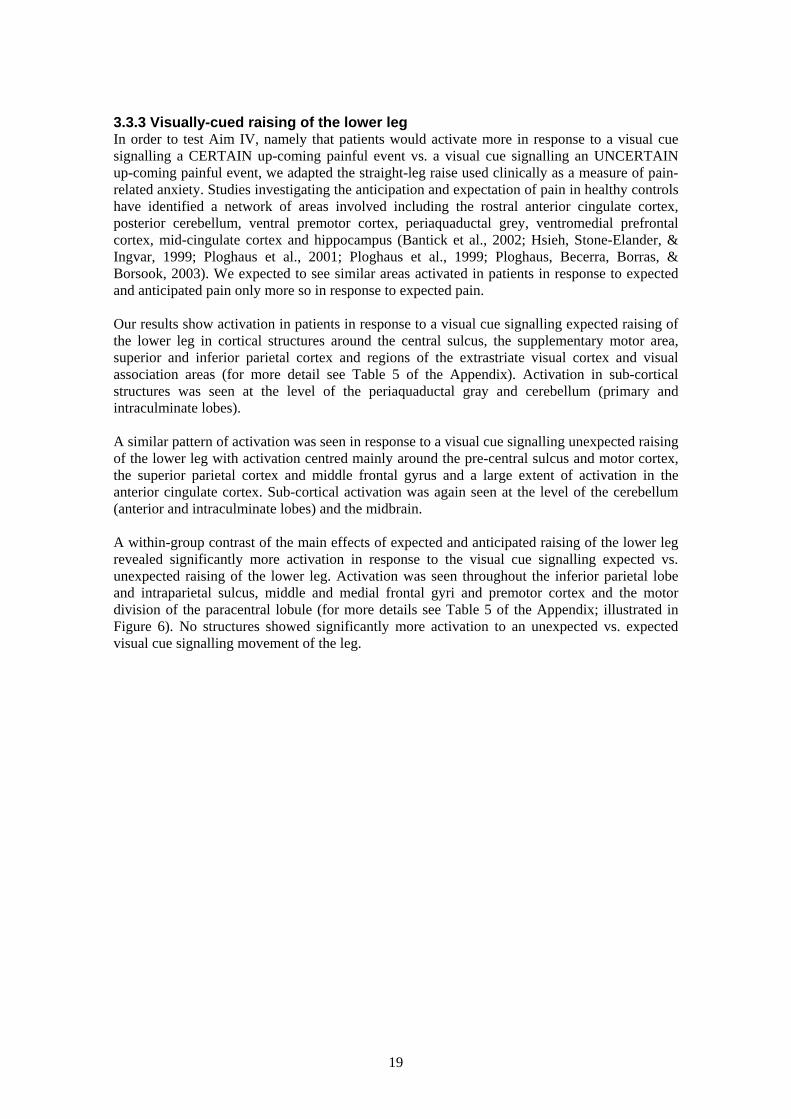
the lower leg in cortical structures around the central sulcus, the supplementary motor area,
superior and inferior parietal cortex and regions of the extrastriate visual cortex and visual
association areas (for more detail see Table 5 of the Appendix). Activation in sub-cortical
structures was seen at the level of the periaquaductal gray and cerebellum (primary and
intraculminate lobes).
A similar pattern of activation was seen in response to a visual cue signalling unexpected raising
of the lower leg with activation centred mainly around the pre-central sulcus and motor cortex,
the superior parietal cortex and middle frontal gyrus and a large extent of activation in the
anterior cingulate cortex. Sub-cortical activation was again seen at the level of the cerebellum
(anterior and intraculminate lobes) and the midbrain.
A within-group contrast of the main effects of expected and anticipated raising of the lower leg
revealed significantly more activation in response to the visual cue signalling expected vs.
unexpected raising of the lower leg. Activation was seen throughout the inferior parietal lobe
and intraparietal sulcus, middle and medial frontal gyri and premotor cortex and the motor
division of the paracentral lobule (for more details see Table 5 of the Appendix; illustrated in
Figure 6). No structures showed significantly more activation to an unexpected vs. expected
visual cue signalling movement of the leg.
19
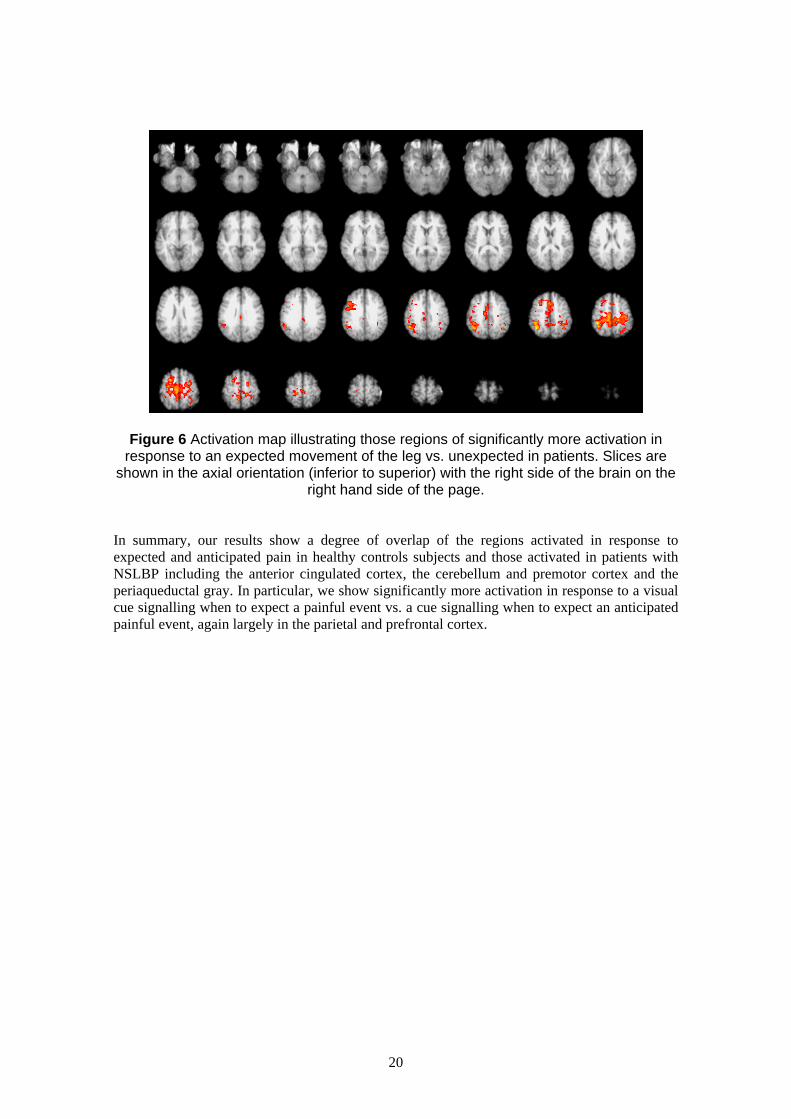
Figure 6 Activation map illustrating those regions of significantly more activation in response to an expected movement of the leg vs. unexpected in patients. Slices are
shown in the axial orientation (inferior to superior) with the right side of the brain on the right hand side of the page.
In summary, our results show a degree of overlap of the regions activated in response to
expected and anticipated pain in healthy controls subjects and those activated in patients with
NSLBP including the anterior cingulated cortex, the cerebellum and premotor cortex and the
periaqueductal gray. In particular, we show significantly more activation in response to a visual
cue signalling when to expect a painful event vs. a cue signalling when to expect an anticipated
painful event, again largely in the parietal and prefrontal cortex.
20
4 DISCUSSION
The results of this study have shown significant differences in cerebral activation in patients
with NSLBP and healthy controls in response to actual and anticipated pain. Patients
demonstrated significantly more activation of the pain matrix in response to both noxious
thermal and mechanical stimulation when compared to healthy controls in regions identified
through other human imaging studies to represent the sensory and emotive response to pain.
These findings may suggest that patients with NSLBP demonstrate cortical hyper-
responsiveness to actual and anticipated painful stimulation (vs. healthy controls). Specifically,
patients demonstrated increased activation of the contralateral parietal and prefrontal cortex in
response to painful (and non-painful) thermal stimulation (vs. rest) of the right hand plus
ipsilateral activation of the anterior cingulate and insula cortices. Increased activation in
response to a noxious thermal stimulus in the parietal and prefrontal cortices suggests increased
attentional processing of painful stimuli whilst activation of the cingulate and insula cortices
suggests increased affective processing although patients did not subjectively rate the stimulus
as any more unpleasant. In response to warm stimulation of the hand, patients demonstrated
significantly more activation of primary somatosensory cortex, which may suggest a changed
physiological response to somatic sensory information in patients with NSLBP and this
interpretation is corroborated by the finding of an enlarged cluster of activation in the
somatosensory cortex in patients vs. healthy controls in response to mechanical stimulation of
the lower back. Finally, significantly more activation in response to a visual cue signalling
expected painful movement of the leg (vs. unexpected movement) was seen in right parietal and
prefrontal cortices, the primary sensorimotor representation of the leg, cingulate cortex, visual
association areas and the sub-cortex largely in the cerebellum and periaquaductal gray. This
finding may be of potential therapeutic value as it seems that patients activate similar areas in
the expectation of pain as were seen to activate in the response to actual physical pain.
Specifically, increased activation in response to a visual cue signalling when to expect a painful
stimulus (vs. unknown anticipation of the painful event) activated regions of the parietal, frontal
and cingulate cortices, seen to activate in response to noxious thermal stimulation of the hand,
as well as a large extent of sensorimotor cortex. We interpret these findings as suggesting that
regions of the brain involved in the actual response to pain are also activated in the anticipated
response to pain and that innocuous cues (such as a visual stimulus) can trigger a pain-reaction
in the brain of patients with NSLBP. Further work will be needed to qualify this interpretation;
however, knowing that the mere thought of pain can induce a cortical pain response in patients
and that this can be triggered through innocuous cues may provide a number of plausible
treatment options in order to ‘de-sensitise’ patients to what they perceive as cues to pain.
Secondary to the main neuroimaging findings, we have also shown through the use of
questionnaire self-report measures that patients score significantly higher on measures of
anxiety, depression and pain when compared to healthy controls with worse general health
overall and furthermore, that those patients assessed clinically as having high levels of pain-
related illness behaviour (Group 2) showing 4/5 of the Waddell Signs also scored higher on tests
of pain catastrophising, disability, fear-avoidance beliefs and anxiety and depression than
patients assessed clinically as having low levels of pain-related illness behaviour (Aim I). We
predict that the cortical changes observed here are unlikely to be the result of a change in the
peripheral processing of pain signals to the cortex and may have a more direct correlation with
patients psychological functioning. This aim will be explicitly tested with the recruitment of
more patients.
Before discussing the results in more detail, the limitations of the present study should be
highlighted. Out of the twenty NSLBP patients tested, eight demonstrated significant pain
21
related illness behaviour, scoring 4/5 or 5/5 on the Waddell Signs (Group 2), whilst twelve were
rated as having little or no pain-related illness behaviour (0/5 or 1/5 Waddell Signs – Group 1).
In the current study, these patients have been combined for the purposes of analysing the fMRI
data, which requires a very minimum of twelve participants for interpretation of group results
due to inherent problems of individual variability. However, we acknowledge that both the
clinical and psychometric data presented here suggest these are two different populations and so
combining them may introduce more variability into the group results and lead to a subsequent
under-estimation in the size of the group effect we are reporting here. We are currently in the
process of recruiting several more participants into each of the patient groups with the aim of
having equal numbers of healthy controls, Group 1 and Group 2 patients (supported through a
grant from the Pain Relief Foundation to Donna Lloyd; projected completion date May 2005).
However, we feel that the results of the current study provide fundamentally important
information on whether brain function does indeed change as a result of NSLBP and the
putative cortical and sub-cortical regions involved, which can be used to interpret subsequent
results.
Two hypotheses of the current study relate to whether brain function in patients with NSLBP is
changed in response to a noxious painful stimulus applied either to a part of the body not related
to the patients clinical pain (i.e., the hand; Aim II) or a site, which is related to the patients pain
(i.e., the lower back; Aim III). We predicted that brain activation should increase in response to
stimulation of these sites in patients with NSLBP vs. healthy controls. Firstly, in response to
noxious thermal stimulation of the hand we have shown a similarity in the response in both our
patient and control group, which also matches those areas reported by others in the literature to
noxious thermal stimulation of the hand using neuroimaging techniques in both healthy controls
(Brooks, Nurmikko, Bimson, Singh, & Roberts, 2002b; Davis et al., 1998) and patients
(Derbyshire et al., 2002). The areas typically identified include the somatosensory and motor
cortices, the anterior cingulate cortex (ACC), the parietal and prefrontal cortices and the insula,
thalamus, posterior cingulate cortex and cerebellum. These areas have been classically referred
to as forming a ‘pain matrix’ for the central processing of pain (Melzack & Wall, 1965).
However, contrary to previous findings, significantly more activation was seen in our patient vs.
control group in response to a noxious thermal stimulus applied to the hand. This increase in
activation was seen in the contralateral posterior parietal and pre-frontal cortex with further
activation in the right anterior insula and anterior cingulate cortices. In a similar study by
Derbyshire et al., (Derbyshire et al., 2002), which also compared activation in response to
noxious thermal stimulation between patients with NSLBP and healthy controls, significant
differences in the cortical response between the two groups were not conclusively found.
However, we consistently see an increase in activation of the parietal, prefrontal and anterior
cingulate cortices in the current study, not only to noxious stimulation (for example, a direct
contrast of the cortical response to noxious vs. innocuous thermal stimulation in patients vs.
controls revealed significantly greater activation of the posterior parietal cortex (bilaterally),
middle frontal gyrus (bilaterally), the dorsal premotor cortex, sub-cortical sites and right anterior
insula cortex) but also to warm stimulation. Patients (vs. controls) showed significantly more
activation of the contralateral posterior parietal and middle frontal gyrus as well as the right
anterior cingulate cortex.
There are now several lines of evidence (including the findings of the current study) that activity
in the anterior cingulate, insula, parietal and prefrontal cortices may have an important role in
pain processing in functional pain syndromes (such as NSLBP). For example, Cook et al.,
(Cook et al., 2004) found that patients with fibromyalgia exhibited greater activity than controls
in response to painful and non-painful stimuli in the insula cortex. This region has previously
been implicated in the attentional processing of unpleasant noxious stimuli by Brooks et al.,
(Brooks, Nurmikko, Bimson, Singh, & Roberts, 2002c) vs. the posterior insula, which is
thought to be involved in the thermosensory discriminative response (Craig, Chen, Bandy, &
22
Reiman, 2000). In addition to attending more to peripheral noxious thermal stimulation, there is
further evidence from the study by Cook et al., (2004) and from the results of the current study
that patients also attend more to innocuous thermal stimulation of the hand, with activity in both
studies seen in the prefrontal, insula and anterior cingulate cortices. Cook et al., interpret their
findings as providing a physiological explanation for fibromyalgia, whereby there is increased
cortical excitability within prefrontal, motor, insula and cingulate cortex resulting in normally
non-painful stimuli becoming painful (‘mechanical allodynia’). We suggest our results provide
even stronger evidence for heightened cortical responsivity to non-painful stimuli in patients
with NSLBP, which is further exemplified by overlapping the group maps of main effects to
noxious and innocuous thermal stimulation in patients, which reveals conjoint activation within
the hippocampus and anterior cingulate sulcus (BA32/9). These results suggest that patients
have an exaggerated response to innocuous thermal stimulation (which activates similar regions
as noxious thermal stimulation), and which may be attentional/affective/motivational in nature.
One interpretation of these results may be that, because patients are generally more anxious than
healthy controls (as evidenced by psychometric scores, see Section 3.1); increased activation
within the hippocampus and anterior cingulate cortex to both types of thermal stimulation is the
result of a generalised anxiety response to the experimental environment. The activation of the
hippocampus would support this supposition within the context of the Gray-McNaughton theory
(McNaughton, 1997). Or it may be consistent with the fact that patients encode the affective-
motivational and cognitive aspects of a sensory stimulus and not the sensory-discriminative
qualities (Becerra et al., 1999).
Evidence for the involvement of the prefrontal cortex in chronic low back pain has come from a
series of studies by Apkarian and colleagues demonstrating significant structural and functional
changes in this region in patients with pain of over 6 months duration. In an earlier study,
abnormal brain chemistry was investigated and a reduction in the prefrontal cortex N-acetyl-
aspartate-creatine ratio was identified, demonstrating neuronal loss or dysfunction in this region
(Grachev, Fredrickson, & Apkarian, 2000). In a later study, this time assessing cognitive
abilities on an emotional decision-making task (Apkarian et al., 2004) indirect evidence for
abnormal prefrontal cortex processing was given by lower task performance and more
disadvantageous choices being made by patients (including a mixture of patients with low back
pain and patients with complex regional pain syndrome) vs. healthy controls. More direct
evidence for the dysfunction of prefrontal cortex in patients with chronic low back pain has
come from a more recent study using structural magnetic resonance imaging with two
independent automated morphometry approaches to contrast brain morphology of patients to
matched normal controls. Patients with chronic low back pain showed 5-11% less neocortical
gray matter volume than control subjects (equivalent to 10-20 years of normal aging). The
decreased volume was related to pain duration and was furthermore reduced in bilateral
dorsolateral prefrontal cortex and right thalamus. Altogether the results of these studies by
Apkarian and colleagues suggest findings that may constitute a pathophysiology of chronic
pain, characterised by neuronal loss and altered cognitive function, particularly in the pre-frontal
cortex. Although we did not test for cognitive function per se in the current study, extensive
prefrontal cortex activation was seen (BA 6/44/46/47) in this group of patients with prolonged
pain status (on average 10 years) and may therefore support the conclusions of Apkarian and
colleagues of dysfunctional processing of the prefrontal cortex in patients with chronic (back)
pain.
Indirect evidence for the role of the prefrontal cortex in human pain processing has also come
from a number of imaging studies in healthy controls. The pre-frontal cortex of humans has
previously been identified as an early component of the emotional response to noxious stimuli
(Becerra, Iadarola, & Borsook, 2004). It is thought to represent the sensation of ‘feeling before
knowing’ in response to a threatening stimulus as a study measuring time delay from painful
information coming from the foot vs. the hand revealed a significant delay in activation of the
23
somatosensory cortices (consistent with the difference in neural transmission time from the foot
compared to the hand) but not in the prefrontal cortex. Activation in this region in the current
study may therefore suggest that patients have an enhanced sense of the unpleasantness of a
painful stimulus as is also suggested by the presence of a small cluster of activation in the mid-
anterior cingulate cortex, the anterior portion of which is known to contain cells, which activate
in response to noxious cutaneous thermal stimulation and fear-induced activity making it
selectively vulnerable to chronic pain and stress syndromes (Vogt, Berger, & Derbyshire, 2003).
Given that activation of the prefrontal cortex may reflect increased attention or greater
anticipation to painful stimuli in patients vs. healthy controls in the current study, this reasoning
may also account for activation of the parietal cortices, which often activate simultaneously in
noxious thermal stimulation paradigms (Tracey et al., 2000). The parietal lobes may reflect
increased spatial attentional processing of sensory inputs or they may be more directly involved
in nociceptive processing as nociceptive cells have been found in BA5/7 of the superior parietal
cortex of the monkey (Dong, Chudler, Sugiyama, Roberts, & Hayashi, 1994). The combined
activation of the inferior and superior parietal cortices in the current study suggest both
increased nociceptive processing and increased spatial attention to sensory inputs occurring on
the body. Why these factors would contribute to the chronic pain state is unclear but Hsieh et
al., (1995) propose that activation of the parietal lobes reflects processes involved in
hypervigilence to sensory information, which maintains the chronic state. This region is
connected to the limbic system (Cavada & Goldman-Rakic, 1989) and has reciprocal
connections to the prefrontal cortex, thalamus and striatum and may constitute, with the ACC, a
network involved in learning, avoidance and sensory integration. Therefore, it seems that the
posterior parietal and prefrontal cortex plus the ACC form part of the limbic system for
increased arousal and avoidance.
An important final result of the current study is the fact that activity within the primary
somatosensory cortex (SI) was only seen when stimulating the hand of patients, not the hands of
healthy controls. This may suggest that SI activity in patients reflects increased processing of
the sensory-discriminative aspects of the perception of pain or it may suggest increased
attention to a peripheral sensory stimulus, which has previously been shown to augment the
BOLD signal within SI (Johansen-Berg, Christensen, Woolrich, & Matthews, 2000). However,
activation of SI is often reported sporadically throughout the literature and this inconsistency
may be due to several reasons. Apkarian et al (Apkarian, Gelnar, Krauss, & Szeverenyi, 2000)
have demonstrated that, because SI cells have properties of centre surround inhibition, a smaller
stimulator (2 cm2) is better for activating SI. The size of the stimulator does not affect the
secondary somatosensory cortex (SII) or the insula as cells in these areas do not posses this
characteristic. Therefore, the stimulator used in the current study at 3 cm2 may be on the border
of activating SI cells, making it more difficult to detect a reliable BOLD signal in this area. In
addition, cells in SI have been shown to have a bimodal response distribution, with an initial
minor peak in the haemodynamic response matching the response profile to brush-evoked
activity and a longer second peak (occurring ~8s after offset of stimulus), which may
correspond to the unpleasant ‘after-sensation’ of a noxious thermal stimulus (Chen, Ha,
Bushnell, Pike, & Duncan, 2002). However, stimuli were only modelled for as long as the
stimulus lasted and so we may have missed this ‘second peak’ phenomena in our data. A further
reason for a lack of SI activation to noxious stimulation, according to Disbrow et al., (Disbrow,
Buonocore, Antognini, Carstens, & Rowley, 1998) is that in SI, nociceptive and non-
nociceptive neurons are intermixed and that using a static thermal stimulus may activate only
area 3a, which is a relatively small proportion of the total SI and unlikely to activate supra-
threshold to a transient thermal stimulus. In summary, there may be several reasons for an
inconsistent response in SI measured with fMRI, which does not apply to SII and future work
should aim to characterise the haemodynamic response profile of this region in response to
24
varying types of noxious stimulation in both healthy controls and patients to better understand
the role of SI in central nociception.
In our second study investigating the functional brain change in patients with NSLBP to
noxious stimulation we applied mechanical stimulation to the lower back of patients and
controls with the specific aim of quantifying the difference in somatosensory activation (both
primary and secondary) in terms of the extent of activation. Our prediction was that patients
would show an increased spatial extent of activation in the somatosensory cortices
(somatotopically relating to the back (Penfield & Boldrey, 1937)) indicative of a functional re
organisation of this region in patients with a long-standing pain condition (Aim III). The results
show an increased extent of activation in the patient compared to the control group in both the
primary and secondary somatosensory cortex (Figure 5), thus agreeing with other studies
investigating the cortical consequences of chronic lower back pain (Flor et al., 1997). A similar
study to ours by Flor et al., (Flor et al., 1997), investigating the cerebral response to stimulation
of the lower back in patients with chronic lower back pain using EEG, hypothesised that
ongoing painful stimulation might result in the expansion of the primary somatosensory cortex,
which should be specific to the site of pain and should result in an exaggerated cortical response
to tactile stimuli from the painful body region. Their results show that the maximum activity
elicited in primary somatosensory cortex was shifted more medially in the very chronic back
pain subjects. Using the increased spatial resolution of fMRI we have demonstrated with the
current paradigm a greater bilateral extent of activation not only of the SI of patients with
NSLBP but also SII, with activation extending medially into the parietal operculum (BA40) by
approximately 6mm. Healthy controls showed only a modest activation of SII in response to
noxious mechanical stimulation of the lower back, with 37 voxels activated in total, 20 of which
are in the right hemisphere. Similarly, a large extent of bilateral activation was seen in the
primary somatosensory cortex (SI) in patients in response to mechanical stimulation of the
lower back, whereas healthy controls again show only a modest response with only 13 voxels
activated in total (12 of which were in the right hemisphere). The activation in SI is confined
solely to BA 2, situated anteriorly to the inferior parietal lobe. Therefore, activation of the
somatosensory cortices in patients is extensive and shows some right-side bias in response to
noxious mechanical stimulation of the back. The exact reason for the cortical reorganisation in
somatosensory cortex is unclear however, Flor et al., suggests that increased duration of pain,
correlates with increased representation of the back in SI, suggesting that long-lasting noxious
input may lead to long-term changes at the central level, and especially cortical level. As the
patients in the current study all had pain of 6 months duration or longer (and an average of 10
years) we suggest that a similar explanation can be used to interpret the findings of our study.
Other significant differences in cortical responsivity between the groups (measured using an
independent group-wise t-test) were seen to occur largely within regions of the superior frontal
lobe, insula and posterior cingulate cortex for patients and within the inferior frontal lobe,
anterior cingulate cortex and temporal lobe for healthy controls. Activation was seen to be
mainly right-lateralised in patients and more bilaterally distributed in healthy controls.
Activation of the mid-insula and posterior cingulate cortices may suggest greater activation in
patients vs. healthy controls in areas involved in attention and processing of egocentric space
(Vogt, Finch, & Olson, 1992) whereas activation of the anterior cingulate and motor cortex in
controls, and sub-cortical sites, including the periaquaductal gray, a region implicated in the
descending inhibition of pain (Vanegas & Schaible, 2004) may suggest greater affective-
motivational processing of noxious mechanical pain in healthy controls than patients. Given the
different patterns of activation across both groups it is difficult to reach any firm conclusions on
the cerebral representation of noxious mechanical stimulation applied to the lower back and all
that can be said at this time is that there appears to be a fundamental difference in the way this
sensory information is processed in the cortex depending on whether a person has NSLBP or
not.
25
Indirect evidence that persistent pain, such as chronic lower back pain, may result in extensive
cortical re-organisation through central sensitisation has come from a number of studies
investigating allodynia (a painful response to a normally non-painful stimulus) using
magnetoencephalography (MEG; (Maihofner, Handwerker, Neundorfer, & Birklein, 2003;
Maihofner, Handwerker, Neundorfer, & Birklein, 2004; Maihofner, Neundorfer, Stefan, &
Handwerker, 2003; Maihofner, Schmelz, Forster, Neundorfer, & Handwerker, 2004). In a 2003
study, activation of the affected thigh compared to the unaffected thigh demonstrated a 10mm
shift in response, laterally and inferiorly compared to the unaffected hemisphere. There was also
an increase of the amplitude of the response. In the current study, there isn’t a clearly defined
shift of the locus of activation but spreads noticeably medially in the patient group, further
along the central sulcus and into the depths of the parietal operculum. A medial shift in
activation may suggest an increased spatial representation of the pain at the periphery extending
into the lower legs in patients, consistent with non-dermatomal sensitivity around the lower
back region as measured with the Waddell Signs. This can be further investigated with more
patients with extreme pain-related illness behaviour.
In contrast to the two previous studies measuring the cerebral response to actual physical pain in
patients with NSLBP, the third fMRI study aimed to identify the neural correlates of expected
and anticipated pain in patients with NSLBP. Specifically, we predicted that the response to
expected pain would be greater than anticipated pain in patients as this condition would induce
more pain-related anxiety, attention and anticipation (Aim IV). To do this we adapted the
‘straight-leg raise’ used clinically as one of the signs of excessive pain behaviour, for use within
the confines of the scanning environment. Participants were visually-cued as to the nature of the
upcoming event, which could be a straight raise of the leg, which either occurred with certainty
on all trials (i.e., they were to expect movement of the leg signified by the colour ‘green’) or
they were to anticipate their leg would be raised (signified by the colour ‘yellow’) as this
occurred only on an unpredictable number of trials. The results show, as predicted, significantly
more activation in response to the visual cue signalling expected vs. unexpected painful raising
of the lower leg in patients as illustrated in Figure 6. This activation was exclusively right
lateralised and occurred in the inferior parietal lobe (including the intraparietal sulcus), middle
and medial frontal gyri, premotor cortex and the motor division of the paracentral lobule.
Studies investigating the neural correlates of anticipated and expected pain in healthy controls
have identified a network of areas including the rostral anterior cingulate cortex, posterior
cerebellum, ventral premotor cortex, periaquaductal grey, ventromedial prefrontal cortex, mid-
cingulate cortex and hippocampus (Bantick et al., 2002; Hsieh et al., 1999; Ploghaus et al.,
2001; Ploghaus et al., 1999; Ploghaus et al., 2003). These results show a degree of overlap
between those regions activated in response to experimentally induced pain in healthy controls
and those induced by clinical pain in patients, again particularly within the pre-frontal cortex,
with additional activation of the parietal cortex in patients. Parietal-frontal networks are often
cited when individuals are required to attend to a stimulus and aattentional control may be a
property of specialized parietal-frontal systems that transform perception into action (Corbetta
& Shulman, 2002; Nobre, 2001). In support of this interpretation, increased activation in the
motor foot area in the current study (the paracentral lobule) probably reflects motor priming of
this region by increased sustained attention to this site prior to lifting of the leg (Arthurs,
Johansen-Berg, Matthews, & Boniface, 2004; Johansen-Berg et al., 2000; Johansen-Berg &
Matthews, 2002; Sahyoun, Floyer-Lea, Johansen-Berg, & Matthews, 2004). Indeed, studies in
healthy controls have revealed extensive activation of the medial motor system in the response
to anticipated movement of the foot (Sahyoun et al., 2004).
The results of the current study show that activation is greater to expected pain than unexpected
pain and a major contributing factor towards a patient’s pain-related distress is perceived
certainty of pain. Some activities may cause an expected and predictable pain (e.g., lifting heavy
26
shopping), whilst other activities may have fear associated with them as the unknown possibility
of pain may occur and the relative ‘certainty of pain’ caused by actions may, in itself, augment
the amount of pain felt. For example, certain expectation of pain (the ‘green’ event in the
current study) will, according to Ploghaus and colleagues (2003) in studies investigating the
neural correlates of pain in healthy controls, activate the rostral anterior cingulate (ACC),
anterior insula and posterior cerebellum and be most associated with a fear response (often
leading to hypoalgesia). Uncertain expectation on the other hand (the ‘yellow’ event of the
current study) activates the ventromedial prefrontal cortex, mid-cingulate and hippocampus and
is associated more with an anxiety response (often leading to hyperalgesia). It is these cognitive
factors that lead to the disabling fear and avoidance associated with many chronic pain patients.
In response to a ‘certain’ painful event we see activation consistent with Ploghaus’s hypothesis
only in the cerebellum, signifying the possible differences between anticipating experimental
pain in healthy controls and clinical pain in patients. Activation of the cerebellum most likely
represents preparatory motor functions (Ramnani & Miall, 2003; Toni, Thoenissen, & Zilles,
2001) thus signalling the motor significance of sensory stimuli. In response to an ‘uncertain’
painful stimulus, on the other hand, we also see activation of the cingulate and prefrontal cortex.
This may suggest a common substrate for pain-related anticipation when there is uncertainty
about the painful event between clinical pain in patients and experimental pain in healthy
controls but not when there is certainty. It is therefore vital to understand how patients perceive
an upcoming painful stimulus, both when it is expected (certain) and unexpected (uncertain) as
the anticipation of pain is a complex state that may influence the immediate unpleasantness of
pain (involving such sub-components as cognitive appraisal, arousal, conditioning and orienting
or diverging attention from the source). However, the regions involved will likely be specific to
the particular pain condition and the previous history and pain experiences of the patient.
Ploghaus and colleagues have now conducted a series of experiments in healthy controls
investigating the neural correlates of pain anticipation (Ploghaus et al., 2001; Ploghaus et al.,
2000; Ploghaus et al., 1999; Ploghaus et al., 2003). Their studies have proposed a network of
areas involved in the anticipation of pain including affective processing in the medial frontal
cortex, autonomic processing in the anterior insula cortex and motor processing in the
cerebellum, sites which are close to but distinct from sites involved in the actual experience of
pain. Our results show similar mechanisms of processing but with distinct anatomical
differences. For example, although we also see activation of the medial frontal cortex, this
extends to the middle frontal areas as well when patients anticipate painful stimulation.
Similarly, activation of areas involved in motor processing, are seen to occur in the premotor
cortex and the paracentral lobule (the medial representation of motor cortex, pre-SMA) in the
current study. Although we don’t see significant activation of the insula, there is highly
significant activation of the right inferior parietal lobe. Given that more activation was seen in
response to a ‘certain’ pain cue than an ‘uncertain’ one, it seems likely that, for these patients,
more anxiety was associated with a certain pain cue, increasing the attentional and emotive
valence of the cue. Other imaging studies in healthy controls using PET scanning have reported
activation of the parietal lobes in response to anticipated pain, plus activation of the cingulate
cortex (Chua, Krams, Toni, Passingham, & Dolan, 1999; Drevets et al., 1995; Hsieh et al.,
1999).
To date there are few, if any, studies that have investigated the neural correlates of pain
anticipation in patients despite the fact that there is much evidence to suggest an interaction
between anticipation of pain and fear-avoidance beliefs in patients with lower back pain (Al-
Obaidi, Nelson, Al-Awadhi, & Al-Shuwaie, 2000; McCracken, Faber, & Janeck, 1998a;
McCracken, Goetsch, & Semenchuk, 1998b; Moseley, Nicholas, & Hodges, 2004; Pfingsten et
al., 2001). Behavioural studies consistently show that the anticipation of pain in patients with
chronic back pain evokes a protective postural strategy that stiffens the spine. This change in
spinal physical capacity cannot be explained solely by the sensory perception of pain but rather
27
it is the anticipation of pain and fear-avoidance beliefs about physical activities that are the
strongest predictors of reduced physical performance and disability associated with chronic
pain. Pain anticipation and fear-avoidance beliefs significantly influence the behaviour of
patients with low back pain in that they motivate avoidance behaviour. In fact, it is the cycle of
anticipation, fear and avoidance behaviour, which leads to maladaptive postural strategies and
may exacerbate spinal injury if maintained long term. Therapists must be aware of the powerful
effects of cognitive processes, which can give rise to fear of pain and, consequently, avoidance
behaviour.
A final interesting result from the current study was the extensive activation of the
periaquaductal gray (PAG) in response to an expected movement of the leg in patients. In a PET
study of healthy controls by Hsieh et al., (Hsieh et al., 1999), activation in response to an
unpredictable stimulus (in this case a saline injection) was seen in the right anterior cingulate,
ventral-medial pre-frontal cortex and the periaquaductal gray (PAG). Activation in response to a
learned pain stimulus (in this case an electrical shock) resulted in decreased activation in the
anterior cingulate and ventral-medial pre-frontal cortex. With only five subjects, the findings
from this study may be somewhat premature, however, the authors conclude that these
differences in activation reflect an anticipatory coping mechanism, which alerts to novel pain
stimuli and activates structures involved in the descending inhibitory control of pain (PAG), and
an attention/distraction system, which helps us to cope with a known pain. Our results show
activation of the PAG when the visual cue signals certain movement of the leg (and therefore
pain). This would agree with the role of the PAG in the descending inhibitory control of pain,
allowing patients to decrease the effects of the upcoming painful event. Similarly the increased
activation of the parietal and visual cortices suggests greater visuo-spatial attention to the cue
and the increased activity around the central sulcus may signify increased sensorimotor
awareness of the body when anticipating a painful event. For example, a recent fMRI study has
demonstrated that placebo can induce changes in anticipation of painful aversive events,
reducing the significance of the aversive event itself (Wager et al., 2004). For patients in whom
no other treatment is available, information relating to development of cognitive behavioural
therapies may prove invaluable at helping people to cope with chronic pain.
28
5 Conclusions and Future Predictions
The results of the current study have revealed several important findings with regards to
changes in brain function in patients with NSLBP vs. healthy controls. We can conclude that
there is an increased cortical response in the parietal, prefrontal, anterior cingulate and anterior
insula cortices in patients vs. healthy controls in response to a noxious thermal stimulus applied
to hand. We interpret this finding as suggesting that patients have increased attentional
awareness of painful sensation at the periphery of the affective-motivational rather than sensory-
discriminative aspects of the stimulus. This may be mediated by increased arousal to
environmental stimuli indicative of a generalised anxiety state. We predict that patients who
have the same levels of anxiety as healthy controls (i.e., those with little or no pain-related
behaviour) will not activate these areas of cortex to the same degree as patients who have high
levels of pain-related illness behaviour (i.e., those scoring 4/5 or 5/5 Waddell Signs) who will
show an exaggerated response in this areas. Similarly, the results of the current study show an
increased spatial extent of somatosensory processing in patients vs. healthy controls. We
interpret this finding as suggesting that long-lasting noxious input may lead to long term
changes in the somatosensory cortex, possibly due to persistent afferent nociceptive barrage or
increased attention to this part of the body. We predict that patients who report higher levels of
pain and/or for whom the pain is more distressing (i.e., those patients who score high on the
Waddell tests of pain-related illness behaviour) there will be greater expansion of the
somatosensory cortex than in those subjects with NSLBP who report modest levels of pain and
have a low score on the Waddell tests. Finally, we have shown an increased response to a visual
cue signalling an expected vs. unexpected painful event in areas of the prefrontal and parietal
cortex, which overlaps with activation produced in the actual response to physical pain. We
interpret this finding as suggesting that patients have a hypervigilence in their response to visual
cues about pain and not only modify their behaviour (through learning) in anticipation of an
expected upcoming painful event but may also ‘experience’ pain simply by anticipating the
upcoming painful event. We predict that patients who have high levels of fear of movement,
correlated with increased disability and negative cognitions about pain should show a further
modulation of this response compared to patients who do not show these traits. Understanding
the differences in the neural response to expected vs. anticipated pain could be used to inform
cognitive behavioural therapies for developing coping strategies for pain to assist movement
and reduce disability, thus reducing the financial burden on NHS and state resources.
29
6 References
Al-Obaidi, S. M., Nelson, R. M., Al-Awadhi, S., & Al-Shuwaie, N. (2000). The role of
anticipation and fear of pain in the persistence of avoidance behavior in patients with chronic
low back pain. Spine, 25, 1126-1131.
Andersson, G. B. (1997). Low back pain. J.Rehabil.Res.Dev., 34, ix.
Apkarian, A. V. (2004). Cortical pathophysiology of chronic pain.
Novartis.Found.Symp., 261, 239-245.
Apkarian, A. V., Gelnar, P. A., Krauss, B. R., & Szeverenyi, N. M. (2000). Cortical
responses to thermal pain depend on stimulus size: a functional MRI study. J.Neurophysiol., 83,
3113-3122.
Apkarian, A. V., Sosa, Y., Krauss, B. R., Thomas, P. S., Fredrickson, B. E., Levy, R. E.
et al. (2004). Chronic pain patients are impaired on an emotional decision-making task. Pain,
108, 129-136.
Arthurs, O. J., Johansen-Berg, H., Matthews, P. M., & Boniface, S. J. (2004). Attention
differentially modulates the coupling of fMRI BOLD and evoked potential signal amplitudes in
the human somatosensory cortex. Exp.Brain Res., 157, 269-274.
Asmundson, G. J. & Norton, G. R. (1995). Anxiety sensitivity in patients with
physically unexplained chronic back pain: a preliminary report. Behav.Res.Ther., 33, 771-777.
Bantick, S. J., Wise, R. G., Ploghaus, A., Clare, S., Smith, S. M., & Tracey, I. (2002).
Imaging how attention modulates pain in humans using functional MRI. Brain, 125, 310-319.
Becerra, L., Iadarola, M., & Borsook, D. (2004). CNS activation by noxious heat to the
hand or foot: site-dependent delay in sensory but not emotion circuitry. J.Neurophysiol., 91,
533-541.
Becerra, L. R., Breiter, H. C., Stojanovic, M., Fishman, S., Edwards, A., Comite, A. R.
et al. (1999). Human brain activation under controlled thermal stimulation and habituation to
noxious heat: an fMRI study. Magn Reson.Med., 41, 1044-1057.
Brooks, J. C., Nurmikko, T. J., Bimson, W. E., Singh, K. D., & Roberts, N. (2002a).
fMRI of thermal pain: effects of stimulus laterality and attention. Neuroimage., 15, 293-301.
Burton, A. K., Tillotson, K. M., Main, C. J., & Hollis, S. (1995). Psychosocial
predictors of outcome in acute and subchronic low back trouble. Spine, 20, 722-728.
Casey, K. L., Minoshima, S., Berger, K. L., Koeppe, R. A., Morrow, T. J., & Frey, K.
A. (1994). Positron emission tomographic analysis of cerebral structures activated specifically
by repetitive noxious heat stimuli. J.Neurophysiol., 71, 802-807.
Cavada, C. & Goldman-Rakic, P. S. (1989). Posterior parietal cortex in rhesus monkey:
II. Evidence for segregated corticocortical networks linking sensory and limbic areas with the
frontal lobe. J Comp Neurol, 287, 422-445.
30
Chen, J. I., Ha, B., Bushnell, M. C., Pike, B., & Duncan, G. H. (2002). Differentiating
noxious- and innocuous-related activation of human somatosensory cortices using temporal
analysis of fMRI. J.Neurophysiol., 88, 464-474.
Chua, P., Krams, M., Toni, I., Passingham, R., & Dolan, R. (1999). A functional
anatomy of anticipatory anxiety. Neuroimage., 9, 563-571.
Coghill, R. C., McHaffie, J. G., & Yen, Y. F. (2003). Neural correlates of
interindividual differences in the subjective experience of pain. Proc.Natl.Acad.Sci.U.S.A, 100,
8538-8542.
Cook, A. J., Woolf, C. J., Wall, P. D., & McMahon, S. B. (1987). Dynamic receptive
field plasticity in rat spinal cord dorsal horn following C-primary afferent input. Nature, 325,
151-153.
Cook, D. B., Lange, G., Ciccone, D. S., Liu, W. C., Steffener, J., & Natelson, B. H.
(2004). Functional imaging of pain in patients with primary fibromyalgia. J.Rheumatol., 31,
364-378.
Corbetta, M. & Shulman, G. L. (2002). Control of goal-directed and stimulus-driven
attention in the brain. Nat.Rev Neurosci, 3, 201-215.
Craig, A. D., Chen, K., Bandy, D., & Reiman, E. M. (2000). Thermosensory activation
of insular cortex. Nat.Neurosci., 3, 184-190.
Crombez, G., Vervaet, L., Lysens, R., Baeyens, F., & Eelen, P. (1998). Avoidance and
confrontation of painful, back-straining movements in chronic back pain patients. Behav.Modif.,
22, 62-77.
Davis, K. D., Kwan, C. L., Crawley, A. P., & Mikulis, D. J. (1998). Functional MRI
study of thalamic and cortical activations evoked by cutaneous heat, cold, and tactile stimuli.
J.Neurophysiol., 80, 1533-1546.
Davis, K. D., Wood, M. L., Crawley, A. P., & Mikulis, D. J. (1995). fMRI of human
somatosensory and cingulate cortex during painful electrical nerve stimulation. Neuroreport, 7,
321-325.
Derbyshire, S. W. (1999). Meta-Analysis of Thirty-Four Independent Samples Studied
Using PET Reveals a Significantly Attenuated Central Response to Noxious Stimulation in
Clinical Pain Patients. Curr.Rev.Pain, 3, 265-280.
Derbyshire, S. W., Jones, A. K., Creed, F., Starz, T., Meltzer, C. C., Townsend, D. W.
et al. (2002). Cerebral responses to noxious thermal stimulation in chronic low back pain
patients and normal controls. Neuroimage., 16, 158-168.
Devinsky, O., Morrell, M. J., & Vogt, B. A. (1995). Contributions of anterior cingulate
cortex to behaviour. Brain, 118, 279-306.
Disbrow, E., Buonocore, M., Antognini, J., Carstens, E., & Rowley, H. A. (1998).
Somatosensory cortex: a comparison of the response to noxious thermal, mechanical, and
electrical stimuli using functional magnetic resonance imaging. Hum.Brain Mapp., 6, 150-159.
31
Dong, W. K., Chudler, E. H., Sugiyama, K., Roberts, V. J., & Hayashi, T. (1994).
Somatosensory, multisensory, and task-related neurons in cortical area 7b (PF) of
unanesthetized monkeys. J.Neurophysiol., 72, 542-564.
Drevets, W. C., Burton, H., Videen, T. O., Snyder, A. Z., Simpson, J. R., Jr., & Raichle,
M. E. (1995). Blood flow changes in human somatosensory cortex during anticipated
stimulation. Nature, 373, 249-252.
Flor, H. (2002). Phantom-limb pain: characteristics, causes, and treatment. Lancet
Neurol., 1, 182-189.
Flor, H., Braun, C., Elbert, T., & Birbaumer, N. (1997). Extensive reorganization of
primary somatosensory cortex in chronic back pain patients. Neurosci.Lett., 224, 5-8.
Fordyce, W. E. (1995). Back pain in the workplace: Management of disability in non
specific conditions. Seattle.: IASP Press.
Fritz, J. M., George, S. Z., & Delitto, A. (2001). The role of fear-avoidance beliefs in
acute low back pain: relationships with current and future disability and work status. Pain, 94,
7-15.
Giesecke, T., Gracely, R. H., Grant, M. A., Nachemson, A., Petzke, F., Williams, D. A.
et al. (2004). Evidence of augmented central pain processing in idiopathic chronic low back
pain. Arthritis Rheum., 50, 613-623.
Gracely, R. H., Geisser, M. E., Giesecke, T., Grant, M. A., Petzke, F., Williams, D. A.
et al. (2004). Pain catastrophizing and neural responses to pain among persons with
fibromyalgia. Brain, 127, 835-843.
Gracely, R. H., Petzke, F., Wolf, J. M., & Clauw, D. J. (2002). Functional magnetic
resonance imaging evidence of augmented pain processing in fibromyalgia. Arthritis Rheum.,
46, 1333-1343.
Grachev, I. D., Fredrickson, B. E., & Apkarian, A. V. (2000). Abnormal brain
chemistry in chronic back pain: an in vivo proton magnetic resonance spectroscopy study. Pain,
89, 7-18.
Hsieh, J. C., Stone-Elander, S., & Ingvar, M. (1999). Anticipatory coping of pain
expressed in the human anterior cingulate cortex: a positron emission tomography study.
Neurosci.Lett., 262, 61-64.
Jenkinson, M. & Smith, S. (2001). A global optimisation method for robust affine
registration of brain images. Med.Image Anal., 5, 143-156.
Jensen, M. C., Brant-Zawadzki, M. N., Obuchowski, N., Modic, M. T., Malkasian, D.,
& Ross, J. S. (1994). Magnetic resonance imaging of the lumbar spine in people without back
pain. N.Engl.J.Med., 331, 69-73.
Jensen, M. C., Kelly, A. P., & Brant-Zawadzki, M. N. (1994). MRI of degenerative
disease of the lumbar spine. Magn Reson.Q., 10, 173-190.
Jensen, M. P., Turner, J. A., Romano, J. M., & Strom, S. E. (1995). The Chronic Pain
Coping Inventory: development and preliminary validation. Pain, 60, 203-216.
32
Johansen-Berg, H., Christensen, V., Woolrich, M., & Matthews, P. M. (2000).
Attention to touch modulates activity in both primary and secondary somatosensory areas.
Neuroreport, 11, 1237-1241.
Johansen-Berg, H. & Matthews, P. M. (2002). Attention to movement modulates
activity in sensori-motor areas, including primary motor cortex. Exp.Brain Res., 142, 13-24.
Klenerman, L., Slade, P. D., Stanley, I. M., Pennie, B., Reilly, J. P., Atchison, L. E. et
al. (1995). The prediction of chronicity in patients with an acute attack of low back pain in a
general practice setting. Spine, 20, 478-484.
Koyama, T., Tanaka, Y. Z., & Mikami, A. (1998). Nociceptive neurons in the macaque
anterior cingulate activate during anticipation of pain. Neuroreport, 9, 2663-2667.
Loeser, J. (1996). Back pain in the workplace. II. Pain, 65, 7-8.
Maguire, E. A., Frith, C. D., Burgess, N., Donnett, J. G., & O'Keefe, J. (1998).
Knowing where things are parahippocampal involvement in encoding object locations in virtual
large-scale space. J.Cogn Neurosci., 10, 61-76.
Maihofner, C., Handwerker, H. O., Neundorfer, B., & Birklein, F. (2003). Patterns of
cortical reorganization in complex regional pain syndrome. Neurology, 61, 1707-1715.
Maihofner, C., Handwerker, H. O., Neundorfer, B., & Birklein, F. (2004). Cortical
reorganization during recovery from complex regional pain syndrome. Neurology, 63, 693-701.
Maihofner, C., Neundorfer, B., Stefan, H., & Handwerker, H. O. (2003). Cortical
processing of brush-evoked allodynia. Neuroreport, 14, 785-789.
Maihofner, C., Schmelz, M., Forster, C., Neundorfer, B., & Handwerker, H. O. (2004).
Neural activation during experimental allodynia: a functional magnetic resonance imaging
study. Eur.J.Neurosci., 19, 3211-3218.
Main, C. J. & Waddell, G. (1991). A comparison of cognitive measures in low back
pain: statistical structure and clinical validity at initial assessment. Pain, 46, 287-298.
McCracken, L. M. (1998). Learning to live with the pain: acceptance of pain predicts
adjustment in persons with chronic pain. Pain, 74, 21-27.
McCracken, L. M., Faber, S. D., & Janeck, A. S. (1998a). Pain-related anxiety predicts
non-specific physical complaints in persons with chronic pain. Behav.Res.Ther., 36, 621-630.
McCracken, L. M., Goetsch, V. L., & Semenchuk, E. M. (1998b). Coping with pain
produced by physical activity in persons with chronic low back pain: immediate assessment
following a specific pain event. Behav.Med., 24, 29-34.
McCracken, L. M., Gross, R. T., Aikens, J., & Carnrike, C. L., Jr. (1996). The
assessment of anxiety and fear in persons with chronic pain: a comparison of instruments.
Behav.Res.Ther., 34, 927-933.
McCracken, L. M., Zayfert, C., & Gross, R. T. (1992). The Pain Anxiety Symptoms
Scale: development and validation of a scale to measure fear of pain. Pain, 50, 67-73.
33
McNaughton, N. (1997). Cognitive dysfunction resulting from hippocampal
hyperactivity--a possible cause of anxiety disorder? Pharmacol.Biochem.Behav., 56, 603-611.
Melzack, R. & Wall, P. D. (1965). Pain mechanisms: a new theory. Science, 150, 971
979.
Moseley, G. L., Nicholas, M. K., & Hodges, P. W. (2004). Does anticipation of back
pain predispose to back trouble? Brain, 127, 2339-2347.
Nobre, A. C. (2001). The attentive homunculus: now you see it, now you don't.
Neurosci.Biobehav.Rev., 25, 477-496.
Penfield, W. & Boldrey, E. (1937). Somatic motor and sensory representation in the
cerebral cortex of man as studied by electrical stimulation. Brain, 60, 389-443.
Peters, M. L., Vlaeyen, J. W., & Weber, W. E. (2005). The joint contribution of
physical pathology, pain-related fear and catastrophizing to chronic back pain disability. Pain,
113, 45-50.
Peyron, R., Laurent, B., & Garcia-Larrea, L. (2000). Functional imaging of brain
responses to pain. A review and meta-analysis (2000). Neurophysiol.Clin., 30, 263-288.
Peyron, R., Schneider, F., Faillenot, I., Convers, P., Barral, F. G., Garcia-Larrea, L. et
al. (2004). An fMRI study of cortical representation of mechanical allodynia in patients with
neuropathic pain. Neurology, 63, 1838-1846.
Pfingsten, M., Leibing, E., Harter, W., Kroner-Herwig, B., Hempel, D., Kronshage, U.
et al. (2001). Fear-avoidance behavior and anticipation of pain in patients with chronic low back
pain: a randomized controlled study. Pain Med., 2, 259-266.
Picavet, H. S., Vlaeyen, J. W., & Schouten, J. S. (2002). Pain catastrophizing and
kinesiophobia: predictors of chronic low back pain. Am.J.Epidemiol., 156, 1028-1034.
Pincus, T. & Morley, S. (2001). Cognitive-processing bias in chronic pain: a review and
integration. Psychol.Bull., 127, 599-617.
Ploghaus, A., Becerra, L., Borras, C., & Borsook, D. (2003). Neural circuitry
underlying pain modulation: expectation, hypnosis, placebo. Trends Cogn Sci., 7, 197-200.
Ploghaus, A., Narain, C., Beckmann, C. F., Clare, S., Bantick, S., Wise, R. et al. (2001).
Exacerbation of pain by anxiety is associated with activity in a hippocampal network. Journal of
Neuroscience, 21, 9896-9903.
Ploghaus, A., Tracey, I., Clare, S., Gati, J. S., Rawlins, J. N., & Matthews, P. M. (2000).
Learning about pain: the neural substrate of the prediction error for aversive events.
Proc.Natl.Acad.Sci.U.S.A, 97, 9281-9286.
Ploghaus, A., Tracey, I., Gati, J. S., Clare, S., Menon, R. S., Matthews, P. M. et al.
(1999). Dissociating pain from its anticipation in the human brain. Science, 284, 1979-1981.
Porro, C. A., Cettolo, V., Francescato, M. P., & Baraldi, P. (2003). Functional activity
mapping of the mesial hemispheric wall during anticipation of pain. Neuroimage., 19, 1738
1747.
34
Price, D. D., McGrath, P. A., Rafii, A., & Buckingham, B. (1983). The validation of
visual analogue scales as ratio scale measures for chronic and experimental pain. Pain, 17, 45
56.
Rainville, P., Duncan, G. H., Price, D. D., Carrier, B., & Bushnell, M. C. (1997). Pain
affect encoded in human anterior cingulate but not somatosensory cortex. Science, 277, 968
971.
Ramnani, N. & Miall, R. C. (2003). Instructed delay activity in the human prefrontal
cortex is modulated by monetary reward expectation. Cereb.Cortex, 13, 318-327.
Robinson, C. J. & Burton, H. (1980). Somatic submodality distribution within the
second somatosensory (SII), 7b, retroinsular, postauditory, and granular insular cortical areas of
M. fascicularis. J.Comp Neurol., 192, 93-108.
Roland, M. & Morris, R. (1983). A study of the natural history of back pain. Part I:
development of a reliable and sensitive measure of disability in low-back pain. Spine, 8, 141
144.
Rosenstiel, A. K. & Keefe, F. J. (1983). The use of coping strategies in chronic low
back pain patients: relationship to patient characteristics and current adjustment. Pain, 17, 33
44.
Sahyoun, C., Floyer-Lea, A., Johansen-Berg, H., & Matthews, P. M. (2004). Towards
an understanding of gait control: brain activation during the anticipation, preparation and
execution of foot movements. Neuroimage., 21, 568-575.
Smith, S. & Brady, M. (1997). SUSAN - a new approach to low level image processing.
International Journal of Computer Vision, 23, 45-78.
Toni, I., Thoenissen, D., & Zilles, K. (2001). Movement preparation and motor
intention. Neuroimage., 14, S110-S117.
Tracey, I., Becerra, L., Chang, I., Breiter, H., Jenkins, L., Borsook, D. et al. (2000).
Noxious hot and cold stimulation produce common patterns of brain activation in humans: a
functional magnetic resonance imaging study. Neurosci.Lett., 288, 159-162.
Treede, R. D., Apkarian, A. V., Bromm, B., Greenspan, J. D., & Lenz, F. A. (2000).
Cortical representation of pain: functional characterization of nociceptive areas near the lateral
sulcus. Pain, 87, 113-119.
Treede, R. D., Kenshalo, D. R., Gracely, R. H., & Jones, A. K. (1999). The cortical
representation of pain. Pain, 79, 105-111.
Van Horn, J. D., Ellmore, T. M., Esposito, G., & Berman, K. F. (1998). Mapping voxel
based statistical power on parametric images. Neuroimage., 7, 97-107.
Vanegas, H. & Schaible, H. G. (2004). Descending control of persistent pain: inhibitory
or facilitatory? Brain Res.Brain Res.Rev., 46, 295-309.
Vlaeyen, J. W., Kole-Snijders, A. M., Boeren, R. G., & van, E. H. (1995). Fear of
movement/(re)injury in chronic low back pain and its relation to behavioral performance. Pain,
62, 363-372.
35
Vogt, B. A., Berger, G. R., & Derbyshire, S. W. (2003). Structural and functional
dichotomy of human midcingulate cortex. Eur.J.Neurosci., 18, 3134-3144.
Vogt, B. A., Finch, D. M., & Olson, C. R. (1992). Functional heterogeneity in cingulate
cortex: the anterior executive and posterior evaluative regions. Cereb.Cortex, 2, 435-443.
Vogt, B. A. & Sikes, R. W. (2000). The medial pain system, cingulate cortex, and
parallel processing of nociceptive information. Prog.Brain Res., 122, 223-235.
Waddell, G. (1992). Biopsychosocial analysis of low back pain. Baillieres
Clin.Rheumatol., 6, 523-557.
Waddell, G. (1987). Clinical assessment of lumbar impairment. Clin.Orthop., 110-120.
Waddell, G. (1991). Occupational low-back pain, illness behavior, and disability. Spine,
16, 683-685.
Waddell, G., Main, C. J., Morris, E. W., Di, P. M., & Gray, I. C. (1984). Chronic low-
back pain, psychologic distress, and illness behavior. Spine, 9, 209-213.
Waddell, G., McCulloch, J. A., Kummel, E., & Venner, R. M. (1980a). Nonorganic
physical signs in low-back pain. Spine, 5, 117-125.
Waddell, G., Newton, M., Henderson, I., Somerville, D., & Main, C. J. (1993). A Fear-
Avoidance Beliefs Questionnaire (FABQ) and the role of fear-avoidance beliefs in chronic low
back pain and disability. Pain, 52, 157-168.
Wager, T. D., Rilling, J. K., Smith, E. E., Sokolik, A., Casey, K. L., Davidson, R. J. et
al. (2004). Placebo-induced changes in FMRI in the anticipation and experience of pain.
Science, 303, 1162-1167.
Woolrich, M. W., Ripley, B. D., Brady, M., & Smith, S. M. (2001). Temporal
autocorrelation in univariate linear modeling of FMRI data. Neuroimage., 14, 1370-1386.
Zigmond, A. S. & Snaith, R. P. (1983). The hospital anxiety and depression scale. Acta
Psychiatr.Scand., 67, 361-370.
36
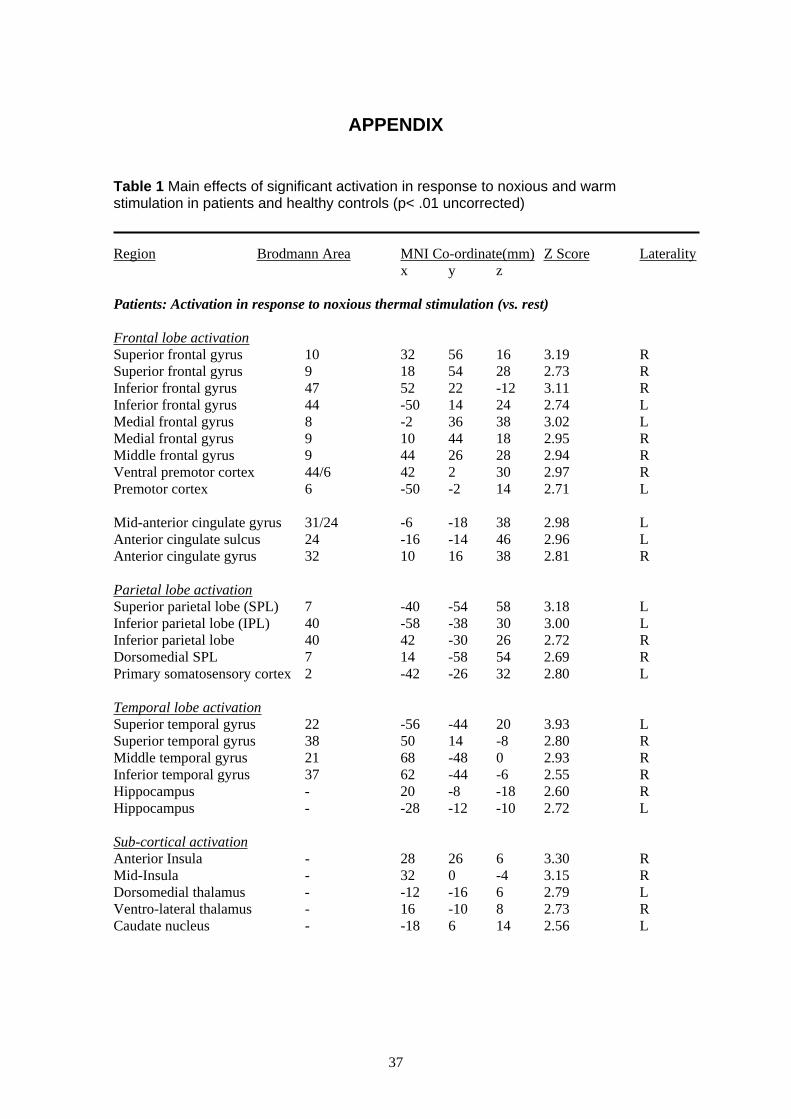
APPENDIX
Table 1 Main effects of significant activation in response to noxious and warm stimulation in patients and healthy controls (p< .01 uncorrected)
Region Brodmann Area MNI Co-ordinate(mm) Z Score Laterality
x y z
Patients: Activation in response to noxious thermal stimulation (vs. rest)
Frontal lobe activation
Superior frontal gyrus 10
Superior frontal gyrus 9
Inferior frontal gyrus 47
Inferior frontal gyrus 44
Medial frontal gyrus 8
Medial frontal gyrus 9
Middle frontal gyrus 9
Ventral premotor cortex 44/6
Premotor cortex 6
32 56 16 3.19 R
18 54 28 2.73 R
52 22 -12 3.11 R
-50 14 24 2.74 L
-2 36 38 3.02 L
10 44 18 2.95 R
44 26 28 2.94 R
42 2 30 2.97 R
-50 -2 14 2.71 L
Mid-anterior cingulate gyrus 31/24
Anterior cingulate sulcus 24
Anterior cingulate gyrus 32
-6 -18 38 2.98 L
-16 -14 46 2.96 L
10 16 38 2.81 R
Parietal lobe activation
Superior parietal lobe (SPL) 7
Inferior parietal lobe (IPL) 40
Inferior parietal lobe 40
Dorsomedial SPL 7
Primary somatosensory cortex 2
-40 -54 58 3.18 L
-58 -38 30 3.00 L
42 -30 26 2.72 R
14 -58 54 2.69 R
-42 -26 32 2.80 L
Temporal lobe activation
Superior temporal gyrus 22
Superior temporal gyrus 38
Middle temporal gyrus 21
Inferior temporal gyrus 37
Hippocampus -
Hippocampus -
-56 -44 20 3.93 L
50 14 -8 2.80 R
68 -48 0 2.93 R
62 -44 -6 2.55 R
20 -8 -18 2.60 R
-28 -12 -10 2.72 L
Sub-cortical activation
Anterior Insula -
Mid-Insula -
Dorsomedial thalamus -
Ventro-lateral thalamus -
Caudate nucleus -
28 26 6 3.30 R
32 0 -4 3.15 R
-12 -16 6 2.79 L
16 -10 8 2.73 R
-18 6 14 2.56 L
37
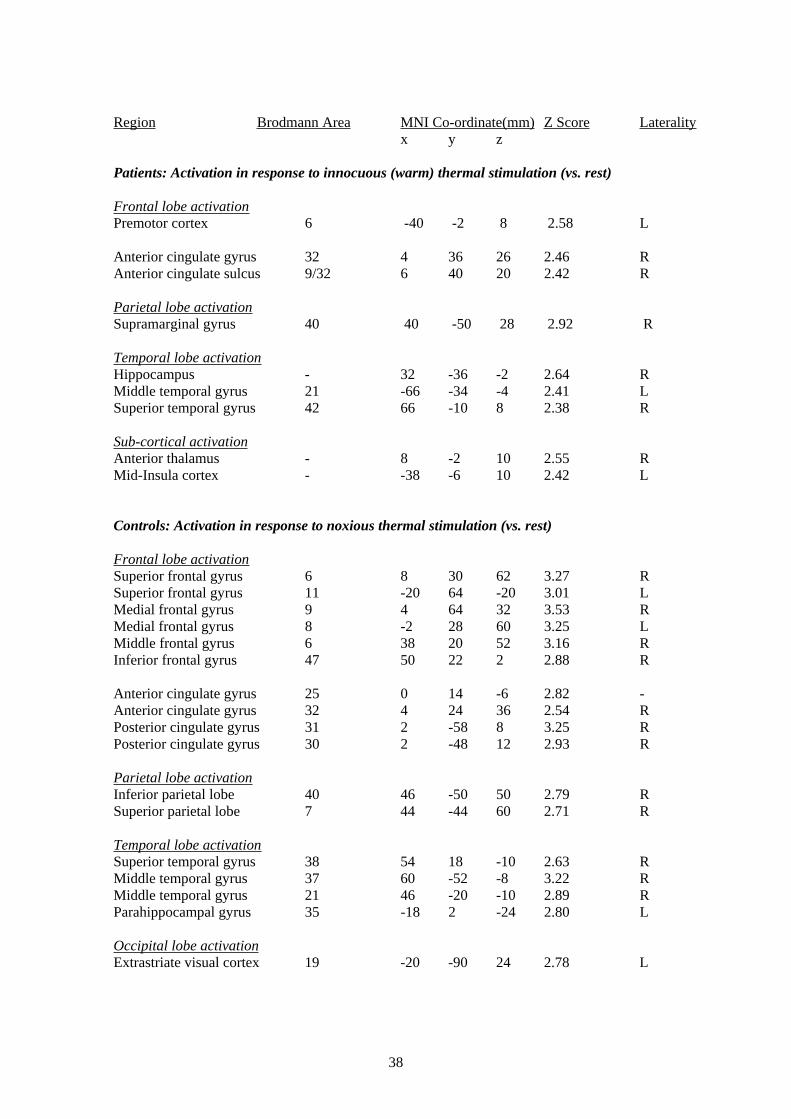
Region Brodmann Area MNI Co-ordinate(mm) Z Score Laterality
x y z
Patients: Activation in response to innocuous (warm) thermal stimulation (vs. rest)
Frontal lobe activation Premotor cortex 6 -40 -2 8 2.58 L
Anterior cingulate gyrus 32 4 36 26 2.46 R
Anterior cingulate sulcus 9/32 6 40 20 2.42 R
Parietal lobe activation
Supramarginal gyrus 40 40 -50 28 2.92 R
Temporal lobe activation
Hippocampus -
Middle temporal gyrus 21
Superior temporal gyrus 42
32 -36 -2 2.64 R
-66 -34 -4 2.41 L
66 -10 8 2.38 R
Sub-cortical activation
Anterior thalamus - 8 -2 10 2.55 R
Mid-Insula cortex - -38 -6 10 2.42 L
Controls: Activation in response to noxious thermal stimulation (vs. rest)
Frontal lobe activation
Superior frontal gyrus 6
Superior frontal gyrus 11
Medial frontal gyrus 9
Medial frontal gyrus 8
Middle frontal gyrus 6
Inferior frontal gyrus 47
8 30 62 3.27 R
-20 64 -20 3.01 L
4 64 32 3.53 R
-2 28 60 3.25 L
38 20 52 3.16 R
50 22 2 2.88 R
Anterior cingulate gyrus 25
Anterior cingulate gyrus 32
Posterior cingulate gyrus 31
Posterior cingulate gyrus 30
0 14 -6 2.82 -
4 24 36 2.54 R
2 -58 8 3.25 R
2 -48 12 2.93 R
Parietal lobe activation
Inferior parietal lobe 40 46 -50 50 2.79 R
Superior parietal lobe 7 44 -44 60 2.71 R
Temporal lobe activation Superior temporal gyrus 38
Middle temporal gyrus 37
Middle temporal gyrus 21
Parahippocampal gyrus 35
54 18 -10 2.63 R
60 -52 -8 3.22 R
46 -20 -10 2.89 R
-18 2 -24 2.80 L
Occipital lobe activation
Extrastriate visual cortex 19 -20 -90 24 2.78 L
38
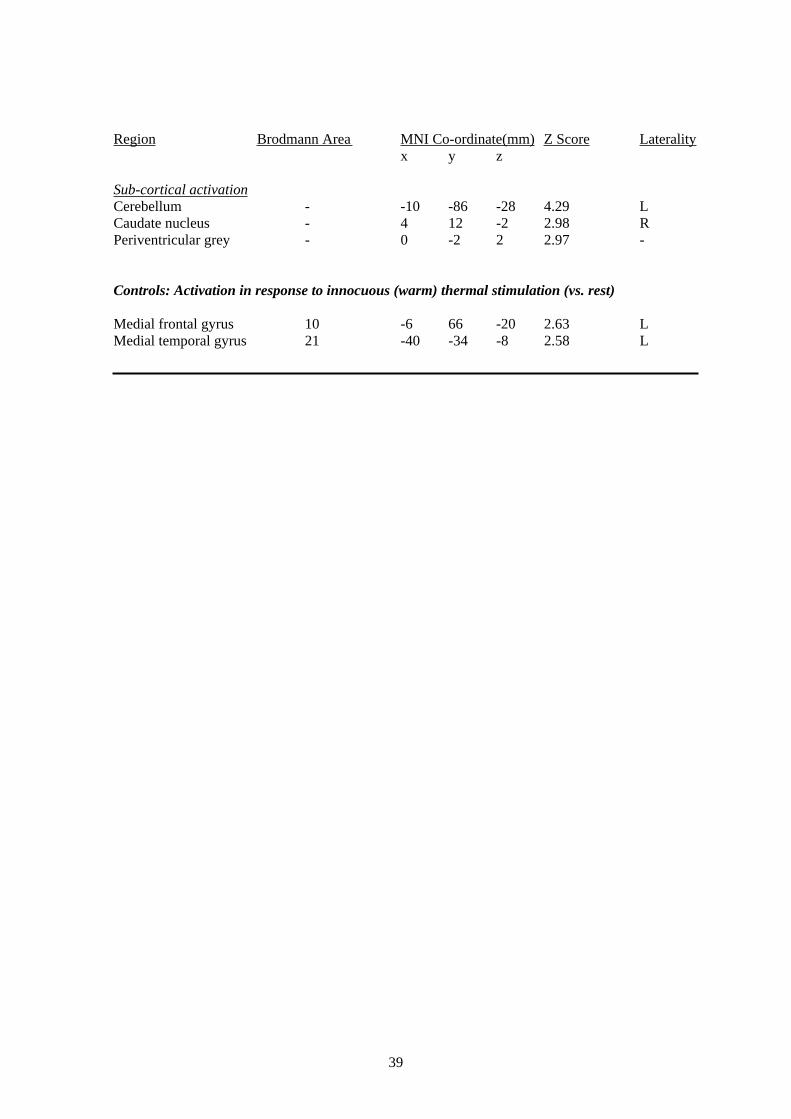
Region Brodmann Area MNI Co-ordinate(mm) Z Score Laterality
x y z
Sub-cortical activation
Cerebellum - -10 -86 -28 4.29
Caudate nucleus -
Periventricular grey -
L
4 12 -2 2.98 R
0 -2 2 2.97 -
Controls: Activation in response to innocuous (warm) thermal stimulation (vs. rest)
Medial frontal gyrus 10 -6 66 -20 2.63 L
Medial temporal gyrus 21 -40 -34 -8 2.58 L
39
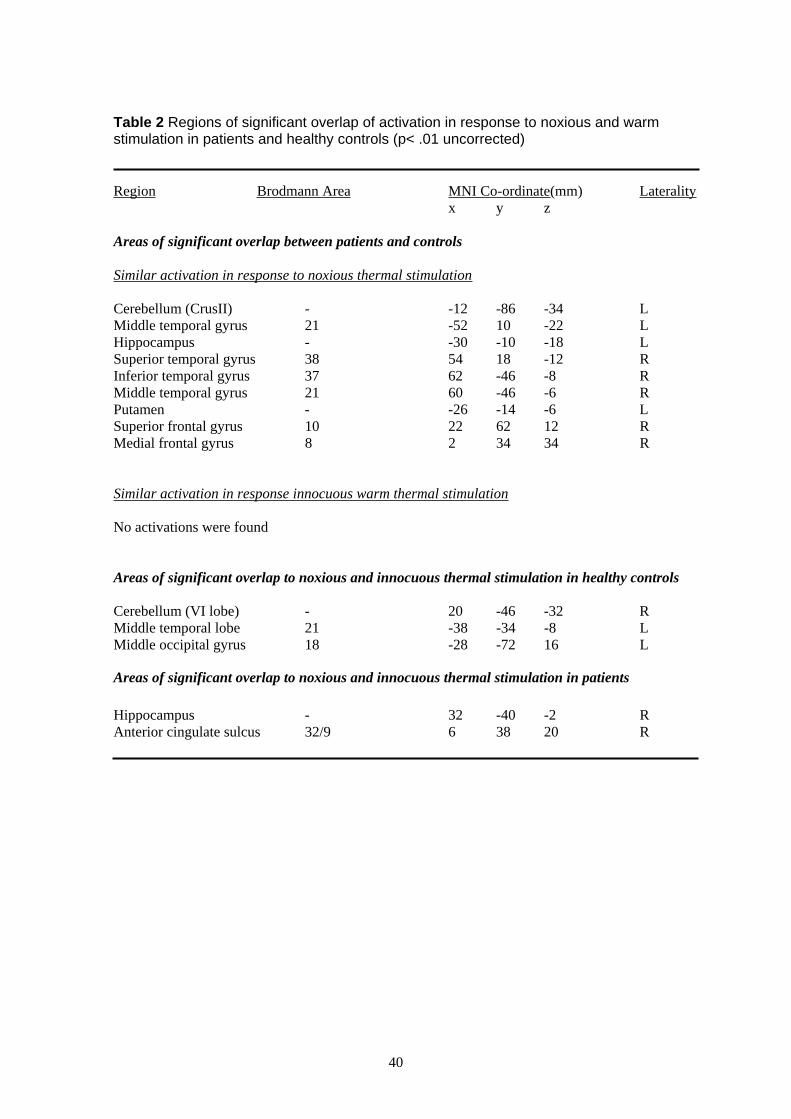
Table 2 Regions of significant overlap of activation in response to noxious and warm stimulation in patients and healthy controls (p< .01 uncorrected)
Region Brodmann Area MNI Co-ordinate(mm) Laterality
x y z
Areas of significant overlap between patients and controls
Similar activation in response to noxious thermal stimulation
Cerebellum (CrusII) -
Middle temporal gyrus 21
Hippocampus -
Superior temporal gyrus 38
Inferior temporal gyrus 37
Middle temporal gyrus 21
Putamen -
Superior frontal gyrus 10
Medial frontal gyrus 8
-12 -86 -34 L
-52 10 -22 L
-30 -10 -18 L
54 18 -12 R
62 -46 -8 R
60 -46 -6 R
-26 -14 -6 L
22 62 12 R
2 34 34 R
Similar activation in response innocuous warm thermal stimulation
No activations were found
Areas of significant overlap to noxious and innocuous thermal stimulation in healthy controls
Cerebellum (VI lobe) -
Middle temporal lobe 21
Middle occipital gyrus 18
20 -46 -32 R
-38 -34 -8 L
-28 -72 16 L
Areas of significant overlap to noxious and innocuous thermal stimulation in patients
Hippocampus - 32 -40 -2 R
Anterior cingulate sulcus 32/9 6 38 20 R
40
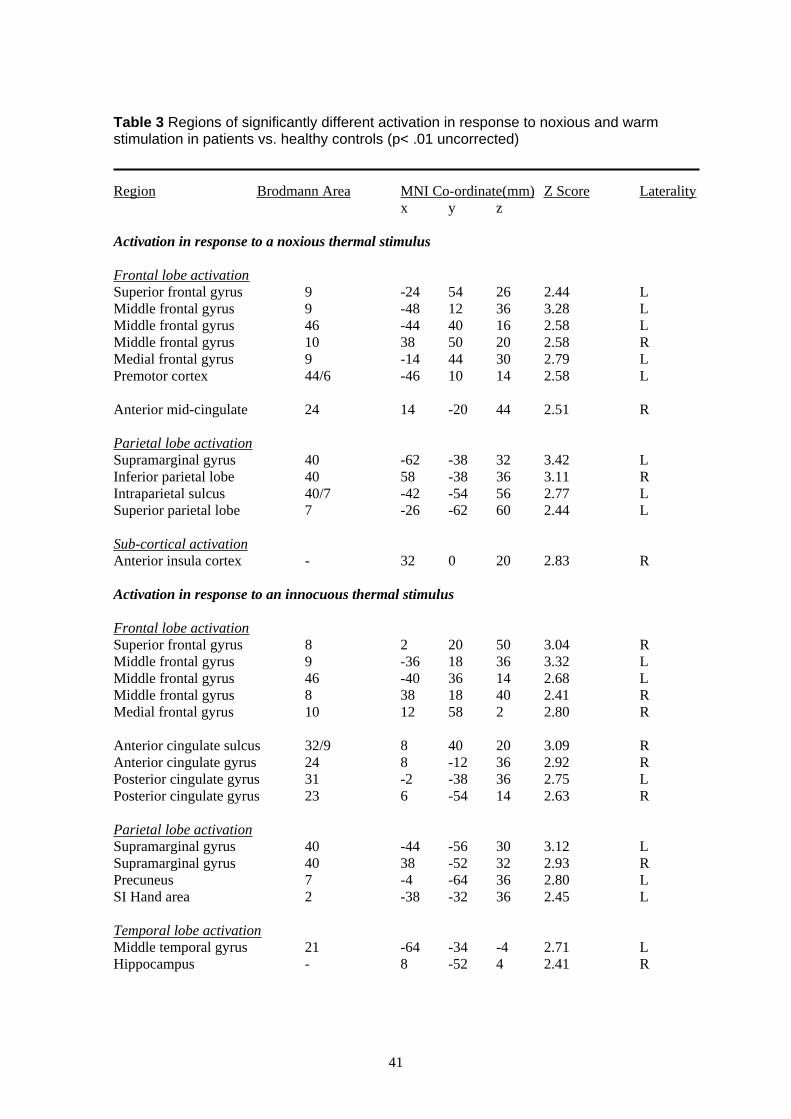
Table 3 Regions of significantly different activation in response to noxious and warm stimulation in patients vs. healthy controls (p< .01 uncorrected)
Region Brodmann Area MNI Co-ordinate(mm) Z Score Laterality
x y z
Activation in response to a noxious thermal stimulus
Frontal lobe activation
Superior frontal gyrus 9 -24 54 26 2.44 L
Middle frontal gyrus 9 -48 12 36 3.28 L
Middle frontal gyrus 46 -44 40 16 2.58 L
Middle frontal gyrus 10 38 50 20 2.58 R
Medial frontal gyrus 9 -14 44 30 2.79 L
Premotor cortex 44/6 -46 10 14 2.58 L
Anterior mid-cingulate 24 14 -20 44 2.51 R
Parietal lobe activation
Supramarginal gyrus 40 -62 -38 32 3.42 L
Inferior parietal lobe 40 58 -38 36 3.11 R
Intraparietal sulcus 40/7 -42 -54 56 2.77 L
Superior parietal lobe 7 -26 -62 60 2.44 L
Sub-cortical activation
Anterior insula cortex - 32 0 20 2.83 R
Activation in response to an innocuous thermal stimulus
Frontal lobe activation
Superior frontal gyrus 8 2 20 50 3.04 R
Middle frontal gyrus 9 -36 18 36 3.32 L
Middle frontal gyrus 46 -40 36 14 2.68 L
Middle frontal gyrus 8 38 18 40 2.41 R
Medial frontal gyrus 10 12 58 2 2.80 R
Anterior cingulate sulcus 32/9 8 40 20 3.09 R
Anterior cingulate gyrus 24 8 -12 36 2.92 R
Posterior cingulate gyrus 31 -2 -38 36 2.75 L
Posterior cingulate gyrus 23 6 -54 14 2.63 R
Parietal lobe activation
Supramarginal gyrus 40 -44 -56 30 3.12 L
Supramarginal gyrus 40 38 -52 32 2.93 R
Precuneus 7 -4 -64 36 2.80 L
SI Hand area 2 -38 -32 36 2.45 L
Temporal lobe activation
Middle temporal gyrus 21 -64 -34 -4 2.71 L
Hippocampus - 8 -52 4 2.41 R
41
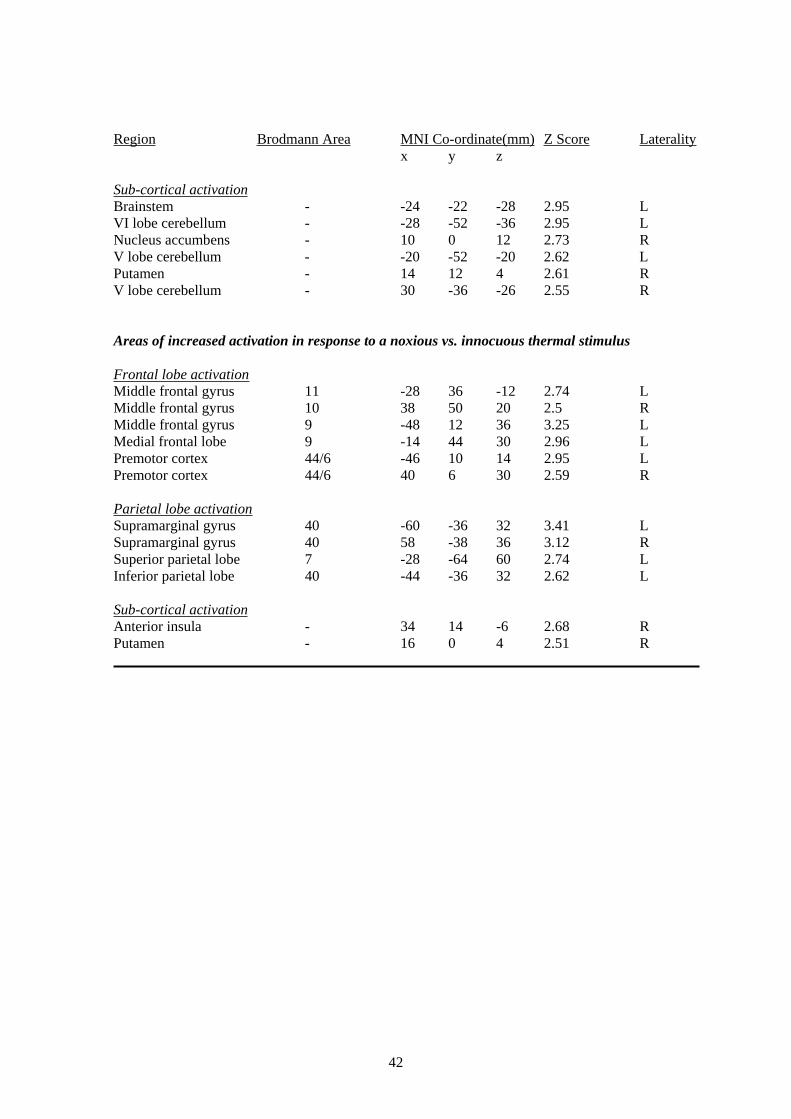
Region Brodmann Area MNI Co-ordinate(mm) Z Score Laterality
x y z
Sub-cortical activation
Brainstem - -24 -22 -28 2.95 L
VI lobe cerebellum - -28 -52 -36 2.95
Nucleus accumbens -
V lobe cerebellum -
L
10 0 12 2.73 R
-20 -52 -20 2.62
Putamen -
V lobe cerebellum -
L
14 12 4 2.61 R
30 -36 -26 2.55 R
Areas of increased activation in response to a noxious vs. innocuous thermal stimulus
Frontal lobe activation
Middle frontal gyrus 11
Middle frontal gyrus 10
Middle frontal gyrus 9
Medial frontal lobe 9
Premotor cortex 44/6
Premotor cortex 44/6
-28 36 -12 2.74 L
38 50 20 2.5 R
-48 12 36 3.25 L
-14 44 30 2.96 L
-46 10 14 2.95 L
40 6 30 2.59 R
Parietal lobe activation
Supramarginal gyrus 40
Supramarginal gyrus 40
Superior parietal lobe 7
Inferior parietal lobe 40
-60 -36 32 3.41 L
58 -38 36 3.12 R
-28 -64 60 2.74 L
-44 -36 32 2.62 L
Sub-cortical activation
Anterior insula - 34 14 -6 2.68 R
Putamen - 16 0 4 2.51 R
42
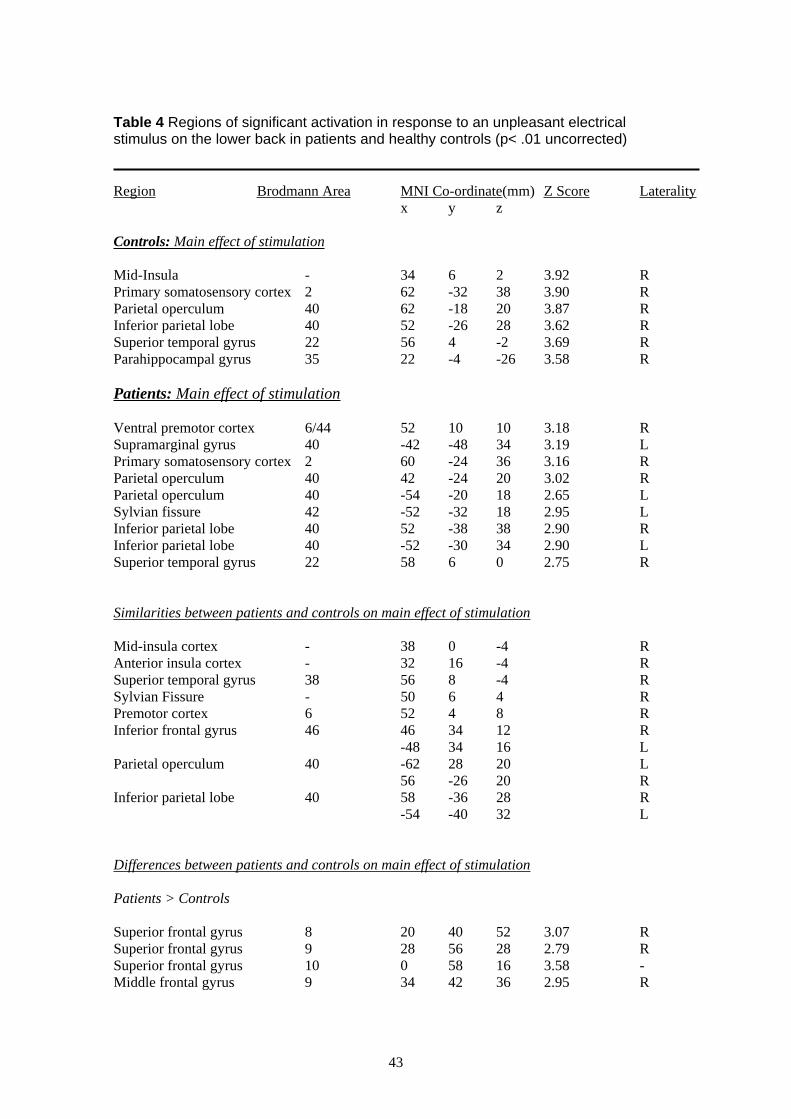
Table 4 Regions of significant activation in response to an unpleasant electrical stimulus on the lower back in patients and healthy controls (p< .01 uncorrected)
Region Brodmann Area MNI Co-ordinate(mm) Z Score Laterality
x y z
Controls: Main effect of stimulation
Mid-Insula -
Primary somatosensory cortex 2
Parietal operculum 40
Inferior parietal lobe 40
Superior temporal gyrus 22
Parahippocampal gyrus 35
34 6 2 3.92 R
62 -32 38 3.90 R
62 -18 20 3.87 R
52 -26 28 3.62 R
56 4 -2 3.69 R
22 -4 -26 3.58 R
Patients: Main effect of stimulation
Ventral premotor cortex 6/44
Supramarginal gyrus 40
Primary somatosensory cortex 2
Parietal operculum 40
Parietal operculum 40
Sylvian fissure 42
Inferior parietal lobe 40
Inferior parietal lobe 40
Superior temporal gyrus 22
52 10 10 3.18 R
-42 -48 34 3.19 L
60 -24 36 3.16 R
42 -24 20 3.02 R
-54 -20 18 2.65 L
-52 -32 18 2.95 L
52 -38 38 2.90 R
-52 -30 34 2.90 L
58 6 0 2.75 R
Similarities between patients and controls on main effect of stimulation
Mid-insula cortex - 38
Anterior insula cortex - 32
Superior temporal gyrus 38 56
Sylvian Fissure - 50
Premotor cortex 6 52
Inferior frontal gyrus 46 46
-48
Parietal operculum 40 -62
56
Inferior parietal lobe 40 58
-54
0 -4 R
16 -4 R
8 -4 R
6 4 R
4 8 R
34 12 R
34 16 L
28 20 L
-26 20 R
-36 28 R
-40 32 L
Differences between patients and controls on main effect of stimulation
Patients > Controls
Superior frontal gyrus 8
Superior frontal gyrus 9
Superior frontal gyrus 10
Middle frontal gyrus 9
20 40 52 3.07 R
28 56 28 2.79 R
0 58 16 3.58 -
34 42 36 2.95 R
43
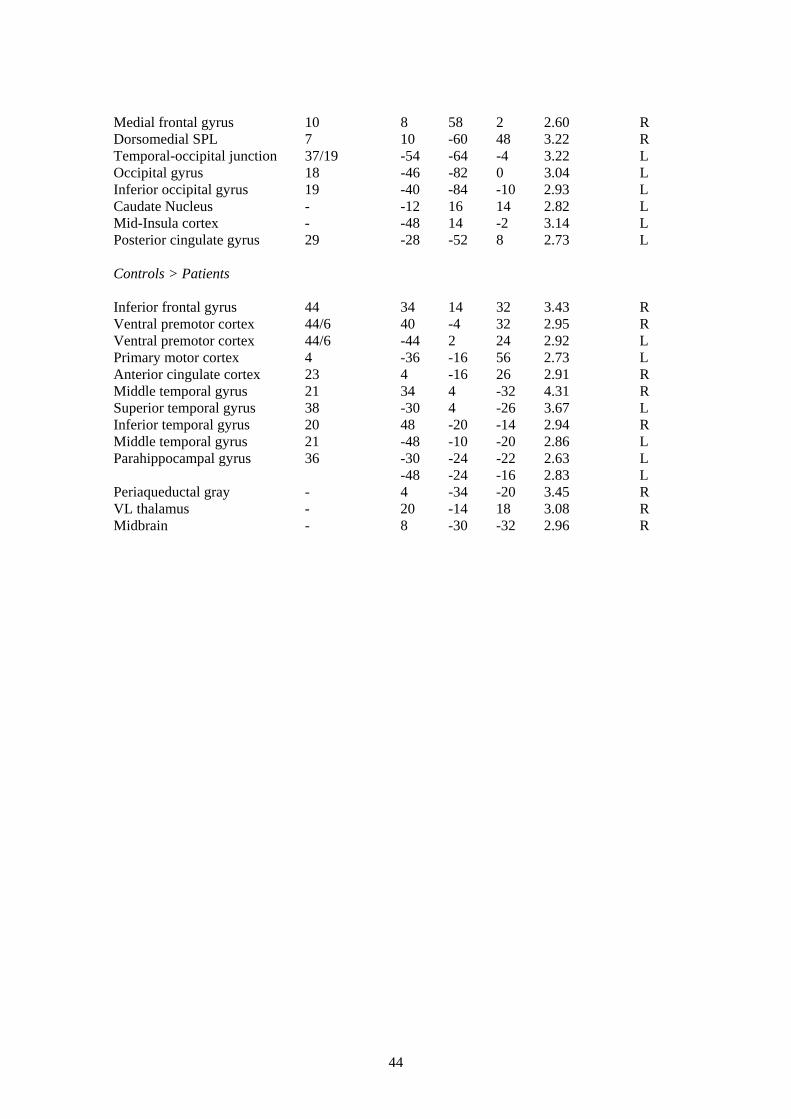
Medial frontal gyrus 10 8 58 2 2.60 R
Dorsomedial SPL 7 10 -60 48 3.22 R
Temporal-occipital junction 37/19 -54 -64 -4 3.22 L
Occipital gyrus 18 -46 -82 0 3.04 L
Inferior occipital gyrus 19 -40 -84 -10 2.93 L
Caudate Nucleus - -12 16 14 2.82 L
Mid-Insula cortex - -48 14 -2 3.14 L
Posterior cingulate gyrus 29 -28 -52 8 2.73 L
Controls > Patients
Inferior frontal gyrus 44 34 14 32 3.43 R
Ventral premotor cortex 44/6 40 -4 32 2.95 R
Ventral premotor cortex 44/6 -44 2 24 2.92 L
Primary motor cortex 4 -36 -16 56 2.73 L
Anterior cingulate cortex 23 4 -16 26 2.91 R
Middle temporal gyrus 21 34 4 -32 4.31 R
Superior temporal gyrus 38 -30 4 -26 3.67 L
Inferior temporal gyrus 20 48 -20 -14 2.94 R
Middle temporal gyrus 21 -48 -10 -20 2.86 L
Parahippocampal gyrus 36 -30 -24 -22 2.63 L
-48 -24 -16 2.83 L
Periaqueductal gray - 4 -34 -20 3.45 R
VL thalamus - 20 -14 18 3.08 R
Midbrain - 8 -30 -32 2.96 R
44
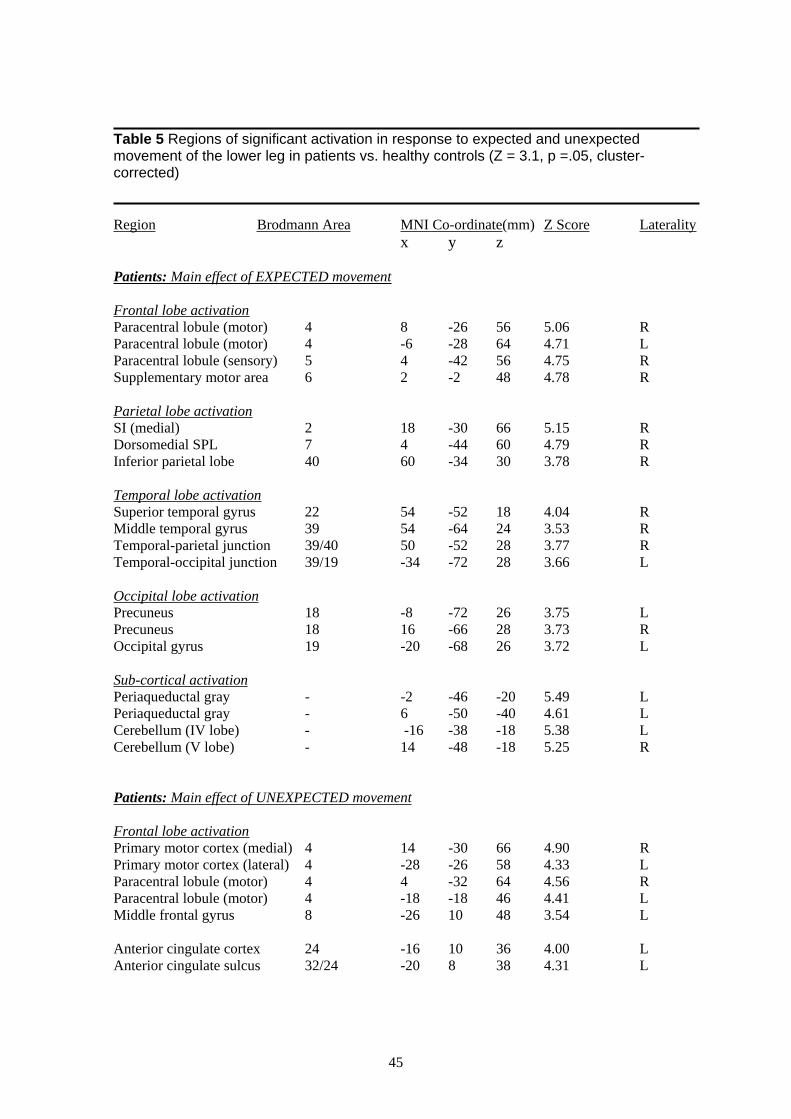
Table 5 Regions of significant activation in response to expected and unexpected movement of the lower leg in patients vs. healthy controls (Z = 3.1, p =.05, cluster-corrected)
Region Brodmann Area MNI Co-ordinate(mm) Z Score Laterality
x y z
Patients: Main effect of EXPECTED movement
Frontal lobe activation
Paracentral lobule (motor) 4
Paracentral lobule (motor) 4
Paracentral lobule (sensory) 5
Supplementary motor area 6
8 -26 56 5.06 R
-6 -28 64 4.71 L
4 -42 56 4.75 R
2 -2 48 4.78 R
Parietal lobe activation
SI (medial) 2
Dorsomedial SPL 7
Inferior parietal lobe 40
18 -30 66 5.15 R
4 -44 60 4.79 R
60 -34 30 3.78 R
Temporal lobe activation
Superior temporal gyrus 22
Middle temporal gyrus 39
Temporal-parietal junction 39/40
Temporal-occipital junction 39/19
54 -52 18 4.04 R
54 -64 24 3.53 R
50 -52 28 3.77 R
-34 -72 28 3.66 L
Occipital lobe activation Precuneus 18
Precuneus 18
Occipital gyrus 19
-8 -72 26 3.75 L
16 -66 28 3.73 R
-20 -68 26 3.72 L
Sub-cortical activation
Periaqueductal gray -
Periaqueductal gray -
Cerebellum (IV lobe) -
Cerebellum (V lobe) -
-2 -46 -20 5.49 L
6 -50 -40 4.61 L
-16 -38 -18 5.38 L
14 -48 -18 5.25 R
Patients: Main effect of UNEXPECTED movement
Frontal lobe activation
Primary motor cortex (medial) 4 14 -30 66 4.90 R
Primary motor cortex (lateral) 4 -28 -26 58 4.33 L
Paracentral lobule (motor) 4 4 -32 64 4.56 R
Paracentral lobule (motor) 4 -18 -18 46 4.41 L
Middle frontal gyrus 8 -26 10 48 3.54 L
Anterior cingulate cortex 24 -16 10 36 4.00 L
Anterior cingulate sulcus 32/24 -20 8 38 4.31 L
45
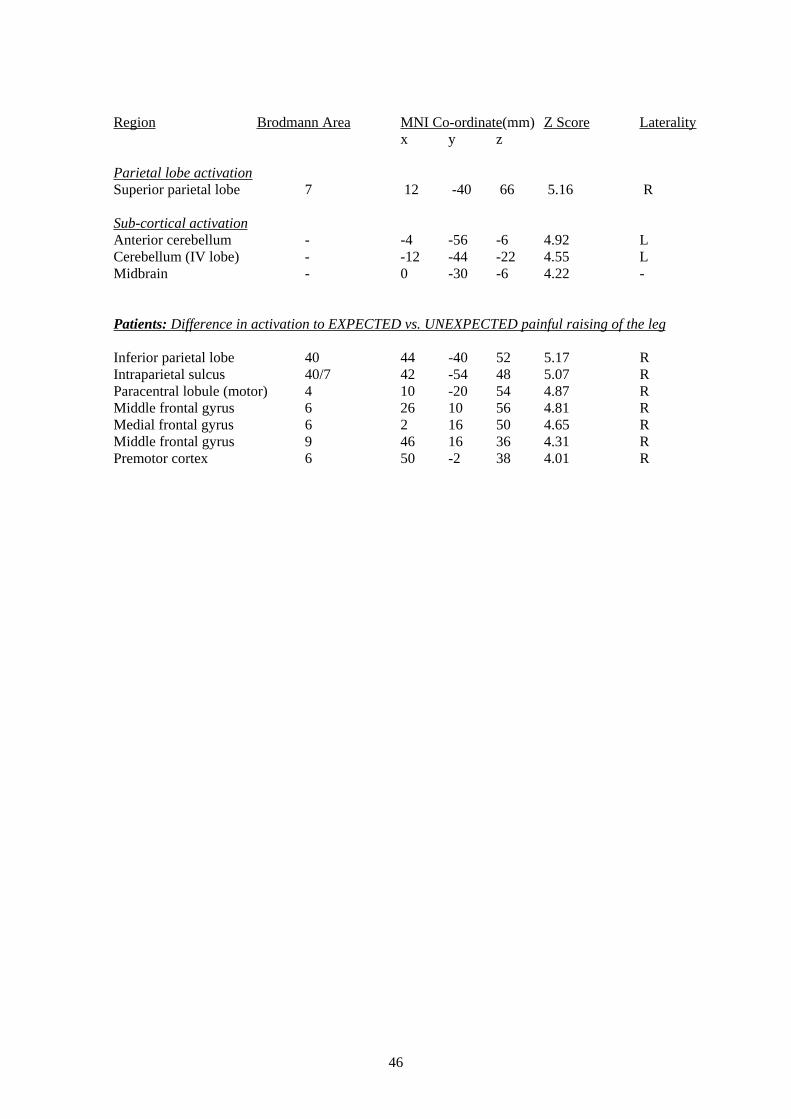
Region Brodmann Area MNI Co-ordinate(mm) Z Score Laterality
x y z
Parietal lobe activation
Superior parietal lobe 7 12 -40 66 5.16 R
Sub-cortical activation
Anterior cerebellum - -4 -56 -6 4.92 L
Cerebellum (IV lobe) - -12 -44 -22 4.55 L
Midbrain - 0 -30 -6 4.22 -
Patients: Difference in activation to EXPECTED vs. UNEXPECTED painful raising of the leg
Inferior parietal lobe 40
Intraparietal sulcus 40/7
Paracentral lobule (motor) 4
Middle frontal gyrus 6
Medial frontal gyrus 6
Middle frontal gyrus 9
Premotor cortex 6
44 -40 52 5.17 R
42 -54 48 5.07 R
10 -20 54 4.87 R
26 10 56 4.81 R
2 16 50 4.65 R
46 16 36 4.31 R
50 -2 38 4.01 R
46

47

Printed and published by the Health and Safety ExecutiveC30 1/98
Printed and published by the Health and Safety Executive C1.10 10/05

ISBN 0-7176-6170-9
RR 394
78071 7 661 701£20.00 9