Embed Size (px)
Citation preview
Is China going to lead the global
‘Clean Energy Technology’ market? A comprehensive RCA Analysis of select
Environmental Goods over a decade
Radhika Kapoor
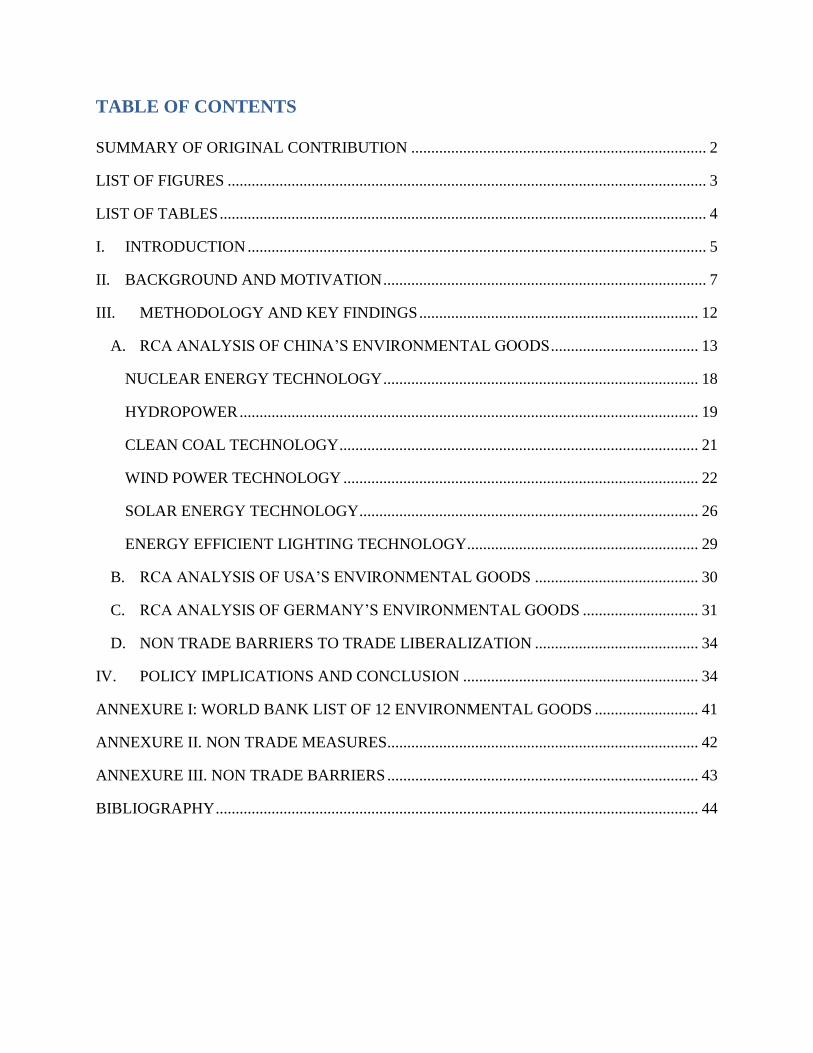
TABLE OF CONTENTS
SUMMARY OF ORIGINAL CONTRIBUTION .......................................................................... 2
LIST OF FIGURES ........................................................................................................................ 3
LIST OF TABLES .......................................................................................................................... 4
I. INTRODUCTION ................................................................................................................... 5
II. BACKGROUND AND MOTIVATION ................................................................................. 7
III. METHODOLOGY AND KEY FINDINGS ...................................................................... 12
A. RCA ANALYSIS OF CHINA‘S ENVIRONMENTAL GOODS ..................................... 13
NUCLEAR ENERGY TECHNOLOGY ............................................................................... 18
HYDROPOWER ................................................................................................................... 19
CLEAN COAL TECHNOLOGY .......................................................................................... 21
WIND POWER TECHNOLOGY ......................................................................................... 22
SOLAR ENERGY TECHNOLOGY ..................................................................................... 26
ENERGY EFFICIENT LIGHTING TECHNOLOGY .......................................................... 29
B. RCA ANALYSIS OF USA‘S ENVIRONMENTAL GOODS ......................................... 30
C. RCA ANALYSIS OF GERMANY‘S ENVIRONMENTAL GOODS ............................. 31
D. NON TRADE BARRIERS TO TRADE LIBERALIZATION ......................................... 34
IV. POLICY IMPLICATIONS AND CONCLUSION ........................................................... 34
ANNEXURE I: WORLD BANK LIST OF 12 ENVIRONMENTAL GOODS .......................... 41
ANNEXURE II. NON TRADE MEASURES.............................................................................. 42
ANNEXURE III. NON TRADE BARRIERS .............................................................................. 43
BIBLIOGRAPHY ......................................................................................................................... 44
SUMMARY OF ORIGINAL CONTRIBUTION
Deriving a unique list of 15 clean energy technology products on the basis of World
Bank‘s list of 12 Environmental Goods
Developing and analyzing the Revealed Comparative Advantage (RCA) metric for the
selected 15 goods for China, Germany and USA
Analysis of China‘s trade strategy and policies using RCA and tariff data
LIST OF FIGURES
Figure 1 : GHG Emission Abatement Potential In Power Sector 8
Figure 2: Market Size And Growth For Environmental Goods And Services By Region, 2011 9
Figure 3: Leading Global Exporters Of Environmental Goods (USD Thousand): Average 2008-
2013 Of Yearly Export Value 9
Figure 4: RCA Analysis Of Select Environmental Goods - China 17
Figure 5: Cumulative Installed Wind Power Capacity In Leading Countries , 1980-2013 23
Figure 6: Percentage Share Of China's Export of Solar PV As Compared With World Exports Of
Solar PV 29
Figure 7 : Average RCA For 15 Environmental Goods For China, Usa And Germany 35
Figure 8 : Percentage Share of Exports For China, Usa And Germany For 15 Environmental
Goods 35
Figure 9: Key Financing Mechanisms For Green Energy Development In China 37
LIST OF TABLES
Table 1 : Clean Energy Technology List Of 15 Environmental Goods 12
Table 2: Static RCA Analysis For China 15
Table 3: Dynamic Analysis Of China's RCA 16
Table 4 : China's Tariff Analysis For 15 Products 20
Table 5: Table of Statistics on Trade In Hydraulic Turbines And Parts, 2010-2012 (US $
Millions) 21
Table 6: Table of Statistics on Exports Of Wind Powered Generating Sets (2004-2012) (US$
Millions) 25
Table 7: RCA Analysis of USA 31
Table 8: RCA Analysis of Germany 32
Table 9: RCA and Tariffs of 15 Environmental Goods Between China, USA And Germany 33
Table 10: Renewable Energy Financing By Country, $Billion 36
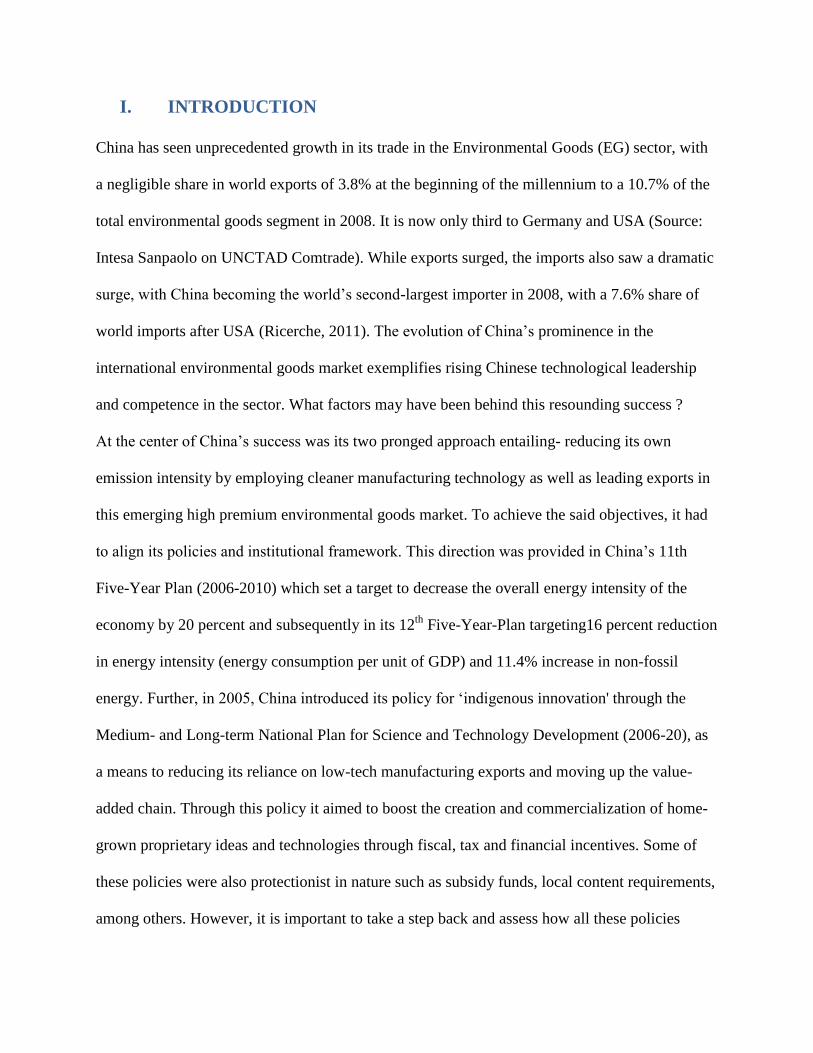
I. INTRODUCTION
China has seen unprecedented growth in its trade in the Environmental Goods (EG) sector, with
a negligible share in world exports of 3.8% at the beginning of the millennium to a 10.7% of the
total environmental goods segment in 2008. It is now only third to Germany and USA (Source:
Intesa Sanpaolo on UNCTAD Comtrade). While exports surged, the imports also saw a dramatic
surge, with China becoming the world‘s second-largest importer in 2008, with a 7.6% share of
world imports after USA (Ricerche, 2011). The evolution of China‘s prominence in the
international environmental goods market exemplifies rising Chinese technological leadership
and competence in the sector. What factors may have been behind this resounding success ?
At the center of China‘s success was its two pronged approach entailing- reducing its own
emission intensity by employing cleaner manufacturing technology as well as leading exports in
this emerging high premium environmental goods market. To achieve the said objectives, it had
to align its policies and institutional framework. This direction was provided in China‘s 11th
Five-Year Plan (2006-2010) which set a target to decrease the overall energy intensity of the
economy by 20 percent and subsequently in its 12th
Five-Year-Plan targeting16 percent reduction
in energy intensity (energy consumption per unit of GDP) and 11.4% increase in non-fossil
energy. Further, in 2005, China introduced its policy for ‗indigenous innovation' through the
Medium- and Long-term National Plan for Science and Technology Development (2006-20), as
a means to reducing its reliance on low-tech manufacturing exports and moving up the value-
added chain. Through this policy it aimed to boost the creation and commercialization of home-
grown proprietary ideas and technologies through fiscal, tax and financial incentives. Some of
these policies were also protectionist in nature such as subsidy funds, local content requirements,
among others. However, it is important to take a step back and assess how all these policies
affected China‘s comparative advantage in environmental goods over the years. It will also be
interesting to understand how China‘s evolving comparative advantage compares with the
developed country leaders in the field such as USA and Germany. This paper aims to ascertain
whether or not China will be able to sustain its comparative advantage by assessing its past RCA
(Revealed Comparative Advantage) trends, policy interventions and tariff structures (trade and
non-trade barriers) to assume future leadership in clean energy technology exports to the world,
overtaking both USA and Germany.
This paper is organized as follows: Section II provides a brief background on environmental
goods and addresses some of the key motivations behind this research, following which Section
III underscores the research methodology and key results of the RCA analysis of the EG
products for China, USA and Germany. Section IV discusses the policy implications and outlines
recommendations for China to sustain and grow its competitiveness in the sector.
II. BACKGROUND AND MOTIVATION
By 2030 world GHG emissions are projected to grow by 37% and by 52% to 2050 (compared to
2005 levels), if no new policy action is introduced. Greenhouse gas (GHG) emissions from
OECD (Organization for Economic Co-operation and Development) countries only would be
expected to increase by 23% by 2030 and by 26% to 2050. While the GHG emissions from 4
rapidly industrializing countries (Brazil, Russia, India and China) are expected to grow by 46%
to 2030, and in total would roughly equal emissions from the 30 OECD countries combined by
2030. With no new policies, world GDP is expected to double (grow by nearly 100%) to 2030
and to triple in size to 2050. But it would only cost about 0.5% of that GDP in 2030, and 2.5% in
2050, to achieve the ambitious climate goal of stabilizing GHG concentrations in the atmosphere
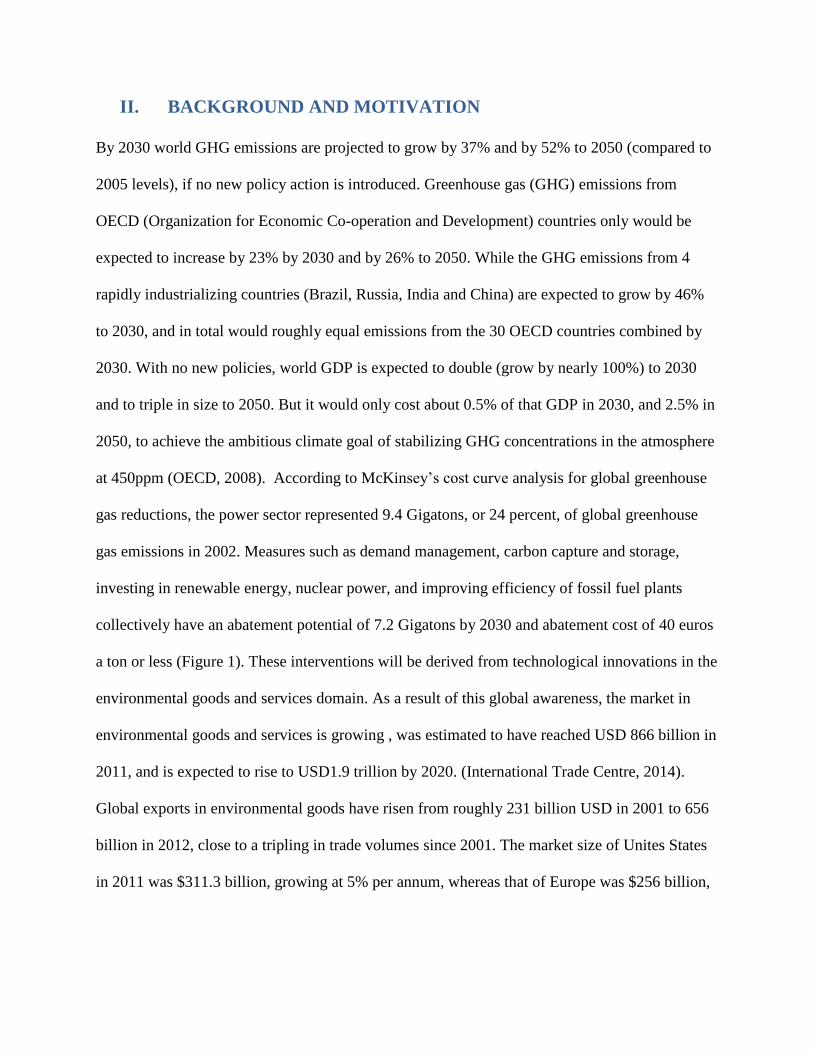
at 450ppm (OECD, 2008). According to McKinsey‘s cost curve analysis for global greenhouse
gas reductions, the power sector represented 9.4 Gigatons, or 24 percent, of global greenhouse
gas emissions in 2002. Measures such as demand management, carbon capture and storage,
investing in renewable energy, nuclear power, and improving efficiency of fossil fuel plants
collectively have an abatement potential of 7.2 Gigatons by 2030 and abatement cost of 40 euros
a ton or less (Figure 1). These interventions will be derived from technological innovations in the
environmental goods and services domain. As a result of this global awareness, the market in
environmental goods and services is growing , was estimated to have reached USD 866 billion in
2011, and is expected to rise to USD1.9 trillion by 2020. (International Trade Centre, 2014).
Global exports in environmental goods have risen from roughly 231 billion USD in 2001 to 656
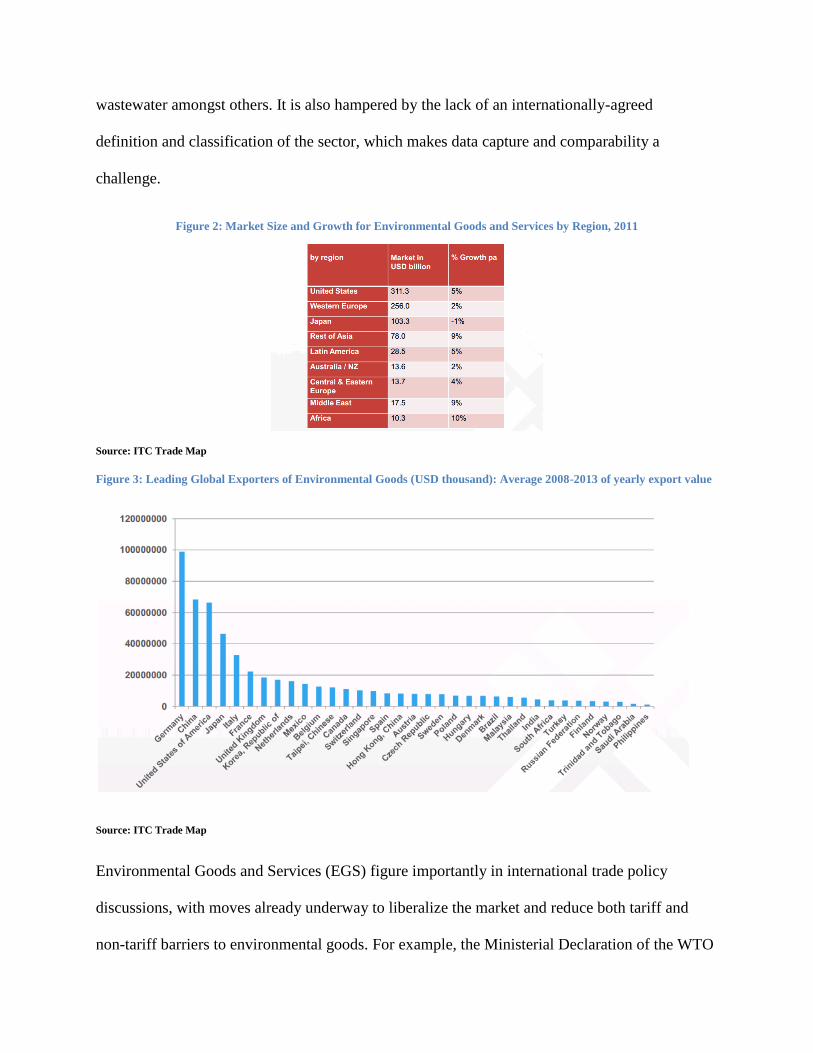
billion in 2012, close to a tripling in trade volumes since 2001. The market size of Unites States
in 2011 was $311.3 billion, growing at 5% per annum, whereas that of Europe was $256 billion,
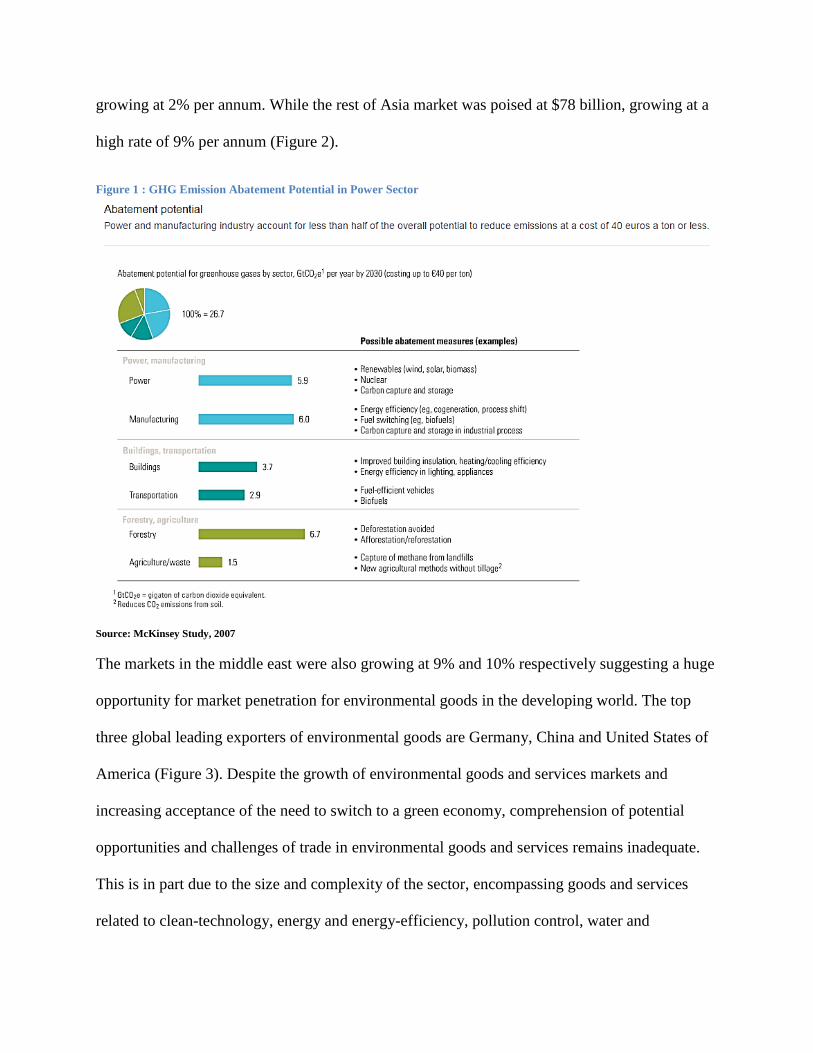
growing at 2% per annum. While the rest of Asia market was poised at $78 billion, growing at a
high rate of 9% per annum (Figure 2).
Figure 1 : GHG Emission Abatement Potential in Power Sector
Source: McKinsey Study, 2007
The markets in the middle east were also growing at 9% and 10% respectively suggesting a huge
opportunity for market penetration for environmental goods in the developing world. The top
three global leading exporters of environmental goods are Germany, China and United States of
America (Figure 3). Despite the growth of environmental goods and services markets and
increasing acceptance of the need to switch to a green economy, comprehension of potential
opportunities and challenges of trade in environmental goods and services remains inadequate.
This is in part due to the size and complexity of the sector, encompassing goods and services
related to clean-technology, energy and energy-efficiency, pollution control, water and
wastewater amongst others. It is also hampered by the lack of an internationally-agreed
definition and classification of the sector, which makes data capture and comparability a
challenge.
Figure 2: Market Size and Growth for Environmental Goods and Services by Region, 2011
Source: ITC Trade Map
Figure 3: Leading Global Exporters of Environmental Goods (USD thousand): Average 2008-2013 of yearly export value
Source: ITC Trade Map
Environmental Goods and Services (EGS) figure importantly in international trade policy
discussions, with moves already underway to liberalize the market and reduce both tariff and
non-tariff barriers to environmental goods. For example, the Ministerial Declaration of the WTO
Doha Round in 2001, explicitly mandates negotiations aimed at the ‗reduction, or as appropriate,
elimination of tariff and non-tariff barriers to environmental goods and services‘, albeit without
specifying which goods and service would fall under this terminology. Lower trade barriers to
EGS can contribute to increased access, which can yield positive environmental, social and
economic benefits (ICTSD, 2007)
For more than a decade, within different settings there have been efforts to define EGs. Defining
and classifying climate-friendly them is the biggest challenge faced by negotiators in favor of
trade liberalization in the sector. The dual-use problem is another important challenge facing EG
negotiators which arises from the fact that most product categories proposed by WTO Members
as EGs include, at the HS-6 digit level, other products that also have non-environmental uses.
Another big challenge for the EG negotiations is the distribution question, which is to ascertain
and include products of export interest to developing countries. The perception so far has been
that EGs—being capital- and technology-intensive—are of export interest only to developed
countries and a few middle-income developing economies. Further most WTO Members have
not accorded ―environmental goods‖ status to otherwise ―like‖ products that have been produced
using methods friendlier to the environment. This is due to the difficulty of distinguishing such
products within the HS system and challenges of harmonizing standards and labelling, as well as
to systemic concerns with regard to other non-product-related standards making their way into
the WTO system as a basis for differentiated treatment. (ICTSD, 2009).
Given these challenges, trade bodies and country associations over the years have made several
attempts at defining lists of EGs. Asia-Pacific Economic Community (APEC) was the first to
single out EGs as a category for trade liberalization in 1997. The OECD list of EGs on the other
hand was based on the definition of the environment and categorized EGs and services under
three broad headings: pollution management, cleaner technologies and products, and resource
management. However, it was the Doha Round that for the first time singled out EGs (and
services) for accelerated trade liberalization at a multilateral level. ‗Friends of Environmental
Goods‘ - Canada, the European Union, Japan, Korea, New-Zealand, Norway, Chinese Taipei,
Switzerland and the United States during the course of the Doha Round also submitted a list of
153 goods for negotiation. (ICTSD, 2013). The World Bank identified a shorter list of 12 goods
for a study on trade and climate change published in 2008 (see Annexure I for details). The list
was identified as being relevant to climate change and was designed to examine the impacts on
trade of removing tariff and non-tariff barriers on environmental goods in general. It includes
goods related to wind power, solar power, energy efficient lighting and ―clean‖ coal. Some of
these items are covered in the list of 153; others are new.
In July 2014, fourteen WTO members launched plurilateral negotiations for an Environmental
Goods Agreement at the WTO. These members account for over 86 per cent of global
environmental goods trade. The talks built on a list of 54 environmental goods put together by
the APEC countries in 2012 to reduce import tariffs to 5 per cent or less by the end of 2015.
Negotiators are expected to meet regularly to discuss substance and product coverage.
With the world coming closer to liberalizing trade in environmental goods and services, how
would China‘s position be affected in world trade ? Will China continue to build its comparative
advantage over time and lead the trade of environmental goods and services or will its
―protected‖ clean energy technology industries fail to compete with USA and Germany over
time ? These are some of the questions this research paper will seek to address.
III. METHODOLOGY AND KEY FINDINGS
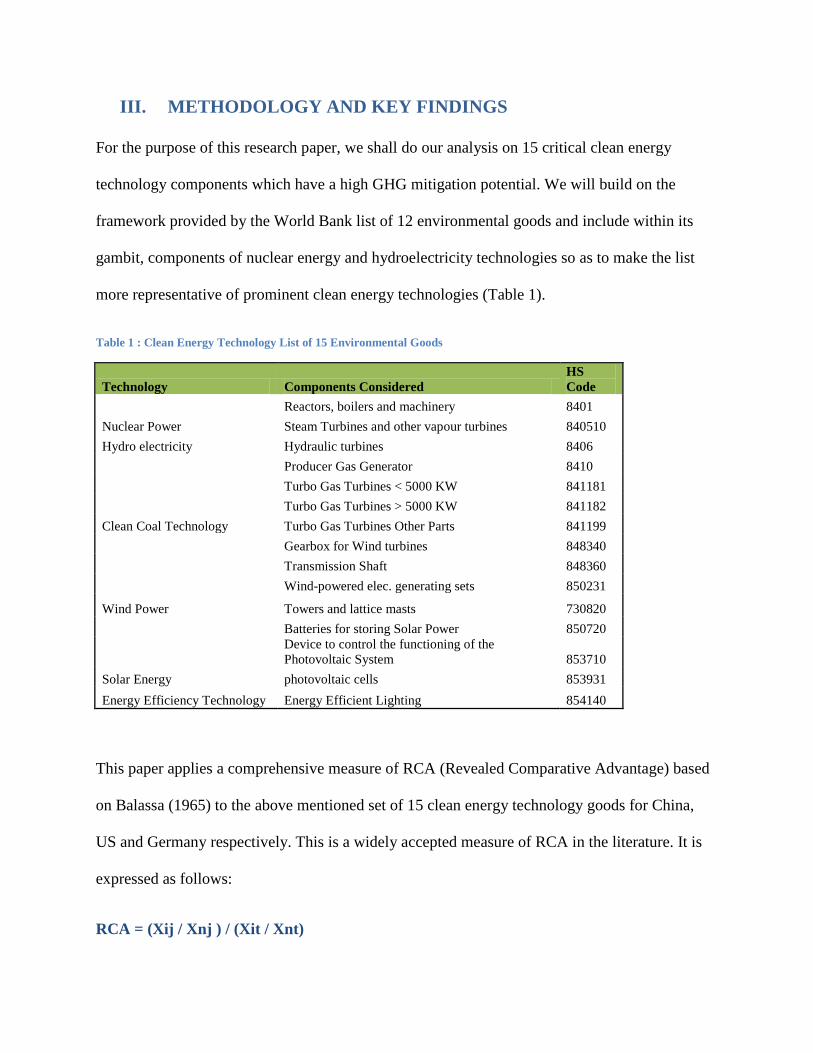
For the purpose of this research paper, we shall do our analysis on 15 critical clean energy
technology components which have a high GHG mitigation potential. We will build on the
framework provided by the World Bank list of 12 environmental goods and include within its
gambit, components of nuclear energy and hydroelectricity technologies so as to make the list
more representative of prominent clean energy technologies (Table 1).
Table 1 : Clean Energy Technology List of 15 Environmental Goods
Technology Components Considered
HS
Code
Nuclear Power
Reactors, boilers and machinery 8401
Steam Turbines and other vapour turbines 840510
Hydro electricity Hydraulic turbines 8406
Clean Coal Technology
Producer Gas Generator 8410
Turbo Gas Turbines < 5000 KW 841181
Turbo Gas Turbines > 5000 KW 841182
Turbo Gas Turbines Other Parts 841199
Wind Power
Gearbox for Wind turbines 848340
Transmission Shaft 848360
Wind-powered elec. generating sets 850231
Towers and lattice masts 730820
Solar Energy
Batteries for storing Solar Power 850720
Device to control the functioning of the
Photovoltaic System 853710
photovoltaic cells 853931
Energy Efficiency Technology Energy Efficient Lighting 854140
This paper applies a comprehensive measure of RCA (Revealed Comparative Advantage) based
on Balassa (1965) to the above mentioned set of 15 clean energy technology goods for China,
US and Germany respectively. This is a widely accepted measure of RCA in the literature. It is
expressed as follows:
RCA = (Xij / Xnj ) / (Xit / Xnt)
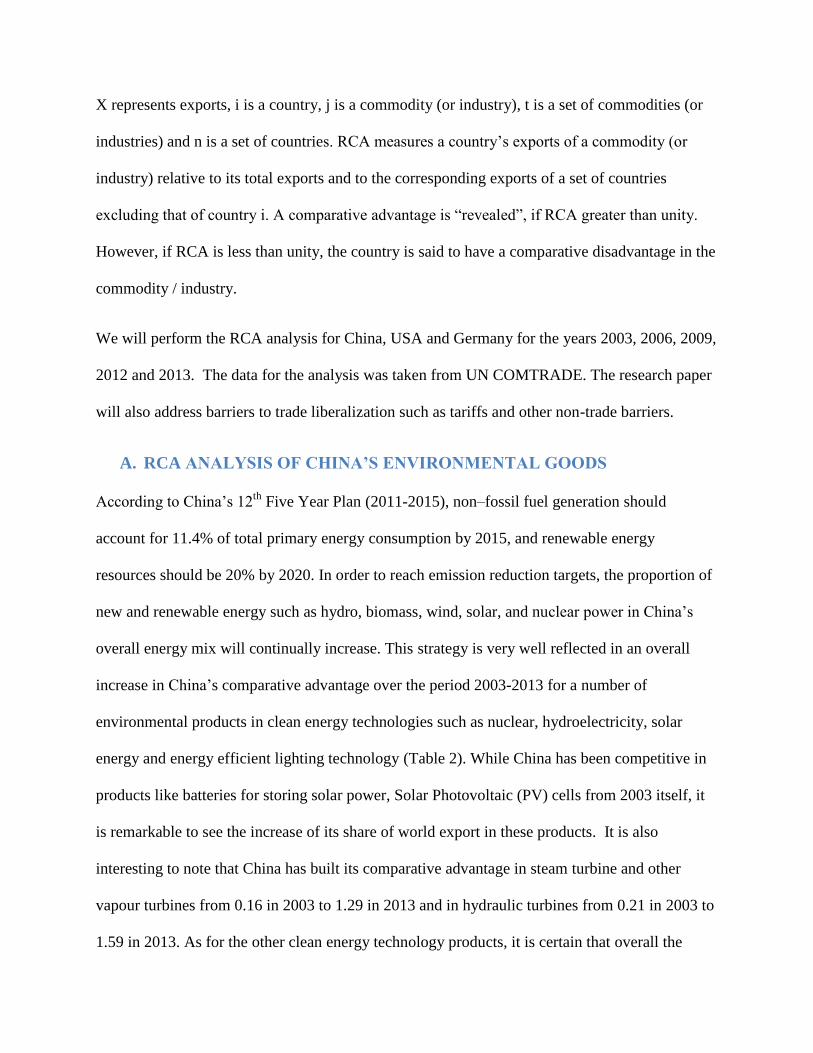
X represents exports, i is a country, j is a commodity (or industry), t is a set of commodities (or
industries) and n is a set of countries. RCA measures a country‘s exports of a commodity (or
industry) relative to its total exports and to the corresponding exports of a set of countries
excluding that of country i. A comparative advantage is ―revealed‖, if RCA greater than unity.
However, if RCA is less than unity, the country is said to have a comparative disadvantage in the
commodity / industry.
We will perform the RCA analysis for China, USA and Germany for the years 2003, 2006, 2009,
2012 and 2013. The data for the analysis was taken from UN COMTRADE. The research paper
will also address barriers to trade liberalization such as tariffs and other non-trade barriers.
A. RCA ANALYSIS OF CHINA’S ENVIRONMENTAL GOODS
According to China‘s 12th
Five Year Plan (2011-2015), non–fossil fuel generation should
account for 11.4% of total primary energy consumption by 2015, and renewable energy
resources should be 20% by 2020. In order to reach emission reduction targets, the proportion of
new and renewable energy such as hydro, biomass, wind, solar, and nuclear power in China‘s
overall energy mix will continually increase. This strategy is very well reflected in an overall
increase in China‘s comparative advantage over the period 2003-2013 for a number of
environmental products in clean energy technologies such as nuclear, hydroelectricity, solar
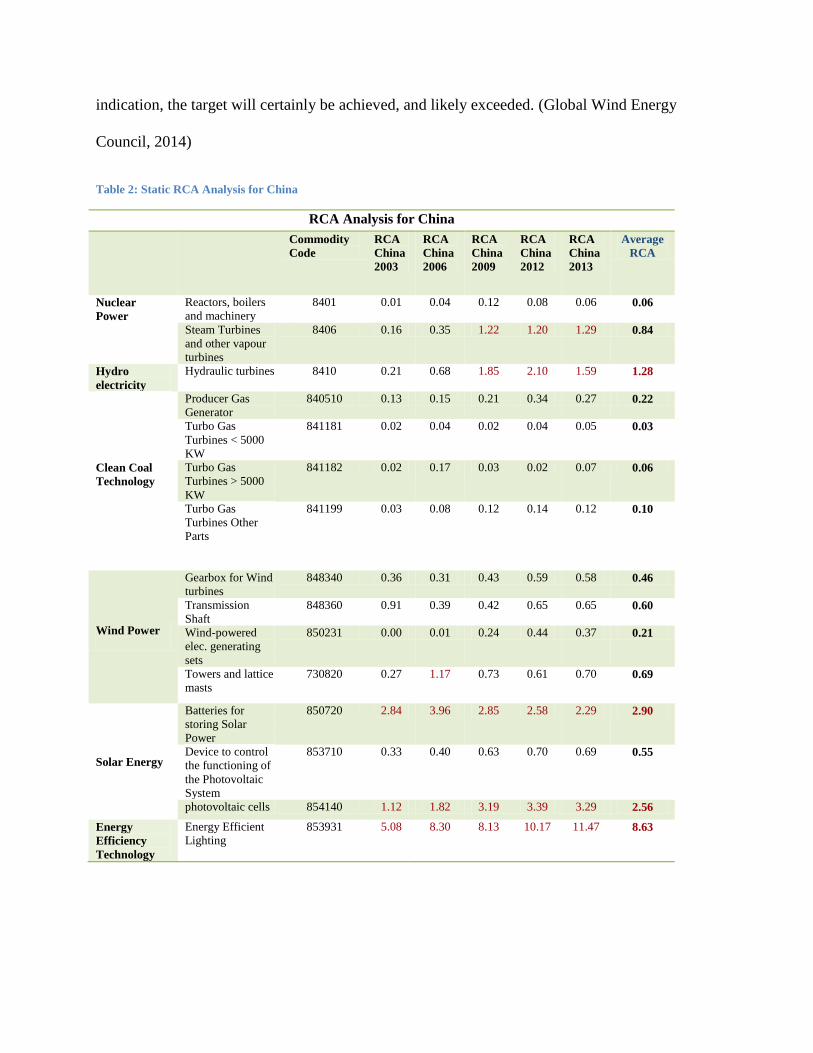
energy and energy efficient lighting technology (Table 2). While China has been competitive in
products like batteries for storing solar power, Solar Photovoltaic (PV) cells from 2003 itself, it
is remarkable to see the increase of its share of world export in these products. It is also
interesting to note that China has built its comparative advantage in steam turbine and other
vapour turbines from 0.16 in 2003 to 1.29 in 2013 and in hydraulic turbines from 0.21 in 2003 to
1.59 in 2013. As for the other clean energy technology products, it is certain that overall the
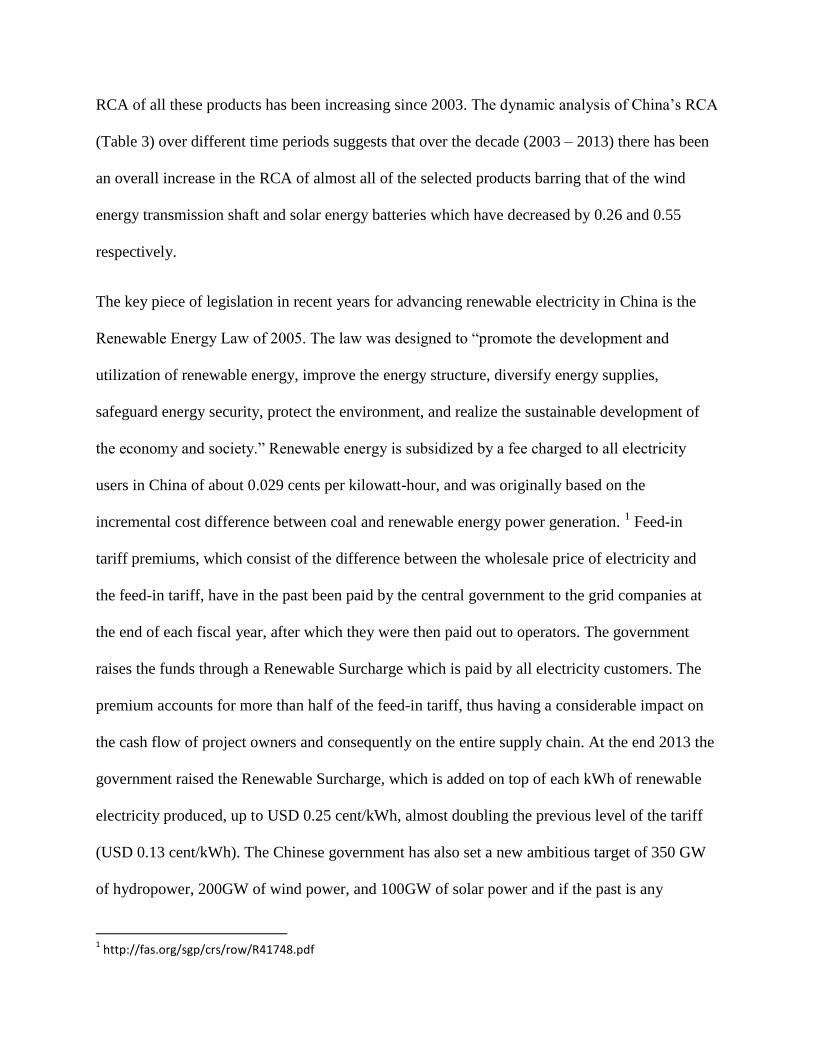
RCA of all these products has been increasing since 2003. The dynamic analysis of China‘s RCA
(Table 3) over different time periods suggests that over the decade (2003 – 2013) there has been
an overall increase in the RCA of almost all of the selected products barring that of the wind
energy transmission shaft and solar energy batteries which have decreased by 0.26 and 0.55
respectively.
The key piece of legislation in recent years for advancing renewable electricity in China is the
Renewable Energy Law of 2005. The law was designed to ―promote the development and
utilization of renewable energy, improve the energy structure, diversify energy supplies,
safeguard energy security, protect the environment, and realize the sustainable development of
the economy and society.‖ Renewable energy is subsidized by a fee charged to all electricity
users in China of about 0.029 cents per kilowatt-hour, and was originally based on the
incremental cost difference between coal and renewable energy power generation. 1 Feed-in
tariff premiums, which consist of the difference between the wholesale price of electricity and
the feed-in tariff, have in the past been paid by the central government to the grid companies at
the end of each fiscal year, after which they were then paid out to operators. The government
raises the funds through a Renewable Surcharge which is paid by all electricity customers. The
premium accounts for more than half of the feed-in tariff, thus having a considerable impact on
the cash flow of project owners and consequently on the entire supply chain. At the end 2013 the
government raised the Renewable Surcharge, which is added on top of each kWh of renewable
electricity produced, up to USD 0.25 cent/kWh, almost doubling the previous level of the tariff
(USD 0.13 cent/kWh). The Chinese government has also set a new ambitious target of 350 GW
of hydropower, 200GW of wind power, and 100GW of solar power and if the past is any
1 http://fas.org/sgp/crs/row/R41748.pdf
indication, the target will certainly be achieved, and likely exceeded. (Global Wind Energy
Council, 2014)
Table 2: Static RCA Analysis for China
RCA Analysis for China
Commodity
Code
RCA
China
2003
RCA
China
2006
RCA
China
2009
RCA
China
2012
RCA
China
2013
Average
RCA
Nuclear
Power
Reactors, boilers
and machinery
8401 0.01 0.04 0.12 0.08 0.06 0.06
Steam Turbines
and other vapour
turbines
8406 0.16 0.35 1.22 1.20 1.29 0.84
Hydro
electricity
Hydraulic turbines 8410 0.21 0.68 1.85 2.10 1.59 1.28
Clean Coal
Technology
Producer Gas
Generator
840510 0.13 0.15 0.21 0.34 0.27 0.22
Turbo Gas
Turbines < 5000
KW
841181 0.02 0.04 0.02 0.04 0.05 0.03
Turbo Gas
Turbines > 5000
KW
841182 0.02 0.17 0.03 0.02 0.07 0.06
Turbo Gas
Turbines Other
Parts
841199 0.03 0.08 0.12 0.14 0.12 0.10
Wind Power
Gearbox for Wind
turbines
848340 0.36 0.31 0.43 0.59 0.58 0.46
Transmission
Shaft
848360 0.91 0.39 0.42 0.65 0.65 0.60
Wind-powered
elec. generating
sets
850231 0.00 0.01 0.24 0.44 0.37 0.21
Towers and lattice
masts
730820 0.27 1.17 0.73 0.61 0.70 0.69
Solar Energy
Batteries for
storing Solar
Power
850720 2.84 3.96 2.85 2.58 2.29 2.90
Device to control
the functioning of
the Photovoltaic
System
853710 0.33 0.40 0.63 0.70 0.69 0.55
photovoltaic cells 854140 1.12 1.82 3.19 3.39 3.29 2.56
Energy
Efficiency
Technology
Energy Efficient
Lighting
853931 5.08 8.30 8.13 10.17 11.47 8.63
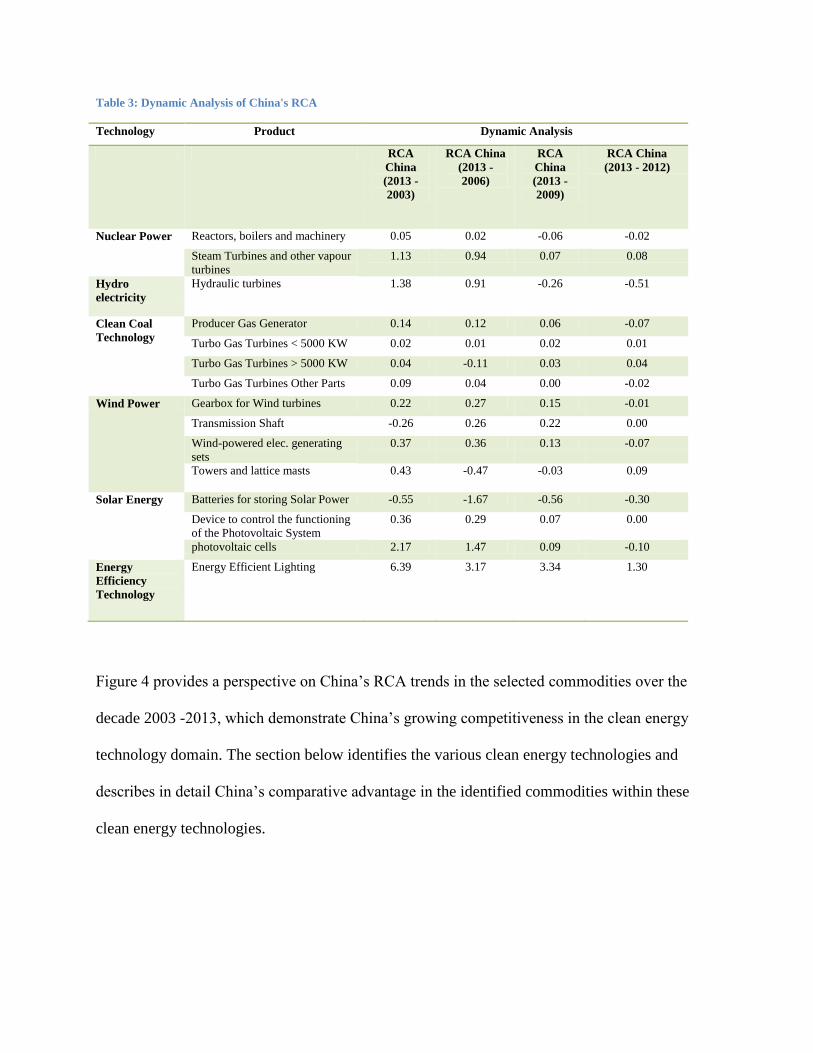
Table 3: Dynamic Analysis of China's RCA
Technology Product Dynamic Analysis
RCA
China
(2013 -
2003)
RCA China
(2013 -
2006)
RCA
China
(2013 -
2009)
RCA China
(2013 - 2012)
Nuclear Power Reactors, boilers and machinery 0.05 0.02 -0.06 -0.02
Steam Turbines and other vapour
turbines
1.13 0.94 0.07 0.08
Hydro
electricity
Hydraulic turbines 1.38 0.91 -0.26 -0.51
Clean Coal
Technology
Producer Gas Generator 0.14 0.12 0.06 -0.07
Turbo Gas Turbines < 5000 KW 0.02 0.01 0.02 0.01
Turbo Gas Turbines > 5000 KW 0.04 -0.11 0.03 0.04
Turbo Gas Turbines Other Parts 0.09 0.04 0.00 -0.02
Wind Power Gearbox for Wind turbines 0.22 0.27 0.15 -0.01
Transmission Shaft -0.26 0.26 0.22 0.00
Wind-powered elec. generating
sets
0.37 0.36 0.13 -0.07
Towers and lattice masts 0.43 -0.47 -0.03 0.09
Solar Energy Batteries for storing Solar Power -0.55 -1.67 -0.56 -0.30
Device to control the functioning
of the Photovoltaic System
0.36 0.29 0.07 0.00
photovoltaic cells 2.17 1.47 0.09 -0.10
Energy
Efficiency
Technology
Energy Efficient Lighting 6.39 3.17 3.34 1.30
Figure 4 provides a perspective on China‘s RCA trends in the selected commodities over the
decade 2003 -2013, which demonstrate China‘s growing competitiveness in the clean energy
technology domain. The section below identifies the various clean energy technologies and
describes in detail China‘s comparative advantage in the identified commodities within these
clean energy technologies.
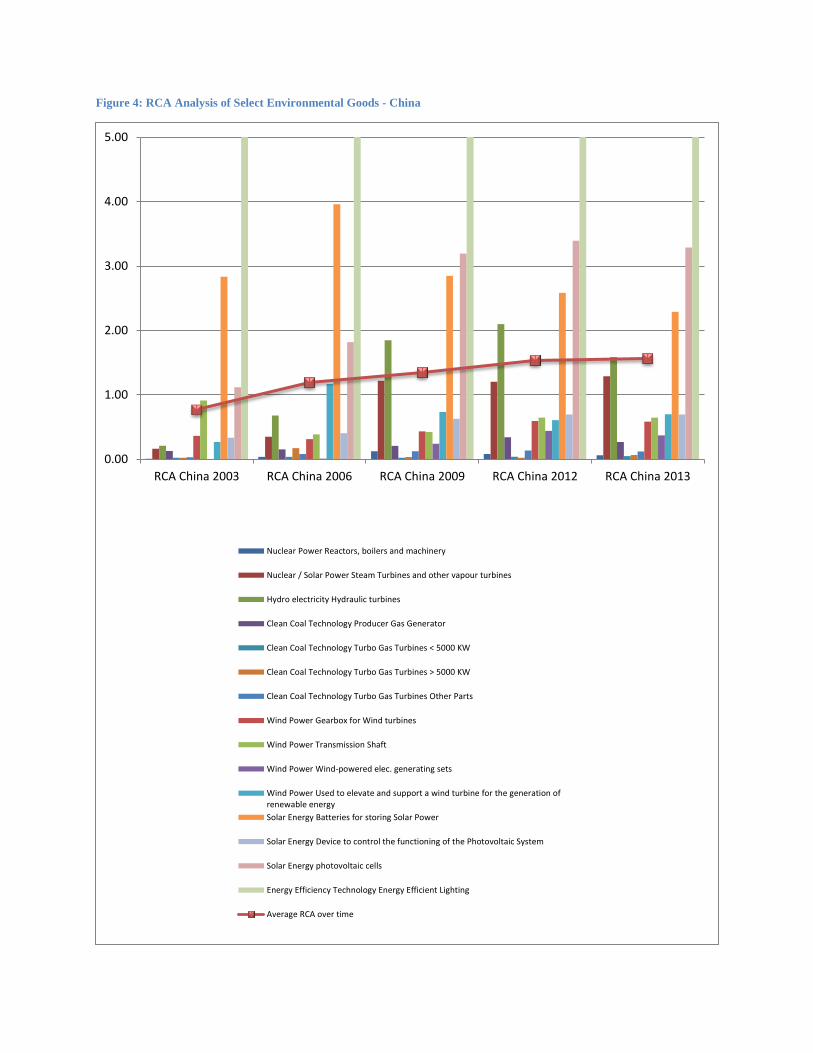
Figure 4: RCA Analysis of Select Environmental Goods - China
0.00
1.00
2.00
3.00
4.00
5.00
RCA China 2003 RCA China 2006 RCA China 2009 RCA China 2012 RCA China 2013
Nuclear Power Reactors, boilers and machinery
Nuclear / Solar Power Steam Turbines and other vapour turbines
Hydro electricity Hydraulic turbines
Clean Coal Technology Producer Gas Generator
Clean Coal Technology Turbo Gas Turbines < 5000 KW
Clean Coal Technology Turbo Gas Turbines > 5000 KW
Clean Coal Technology Turbo Gas Turbines Other Parts
Wind Power Gearbox for Wind turbines
Wind Power Transmission Shaft
Wind Power Wind-powered elec. generating sets
Wind Power Used to elevate and support a wind turbine for the generation ofrenewable energy
Solar Energy Batteries for storing Solar Power
Solar Energy Device to control the functioning of the Photovoltaic System
Solar Energy photovoltaic cells
Energy Efficiency Technology Energy Efficient Lighting
Average RCA over time
NUCLEAR ENERGY TECHNOLOGY
Mainland China has 23 nuclear power reactors in operation and 26 under construction.
Additional reactors that are planned, including some of the world's most advanced, to give more
than a three-fold increase in nuclear capacity to at least 58 GWe by 2020, then some 150 GWe
by 2030, and much more by 2050. The impetus for increasing nuclear power share in China is
increasingly due to air pollution from coal-fired plants. China‘s policy is for closed fuel cycle.
China has become largely self-sufficient in reactor design and construction, as well as other
aspects of the fuel cycle, but is making full use of western technology while adapting and
improving it. China will invest more in nuclear power technological innovations, promote
application of advanced technology, improve the equipment level, and attach great importance to
personnel training. In July 2013 the NDRC set a wholesale power price of 7 US cents/kWh for
all new nuclear power projects, to promote the healthy development of nuclear power and guide
investment into the sector. China has a determined policy at NDRC level of exporting nuclear
technology, based on development of the CAP1400 reactor with Chinese intellectual property
rights and backed by full fuel cycle capability. The policy is being pursued at a high level
politically, utilising China's economic and diplomatic influence. In January 2015 the cabinet
announced new incentives and financing for industry exports, particularly nuclear power and
railways, on the back of $103 billion outbound trade and investment in 2014 (World Nuclear
Association, 2015).
Reactors, Boilers and Machinery: China is currently uncompetitive in the export of nuclear
technology with an average RCA of 0.06 (Table 2). China‘s RCA increased only marginally by
0.05 over the decade (2003-13) (Table 3). To encourage import of this critical technology and
encourage technology transfer, China has very low average ad-valorem tariff of 1.4% on the
import of the nuclear energy technology. Given the massive investments in R&D and strong
political will to develop this industry as a potential export market, we could see a gradual
increase in China‘s RCA for nuclear energy technology in the near future.
Steam Engine: Steam engines are a critical component of nuclear power plants. Nuclear plants
create supercritical steam, which has higher temperature efficiencies than more typical types of
steam. General Electric (GE) licensed its steam turbine technology to Chinese companies and
also formed joint venture with state owned firms to produce less sophisticated power turbines in
1980. Other competitors, around the same time, entered into technology transfer agreements
with the Chinese counterparts, the result of which was that China mastered the technology of
manufacturing steam turbines (McFarlin, 2015). In 2009, China was the third largest exporter
and importer of steam turbines and other vapor turbines and accounted for 15 percent of world
exports and 7.6 percent of world imports (UNCOMTRADE). This export prowess is projected in
the RCA of 1.22 for China in 2009 in this segment (Table 2) which only increased to 1.29 in
2013. To maintain its leadership even domestically, China has a prohibitive ad-valorem import
tariff of 14% on the commodity (Table 4).
HYDROPOWER
Hydropower is the largest renewable energy source, and it produces around 16 % of the world‘s
electricity and over four-fifths of the world‘s renewable electricity. Canada, China and the
United States are the countries which have the largest hydropower generation capacity (IPCC,
2011; REN21, 2011; and IHA, 2011). China has been particularly successful at installing small
hydropower projects to meet rural electrification goals and 160 TWh was produced from 45 000
small hydro projects in China in 2010 (IN-SHP, 2010). (International Renewable Energy
Agency, 2010). ITA (International Trade Administration) believes hydropower will account for
15 percent of renewable energy exports and nearly 20 percent of global investment in renewable
energy through 2015. The industry installed roughly 26 GW of new capacity in 2012 – led by
China (14 GW) – and is expected to continue to grow into the future. China alone enjoys a
project pipeline of 80 GW including 16 different large hydropower projects. In 2013, China had
the highest installed capacity of 229 GW (ITA Renewable Energy Top Markets Study, 2014).
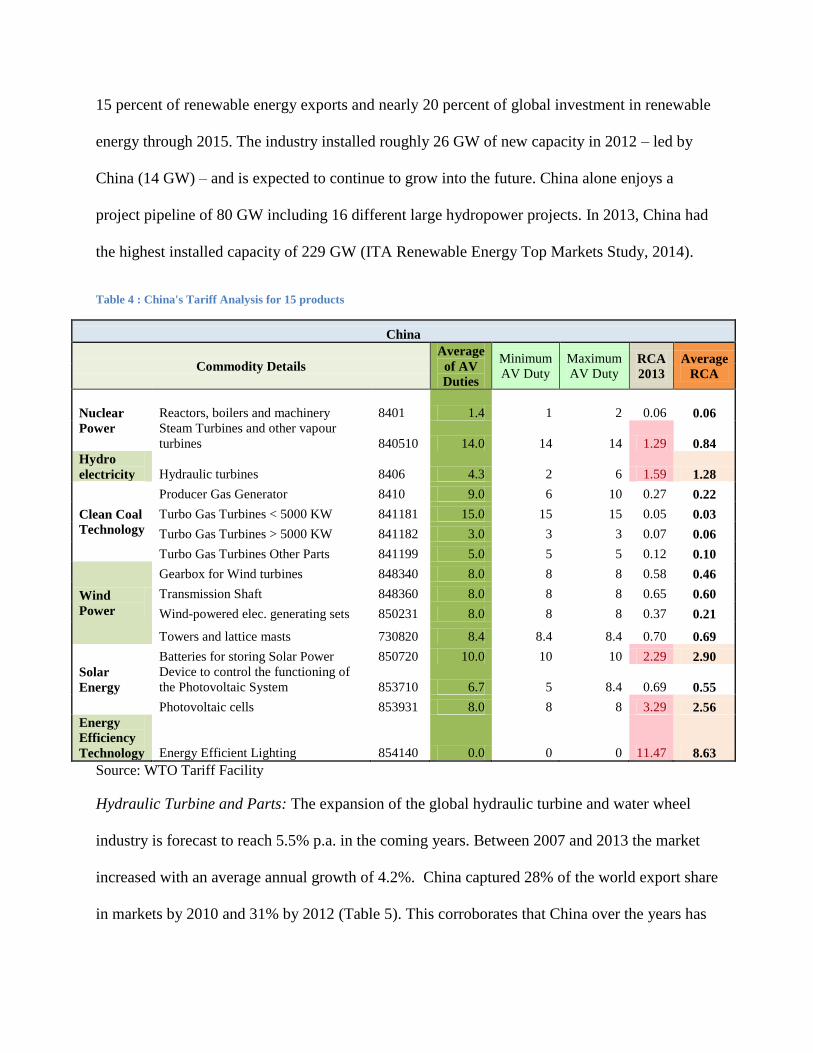
Table 4 : China's Tariff Analysis for 15 products
China
Commodity Details
Average
of AV
Duties
Minimum
AV Duty
Maximum
AV Duty RCA
2013
Average
RCA
Nuclear
Power
Reactors, boilers and machinery 8401 1.4 1 2 0.06 0.06
Steam Turbines and other vapour
turbines 840510 14.0 14 14 1.29 0.84
Hydro
electricity Hydraulic turbines 8406 4.3 2 6 1.59 1.28
Clean Coal
Technology
Producer Gas Generator 8410 9.0 6 10 0.27 0.22
Turbo Gas Turbines < 5000 KW 841181 15.0 15 15 0.05 0.03
Turbo Gas Turbines > 5000 KW 841182 3.0 3 3 0.07 0.06
Turbo Gas Turbines Other Parts 841199 5.0 5 5 0.12 0.10
Wind
Power
Gearbox for Wind turbines 848340 8.0 8 8 0.58 0.46
Transmission Shaft 848360 8.0 8 8 0.65 0.60
Wind-powered elec. generating sets 850231 8.0 8 8 0.37 0.21
Towers and lattice masts 730820 8.4 8.4 8.4 0.70 0.69
Solar
Energy
Batteries for storing Solar Power 850720 10.0 10 10 2.29 2.90
Device to control the functioning of
the Photovoltaic System 853710 6.7 5 8.4 0.69 0.55
Photovoltaic cells 853931 8.0 8 8 3.29 2.56
Energy
Efficiency
Technology Energy Efficient Lighting 854140 0.0 0 0 11.47 8.63
Source: WTO Tariff Facility
Hydraulic Turbine and Parts: The expansion of the global hydraulic turbine and water wheel
industry is forecast to reach 5.5% p.a. in the coming years. Between 2007 and 2013 the market
increased with an average annual growth of 4.2%. China captured 28% of the world export share
in markets by 2010 and 31% by 2012 (Table 5). This corroborates that China over the years has
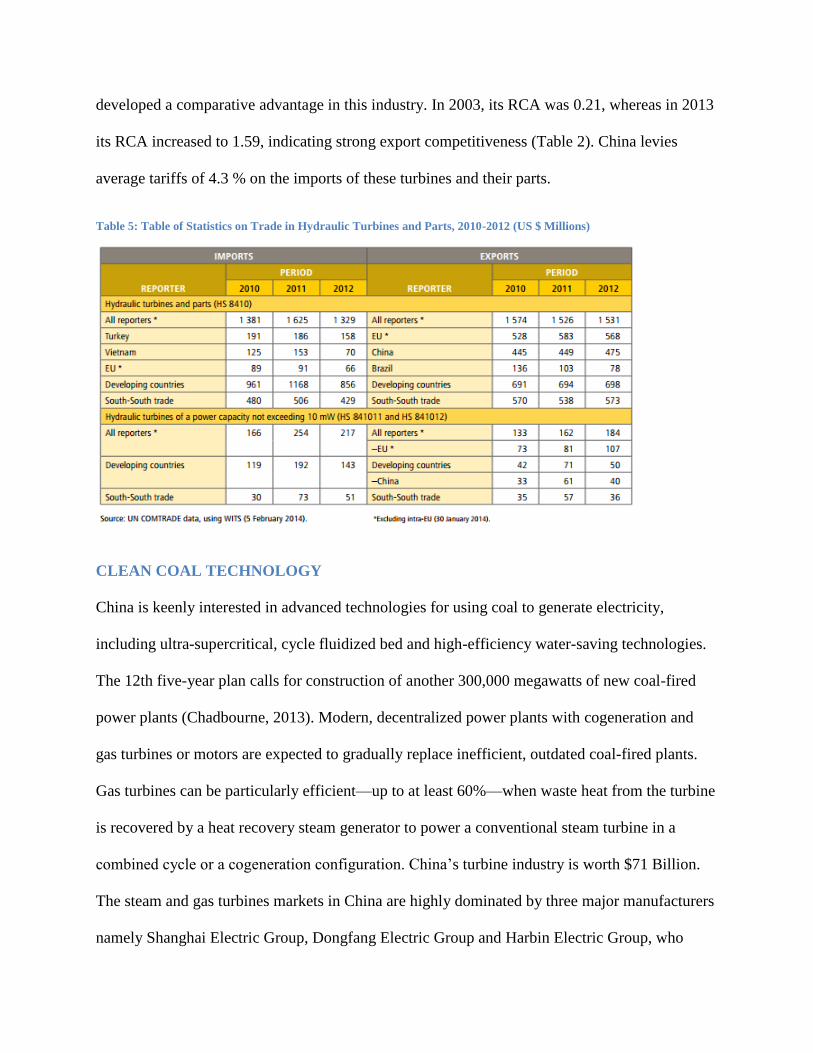
developed a comparative advantage in this industry. In 2003, its RCA was 0.21, whereas in 2013
its RCA increased to 1.59, indicating strong export competitiveness (Table 2). China levies
average tariffs of 4.3 % on the imports of these turbines and their parts.
Table 5: Table of Statistics on Trade in Hydraulic Turbines and Parts, 2010-2012 (US $ Millions)
CLEAN COAL TECHNOLOGY
China is keenly interested in advanced technologies for using coal to generate electricity,
including ultra-supercritical, cycle fluidized bed and high-efficiency water-saving technologies.
The 12th five-year plan calls for construction of another 300,000 megawatts of new coal-fired
power plants (Chadbourne, 2013). Modern, decentralized power plants with cogeneration and
gas turbines or motors are expected to gradually replace inefficient, outdated coal-fired plants.
Gas turbines can be particularly efficient—up to at least 60%—when waste heat from the turbine
is recovered by a heat recovery steam generator to power a conventional steam turbine in a
combined cycle or a cogeneration configuration. China‘s turbine industry is worth $71 Billion.
The steam and gas turbines markets in China are highly dominated by three major manufacturers
namely Shanghai Electric Group, Dongfang Electric Group and Harbin Electric Group, who
account for over 86% of the total gas and steam turbine market revenues. In terms of market size,
gas turbine manufacturing enterprises achieved sales revenues of more than $6 Billion in 2010,
taking a share of more than 70% of the gross sales revenue across China. However, it is
important to note that China had no comparative advantage in this technology as on 2013. It‘s
RCA in 2013 for turbo gas turbines <5000KW, >5000KW and turbo gas turbine parts were 0.05,
0.07 and 0.12 respectively. The ad-valorem import tariffs on the other hand were as high as 15%,
3% and 5% respectively. This suggests that the Chinese government is protecting its import
competing industry especially in the segment of turbo gas turbine of less than 5000 KW. It is
also reflective of the intent of Chinese government to grow competitive in this segment by
encouraging its local manufacturers to dominate the Chinese market where demand for gas
turbines in China was speculated to grow by 8.4% annually through 2011 (Chadbourne, 2013).
Government plans to support gas turbine research and development by investing more than
US$17 billion in the coming years (SZW).
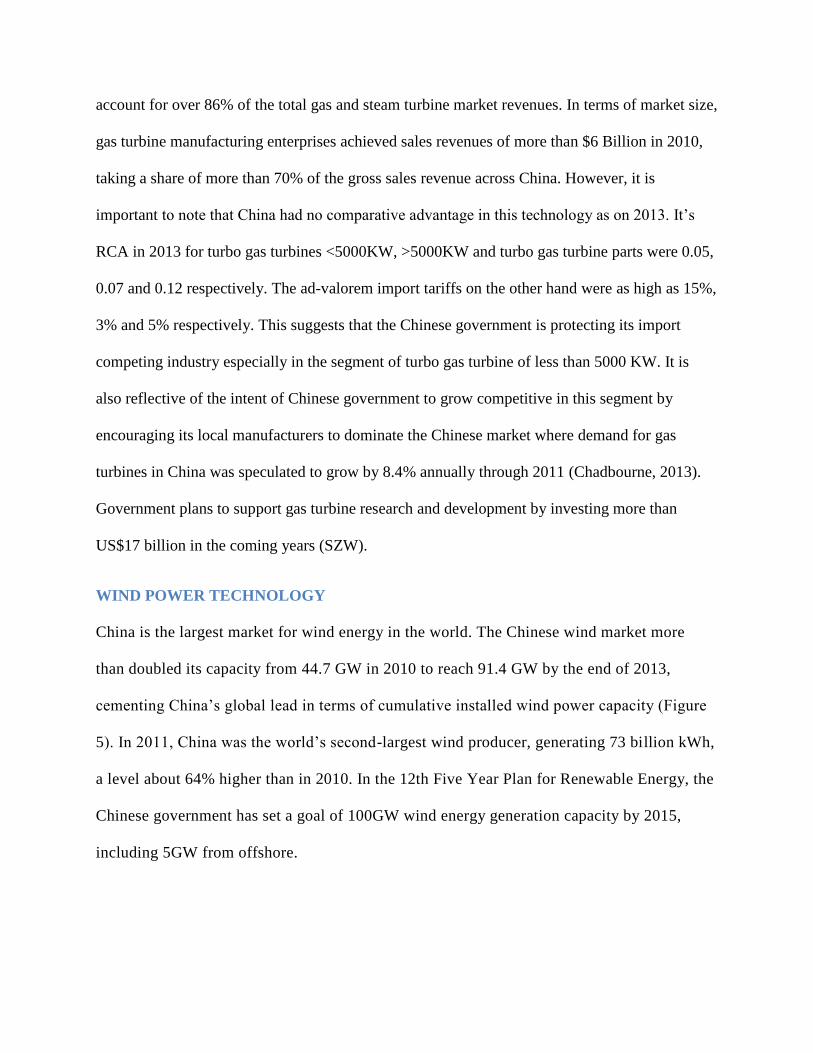
WIND POWER TECHNOLOGY
China is the largest market for wind energy in the world. The Chinese wind market more
than doubled its capacity from 44.7 GW in 2010 to reach 91.4 GW by the end of 2013,
cementing China‘s global lead in terms of cumulative installed wind power capacity (Figure
5). In 2011, China was the world‘s second-largest wind producer, generating 73 billion kWh,
a level about 64% higher than in 2010. In the 12th Five Year Plan for Renewable Energy, the
Chinese government has set a goal of 100GW wind energy generation capacity by 2015,
including 5GW from offshore.
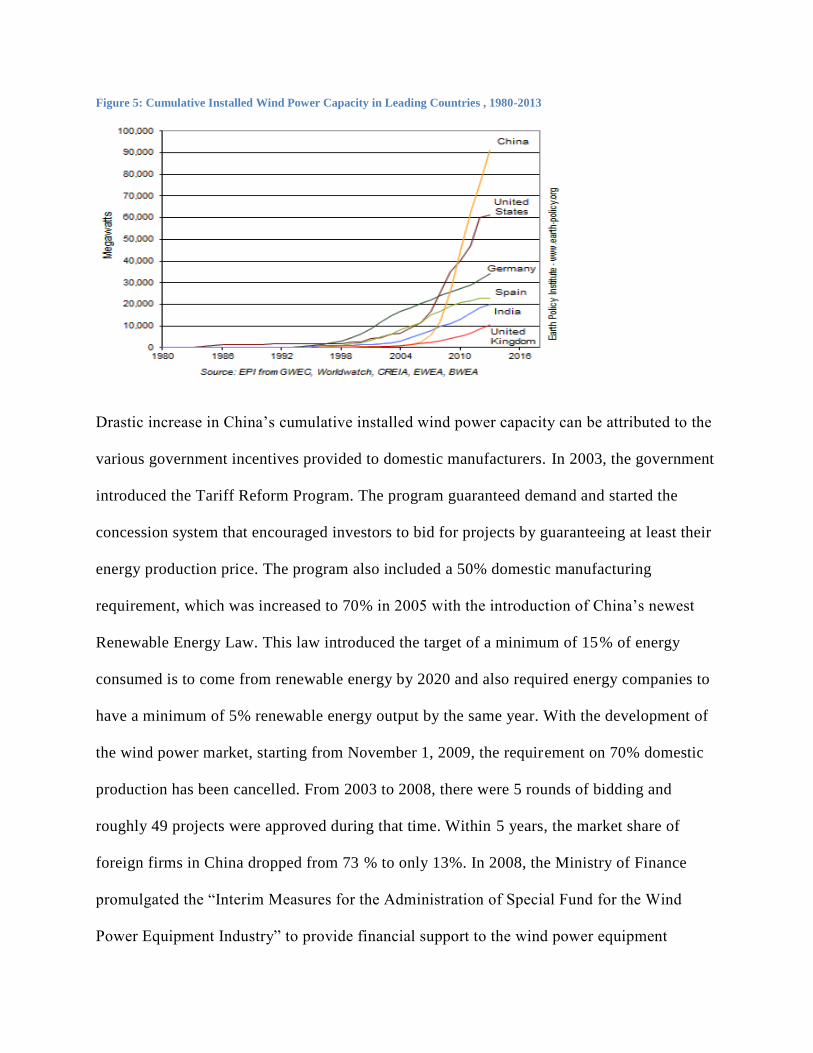
Figure 5: Cumulative Installed Wind Power Capacity in Leading Countries , 1980-2013
Drastic increase in China‘s cumulative installed wind power capacity can be attributed to the
various government incentives provided to domestic manufacturers. In 2003, the government
introduced the Tariff Reform Program. The program guaranteed demand and started the
concession system that encouraged investors to bid for projects by guaranteeing at least their
energy production price. The program also included a 50% domestic manufacturing
requirement, which was increased to 70% in 2005 with the introduction of China‘s newest
Renewable Energy Law. This law introduced the target of a minimum of 15% of energy
consumed is to come from renewable energy by 2020 and also required energy companies to
have a minimum of 5% renewable energy output by the same year. With the development of
the wind power market, starting from November 1, 2009, the requirement on 70% domestic
production has been cancelled. From 2003 to 2008, there were 5 rounds of bidding and
roughly 49 projects were approved during that time. Within 5 years, the market share of
foreign firms in China dropped from 73 % to only 13%. In 2008, the Ministry of Finance
promulgated the ―Interim Measures for the Administration of Special Fund for the Wind
Power Equipment Industry‖ to provide financial support to the wind power equipment
manufacturers to encourage them to do independent research and develop turbines and spare
parts for multi-MW wind power equipment. Wind power companies were also identified as
high-tech companies which could enjoy a 15% income tax rate (the normal tax rate is 25 %).
In 2008, Ministry of Finance and State Taxation Bureau jointly promulgated the notice to
deduct and refund 50% of the value added tax of companies which sells self-produced
electricity by wind power. Wind power generation projects are regarded as electricity
infrastructure projects, therefore, they fall under the category of ―three years‘ exemption and
subsequent three years 50% income tax deduction‖ (Holland, 2014).
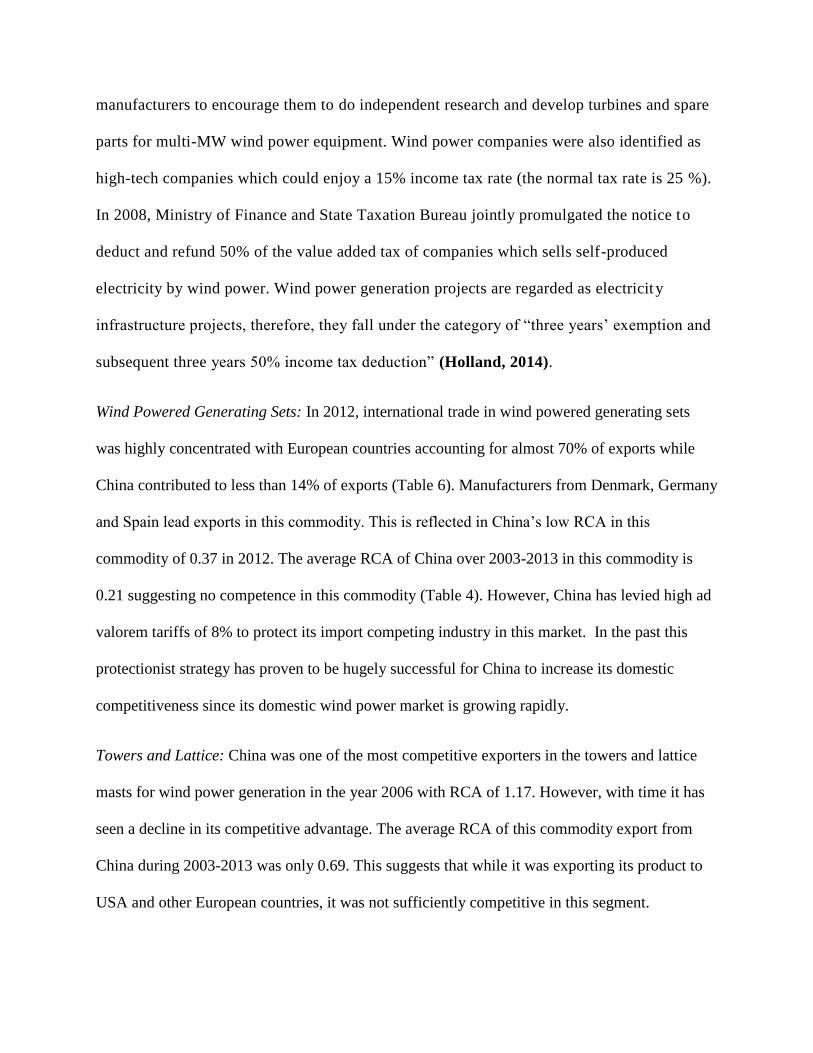
Wind Powered Generating Sets: In 2012, international trade in wind powered generating sets
was highly concentrated with European countries accounting for almost 70% of exports while
China contributed to less than 14% of exports (Table 6). Manufacturers from Denmark, Germany
and Spain lead exports in this commodity. This is reflected in China‘s low RCA in this
commodity of 0.37 in 2012. The average RCA of China over 2003-2013 in this commodity is
0.21 suggesting no competence in this commodity (Table 4). However, China has levied high ad
valorem tariffs of 8% to protect its import competing industry in this market. In the past this
protectionist strategy has proven to be hugely successful for China to increase its domestic
competitiveness since its domestic wind power market is growing rapidly.
Towers and Lattice: China was one of the most competitive exporters in the towers and lattice
masts for wind power generation in the year 2006 with RCA of 1.17. However, with time it has
seen a decline in its competitive advantage. The average RCA of this commodity export from
China during 2003-2013 was only 0.69. This suggests that while it was exporting its product to
USA and other European countries, it was not sufficiently competitive in this segment.
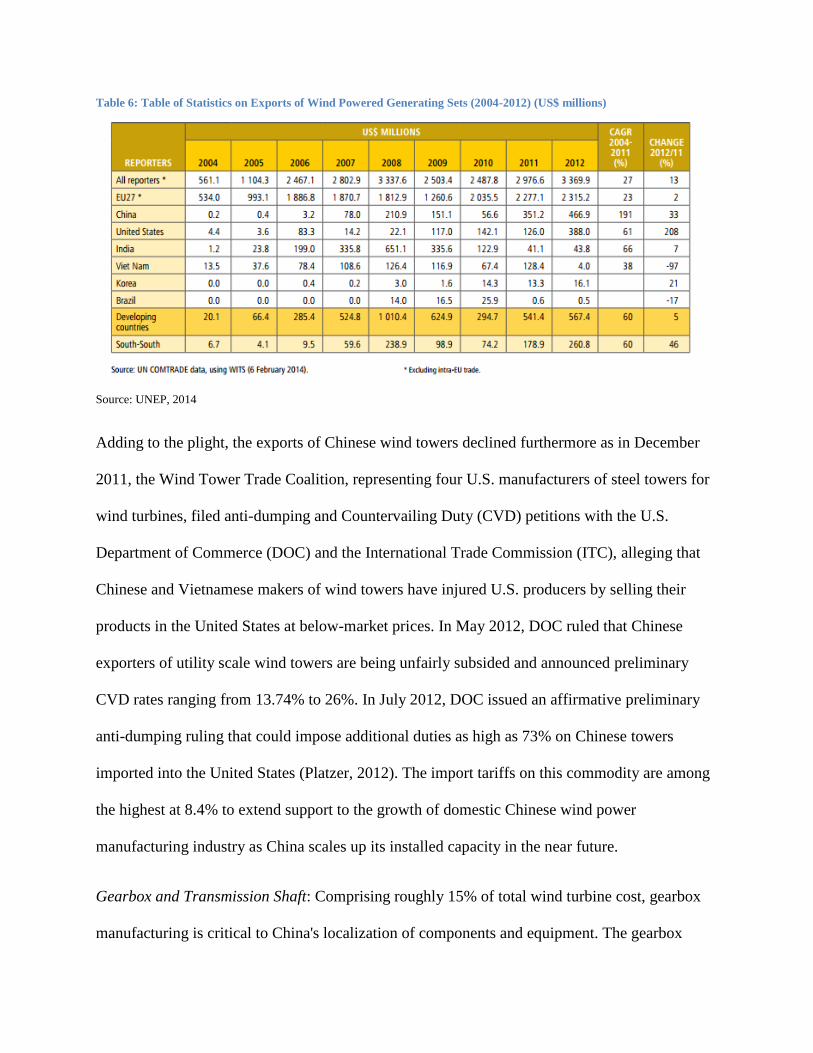
Table 6: Table of Statistics on Exports of Wind Powered Generating Sets (2004-2012) (US$ millions)
Source: UNEP, 2014
Adding to the plight, the exports of Chinese wind towers declined furthermore as in December
2011, the Wind Tower Trade Coalition, representing four U.S. manufacturers of steel towers for
wind turbines, filed anti-dumping and Countervailing Duty (CVD) petitions with the U.S.
Department of Commerce (DOC) and the International Trade Commission (ITC), alleging that
Chinese and Vietnamese makers of wind towers have injured U.S. producers by selling their
products in the United States at below-market prices. In May 2012, DOC ruled that Chinese
exporters of utility scale wind towers are being unfairly subsided and announced preliminary
CVD rates ranging from 13.74% to 26%. In July 2012, DOC issued an affirmative preliminary
anti-dumping ruling that could impose additional duties as high as 73% on Chinese towers
imported into the United States (Platzer, 2012). The import tariffs on this commodity are among
the highest at 8.4% to extend support to the growth of domestic Chinese wind power
manufacturing industry as China scales up its installed capacity in the near future.
Gearbox and Transmission Shaft: Comprising roughly 15% of total wind turbine cost, gearbox
manufacturing is critical to China's localization of components and equipment. The gearbox
converts between slowly rotating, high torque power from the wind turbine rotor and high speed,
low torque power used for the generator (Hodum, 2008). China's largest manufacturer of
gearboxes is China High Speed Transmission, which in 2007 captured nearly 80% of domestic
market share. However, China is not export competitive in production of both the gearbox and
transmission shaft and has an average RCA of 0.46 and 0.60 from 2003-2013 (Table 2). At the
same time its ad-valorem import tariffs are as high as 8%. This is because China seeks to protect
this infant industry segment and harbor greater financial and technical strength of domestic
manufacturers. This strategy will pay huge dividends in supporting and expanding its wind
energy capacity in the near future as these commodities are seeing a gradual increase in export
competitiveness over time.
SOLAR ENERGY TECHNOLOGY
Batteries: China has become one of the world‘s largest exporters of lead-acid batteries; the
export volume and export amount are increasing at the annual rates of 40% and 35%
respectively. It has an average RCA of 2.9. While this commodity is extremely competitive, it
has seen a relative decrease in its RCA from 2.84 in 2003 to 2.29 in 2013. The relative decrease
in RCA (while its competitiveness is still very high) is primarily due to non-tariff barriers
imposed on Chinese exports of Lead-acid battery by European Union, the United States and
other developed countries in 2012-13, owing to high mercury/lead content in these batteries
which is regarded as hazardous to the environment. Countries have prohibited the imports of this
good under the WTO‘s Agreement on Sanitary and Phytosanitary measures. Further, technical
barriers to trade such as the CE marking requirement (considered as a certification requirement)
were also been imposed on imported Chinese batteries by the European Union in the past (WITS
data). To counter these effects, in May 2012, the Chinese Ministry of Industry and Information
Technology (MIIT) officially announced the Lead-acid Battery Industry Access Conditions,
which required reorganization and expansion of the industry mandating that capacities of the
new plants be no less than 500,000 kVA, that of existing plants be no less than 200,000 kVA,
while putting forward clear requirements on the production technology and equipment to
improve the industry access threshold. As a result, in 2012, a large number of lead-acid battery
companies that didn't meet national environmental requirements were eliminated, while qualified
enterprises successively increased production capacity and output to seize vacated market share.
In the same year, Chinese lead-acid battery output was 175 million kVA, an increase of 23%
over the same period in 2011. Following the ever-growing market demand for electric bicycle
batteries, automotive starter batteries, electric vehicle batteries and energy storage batteries, lead-
acid battery output in 2015 is expected to reach 240 million kVA (China Lead-acid Battery
Industry Report, 2012-2015) and China is poised to maintain its comparative advantage. China
maintains high import tariffs of 10% on this commodity (Table 4), which signals its protective
approach towards its home grown industries despite high comparative advantage in the domain.
Solar PV: China‘s share in world exports of Solar PV increased from a mere 10% in 2003 to a
drastic 37% in 2013 (Figure 6), while its RCA also increased from 1.12 to 3.29 over the period,
which signals China‘s strong dominance in the industry (Table 2). China is presently a leader in
the industry. However, a deeper look at the analysis reveals that despite such high comparative
advantage, between 2012 and 2013, China saw a relative decline of 0.1 in its RCA (Table 3) and
during the same time China maintained a high tariff of 8% on the imports of Solar PV.
Interestingly since 2008, through government subsidies, the manufacturing capacity of China‘s
solar-panel industry grew tenfold, leading to a vast global oversupply. A surge in exports of
Chinese panels depressed world prices by 75%. In 2012, China‘s top six solar companies had
debt ratios of over 80%. The Harvard Business Review research (Haley, 2013) demonstrated that
without subsidies, these companies would be bankrupt. This was a case for U.S. manufacturers to
invoke the anti-dumping and anti-subsidy trade barriers to Chinese imports. SolarWorld, a U.S.
producer, filed its first anti-dumping and countervailing duty petition on Oct. 19, 2011, against
$4 billion in solar cells imported from China. This petition resulted in anti-dumping and
countervailing duty orders in December 2012. During the previous few years, China's PV export
demand had plunged on weak economic growth in Europe and the U.S., lower subsidies for
exports to major European and U.S. markets as well as protectionist policies. However, the PV
industry took a favorable turn in 2013 with China shifting its export focus to emerging markets.
China's exports of solar cells and modules to Asia surged 124 % year on year to US $5.5 billion
in 2013, accounting for 44.8 % of the total, while those to Europe fell 62 % to US $3.72 billion.
During that same year, the country exported US $570 million of solar cells and modules to
Africa, up 387 % from the previous year. (Renewable Energy World, 2014). In December 2014
United States Department of Commerce, imposed antidumping duties of 26.71 % to 78.42 % on
imports of most solar panels made in China, and rates of 11.45 % to 27.55 % on imports of solar
cells, a key component, that are made in Taiwan. In addition, the department announced anti-
subsidy duties of 27.64 % to 49.79 % for Chinese modules. The decision was intended in part to
close a loophole that had allowed Chinese manufacturers to avoid tariffs imposed in an earlier
ruling by using cells made in Taiwan (New York Times, 2014). However, as China ramps up its
PV cell production to meet its solar targets and expands into newer markets in Asia and Africa,
global prices are falling, leading to a shakeout of uncompetitive solar panel manufacturers.
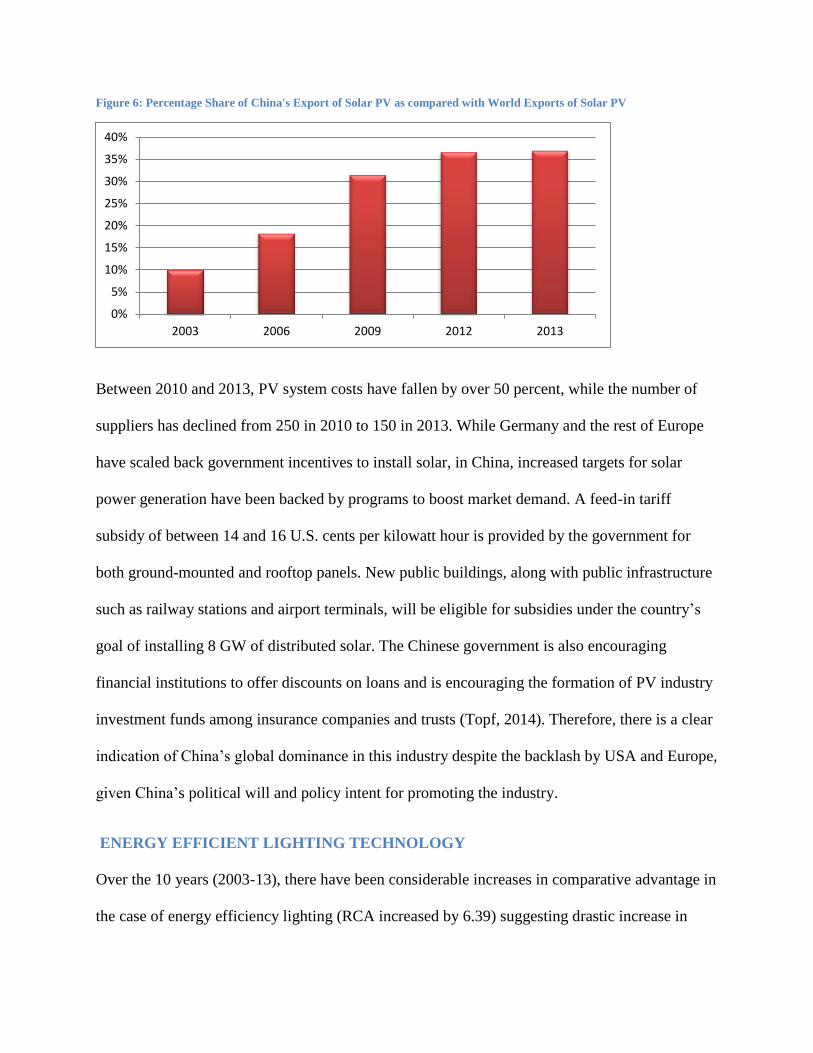
Figure 6: Percentage Share of China's Export of Solar PV as compared with World Exports of Solar PV
Between 2010 and 2013, PV system costs have fallen by over 50 percent, while the number of
suppliers has declined from 250 in 2010 to 150 in 2013. While Germany and the rest of Europe
have scaled back government incentives to install solar, in China, increased targets for solar
power generation have been backed by programs to boost market demand. A feed-in tariff
subsidy of between 14 and 16 U.S. cents per kilowatt hour is provided by the government for
both ground-mounted and rooftop panels. New public buildings, along with public infrastructure
such as railway stations and airport terminals, will be eligible for subsidies under the country‘s
goal of installing 8 GW of distributed solar. The Chinese government is also encouraging
financial institutions to offer discounts on loans and is encouraging the formation of PV industry
investment funds among insurance companies and trusts (Topf, 2014). Therefore, there is a clear
indication of China‘s global dominance in this industry despite the backlash by USA and Europe,
given China‘s political will and policy intent for promoting the industry.
ENERGY EFFICIENT LIGHTING TECHNOLOGY
Over the 10 years (2003-13), there have been considerable increases in comparative advantage in
the case of energy efficiency lighting (RCA increased by 6.39) suggesting drastic increase in
0%
5%
10%
15%
20%
25%
30%
35%
40%
2003 2006 2009 2012 2013
market share in this product (Table 3). The average RCA for the commodity was 8.63, while its
RCA in 2013 was 11.47. This result comes as no surprise as Chinese manufacturers are strongest
in the low-wattage LEDs. Chinese companies capture about 30 percent of the global market.
That gives them the biggest share ahead of Japan, South Korea, Germany, Taiwan and the United
States, which share the rest of the market in fairly even proportions. (BRADSHER, 2014) The
tariff in the segment is also nil (Table 4), suggesting China‘s confidence in its comparative
advantage as well as trade openness in this segment.
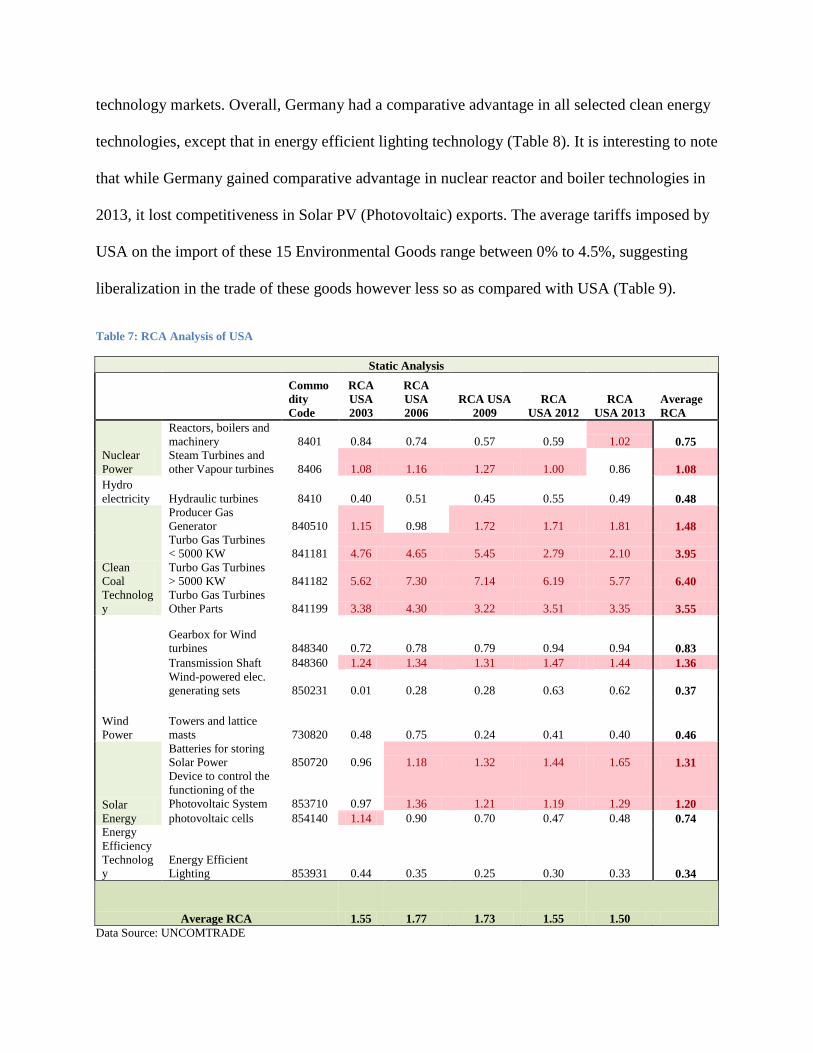
B. RCA ANALYSIS OF USA’S ENVIRONMENTAL GOODS
USA is one of the leading exporters of Environmental Goods in the world, ranking third only to
China and Germany (Figure 3). By analyzing the RCA of the 15 environmental goods, we
conclude that overall, USA is most export competitive in clean energy technologies such as clean
coal, nuclear power and solar energy technology (Table 7). However, it is not as export
competitive in clean energy technologies such as hydropower, wind power and energy efficient
lighting. The average ad-valorem tariffs imposed by USA on the import of these 15
Environmental Goods range between 0% to 3.4%, suggesting significant liberalization in the
trade of these goods (Table 9). USA‘s dominance in exports of these clean energy technologies is
being challenged aggressively by both Germany and China. It is interesting to note that between
2007 and 2010, the U.S. trade deficit in environmental goods with China increased 170 percent
(Wyden, 2010).
C. RCA ANALYSIS OF GERMANY’S ENVIRONMENTAL GOODS
Germany is the world leader in exports of environmental goods (Figure 3) as on 2013.
Germany‘s leadership is a result of the sharp contraction in the role of the United States.
However, China is not far behind Germany in the quest of leadership of global clean energy
technology markets. Overall, Germany had a comparative advantage in all selected clean energy
technologies, except that in energy efficient lighting technology (Table 8). It is interesting to note
that while Germany gained comparative advantage in nuclear reactor and boiler technologies in
2013, it lost competitiveness in Solar PV (Photovoltaic) exports. The average tariffs imposed by
USA on the import of these 15 Environmental Goods range between 0% to 4.5%, suggesting
liberalization in the trade of these goods however less so as compared with USA (Table 9).
Table 7: RCA Analysis of USA
Static Analysis
Commo
dity
Code
RCA
USA
2003
RCA
USA
2006
RCA USA
2009
RCA
USA 2012
RCA
USA 2013
Average
RCA
Nuclear
Power
Reactors, boilers and
machinery 8401 0.84 0.74 0.57 0.59 1.02 0.75
Steam Turbines and
other Vapour turbines 8406 1.08 1.16 1.27 1.00 0.86 1.08
Hydro
electricity Hydraulic turbines 8410 0.40 0.51 0.45 0.55 0.49 0.48
Clean
Coal
Technolog
y
Producer Gas
Generator 840510 1.15 0.98 1.72 1.71 1.81 1.48
Turbo Gas Turbines
< 5000 KW 841181 4.76 4.65 5.45 2.79 2.10 3.95
Turbo Gas Turbines
> 5000 KW 841182 5.62 7.30 7.14 6.19 5.77 6.40
Turbo Gas Turbines
Other Parts 841199 3.38 4.30 3.22 3.51 3.35 3.55
Wind
Power
Gearbox for Wind
turbines 848340 0.72 0.78 0.79 0.94 0.94 0.83
Transmission Shaft 848360 1.24 1.34 1.31 1.47 1.44 1.36
Wind-powered elec.
generating sets 850231 0.01 0.28 0.28 0.63 0.62 0.37
Towers and lattice
masts 730820 0.48 0.75 0.24 0.41 0.40 0.46
Solar
Energy
Batteries for storing
Solar Power 850720 0.96 1.18 1.32 1.44 1.65 1.31
Device to control the
functioning of the
Photovoltaic System 853710 0.97 1.36 1.21 1.19 1.29 1.20
photovoltaic cells 854140 1.14 0.90 0.70 0.47 0.48 0.74
Energy
Efficiency
Technolog
y
Energy Efficient
Lighting 853931 0.44 0.35 0.25 0.30 0.33 0.34
Average RCA 1.55 1.77 1.73 1.55 1.50
Data Source: UNCOMTRADE
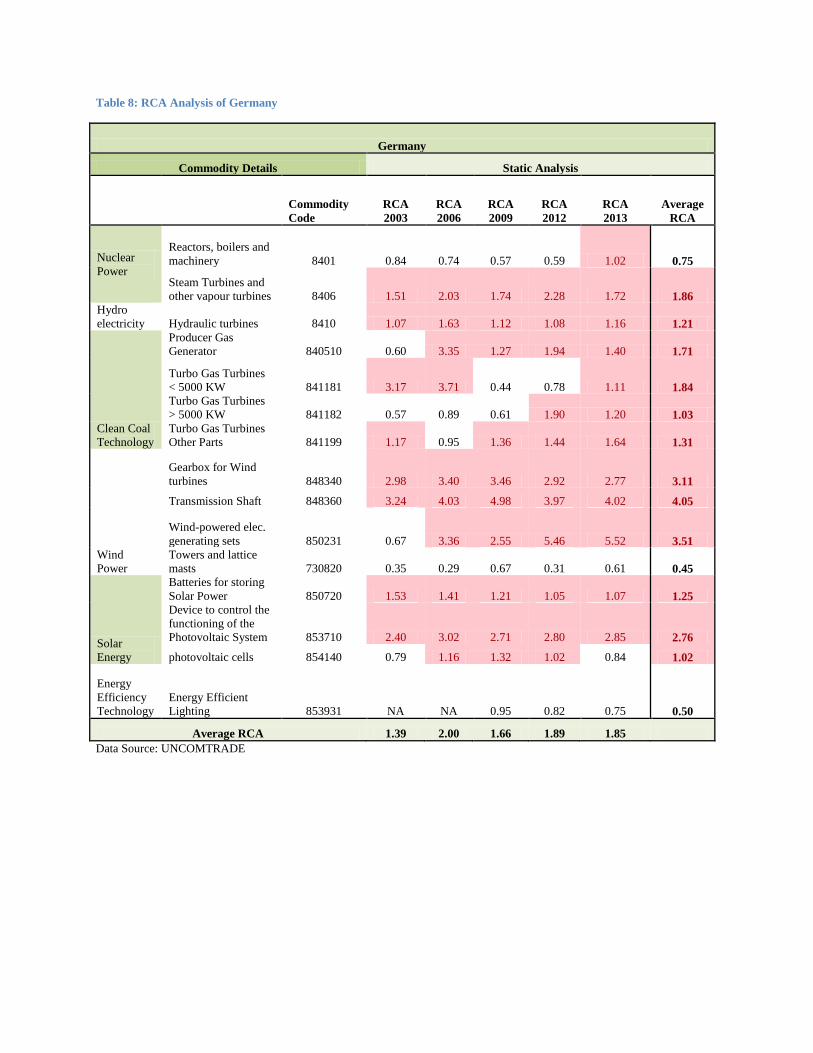
Table 8: RCA Analysis of Germany
Germany
Commodity Details Static Analysis
Commodity
Code
RCA
2003
RCA
2006
RCA
2009
RCA
2012
RCA
2013
Average
RCA
Nuclear
Power
Reactors, boilers and
machinery 8401 0.84 0.74 0.57 0.59 1.02 0.75
Steam Turbines and
other vapour turbines 8406 1.51 2.03 1.74 2.28 1.72 1.86
Hydro
electricity Hydraulic turbines 8410 1.07 1.63 1.12 1.08 1.16 1.21
Clean Coal
Technology
Producer Gas
Generator 840510 0.60 3.35 1.27 1.94 1.40 1.71
Turbo Gas Turbines
< 5000 KW 841181 3.17 3.71 0.44 0.78 1.11 1.84
Turbo Gas Turbines
> 5000 KW 841182 0.57 0.89 0.61 1.90 1.20 1.03
Turbo Gas Turbines
Other Parts 841199 1.17 0.95 1.36 1.44 1.64 1.31
Wind
Power
Gearbox for Wind
turbines 848340 2.98 3.40 3.46 2.92 2.77 3.11
Transmission Shaft 848360 3.24 4.03 4.98 3.97 4.02 4.05
Wind-powered elec.
generating sets 850231 0.67 3.36 2.55 5.46 5.52 3.51
Towers and lattice
masts 730820 0.35 0.29 0.67 0.31 0.61 0.45
Solar
Energy
Batteries for storing
Solar Power 850720 1.53 1.41 1.21 1.05 1.07 1.25
Device to control the
functioning of the
Photovoltaic System 853710 2.40 3.02 2.71 2.80 2.85 2.76
photovoltaic cells 854140 0.79 1.16 1.32 1.02 0.84 1.02
Energy
Efficiency
Technology
Energy Efficient
Lighting 853931 NA NA 0.95 0.82 0.75 0.50
Average RCA 1.39 2.00 1.66 1.89 1.85
Data Source: UNCOMTRADE
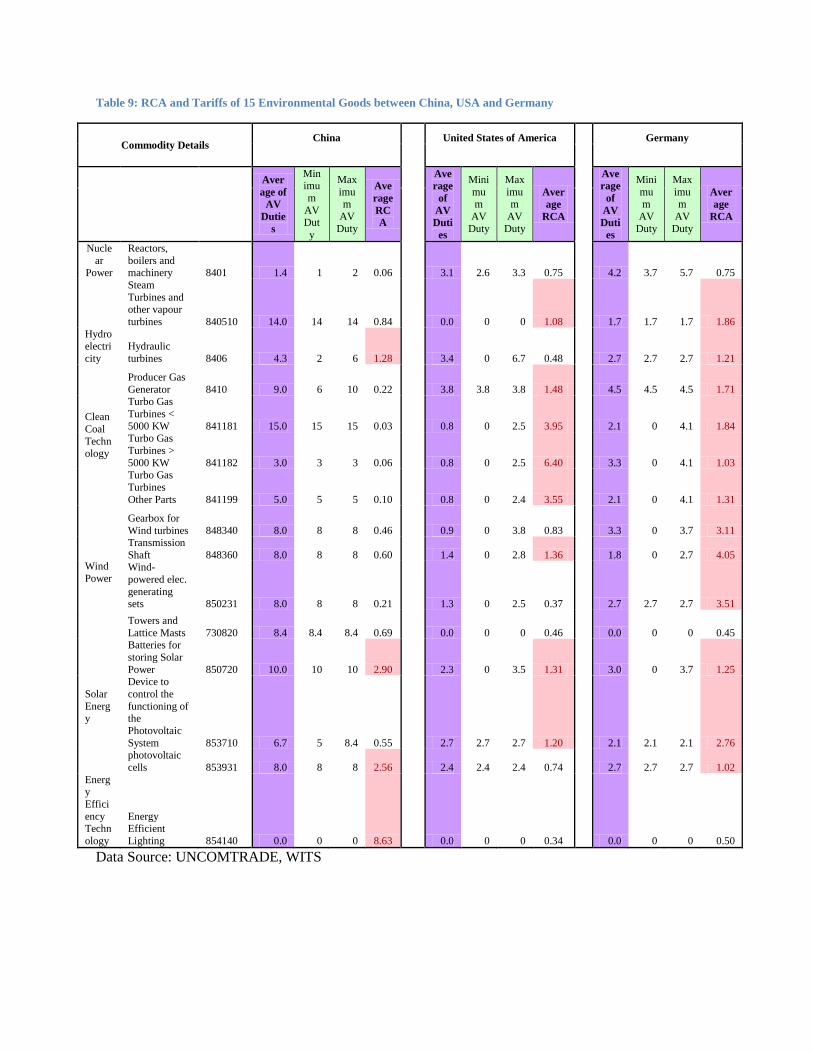
Table 9: RCA and Tariffs of 15 Environmental Goods between China, USA and Germany
Commodity Details China United States of America Germany
Aver
age of
AV
Dutie
s
Minimu
m
AV Dut
y
Max
imum
AV
Duty
Ave
rage
RC
A
Ave
rage
of
AV
Duti
es
Mini
mum
AV
Duty
Max
imum
AV
Duty
Aver
age
RCA
Ave
rage
of
AV
Duti
es
Mini
mum
AV
Duty
Max
imum
AV
Duty
Aver
age
RCA
Nucle
ar Power
Reactors,
boilers and machinery 8401 1.4 1 2 0.06 3.1 2.6 3.3 0.75 4.2 3.7 5.7 0.75
Steam
Turbines and other vapour
turbines 840510 14.0 14 14 0.84 0.0 0 0 1.08 1.7 1.7 1.7 1.86
Hydro electri
city
Hydraulic
turbines 8406 4.3 2 6 1.28 3.4 0 6.7 0.48 2.7 2.7 2.7 1.21
Clean
Coal
Technology
Producer Gas
Generator 8410 9.0 6 10 0.22 3.8 3.8 3.8 1.48 4.5 4.5 4.5 1.71 Turbo Gas
Turbines <
5000 KW 841181 15.0 15 15 0.03 0.8 0 2.5 3.95 2.1 0 4.1 1.84 Turbo Gas
Turbines >
5000 KW 841182 3.0 3 3 0.06 0.8 0 2.5 6.40 3.3 0 4.1 1.03 Turbo Gas
Turbines
Other Parts 841199 5.0 5 5 0.10 0.8 0 2.4 3.55 2.1 0 4.1 1.31
Wind
Power
Gearbox for
Wind turbines 848340 8.0 8 8 0.46 0.9 0 3.8 0.83 3.3 0 3.7 3.11 Transmission
Shaft 848360 8.0 8 8 0.60 1.4 0 2.8 1.36 1.8 0 2.7 4.05 Wind-
powered elec.
generating sets 850231 8.0 8 8 0.21 1.3 0 2.5 0.37 2.7 2.7 2.7 3.51
Towers and
Lattice Masts 730820 8.4 8.4 8.4 0.69 0.0 0 0 0.46 0.0 0 0 0.45
Solar
Energy
Batteries for
storing Solar
Power 850720 10.0 10 10 2.90 2.3 0 3.5 1.31 3.0 0 3.7 1.25 Device to
control the
functioning of the
Photovoltaic
System 853710 6.7 5 8.4 0.55 2.7 2.7 2.7 1.20 2.1 2.1 2.1 2.76 photovoltaic
cells 853931 8.0 8 8 2.56 2.4 2.4 2.4 0.74 2.7 2.7 2.7 1.02
Energy
Effici
ency Techn
ology
Energy Efficient
Lighting 854140 0.0 0 0 8.63 0.0 0 0 0.34 0.0 0 0 0.50
Data Source: UNCOMTRADE, WITS
D. NON TRADE BARRIERS IN ENVIRONMENTAL GOODS TRADE
There are various non trade barriers and measures employed by governments across the globe to
protect their import competing industries from foreign competition. Some of the common
barriers to trade in environmental goods are business licensing and registration, lengthy
procedures related to valuation of goods at customs, local content requirements, restrictive
technical standards; disproportionately onerous labeling, packaging and documentation
requirements; non-transparent government procurement and contracting procedures; restrictions
on professional services, investment, and ownership; intellectual property protection, preferential
procurement, legal and regulatory framework issues, lack of financing, lack of adequate energy
infrastructure, and incompatible standards. Annexure II and III provide a detailed description of
the legal definitions of non-trade barriers and non-trade measures constricting trade.
IV. POLICY IMPLICATIONS AND CONCLUSION
Over the last decade, China has grown dramatically to become a leading exporter in global
environmental goods markets owing to enhanced export competitiveness, evolution of its
environmental legislation and policy and also due to extensive government support in the form of
subsidy and protection. However, a recent study by Usha C.V. Haley and George T. Haley
published in the Harvard Business Review proves that the trade competitiveness of Chinese
exports stems from extensive government support in the form of subsidies. The research argues
that in industries such as— solar, steel, glass, paper, and auto parts, labor was between 2% and
7% of production costs, while imported raw materials and energy accounted for most costs. The
production mostly came from small companies that possessed no scale economies. Yet, Chinese
products routinely sold for 25% to 30% less than those from the U.S. or European Union.
0.00
0.50
1.00
1.50
2.00
2.50
2003 2006 2009 2012 2013
China USA Germany
0.0%
5.0%
10.0%
15.0%
20.0%
2003 2006 2009 2012 2013
China USA Germany
Subsidies, they claim, took the form of free or low-cost loans; artificially cheap raw materials,
components, energy, and land; and support for R&D and technology acquisitions (Haley, 2013).
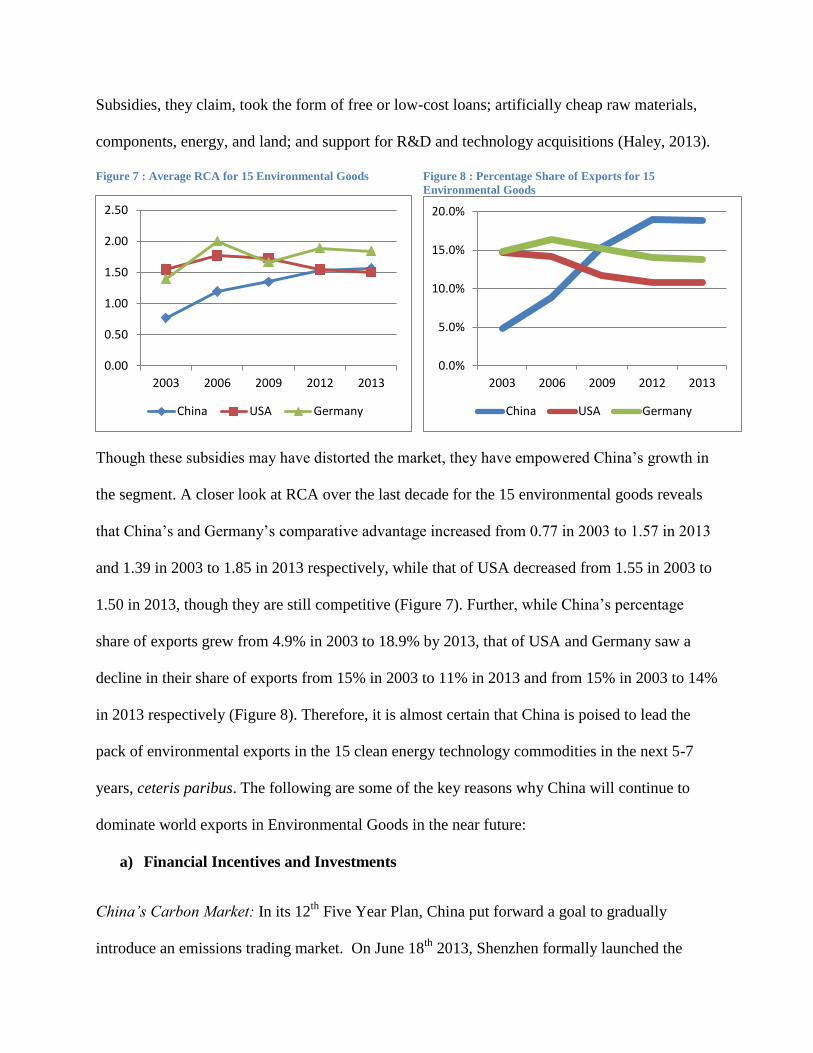
Figure 7 : Average RCA for 15 Environmental Goods Figure 8 : Percentage Share of Exports for 15
Environmental Goods
Though these subsidies may have distorted the market, they have empowered China‘s growth in
the segment. A closer look at RCA over the last decade for the 15 environmental goods reveals
that China‘s and Germany‘s comparative advantage increased from 0.77 in 2003 to 1.57 in 2013
and 1.39 in 2003 to 1.85 in 2013 respectively, while that of USA decreased from 1.55 in 2003 to
1.50 in 2013, though they are still competitive (Figure 7). Further, while China‘s percentage
share of exports grew from 4.9% in 2003 to 18.9% by 2013, that of USA and Germany saw a
decline in their share of exports from 15% in 2003 to 11% in 2013 and from 15% in 2003 to 14%
in 2013 respectively (Figure 8). Therefore, it is almost certain that China is poised to lead the
pack of environmental exports in the 15 clean energy technology commodities in the next 5-7
years, ceteris paribus. The following are some of the key reasons why China will continue to
dominate world exports in Environmental Goods in the near future:
a) Financial Incentives and Investments
China’s Carbon Market: In its 12th
Five Year Plan, China put forward a goal to gradually
introduce an emissions trading market. On June 18th
2013, Shenzhen formally launched the
emission trading scheme, followed by Shanghai, Beijing, Guangdong and Tianjin in the next 6
months. The system was based on the cap and trade model with provisions to accept offset
carbon credits generated from the CCER (China Certified Emission Reduction) projects. In 2013,
the approximate scale of China‘s carbon market was 1.08 billion tons (Global Renewable Energy
report , 2014). Benefits of having a carbon market will be two pronged for China - it will lead to
lower emissions as well as provide a greater incentive to corporations to invest in clean energy
technology.
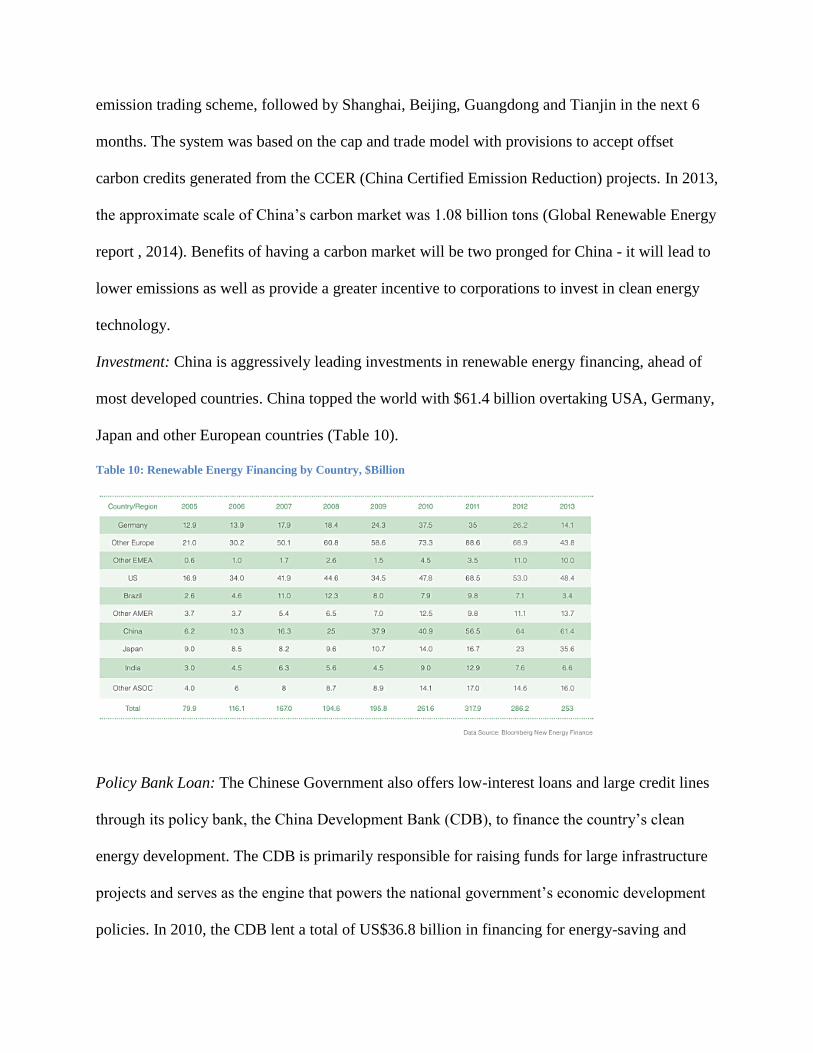
Investment: China is aggressively leading investments in renewable energy financing, ahead of
most developed countries. China topped the world with $61.4 billion overtaking USA, Germany,
Japan and other European countries (Table 10).
Table 10: Renewable Energy Financing by Country, $Billion
Policy Bank Loan: The Chinese Government also offers low-interest loans and large credit lines
through its policy bank, the China Development Bank (CDB), to finance the country‘s clean
energy development. The CDB is primarily responsible for raising funds for large infrastructure
projects and serves as the engine that powers the national government‘s economic development
policies. In 2010, the CDB lent a total of US$36.8 billion in financing for energy-saving and
pollution control projects and provided China‘s major solar panel manufacturers with a
combined total of US$32.2 billion in loans to assist them in increasing production capacity and
expanding overseas operations. This expansion could double global solar cell production
capacity and enable these Chinese companies to gain larger shares in important markets (Price,
Wang, Li, & Zeng, 2012).
b) Policy Incentives and Backing
Renewable Energy Law : This law introduced the target of a minimum of 15% of energy
consumed is to come from renewable energy by 2020 and also required energy companies to
have a minimum of 5% renewable energy output by the same year.
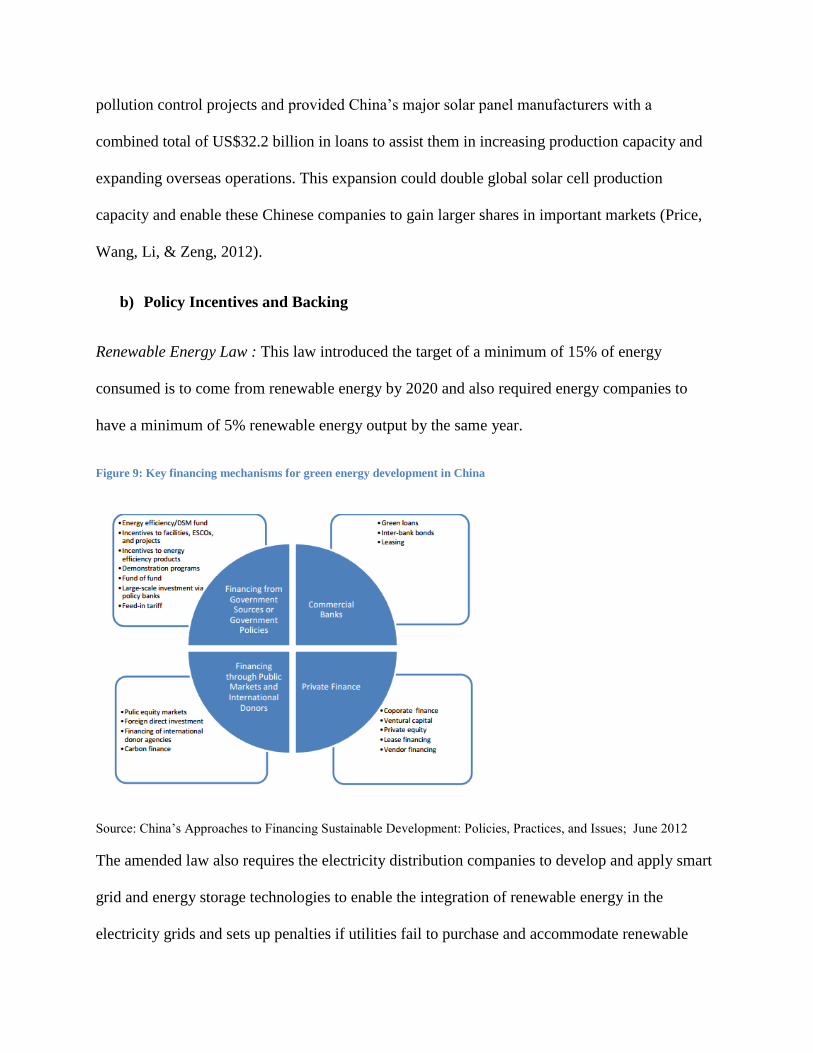
Figure 9: Key financing mechanisms for green energy development in China
Source: China‘s Approaches to Financing Sustainable Development: Policies, Practices, and Issues; June 2012
The amended law also requires the electricity distribution companies to develop and apply smart
grid and energy storage technologies to enable the integration of renewable energy in the
electricity grids and sets up penalties if utilities fail to purchase and accommodate renewable
energy. The law authorizes financial institutions to offer concessional loans with subsidized
interest rates to renewable energy projects.
Renewable Energy Development Fund: This fund includes both direct subsidies and interest
payment to support renewable energy. The subsidies include $214 for producing each ton of fuel
ethanol, $3.17 per watt for building integrated photovoltaic systems, and a fund covering a
maximum of 70 % of the construction cost of an independent photovoltaic system. As of
September 2011, the Chinese central government has provided a total subsidy of $1.6 billion
supporting photovoltaic applications. In addition, the fund also provides interest payment support
that discounts the interest rate for a renewable energy project by up to 3% for one to three years.
Special Fund for Emerging Industries : To enable the country become a leader in vital emerging
market sectors such as energy efficiency, information technology, biotechnology, high-end
equipment manufacturing, new energy, advanced materials, and new energy vehicles, the
Chinese government has created a special fund and allocated $634 million supporting the
development of these emerging sectors in 2011. The Government‘s allocation can be used as
venture capital investment, subsidies for accelerating commercialization, and incentives for
spurring consumption in these strategic emerging sectors. (Price, Wang, Li, & Zeng, 2012)
“Green Credit” policy : Issued in July 2007, this policy requires banks to cease lending to
companies who are listed in the MEP (Ministry of Environment Protection) blacklist for
environmental violations and to projects that are out of compliance with relevant regulations.
“Green Security” policy: Adopted in February 2008 – this policy calls for strengthening the
implementation of environmental performance verification for public-listed companies in
polluting industries. It also requires the security regulatory agency to reject or suspend Initial
Public Offering (IPO) or refinancing requests from companies that failed to pass a government
environmental evaluation. In addition, the policy mandates listed companies to disclose their
environmental information to shareholders so that investors can avoid potential financial loss
resulting from possible violations.
“Green Insurance” policy – also issued in February 2008 – calls for the use of environmental
liability insurance as an effective leverage to prompt enterprises to take measures to minimize
environmental risks.
Fund of Funds: This fund will invests the public fund to form new venture capital funds or
increase the equity of existing venture capital funds to target start-up companies who pursue
innovation in emerging strategic industries and high-tech of transforming traditional industries
c) Tariff Support
China has maintained high average tariffs with a range of 0%-15% on most clean energy
commodities to support the domestic producers and protect them from international import
competition.
d) Trade Shift to Developing Countries
As developed country markets are getting both saturated and protectionist of Chinese imports,
China is gradually shifting its trade focus to South –South trade especially markets in Africa.
According to WTO, trade between China and Africa will likely be upwards of USD 200 billion
in 2012, up 25% year on year. If this trend continues, reports are that Africa could surpass the
EU and the US to become China‘s largest trade partner in three to five years (Lamy, 2012). This
signals China‘s intent of developing new world markets for its products.
e) Domestic Market
As China continues to grow its installed capacity in renewable energy domestically and as the
market consolidates, large clean energy technology manufacturers are likely to never run out of
business and will continue to enjoy a large market share within the country, owing to preferential
government policies and economies of scale.
Conclusion
China sees its transition to a clean energy economy as an imperative for its sustainable growth,
energy security and as a strategic opportunity to become a leader in this vital emerging market
sector with higher premiums. It has undisputed comparative advantage in certain clean energy
technologies like energy efficient lighting, Solar PV and batteries, hydraulic motors and steam
engine technology. However, it is still developing competence under a protected environment in
wind, clean coal and nuclear energy technology. As WTO strengthens trade liberalization efforts
in environmental goods, China will benefit a great deal from a larger export market for products
in solar, hydro power and energy efficient lighting in developing countries. However, lowering
its high tariffs and other non-trade barriers in products where it does not have comparative
advantage will hurt China‘s domestic manufacturers. Therefore in order to reach scale in this
high technology space of environmental goods while it strategizes liberalization, China must
continue to develop its domestic market, invest in research and development , provide financial
and market incentives and strengthen its trade ties with other developing countries. While
Germany leads most of the clean energy technology exports currently, with USA not far behind,
China, backed with a strong policy framework, has an unprecedented opportunity to establish its
leadership in this sector in the near future.
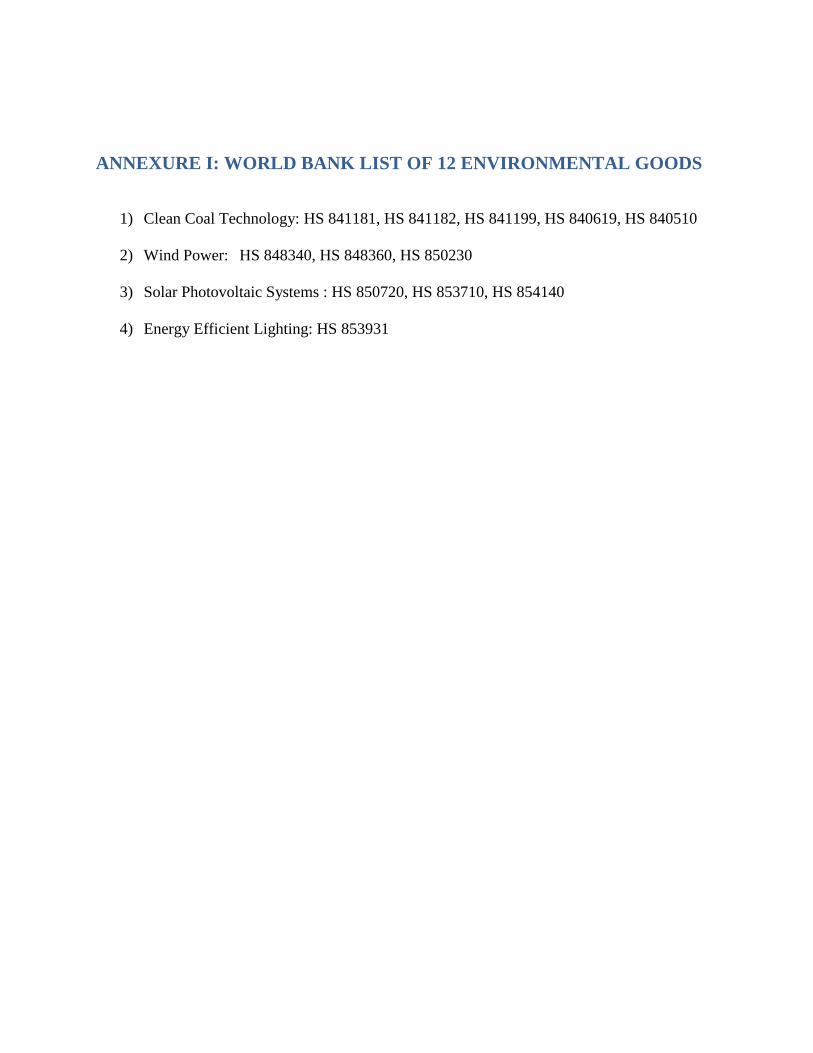
ANNEXURE I: WORLD BANK LIST OF 12 ENVIRONMENTAL GOODS
1) Clean Coal Technology: HS 841181, HS 841182, HS 841199, HS 840619, HS 840510
2) Wind Power: HS 848340, HS 848360, HS 850230
3) Solar Photovoltaic Systems : HS 850720, HS 853710, HS 854140
4) Energy Efficient Lighting: HS 853931
ANNEXURE II. NON TRADE MEASURES
The Agreement on the Application of Sanitary and Phytosanitary Measures (SPS
Agreement) provides the basic framework within which States set their standards for human,
animal, and plant health. These measures are steps to reduce health risks arising out of imported
goods. However, such measures can also constitute an effective means of protectionism –
placing excessive restrictions on imports disadvantages them in the domestic market, affecting a
protectionist regime for domestic goods. However, Article 10 contains limited exemptions for
the special needs of developing and least-developed countries by allowing for longer time frames
for compliance in cases of phased introduction of new sanitary and phytosanitary measures to
preserve their opportunities for export. In addition, article 10(3) also allows for the grant of
specified time limited exceptions, in whole or in part, from obligations under the agreement upon
request.
The Agreement on Technical Barriers to Trade : The Agreement on Technical Barriers to
Trade (TBT Agreement) governs technical regulations and standards. The Agreement defines a
technical regulation as a ―Document which lays down product characteristics or their related
processes and production methods, including the applicable administrative provisions, with
which compliance is mandatory.‖ Thus, the host government requires mandatory compliance
with technical regulations, but not with technical standards. Both regulations and standards apply
to ―terminology, symbols, packaging, marking or labelling requirements. Article 2 proceeds to
mention some legitimate grounds for technical barriers, such as national security and the
prevention of deceptive trade practices.
The Protection of Life and National Security: The Agreement on Technical Barriers to Trade
(TBT), recognizes the right of States party to the agreement to take certain trade-related
measures which would, in effect, constitute NTBs112. These measures are justified by the
State‘s responsibility to ensure: [The] quality of its exports… the protection of human, animal or
plant life or health, of the environment… [and] the prevention of deceptive practices
Limitations on Exemptions from Free Trade These provisions are, however, subject to the
overarching obligation upon States to refrain from engaging in unfair means of protectionism
vis-à-vis the domestic market.
Source: (International Growth Center, 2014)
ANNEXURE III. NON TRADE BARRIERS
The international legal regime on trade under the GATT (1994)105 allow for NTBs under
particular circumstances which operate to restrict imports which include:
Antidumping Measures: Under the GATT, Importing States are allowed to impose restrictions
on goods which have been ‗dumped‘ – i.e. which have been exported by an exporting State – at
prices lower than in the exporting State‘s domestic market, provided that such ‗dumping‘ causes
―material injury‖ to the competing domestic industry in the importing State. These goods are
often excess produce which is exported to external markets at lower-than-domestic prices and
article 6 of the GATT (relevant portions reproduced below) discusses anti-dumping measures
allowable under the GATT regime: In order to offset or prevent dumping, a contracting party
may levy on any dumped product an anti-dumping duty not greater in amount than the margin of
dumping in respect of such product
Countervailing Duties: Similar to antidumping measures, countervailing duties are duties
imposed by the importing State on goods produced by industries subsidized by the exporting
State. As per the Agreement on Subsidies and Countervailing Measures (SCM), following a
determination that the subsidies extended by the exporting State to the goods being exported
materially advantage those goods over those produced domestically in the importing market, a
State is allowed to impose a duty to offset the effect of the subsidy. Similarly, article 6 of the
GATT defines the term ―countervailing duty‖ as: a special duty levied for the purpose of
offsetting any bounty or subsidy bestowed, directly, or indirectly, upon the manufacture,
production or export of any merchandise.
Safeguard Measures: These are temporary measures initiated in order to protect the importing
market from a dramatic increase in imports if such an increase injures or threatens to injure it.
Such an increase can be in the form of an absolute increase the amount of imports or a relative
increase vis-à-vis the imported goods‘ market share. Emergency measures – ‗safeguard
measures‘ in the parlance of the WTO legal texts – implemented by a State to protect domestic
industry are covered in article 19 of the GATT, which enables an importing State to restrict
imports in the event of unforeseen developments such that imports would cause or threaten
serious injury to domestic producers of like or directly competitive products.
Allowances for Developing States: The GATT – recognizing their economic realities – makes
allowances for developing States in article 18 to implement programmes and policies of
economic development designed to raise the general standard of living of their people, to take
protective or other measures affecting imports For example, a developing State with a struggling
local industry may institute trade barriers restricting imports of goods produced by those
industries, thus reducing the competition such industries face. Examples of such protectionism
include ‗buy domestic‘ policies instituted in China.
Source: (International Growth Center, 2014)
BIBLIOGRAPHY
1. Administration, I. T. (2014). ITA Renewable Energy Top Markets Study.
2. BRADSHER, K. (2014, June). International Business. Retrieved March 10th, 2015, from
New York Times: http://www.nytimes.com/2014/06/18/business/as-led-industry-evolves-
china-elbows-its-way-to-the-fore.html?_r=0
3. Chadbourne. (2013, April). Retrieved from
http://www.chadbourne.com/ChinaSetsNewEnergyGoals_4_13_projectfinance/
4. China New Energy Chamber of Commerce (CNECC). (2014). Global Renewable Energy
report . http://www.hanergy.com/en/upload/contents/2014/07/53bfa4772d9f6.pdf.
5. China, R. I. (2013). China Lead-acid Battery Industry Report, 2012-2015.
6. Global Wind Energy Council. (2014). Global Wind Report : Annual Market Update
2013. http://www.gwec.net/wp-content/uploads/2014/04/GWEC-Global-Wind-Report_9-
April-2014.pdf.
7. Haley, U. C. (2013). How Chinese Subsidies Changed the World. Retrieved from
https://hbr.org/2013/04/how-chinese-subsidies-changed
8. Hodum, L. S. (2008). China's Wind Power Industry: Localizing Equipment
Manufacturing. Retrieved from Renewable Energy World:
http://www.renewableenergyworld.com/rea/news/article/2008/07/chinas-wind-power-
industry-localizing-equipment-manufacturing-53076
9. Holland. (2014). China Top Sector Wind Energy Opportunities for Dutch Companies.
http://china.nlambassade.org/binaries/content/assets/postenweb/c/china/zaken-doen-in-
china/sectoren/duurzame-energie/opportunity-report-wind-energy.pdf.
10. ICTSD. (2007). Promoting Trade in Environmental Goods : How RTAs can contribute ?
11. ICTSD. (2009). Liberalization of Climate-friendly environmental goods - Issues for small
developing countries.
12. ICTSD. (2013). Lists of Environmental Goods: An Overview .
13. International Growth Center. (2014). Non-Tariff Barriers and Pakistan’s Regional trade.
14. International Renewable Energy Agency. (2010). RENEWABLE ENERGY
TECHNOLOGIES: COST ANALYSIS SERIES : Volume 1: Power Sector.
15. International Trade Centre. (2014, August ). Retrieved from
http://www.intracen.org/uploadedFiles/intracenorg/Content/Exporters/Sectors/Service_ex
ports/Trade_in_services/APEC%20Seminar%20on%20Environmental%20Goods.pdf
16. Korte, K. J. (2010). Government Promotion of Renewable Energy Technologies .
17. Lamy, P. (2012). WTO NEWS. Retrieved from World Trade Organization:
https://www.wto.org/english/news_e/sppl_e/sppl258_e.htm
18. McFarlin, P. D. (2015). International Management: Strategic Opportunities and Cultural
Challenges.
19. New York Times. (2014). Retrieved from
http://www.nytimes.com/2014/12/18/business/energy-environment/china-criticizes-steep-
us-tariffs-on-solar-panels.html?_r=0
20. OECD. (2008). OECD Environmental Outlook to 2030.
21. PEW Center on Global Climate Change . (2011). Energy and Climate Goals of China’s
12th Five-Year Plan .
22. Platzer, M. D. (2012). U.S. Wind Turbine Manufacturing:Federal Support for an
Emerging Industry. Congressional Research Service .
23. Price, B. S., Wang, J., Li, M., & Zeng, L. (2012). China’s Approaches to Financing
Sustainable Development: Policies, Practices, and Issues.
24. Renewable Energy World. (2014). Retrieved from
http://www.renewableenergyworld.com/rea/news/article/2014/06/china-becomes-worlds-
largest-pv-market
25. Ricerche, S. S. (2011, March). Environmental Policy, Technology and Trade in
Environmental Goods- What about China.
26. SZW. (n.d.). World Gas Turbine (China) 2015. Retrieved March 2015, from SZW
Group: http://www.szwgroup.com/world-gas-turbine-china-2015/
27. Topf, A. (2014, August ). Retrieved from Oil Price: http://oilprice.com/Alternative-
Energy/Solar-Energy/Why-China-Is-Leading-The-World-In-Solar-Power.html
28. World Nuclear Association. (2015, March). Retrieved from http://www.world-
nuclear.org/info/country-profiles/countries-a-f/china--nuclear-power/
29. Wyden, S. R. (2010). U.S. TRADE IN ENVIRONMENTAL GOODS .