Embed Size (px)
Citation preview
Sujatha et al., International Journal of Advanced Engineering Technology E-ISSN 0976-3945
Int J Adv Engg Tech/Vol. VII/Issue I/Jan.-March.,2016/476-485
Research Paper LOCAL AND GLOBAL TONE MAPPING OPERATORS IN HDR
IMAGE PROCESSING WITH AMALGAM TECHNIQUE Sujatha Ka, Dr D Shalini Punithavathanib
Address for Correspondence [email protected] a Research Scholar F/T of Anna University , Government College of Engineering –Tirunelveli, Tamil Nadu,
b Principal, Government College of Engineering –Tirunelveli, Tamil Nadu, India
ABSTRACT High Dynamic range HDR images are achieved even in mobile phone, due to the recent advances in the field of HDR. Tone mapping operator converts the HDR image into LDR images which can be visualized clearly There are various operators available in the HDR tool box In. this paper we have demonstrated the all the tone mapping operators dividing them as local and global as given in the early literature studies. The various results of the operators are shown in the paper with the subjective analysis. A new hybrid method is proposed with local and global operator and the evaluation is done. By examining all the combination of the operators the global combination with the same global method gives a promising result. Compared with the individual local and global tone mapping operators the combinational hybrid operator gives a better performance. KEY WORDS: Tone mapping operators, High Dynamic Range Images, low Dynamic Range Images, Subjective evaluation, Hybrid tone mapping operator.
1. INTRODUCTION The present trend is to produce high resolution
images with low investment. It is noticeable that we
are in the digital era thinking of the digital images
with high resolution images which depends on the
size of the pixels and their intensities. The colour
images are represented in 8 bit for each colour
channels red, blue and green and 8 bit for the
exponent value which contribute to 0-255 colour
components for each pixel. 1.6 millions Colours can
be derived from those basic 256 colour shades. The
advanced dynamic range of photography and
cinematography can be achieved with these colours
with high ended cameras. The luminance of these
images will be changed from the world luminance to
device luminance. There will be small shift in the
compatibility of the luminance. So it is very
challenging task to convert this low dynamic range to
convert to produce a high dynamic range with
radiance mapping which is called as high dynamic
range images.
The quality of HDR images is superior to
the conventional images that we get through the
normal cameras with low sensors. From direct
sunlight to faint nebula the hdr images have best
luminance value depending on the light source .It is
a challenging task to produce the high dynamic range
in the photography with and the images taken by
lesser dynamic range devices. The change in the
resolution that is from high dynamic to low dynamic
can be obtained by generating a intermediate map
known as the radiance map. The fidelity of the high
dynamic range image will be much higher than the
conventional images .Improvements in the
technology helps us to improve the sensors used in
the capturing devices which intern improves the
range of the image but these devices are very
expensive. Every customer cannot be expected to buy
expensive devices. It is also difficult to make low
budget devices due to the stiff competition. So it is
very essential to derive a algorithm or an operator to
convert this high dynamic range devices to low
dynamic range images .The general procedure of
doing this is by applying Tone Mapping Operators
(TMOs). Technology on the subject of the tone
mapping of standstill images has been meticulously
explored. Solutions have been designed to overcome
the flickering problem. These solutions use
temporally close frames to smooth out abrupt
changes of luminance. There are different tone
mapping operators available. The strength and
weakness of these operators can be evaluated only by
a systematic assessment .there are extensive
approaches available to evaluate the methods. The
real world scene and the tone mapped image scene
can be evaluated directly by psychophysical testing.
The most important concentration of this
paper is to investigate the differences interception of
tone mapped images when they are directly compared
with their corresponding real-world views compared
with each other. Based on the appearance of the
images the high dynamic range of image scan be
classified as two different regions as smooth radiance
transition regions with significant high dynamic
range pixels and the other one is significant local
radiance change neighbouring pixels with sharp
details .The properties of the pixels helps in
compressing the dynamic range of the pixel by
optimizing the pixel compression to window level.
The paper is a study paper with a proposed hybrid
tone mapping operator. The section 2 deals with the
related work of the various authors. .Section 3
discuss about various steps involved in tone mapping
operator along with the example of global and local
operators. Section 4 presents the proposed hybrid
tone mapping operators and section 5 gives the detail
view about subjective quality measure of tone
mapping and the section6 presents the results and
discussions.
2. RELATED WORK The history of evaluation of tone mapping operator is
based on luminance, brightness and colour
correction. Drago et al[1] first and foremost used a
Sujatha et al., International Journal of Advanced Engineering Technology E-ISSN 0976-3945
Int J Adv Engg Tech/Vol. VII/Issue I/Jan.-March.,2016/476-485
perceptual method to evaluate the tone mapping
method. The pair wise and rate of difference was
considered and the test was conducted. 10 HDR
images were considered was testing the various tone
mapping operators by Kuang et al. The experiment
was carried out by implementing two paired
comparison psychophysical experiments which
generally helps to assess the colour and greyscale
tone mapping performance respectively. Six best tone
mapping operators were considered and the overall
quality measured. There was another evaluating
procedure carried out by Yoshida et al[3] with 14
observers evaluating the dissimilar tone mapping
methods on two architectural interior scenes .they
were asked to rate the images and a output was
atomised for calculating the metrics. The results of
this perceptual study exhibited differences between
local and global tone mapping operators,
comparatively local shows better outcomes.(IBL)
image based lighting applications are used in
extending the dynamic range which is sharply
monitored by the researchers. Inverse Tone mapping
Operator (iTMO) can be classified based on image
processing technique. For example, global operators
or local operators Reinhard et al[4] and Banterle by
Ledda et al [2] by comparing the algorithms and
their computational time. These HDR displays allow
to execute with statistical method et al[5] provide
good overview and implementation in terms of
perception. A new method was proposed by
Schlick and Tumblin et al[6] which has a drawback
of lack of contrast but excellent in preserving the
details and shadows with the help of S shaped
function. There are some papers which addresses the
histogram based operators which play a vital role in
contrast adjustment based on the histograms. The
uniform global natured histogram was processed by
Cohen[7] and Jonathan which modifies the contrast.
The general procedure for tone mapping is to
decompose the images into different layers or scales
and then modify the contrast or enhance the contrast
with a vibrant technique. The presence of halo
artefacts are the main pit fall of these local processing
methods .The research by Chiu et al[8] confirmed
that the halos were due to the low pass version of the
image. Pattenik et al [9] proposed operator to process
a stream of input images of a scene and produce the
output stream that simulates the changes in visual
appearances caused by variation in the scene
luminance. Since the concept of HDR colour space is
new no experience within image application has been
gained some far. Therefore, a new gamut mapping is
proposed by improving the colour image difference.
Ferwerda et al[10] developed a computational model
with visual adaption. Larson et al[11]proposed a tone
mapping operator based on histogram adjustment
technique which improves the population of local
adoption luminance scene. Drago et al[12] proposed
a tone mapping operator with adaptive logarithmic
mapping strategy by changing the logarithmic
function based on luminance level. Duanet al[13]
developed a global tone mapping operator which is
better in visualization compared with other tone
mapping operators. Tumblin and Turk et al[14]
proposed a local tone mapping operator with layered-
based method which is used for preserving the edges
and filtering anisotropic diffusion. Durand and
Dorsey et al[15] developed a simpler layer-based
method for using base layer and detail layer. Lee et
al[16] proposed a local tone mapping operator with
bilateral filtering method for the adjustment of base
layer using global mapping function and
enhancement of detail layer using gain map obtained
in base layer. Krawczyk et al[17] proposed a local
merging framework with luminance value to segment
the HDR image. Lischinski et al introduce a novel
interactive local adjustment method to have better
tonal values with greater visual parameter.
Adaptive logarithmic mapping provides consistent
result by avoiding artifacts and addressing halos with
contrast adjustment. The logarithmic based adaptive
adjustment is carried out in logarithmic tone mapping
operator depending upon the pixel radiance. The
interpolation luminance value is bring into being in
the scene from log2(Lw) to log10(Lw). the dark region
of the image is preserved and the maximum
compression of luminance is carried out. With the
knowledge about various tone mapping operators
Here, we proposed Hybrid Tone mapping Operator
(Hybrid TMO) as a part of work and the subjective
quality assessment is carried out and the results has
been attached. There are 3o tone mapping operator
and one false colour producing operator. All these
tone mapping operator has been tested and the results
have been stated.
3. DETAILED STUDY ABOUT TONE MAPPING
Tone Mapping is a practice used in image processing
and computer graphics to map one set of colors to
another to approximate the appearance of high
dynamic range images in a medium that has a more
limited dynamic range .Tone mapping is done by an
operator and they can be classified on the basis of
their operation on the image.
3.1General steps involved in Tone mapping
The main objective of tone mapping is to replicate
the given scene or an image close to the real world
brightness matching the human view in the display
devices. Appropriate metrics are chosen for various
input images depending on the application. In tone
mapping the contrast distortions are weighted
according to the individual visibilities approximated
by Human Visual Systems. An objective function
based tone map is created. There are different filters
like bayer’s filters and other filters are used for tone
mapping. These filters can also be extended to
videos. The purpose of using the tone mapping
operator can be in a different way as in some cases
the image has to be aesthetically pleasing and while
Sujatha et al., International Journal of Advanced Engineering Technology E-ISSN 0976-3945
Int J Adv Engg Tech/Vol. VII/Issue I/Jan.-March.,2016/476-485
other application they need to reproduce as many as
details as in the medical images . The goal of creating
the image vary from application to application
depending upon the need .It is not only restricted to
the application but also the display devices which is
not able to reproduce the full range of luminance
values.
3.2 Local tone mapping Algorithm Local tone mapping operation on a image produce a
a vital number of characteristic effects. The local
operation may end up even with canvas like
appearance due to the dark objects around them and
shadows in the input image. The camera response
curve is obtained in the local tone mapping with the
help of real world brightness of the pixels ranging
from 0 -255. Multiple exposure images are taken as
the input the HDR radiance map is computed with
weighted sum of all the inputs. Keeping the contrast
of the HDR radiance map other contrast and the
luminance is compressed while preserving the
details. Let the image G be the RGB values of the
input radiance which is the input. The intensity of the
image has to be calculated. The image be represented
in the following matrix and ij be the no of rows and
columns of the image pixels.
�
��� ⋯ ���⋮ ⋱ ⋮��� ⋯ ���
� (1)
The intensity of the pixel can be calculated with
different methods which depends on the intensity hue
and brightness of the image .the brightness can also
be taken as the arithmetic mean of the colors red,
green and blue.
∞ =��� + ����� + ����
3 (2)
Though the above equation represents the general
procedure for cal calculating the brightness, the
intensity of the image Iin can be calculated with
different methods by applying the scalar product to
each colour coordinate .For example
1/61(R×20+G×40+B) is the intensity calculation of
Durand .The chrominance of the image can be
calculated by �
�,�
�,�
�which gives the individual
values. Logarithmic value of the intensity is
calculated by
������ = ����(���) (3)
The filter is applied on the logarithmic value in order
to separate the detail layer and the base layer the base
layer is obtained. Any filter can be applied to
separate the detail layer and base layer. The best
utilized filter is bilateral filter.
���� = ������(������) (4)
The detailed layer can be calculated by the equation
(5).here the base layer is subtracted from logarithmic
intensity which gives the detailed part
�������= ������ − ���� (5)
The detail layer is applied to offset and scaling
process to get the Loffs is the layer which has the
detailed pixels of the input image, then the image is
reconstructed by summing up the base and detailed
layer as
L final=����+������� (6)
After obtaining the final image the original colors are
put back to the reconstructed image as in (7) which
gives the final tone mapped image.
����� = L�����× (R
∞,G
∞,B
∞) (7)
3.3Popular Local tone mapping operators
Ashikhmin’s[18] operator is one of the best local
tone mapping operator is which the functionality of
HVS is carried out with three stages of processing.
Local adaption luminance is estimated and the values
are compressed into a required display range, some
of the lost details in the previous stages are re-
introduced in the third slapped. The
���(�,�)=����(�,�)
���(�,�)
(8)
Las is the local world adaption value .
����(�,�) =������(���
(�,�)− ������
�����(�,�)− ������
(9)
�(�)
=
⎩⎪⎪⎪⎨
⎪⎪⎪⎧
�
0.0014���� < 0.0034
16.5630+�− 1
0.4027��� 1 ≤ � < 7.244
2.4483+ log��
�
�.���
0.4027��� 0.034 ≤ � ≤ 1
32.0693+ log�� �
�
�.�����
0.0556������ℎ���
⎭⎪⎪⎪⎬
⎪⎪⎪⎫
(10)
ICAMO6 is one of the local tone mapping operator
based in the icam Image appearance model. This
model is designed to work with CIE tristimulers
information and takes the advantage of multiple
different colour related HSV effects that rely on
colorimetric values. Reline based tone mapping
operators are also one of the local tone mapping
operators.
3.4Popular Global tone mapping operators
The tone mapping operations can be broadly
classified as local and Global tone mapping operator.
The problem of dynamic range can be overcome by
the compressing the pixels populated by strong
contrast pixel with some algorithms. Compression in
contrast can be applied globally by predicting the
tone mapping curve which is applied to all the pixels
of the image. The slope of the curve is controlled by
taking into consideration the human contrast
sensitivity to promise that the displayed image does
not exhibit more contrast than what is perceived in
the real scene. There is a need for a fast algorithm
suitable for interactive applications which
automatically produce realistically looking images
for a wide variation of scenes exhibiting high
dynamic range of luminance. One of the global tone
mapping operator is logarithmic operator which
based on logarithmic compression of luminance.
Logarithmic function from log2 to log 10 is used
with increasing comprehensive power to preserve the
Sujatha et al., International Journal of Advanced Engineering Technology E-ISSN 0976-3945
Int J Adv Engg Tech/Vol. VII/Issue I/Jan.-March.,2016/476-485
details of the input image. The brightest pixel are
applied with higher value of log10 and the other
pixels are interpolated between values 2–10 as a
function of their luminance. In order to attain the
steepness of the image Perlin bias power function29
is applied to the logarithm bases. There are many
local and global operators available .Global operators
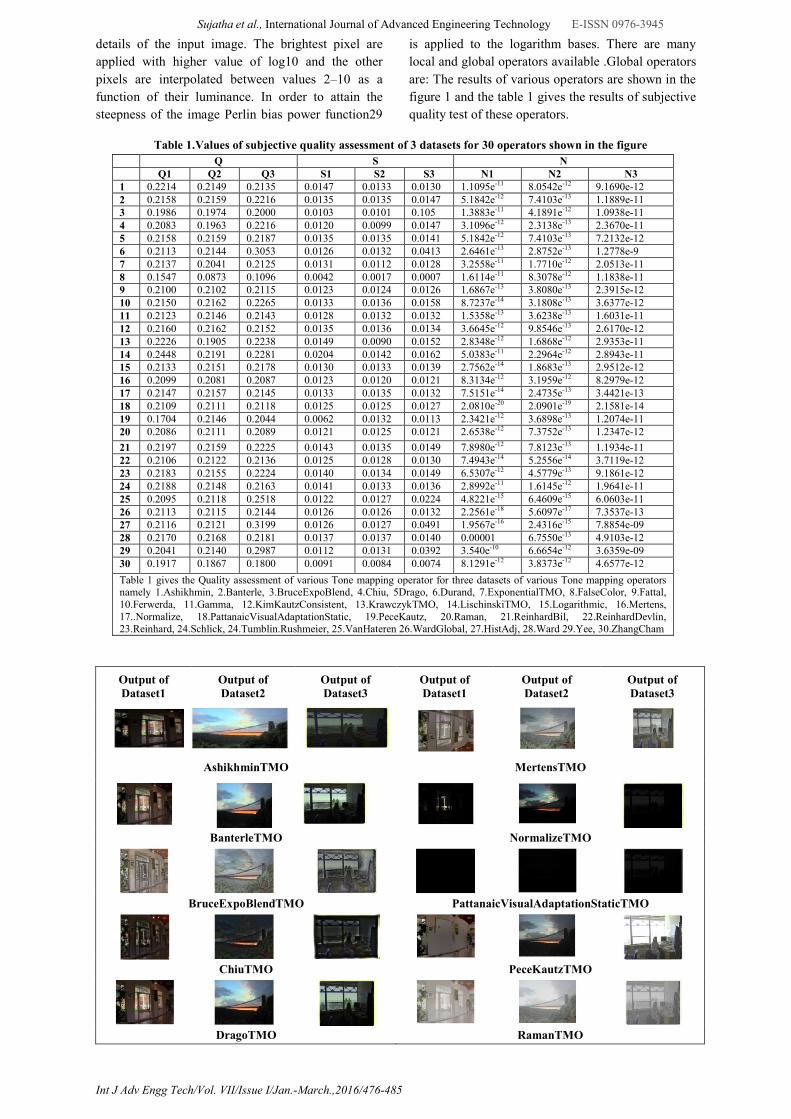
are: The results of various operators are shown in the
figure 1 and the table 1 gives the results of subjective
quality test of these operators.
Table 1.Values of subjective quality assessment of 3 datasets for 30 operators shown in the figure
Output of Dataset1
Output of Dataset2
Output of Dataset3
Output of Dataset1
Output of Dataset2
Output of Dataset3
AshikhminTMO MertensTMO
BanterleTMO NormalizeTMO
BruceExpoBlendTMO PattanaicVisualAdaptationStaticTMO
ChiuTMO PeceKautzTMO
DragoTMO RamanTMO
Q S N Q1 Q2 Q3 S1 S2 S3 N1 N2 N3 1 0.2214 0.2149 0.2135 0.0147 0.0133 0.0130 1.1095e-11 8.0542e-12 9.1690e-12 2 0.2158 0.2159 0.2216 0.0135 0.0135 0.0147 5.1842e-12 7.4103e-13 1.1889e-11 3 0.1986 0.1974 0.2000 0.0103 0.0101 0.105 1.3883e-11 4.1891e-12 1.0938e-11 4 0.2083 0.1963 0.2216 0.0120 0.0099 0.0147 3.1096e-12 2.3138e-13 2.3670e-11 5 0.2158 0.2159 0.2187 0.0135 0.0135 0.0141 5.1842e-12 7.4103e-13 7.2132e-12 6 0.2113 0.2144 0.3053 0.0126 0.0132 0.0413 2.6461e-13 2.8752e-13 1.2778e-9 7 0.2137 0.2041 0.2125 0.0131 0.0112 0.0128 3.2558e-11 1.7710e-12 2.0513e-11 8 0.1547 0.0873 0.1096 0.0042 0.0017 0.0007 1.6114e-11 8.3078e-12 1.1838e-11 9 0.2100 0.2102 0.2115 0.0123 0.0124 0.0126 1.6867e-13 3.8080e-13 2.3915e-12 10 0.2150 0.2162 0.2265 0.0133 0.0136 0.0158 8.7237e-14 3.1808e-13 3.6377e-12 11 0.2123 0.2146 0.2143 0.0128 0.0132 0.0132 1.5358e-13 3.6238e-13 1.6031e-11 12 0.2160 0.2162 0.2152 0.0135 0.0136 0.0134 3.6645e-12 9.8546e-13 2.6170e-12 13 0.2226 0.1905 0.2238 0.0149 0.0090 0.0152 2.8348e-12 1.6868e-12 2.9353e-11 14 0.2448 0.2191 0.2281 0.0204 0.0142 0.0162 5.0383e-11 2.2964e-12 2.8943e-11 15 0.2133 0.2151 0.2178 0.0130 0.0133 0.0139 2.7562e-14 1.8683e-13 2.9512e-12 16 0.2099 0.2081 0.2087 0.0123 0.0120 0.0121 8.3134e-12 3.1959e-12 8.2979e-12 17 0.2147 0.2157 0.2145 0.0133 0.0135 0.0132 7.5151e-14 2.4735e-13 3.4421e-13 18 0.2109 0.2111 0.2118 0.0125 0.0125 0.0127 2.0810e-20 2.0901e-19 2.1581e-14 19 0.1704 0.2146 0.2044 0.0062 0.0132 0.0113 2.3421e-12 3.6898e-13 1.2074e-11 20 0.2086 0.2111 0.2089 0.0121 0.0125 0.0121 2.6538e-12 7.3752e-13 1.2347e-12
21 0.2197 0.2159 0.2225 0.0143 0.0135 0.0149 7.8980e-12 7.8123e-13 1.1934e-11 22 0.2106 0.2122 0.2136 0.0125 0.0128 0.0130 7.4943e-14 5.2556e-14 3.7119e-12 23 0.2183 0.2155 0.2224 0.0140 0.0134 0.0149 6.5307e-12 4.5779e-13 9.1861e-12 24 0.2188 0.2148 0.2163 0.0141 0.0133 0.0136 2.8992e-11 1.6145e-12 1.9641e-11 25 0.2095 0.2118 0.2518 0.0122 0.0127 0.0224 4.8221e-15 6.4609e-15 6.0603e-11 26 0.2113 0.2115 0.2144 0.0126 0.0126 0.0132 2.2561e-18 5.6097e-17 7.3537e-13 27 0.2116 0.2121 0.3199 0.0126 0.0127 0.0491 1.9567e-16 2.4316e-15 7.8854e-09 28 0.2170 0.2168 0.2181 0.0137 0.0137 0.0140 0.00001 6.7550e-13 4.9103e-12 29 0.2041 0.2140 0.2987 0.0112 0.0131 0.0392 3.540e-10 6.6654e-12 3.6359e-09 30 0.1917 0.1867 0.1800 0.0091 0.0084 0.0074 8.1291e-12 3.8373e-12 4.6577e-12
Table 1 gives the Quality assessment of various Tone mapping operator for three datasets of various Tone mapping operators namely 1.Ashikhmin, 2.Banterle, 3.BruceExpoBlend, 4.Chiu, 5Drago, 6.Durand, 7.ExponentialTMO, 8.FalseColor, 9.Fattal, 10.Ferwerda, 11.Gamma, 12.KimKautzConsistent, 13.KrawczykTMO, 14.LischinskiTMO, 15.Logarithmic, 16.Mertens, 17..Normalize, 18.PattanaicVisualAdaptationStatic, 19.PeceKautz, 20.Raman, 21.ReinhardBil, 22.ReinhardDevlin, 23.Reinhard, 24.Schlick, 24.Tumblin.Rushmeier, 25.VanHateren 26.WardGlobal, 27.HistAdj, 28.Ward 29.Yee, 30.ZhangCham
Sujatha et al., International Journal of Advanced Engineering Technology E-ISSN 0976-3945
Int J Adv Engg Tech/Vol. VII/Issue I/Jan.-March.,2016/476-485
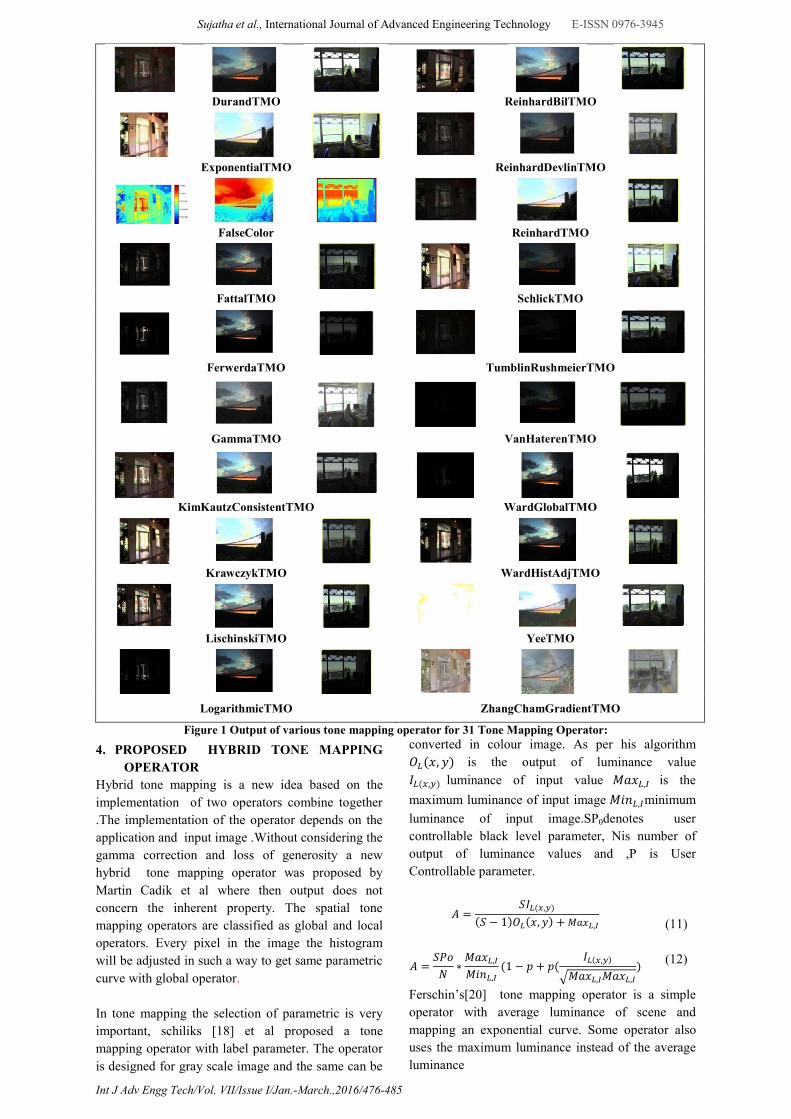
DurandTMO ReinhardBilTMO
ExponentialTMO ReinhardDevlinTMO
FalseColor ReinhardTMO
FattalTMO SchlickTMO
FerwerdaTMO TumblinRushmeierTMO
GammaTMO VanHaterenTMO
KimKautzConsistentTMO WardGlobalTMO
KrawczykTMO WardHistAdjTMO
LischinskiTMO YeeTMO
LogarithmicTMO ZhangChamGradientTMO
Figure 1 Output of various tone mapping operator for 31 Tone Mapping Operator:
4. PROPOSED HYBRID TONE MAPPING
OPERATOR
Hybrid tone mapping is a new idea based on the
implementation of two operators combine together
.The implementation of the operator depends on the
application and input image .Without considering the
gamma correction and loss of generosity a new
hybrid tone mapping operator was proposed by
Martin Cadik et al where then output does not
concern the inherent property. The spatial tone
mapping operators are classified as global and local
operators. Every pixel in the image the histogram
will be adjusted in such a way to get same parametric
curve with global operator.
In tone mapping the selection of parametric is very
important, schiliks [18] et al proposed a tone
mapping operator with label parameter. The operator
is designed for gray scale image and the same can be
converted in colour image. As per his algorithm
��(�,�) is the output of luminance value
��(�,�) luminance of input value ����,� is the
maximum luminance of input image ����,�minimum
luminance of input image.SP0denotes user
controllable black level parameter, Nis number of
output of luminance values and ,P is User
Controllable parameter.
� =���(�,�)
(� − 1)��(�,�)+ ����,�
(11)
� =���
�∗����,�����,�
(1 − � + �(��(�,�)
�����,�����,�)
(12)
Ferschin’s[20] tone mapping operator is a simple
operator with average luminance of scene and
mapping an exponential curve. Some operator also
uses the maximum luminance instead of the average
luminance
Sujatha et al., International Journal of Advanced Engineering Technology E-ISSN 0976-3945
Int J Adv Engg Tech/Vol. VII/Issue I/Jan.-March.,2016/476-485
��(�,�)= ����,�(1 − ���(�,�)
����,� ) (13)
��(�,�)is the output display luminance value
����,�is the maximum output luminance, ��(�,�)and
avgl,s average input luminance. In logarithmic
mapping algorithm Drago[105] et al uses the
logarithmic base between 2 to 10 for each pixel thus
preserving contrast and detail. Reinhard and
Devilin(106) operator is a global operator with
multiple user controllable image parameters. The
various parameters for contrast, brightness, chromatic
adaption and light adaption corrections are derived
The steps Involved in calculating are shown below.
���(�,�,�)= ���(�,�,�)+ �(��)� (14) (14)
���(�,�,�)is the output (display) luminance values.
�� = aγ� + (1 − a)γ� (15)
�����(�) + (1 − �)��� (16)
�� = ����(�) + (1 − �)��� (17)
�� = �����(�) + (1 − �)�(�,�) (18)
�(�,�) = 0.2125���(�,�,�)+ 0.71541��� (19)
Lod ( �,�,�) is the output (display) luminance
values.�(�,�) are the lemma values,L���(�)an average
of each color channel. � avis an average lemma
value. � maxis the maximum lemma and � min is
minimum lemma are average of each colour channel.
Lis (�,�,�)input luminance� is controllable value for
chromatic adaption value controlled by user.
Reinhard et al presented two different variations of
the photographic tone reproduction operator. The
overall brightness information is used as a key value
for designing the operator and the automatic
parameter is estimated for global mapping with
smallest luminance. Ld(x,y) is output display
intensity values. Ls(x,y,i) are input intensity value .Ls
is the log average luminance Lwhite is the user
controllable value for smallest luminance that will be
mapped to white, and ais the user controllable value
where the key value is mapped in the equation.
��(�,�) = ��(�,�)�1 +��(�,�)
���ℎ����
(20)
��(�,�)=�
�����(�,�)�
(21)
Where Ls is the log average luminance as key value.
Lwhite is the user controllable value, which denotes for
the smallest luminance mapped to white .Ld(x, y) is
output (display) intensity value, Ls(x, y, i) are the
input (scene),intensity value of Ls.
4.1 Overview of hybrid tone map
Input general steps involved in hybrid tone mapping
frame work consist of three steps.
Step 1: The multiple exposes image is combined into
single HDR image with various operating Enhance
with global (or) local operator. The output will be a
enhanced HDR image which cannot be viewed
normally on the display device.
Step 2: Construction of Enhancement Map with
same float number .Enhancement map is constructed
either with the threshold value or the luminance value
of the pixel. A mask is used to enhance local details
and make global transformation.
Step 3: Enhancement Map is very essential in hybrid
tone mapping. Obtaining the enhancement map, run
the bilateral filtering which separates the original
luminance map to the base layer and detail layer .the
detail layer is used to enhance the result of global
tone mapping .
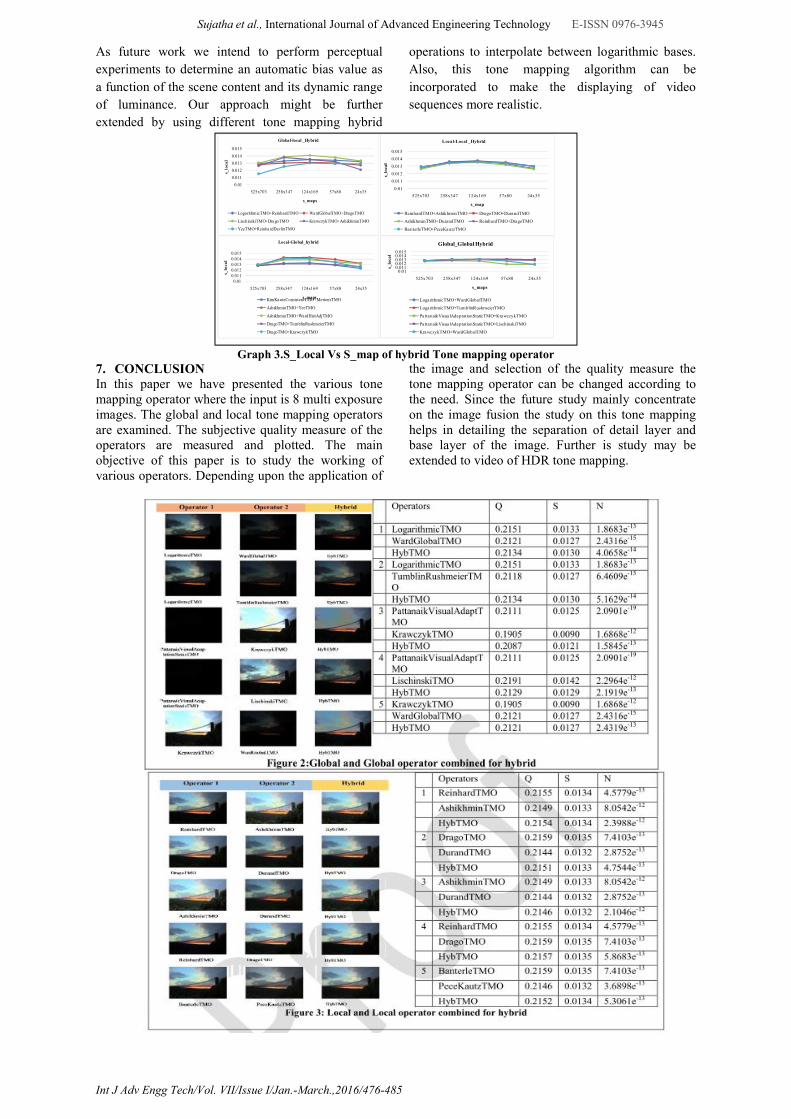
4.2 Implementation of Hybrid TMO
A Hybrid Tone Mapping Operator is
produced by combining two operators from local
and global. Firstly, a Global TMO is fused with
another Global TMO giving a hybrid of Global-
Global TMO. The resulting TMO is executed to
produce a tone mapped image and then the quality of
the image is assessed. Secondly, a Local TMO is
fused with another Local TMO giving a hybrid of
Local-Local TMO. The resulting TMO is executed to
produce a tone mapped image and then the quality of
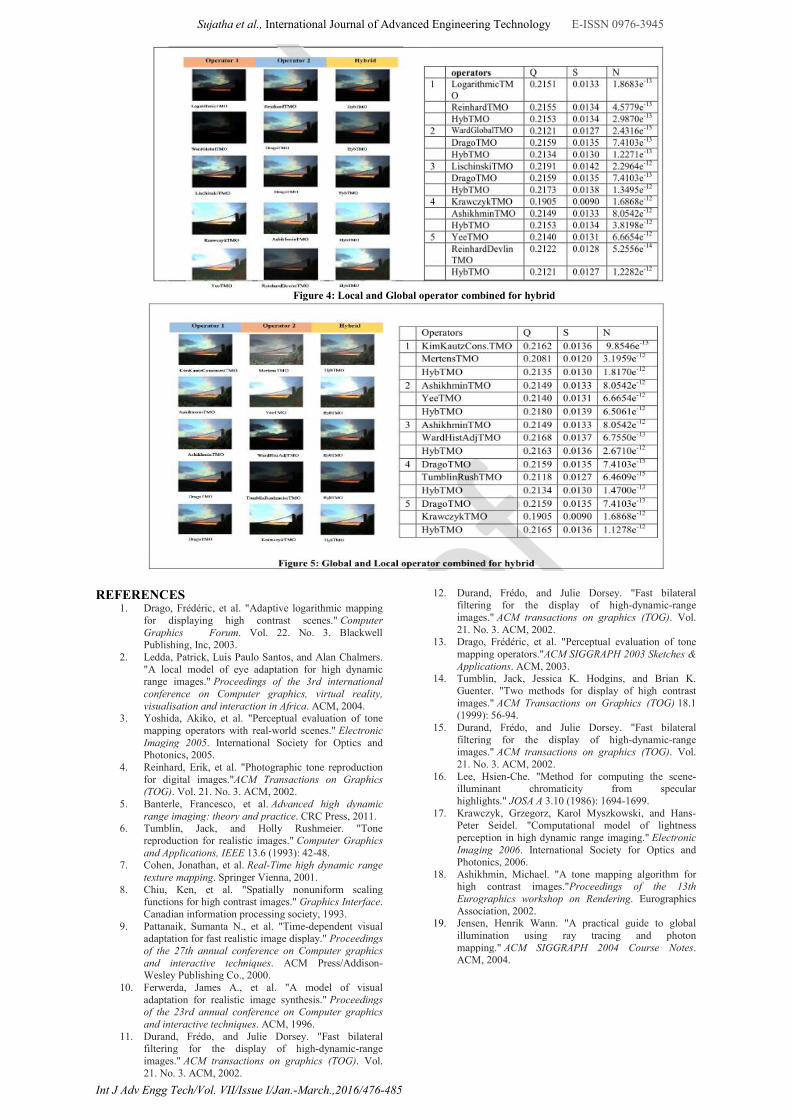
the image is assessed. Thirdly, a Global TMO is
fused with a local TMO giving a hybrid of Global-
Local TMO. The resulting TMO is executed to
produce a tone mapped image and then the quality of
the image is assessed. Lastly, a Local TMO is fused
with a Global TMO giving a new hybrid of Local-
Global TMO. The resulting TMO is executed to
produce a tone mapped image and then the quality of
the image is assessed.
There are four types of Hybrid Tone Mapping
Operator, where the results are show below the
Fig[2-5]. They are:
Hybrid TMO of Global TMO and Global TMO
Hybrid TMO of Local TMO and Local TMO
Hybrid TMO of Global TMO and Local TMO
Hybrid TMO of Local TMO and Global TMO
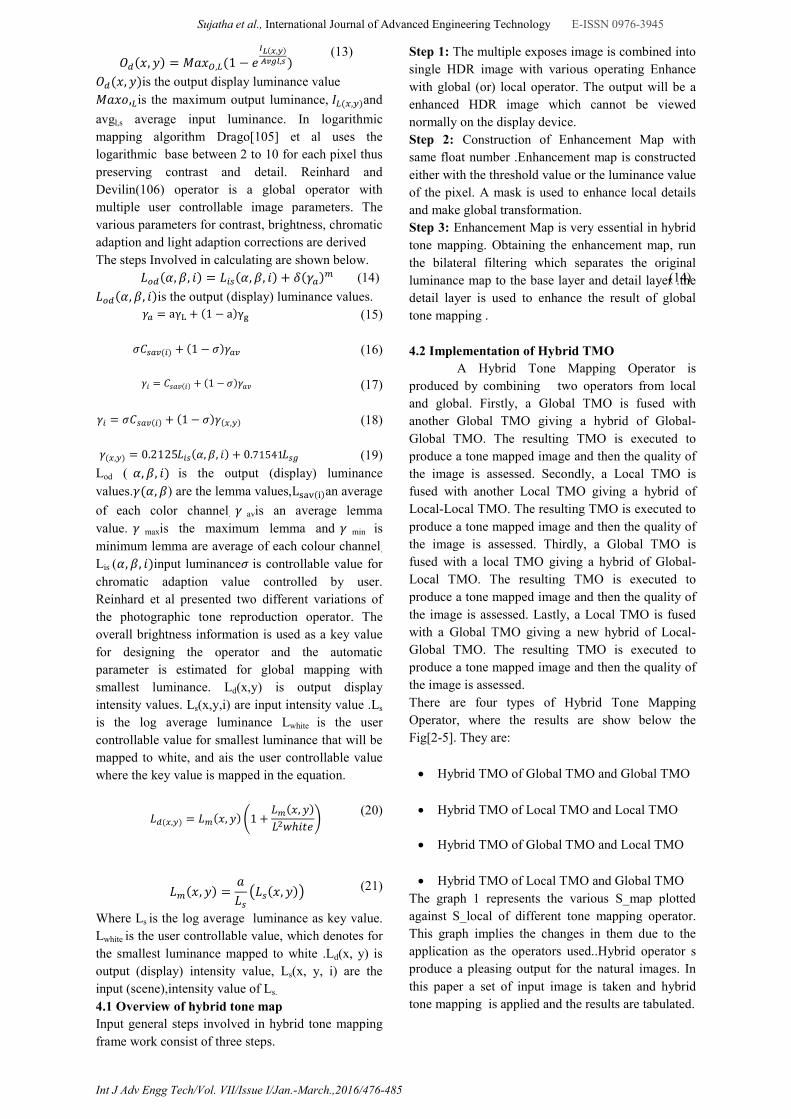
The graph 1 represents the various S_map plotted
against S_local of different tone mapping operator.
This graph implies the changes in them due to the
application as the operators used..Hybrid operator s
produce a pleasing output for the natural images. In
this paper a set of input image is taken and hybrid
tone mapping is applied and the results are tabulated.
Sujatha et al., International Journal of Advanced Engineering Technology E-ISSN 0976-3945
Int J Adv Engg Tech/Vol. VII/Issue I/Jan.-March.,2016/476-485
Graph1: S_local Vs S_ Map of various operators of tone mapping operator
5. QUALITY ASSESSMENT METHOD All the information in the HDR images cannot be
preserved by TMOs due to the reduction in the
dynamic range. A human observing the LDR
versions of these images may be unaware of it. For
assessing the quality of tone-mapped images,
structural fidelity is important. However, an overall
quality evaluation cannot be provided by structural
fidelity alone. Structural fidelity preservation and
statistical naturalness are sometimes competing
factors in producing a good Tone Mapped Image and
there should be a good compromise between the two
in a good quality tone mapped image
.
5.1Structural Fidelity(S)
The SSIM approach is the best metric designed For
measuring structural fidelity between images the
practical SSIM approach is followed. The SSIM
algorithm which is applied locally compares the
luminance, contrast and structure between images
Let a and b be two local image patches
extracted from the HDR and the tone-mapped LDR
images, respectively. Where σx, σy and σxy are the
local standard deviations and cross correlation
between the two corresponding patches in HDR and
LDR images, respectively, and C1 and C2 are
positive stabilizing constants. Compared with the
SSIM definition, the luminance comparison
component is missing, and the structure comparison
component is exactly the same
.
)22(2
2),(
2
2
12'2'
1''
C
C
C
CyxS
yx
xy
yx
yxlocal
The local structural fidelity measure S_local
is applied to an image using a sliding window that
runs across the image space. This results in a map
that reflects the variation of structural fidelity across
space. The sampling density of the image determines
the visibility of the image, the distance between the
image and the observer, the resolution of the display,
and the perceptual capability of the observer’s visual
system. A single scale method cannot capture such
variations. The local structural fidelity map is
generated at each scale. At each scale, the map is
pooled by averaging to provide a single score .
Nl
iiilocall yxS
NlS
1
),(1
(23)
Where xi and yi are the i th patches in
the HDR and LDR images being compared,
respectively. The overall structural fidelity
is determined by combining scale level
Sujatha et al., International Journal of Advanced Engineering Technology E-ISSN 0976-3945
Int J Adv Engg Tech/Vol. VII/Issue I/Jan.-March.,2016/476-485
structural fidelity scores using the method
in.
L
i
llSS
1
(24)
Where L is the total number of scales and βl is the
weight assigned to the l-th scale. The various
parameters like structural fidelity, naturalness and the
quality are tabulated. These parameters prove that the
proposed method is predominant. The S_map and
S_local values are mapped in the graph
5.2 Statistical Naturalness (N)
Among the attributes tested, brightness and contrast
have more correlation with perceived naturalness. We
used these two attributes to build our statistical
naturalness model. Our choice may have
oversimplified the concept of statistical image
naturalness. It may not be possible to generalize it to
other image processing applications which use the
concept of naturalness. It accounts for the simplicity
of our model and has the capability of capturing the
most important ingredients of naturalness that are
related to the tone mapping evaluation problem we
are trying to solve, where brightness mapping is an
unavoidable issue in all tone mapping operations. It
also best complements the structural fidelity measure
described in Section II-A, where brightness
modelling and evaluation are missing. Recent studies
suggested that brightness and contrast are largely
independent quantities in terms of both natural image
statistics and biological computation .As a result,
their joint probability density function would be the
product of the Therefore; we define our statistical
naturalness measure as
dmPPK
N1
-(25)
Where K is a normalization factor given by K = max
{Pm Pd}. This constrains the statistical naturalness
measure to be bounded between 0 and 1.
5.3 Quality Assessment Model (Q)
The structural fidelity S and the statistical naturalness
N tells us the quality of tone mapped images. They
may be used individually or jointly as a vector valued
measure.
. NaaSQ a )1( -(26)
where 0 ≤ a ≤ 1 adjusts the relative importance of the
two components, and α and β determine their
sensitivities, respectively. Since both S and N are
upper-bounded by 1, the overall quality measure is
also upper-bounded by 1.The results of global and
local operator is displayed in the graph[1] and table
[1].The subjective quality assessment of hybrid
operator is also shown in the paper
6. EXPERIMENTS AND DISCUSSIONS
In this paper various Tone mapping operators both
local and global operators are examined. As the first
step of experiment the 30 operators are taken into
consideration.
Namely 1.Ashikhmin, 2.Banterle,
3.BruceExpoBlend, 4.Chiu, 5Drago, 6.Durand,
7.ExponentialTMO, 8.FalseColor, 9.Fattal,
10.Ferwerda, 11.Gamma, 12.KimKautzConsistent,
13.KrawczykTMO, 14.LischinskiTMO,
15.Logarithmic, 16.Mertens, 17..Normalize,
18.PattanaicVisualAdaptationStatic, 19.PeceKautz,
20.Raman, 21.ReinhardBil, 22.ReinhardDevlin,
23.Reinhard, 24.Schlick, 24.Tumblin.Rushmeier,
25.VanHateren 26.WardGlobal, 27.HistAdj, 28.Ward
29.Yee, 30.ZhangCham,Gradient The study of local
and global Tone Mapping Operator results are
displayed in the fig[1] the quality metrics of the
image like structural fidelity is examined and listed in
Table1 1, This study on both local and global TMO
leads us to creating a hybrid of different component.
A hybrid TMO that adopts the characteristics of the
parent TMO are developed which will produce a
better image quality than the previous TMOs and in a
much faster speed.
The Hybrid Tone Mapping Operator is developed
and executed to get an output image. The two
operator are combined to produce this hybrid tone
mapping as mentioned earlier the two operators are
taken in 4 combinations and the results are displayed
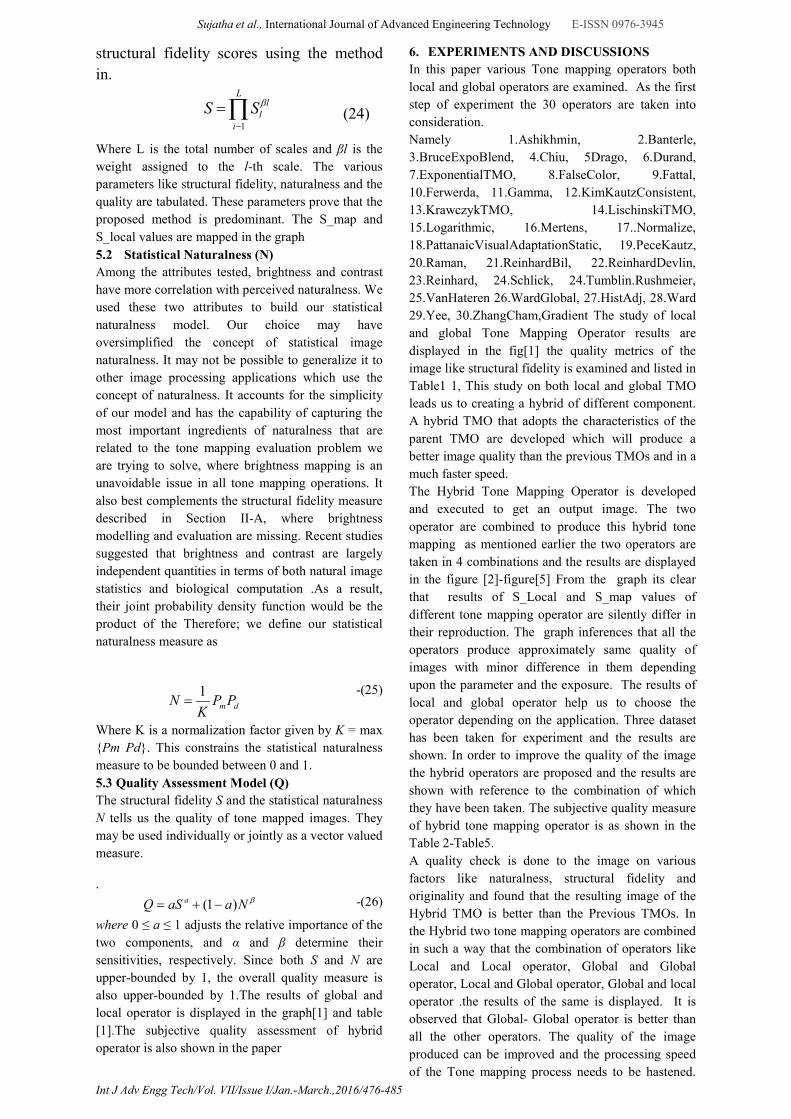
in the figure [2]-figure[5] From the graph its clear
that results of S_Local and S_map values of
different tone mapping operator are silently differ in
their reproduction. The graph inferences that all the
operators produce approximately same quality of
images with minor difference in them depending
upon the parameter and the exposure. The results of
local and global operator help us to choose the
operator depending on the application. Three dataset
has been taken for experiment and the results are
shown. In order to improve the quality of the image
the hybrid operators are proposed and the results are
shown with reference to the combination of which
they have been taken. The subjective quality measure
of hybrid tone mapping operator is as shown in the
Table 2-Table5.
A quality check is done to the image on various
factors like naturalness, structural fidelity and
originality and found that the resulting image of the
Hybrid TMO is better than the Previous TMOs. In
the Hybrid two tone mapping operators are combined
in such a way that the combination of operators like
Local and Local operator, Global and Global
operator, Local and Global operator, Global and local
operator .the results of the same is displayed. It is
observed that Global- Global operator is better than
all the other operators. The quality of the image
produced can be improved and the processing speed
of the Tone mapping process needs to be hastened.
Sujatha et al., International Journal of Advanced Engineering Technology E-ISSN 0976-3945
Int J Adv Engg Tech/Vol. VII/Issue I/Jan.-March.,2016/476-485
As future work we intend to perform perceptual
experiments to determine an automatic bias value as
a function of the scene content and its dynamic range
of luminance. Our approach might be further
extended by using different tone mapping hybrid
operations to interpolate between logarithmic bases.
Also, this tone mapping algorithm can be
incorporated to make the displaying of video
sequences more realistic.
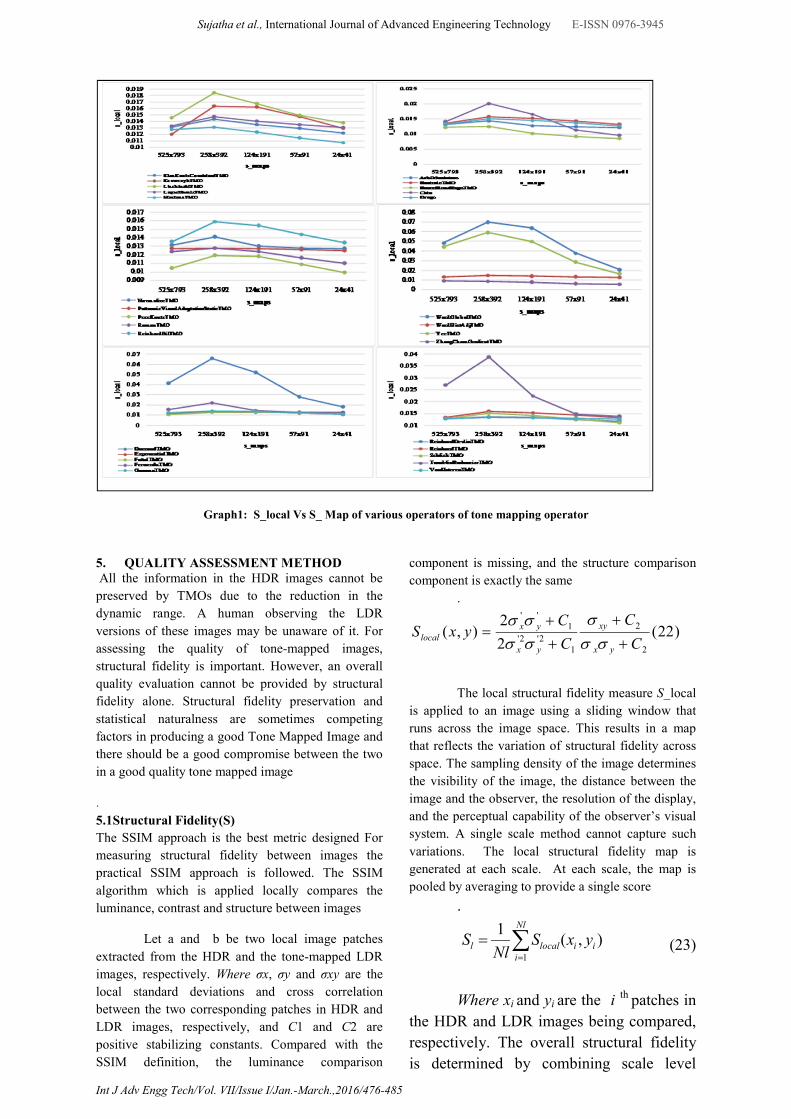
Graph 3.S_Local Vs S_map of hybrid Tone mapping operator
7. CONCLUSION In this paper we have presented the various tone mapping operator where the input is 8 multi exposure images. The global and local tone mapping operators are examined. The subjective quality measure of the operators are measured and plotted. The main objective of this paper is to study the working of various operators. Depending upon the application of
the image and selection of the quality measure the tone mapping operator can be changed according to the need. Since the future study mainly concentrate on the image fusion the study on this tone mapping helps in detailing the separation of detail layer and base layer of the image. Further is study may be extended to video of HDR tone mapping.
0.01
0.011
0.012
0.013
0.014
0.015
525x703 258x347 124x169 57x80 24x35
s_lo
cal
s_maps
Global-local _Hybrid
LogarithmicTMO+ReinhardTMO WardGlobalTMO+DragoTMO
LischinskiTMO+DragoTMO KrawczykTMO+AshikhminTMO
YeeTMO+Reinha rdDevlinTMO
0.01
0.011
0.012
0.013
0.014
0.015
525x703 258x347 124x169 57x80 24x35
s_lo
cal
s_map
Local-Local _Hybrid
ReinhardTMO+AshikhminTMO DragoTMO+DurandTMO
AshikhminTMO+DurandTMO ReinhardTMO+DragoTMO
BanterleTMO+PeceKautzTMO
0.010.0110.0120.0130.0140.015
525x703 258x347 124x169 57x80 24x35
s_lo
cal
s_maps
Local-Global_hybrid
KimKautzConsistentTMO+MertensTMO
AshikhminTMO+YeeTMO
AshikhminTMO+WardHistAdjTMO
DragoTMO+TumblinRushmeierTMO
DragoTMO+KrawczykTMO
0.010.0110.0120.0130.0140.015
525x703 258x347 124x169 57x80 24x35
s_lo
cal
s_maps
Global_Global Hybrid
LogarithmicTMO+WardGlobalTMO
LogarithmicTMO+TumblinRushmeierTMO
PattanaikVisua lAdaptationStaticTMO+KrawczykTMO
PattanaikVisua lAdaptationStaticTMO+LischinskiTMO
KrawczykTMO+WardGlobalTMO
Sujatha et al., International Journal of Advanced Engineering Technology E-ISSN 0976-3945
Int J Adv Engg Tech/Vol. VII/Issue I/Jan.-March.,2016/476-485
Figure 4: Local and Global operator combined for hybrid
REFERENCES 1. Drago, Frédéric, et al. "Adaptive logarithmic mapping
for displaying high contrast scenes." Computer Graphics Forum. Vol. 22. No. 3. Blackwell Publishing, Inc, 2003.
2. Ledda, Patrick, Luis Paulo Santos, and Alan Chalmers. "A local model of eye adaptation for high dynamic range images." Proceedings of the 3rd international conference on Computer graphics, virtual reality, visualisation and interaction in Africa. ACM, 2004.
3. Yoshida, Akiko, et al. "Perceptual evaluation of tone mapping operators with real-world scenes." Electronic Imaging 2005. International Society for Optics and Photonics, 2005.
4. Reinhard, Erik, et al. "Photographic tone reproduction for digital images."ACM Transactions on Graphics (TOG). Vol. 21. No. 3. ACM, 2002.
5. Banterle, Francesco, et al. Advanced high dynamic range imaging: theory and practice. CRC Press, 2011.
6. Tumblin, Jack, and Holly Rushmeier. "Tone reproduction for realistic images." Computer Graphics and Applications, IEEE 13.6 (1993): 42-48.
7. Cohen, Jonathan, et al. Real-Time high dynamic range texture mapping. Springer Vienna, 2001.
8. Chiu, Ken, et al. "Spatially nonuniform scaling functions for high contrast images." Graphics Interface. Canadian information processing society, 1993.
9. Pattanaik, Sumanta N., et al. "Time-dependent visual adaptation for fast realistic image display." Proceedings of the 27th annual conference on Computer graphics and interactive techniques. ACM Press/Addison-Wesley Publishing Co., 2000.
10. Ferwerda, James A., et al. "A model of visual adaptation for realistic image synthesis." Proceedings of the 23rd annual conference on Computer graphics and interactive techniques. ACM, 1996.
11. Durand, Frédo, and Julie Dorsey. "Fast bilateral filtering for the display of high-dynamic-range images." ACM transactions on graphics (TOG). Vol. 21. No. 3. ACM, 2002.
12. Durand, Frédo, and Julie Dorsey. "Fast bilateral filtering for the display of high-dynamic-range images." ACM transactions on graphics (TOG). Vol. 21. No. 3. ACM, 2002.
13. Drago, Frédéric, et al. "Perceptual evaluation of tone mapping operators."ACM SIGGRAPH 2003 Sketches & Applications. ACM, 2003.
14. Tumblin, Jack, Jessica K. Hodgins, and Brian K. Guenter. "Two methods for display of high contrast images." ACM Transactions on Graphics (TOG) 18.1 (1999): 56-94.
15. Durand, Frédo, and Julie Dorsey. "Fast bilateral filtering for the display of high-dynamic-range images." ACM transactions on graphics (TOG). Vol. 21. No. 3. ACM, 2002.
16. Lee, Hsien-Che. "Method for computing the scene-illuminant chromaticity from specular highlights." JOSA A 3.10 (1986): 1694-1699.
17. Krawczyk, Grzegorz, Karol Myszkowski, and Hans-Peter Seidel. "Computational model of lightness perception in high dynamic range imaging." Electronic Imaging 2006. International Society for Optics and Photonics, 2006.
18. Ashikhmin, Michael. "A tone mapping algorithm for high contrast images."Proceedings of the 13th Eurographics workshop on Rendering. Eurographics Association, 2002.
19. Jensen, Henrik Wann. "A practical guide to global illumination using ray tracing and photon mapping." ACM SIGGRAPH 2004 Course Notes. ACM, 2004.