Embed Size (px)
Citation preview

Daye et al. Journal of Translational Medicine 2013, 11:125http://www.translational-medicine.com/content/11/1/125
RESEARCH Open Access
Neuromimetic model of saccades for localizingdeficits in an atypical eye-movementpathologyPierre M Daye1*, Lance M Optican1, Emmanuel Roze2,3, Bertrand Gaymard2,3 and Pierre Pouget2
Abstract
Background: When patients with ocular motor deficits come to the clinic, in numerous situations it is hard to relatetheir behavior to one or several deficient neural structures. We sought to demonstrate that neuromimetic models ofthe ocular motor brainstem could be used to test assumptions of the neural deficits linked to a patient’s behavior.
Methods: Eye movements of a patient with unexplained neurological pathology were recorded. We analyzed thepatient’s behavior in terms of a neuromimetic saccadic model of the ocular motor brainstem to formulate apathophysiological hypothesis.
Results: Our patient exhibited unusual ocular motor disorders including increased saccadic peak velocities (up to≈1000 deg/s), dynamic saccadic overshoot, left-right asymmetrical post-saccadic drift and saccadic oscillations. Weshow that our model accurately reproduced the observed disorders allowing us to hypothesize that those disordersoriginated from a deficit in the cerebellum.
Conclusion: Our study suggests that neuromimetic models could be a good complement to traditional clinical tools.Our behavioral analyses combined with the model simulations localized four different features of abnormal eyemovements to cerebellar dysfunction. Importantly, this assumption is consistent with clinical symptoms.
IntroductionOcular flutter is an abnormal eye movement consisting ofrepetitive, irregular, involuntary bursts of horizontal sac-cades without an intersaccadic interval [1]. It is generallysuperimposed on normal ocular motor behavior and itsoccurrence may be facilitated by various events, such asblinks, the triggering of normal saccades or optokineticstimulation [2,3] and has been observed during pursuit[4]. The physiology of this rare disorder remains unclear.It probably results from a dysfunction of brainstem ocu-lar motor structures, in particular the paramedian pontinereticular formation (PPRF) involved in saccade gener-ation: excitatory burst neurons (EBN), inhibitory burstneurons (IBN) and omnipause neurons (OPN). EBN drivethe ipsilateral motor neurons, IBN inhibit the contralat-eral motor neurons, and OPN keep EBN and IBN silent,
*Correspondence: [email protected] of Sensorimotor Research, National Institutes of Health, Bethesda,MarylandFull list of author information is available at the end of the article
except immediately before and during saccade execu-tion. Earlier hypotheses ascribed saccadic oscillations toimpaired OPN function [5]. More recently, instability inpositive feedback loops involving EBN and IBN has beenhypothesized as the critical factor responsible for saccadicoscillations [6]. Oscillations could be generated in thesepositive feedback loops if neurons have a post-inhibitoryrebound (PIR), a spontaneous burst of activity followingthe end of a sustained inhibition [4,6-8]. The oscillationsobserved during pursuit [4] could also be linked to theOPN discharge, because it is known that OPN activity isdecreased during pursuit [9].
Here, we report the case of a patient with a flut-ter and very atypical saccade impairments. Saccades inour patient showed four abnormal characteristics. First,leftward saccades had an increased peak velocity whilerightward saccades had a peak velocity close to normal.Second, saccades contained a dynamic overshoot: sac-cade trajectories reversed at the end of the movement.Third, at the end of a saccade, there was an asymmetrical
© 2013 Daye et al.; licensee BioMed Central Ltd. This is an Open Access article distributed under the terms of the CreativeCommons Attribution License (http://creativecommons.org/licenses/by/2.0), which permits unrestricted use, distribution, andreproduction in any medium, provided the original work is properly cited.

Daye et al. Journal of Translational Medicine 2013, 11:125 Page 2 of 14http://www.translational-medicine.com/content/11/1/125
centripetal drift, more pronounced after rightward sac-cades. Finally, our patient generated saccade-inducedoscillations. The neural basis of most of these ocularmotor symptoms is correctly understood individually. Wesought to determine if their coexistence within a sin-gle patient implies widespread lesions or dysfunctions, orwhether they could result from the alteration of a focalneural structure. We focused on a neuromimetic saccadicmodel of ocular motor control that integrates the currentknowledge of the ocular motor brainstem, superior col-liculus and cerebellar circuitry. The fit of the model to thekinematics of the saccades was determined by four param-eters that are each a function of the saccadic displacement:the maximum collicular discharge, the maximum con-tralateral cerebellar discharge, the maximum ipsilateralcerebellar discharge and the timing of the onset of thatdischarge.
MethodsPatient clinical historyAn 18-year-old female with non-consanguineous par-ents had no familial history of neurologic or psychi-atric disorder. Her pregnancy, childbirth and perinatalperiod were normal. She had a mild learning disabilityfrom age eight. At age 14 she started to complain ofvisual disturbances that were attributed to abnormal eyemovements. Her neurological condition gradually deteri-orated over the next four years: she developed dysarthria,then behavioural changes and cognitive deterioration, andeventually mild gait disturbances.
On examination at age 18, she had a mild intellec-tual disability associated with social withdrawal anddepressive features. Motor and speech examination sug-gested a diffuse central nervous system dysfunction withthe combination of a cerebellar syndrome, an akineto-rigid parkinsonism associated with multifocal dystoniaand a pyramidal syndrome without motor deficit. Eyemovement recordings revealed atypical saccadic eyemovements with asymmetrical peak velocity and post-saccadic drift, a dynamic overshoot and an ocular flutter.These ocular motor deficits are quantified in the results.
Repeated work-ups failed to identify an immunologicdisorder; particularly we failed to detect any paraneoplas-tic antibodies and a comprehensive search for a tumorremained negative. She had no improvement following atherapeutic trial with intravenous Immunoglobulin ther-apy. Clinical evolution, MRI of the brain and spinal cord,and analysis of cerebrospinal fluid were normal, ruling outmultiple sclerosis. Dopamine transporter imaging with123I-FP-CIT (DaTSCAN) showed a bilateral reduction instriatal uptake consistent with a dysfunction of the nigros-triatal pathways. The neurometabolic investigations foundno abnormality and genetic investigations were nega-tive for Huntington disease, DRPLA, fragile X, Friedreich
ataxia, dominant spinocerebellar ataxias, PLA2G6, GFAP.Neurologists concluded that she had a probable heredo-degenerative disorder of unknown origin.
Paradigm and data acquisitionThe patient gave an informed consent before the study.All the procedures were approved by the local ethics com-mittee (CERES: Comité d’évaluation éthique des projetsde recherche en santé. N 2012-25) and conducted in con-formity with the Declaration of Helsinki. She was testedon three different dates. The first two sessions were sep-arated by six months, the second and the third sessionswere separated by three months. The subject sat 57 cmfrom a screen in a completely dark room. A gap protocolwas used during these sessions. Briefly, a central fixationpoint (0.5 deg diameter, green) appeared for 2800, 3500 or4000 ms then disappeared for 200 ms (gap period). Afterthe gap, a target was presented either leftward or right-ward (controlled pseudo-random sequence). 12 targetswere presented during a recording block. A single blockwas presented during the first session, four blocks dur-ing the second session and two during the last session. Ofthe seven blocks, one used variable amplitudes between5 and 20 deg, the others used a fixed amplitude of 25deg. During the second session, one block of 16 trials withupward and downward target presentation (no gap) waspresented to the patient. The same number of upward anddownward target positions were presented in a random-ized order. Therefore, we had six blocks with horizontaltarget displacements and one block with vertical targetdisplacements.
The target was presented using a personal com-puter running meyePARADIGM (e(ye)BRAIN SA, Paris,France). Horizontal and vertical monocular eye positionswere acquired using an IVIEW X HI-SPEED (SensoMo-toric Instruments, GmbH, Germany) video eye-tracker at500 Hz. The data were low-pass filtered at 50 Hz. Sac-cades were detected using a generalized likelihood ratio(GLR) algorithm as in [10,11]. Every trial was visuallyinspected; a manual correction of the detection parame-ters was applied if a saccade was not detected. 220 leftward(39 of them come from the variable amplitude paradigm)and 251 rightward (21 of them come from the variableamplitude paradigm) valid saccades were analyzed.
Comparison of linear regression slopesWe used the test detailed in [12] to compare the slopes oftwo linear regressions:
Ya = αaX + βa (1)Yb = αbX + βb (2)
t = αa − αb√SEM(αa)2 + SEM(αb)2
(3)

Daye et al. Journal of Translational Medicine 2013, 11:125 Page 3 of 14http://www.translational-medicine.com/content/11/1/125
αa and αb are the slopes of the regressions (1) and (2). βaand βb are the intercepts of the regressions. X representsthe independent variable while Ya and Yb represent thedependent variables. Equation (3) computes the t-statisticvalue used to test the difference between αa and αb. SEMin eq. (3) corresponds to the standard error of the mean.
ModelIn the following subsections, we will describe the differentparts of the model and how they affect the saccadic eye-movement behavior.
General structureFigure 1 shows the unilateral general organization of themodel, including the feedback loops. The overall archi-tecture is similar to [13,14]. Briefly, based on target visualinformation, the cortex determines the desired eye dis-placement and sends it to the superior colliculus (SC) andto the cerebellum (CBLM). The superior colliculus sendsa drive to the brainstem that shapes the initial eye veloc-ity while the cerebellum controls eye trajectory througha drive sent to the brainstem. The CBLM modulates theamplitude of the collicular discharge through a disfacil-itation signal (diamond tipped arrow in Figure 1). Thebrainstem sends the motor signal to the eye plant as well asan efference copy of this signal back to the cerebellum andto the cortex (green arrows from the brainstem to CBLMand Cortex in Figure 1). At the end of the saccade, the cor-tex evaluates whether a visual position error remains andtriggers a corrective saccade if needed.
Feedforward bilateral architectureThe model presented in this paper focuses on a detailedrepresentation of the brainstem. Figure 2 shows the bilat-eral feedforward connectivity included in the model fromthe cortex to the eye plant. Gray items represent neu-ral structures modeled as being unilateral (without anyloss of generality). Red items represent right side neu-ral structures while blue items represent left side neural
structures. Dot-tipped lines correspond to inhibitory con-nections, arrow-tipped lines represent excitatory connec-tions, and diamond-tipped lines represent disfacilitationsignals. Importantly, we divide the IBN into two popula-tions, one with a long lead and one with a short lead, andconnect them differently [15]. Note that the model is bilat-eral but we only considered the movement of the right eye.This section describes the different neural areas outsidethe brainstem.
In the model, the simplified cortex computes the ampli-tude of the saccadic displacement needed to make asaccade towards a visual target. The cortex block hasfour inputs: an estimate of the orientation of the eye,an internal estimate of eye velocity, the retinal positionof the target (delayed by 150 ms to account for primaryvisual cortex computations, the extraction of the targetposition and the programming of the desired saccadeamplitude) and an input from cerebellum to signal whenthe saccade is over. The model of the cortex includes arefractory period of 50 ms (starting when the eye velocitydrops under 20 deg/s) during which no new saccade canbe triggered. New saccades are triggered if the visual erroris larger than one degree. Finally, the input-output gainbetween the spatial position of the target on the retinaand the amplitude of the saccade is equal to 0.9 to repro-duce saccadic undershoot behavior of healthy subjects[16]. Then, the model of the cortex computes the desiredamplitude of the saccade and sends this informationdownstream to the superior colliculus and the cerebellum.
The superior colliculus (SC) is divided in the model intothree subparts: a rostral part corresponding to very smallerrors and two caudal parts (left and right) that model thecombined activity of the collicular burst and buildup neu-rons. There is no collicular discharge in the caudal partof the modeled SC when the desired gaze displacementis smaller than a threshold value of one degree (output ofcSCL and cSCR is equal to zero and rSC is dischargingat its peak in Figure 2). The rSC corresponds to the ros-tral pole of the SC initially observed by Munoz and Wurtz
Figure 1 General architecture of the model. This figure represents the different parts of the model and their feedforward and feedbackconnections. First, a target (T) appears on the retina and generates a position error (PE) sent to the cortex. Second, the cortex computes the desiredeye displacement (�E) and sends it to the superior colliculus (SC) and the cerebellum (CBLM). Third, SC and CBLM send a drive to the brainstemwhich sends back an efference copy of the eye position to CBLM which controls eye displacement. CBLM also modulates the collicular activitythrough a facilitation signal. Finally, the brainstem sends a drive to the eye plant. Lines with arrowheads correspond to excitation, with filled circlescorrespond to inhibition, and with filled diamonds correspond to facilitation. Details of the brainstem connectivity are presented in Figure 2.

Daye et al. Journal of Translational Medicine 2013, 11:125 Page 4 of 14http://www.translational-medicine.com/content/11/1/125
Figure 2 Feedforward bilateral connectivity. This figure represents a detailed view of the bilateral architecture with feedforward connections.Gray boxes correspond to neural structures modeled as being unilateral. Red boxes represent right side neural structures. Blue boxes represent leftside neural structures. The green shadow box represents the detailed description of the green box “brainstem” in Figure 1. Lines with arrowheadscorrespond to excitation, with filled circles correspond to inhibition, and with filled diamonds correspond to facilitation. No efferent-copy signals (tocortical and/or subcortical neural areas) are represented in this figure because they correspond to feedback connections.
[17] but must be seen as a simplification of the actualSC circuitry [18]. In more caudal recordings, Wurtz andGoldberg [19] have shown that the activity of the SC deeplayers is related to a particular displacement (orientationand amplitude) of the eye. The rSC in the model receivesthree inputs: a disfacilitation signal from each caudal fasti-gial nucleus and the desired eye displacement from thecortex. Both caudal superior colliculi receive two inputs:the desired eye displacement and a disfacilitation signalfrom the contralateral caudal fastigial nucleus. The outputof the caudal collicular parts is saturated to account for thesaccadic peak velocity saturation with increasing saccadicamplitudes. The maximum discharge of the caudal supe-rior colliculus (cSCm) is determined by a piecewise linearfunction that uses the desired saccadic displacement asinput. This function was manually tuned before the sim-ulations. The amplitude of the collicular discharge shapesthe initial acceleration of saccadic eye movement.
The cerebellum is the core of the saccadic controller inthe proposed model. It has three different roles; it con-trols the trajectory to ensure that the saccade ends closeto the target, it modulates the level of activity of theSC and it stops the saccade by sending a choke signal
to the contralateral long-lead inhibitory burst neurons(LLIBN). The output of the cerebellum is represented inthe model by the discharge of the caudal fastigial nuclei.Each nucleus has two inputs: the desired eye displace-ment and an efference copy representing eye velocity[20-22]. Each nucleus has two different roles dependingon the movement direction. The caudal fastigial nucleuscontralateral to the saccadic displacement controls themovement, while the ipsilateral caudal fastigial nucleusstops the movement at the end of the saccadea. To controlthe trajectory, the contralateral caudal fastigial nucleuscompares the desired eye displacement to an estimateof the current displacement obtained by integrating (ina mathematical sense) the efference copy of eye velocityand computes the appropriate drive to correct the trajec-tory. The amplitude of cerebellar discharge is saturated toreproduce the saturation of the peak velocity of saccadesas a function of the saccadic amplitude, called the mainsequence [23]. The maximum discharge of the caudalfastigial nucleus (cFNMax) is determined by a piecewiselinear function using the desired saccadic displacement asinput. The ipsilateral caudal fastigial nucleus dischargesonly at the end of the saccade to stop the movement. The
Daye et al. Journal of Translational Medicine 2013, 11:125 Page 5 of 14http://www.translational-medicine.com/content/11/1/125
timing of the activity onset (iFNo) and the intensity ofthe discharge (iFNMax) of the ipsilateral caudal fastigialnucleus is determined in the model by piecewise linearfunctions using the desired eye displacement as input.These functions were manually tuned before the simu-lations to ensure correct saccadic accuracy and matchthe main sequence relationship [23,24]. Finally, the cere-bellum also modulates the collicular activity through adisfacilitation signal. This signal is proportional to theamplitude of the eye motor error. Several studies haveshown the existence of an excitatory projection from thedeep cerebellar nuclei (dCN) to SC in the rat [25-27] andin the grey squirrel [28] that can facilitate or disfacilitatecollicular activity [27].
To summarize, the kinematics of the saccades weredetermined by four parameters that are each a func-tion of the saccadic displacement: the maximum col-licular discharge, the maximum contralateral cerebellardischarge, the maximum ipsilateral cerebellar dischargeand the timing of the onset of the discharge. As previ-ously explained, these parameters were tuned manuallyonce for the healthy saccade case and once to reproducethe patient’s behavior.
The input-output relationship between the innervationof the ocular muscles and the movement of the eye is mod-eled as a second-order transfer function with two timeconstants (150 ms and 5 ms). It receives two inputs: onefrom the right motoneuron nucleus and a second from theleft motoneuron nucleus.
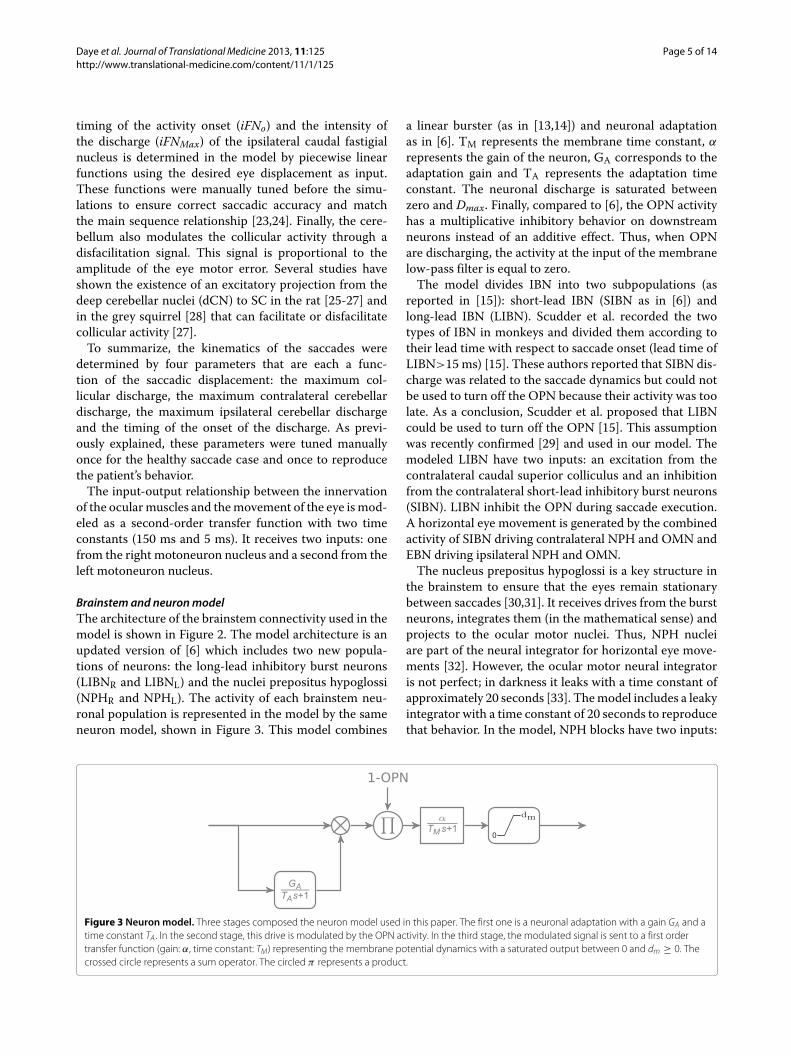
Brainstem and neuron modelThe architecture of the brainstem connectivity used in themodel is shown in Figure 2. The model architecture is anupdated version of [6] which includes two new popula-tions of neurons: the long-lead inhibitory burst neurons(LIBNR and LIBNL) and the nuclei prepositus hypoglossi(NPHR and NPHL). The activity of each brainstem neu-ronal population is represented in the model by the sameneuron model, shown in Figure 3. This model combines
a linear burster (as in [13,14]) and neuronal adaptationas in [6]. TM represents the membrane time constant, α
represents the gain of the neuron, GA corresponds to theadaptation gain and TA represents the adaptation timeconstant. The neuronal discharge is saturated betweenzero and Dmax. Finally, compared to [6], the OPN activityhas a multiplicative inhibitory behavior on downstreamneurons instead of an additive effect. Thus, when OPNare discharging, the activity at the input of the membranelow-pass filter is equal to zero.
The model divides IBN into two subpopulations (asreported in [15]): short-lead IBN (SIBN as in [6]) andlong-lead IBN (LIBN). Scudder et al. recorded the twotypes of IBN in monkeys and divided them according totheir lead time with respect to saccade onset (lead time ofLIBN>15 ms) [15]. These authors reported that SIBN dis-charge was related to the saccade dynamics but could notbe used to turn off the OPN because their activity was toolate. As a conclusion, Scudder et al. proposed that LIBNcould be used to turn off the OPN [15]. This assumptionwas recently confirmed [29] and used in our model. Themodeled LIBN have two inputs: an excitation from thecontralateral caudal superior colliculus and an inhibitionfrom the contralateral short-lead inhibitory burst neurons(SIBN). LIBN inhibit the OPN during saccade execution.A horizontal eye movement is generated by the combinedactivity of SIBN driving contralateral NPH and OMN andEBN driving ipsilateral NPH and OMN.
The nucleus prepositus hypoglossi is a key structure inthe brainstem to ensure that the eyes remain stationarybetween saccades [30,31]. It receives drives from the burstneurons, integrates them (in the mathematical sense) andprojects to the ocular motor nuclei. Thus, NPH nucleiare part of the neural integrator for horizontal eye move-ments [32]. However, the ocular motor neural integratoris not perfect; in darkness it leaks with a time constant ofapproximately 20 seconds [33]. The model includes a leakyintegrator with a time constant of 20 seconds to reproducethat behavior. In the model, NPH blocks have two inputs:
Figure 3 Neuron model. Three stages composed the neuron model used in this paper. The first one is a neuronal adaptation with a gain GA and atime constant TA . In the second stage, this drive is modulated by the OPN activity. In the third stage, the modulated signal is sent to a first ordertransfer function (gain: α, time constant: TM) representing the membrane potential dynamics with a saturated output between 0 and dm ≥ 0. Thecrossed circle represents a sum operator. The circled π represents a product.

Daye et al. Journal of Translational Medicine 2013, 11:125 Page 6 of 14http://www.translational-medicine.com/content/11/1/125
an inhibition from the contralateral short-lead inhibitoryburst neurons and an excitation from the ipsilateral excita-tory burst neurons. Each nucleus projects to the ipsilateraloculomotor nucleus. Finally, it is known that the flocculusand the paraflocculus of the cerebellum are involved in theintegration process; post-saccadic drifts with amplitude afunction of the orbital position were reported followinga lesion of the flocculus and paraflocculus [34]. It mustbe stressed that our model of the neural integrator doesnot include an orbital-dependent drift because this levelof complexity is beyond the scope of this paper.
SimulationsAll the simulations in this paper were performed on apersonal computer running MATLAB/SIMULINK (TheMathworks, Natick, MA, USA).
ResultsPatient behaviorTo test the sensorimotor eye movement function of apatient, the first paradigm traditionally used is the visu-ally guided saccade test. During this protocol, targets werepresented in sequence at different places and the patientwas asked to look at the target as soon as she saw it. Sev-eral variations of this protocol exist, depending on thetiming of target display: the next target is shown whilethe last one is still visible (overlap condition), has dis-appeared for a certain duration (gap) or disappeared atthe same time (synchronous condition). This test is infor-mative because saccade kinematics are very stereotypedand simple analyses can be done to characterize saccadiceye movements. In the next sections, we will first showthe main sequence to characterize leftward and right-ward average saccadic behavior. After, we will present atypical rightward and a typical leftward saccade done bythe patient with particularly large overshoots. Then wewill present saccadic movements with horizontal oscil-lations made by the patient. Finally, from the behavioralobservations we made, we then show how small adjust-ments to the model’s parameters cause it to change froma healthy configuration to a configuration that reproducesthe majority of the patient’s conditions.
Main sequenceIn this section, we characterize the general saccadicbehavior of the patient. The upper graph in Figure 4 showsthe relationship between saccade amplitude (e.g. differ-ence between eye position at point c and eye positionat point b in Figure 5 for the first saccade) and saccadepeak velocity known as the main sequence [23]. Leftward(rightward) saccades are represented with a negative (pos-itive) amplitude. Lower graph shows the peak velocityas a function of the maximum displacement during thesaccade. The maximum displacement is defined as the
Figure 4 Patient main sequence. Upper row represents saccadepeak velocity as a function of saccade amplitude. Lower rowrepresents saccade peak velocity as a function of saccadic maximumdisplacement. Gray dots correspond to the patient data. Thick coloredlines represent the average behavior computed with an exponentialfit. Thin colored lines represent the 95% confidence interval aroundthe exponential fit. Red lines are used for rightward movements. Bluelines are used for leftward movements. Negative amplitudes(maximum displacements) correspond to leftward movements.Positive amplitudes (maximum displacements) represent rightwardmovements.
Figure 5 Patient saccades. Upper (lower) row represents the timecourse of eye position when the patient looked at a 25 deg targetlocated on the right (left). Black lines represent target position.Orange lines represent horizontal eye movements. Green linesrepresent vertical eye position. Blue lines represent saccades. arepresents the onset of the first saccade. b represents the hookextrema. c represents the offset of the saccade.

Daye et al. Journal of Translational Medicine 2013, 11:125 Page 7 of 14http://www.translational-medicine.com/content/11/1/125
difference between eye position at the extrema of the posi-tion hook (reversal of the saccadic trajectory, e.g. point bin Figure 5 for the first saccade) and the eye position atthe onset of the saccade (e.g. point a in Figure 5 for thefirst saccade). One can see that the dispersion is smallerfor the peak-velocity vs. maximum-displacement relation-ship than for the peak-velocity vs. saccade-amplitude rela-tionship. To test this, we fitted an exponential model tocharacterize the different relationships in Figure 4:
VR,Max = (579 ± 35) ∗(
1 − e−(0.128±0.018)AR)
MSE = 5643,(4)
VL,Max = (938 ± 237) ∗(
1 − e(0.043±0.017)AL)
MSE = 11562,(5)
VR,Max = (617 ± 35) ∗(
1 − e−(0.077±0.009)MR)
MSE = 3517,(6)
VL,Max = (1133 ± 303) ∗(
1 − e(0.029±0.011)ML)
MSE = 7400.(7)
The parameters of each fit is given with their 95% confi-dence interval. AR (AL) corresponds to the amplitude ofrightward (leftward) saccades. MR (ML) corresponds tothe maximum displacement of rightward (leftward) sac-cades. VR,Max (VL,Max) represents the peak velocity duringrightward (leftward) saccades. Finally, MSE represents themean squared error of each fit. Fits (4)-(7) are shown inFigure 4 using blue thick lines for leftward fits and redthick lines for rightward fits. The 95% confidence intervalfor each fit is represented in Figure 4 by the correspondingthin lines.
The main sequence expresses that saccadic eye velocitysaturates for large-amplitude saccades. For a healthy sub-ject, there is no statistically significant difference betweenthe saturation velocity for leftward and rightward sac-cades. For our patient, there is an asymmetry betweenthe peak velocity for leftward and rightward saccades:rightward saccades have a velocity saturation approxi-mately half the size of that of leftward saccades. Normalsubject have a peak eye velocity saturating between 500and 700 deg/s [24]. Therefore, this asymmetry does notarise from slow rightward saccadic movements but fromextremely fast leftward saccadic movements. This is thefirst characteristic that the model should reproduce.
Comparing MSEs between equations (4) and (6)and between equations (5) and (7), fits using themaximum displacement as the independent parameterexplain more variability than those using saccadic ampli-tude as the independent parameter. Two-tailed f-tests
between residual distributions indicate that this differ-ence between MSEs is statistically significant (leftwardsaccades: F(163,163)=1.606 , p<0.05. Rightward saccades:F(103,103)=1.526, p<0.05). The better fit using the maxi-mum amplitude suggests to us that the command sent tothe burst neurons has a normal saccadic shape but that thedischarge that stops the saccade is too large.
Dynamic overshootA saccadic dynamic overshoot corresponds to a fast rever-sal of the saccadic trajectory before the end of the move-ment. It is different from a pulse-step mismatch becauseof the time course of the reversal movement (see [35] fora study of pulse-step mismatch). This can be observedin Figure 5. To characterize the dynamic saccadic over-shoot of the patient, we computed a linear regressionbetween rightward and leftward maximum displacementsand saccadic amplitudes:
AR = (0.790 ± 0.013)MR − (0.698 ± 0.2129)
R2 = 0.96, p < 0.001,(8)
AL = (0.928 ± 0.018)ML − (0.528 ± 0.086)
R2 = 0.98, p < 0.001.(9)
Regressions (8) and (9) show that the dynamic overshootmade by the patient corresponded to ≈21% of the max-imum displacement for rightward saccades and to ≈7%of the maximum displacement for leftward saccades. Thecoefficient of variation of the two regressions shows thata linear relationship accurately captures the relationshipbetween the maximum displacement and the amplitude ofthe saccade. The dynamic overshoot is the second majorcharacteristic that the model should simulate.
Post-saccadic driftFigure 5 shows 25 deg rightward (upper row) and left-ward (bottom row) saccades made by the patient duringthe second session. Target position is represented in black,horizontal eye position in orange and vertical eye posi-tion in green. Saccades as determined by our algorithmare colored in blue. As shown in Figure 5, a positionhook was visible at the end of each saccadic trajectory.The overshoot of the first rightward saccade in Figure 5has an amplitude of 9.05 deg. The overshoot of the firstleftward saccade in Figure 5 has an amplitude of 8.86deg. Additionally, when saccades were directed right-ward, the patient drifted towards the center but this driftwas strongly reduced (even absent sometimes) when thepatient executed leftward saccades. To quantify the timeconstant and the amplitude of the drift, we fitted an expo-nential function to the movements between two saccades.We excluded fits with a time constant larger than 20

Daye et al. Journal of Translational Medicine 2013, 11:125 Page 8 of 14http://www.translational-medicine.com/content/11/1/125
seconds and consider them as non-decaying (no right-ward movements, 5 leftward movements). The averagetime constant for the drifts following rightward saccadeswas equal to 90±75 ms and for the drifts following left-ward saccades was equal to 142±171 ms. The averageamplitude of the drifts following rightward saccades wasequal to 3.4±1.9 deg (statistically different from zero, two-tailed t-test, t(63)=14.22, p<0.001). The average ampli-tude of the drifts following leftward saccades was equal to-0.5±0.9 deg (statistically different from zero, two-tailed t-test, t(60)=-4.60, p<0.001). Finally, we computed the cor-relation between the amplitude of the drifts and the orbitalposition at the onset of the drift. We found a significantpositive correlation between the amplitude of the right-ward drifts and the orbital position (ρ=0.418, p<0.001). Incontrast, no significant correlation was observed betweenthe amplitude of leftward drifts and the orbital position(ρ=-0.098, p=0.450). These statistical analyses confirmedthat there was a strong drift following rightward saccadesand a marginal leftward drift following leftward saccades.The asymmetrical drift is the third major characteristicof the patient’s saccadic behavior that the model shouldsimulate.
Saccadic oscillationFigure 6, upper panel, shows a horizontal saccade towardsa target located 15 deg on the right. As for the rightwardsaccade in Figure 5, this saccade has a hook in the posi-tion trace at the end of the movement. However, unlike thecase of Figure 5, the eyes started to oscillate horizontallyat the end of the saccade. No oscillations were observedon the vertical channel. To test if the oscillation was linkedto the saccadic command, we tested the behavior duringsaccades. The bottom row of Figure 6 shows a vertical sac-cade towards a downward 13 deg target. No oscillationswere observed on the vertical channel at the end of thesaccade. However, horizontal oscillations were observedduring the largest vertical saccade. These two behavioralobservations indicate an oscillation mechanism based onthe cross-inhibition of the short lead inhibitory burst neu-rons similar to the one previously reported by [6]. Wequantified the frequency of the horizontal oscillations fol-lowing horizontal saccades and during vertical saccades.We computed the oscillation frequency based on thetime between successive peak positions during the oscil-lations. The average frequency in our patient is equal to14.5±3.4 Hz after horizontal saccades and to 13.1±3.1Hz during vertical saccades. We found no significant dif-ference between the two frequency ranges (two-tailedt-test, t(68)=-1.459, p=0.142), pointing towards an identi-cal mechanism in both cases. As in [6], those oscillationsare only possible if the omnipause neurons are held off.Therefore, the oscillatory saccadic behavior of the patientindicates that OPN are not reactivated correctly at saccade
Figure 6 Patient saccadic oscillation. Upper row shows ahorizontal saccade towards a target located 15 deg to the right.Lower row represents a vertical downward saccade towards a targetlocated 13 deg below the central fixation point. Same colorconventions as in Figure 5.
offset. This behavior is the fourth major characteristic thatmodel should reproduce.
Model simulationsIn this section, we will explain how we reproduced thefour major characteristics of the patient saccadic behavior:the dynamic overshoot, the pronounced rightward driftand the attenuated leftward one, the saccadic oscillationsand the asymmetry in the peak velocity. First we presenthow the model can reproduce general characteristics ofhealthy saccades.
Healthy saccadeTo simulate healthy human subjects, we tuned the param-eters of the model (cSCMax, cFNMax, iFNo and iFNMax, seemethods) to reproduce the main sequence represented byequation:
VMax = sign(A) · 601.4 ·(
1 − e−0.103‖A‖) (10)
This main sequence is extracted from a fit we performedon the data presented in Figure 1 of [24]. Compared to thepatient situation, there is only one expression of the mainsequence because there is neither a dynamic overshootnor a left-right asymmetry. Thus A in eq. (10) correspondsto the amplitude of the saccade, whether it is rightwardor leftward. To account for the natural undershoot behav-ior of saccades, we set a gain of 0.9 for the saccadicdisplacement.

Daye et al. Journal of Translational Medicine 2013, 11:125 Page 9 of 14http://www.translational-medicine.com/content/11/1/125
The upper panel of Figure 7 shows the time course of asimulated saccadic movement toward a rightward 25 degtarget. Because of the undershoot, the model generatedtwo saccades. The first saccade ended at 22.5 deg (peakvelocity: 545 deg/s) and a corrective saccade of 2.5 deg(peak velocity: 138.5 deg/s) was triggered by the model ofthe cortex to cancel the remaining visual error.
The solid gray line in the lower panel of Figure 7 rep-resents the main sequence of eq. (10) while the bluedots represent simulated saccades with a range of ampli-tudes between two and 40 degrees in steps of one degree.This panel shows that, once tuned, the model reproducedcorrectly the desired behavior.
Patient simulation of average behavior: asymmetric peakvelocity and main sequenceTo reproduce the main sequence of the patient, weincreased the activity of the contralateral caudal fastigialnucleus and the contralateral caudal superior colliculus(cFNMax, patient > cFNMax, healthy and cSCMax, patient >
cSCMax, healthy). Those parameters were tuned to repro-duce the peak velocity-maximum displacement relation-ship presented in Figure 6. To simulate the drift, first weincreased bilaterally the time constant of the NPH (from20 seconds to 22.5 seconds). Second, we increased the
Figure 7 Model simulation: healthy subject. Upper row representsa simulation (time course of horizontal eye position) of the modelwhen a target is presented 25 deg to the right. Same colorconventions as in Figures 5–6. Lower row represents simulation of amain sequence by the model. The gray line represents a fit computedon data extracted from Figure 1 of [24]. The blue dots representsimulations of the model for a range of amplitudes between two and40 deg in steps of one deg.
gain of the projection from the right EBN and left IBNto the right abducens nucleus (step gain from 0.15 to0.185). This second modification disturbs the compensa-tion of the longest time constant of the eye plant on oneside, and thus generates an asymmetrical drifting behav-ior as observed in the patient. It must be stressed thatthe effect of the drift could not be observed in the mainsequence but was present in the patient behavior. Thus,we already included the drift modifications in those sim-ulations but the results of the changes will be discussed inthe next section. To reproduce the dynamic overshoot, weincreased the maximum discharge of the ipsilateral cau-dal fastigial nucleus (iFNMax, patient > iFNMax, healthy) andwe triggered the ipsilateral caudal fastigial nucleus activ-ity sooner (iFNo, patient < iFNo, healthy). Through thosechanges, the ipsilateral EBNs start to discharge too soon,and thus reverse the movement. The higher and/or soonerthe ipsilateral caudal fastigial activity, the bigger the sac-cadic overshoot made by the model. Each of the piecewisefunctions was tuned independently for leftward and right-ward movements to match the dynamic overshoot ampli-tude for leftward and rightward saccades expressed by eq.(8) and (9).
Once the parameters were tuned to match this rela-tionship, we added a 25% random gaussian noise oniFNMax, patient to account for a part of the variabilityobserved in the patient data (noise amplitude arbitrar-ily chosen). Then, we simulated 117 leftward and 117rightward saccades with varying amplitudes between 2and 45 deg. Figure 8 shows the main sequences gener-ated by the model. Upper panel of Figure 9 representsthe saccade-amplitude vs. peak-velocity relationship whilethe lower panel shows the peak-velocity vs. maximum-displacement relationship. Red dots represent the right-ward saccade simulations and blue dots represent theleftward saccade simulations. As expected by the tuningof the parameters, the model reproduces correctly themaximum displacement-peak velocity relationship.
Finally, we computed the regression between the maxi-mum displacement and the saccade amplitude for leftwardand rightward simulated saccades:
AR,S = (0.773 ± 0.014)MR,S − (0.611 ± 0.436)
R2 = 0.98, p < 0.001,(11)
AL,S = (0.936 ± 0.005)ML,S − (1.098 ± 0.138)
R2 = 0.99, p < 0.001.(12)
Comparing regressions (8)-(9) with regressions (11)-(12),one can see that the model correctly approximates thepatient behavior. A t-test showed that the slope of eq.(8) is not statistically different from the slope of eq. (11)for rightward saccades (two tailed t-test. t(115)=0.4513,

Daye et al. Journal of Translational Medicine 2013, 11:125 Page 10 of 14http://www.translational-medicine.com/content/11/1/125
Figure 8 Model simulation: patient extreme conditions. Upperrow represents how the model reproduces specific movements showin Figure 5. Same layout and color conventions as in Figure 5.
p=0.3264). Similarly for leftward saccades, a t-test showedthat the slope of eq. (9) is not statistically different fromthe slope of eq. (12) for rightward saccades (two tailedt-test, t(115)=0.8768 , p=0.1909).
Patient simulation: asymmetric drift and dynamic overshootSimulating the average behavior of the patient is impor-tant for the model, but it is also important to show that
Figure 9 Model simulation: patient saccadic average behavior.Superimposed on the patient data of Figure 4, this figure shows howthe model reproduces the average behavior of the patient. Red dotsrepresent rightward simulated saccades. Blue dots represent leftwardsimulated saccades. Same layout as in Figure 4.
it can reproduce extreme conditions. The examples ofFigure 5 present a fairly large dynamic overshoot for thefirst saccade compared to the average behavior. Therefore,we tuned the model with a new set of the four parame-ters (cSCMax, cFNMax, iFNo and iFNMax) to reproduce thelarger dynamic overshoot of the first saccades of the tri-als in Figure 5. To reproduce the patient behavior, we usedthe behavioral observation that the main sequence is bet-ter defined if one used the maximum displacement insteadof the saccadic displacement. Therefore, the parameterswere tuned as a function of the maximum displacementinstead of the saccadic amplitude. We used the inverseof relationships (8) and (9) to compute the amplitude ofthe saccade sent to the cerebellum and the colliculus bythe cortex. All the other parameters were kept constant.Figure 8 shows a rightward simulated saccade (upperpanel) and a leftward simulated saccade (bottom panel)that reproduce the patient behavior presented in Figure 5:the dynamic overshoot in both directions and the asym-metric drift at the end of the movement. The upper panelshows the simulation of a rightward saccade toward a 25deg visual target. The saccadic gain in the cortex was set to1 to reproduce the behavior shown in Figure 5. Comparedto the upper panel of Figure 5, one can see that the generalbehavior is reproduced: the first saccade overshoots thetarget and subsequent saccades are triggered even thoughthe eye is close to the target. In addition, a drift can beobserved between rightward saccades. The lower panelshows the simulation of a saccade towards a visual targetlocated 25 deg on the left of the center. For this leftwardmovement, the saccadic gain in the cortex was set to 0.8.Comparing this simulation with the patient behavior pre-sented in the bottom panel of Figure 5, one can see thatthe model reproduces correctly the desired behavior. Thedrift between the saccades is greatly reduced compared torightward movements but the dynamic overshoot is stillpresent. The amplitude of the dynamic overshoot of thefirst saccade is identical in the simulations (rightward sim-ulation: 9.1 deg, leftward simulation: 8.3 deg) compared tothe ones observed in Figure 5.
Patient simulation: saccadic oscillationsFigure 10 shows the model behavior when the OPN activ-ity is not reactivated at the end of a 15 deg rightwardsaccade (to reproduce the patient behavior in the upperpanel of Figure 6). The model starts to oscillate if theOPN are not reactivated at saccade offset. The simulatedoscillation mechanism is similar to the one reported in[6] and can be reproduced by the model because of thecross-inhibition of the short-lead inhibitory burst neuronsand the post-inhibitory rebound of the neurons. To gen-erate the oscillation pattern of Figure 10, we decreasedonly the input gain of the OPN and we kept all the otheraverage parameters as in Figure 9. Therefore, at the end

Daye et al. Journal of Translational Medicine 2013, 11:125 Page 11 of 14http://www.translational-medicine.com/content/11/1/125
Figure 10 Model simulation: saccadic oscillations. Simulation of arightward horizontal towards a target located 15 deg on the right ofthe central fixation point. Same color conventions as in Figure 6.
of the saccade when the OPN should have fired to pre-vent the sIBNL-sIBNR circuit from oscillating, the OPNinhibition by the long-lead inhibitory burst neurons couldnot be stopped and an oscillatory movement started. Themain differences between our simulation and the patientobservation is the variable amplitude of the oscillations.To generate a variable amplitude of the oscillations, wecould included some variability in the amplitude of theinput gain of the OPN, but that is beyond the scope ofthis paper. The patient also exhibited shorter oscillatoryperiods. To simulate those situations, the input OPN gainmust be amplified sooner. This will excite the OPN andstop the oscillations.
DiscussionOur patient had several ocular motor abnormalities: sac-cades were asymmetric and had increased peak velocity,a dynamic overshoot, an asymmetrical postsaccadic cen-tripetal drift and saccade-induced oscillations.
To account for these observations, we focused on a neu-romimetic model of saccadic control with a detailed rep-resentation of the brainstem. A key point while designinga model is that several theoretical control structures couldbe built to reproduce our patient’s behavior. However, thepathophysiological consequences linked to a modificationof the model make sense only if the model structure relatesclosely to the actual neural circuitry. With that point inmind, we built a model that is constrained by the currentknowledge of the anatomy (connections between neuralstructures) and the neurophysiology (average discharge ofthe neural structures). Once the model architecture wasdefined, we tuned the model parameters to reproduce thesaccadic behavior of healthy human subjects. Then wemodified just 8 out of the 112 model parameters to repro-duce our patient’s saccadic eye movements (each one ofthe modified parameters being a piecewise linear functionof saccade amplitude).
If the model it to help us understand the complex inter-actions between the different subparts of the system, the
likelihood of the simulated deficit must always be put inperspective with other studies of the neuronal structureassumed to be defective. The interpretation of the changesapplied to the model to simulate our patient’s eye move-ments is important because abnormal behavior could havedifferent functional or anatomical origins. In addition, thepatient’s behavior could arise from a focal lesion or be theresultant of several defects. Once a set of parameters hasbeen found that mimics the deficit in the behavior, onemust ask how likely the changes in the parameters are toreflect the actual neuronal defects in the patient.
The first deficit we simulated with our model was theasymmetrical peak velocity vs. saccade amplitude rela-tionship of our patient. Saccade kinematics in the modelcan be tuned using four parameters: the maximum col-licular discharge, the maximum contralateral cerebellardischarge, the maximum ipsilateral cerebellar dischargeand the onset timing of the ipsilateral cerebellar discharge.The saccadic peak velocity can be increased in the modelby increasing the maximum collicular discharge and themaximum contralateral cerebellar discharge. Because thecollicular discharge is shaped by the cerebellar activitythrough the disfacilitation signal, an increase of the max-imum collicular discharge is equivalent to a decrease ofthe disfacilitation gain from the cerebellum. Therefore,the patient’s abnormal saccadic peak velocity can also beexplained by a cerebellar defect. However, the colliculusis not inhibited only by the cerebellum; another majorsource of inhibition comes from the substantia nigra parsreticulata (SNr) [36]. Therefore, the decrease of collicu-lar inhibition (and thus the increase of collicular dischargeleading to an increased saccadic peak velocity) could alsobe explained by a deficient SNr. In addition, clinical exam-inations of the patient showed a deficit in the nigrostriatalpathways. However, Vidailhet et al. have reported thatpatients with striatonigral deficits have close to normalsaccades [37]. Thus, the abnormal eye movements of ourpatient are unlikely to arise from a low inhibition onthe colliculus from the SNr and we favor a cerebellarorigin.
The second deficit we tried to reproduce with themodel was the dynamic overshoot of the patient. Opticanand colleagues have proposed that the ipsilateral cere-bellar discharge is responsible for stopping the saccadethrough a choke signal sent to the contralateral EBN andIBN [13,14]. Hence, to model the dynamic overshoot ofour patient, we increased the maximum discharge of theipsilateral cerebellar discharge and triggered its activitysooner. These changes increased the choke drive sent tothe contralateral EBN and IBN and reversed the directionof the saccade. Thus, the dynamic overshoot of our patientcan also be explained by cerebellar dysfunction.
The third deficit of our patient that our model soughtto simulate was her asymmetrical post-saccadic drifting

Daye et al. Journal of Translational Medicine 2013, 11:125 Page 12 of 14http://www.translational-medicine.com/content/11/1/125
behavior. We changed unilaterally the gain of EBN andIBN projections at the input of the right abducens nucleusand by slightly increasing bilaterally the NPH time con-stant to reproduce the drift. The NPH changes reflect apathological neural integrator that could be explained bya loss of compensation by the cerebellum [34,38,39].
Thus, the first three deficits in this patient could beaccounted for by changing a minimal subset of modelparameters, all of which could be linked to a cerebellarproblem.
Finally, we showed how a simple decrease of the inputgain of the OPN allowed us to reproduce the oscillatorybehavior of the patient (her fourth deficit). (As pointedout in the result, we chose a sustained oscillation as anexample because they are harder to generate.) If one wantsto stop the oscillations sooner, it can easily be done byrestoring the input gain to its normal state. The change ofthe input gain can reflect either a deficit of the OPN or adeficit of the excitatory drive sent to the OPN to reacti-vate them. It is known that the OPN receive projectionsfrom the superior colliculus [40-42] and from the cere-bellum [13,14]. Consequently, if one or both of those twostructures does not send an appropriate signal to the OPN,they will not be reactivated and an oscillation will be trig-gered. Therefore, the oscillations may be attributable to acerebellar dysfunction.
In the present study, the first step was to acquireaccurate recordings for analysis and identification of thepatient’s ocular motor impairments, especially when thosecould not be easily identified by a clinical examination(such as increased leftward saccade velocities, dynamicovershoot and saccadic oscillations). In the next steps,the model simulation showed that the entire ocularmotor behavior could be reproduced by the alterationof intra-cerebellar structures. This result is consistentwith the marked cerebellar syndrome exhibited by ourpatient. A second interesting outcome of this simula-tion was that this diverse ocular motor behavior couldbe induced by subtle adjustments of a limited number ofparameters.
Our model reproduces the key abnormal saccadic ocu-lar motor deficits of our patient, even though it was builtwith some limitations in mind. We did not include sim-ulations of saccades smaller than one degree because wedid not have enough data to analyze the behavior of ourpatient for such small amplitudes. A second simplifica-tion comes from the constant saccadic gain over the wholerange of amplitudes. Adding a dependency of the saccadicgain as a function of amplitude would not help us linka neural deficit to the patient’s behavior. Therefore, wedecided to simplify the amplitude vs. gain relationship asa constant. In addition, the model of the cortex is verysimple. However, the brainstem connectivity reproducesas closely as possible (for a lumped model) the known
anatomical connectivity and the functions of the ocularmotor brainstem. This level of detail in the model wassufficient to reproduce the patient’s behavior. Therefore,we think that it could be used also to reproduce othersaccade-related dysfunctions (congenital nystagmus, sac-cadic intrusions, etc) that do not depend on defects inthe cerebrum. Thus, our cortical model is adequate toserve its sole purpose: sending desired saccade displace-ments to the subcortical areas involved in the controlof saccade trajectory. Other models have been proposedthat include more functionally detailed cortical areas thattrigger saccades and pursuit movements [43-50]. Thosemodels provided assumptions on the mechanisms fromwhich arise gaze-evoked nystagmus [43], myasthenic dis-ease [44], latent/manifest latent nystagmus [45] and con-genital nystagmus [46-50]. They also provided predictionson the patient’s behavior on the interactions between sac-cades, pursuit and fixation. Although they reproduce a lotof complex functions, they do not incorporate an accu-rate description of the bilateral ocular motor brainstemconnectivity and a model of neuron behavior. Therefore,a major difference arises between our new model (andthe models of [4,6,8]) and more functionally-built models[43-50] in that the properties of the saccadic movementsemerge from the connectivity, not from the design ofthe functions included in the model. We think that theseapproaches are complimentary.
In conclusion, a lumped neuromimetic model of brain-stem eye movement circuitry enabled us to propose thatall of this patient’s diverse deficits could be localized toa single structure, the cerebellum. Future work should beaimed at extending such models to include other functionsin other parts of the brain, while maintaining the simplic-ity of interpretation given by the lumped circuitry. Suchmodels would have further specificity and increase theirutility in clinical diagnosis.
EndnoteaFor the sake of simplicity, “contralateral (ipsilateral)”
will be used instead of “contralateral (ipsilateral) to thesaccade” in the rest of the text.
Competing interestsThe authors declare that they have no competing interests.
Authors’ contributionsPMD and LMO made the analyses, built the model, made the graphs, wrotethe methods and results sections. BG and ER diagnosed the patient, recordedher eye movements, wrote the discussion and reviewed the document. PPwrote the introduction and reviewed the document. All authors read andapproved the final manuscript.
Author details1Laboratory of Sensorimotor Research, National Institutes of Health, Bethesda,Maryland. 2Pierre et Marie Curie Paris-6 University, INSERM UMRS 975, CNRS7225, Paris, France. 3Assistance Publique Hôpitaux de Paris (AP-HP),Department of Neurology, Pitié-Salpêtrière Hospital, Paris, France.

Daye et al. Journal of Translational Medicine 2013, 11:125 Page 13 of 14http://www.translational-medicine.com/content/11/1/125
Received: 6 February 2013 Accepted: 15 May 2013Published: 22 May 2013
References1. Leigh R, Zee D: The neurology of eye movements, Volume 70. New York:
Oxford University Press; 2006.2. Koh S, Kim S: Ocular flutter induced only by optokinetic stimulation. J
Clin Neurosci 2006, 13(4):479–481.3. Hain T, Zee D, Mordes M: Blink-induced saccadic oscillations. Ann
Neurol 1986, 19(3):299–301.4. Shaikh AG, Miura K, Optican LM, Ramat S, Leigh RJ, Zee DS: A new
familial disease of saccadic oscillations and limb tremor providesclues to mechanisms of common tremor disorders. Brain 2007,130(11):3020–3031.
5. Zee D, Robinson D: A hypothetical explanation of saccadicoscillations. Ann Neurol 1979, 5(5):405–414.
6. Ramat S, Leigh R, Zee D, Optican L: Ocular oscillations generated bycoupling of brainstem excitatory and inhibitory saccadic burstneurons. Exp Brain Res 2005, 160:89–106.
7. Enderle J, Engelken E: Simulation of oculomotor post-inhibitoryrebound burst firing using a Hodgkin-Huxley model of a neuron.Biomed Sci Instrum 1995, 31:53.
8. Miura K, Optican LM: Membrane channel properties of premotorexcitatory burst neurons may underlie saccade slowing after lesionsof omnipause neurons. J Comput Neurosci 2006, 20:25–41.
9. Missal M, Keller E: Common inhibitory mechanism for saccades andsmooth-pursuit eye movements. J Neurophysiol 2002, 88(4):1880–1892.
10. Daye PM, Blohm G, Lefèvre P: Saccadic compensation for smooth eyeand head movements during head-unrestrained two-dimensionaltracking. J Neurophysiol 2010, 103:543–556.
11. Daye PM, Blohm G, Lefevre P: Target motion direction influence ontracking performance and head tracking strategies inhead-unrestrained conditions. J Vis 2012 , 12:1–2.
12. Clogg C, Petkova E, Haritou A: Statistical methods for comparingregression coefficients between models. AJS 1995 , 100(5):1261–1293.
13. Lefèvre P, Quaia C, Optican L: Distributed model of control of saccadesby superior colliculus and cerebellum. Neural Netw 1998,11(7–8):1175–1190.
14. Quaia C, Lefèvre P, Optican L: Model of the control of saccades bysuperior colliculus and cerebellum. J Neurophysiol 1999,82(2):999–1018.
15. Scudder CA, Fuchs AF, Langer TP: Characteristics and functionalidentification of saccadic inhibitory burst neurons in the alertmonkey. J Neurophysiol 1988, 59(5):1430–1454.
16. Becker W, Fuchs A: Further properties of the human saccadic system:eye movements and correction saccades with and without visualfixation points. Vision Res 1969, 9(10):1247–1258.
17. Munoz D, Wurtz R: Fixation cells in monkey superior colliculus. I.Characteristics of cell discharge. J Neurophysiol 1993, 70(2):559–575.
18. Hafed Z, Goffart L, Krauzlis R: A neural mechanism for microsaccadegeneration in the primate superior colliculus. Science 2009,323(5916):940–943.
19. Wurtz R, Goldberg M: Activity of superior colliculus in behavingmonkey. III. Cells discharging before eye movements. J Neurophysiol1972, 35(4):575–586.
20. Baker R, Precht W, Llinas R: Mossy and climbing fiber projections ofextraocular muscle afferents to the cerebellum. Brain Res 1972,38(2):440.
21. Buchtel H, Iosif G, Marchesi G, Provini L, Strata P: Analysis of the activityevoked in the cerebellar cortex by stimulation of the visualpathways. Exp Brain Res 1972, 15(3):278–288.
22. Langer T, Fuchs A, Scudder C, Chubb M, et al: Afferents to the flocculusof the cerebellum in the rhesus macaque as revealed by retrogradetransport of horseradish peroxidase. J Comp Neurol 1985, 235:1–25.
23. Bahill A, Clark M, Stark L: The main sequence, a tool for studyinghuman eye movements. Math Biosci 1975, 24(3–4):191–204.
24. Bahill A, Brockenbrough A, Troost B: Variability and development of anormative data base for saccadic eye movements. Invest OphthalmolVis Sci 1981, 21:116–125.
25. Gonzalo-Ruiz A, Leichnetz G: Collateralization of cerebellar efferentprojections to the paraoculomotor region, superior colliculus, andmedial pontine reticular formation in the rat: a fluorescentdouble-labeling study. Exp Brain Res 1987, 68(2):365–378.
26. Gayer N, Faull R: Connections of the paraflocculus of the cerebellumwith the superior colliculus in the rat brain. Brain Res 1988,449:253–270.
27. Niemi-Junkola U, Westby G: Cerebellar output exerts spatiallyorganized influence on neural responses in the rat superiorcolliculus. Neuroscience 2000, 97(3):565–573.
28. May P, Hall W: The cerebellotectal pathway in the grey squirrel. ExpBrain Res 1986, 65:200–212.
29. Shinoda Y, Sugiuchi Y, Takahashi M, Izawa Y: Neural substrate forsuppression of omnipause neurons at the onset of saccades. Ann N YAcad Sci 2011, 1233:100–106.
30. Lopez-Barneo J, Darlot C, Berthoz A, Baker R: Neuronal activity inprepositus nucleus correlated with eye movement in the alert cat. JNeurophysiol 1982, 47(2):329–352.
31. McFarland J, Fuchs A: Discharge patterns in nucleus prepositushypoglossi and adjacent medial vestibular nucleus duringhorizontal eye movement in behaving macaques. J Neurophysiol1992, 68:319–332.
32. Robinson D: Integrating with neurons. Annu Rev Neurosci 1989,12:33–45.
33. Cannon S, Robinson D: Loss of the neural integrator of theoculomotor system from brain stem lesions in monkey. JNeurophysiol 1987, 57(5):1383–1409.
34. Zee D, Yamazaki A, Butler P, Gucer G: Effects of ablation of flocculusand paraflocculus of eye movements in primate. J Neurophysiol 1981,46(4):878–899.
35. Optican L, Robinson D: Cerebellar-dependent adaptive control ofprimate saccadic system. J Neurophysiol 1980, 44(6):1058–1076.
36. Hikosaka O, Wurtz R, et al: Visual and oculomotor functions of monkeysubstantia nigra pars reticulata. IV. Relation of substantia nigra tosuperior colliculus. J Neurophysiol 1983, 49(5):1285–1301.
37. Vidailhet M, Rivaud S, Gouider-Khouja N, Pillon B, Bonnet A, Gaymard B,Agid Y, Pierrot-Deseilligny C: Eye movements in parkinsoniansyndromes. Ann Neurol 2004, 35(4):420–426.
38. Robinson D: The effect of cerebellectomy on the cat’svestibulo-ocular integrator. Brain Res 1974, 71(2):195–207.
39. Chelazzi L, Ghirardi M, Rossi F, Strata P, Tempia F: Spontaneous saccadesand gaze-holding ability in the pigmented Rat. II. Effects of localizedcerebellar lesions. Eur J Neurosci 2006, 2(12):1085–1094.
40. Langer T, Kaneko C: Brainstem afferents to the omnipause region inthe cat: a horseradish peroxidase study. J Comp Neurol 1984,230(3):444–458.
41. Fuchs A, Kaneko C, Scudder C: Brainstem control of saccadic eyemovements. Annu Rev Neurosci 1985, 8:307–337.
42. Scudder C, Moschovakis A, Karabelas A, Highstein S: Anatomy andphysiology of saccadic long-lead burst neurons recorded in thealert squirrel monkey. I. Descending projections from themesencephalon. J Neurophysiol 1996, 76:332–352.
43. Abel L, Dell’osso LF, Daroff R: Analog model for gaze-evokednystagmus. Biomed Eng, IEEE Trans 1978 , BME-25(1):71–75.
44. Abel L, Dell’Osso L, Schmidt D, Daroff R: Myasthenia gravis: analogcomputer model. Exp Neurol 1980, 68(2):378–389.
45. Dell’Osso L, Jacobs J: A normal ocular motor system model thatsimulates the dual-mode fast phases of latent/manifest latentnystagmus. Biol Cybern 2001, 85(6):459–471.
46. Jacobs JB, Dell’Osso LF: Congenital nystagmus: hypotheses for itsgenesis and complex waveforms within a behavioral ocular motorsystem model. J Vis 2004, 4 (7):604-625.
47. Wang Z, Dell’Osso L: Being" slow to see" is a dynamic visual functionconsequence of infantile nystagmus syndrome: Model predictionsand patient data identify stimulus timing as its cause. Vision Res 2007,47(11):1550.
48. Wang Z, Dell’Osso L: Tenotomy procedure alleviates the “slow tosee”I phenomenon in infantile nystagmus syndrome: modelprediction and patient data. Vision Res 2008, 48(12):1409–1419.

Daye et al. Journal of Translational Medicine 2013, 11:125 Page 14 of 14http://www.translational-medicine.com/content/11/1/125
49. Wang Z, Dell’Osso L: Factors influencing pursuit ability in infantilenystagmus syndrome: Target timing and foveation capability. VisionRes 2009, 49(2):182–189.
50. Wang Z, DellâAZOsso L: A unifying model-based hypothesis for thediverse waveforms of infantile nystagmus syndrome. J Eye Mov Res2011, 4:1–18.
doi:10.1186/1479-5876-11-125Cite this article as: Daye et al.: Neuromimetic model of saccades for localiz-ing deficits in an atypical eye-movement pathology. Journal of TranslationalMedicine 2013 11:125.
Submit your next manuscript to BioMed Centraland take full advantage of:
• Convenient online submission
• Thorough peer review
• No space constraints or color figure charges
• Immediate publication on acceptance
• Inclusion in PubMed, CAS, Scopus and Google Scholar
• Research which is freely available for redistribution
Submit your manuscript at www.biomedcentral.com/submit