Embed Size (px)
Citation preview
Chebouba et al. BMC Bioinformatics 2018, 19(Suppl 2):59https://doi.org/10.1186/s12859-018-2034-4
RESEARCH Open Access
Discriminate the response of AcuteMyeloid Leukemia patients to treatment byusing proteomics data and Answer SetProgrammingLokmane Chebouba1,2, Bertrand Miannay2, Dalila Boughaci1 and Carito Guziolowski2*
From Bringing Maths to Life 2017Naples, Italy. 07-09 June 2017
Abstract
Background: During the last years, several approaches were applied on biomedical data to detect disease specificproteins and genes in order to better target drugs. It was shown that statistical and machine learning based methodsuse mainly clinical data and improve later their results by adding omics data. This work proposes a new method todiscriminate the response of Acute Myeloid Leukemia (AML) patients to treatment. The proposed approach usesproteomics data and prior regulatory knowledge in the form of networks to predict cancer treatment outcomes byfinding out the different Boolean networks specific to each type of response to drugs. To show its effectiveness weevaluate our method on a dataset from the DREAM 9 challenge.
Results: The results are encouraging and demonstrate the benefit of our approach to distinguish patient groupswith different response to treatment. In particular each treatment response group is characterized by a predictivemodel in the form of a signaling Boolean network. This model describes regulatory mechanisms which are specific toeach response group. The proteins in this model were selected from the complete dataset by imposing optimizationconstraints that maximize the difference in the logical response of the Boolean network associated to each group ofpatients given the omic dataset. This mechanistic and predictive model also allow us to classify new patients data intothe two different patient response groups.
Conclusions: We propose a new method to detect the most relevant proteins for understanding different patientresponses upon treatments in order to better target drugs using a Prior Knowledge Network and proteomics data.The results are interesting and show the effectiveness of our method.
Keywords: AML, Answer Set Programming, Boolean network, Proteomics data
BackgroundOnly one quarter of Acute Myeloid Leukemia (AML)diagnosed patients survive beyond 5 years. It is there-fore worth exploring how mathematical modeling maycontribute on a shift towards a more personalized fol-low up treatment for AML diagnosed patients. On thiscontext, a prediction of the treatment response of AML
*Correspondence: [email protected], UMR 6004, École Centrale de Nantes, Nantes, FranceFull list of author information is available at the end of the article
patients, solely based on proteomic data, may add valu-able information and improve clinical decisions. In 2014the DREAM 9 challenge was launched in order to pre-dict the complete remission (CR) and primary resistant(PR) response to chemotherapy of 191 AML patients fromtheir proteomics data (231 measured proteins) and from40 clinical data [1]. In several studies analyzing AML data[1–4] it was found that proteomic data is less discrim-inant than clinical data to predict patients’ response. Inthe Dream 9 challenge all methods used in a first attempt
© The Author(s). 2018 Open Access This article is distributed under the terms of the Creative Commons Attribution 4.0International License (http://creativecommons.org/licenses/by/4.0/), which permits unrestricted use, distribution, andreproduction in any medium, provided you give appropriate credit to the original author(s) and the source, provide a link to theCreative Commons license, and indicate if changes were made. The Creative Commons Public Domain Dedication waiver(http://creativecommons.org/publicdomain/zero/1.0/) applies to the data made available in this article, unless otherwise stated.
Chebouba et al. BMC Bioinformatics 2018, 19(Suppl 2):59 Page 16 of 54
clinical data to discriminate patients’ response, and ina second attempt the 2 best performing methods usedproteomic data to improve their prediction accuracy. Asmall set of proteins was considered to have a signifi-cant impact: PIK3CA, GSKAB, PTEN and NPM1. In [5]the authors proposed a biomarker detection method forthe Dream 9 challenge data, which combines a machinelearning framework with prior knowledge concerning theevolutionary conservation of the selected biomarkers. Intheir work they agree with previous studies on the lowdiscriminant power of proteomic data: only two discrim-inant features came from proteomic data (PIK3CA andGSK3) and the rest were taken from the bio-clinical data.In this work, we propose a method to answer to theDREAM 9 challenge by including as prior informationsignaling networks. Even if the task of compiling signal-ing networks may be considered time demanding, manypublicly available resources containing regulatory infor-mation currently exist such as KEGG [6], Reactome [7, 8],Pathway Commons [9], OmniPath [10] and NDEX [11].Some of these resources have available tools or Cytoscape[12] plug-ins to extract networks given a list of molecules,such as ReactomeFIViz [13] for Reactome, CyPath2 [14]for Pathway Commons and PyPath [15] for OmniPath.Therefore, in this work we aim to understand the impactof using a mathematical model built over a signaling net-work, automatically retrieved from the KEGG database,associating the measured proteins on the prediction ofCR-PR classes of patients’ response.
Patients’ response classification is usually approachedby methods that find statistically significant markers fromthe transcriptomic or proteomic data at hand. A classicalmethod used for this is univariate and multivariate Coxproportional hazards analyses. Following such approach,several statistic [16, 17] and machine learning [18–20]methods conceived for significant features extraction havebeen applied to this problem. This was the case for mostof the best performing methods in the Dream 9 challenge.More recent approaches include the notion of pathwaysin this drug detection problem [21]. Such methods allowidentifying the regulatory mechanisms related to the bestdrug targets [22] and this mechanistical information isvaluable to understand the disease and the complexityof drug targeting. We have introduced in [23] the caspomethod, which learns BNs from phosphoproteomic mul-tiple perturbation data by using Logic Programming. Thisframework allows us to retrieve families of logic modelshaving the best fit to the experimental data from exhaus-tive searches over a large-scale prior signaling network. Inthis work we make use of caspo. Experimentally, however,multiple perturbation data needed for caspo is impossibleto obtain for patients. For this reason we have introduceda logic programming based approach to select subsets ofproteins in the form of multiple perturbation experiments
from static proteomics measurements that can allow usto maximize the discrimination between the two responsetype patients.
Following a parallel path to other Dream 9 challengeapproaches, in this work we focused mainly on the pro-teomics data ignoring clinical data. We make this choiceto discover discriminating signaling mechanisms. Ourresults show that 34 proteins were significant to build dis-criminant logic models of both classes of patients. Weobtained the mechanisms and Boolean gates that bestexplained both type of data. Interestingly, several proteinsare key in these models. Despite having two common pro-teins (ERBB3 and IGF1R), the Boolean networks presentdifferent interconnections among different proteins in thecase of models that explain a CR response (FN1, SMAD6,LEF1, ERBB3, IGF1R, MAPK9, STMN1, GAPDH) andthose that explain a PR response (FN1, YAP1, STK11,ERBB3, IGF1R, CASP9, CASP3, BAK1, TSC2, PTGS2).The PIK3CA and PTEN proteins, also reported in thepreviously DREAM 9 challenge cited methods, were alsodiscovered by our approach, as intermediate nodes withinthe Boolean models.
When compared to the Dream challenge 100 patientstesting dataset, the accuracy of the learned BNs was of42%; this accuracy improves to 55% when selecting onlypatients where the measurements had strong signals. Theaccuracy obtained for the CR class, 64.7% (72.2% forstrong signals) was greater than the one obtained for thePR class, 18.3% (27.2% for strong signals). In [1] it wasfound the same difference in the accuracy reported for dif-ferent patient response groups (median accuracy of 73%for CR and 42% for PR); however, in that study the authorsused the 40 bioclinical variables and only 4 protein mea-surements without considering the signaling mechanismsthat explain this difference.
MethodOur method consists of four main steps. First, we startwith the creation of a Prior Knowledge Network (PKN)from public databases that connects the 231 measuredproteins. In this PKN we distinguished 3 types of nodes:stimuli, inhibitors and readouts. By stimuli we refer to theentry-layer of the network (nodes without predecessors);readouts, to the output-layer of the network (nodes with-out successors); and inhibitors, to proteins in between theentry and output-layers. The second step is the imple-mentation of a logic program based on Answer Set Pro-gramming for proteins and patients selection. This logicprogram selects a group of k stimuli and inhibitor pro-teins that maximize the number of pairs of patients forwhich the binarized values of their experimental measuresmatched in both classes (CR, PR). In the third step we usedthe reduced dataset (composed of previously selected pro-teins and patients) to learn the Boolean networks (BNs)
Chebouba et al. BMC Bioinformatics 2018, 19(Suppl 2):59 Page 17 of 54
with the caspo software [24]. This step produces two fam-ilies of BNs for the two response classes (CR and PR). Ourobjective here was to learn different families of BNs byusing the identical stimuli-inhibitor cases and the max-imal difference of readouts measures for each class andfinally compare the structure and mechanisms betweenthese BNs families. The final step is the classificationstep in which we compute the Mean Square Error (MSE)between measured readouts and predicted readouts for
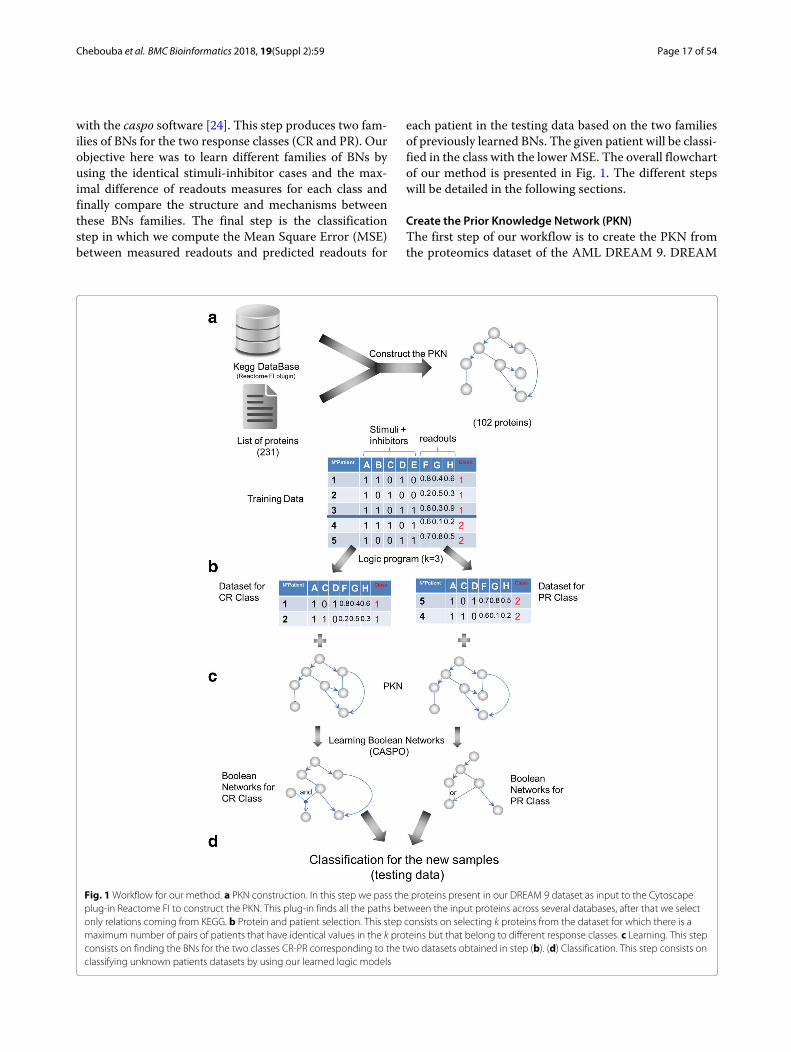
each patient in the testing data based on the two familiesof previously learned BNs. The given patient will be classi-fied in the class with the lower MSE. The overall flowchartof our method is presented in Fig. 1. The different stepswill be detailed in the following sections.
Create the Prior Knowledge Network (PKN)The first step of our workflow is to create the PKN fromthe proteomics dataset of the AML DREAM 9. DREAM
Fig. 1 Workflow for our method. a PKN construction. In this step we pass the proteins present in our DREAM 9 dataset as input to the Cytoscapeplug-in Reactome FI to construct the PKN. This plug-in finds all the paths between the input proteins across several databases, after that we selectonly relations coming from KEGG. b Protein and patient selection. This step consists on selecting k proteins from the dataset for which there is amaximum number of pairs of patients that have identical values in the k proteins but that belong to different response classes. c Learning. This stepconsists on finding the BNs for the two classes CR-PR corresponding to the two datasets obtained in step (b). (d) Classification. This step consists onclassifying unknown patients datasets by using our learned logic models
Chebouba et al. BMC Bioinformatics 2018, 19(Suppl 2):59 Page 18 of 54
challenges are crowd-sourcing challenges where biolo-gists provide experimental data related to a particular andprecise biological problematic and mathematicians, physi-cians and computer scientists develop methods to answerto the biological question.
Data description. The data consists of measurementsof 191 patients diagnosed with AML who were treatedat MD Anderson Cancer Center (USA). Each patienthas 40 bio-clinical data measures and 231 protein lev-els measured using RPPA (Reversed Phase Protein Array).The patients are classified in two classes following theirresponse to treatments: Complete Remission (CR), forpatients with a good treatment response and PrimaryResistant (PR), for patients with a bad treatment response.
Network construction. We construct the PKN by usingthe KEGG database [6] through Reactome FI [7, 25]which is a Cytoscape plug-in that queries several path-way databases, containing pathways and network pat-terns related to cancer and other types of diseases,such as Reactome and KEGG (see Fig. 1a). The plug-in connects the set of user-provided genes to buildthe PKN, representing each gene by a node, and eachinteraction between nodes by a signed arrow. We dis-tinguish 3 types of nodes which are important for ourmodeling assumptions: stimuli, inhibitors, and readouts.Stimuli are nodes with no predecessors, readouts ormeasured nodes have no successors, and inhibitors, arenodes that connect stimuli to readouts. For our analy-ses we selected the KEGG’s interactions, since we foundthem semantically (expressing directionality and type ofthe interaction) more precise for our study than thosein Reactome.
Proteins and patients selectionThe first step is data preprocessing. Since our model-ing framework, caspo, aims to establish BNs that explainexperimental measures, the proteomics data needs to bedivided into input and output measures. caspo receives asinput a list of perturbation data. Perturbation experimentsare provided as Boolean values (stimulated or inhibited),while perturbation results are provided as continuous val-ues in [ 0, 1]. caspo will afterwards learn which BNs answerthe input-output relation of the perturbation data. There-fore, for the input data (stimuli and inhibitor nodes), wediscretized the proteomics data by using the k-meansalgorithm [26]. In this way we classified all the measure-ments into two clusters centered in {0, 1} values; then weused the associated cluster for each value of the input datato select the class. See Eq. (1).
if(1 − aij
) ≤ 0.5 then 1 else 0. (1)
we denote as aij the discretized value of the stimuli orinhibitor protein i for patient j. For the output data (read-out nodes), we transformed each value of readout i for the
patient j in a normalized value in the interval of [0,1] byusing Eq. (2)
rij = r′ij − min
max − min(2)
where r′ij is the non normalized value of the readout i for
the patient j and min (resp. max) is the minimum (resp.maximum) value of all the readouts.
The second step is to conceive a logic program inAnswer Set Programming (ASP) [27, 28] that given theproteomics data (see Fig. 1b) with discretized measuresassigned to stimuli and inhibitors nodes, with normal-ized measures assigned to readout nodes, and wherestimuli-inhibitor-readout preprocessed values were clas-sified either into CR and PR patient classes, computes thefollowing:
1. Select a set K of proteins, composed of k proteinsfrom all combinations of stimuli and inhibitorsCk
|S|+|I|; where S and I represent the set of stimuliand inhibitor nodes respectively.
2. Select pairs of patients for which the discretizedvalues of the proteins in K match in both classes (CRand PR).
3. Maximize the number of pairs of patients belongingto different classes. See optimization (3).
4. Maximize the difference in the readouts (proteins in R)of the pairs of patients selected. See optimization (4).
maximize∑
j,j’∈CR×PRfK(j,j’)
subject to f K (j, j′) = 1 if aij = ai,j′∀i ∈ K
f K (j, j′) = 0 else.
(3)
maximizek
∑
(j,j’)∈Ak
|R|∑
i=1
∣∣∣rCRj
i − rPRj′i
∣∣∣
subject to Ak : one optimal set of (j,j’) pairsselection of Step 3.
(4)
From steps 1–3, the k proteins selection should max-imize the number of CR vs. PR cases in which theirdiscretized measures was identical. Step 4 is applied in thecase where multiple optimal selections of patients’ pairsare proposed in Step 3. For example if we have more thanone patient in the CR class that matches one or morepatients in the PR class. In this case we choose the pairof patients that maximizes the difference of the readoutnodes selected with the maximal CR vs. PR cases.
After presenting the general scheme of our method,now we provide details on its implementation in AnswerSet Programming (ASP). The declarative approaches suchas ASP are very suitable for selecting features that candifferentiate the patients response and obtaining an effi-cient enumeration of solutions by a solver.
Chebouba et al. BMC Bioinformatics 2018, 19(Suppl 2):59 Page 19 of 54
Proteins and patients selection - ASP implementationIn this section we provide an overview of the ASP programused for protein selection.
Listing 1 Dataset representation as logical facts1 node ( V1 ) . node ( V2 ) . node ( V3 ) .2 c l a s s ( c1 ) . c l a s s ( c2 ) .3 p e r t ( 1 , V1 , 0 , c1 ) . p e r t ( 1 , V2 , 1 , c1 ) . p e r t ( 1 , V3 , 0 , c1 ) .4 p e r t ( 2 , V1 , 0 , c2 ) . p e r t ( 2 , V2 , 1 , c2 ) . p e r t ( 2 , V3 , 0 , c2 ) .
In line 1, we represent the proteins V as facts over thepredicate node/1, namely node(v) for all v ∈ V / V are thenodes present in the PKN. In line 2, we represent the twoclasses of patients C1 for the class Complete Remissionand C2 for th class Primary Resistant as facts using thepredicate class/1. In lines 3–4, we represent pert(E,V,S,C)to say that the perturbation (experience or patient) num-ber (E) for the protein (V), is clamped to S, S ∈ {0,1}, andit belongs to the class C.
Listing 2 ASP Coding1 k { s e l p r o t (V ) : p e r t ( E , V , S , C ) } k .2 a f f ( E , V , S , C) :− s e l p r o t (V) , p e r t ( E , V , S , C ) .3 e g a l e ( I , J , V) :− a f f ( I , V , S1 , C1 ) , a f f ( J , V , S2 , C2 ) ,
C1<C2 , S1==S2 .4 c o u n t e g a l e ( I , J ,M) :− M={ e g a l e ( I , J , _ ) } ,
a f f ( I , _ , _ , C1 ) , a f f ( J , _ , _ , C2 ) , C1<C2 .5 a f f i n i t e ( I , J ) :− c o u n t e g a l e ( I , J , k ) ,
a f f ( I , _ , _ , C1 ) , a f f ( J , _ , _ , C2 ) , C1<C2 .6 # maximize { 1 , I : a f f i n i t e ( I , _ ) } .7 #show s e l p r o t / 1 .8 #show a f f i n i t e / 2 .
In line 1, we generate a set of k proteins with thepredicate selprot/1, from all the proteins present in theperturbations. In fact this predicate generates all the pos-sible ways to select k proteins from D, where D is the setcontaining all proteins of the DREAM 9 dataset. In line 2,we define the predicate aff/4 that expresses that the per-turbation (E) for the protein (V) in selprot/1, is clampedto S, S ∈ {0,1}, and it belongs to the class C. In line 3, weselect the pairs of perturbations that have the same val-ues in S (S1=S2), but belong to different classes of patientsC1 < C2. egale(I,J,V) expresses that the perturbation I andthe perturbation J belong to different classes and have thesame value at the protein V. In line 4, we count the numberof proteins where the perturbations I and J are equal, i.e.,we count the number of predicates egale(I,J,V). If the num-ber of proteins equal to k (selected above in line 1), thenwe can say that there is an affinity between experienceI and experience J, i.e. they are similar on all k selectedproteins. We represent that by the predicate affinity/1 asshown in the line 5. Finally, in line 6, we maximize thenumber of affinity/2, i.e. the number of cases where I andJ are similar and then we display the proteins (selprot/1)and affinities (affinity/2) found in lines 7–8.
For the sake of clarity we present the ASP code of themaximization of the readouts difference in the Additionalfile 1.
LearningThe result of the logic program are 2 reduced datasetsin the form of a matrix with the selected k proteins andoptimal number of patients. These 2 datasets have thesame number of patients, the same values of the (k) stim-uli and inhibitor proteins, and different readout values.Each dataset belongs to either the CR or PR class. Fromthese two files and the PKN we learned a family of BooleanNetworks (BNs) with caspo for each class of patients (seeFig. 1c). caspo is a Python and ASP software to learnBoolean Networks (BN) from multiple samples data and aPKN [24].
ClassificationIn order to predict the response to drugs for newpatients from our logic models, we proposed 2 validationapproaches (see Fig. 1d).
Method 1Given a dataset associated to a new patient, we pre-dict the value of the readout proteins in the new patientdataset from the two families of BNs learned in the pre-vious section and from the binarized values of the stimuliand inhibitor proteins in this new dataset. Afterwards, wecomputed the Mean Square Error (MSE) between the BNsprediction and the readout measurements. We classifiedthe patients to the class which had the lowest MSE.
Method 2This method may give an unknown answer to the classifi-cation problem for some patients datasets. New patientsdatasets are only considered for classification if the nor-malized value v of their readouts proteins has a significantmeasure (v < 0.25 or v > 0.6). If the patient is kept, thenwe classify the patient according to Method 1.
Instead of predicting a binary value (complete responseto therapy and achievement of remission or resistance totreatment), our method reports a value in [ 0, 1] expressingthe confidence that a patient will have a complete responseand achieve complete remission. A predicted value of1 indicates complete confidence that the patient willrespond well to therapy and achieve complete remission.A predicted value of 0 indicates a complete confidencethat the patient’s case will be resistant to treatment.
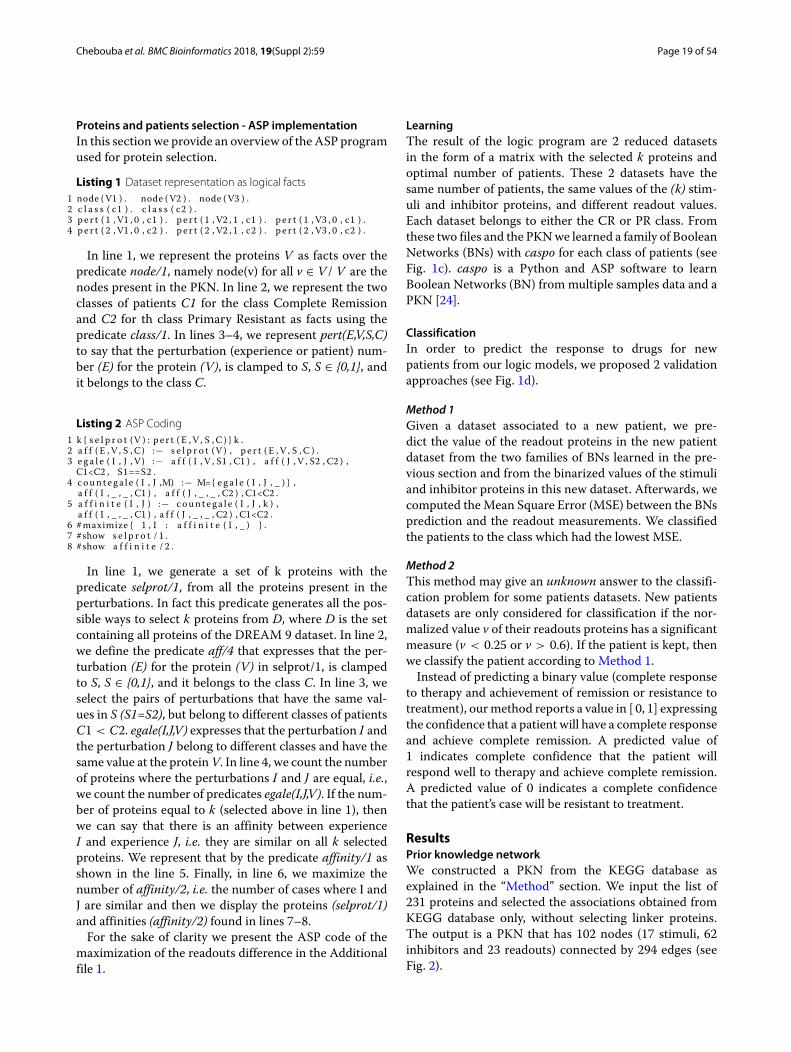
ResultsPrior knowledge networkWe constructed a PKN from the KEGG database asexplained in the “Method” section. We input the list of231 proteins and selected the associations obtained fromKEGG database only, without selecting linker proteins.The output is a PKN that has 102 nodes (17 stimuli, 62inhibitors and 23 readouts) connected by 294 edges (seeFig. 2).
Chebouba et al. BMC Bioinformatics 2018, 19(Suppl 2):59 Page 20 of 54
Fig. 2 The Prior Knowledge Network is constructed from the 102 proteins in the DREAM 9 challenge proteomics dataset that are documented inthe KEGG database. The dark- and light-green nodes are stimuli (nodes without predecessor), blue nodes are readouts (nodes without successors)and the red and pink nodes are inhibitors (rely the stimuli to readout nodes). Green arrows mean activation, red ones mean inhibition
Protein and patient selectionThe result of this step was a subset of k proteins extractedfrom the union of the stimuli and inhibitors present in thePKN (79 proteins). Our logic program was parametrizedto the value k, which choice was arbitrary. This valuehas impact on the following BN learning step. Choos-ing a larger k will allow us to build larger networks andtherefore larger logic models; however it may also implyless patient couples (experimental conditions) to learn andtherefore less data-specific models.
To choose the best value for k we run our algorithm ofprotein selection with different values. For each selected kwe compared the numbers of couples of patients (exper-imental conditions) obtained. In this analysis we deletedthe redundant couples by using the readout maximiza-tion described in the “Method” section and the Additionalfile 1. Since a couple is defined as a patient-to-patient
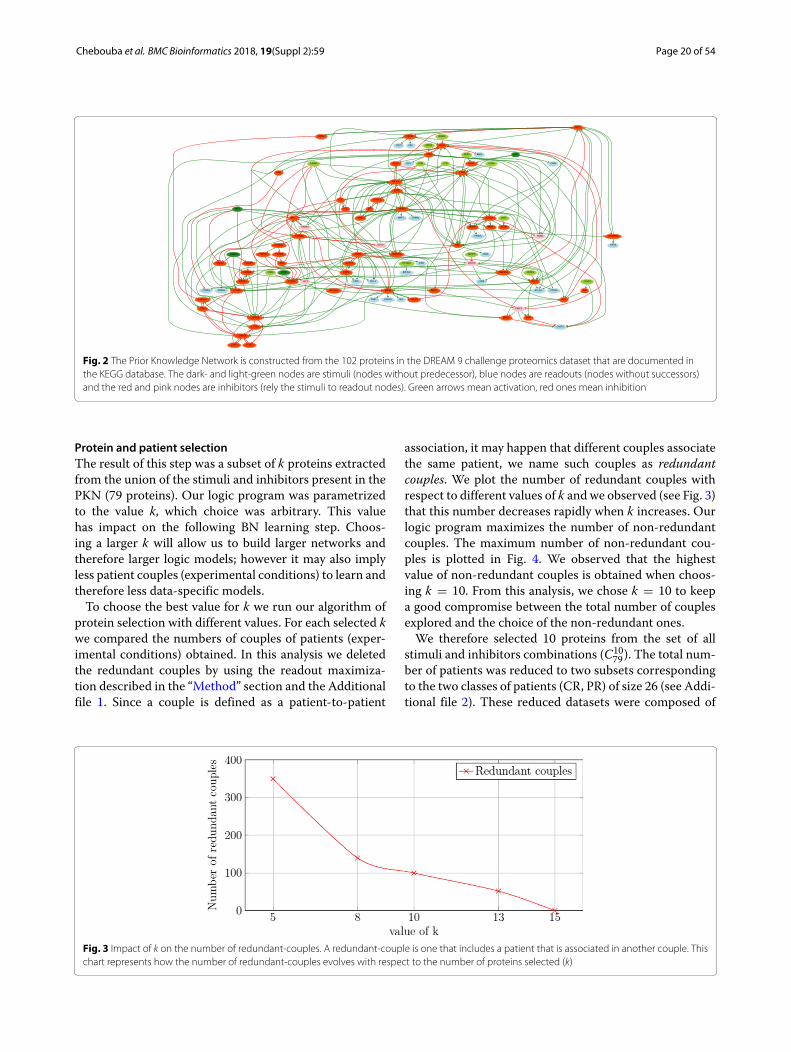
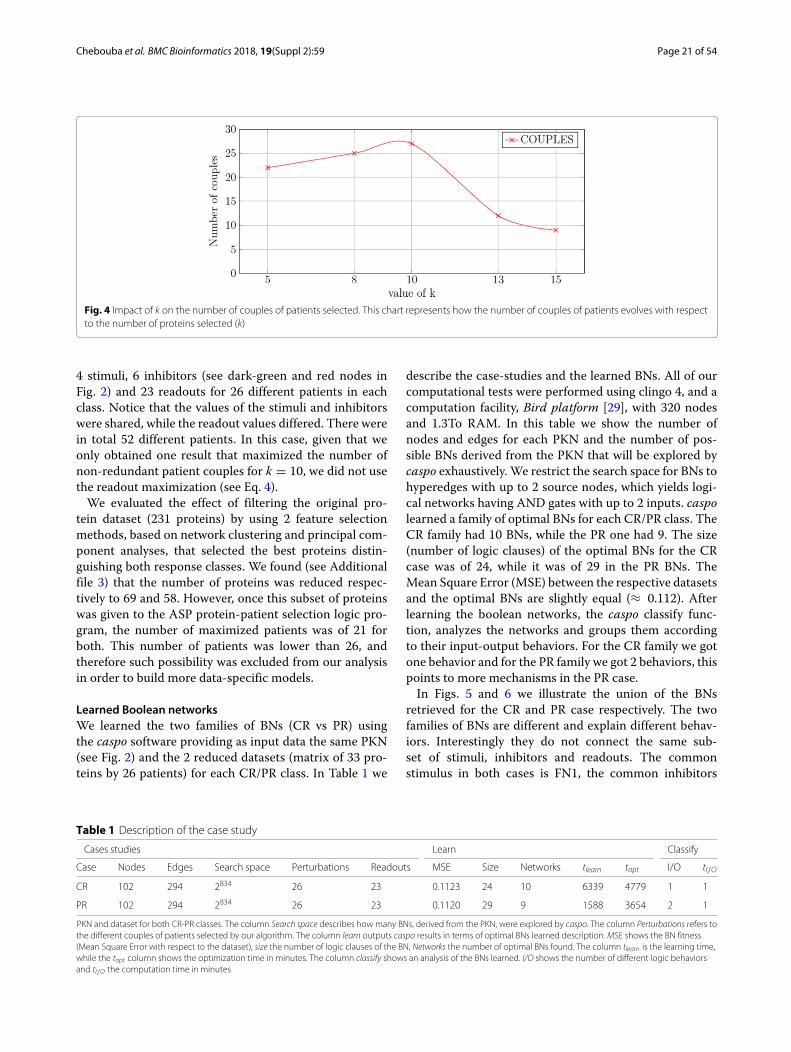
association, it may happen that different couples associatethe same patient, we name such couples as redundantcouples. We plot the number of redundant couples withrespect to different values of k and we observed (see Fig. 3)that this number decreases rapidly when k increases. Ourlogic program maximizes the number of non-redundantcouples. The maximum number of non-redundant cou-ples is plotted in Fig. 4. We observed that the highestvalue of non-redundant couples is obtained when choos-ing k = 10. From this analysis, we chose k = 10 to keepa good compromise between the total number of couplesexplored and the choice of the non-redundant ones.
We therefore selected 10 proteins from the set of allstimuli and inhibitors combinations (C10
79). The total num-ber of patients was reduced to two subsets correspondingto the two classes of patients (CR, PR) of size 26 (see Addi-tional file 2). These reduced datasets were composed of
Fig. 3 Impact of k on the number of redundant-couples. A redundant-couple is one that includes a patient that is associated in another couple. Thischart represents how the number of redundant-couples evolves with respect to the number of proteins selected (k)
Chebouba et al. BMC Bioinformatics 2018, 19(Suppl 2):59 Page 21 of 54
Fig. 4 Impact of k on the number of couples of patients selected. This chart represents how the number of couples of patients evolves with respectto the number of proteins selected (k)
4 stimuli, 6 inhibitors (see dark-green and red nodes inFig. 2) and 23 readouts for 26 different patients in eachclass. Notice that the values of the stimuli and inhibitorswere shared, while the readout values differed. There werein total 52 different patients. In this case, given that weonly obtained one result that maximized the number ofnon-redundant patient couples for k = 10, we did not usethe readout maximization (see Eq. 4).
We evaluated the effect of filtering the original pro-tein dataset (231 proteins) by using 2 feature selectionmethods, based on network clustering and principal com-ponent analyses, that selected the best proteins distin-guishing both response classes. We found (see Additionalfile 3) that the number of proteins was reduced respec-tively to 69 and 58. However, once this subset of proteinswas given to the ASP protein-patient selection logic pro-gram, the number of maximized patients was of 21 forboth. This number of patients was lower than 26, andtherefore such possibility was excluded from our analysisin order to build more data-specific models.
Learned Boolean networksWe learned the two families of BNs (CR vs PR) usingthe caspo software providing as input data the same PKN(see Fig. 2) and the 2 reduced datasets (matrix of 33 pro-teins by 26 patients) for each CR/PR class. In Table 1 we
describe the case-studies and the learned BNs. All of ourcomputational tests were performed using clingo 4, and acomputation facility, Bird platform [29], with 320 nodesand 1.3To RAM. In this table we show the number ofnodes and edges for each PKN and the number of pos-sible BNs derived from the PKN that will be explored bycaspo exhaustively. We restrict the search space for BNs tohyperedges with up to 2 source nodes, which yields logi-cal networks having AND gates with up to 2 inputs. caspolearned a family of optimal BNs for each CR/PR class. TheCR family had 10 BNs, while the PR one had 9. The size(number of logic clauses) of the optimal BNs for the CRcase was of 24, while it was of 29 in the PR BNs. TheMean Square Error (MSE) between the respective datasetsand the optimal BNs are slightly equal (≈ 0.112). Afterlearning the boolean networks, the caspo classify func-tion, analyzes the networks and groups them accordingto their input-output behaviors. For the CR family we gotone behavior and for the PR family we got 2 behaviors, thispoints to more mechanisms in the PR case.
In Figs. 5 and 6 we illustrate the union of the BNsretrieved for the CR and PR case respectively. The twofamilies of BNs are different and explain different behav-iors. Interestingly they do not connect the same sub-set of stimuli, inhibitors and readouts. The commonstimulus in both cases is FN1, the common inhibitors
Table 1 Description of the case study
Cases studies Learn Classify
Case Nodes Edges Search space Perturbations Readouts MSE Size Networks tlearn topt I/O tI/O
CR 102 294 2834 26 23 0.1123 24 10 6339 4779 1 1
PR 102 294 2834 26 23 0.1120 29 9 1588 3654 2 1
PKN and dataset for both CR-PR classes. The column Search space describes how many BNs, derived from the PKN, were explored by caspo. The column Perturbations refers tothe different couples of patients selected by our algorithm. The column learn outputs caspo results in terms of optimal BNs learned description. MSE shows the BN fitness(Mean Square Error with respect to the dataset), size the number of logic clauses of the BN, Networks the number of optimal BNs found. The column tlearn is the learning time,while the topt column shows the optimization time in minutes. The column classify shows an analysis of the BNs learned. I/O shows the number of different logic behaviorsand tI/O the computation time in minutes
Chebouba et al. BMC Bioinformatics 2018, 19(Suppl 2):59 Page 22 of 54
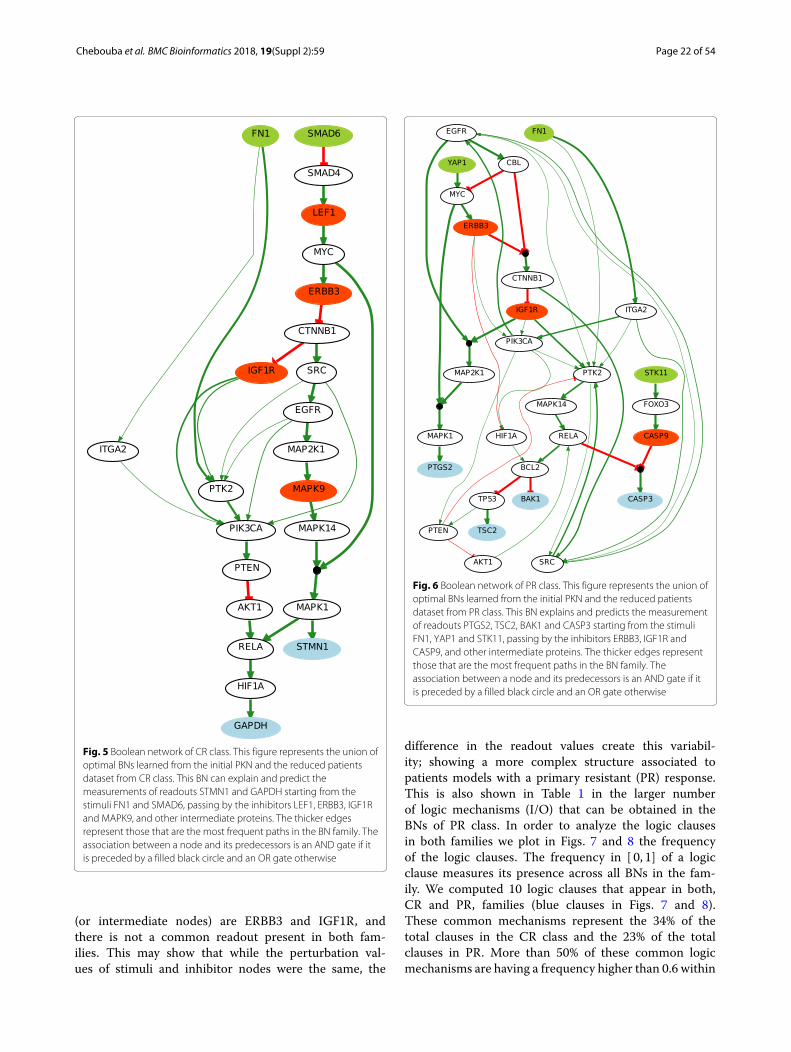
Fig. 5 Boolean network of CR class. This figure represents the union ofoptimal BNs learned from the initial PKN and the reduced patientsdataset from CR class. This BN can explain and predict themeasurements of readouts STMN1 and GAPDH starting from thestimuli FN1 and SMAD6, passing by the inhibitors LEF1, ERBB3, IGF1Rand MAPK9, and other intermediate proteins. The thicker edgesrepresent those that are the most frequent paths in the BN family. Theassociation between a node and its predecessors is an AND gate if itis preceded by a filled black circle and an OR gate otherwise
(or intermediate nodes) are ERBB3 and IGF1R, andthere is not a common readout present in both fam-ilies. This may show that while the perturbation val-ues of stimuli and inhibitor nodes were the same, the
Fig. 6 Boolean network of PR class. This figure represents the union ofoptimal BNs learned from the initial PKN and the reduced patientsdataset from PR class. This BN explains and predicts the measurementof readouts PTGS2, TSC2, BAK1 and CASP3 starting from the stimuliFN1, YAP1 and STK11, passing by the inhibitors ERBB3, IGF1R andCASP9, and other intermediate proteins. The thicker edges representthose that are the most frequent paths in the BN family. Theassociation between a node and its predecessors is an AND gate if itis preceded by a filled black circle and an OR gate otherwise
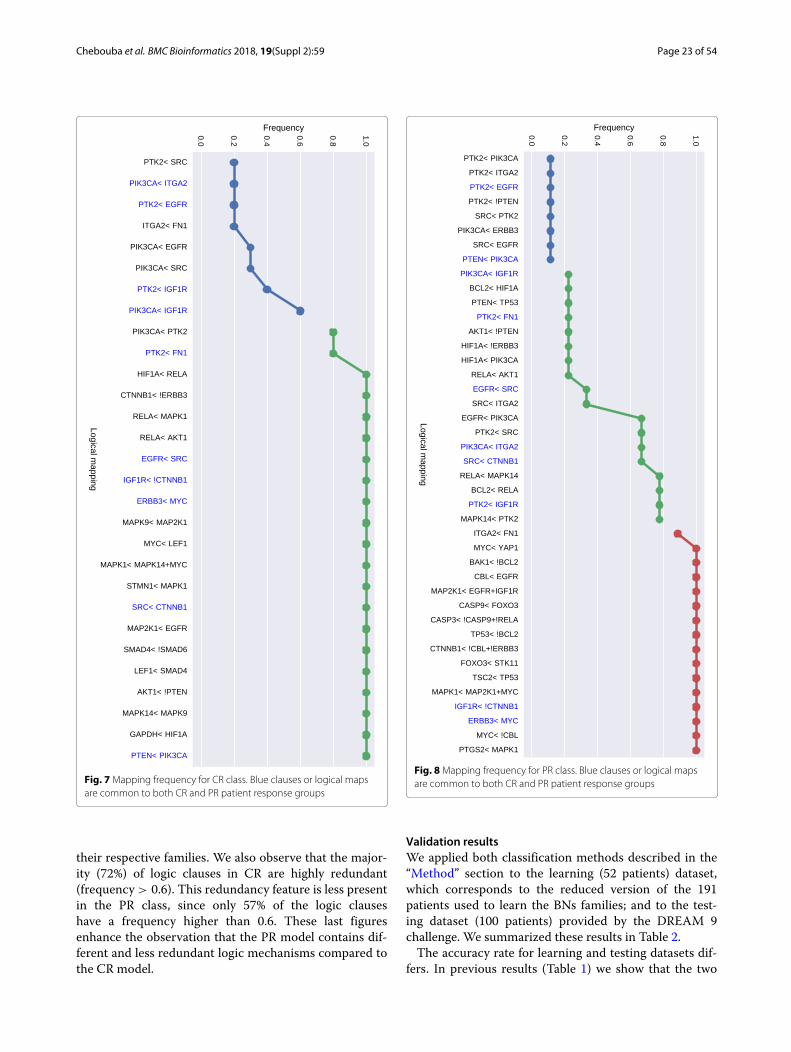
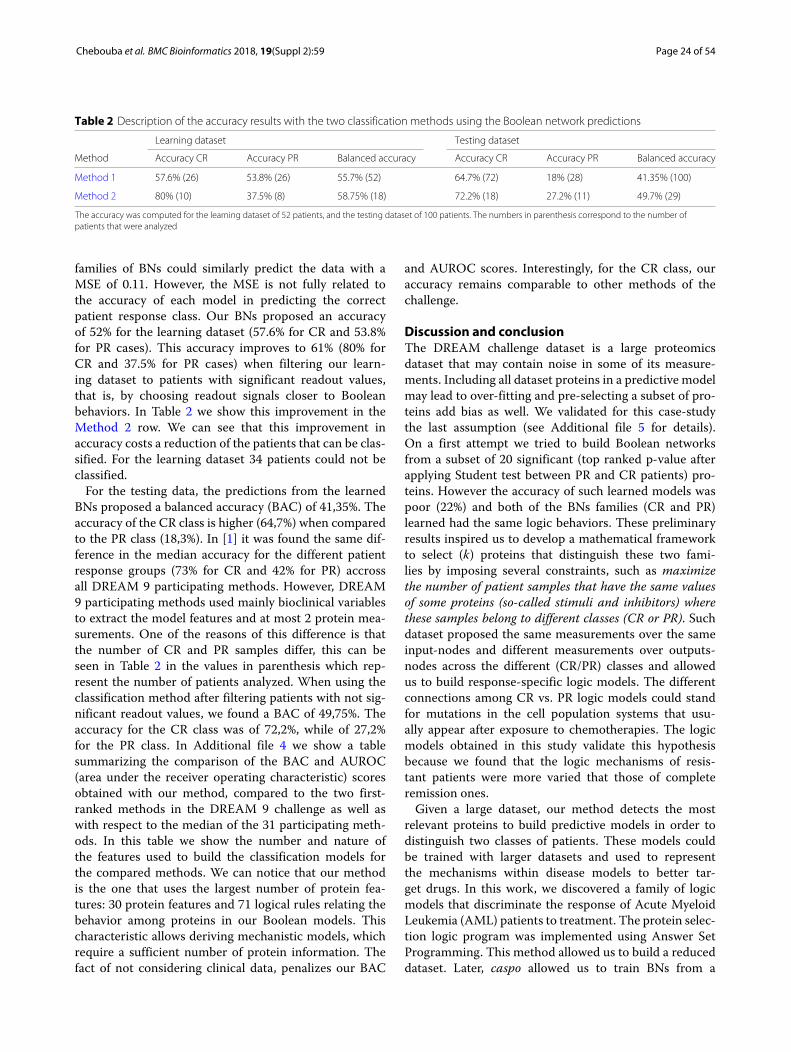
difference in the readout values create this variabil-ity; showing a more complex structure associated topatients models with a primary resistant (PR) response.This is also shown in Table 1 in the larger numberof logic mechanisms (I/O) that can be obtained in theBNs of PR class. In order to analyze the logic clausesin both families we plot in Figs. 7 and 8 the frequencyof the logic clauses. The frequency in [ 0, 1] of a logicclause measures its presence across all BNs in the fam-ily. We computed 10 logic clauses that appear in both,CR and PR, families (blue clauses in Figs. 7 and 8).These common mechanisms represent the 34% of thetotal clauses in the CR class and the 23% of the totalclauses in PR. More than 50% of these common logicmechanisms are having a frequency higher than 0.6 within
Chebouba et al. BMC Bioinformatics 2018, 19(Suppl 2):59 Page 23 of 54
Fig. 7 Mapping frequency for CR class. Blue clauses or logical mapsare common to both CR and PR patient response groups
their respective families. We also observe that the major-ity (72%) of logic clauses in CR are highly redundant(frequency > 0.6). This redundancy feature is less presentin the PR class, since only 57% of the logic clauseshave a frequency higher than 0.6. These last figuresenhance the observation that the PR model contains dif-ferent and less redundant logic mechanisms compared tothe CR model.
Fig. 8 Mapping frequency for PR class. Blue clauses or logical mapsare common to both CR and PR patient response groups
Validation resultsWe applied both classification methods described in the“Method” section to the learning (52 patients) dataset,which corresponds to the reduced version of the 191patients used to learn the BNs families; and to the test-ing dataset (100 patients) provided by the DREAM 9challenge. We summarized these results in Table 2.
The accuracy rate for learning and testing datasets dif-fers. In previous results (Table 1) we show that the two
Chebouba et al. BMC Bioinformatics 2018, 19(Suppl 2):59 Page 24 of 54
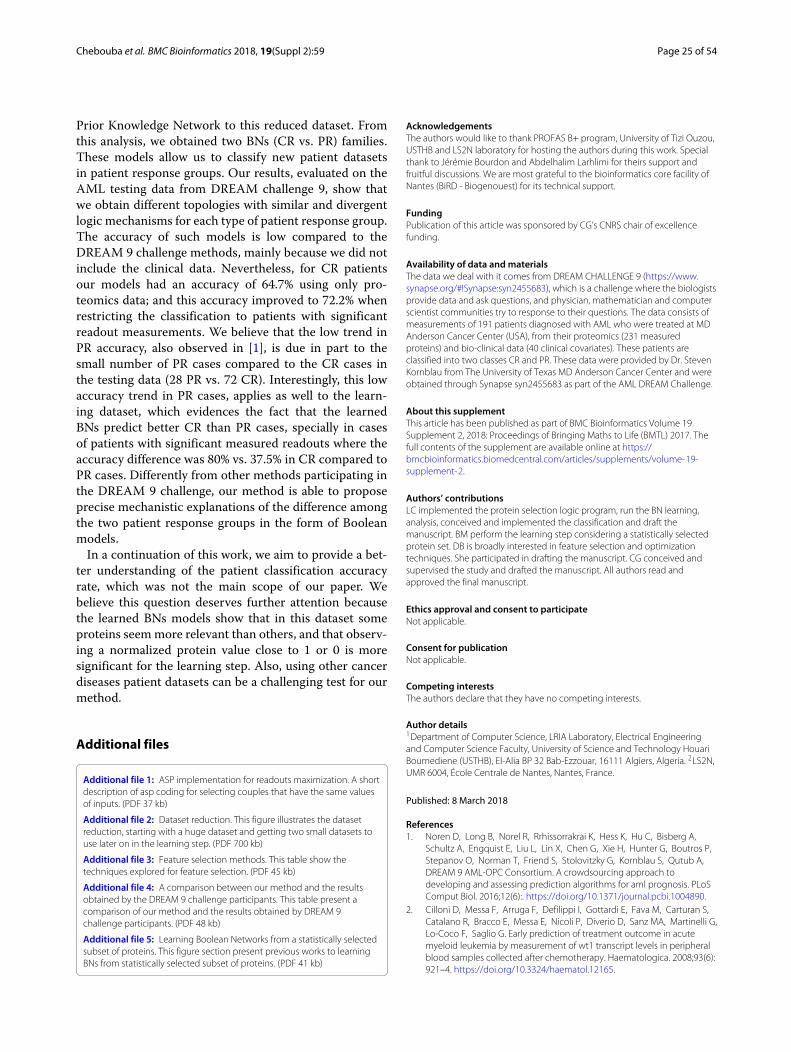
Table 2 Description of the accuracy results with the two classification methods using the Boolean network predictions
Learning dataset Testing dataset
Method Accuracy CR Accuracy PR Balanced accuracy Accuracy CR Accuracy PR Balanced accuracy
Method 1 57.6% (26) 53.8% (26) 55.7% (52) 64.7% (72) 18% (28) 41.35% (100)
Method 2 80% (10) 37.5% (8) 58.75% (18) 72.2% (18) 27.2% (11) 49.7% (29)
The accuracy was computed for the learning dataset of 52 patients, and the testing dataset of 100 patients. The numbers in parenthesis correspond to the number ofpatients that were analyzed
families of BNs could similarly predict the data with aMSE of 0.11. However, the MSE is not fully related tothe accuracy of each model in predicting the correctpatient response class. Our BNs proposed an accuracyof 52% for the learning dataset (57.6% for CR and 53.8%for PR cases). This accuracy improves to 61% (80% forCR and 37.5% for PR cases) when filtering our learn-ing dataset to patients with significant readout values,that is, by choosing readout signals closer to Booleanbehaviors. In Table 2 we show this improvement in theMethod 2 row. We can see that this improvement inaccuracy costs a reduction of the patients that can be clas-sified. For the learning dataset 34 patients could not beclassified.
For the testing data, the predictions from the learnedBNs proposed a balanced accuracy (BAC) of 41,35%. Theaccuracy of the CR class is higher (64,7%) when comparedto the PR class (18,3%). In [1] it was found the same dif-ference in the median accuracy for the different patientresponse groups (73% for CR and 42% for PR) accrossall DREAM 9 participating methods. However, DREAM9 participating methods used mainly bioclinical variablesto extract the model features and at most 2 protein mea-surements. One of the reasons of this difference is thatthe number of CR and PR samples differ, this can beseen in Table 2 in the values in parenthesis which rep-resent the number of patients analyzed. When using theclassification method after filtering patients with not sig-nificant readout values, we found a BAC of 49,75%. Theaccuracy for the CR class was of 72,2%, while of 27,2%for the PR class. In Additional file 4 we show a tablesummarizing the comparison of the BAC and AUROC(area under the receiver operating characteristic) scoresobtained with our method, compared to the two first-ranked methods in the DREAM 9 challenge as well aswith respect to the median of the 31 participating meth-ods. In this table we show the number and nature ofthe features used to build the classification models forthe compared methods. We can notice that our methodis the one that uses the largest number of protein fea-tures: 30 protein features and 71 logical rules relating thebehavior among proteins in our Boolean models. Thischaracteristic allows deriving mechanistic models, whichrequire a sufficient number of protein information. Thefact of not considering clinical data, penalizes our BAC
and AUROC scores. Interestingly, for the CR class, ouraccuracy remains comparable to other methods of thechallenge.
Discussion and conclusionThe DREAM challenge dataset is a large proteomicsdataset that may contain noise in some of its measure-ments. Including all dataset proteins in a predictive modelmay lead to over-fitting and pre-selecting a subset of pro-teins add bias as well. We validated for this case-studythe last assumption (see Additional file 5 for details).On a first attempt we tried to build Boolean networksfrom a subset of 20 significant (top ranked p-value afterapplying Student test between PR and CR patients) pro-teins. However the accuracy of such learned models waspoor (22%) and both of the BNs families (CR and PR)learned had the same logic behaviors. These preliminaryresults inspired us to develop a mathematical frameworkto select (k) proteins that distinguish these two fami-lies by imposing several constraints, such as maximizethe number of patient samples that have the same valuesof some proteins (so-called stimuli and inhibitors) wherethese samples belong to different classes (CR or PR). Suchdataset proposed the same measurements over the sameinput-nodes and different measurements over outputs-nodes across the different (CR/PR) classes and allowedus to build response-specific logic models. The differentconnections among CR vs. PR logic models could standfor mutations in the cell population systems that usu-ally appear after exposure to chemotherapies. The logicmodels obtained in this study validate this hypothesisbecause we found that the logic mechanisms of resis-tant patients were more varied that those of completeremission ones.
Given a large dataset, our method detects the mostrelevant proteins to build predictive models in order todistinguish two classes of patients. These models couldbe trained with larger datasets and used to representthe mechanisms within disease models to better tar-get drugs. In this work, we discovered a family of logicmodels that discriminate the response of Acute MyeloidLeukemia (AML) patients to treatment. The protein selec-tion logic program was implemented using Answer SetProgramming. This method allowed us to build a reduceddataset. Later, caspo allowed us to train BNs from a
Chebouba et al. BMC Bioinformatics 2018, 19(Suppl 2):59 Page 25 of 54
Prior Knowledge Network to this reduced dataset. Fromthis analysis, we obtained two BNs (CR vs. PR) families.These models allow us to classify new patient datasetsin patient response groups. Our results, evaluated on theAML testing data from DREAM challenge 9, show thatwe obtain different topologies with similar and divergentlogic mechanisms for each type of patient response group.The accuracy of such models is low compared to theDREAM 9 challenge methods, mainly because we did notinclude the clinical data. Nevertheless, for CR patientsour models had an accuracy of 64.7% using only pro-teomics data; and this accuracy improved to 72.2% whenrestricting the classification to patients with significantreadout measurements. We believe that the low trend inPR accuracy, also observed in [1], is due in part to thesmall number of PR cases compared to the CR cases inthe testing data (28 PR vs. 72 CR). Interestingly, this lowaccuracy trend in PR cases, applies as well to the learn-ing dataset, which evidences the fact that the learnedBNs predict better CR than PR cases, specially in casesof patients with significant measured readouts where theaccuracy difference was 80% vs. 37.5% in CR compared toPR cases. Differently from other methods participating inthe DREAM 9 challenge, our method is able to proposeprecise mechanistic explanations of the difference amongthe two patient response groups in the form of Booleanmodels.
In a continuation of this work, we aim to provide a bet-ter understanding of the patient classification accuracyrate, which was not the main scope of our paper. Webelieve this question deserves further attention becausethe learned BNs models show that in this dataset someproteins seem more relevant than others, and that observ-ing a normalized protein value close to 1 or 0 is moresignificant for the learning step. Also, using other cancerdiseases patient datasets can be a challenging test for ourmethod.
Additional files
Additional file 1: ASP implementation for readouts maximization. A shortdescription of asp coding for selecting couples that have the same valuesof inputs. (PDF 37 kb)
Additional file 2: Dataset reduction. This figure illustrates the datasetreduction, starting with a huge dataset and getting two small datasets touse later on in the learning step. (PDF 700 kb)
Additional file 3: Feature selection methods. This table show thetechniques explored for feature selection. (PDF 45 kb)
Additional file 4: A comparison between our method and the resultsobtained by the DREAM 9 challenge participants. This table present acomparison of our method and the results obtained by DREAM 9challenge participants. (PDF 48 kb)
Additional file 5: Learning Boolean Networks from a statistically selectedsubset of proteins. This figure section present previous works to learningBNs from statistically selected subset of proteins. (PDF 41 kb)
AcknowledgementsThe authors would like to thank PROFAS B+ program, University of Tizi Ouzou,USTHB and LS2N laboratory for hosting the authors during this work. Specialthank to Jérémie Bourdon and Abdelhalim Larhlimi for theirs support andfruitful discussions. We are most grateful to the bioinformatics core facility ofNantes (BiRD - Biogenouest) for its technical support.
FundingPublication of this article was sponsored by CG’s CNRS chair of excellencefunding.
Availability of data and materialsThe data we deal with it comes from DREAM CHALLENGE 9 (https://www.synapse.org/#!Synapse:syn2455683), which is a challenge where the biologistsprovide data and ask questions, and physician, mathematician and computerscientist communities try to response to their questions. The data consists ofmeasurements of 191 patients diagnosed with AML who were treated at MDAnderson Cancer Center (USA), from their proteomics (231 measuredproteins) and bio-clinical data (40 clinical covariates). These patients areclassified into two classes CR and PR. These data were provided by Dr. StevenKornblau from The University of Texas MD Anderson Cancer Center and wereobtained through Synapse syn2455683 as part of the AML DREAM Challenge.
About this supplementThis article has been published as part of BMC Bioinformatics Volume 19Supplement 2, 2018: Proceedings of Bringing Maths to Life (BMTL) 2017. Thefull contents of the supplement are available online at https://bmcbioinformatics.biomedcentral.com/articles/supplements/volume-19-supplement-2.
Authors’ contributionsLC implemented the protein selection logic program, run the BN learning,analysis, conceived and implemented the classification and draft themanuscript. BM perform the learning step considering a statistically selectedprotein set. DB is broadly interested in feature selection and optimizationtechniques. She participated in drafting the manuscript. CG conceived andsupervised the study and drafted the manuscript. All authors read andapproved the final manuscript.
Ethics approval and consent to participateNot applicable.
Consent for publicationNot applicable.
Competing interestsThe authors declare that they have no competing interests.
Author details1Department of Computer Science, LRIA Laboratory, Electrical Engineeringand Computer Science Faculty, University of Science and Technology HouariBoumediene (USTHB), El-Alia BP 32 Bab-Ezzouar, 16111 Algiers, Algeria. 2LS2N,UMR 6004, École Centrale de Nantes, Nantes, France.
Published: 8 March 2018
References1. Noren D, Long B, Norel R, Rrhissorrakrai K, Hess K, Hu C, Bisberg A,
Schultz A, Engquist E, Liu L, Lin X, Chen G, Xie H, Hunter G, Boutros P,Stepanov O, Norman T, Friend S, Stolovitzky G, Kornblau S, Qutub A,DREAM 9 AML-OPC Consortium. A crowdsourcing approach todeveloping and assessing prediction algorithms for aml prognosis. PLoSComput Biol. 2016;12(6):. https://doi.org/10.1371/journal.pcbi.1004890.
2. Cilloni D, Messa F, Arruga F, Defilippi I, Gottardi E, Fava M, Carturan S,Catalano R, Bracco E, Messa E, Nicoli P, Diverio D, Sanz MA, Martinelli G,Lo-Coco F, Saglio G. Early prediction of treatment outcome in acutemyeloid leukemia by measurement of wt1 transcript levels in peripheralblood samples collected after chemotherapy. Haematologica. 2008;93(6):921–4. https://doi.org/10.3324/haematol.12165.
Chebouba et al. BMC Bioinformatics 2018, 19(Suppl 2):59 Page 26 of 54
3. Gulley M, Shea T, Fedoriw Y. Genetic tests to evaluate prognosis andpredict therapeutic response in acute myeloid leukemia. J Mole Diagn.2010;12(1):3–16. https://doi.org/10.2353/jmoldx.2010.090054.
4. Moon JH, Kyun Sohn S, Lee MH, Jang J, Kim K, Won Jung C, Kim D. Bcl2gene polymorphism could predict the treatment outcomes in acutemyeloid leukemia patients. Leukemia Res. 2009;34:166–72. https://doi.org/10.1016/j.leukres.2009.05.009.
5. Liu L, Chang Y, Yang T, Noren DP, Long B, Kornblau S, Qutub A, Ye J.Evolution-informed modeling improves outcome prediction for cancers.Evol Appl. 2017;10(1):68–76. http://doi.org/10.1111/eva.12417.
6. Kanehisa M, Goto S. Kegg: Kyoto encyclopedia of genes and genomes.Nucleic Acids Res. 2000;28(1):27–30. http://doi.org/10.1093/nar/28.1.27.
7. Croft D, Mundo AF, Haw R, Milacic M, Weiser J, Wu G, Caudy M,Garapati P, Gillespie M, Kamdar MR, Jassal B, Jupe S, Matthews L, May B,Palatnik S, Rothfels K, Shamovsky V, Song H, Williams M, Birney E,Hermjakob H, Stein L, D’Eustachio P. The reactome pathwayknowledgebase. Nucleic Acids Res. 2014;42(Database-Issue):472–7.
8. Croft D, O’Kelly G, Wu G, Haw R, Gillespie M, Matthews L, Caudy M,Garapati P, Gopinath G, Jassal B, Jupe S, Kalatskaya I, Mahajan S, May B,Ndegwa N, Schmidt E, Shamovsky V, Yung C, Birney E, Hermjakob H,D’Eustachio P, Stein L. Reactome: a database of reactions, pathways andbiological processes. Nucleic Acids Res. 2011;39(suppl_1):691–7. https://doi.org/10.1093/nar/gkq1018.
9. Cerami EG, Gross BE, Demir E, Rodchenkov I, Babur O, Anwar N, Schultz N,Bader GD, Sander C. Pathway commons, a web resource for biologicalpathway data. Nucleic Acids Res. 2011;39(suppl_1):685–90. https://dx.doi.org/10.1093/nar/gkq1039.
10. Turei D, Korcsmaros T, Saez-Rodriguez J. Omnipath: guidelines andgateway for literature-curated signaling pathway resources. Nat Meth.2016;13:966–7. https://dx.doi.org/10.1038/nmeth.4077.
11. Dexter P, Jing C, David W, Ricardo R, Rudolf P, Vladimir R, Keiichiro O,Carol M, Lyndon H, Sandor S, Aleksandar S, Radu D, Michael B, Jan K,Barry D, Trey I. Ndex, the network data exchange. Cell Systems. 2015;1:302–5. https://doi.org/10.1016/j.cels.2015.10.001.
12. Shannon P, Markiel A, Ozier O, Baliga NS, Wang JT, Ramage D, Amin N,Schwikowski B, Ideker T. Cytoscape: a software environment forintegrated models of biomolecular interaction networks. Genome Res.2003;13:2498–504. https://doi.org/10.1101/gr.1239303.
13. Wu G, Dawson E, Duong A, Haw R, Stein L. Reactomefiviz: a cytoscapeapp for pathway and network-based data analysis. F1000Research.2014;3:. https://doi.org/10.12688/f1000research.4431.2.
14. Cytoscape App Store - CyPath2. http://apps.cytoscape.org/apps/cypath2.Accessed 12 Dec 2017.
15. PyPath Documentation. http://pypath.omnipathdb.org. Accessed 12 Dec2017.
16. Kuhn M, Yates P, Hyde C. In: Zhang L, editor. Statistical Methods for DrugDiscovery. pp. 53–81: Springer, Cham (2016). https://doi.org/10.1007/978-3-319-23558-5_4.
17. Wang Y(Marcia). Statistical methods for high throughput screening drugdiscovery data, PhD thesis (2005). http://hdl.handle.net/10012/1204.Accessed 12 Dec 2017.
18. Lima AN, Philot EA, Trossini GHG, Scott LPB, Maltarollo VG, Honorio KM.Use of machine learning approaches for novel drug discovery. ExpertOpinion Drug Discov. 2016;11(3):225–39. https://doi.org/10.1517/17460441.2016.1146250. PMID: 26814169. Accessed 12 Dec 2017.
19. Gawehn E, Hiss JA, Schneider G. Deep learning in drug discovery.Molecular Inf. 2016;35(1):3–14. https://doi.org/10.1002/minf.201501008.Accessed 12 Dec 2017.
20. Murphy RF. An active role for machine learning in drug development. NatChem Biol. 2011;7:327–30. https://doi.org/10.1038/nchembio.576.
21. Apic G, Ignjatovic T, Boyer S, Russell RB. Illuminating drug discovery withbiological pathways. FEBS Lett. 2005;579(8):1872–1877. https://doi.org/10.1016/j.febslet.2005.02.023.
22. Korkut A, Wang W, Demir E, Aksoy BA, Jing X, Molinelli EJ, Babur O,Bemis DL, Onur Sumer S, Solit DB, Pratilas CA, Sander C. Perturbationbiology nominates upstream-downstream drug combinations in RAFinhibitor resistant melanoma cells. Elife. 2015;4:. https://doi.org/10.7554/eLife.04640.
23. Videla S, Guziolowski C, Eduati F, Thiele S, Grabe N, Saez-Rodriguez J,Siegel A. Revisiting the training of logic models of protein signalingnetworks with asp. In: Computational Methods in Systems Biology.
Springer Berlin/Heidelberg; 2012. p. 342–61. https://doi.org/10.1007/978-3-642-33636-2_20. Accessed 12 Dec 2017.
24. Videla S, Saez-Rodriguez J, Guziolowski C, Siegel A. caspo: a toolbox forautomated reasoning on the response of logical signaling networksfamilies. Bioinformatics. 2017;33(6):947–50. https://doi.org/10.1093/bioinformatics/btw738.
25. Fabregat A, Sidiropoulos K, Garapati P, Gillespie M, Hausmann K, Haw R,Jassal B, Jupe S, Korninger F, McKay S, Matthews L, May B, Milacic M,Rothfels K, Shamovsky V, Webber M, Weiser J, Williams M, Wu G, Stein L,Hermjakob H, D’Eustachio P. The reactome pathway knowledgebase.Nucleic Acids Res. 2016;44(D1):481–7. https://doi.org/10.1093/nar/gkv1351.
26. Likas A, Vlassis N, Verbeek JJ. The global k-means clustering algorithm.Pattern Recognit. 2003;36(2):451–61. https://doi.org/10.1016/S0031-3203(02)00060-2. Biometrics. Accessed 12 Dec 2017.
27. Baral C. Knowledge Representation, Reasoning, and Declarative ProblemSolving. New York: Cambridge University Press; 2003.
28. Brewka G, Eiter T, Truszczynski M. Answer set programming at a glance.Commun ACM. 2011;54(12):92–103. https://doi.org/10.1145/2043174.2043195.
29. Bird Platform. http://www.pf-bird.univ-nantes.fr/. Accessed 12 Dec 2017.
• We accept pre-submission inquiries
• Our selector tool helps you to find the most relevant journal
• We provide round the clock customer support
• Convenient online submission
• Thorough peer review
• Inclusion in PubMed and all major indexing services
• Maximum visibility for your research
Submit your manuscript atwww.biomedcentral.com/submit
Submit your next manuscript to BioMed Central and we will help you at every step:

![RESEARCH OpenAccess … OpenAccess Anovelvoiceconversionapproachusing admissiblewaveletpacketdecomposition ... posed for voice morphing [17]. …](https://img.pdfslide.us/doc/110x75/5b0354627f8b9ab9598f2a8c/research-openaccess-openaccess-anovelvoiceconversionapproachusing-admissiblewaveletpacketdecomposition.jpg)