Embed Size (px)
Citation preview
RESEARCH Open Access
Climate change impacts on Ontario wind powerresourceYao Yao1, Gordon H Huang2,3* and Qianguo Lin4
Abstract
Background: The availability and reliability of wind power depend largely on current and future climate conditions,which may vary in the context of climate change. A high resolution regional climate model (PRECIS) was used fordynamic downscaling of the future wind speed over Ontario. The changes of wind power density and powerproduction were further investigated through case studies.
Results: The spatial pattern and the magnitude of wind speed from PRECIS simulation, Wind Energy Atlas and theobservation indicated a successful climate simulation. Climate modelling indicated that there would be a decreaseof up to 5% in wind speed over southern Ontario from present to the period of 2071–2100. It was showed in thecase studies that the changes of wind power production were not in proportion to the changes of average windspeed, due to the variations of wind speed distribution.
Conclusion: The decrease of projected wind speed would be more intense in A2 than in B2 scenario, showingstatistically significant differences in the grid cell mean wind speed. The changes of wind power production maynot be in proportion to the changes of average wind speed. It would be reasonable to develop onshore oroffshore wind energy industry around Georgian Bay and James Bay, considering the projected increasing windspeeds within these areas.
Keywords: Climate change, Regional climate model, Wind speed, Power production
BackgroundAround the world, the effects of climate change arealready upon us. Many countries have included renew-able energy systems in their future energy plans so thatthey can produce reliable and environmentally friendlyenergy. Compared to the environmental effects of trad-itional energy sources, the environmental effects of windpower are relatively minor (Dvorak et al., 2010; Migoyaet al., 2007). Wind power consumes no fuel, and emitsno air pollution. However, it’s advisable to realize thatwind energy is based on natural forces, which means it’shighly spatial correlated, and is also variable over time.Moreover, the availability and reliability of wind powerdepend greatly on current and future climate conditions,which also may vary in light of possible global climate
change (Cai et al., 2011; Huang & Qin, 2008; Lin et al.,2011). Ontario is at the forefront of wind energy inCanada. According to Canadian Wind Energy Association,Ontario takes up 36% of current wind power generated inthe country, and its capacity will continue to increase dra-matically in the future. In terms of regional energy plan-ning, there is an urgent need to refine global climatechange impacts down to regional level in order to under-stand its trend and longer-term effect to avoid energysafety and economical risks.It is widely recognized that the increasing of green-
house gas (GHG) emission in atmosphere has effects onglobal climate. A range of GHG emission scenarios havebeen developed in the IPCC Special Report on EmissionsScenarios that reflect a number of different ways inwhich the world might develop and the consequences forpopulation, economic growth, energy use and technology(Nakicenovic et al., 2000). To estimate the effect that theseemissions have on the global climate, global climate mod-els (GCMs) are employed (Smithson, 2002). GCMs de-scribe important physical elements and processes in the
* Correspondence: [email protected] for Energy, Environment and Sustainable Communities, Universityof Regina, Regina, Saskatchewan, Canada S4S 0A23Institute for Energy, Environment and Sustainability Research, UR-NCEPU,North China Electric Power University, Beijing 102206, ChinaFull list of author information is available at the end of the article
© 2012 Yao et al.; licensee Springer. This is an Open Access article distributed under the terms of the Creative CommonsAttribution License (http://creativecommons.org/licenses/by/2.0), which permits unrestricted use, distribution, and reproductionin any medium, provided the original work is properly cited.
Yao et al. Environmental Systems Research 2012, 1:2http://www.environmentalsystemsresearch.com/content/1/1/2

atmosphere, oceans and land surface that make up the cli-mate system. One disadvantage of GCMs is their scale,which is typically a few hundred kilometers in resolution.In order to link the impacts of climate change to practicalproblems such as local wind power availability, we need topredict changes on much finer scales. The GCM modelingresults are required to be downscaled to higher resolution.Generally, there are two types of downscaling techniques.One is statistical downscaling. The other one is dynamicdownscaling. The dynamic one is through the use of re-gional climate models (RCMs), which have the potentialto improve the representation of the climate informationwhich is important for assessing a region’s vulnerability toclimate change. PRECIS (Providing Regional Climates forImpacts Studies) is a regional modeling system that can berun over any area of the globe to provide regional climateinformation for impacts studies. Boundary conditions arerequired at the limits of the model’s domain to providethe meteorological forcing for the RCM.In the past decade, much attention in the climate
change researches has been focused on the potentialimpacts on temperature and precipitation. Recently, agrowing number of studies have looked at potentialimpacts on renewable energy resources, and on windpower (Sailor et al., 2008). In particular, it was foundthat wind power potential throughout Finland might in-crease by 2–10% under conditions of climate changeUsing GCM output from the Hadley (Venäläinen et al.,2004). Pryor (Pryor et al., 2005a) has found that annualwind power potential over Northern Europe under theIPCC A2 and B2 scenarios was highly dependent on theboundary conditions used in Rossby Centre coupledRegional Climate Model (RCAO). Using empiricaldownscaling of five GCMs for 46 stations over NorthernEurope, it’s shown a slight decrease in mean wind speedsunder a 2080–2100 climate projection (Pryor et al.,2005b). Breslow & Sailor explored climate change impli-cations for wind power in California and Texas usingneural network-based downscaling (Breslow & Sailor,2002). In the recent research using statistically down-scaling tools (Sailor et al., 2008), the summertime windspeeds in the Northwest U.S. may decrease by 5–10%which suggests a 40% reduction in summertime gener-ation potential. RCM was also used in Brazil to find outthat the wind power potential in Brazil would not bejeopardized in the future due to possible new climateconditions (Breslow & Sailor, 2002). However, withinall these researches, uncertainty remains a bottle-neck. The models, methods and scenarios used areso sophisticated that the massive uncertainty is im-measurable, which leads to a relatively low credibilityof the findings. There is also a lack of studies on thesubstantial impacts of changing wind speed on theactual wind power production.
Therefore the objective of this research is to: a) determinewhether the wind speed over Ontario generated by PRECISusing boundary conditions supplied from HadAM3HGCM during the control period (1961–1990) exhibit rea-sonable and realistic features as other reanalysis data pro-ducts. b) determine if there are substantial differencesbetween near-surface wind speed calculated for the controlrun versus a prognostic period (2071–2100) for either oftwo IPCC emission scenarios (A2 and B2). c) investigatethe detailed impacts on wind power utilization as the resultof the changes of the wind speed.
MethodologyStudy area and data acquisitionStudy areaThe territory of Ontario is often broken into two regions,Northern Ontario and Southern Ontario. The great major-ity of population (94%, i.e. 36.3% of the population ofCanada) and arable land in Ontario is located in the south,which contrasts with its relatively small land area in com-parison to the north. Ontario’s existing installed generationcapacity includes nuclear, coal, oil, gas, hydroelectric, woodand waste-fuelled generation, which results in a total in-stalled capacity of approximately 35485 MW. The wind en-ergy only constitutes about 3% of the total capacity, whilethis percentage is 30% in Denmark. The total installed windpower capacity is 1208 megawatts, or 2.7 percent ofOntario’s total installed capacity. Ontario has 36% ofCanada’s installed capacity for wind-generated electri-city. The Ontario Power Authority’s (OPA) IntegratedPower System Plan had called for 4600 MW of windenergy by 2020. In 2009, Ontario’s new Green EnergyAct came into force with a feed-in-tariff and (FIT)new transmission investments that make it likely thatthis target will be exceeded. Approximately 8000 MW ofwind energy projects have submitted applications for FITcontracts. Currently, 2500 MW of capacity will be able toconnect to the grid, but transmission upgrades areplanned to allow the connection of significantly more cap-acity over the next few years (Pereira de Lucena et al.,2010). With such a fast growing rate of wind power, thereis a growing need for a long-term outlook of the windspeed variation.
Climate change projectionsPRECIS is a high resolution climate model that covers alimited area of the globe, typically 5000 × 5000 km, witha typical horizontal resolution of 50 km. The HadleyCentre’s current version of the PRECIS (HadRM3P) isbased on HadAM3H, an improved version of the atmos-pheric component of the latest Hadley Centre coupledAOGCM. HadRM3P has been used with horizontalresolutions of 50 and 25 km with 19 levels in the atmos-phere (from the surface to 30 km in the stratosphere)
Yao et al. Environmental Systems Research 2012, 1:2 Page 2 of 11http://www.environmentalsystemsresearch.com/content/1/1/2

and four levels in the soil. This study was based on PRE-CIS 1.8.2.In order to investigate the state of the regional climate,
the length of the simulation should be at least 10 yearsto give a reasonable idea of the mean climate change.However, a 30-year experiment is preferable to betterdetermine changes in higher order statistics. This is par-ticularly important for the analysis of aspects of climatevariability, such as distributions of daily wind speed orclimate extremes. Therefore, in this study, the simulation
length was set as 30 years (1961–1990 for baseline and2071–2100 for projection). It is important to run RCMsto generate more than one of the future climate scenar-ios implied by different emissions scenarios in order tostart to quantify the “emissions” uncertainty in the pre-dictions. For PRECIS, boundary data was available fromtwo 31 year integrations of the HadAM3P atmosphere-only atmosphere global model. One of them provides asimulation of the climate of 2070–2100 under A2 emis-sion scenario and the other is associated with B2 emis-sion scenario.
Reanalyzed climate dataTo provide independent assessment of the PRECIS outputduring the control period, the reanalyzed Canadian WindEnergy Atlas was used. This data set was produced bystatistical-dynamical downscaling method. The methodconsists of using large scale long term atmospheric dataand their statistical properties to run a mesoscale modeland post-process its output in order to get a small scalepicture of atmospheric motion. The NCAR/NCEP re-analysis (Frey-Buness et al., 1995) was chosen as its database. The simulations are performed with the MesoscaleCompressible Community (MC2) model (Kalnay et al.,1996) to provide 5 km resolution output. This data set
Figure 2 Average wind speed in PRECIS baseline.
Figure 1 Research flowchart.
Yao et al. Environmental Systems Research 2012, 1:2 Page 3 of 11http://www.environmentalsystemsresearch.com/content/1/1/2
was considered as the representative of statistical windproperties for the period of 1958 to 2000.
Observed climate dataTo analyze the historical weather condition and to evalu-ate the performance of PRECIS control run, observedweather data was collected from Environmental Canada.Twelve weather stations at major cities in Ontario wereselected. The data was downloaded from National ClimateData and Information Archive on Environment Canadawebsite (Benoit et al., 1997). This archive, operated andmaintained by Environment Canada, contains officialclimate and weather observations for Canada. Climateelements, such as temperature, precipitation, relative hu-midity, atmospheric pressure, wind speed, wind direction,visibility, cloud types, cloud heights and amounts, soiltemperature, evaporation, solar radiation and sunshine aswell as occurrences of thunderstorms, hail, fog or otherweather phenomena are warehoused in a digital database.
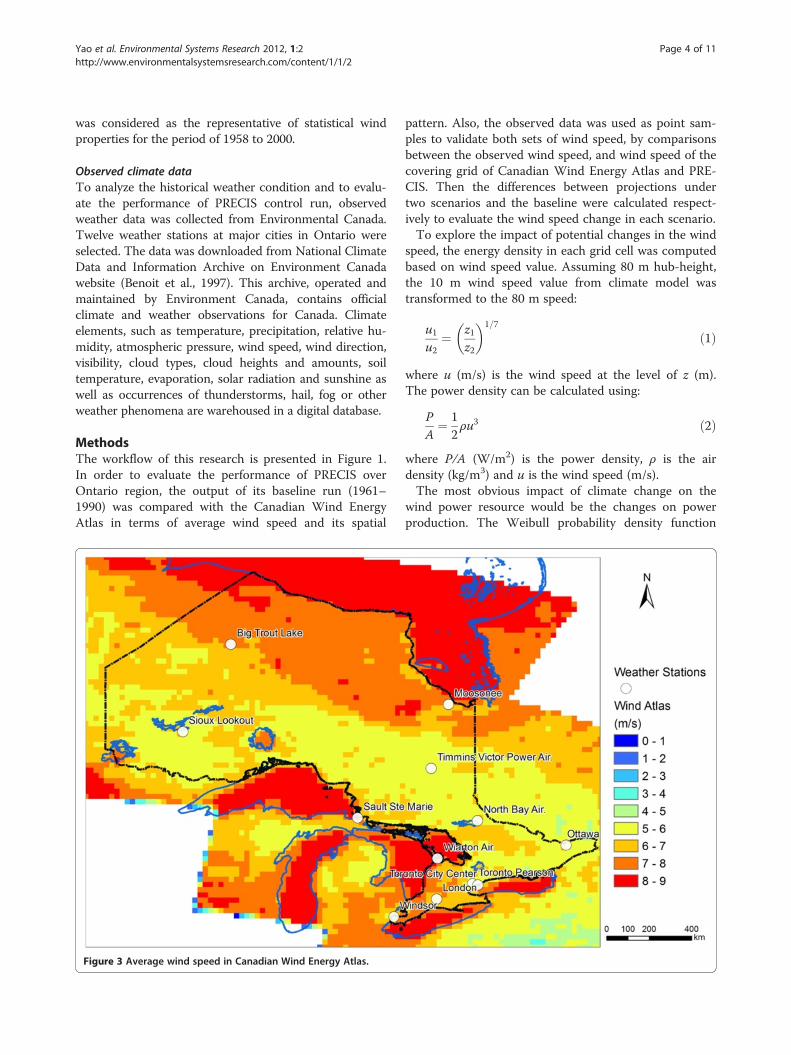
MethodsThe workflow of this research is presented in Figure 1.In order to evaluate the performance of PRECIS overOntario region, the output of its baseline run (1961–1990) was compared with the Canadian Wind EnergyAtlas in terms of average wind speed and its spatial
pattern. Also, the observed data was used as point sam-ples to validate both sets of wind speed, by comparisonsbetween the observed wind speed, and wind speed of thecovering grid of Canadian Wind Energy Atlas and PRE-CIS. Then the differences between projections undertwo scenarios and the baseline were calculated respect-ively to evaluate the wind speed change in each scenario.To explore the impact of potential changes in the wind
speed, the energy density in each grid cell was computedbased on wind speed value. Assuming 80 m hub-height,the 10 m wind speed value from climate model wastransformed to the 80 m speed:
u1u2
¼ z1z2
� �1=7
ð1Þ
where u (m/s) is the wind speed at the level of z (m).The power density can be calculated using:
PA¼ 1
2ρu3 ð2Þ
where P/A (W/m2) is the power density, ρ is the airdensity (kg/m3) and u is the wind speed (m/s).The most obvious impact of climate change on the
wind power resource would be the changes on powerproduction. The Weibull probability density function
Figure 3 Average wind speed in Canadian Wind Energy Atlas.
Yao et al. Environmental Systems Research 2012, 1:2 Page 4 of 11http://www.environmentalsystemsresearch.com/content/1/1/2
was adopted and be fitted to hub-high wind speed distri-bution. This distribution is often used in wind energyengineering, as it conforms well to the observed long-term distribution of mean wind speeds for a range ofsites (Manwell et al., 2009). The Weibull probabilitydensity function expresses the probability f(x) to have awind speed x, as follow (Hiester & Pennell, 1981):
f xð Þ ¼ kC
� �xC
� �k�1exp � x
C
� �k� �
ð3Þ
where k is the shape factor, specified by the user. Theshape factor will typically range from 1 to 3. For a givenaverage wind speed, a lower shape factor indicates a rela-tively wide distribution of wind speeds around the aver-age while a higher shape factor indicates a relativelynarrow distribution of wind speeds around the average.A lower shape factor will normally lead to a higher en-ergy production for a given average wind speed.The actual output of a wind turbine is related directly
to its: a) start-up speed: the speed at which the rotorand blade assembly begins to rotate, b) cut-in speed: theminimum wind speed at which the wind turbine willgenerate usable power, c) rated speed: the minimumwind speed at which the wind turbine will generate its
designated rated power, d) cut-out speed: the safetyspeed which protects the wind turbine from damage.The power production Pw of a wind turbine can be
calculated by:
Pw ¼Z xo
xip xð Þf xð Þdx ð4Þ
where xi and xo is the cut-in and cut-off speed of theturbine; p(x) is the power curve of a specific turbine.
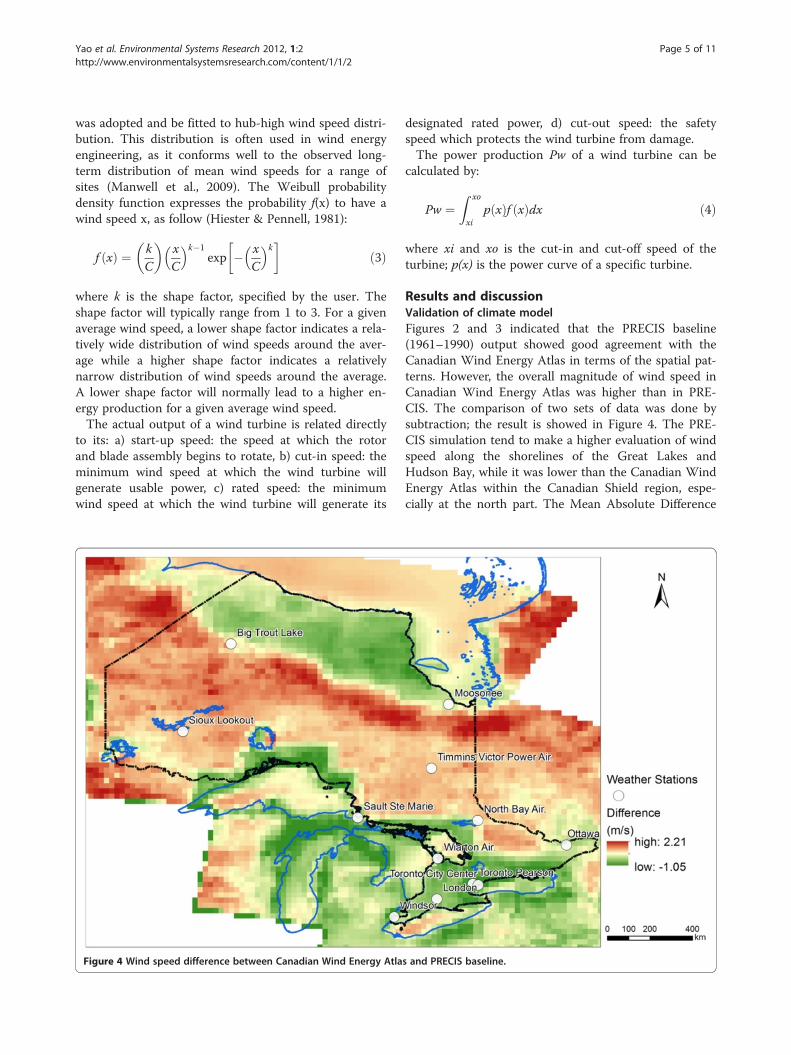
Results and discussionValidation of climate modelFigures 2 and 3 indicated that the PRECIS baseline(1961–1990) output showed good agreement with theCanadian Wind Energy Atlas in terms of the spatial pat-terns. However, the overall magnitude of wind speed inCanadian Wind Energy Atlas was higher than in PRE-CIS. The comparison of two sets of data was done bysubtraction; the result is showed in Figure 4. The PRE-CIS simulation tend to make a higher evaluation of windspeed along the shorelines of the Great Lakes andHudson Bay, while it was lower than the Canadian WindEnergy Atlas within the Canadian Shield region, espe-cially at the north part. The Mean Absolute Difference
Figure 4 Wind speed difference between Canadian Wind Energy Atlas and PRECIS baseline.
Yao et al. Environmental Systems Research 2012, 1:2 Page 5 of 11http://www.environmentalsystemsresearch.com/content/1/1/2

Figure 5 Comparison of wind speed from observation, Canadian Wind Energy Atlas and PRECIS baseline at major cities.
Figure 6 Wind speed variation under A2 scenario.
Yao et al. Environmental Systems Research 2012, 1:2 Page 6 of 11http://www.environmentalsystemsresearch.com/content/1/1/2

(MAD) between PRECIS output and observation was0.73 m/s, and was 0.84 m/s between Canadian WindEnergy Atlas and observation. The three set of windspeed data was compared at 12 weather stations in themajor cities in Ontario (Windsor Airport, London Int’lAirport, Toronto Pearson Int’l Airport, Toronto CityCenter (Island) Airport, Ottawa Int’l Airport, WiartonAirport, North Bay Airport, Sault Ste Marie Airport,Sioux Lookout, Timmins Victor Power Airport, BigTrout Lake, Moosonee Airport). The result was pre-sented in Figure 5. The three series are: observation ver-sus observation, RCM baseline versus observation, andCanadian Wind Energy Atlas versus observation. Thepattern showed in this figure was in accordance withFigure 4, that PRECIS simulate higher wind speedaround The Great Lakes. However, since both PRECISand Wind Energy Atlas generate grid-cell averaged windspeed, the bias was inevitable when comparing with spotmeasurement. It is also indicated that there was no sig-nificant bias between the PRECIS baseline run andCanadian Wind Energy Atlas. As the Canadian WindEnergy Atlas was acknowledged to be a plausible repre-sentation of the wind speed distribution, the PRECISbaseline run was therefore considered to be a validatedand successful.
Changes of wind speedOnce the baseline simulation was validated, it’s reasonableto assume that the used climate model was able to reflectthe meteorological processes which it was designed tocapture. Therefore, by comparing the projected climateunder various scenarios and the baseline, the possiblechanges of the future climate can be investigated.The grid differences of wind speed between A2, B2
projection and baseline ranged from −0.65 m/s to0.82 m/s and −0.55 m/s to 0.37 m/s, respectively. TheMean Absolute Difference (MAD) and its standard devi-ation were 0.016 m/s and 0.212 m/s under A2 scenario,and 0.002 m/s and 0.122 m/s under B2 scenario. Al-though the MAD was small, the changes of wind speedrequired detailed interpretation by referring to thespatial distribution, which was not homogeneous consid-ering the relatively high standard deviation.The wind speed variations under A2 and B2 scenarios
were presented in Figure 6 and Figure 7. The percentageof variation was derived by subtracting the wind speedin baseline from projected for each grid, and divided bythe baseline wind speed. Generally, there would be atrend that wind speed in Great Lakes region would de-crease, while there would be greater wind speed aroundand over northern water bodies. This trend would be
Figure 7 Wind speed variation under B2 scenario.
Yao et al. Environmental Systems Research 2012, 1:2 Page 7 of 11http://www.environmentalsystemsresearch.com/content/1/1/2

more intense in A2 scenario than in B2 (Figure 8).Therefore the low MAD value was the result of the aver-aging of positive and negative variations. In most areasof southern Ontario, there would be a deduction of aver-age wind speed ranging from 1% to 3% by the period of2071–2100, or even higher to 5% at some grids in bothscenarios. As most of the Ontario’s population settles inthe southern region, they would probably experience alower near surface wind in the long-term future. Thetrend of decreasing wind speed in north America wasalso reported by Breslow and Sailor (Breslow & Sailor,2002), who used GCMs to investigate the potentialimpacts of climate change on wind speeds, predictingthat the US continental will see reduced wind speeds of1.0 to 3.2% in the next 50 years, and 1.4 to 4.5% over thenext 100 years.
Impacts on wind power resourceFigure 6 and Figure 7 also shows the major wind farmsin Ontario, it could be inferred that most of the turbineswould still be in the suitable zone where the averagewind speed exceeds 6 m/s. However, as can be seen fromthe figures, most of Ontario’s major wind farms werebuilt in the Great Lakes region, where the wind speedwould likely to be lower, in which case the wind farmsmight be facing a decreasing power production. As can
be calculated by Eq. (2), the wind energy density woulddrop down dramatically as wind speed decreases, be-cause its value is proportional to the third power of thewind speed. Take Erie Shores Wind Farm as an example,it is located at northern shoreline of Lake Eire, installedin 2006 with 66 GE 1.5 MW Turbines and total installedCapacity of 99 MW. According to the projected results,the average wind speed in 2071–2100 would decrease by4.9% and 3.2% under A2 and B2 scenarios respectively.That equaled to a significant wind power density deduc-tion of 14.0% and 9.3% under A2 and B2 scenarios.To investigate the detailed impact on the actual power
production of wind turbines, the Weibull distribution(Eq. (3)) was fitted to the 80 m high equivalent windspeed for the years of 1990 and 2070 (under A2 sce-nario) at Erie Shores Wind Farm (Figure 9). The figureindicated that the projected future wind speed distribu-tion would be more scattered, and the peak speed wouldbe lower. The energy production of a GE Energy 1.5SLEwind turbine was then calculated based on Eq. (4). Theresults showed that the difference of power productionbetween the two Weibull curves was 9.23%, which waslower than the estimated power density deduction. Thereason for that was because the power production of awind turbine ceased to rise while the wind speedexceeded a certain value, which is 10 m/s for the GE
Figure 8 Wind speed difference between A2 and B2 scenarios.
Yao et al. Environmental Systems Research 2012, 1:2 Page 8 of 11http://www.environmentalsystemsresearch.com/content/1/1/2

Energy 1.5SLE model. In another word, the wind powerdensity estimation was not a perfect index for windpower production, since it merely rely on the averagewind speed and was not able to account for the featuresof the wind turbines. However, the tradeoff of consider-ing the wind turbine specifications is the less representa-tiveness and comparability.Despite the pessimistic results of the projection, it
should be noticed that the time span of this variationwas about 100 years, while the lifespan of a normal windturbine is 20 to 25 years. Thus, it’s possible to consideradaptation strategies in order to mitigate the impact ofclimate change, considering the long-term wind speed
variation. From Figures 7 and 8, it’s obvious that the fu-ture wind speed at Georgian Bay (to the west of LakeHuron) and James Bay would be higher. Using the samemethod for the Erie Shores case study, the changes ofonshore and offshore wind power density and windpower production at Georgian Bay and James Bay werecalculated. As showed in Table 1, the growth of offshorewind power potential would be higher than onshore.There would be a dramatic increase of 33.1% in offshorewind power density at James Bay, while the changes ofwind power production was much lower (15.7%) due tothe same reason above. It should be noted that the changeof power production was based on particular model of
Figure 9 Projected wind speed distribution at Erie Shores Wind Farm in the year of 2070 (upper) and 1990 (lower).
Yao et al. Environmental Systems Research 2012, 1:2 Page 9 of 11http://www.environmentalsystemsresearch.com/content/1/1/2

wind turbine. The difference between power density andpower production would be lower if a turbine that canmake full use of the wind power was chosen.Currently, many wind farms around Georgian Bay has
already been built and the nearby transmission lines alsoprovide support for the development of wind energy. It’sreasonable to consider Georgian Bay’s shoreline as a po-tential hotspot for wind energy in the climate changecontext. As for James Bay, the wind energy potentialthere is abundant and would keep increasing in the fu-ture projections. There is also transmission line connect-ing hydropower stations at Abitibi River and MattagamiRiver. But the extreme weather in this region, the coldweather specially, must be solved technically before initi-ate any wind farm project. In a cold climate, icing repre-sents one of the biggest challenges to the operation ofwind turbines. Wind turbines must be able to sustain atleast limited icing without incurring damage that wouldprevent normal operation.The above finding also suggests offshore wind farm as
an alternative regarding the increasing wind energy po-tential above the water surfaces over Georgian Bay andJames Bay. While offshore wind energy is undergoing ra-ther rapid global growth, Canada does not yet have anyoffshore wind facilities installed. However, the potentialresources for this technology in Canada are amply atpresent and in the projected future. Although offshorewind turbines can be more costly to install and operate,they offer several distinct advantages over their onshorecounterparts: (1) in general, they can be installed closerto coastal urban load centers, where most electricalenergy demand exists, (2) offshore winds are faster andmore consistent at lower vertical heights due to thereduced surface roughness over the ocean (Manwellet al., 2009), and (3) offshore turbines and componentsare not limited by roadway shipping constraints, sohigher capacity turbines can be installed.
ConclusionThe results corresponding to the objectives are as fol-lows: a) The spatial pattern of wind speed was similarbetween PRECIS simulation (1961–1990) and CanadianWind Energy Atlas. The mean absolute difference of the
mean wind speed between PRECIS simulation, WindEnergy Atlas and the observed data were 0.73 and0.84 m/s respectively, indicating a successful climatesimulation. b) The PRECIS simulation (2071–2100)suggested decreasing wind speed over the populatedsouthern Ontario relative to the baseline period. Thesechanges would be more intense in the A2 than in B2scenario, and lead to statistically significant differencesin the grid cell mean wind speed. c) Based on case stud-ies around Erie Shores, James Bay and Georgian Bay, itwas showed that the changes of wind power productionmay not be in proportion to the changes of average windspeed, due to the possible variations of wind speed dis-tribution. It would be reasonable to develop onshore oroffshore wind energy industry around Georgian Bay andJames Bay, considering the projected increasing windspeeds within these areas.Although it would provide more valuable information,
the analysis of temporal variations of wind speed wasnot conducted due to limited computational capacity. Itshould also be noted that the results of this work dependfundamentally on the quality of the climate projectionson which it is based. Improvements could be madethrough a more thorough analysis, including wind speedseasonality, and projections from different GCM config-urations and downscaling methods. These could aid incoping with some of the uncertainties and add useful in-formation about the vulnerability of wind power.
Competing interestsThe authors declare that they have no competing interests.
AcknowledgementsThis research was supported by the Program for Innovative Research Team(IRT1127), the MOE Key Project Program (311013), the Natural Science andEngineering Research Council of Canada, and the Major Project Program ofthe Natural Sciences Foundation (51190095).
Author details1Faculty of Engineering and Applied Science, University of Regina, Regina,Saskatchewan S4S 0A2, Canada. 2Institute for Energy, Environment andSustainable Communities, University of Regina, Regina, Saskatchewan,Canada S4S 0A2. 3Institute for Energy, Environment and SustainabilityResearch, UR-NCEPU, North China Electric Power University, Beijing 102206,China. 4Institute for Energy, Environment and Sustainability Research, UR-NCEPU, North China Electric Power University, Beijing 102206, China.
Authors’ contributionYY carried out the data collection, results analysis and drafted themanuscript. GH and QL carried out the works related to climate modelling.All contributed jointly and equally to the discussion of the manuscript. Allauthors read and approved the final manuscript.
Received: 18 April 2012 Accepted: 14 August 2012Published: 14 August 2012
ReferencesBenoit R, Desgagné M, Pellerin P, Pellerin S, Chartier Y, Desjardins S (1997) The
Canadian MC2: a Semi-Lagrangian, semi-implicit wideband atmosphericmodel suited for finescale process studies and simulation. Mon Weather Rev125(10):2382–2415
Table 1 Variations (%) of wind speed, power density andpower production at studied locations under A2 (B2)scenario in 2070
Location Wind Speed Power Density Power Production
Erie Shores −4.9 (−3.2) −14.0 (−9.3) −9.2 (−7.2)
James Bay, onshore 2.1 (1.2) 6.4 (3.6) 5.4 (3.1)
James Bay, offshore 10.0 (4.2) 33.1 (13.1) 15.7 (8.6)
Georgian Bay, onshore 1.4 (2.0) 4.3 (6.1) 3.9 (4.8)
Georgian Bay, offshore 2.9 (4.6) 9.0 (14.4) 6.3 (9.2)
Yao et al. Environmental Systems Research 2012, 1:2 Page 10 of 11http://www.environmentalsystemsresearch.com/content/1/1/2

Breslow PB, Sailor DJ (2002) Vulnerability of wind power resources to climatechange in the continental United States. Renew Energy 27(4):585–598
Cai YP, Huang GH, Tan Q, Liu L (2011) An integrated approach for climate-change impact analysis and adaptation planning under multi-leveluncertainties. Part II. Case study. Renew Sustain Energy Rev 15(6):3051–3073
Dvorak MJ, Archer CL, Jacobson MZ (2010) California offshore wind energypotential. Renew Energy 35(6):1244–1254
Frey-Buness F, Heimann D, Sausen R (1995) A statistical-dynamical downscalingprocedure for global climate simulations. Theor Appl Climatol 50(3):117–131
Hiester TR, Pennell WT (1981) The siting handbook for large wind energysystems. WindBooks, Rockville Centre, N.Y
Huang GH, Qin XS (2008) Editorial: Climate Change and Sustainable EnergyDevelopment. Energy Sources, Part A: Recovery, Utilization, andEnvironmental Effects 30(14):1281–1285
Kalnay E, Kanamitsu M, Kistler R, Collins W, Deaven D, Gandin L, Iredell M, Saha S,White G, Woollen J, Zhu Y, Leetmaa A, Reynolds R, Chelliah M, Ebisuzaki W,Higgins W, Janowiak J, Mo KC, Ropelewski C, Wang J, Jenne R, Joseph D(1996) The NCEP/NCAR 40-Year Reanalysis Project. Bull Am Meteorol Soc 77(3):437–471
Lin QG, Huang GH, Bass B (2011) Impacts from climate change and adaptationresponses on energy economy and greenhouse gas emissions in theToronto-Niagara Region, Canada. Energy Sources, Part A: Recovery,Utilization, and Environmental Effects 33(17):1581–1597
Manwell JF, McGowan JG, Rogers AL (2009) Wind Turbine Design and Testing. In:Wind Energy Explained. John Wiley & Sons, Ltd, Hoboken, New Jersey,United States, pp 311–357
Migoya E, Crespo A, Jiménez Á, García J, Manuel F (2007) Wind energy resourceassessment in Madrid region. Renew Energy 32(9):1467–1483
Nakicenovic N, Alcamo J, Davis G, de Vries B, Fenhann J, Gaffin S, Gregory K,Grubler A, Jung TY, Kram T, La Rovere EL, Michaelis L, Mori S, Morita T,Pepper W, Pitcher HM, Price L, Riahi K, Roehrl A, Rogner H-H, Sankovski A,Schlesinger M, Shukla P, Smith SJ, Swart R, van Rooijen S, Victor N, Dadi Z(2000) Special Report on Emissions Scenarios: a special report of WorkingGroup III of the Intergovernmental Panel on Climate Change
Pereira de Lucena AF, Szklo AS, Schaeffer R, Dutra RM (2010) The vulnerability ofwind power to climate change in Brazil. Renew Energy 35(5):904–912
Pryor S, Barthelmie R, Kjellström E (2005a) Potential climate change impact onwind energy resources in northern Europe: analyses using a regional climatemodel. Clim Dyn 25(7):815–835
Pryor SC, Schoof JT, Barthelmie RJ (2005b) Climate change impacts on windspeeds and wind energy density in northern Europe: empirical downscalingof multiple AOGCMs. Clim Res 29(3):183–198
Sailor DJ, Smith M, Hart M (2008) Climate change implications for wind powerresources in the Northwest United States. Renew Energy 33(11):2393–2406
Smithson PA (2002) IPCC, 2001: climate change 2001: the scientific basis.Contribution of Working Group 1 to the Third Assessment Report of theIntergovernmental Panel on Climate Change, edited by J. T. Houghton, Y.Ding, D. J. Griggs, M. Noguer, P. J. van der Linden, X. Dai, K. Maskell and C. A.Johnson (eds). Cambridge University Press, Cambridge, UK, and New York,USA, 2001. No. of pages: 881. Price £34.95, US$ 49.95, ISBN 0-521-01495-6(paperback). £90.00, US$ 130.00, ISBN 0-521-80767-0 (hardback). Int J Climatol22(9):1144
Venäläinen A, Tammelin B, Tuomenvirta H, Jylhä K, Koskela J, Turunen M,Vehviläinen B, Forsius J, Järvinen P (2004) The influence of climate changeon energy production & heating energy demand in Finland. Energy &Environment 15(1):93–109
doi:10.1186/2193-2697-1-2Cite this article as: Yao et al.: Climate change impacts on Ontario windpower resource. Environmental Systems Research 2012 1:2.
Submit your manuscript to a journal and benefi t from:
7 Convenient online submission
7 Rigorous peer review
7 Immediate publication on acceptance
7 Open access: articles freely available online
7 High visibility within the fi eld
7 Retaining the copyright to your article
Submit your next manuscript at 7 springeropen.com
Yao et al. Environmental Systems Research 2012, 1:2 Page 11 of 11http://www.environmentalsystemsresearch.com/content/1/1/2