Embed Size (px)
Citation preview
CLIM 101 // Global Warming, Weather, Climate and Society // Fall 2012
Impacts of Climate Change
Impacts on Natural SystemsImpacts on Society: water, agriculture, food, and human health
CLIM 101: Global Warming: Weather, Climate and Society
CLIM 101 // Global Warming, Weather, Climate and Society // Fall 2012
HumansEcosystems
WeatherClimate
CLIM 101 // Global Warming, Weather, Climate and Society // Fall 2012
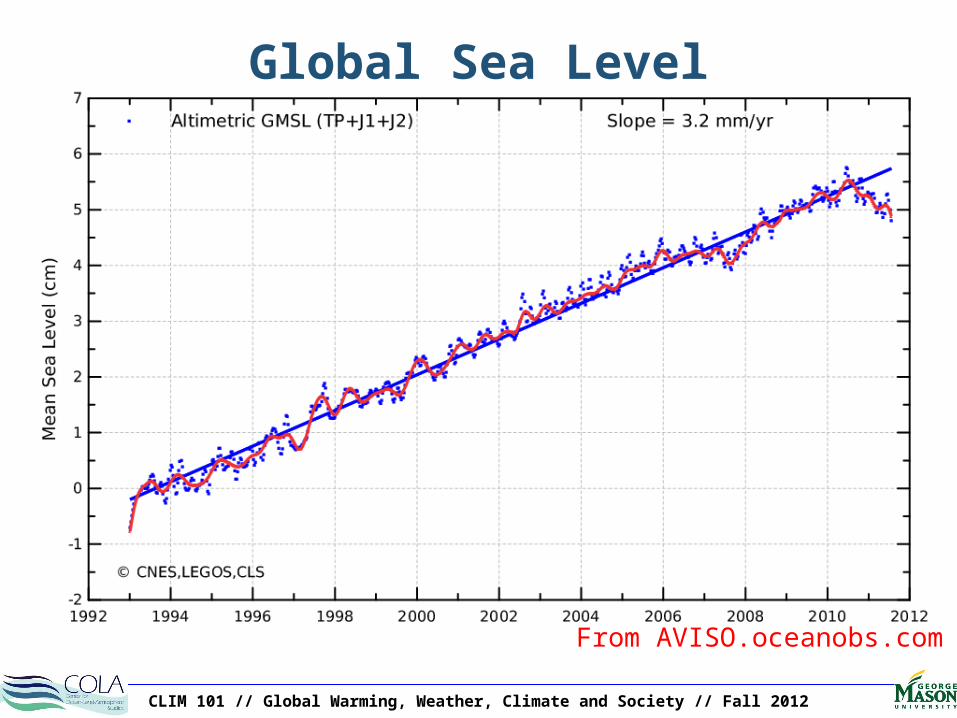
From AVISO.oceanobs.com
Global Sea Level
CLIM 101 // Global Warming, Weather, Climate and Society // Fall 2012
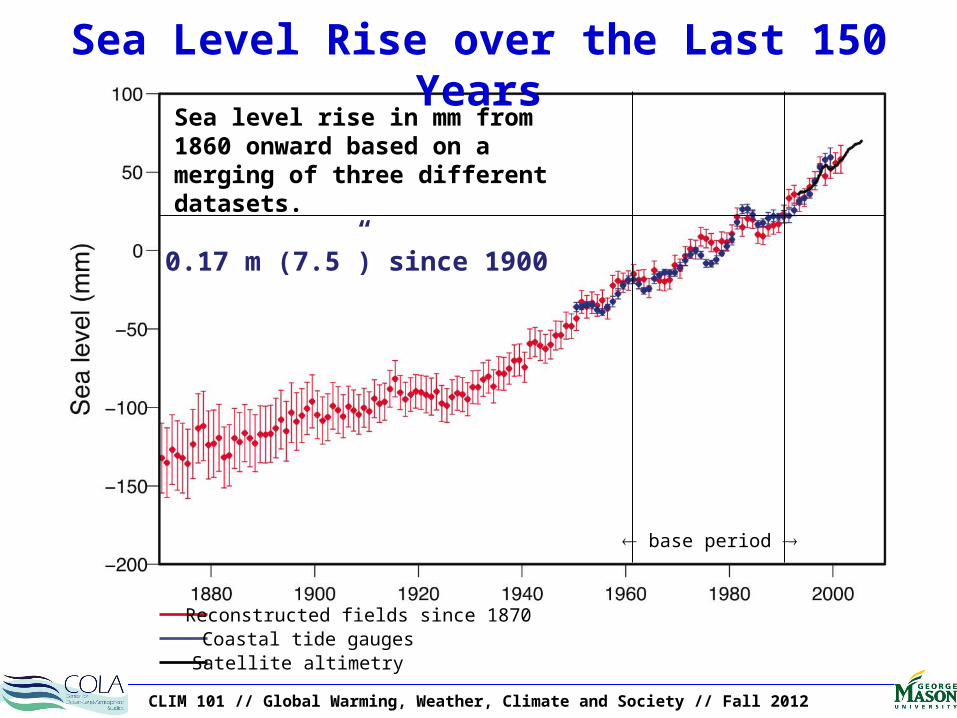
Reconstructed fields since 1870Coastal tide gaugesSatellite altimetry
base period
Sea level rise in mm from 1860 onward based on a merging of three different datasets.
Sea Level Rise over the Last 150 Years
0.17 m (7.5”) since 1900
CLIM 101 // Global Warming, Weather, Climate and Society // Fall 2012
• Cryosphere– Consists of: snow, river and lake ice, sea ice, ice shelves and ice
sheets, glaciers and ice caps, frozen ground– 2nd largest component of the climate system (75% of fresh water)– Linked to energy budget (reflection of solar radiation)– Natural sensor of climate variability (“canary in the mine”)– Important climate change variable
• Snow cover• Polar Sea ice – Arctic and Antarctic• Continental Ice Sheet – Greenland and Antarctic• Mountain Glaciers – Tropics and mid-latitude• Permafrost (Frozen Ground)
Changes in Cryosphere
CLIM 101 // Global Warming, Weather, Climate and Society // Fall 2012
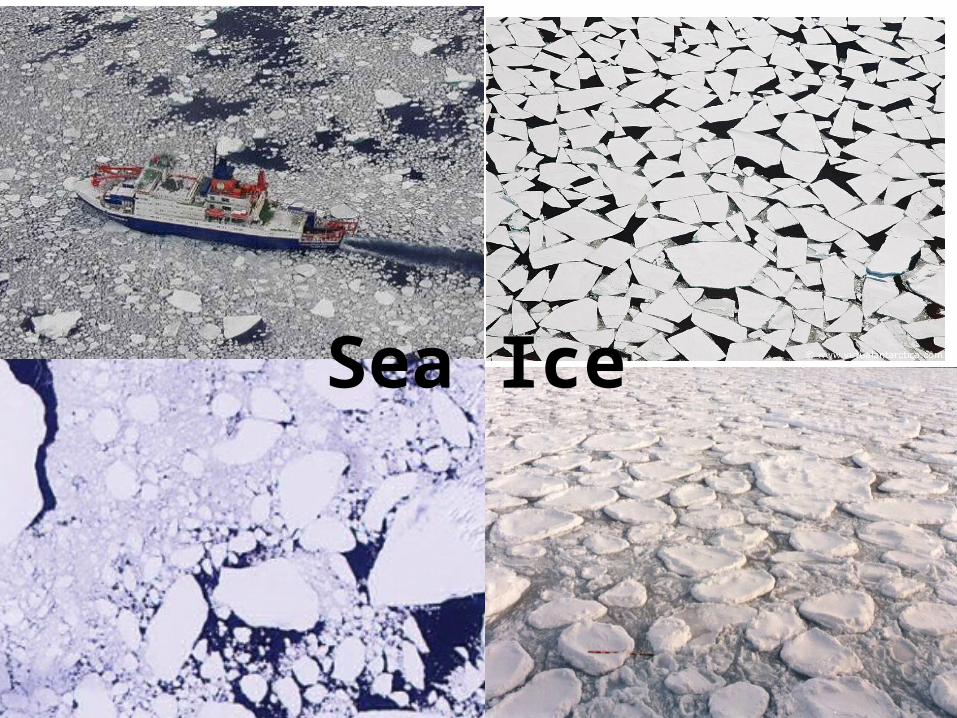
Sea Ice
CLIM 101 // Global Warming, Weather, Climate and Society // Fall 2012
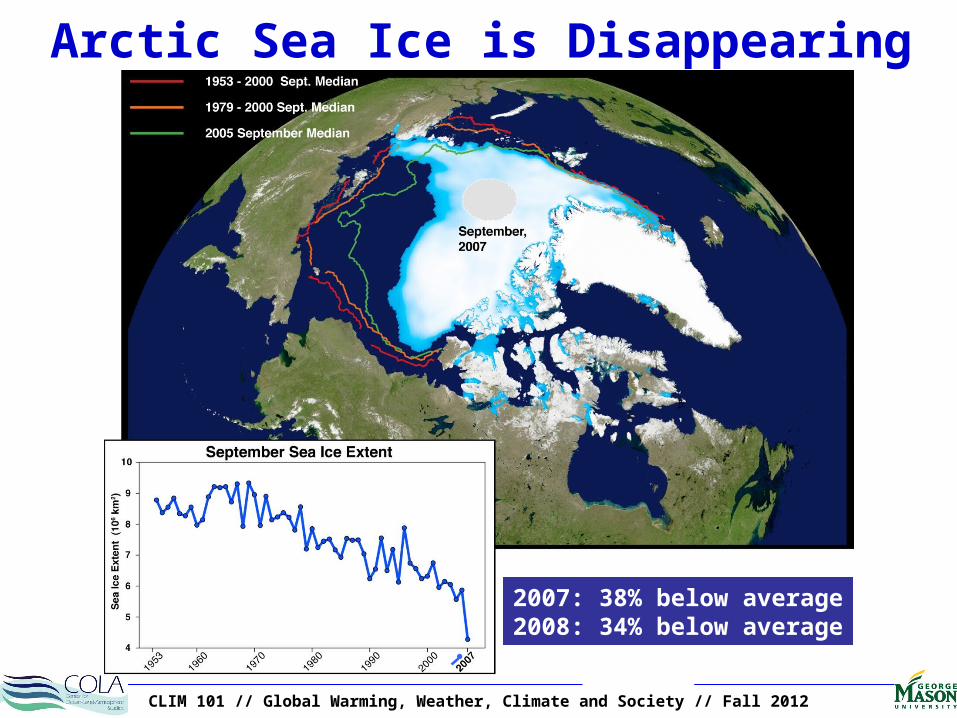
Arctic Sea Ice is Disappearing
2007: 38% below average2008: 34% below average
CLIM 101 // Global Warming, Weather, Climate and Society // Fall 2012
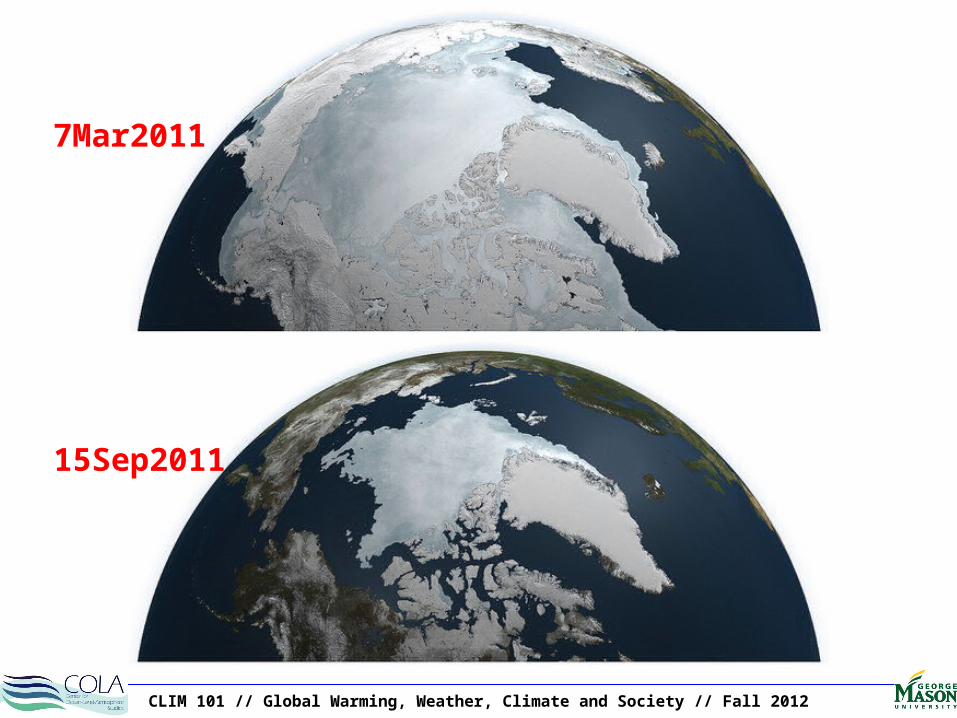
7Mar2011
15Sep2011
CLIM 101 // Global Warming, Weather, Climate and Society // Fall 2012
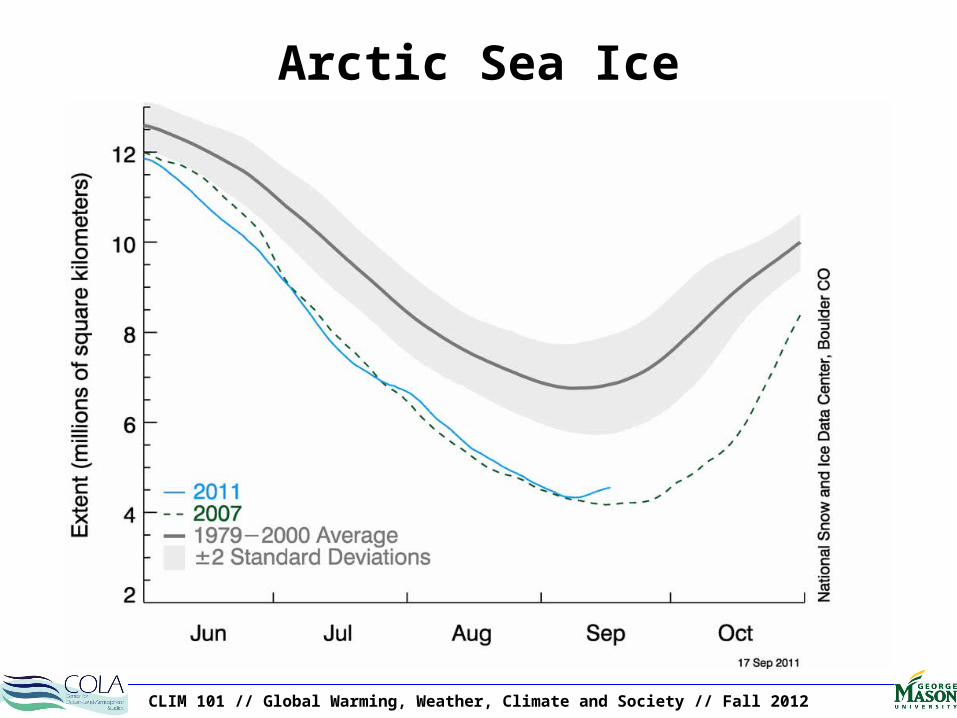
Arctic Sea Ice
CLIM 101 // Global Warming, Weather, Climate and Society // Fall 2012
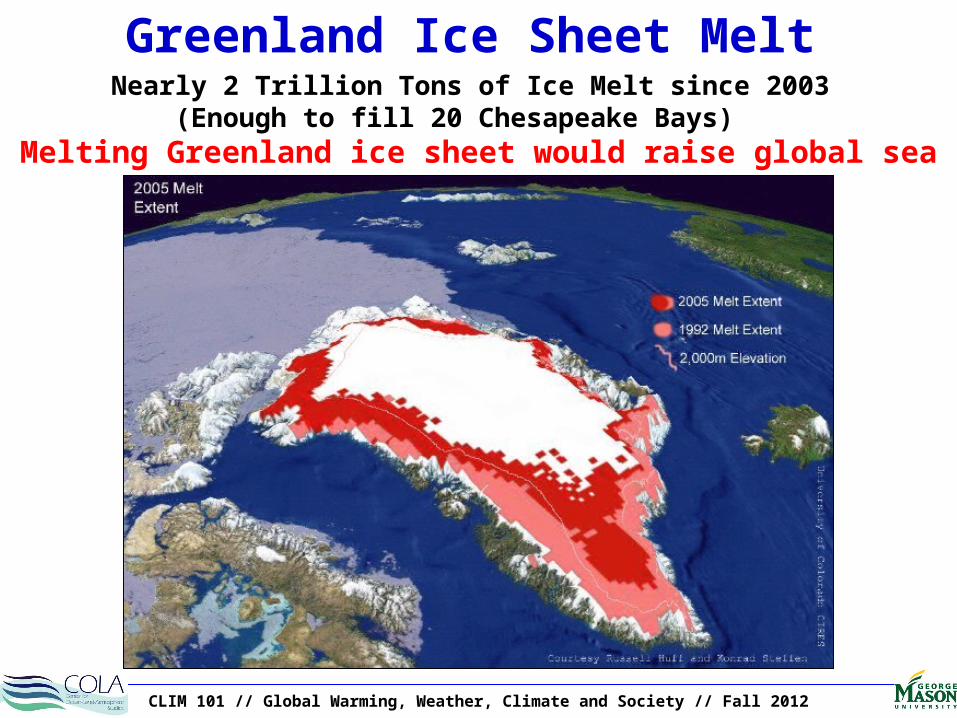
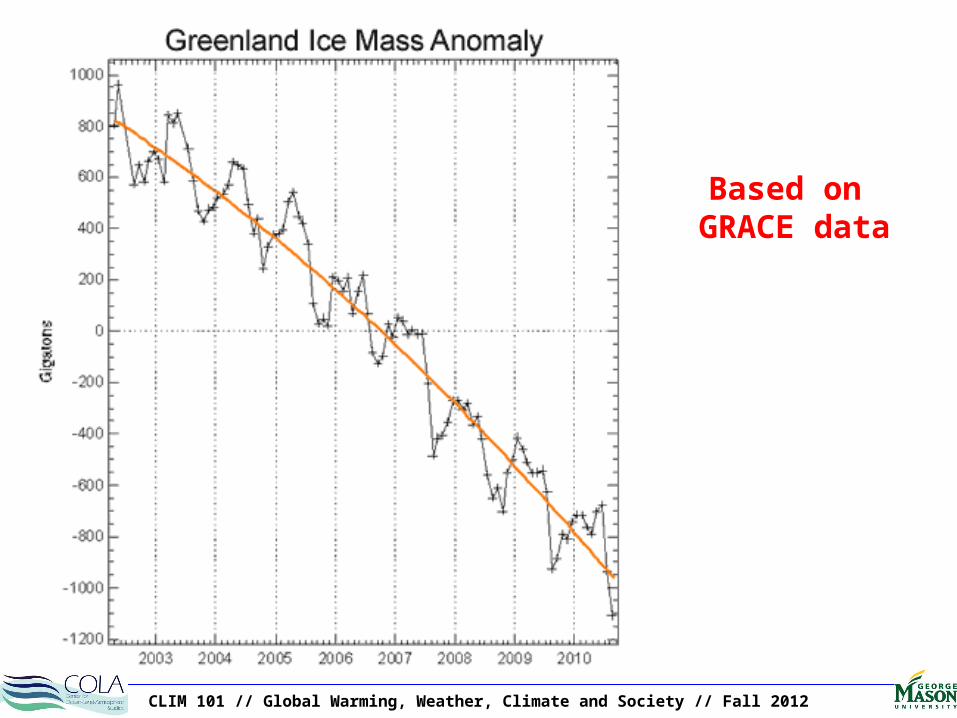
Greenland Ice Sheet MeltNearly 2 Trillion Tons of Ice Melt since 2003
(Enough to fill 20 Chesapeake Bays) Melting Greenland ice sheet would raise global sea level by 7 m.
CLIM 101 // Global Warming, Weather, Climate and Society // Fall 2012
Based on GRACE data
CLIM 101 // Global Warming, Weather, Climate and Society // Fall 2012
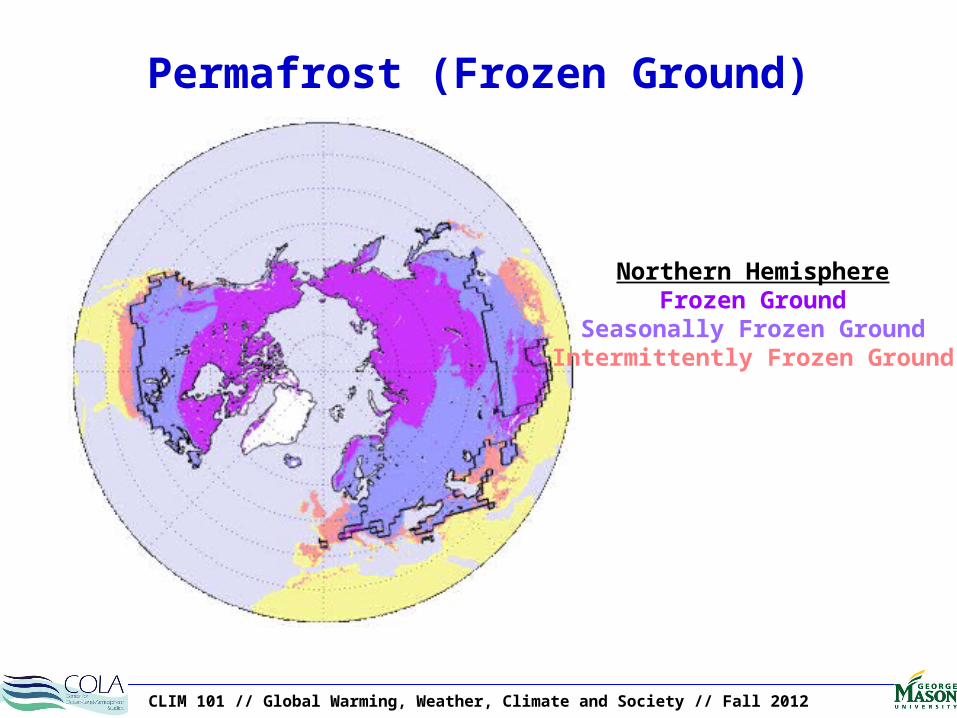
Northern HemisphereFrozen Ground
Seasonally Frozen GroundIntermittently Frozen Ground
Permafrost (Frozen Ground)
CLIM 101 // Global Warming, Weather, Climate and Society // Fall 2012
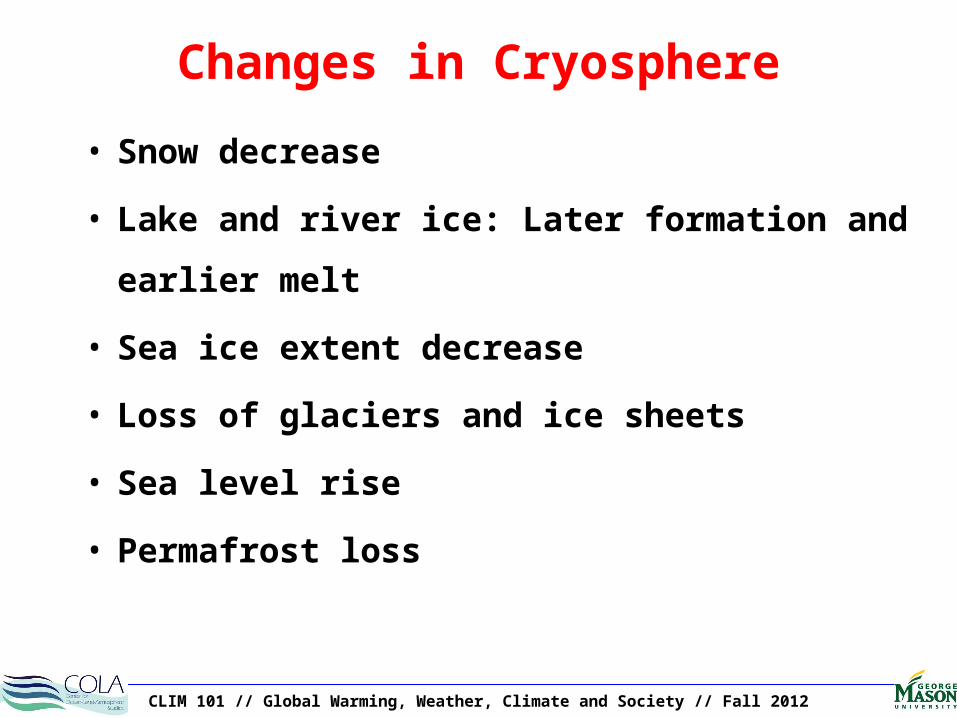
Changes in Cryosphere
• Snow decrease
• Lake and river ice: Later formation and earlier
melt
• Sea ice extent decrease
• Loss of glaciers and ice sheets
• Sea level rise
• Permafrost loss
CLIM 101 // Global Warming, Weather, Climate and Society // Fall 2012
IPCC AR4 WG-II Report
• Chapter 3 - Fresh Water• Chapter 5 - Food • Chapter 8 - Impacts on human health
http://www.ipcc.ch/ipccreports/ar4-wg2.htm
CLIM 101 // Global Warming, Weather, Climate and Society // Fall 2012
Center of Ocean-Land-Atmosphere studies
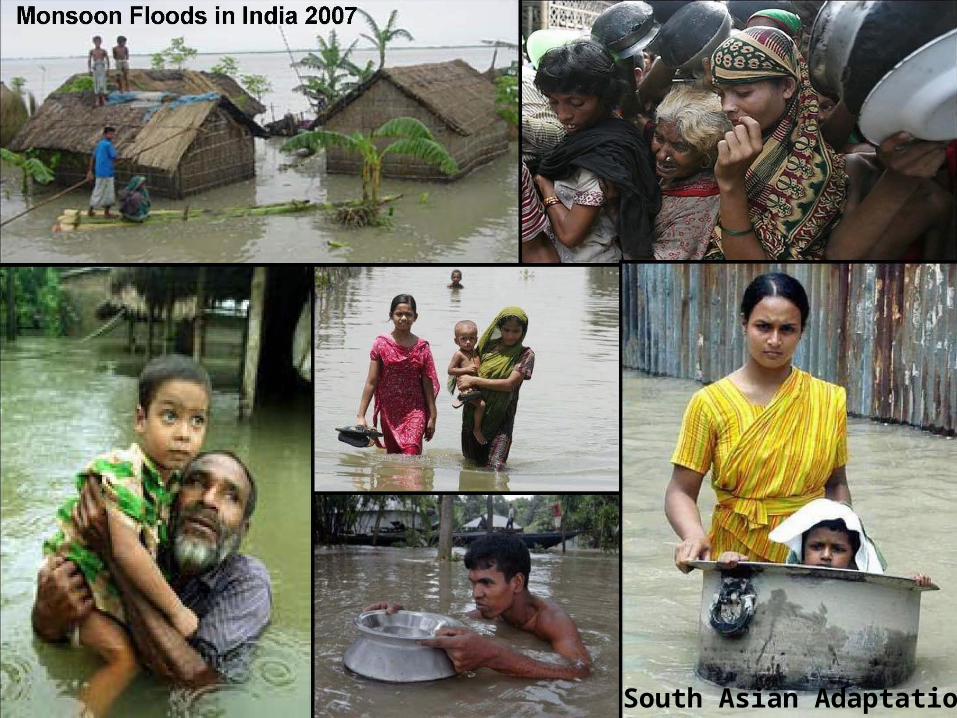
South Asian Adaptation
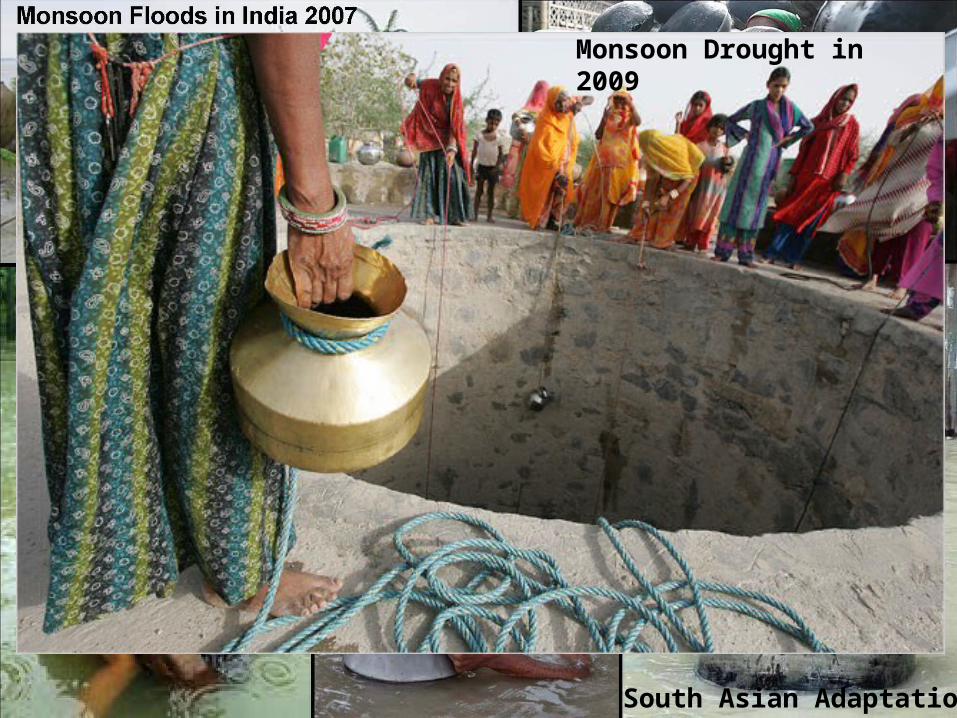
Monsoon Drought in 2009
South Asian Adaptation
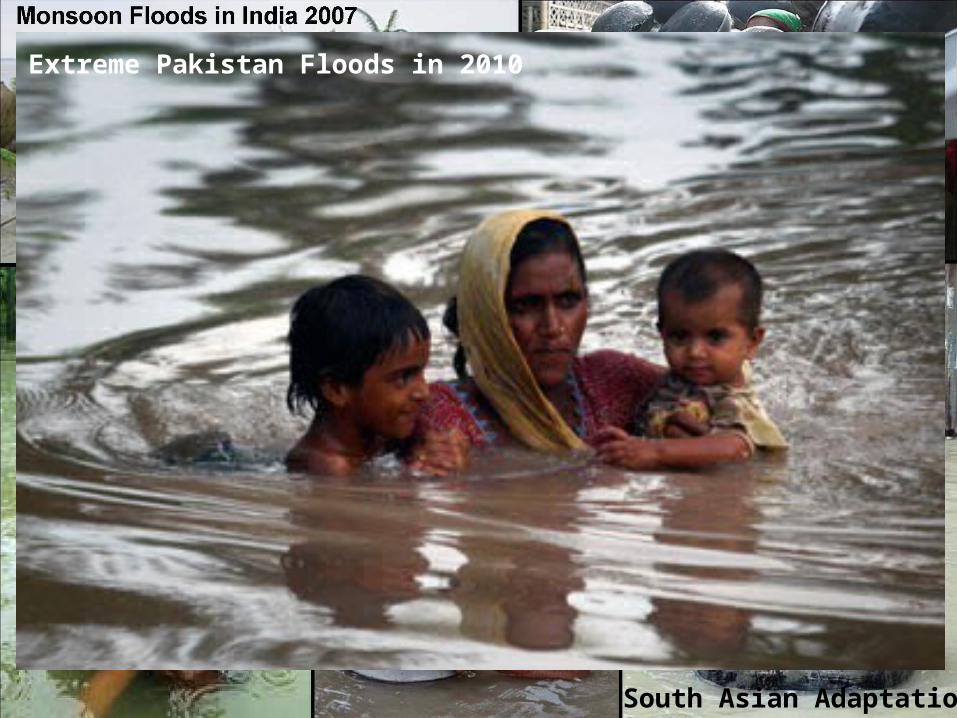
Monsoon Drought in 2009
Extreme Pakistan Floods in 2010
South Asian Adaptation
CLIM 101 // Global Warming, Weather, Climate and Society // Fall 2012
Center of Ocean-Land-Atmosphere studies
CLIM 101 // Global Warming, Weather, Climate and Society // Fall 2012
Center of Ocean-Land-Atmosphere studies
CLIM 101 // Global Warming, Weather, Climate and Society // Fall 2012
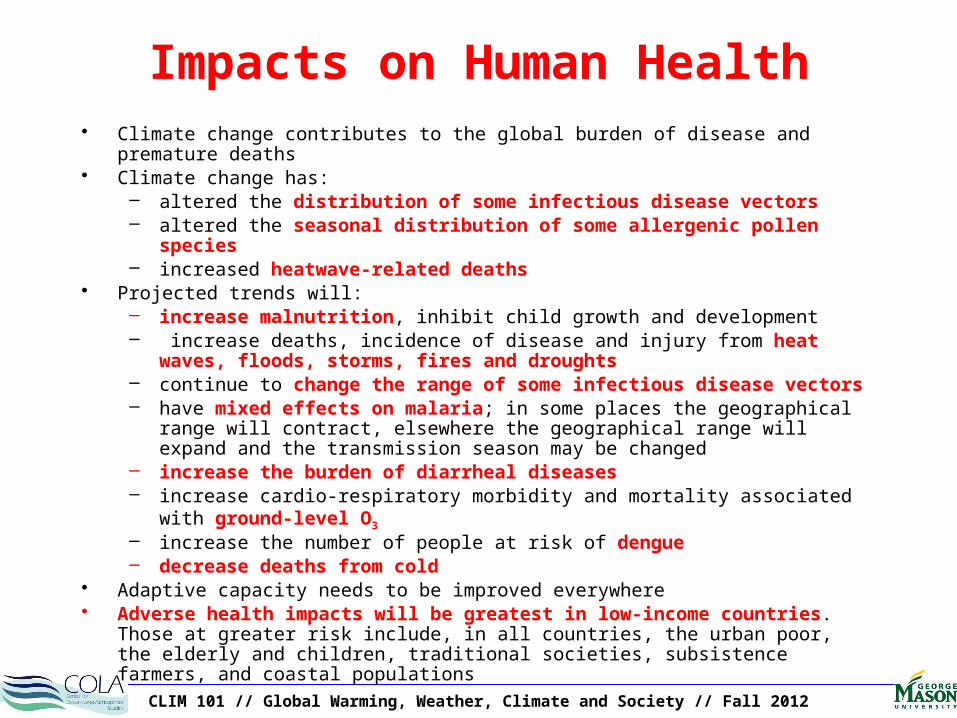
Impacts on Human Health• Climate change contributes to the global burden of disease and premature deaths• Climate change has:
– altered the distribution of some infectious disease vectors– altered the seasonal distribution of some allergenic pollen species – increased heatwave-related deaths
• Projected trends will: – increase malnutrition, inhibit child growth and development– increase deaths, incidence of disease and injury from heat waves, floods, storms,
fires and droughts – continue to change the range of some infectious disease vectors– have mixed effects on malaria; in some places the geographical range will contract,
elsewhere the geographical range will expand and the transmission season may be changed
– increase the burden of diarrheal diseases– increase cardio-respiratory morbidity and mortality associated with ground-level O3
– increase the number of people at risk of dengue – decrease deaths from cold
• Adaptive capacity needs to be improved everywhere• Adverse health impacts will be greatest in low-income countries. Those at greater risk
include, in all countries, the urban poor, the elderly and children, traditional societies, subsistence farmers, and coastal populations
CLIM 101 // Global Warming, Weather, Climate and Society // Fall 2012Stern Review
CLIM 101 // Global Warming, Weather, Climate and Society // Fall 2012
CLIM 101 // Global Warming, Weather, Climate and Society // Fall 2012
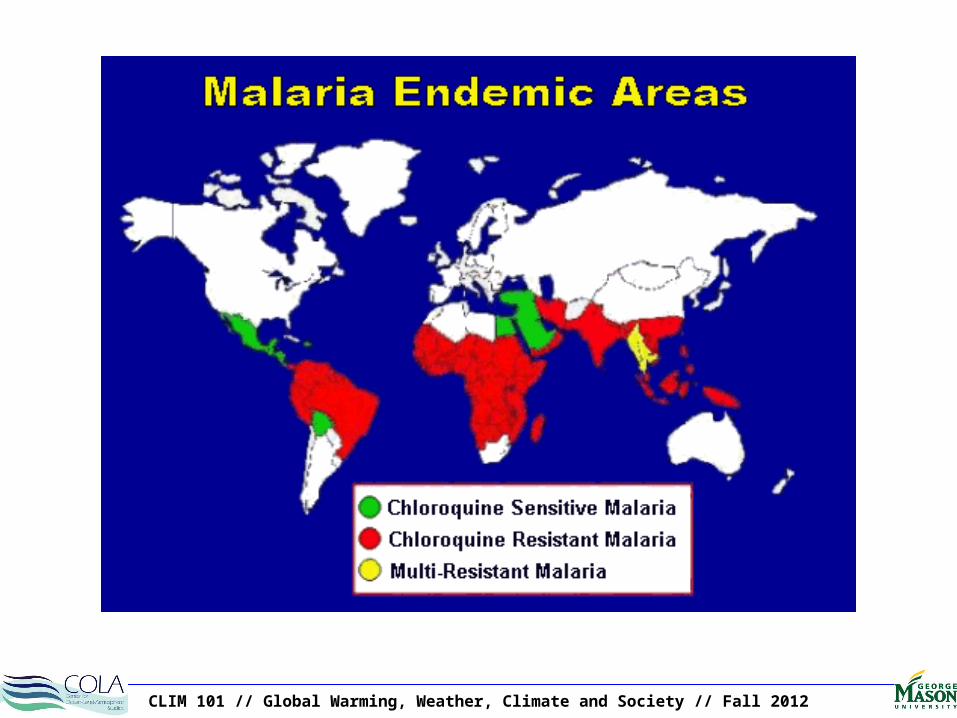
• Temperature dependence of malaria vector well known to researchers in the 1920s (e.g., A. Macdonald, Journal of the Royal Army Medical Corps)
• Maximum altitude and latitudinal range strongly determined by mean temperature
• Interactions between pathogen, vector, host, and climate are complex and not fully understood
• Weaker links between disease incidence and climate within endemic regions
• Vectors are subject to significant control measures in developed world, confounding link to climate.
Climate and Malaria
CLIM 101 // Global Warming, Weather, Climate and Society // Fall 2012
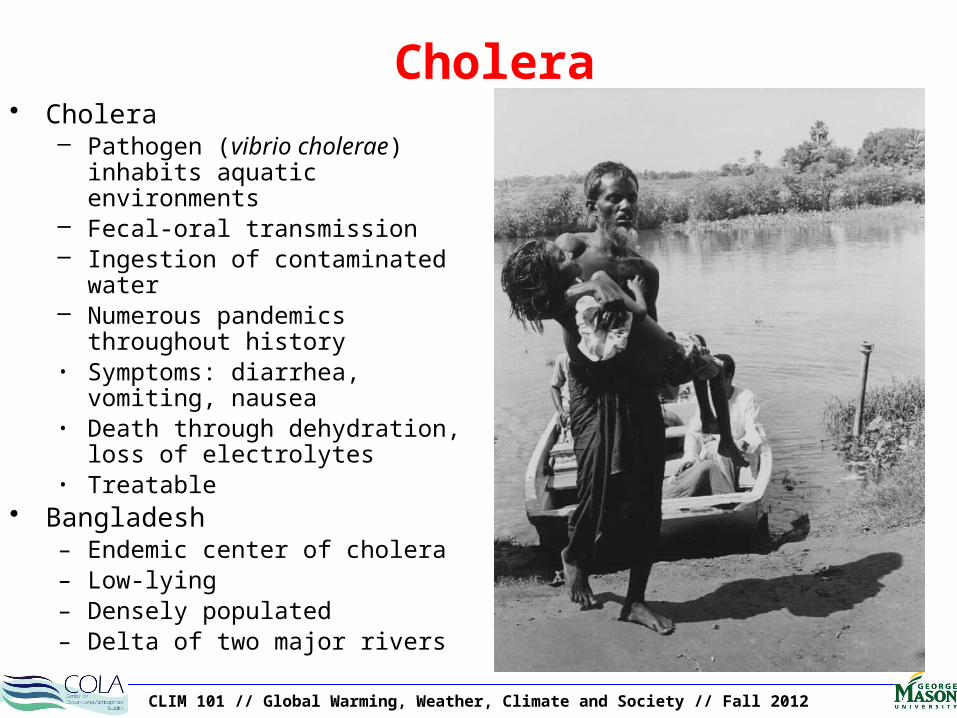
Cholera• Cholera
– Pathogen (vibrio cholerae) inhabits aquatic environments
– Fecal-oral transmission– Ingestion of contaminated water– Numerous pandemics throughout
history• Symptoms: diarrhea, vomiting,
nausea• Death through dehydration, loss of
electrolytes• Treatable
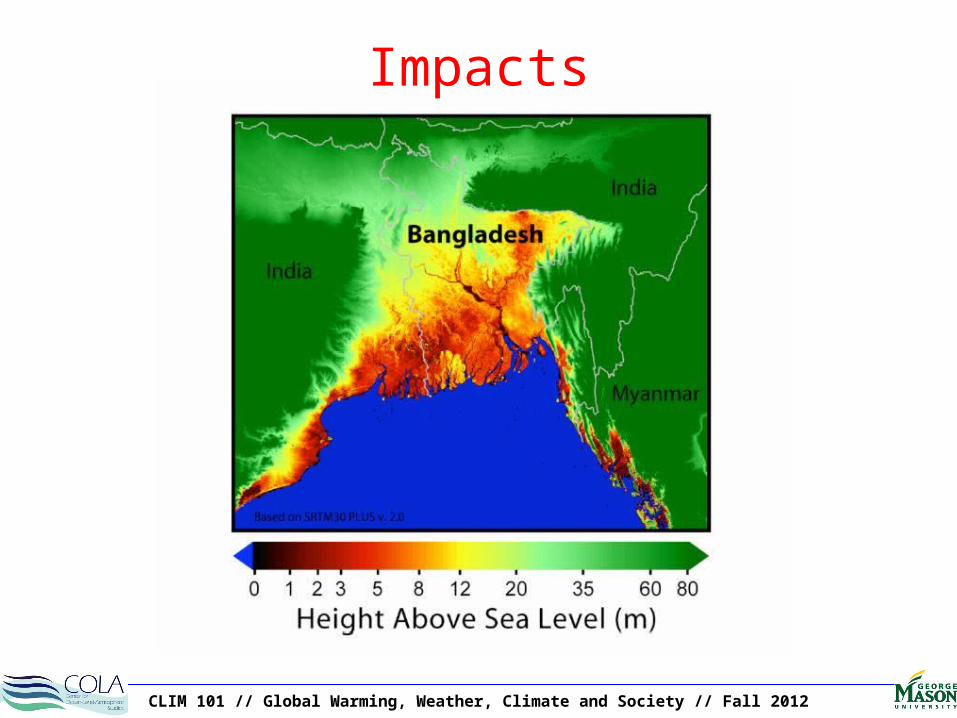
• Bangladesh– Endemic center of cholera– Low-lying– Densely populated– Delta of two major rivers
CLIM 101 // Global Warming, Weather, Climate and Society // Fall 2012
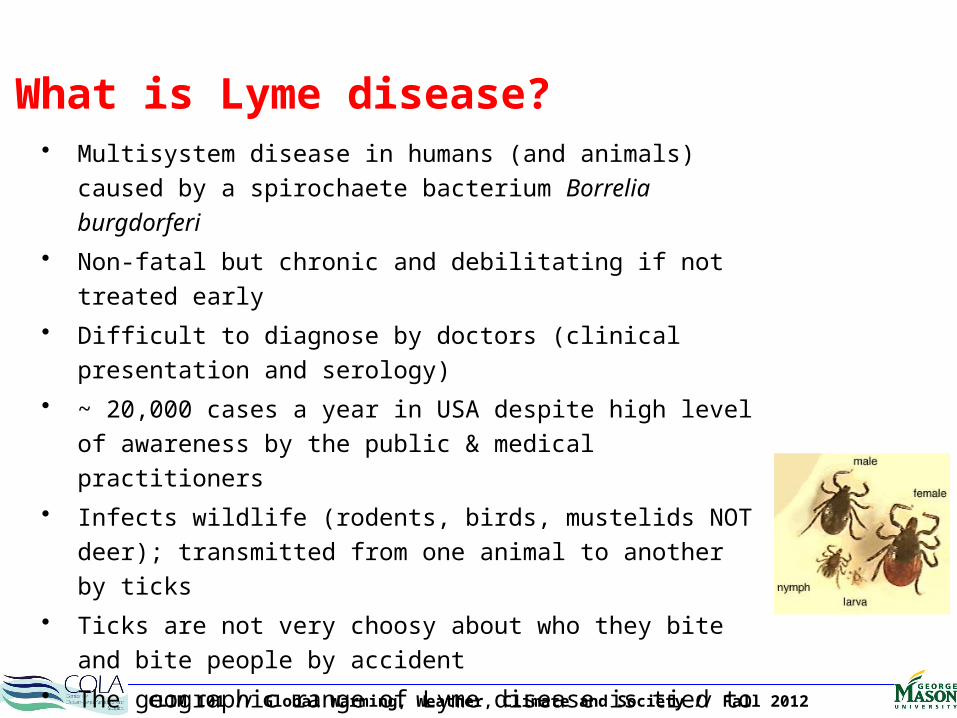
What is Lyme disease?• Multisystem disease in humans (and animals) caused by
a spirochaete bacterium Borrelia burgdorferi
• Non-fatal but chronic and debilitating if not treated early
• Difficult to diagnose by doctors (clinical presentation and serology)
• ~ 20,000 cases a year in USA despite high level of awareness by the public & medical practitioners
• Infects wildlife (rodents, birds, mustelids NOT deer); transmitted from one animal to another by ticks
• Ticks are not very choosy about who they bite and bite people by accident
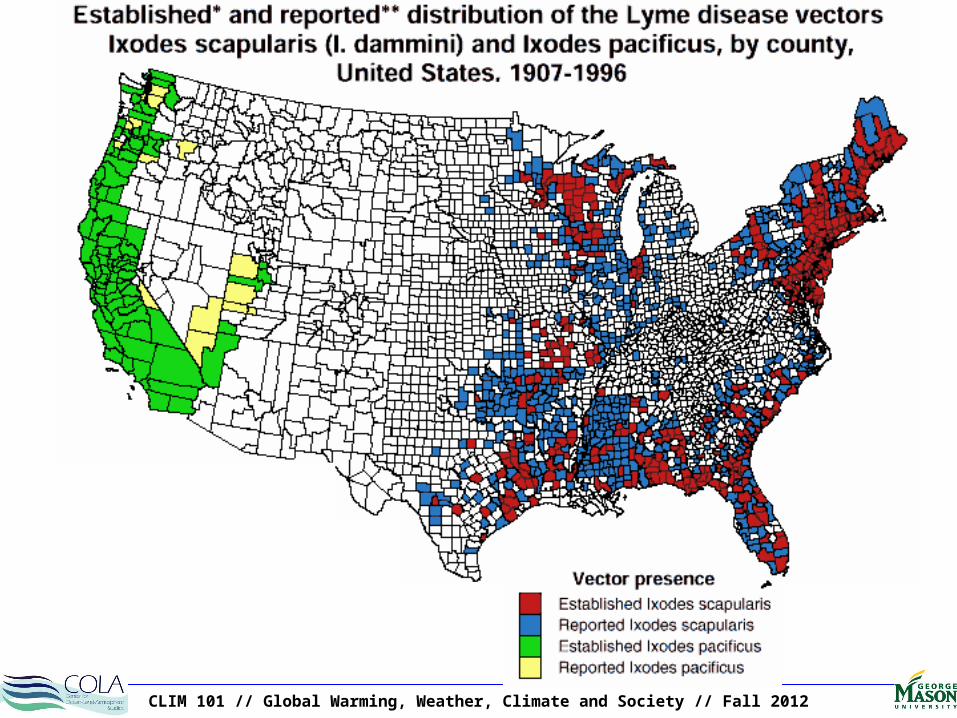
• The geographic range of Lyme disease is tied to that of its tick vectors
CLIM 101 // Global Warming, Weather, Climate and Society // Fall 2012
CLIM 101 // Global Warming, Weather, Climate and Society // Fall 2012
Impact of Climate Change on Lyme Disease in Canada
• A northward expansion of the range of Ixodes scapularis, associated with climate change, is likely because:– Tick survival increases dramatically
– Ticks are being carried into Canada each year on migratory birds
– The habitat in many areas is suitable for tick survival
• Chaotic weather (heavy rainfall and droughts) may inhibit spread
• Spread into central Provinces may be limited by low rainfall
CLIM 101 // Global Warming, Weather, Climate and Society // Fall 2012
Fresh Water Resources and their Management
• The impacts of climate change on freshwater systems and their management are mainly due to the observed and projected increases in temperature, sea level and precipitation variability.
• Semi-arid and arid areas are particularly exposed to the impacts of climate change on freshwater.
• Higher water temperatures, increased precipitation intensity, and longer periods of low flows exacerbate many forms of water pollution, with impacts on ecosystems, human health, water system reliability and operating costs.
• Climate change affects the function and operation of existing water infrastructure as well as water management practices.
• Adaptation procedures and risk management practices for the water sector are being developed in some countries and regions (e.g., Caribbean, Canada, Australia, Netherlands, UK, USA, Germany) that have recognized projected hydrological changes with related uncertainties.
• The negative impacts of climate change on freshwater systems outweigh its benefits.

CLIM 101 // Global Warming, Weather, Climate and Society // Fall 2012
Impact of Climate Change on World Food Prices
Cereal prices versus global mean temperature change
CLIM 101 // Global Warming, Weather, Climate and Society // Fall 2012
Summary
• Projected changes in the frequency and severity of extreme climate events will have more serious consequences for food and forestry production, and food insecurity, than will changes in projected means of temperature and precipitation.
• Climate change increases the number of people at risk of hunger (high confidence). The impact of chosen socioeconomic pathways (SRES scenario) on the numbers of people at risk of hunger is significantly greater than the impact of climate change. Climate change will further shift the focus of food insecurity to sub-Saharan Africa.
• While moderate warming benefits crop and pasture yields in mid- to high-latitude regions, even slight warming decreases yields in seasonally dry and low-latitude regions.
• Experimental research on crop response to elevated CO2 confirms Third Assessment Report (TAR) findings). New Free-Air Carbon Dioxide Enrichment (FACE) results suggest lower responses for forests. Cropmodels include CO2 estimates close to the upper range of new research (high confidence), while forest models may overestimate CO2 effects.
• Globally, commercial timber productivity rises modestly with climate change in the short and medium term, with large regional variability around the global trend.
• Local extinctions of particular fish species are expected at edges of ranges.
• Food and forestry trade is projected to increase in response to climate change, with increased dependence of most developing countries on food imports.
• Simulations suggest rising relative benefits of adaptation with low to moderate warming, although adaptation may stress water and environmental resources as warming increases.
CLIM 101 // Global Warming, Weather, Climate and Society // Fall 2012
Consequences of Global Warming
CLIM 101 // Global Warming, Weather, Climate and Society // Fall 2012
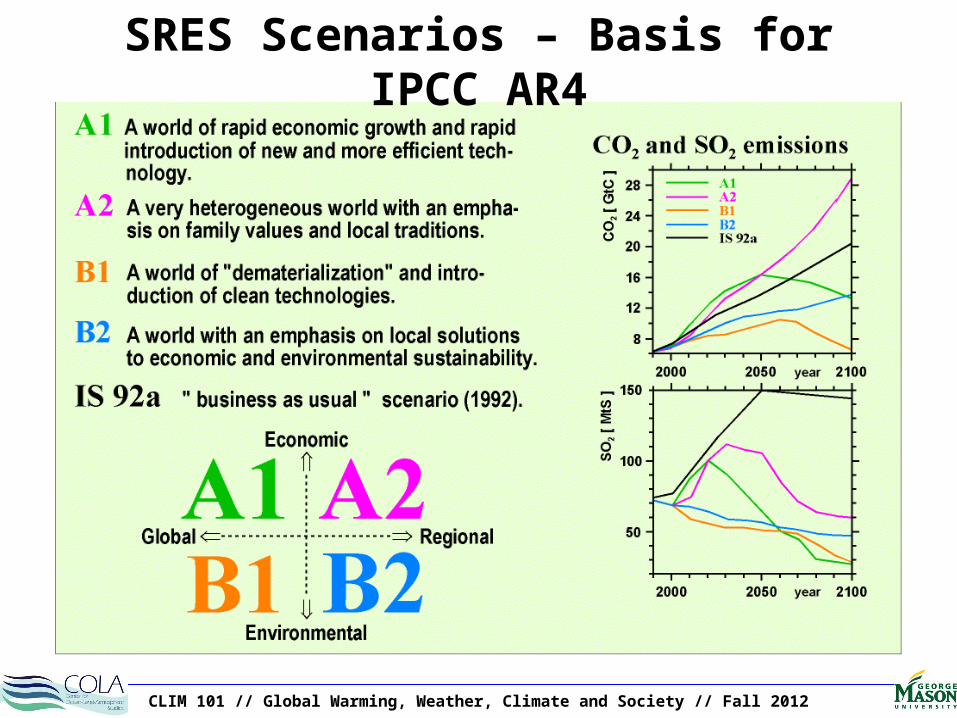
SRES Scenarios – Basis for IPCC AR4
CLIM 101 // Global Warming, Weather, Climate and Society // Fall 2012
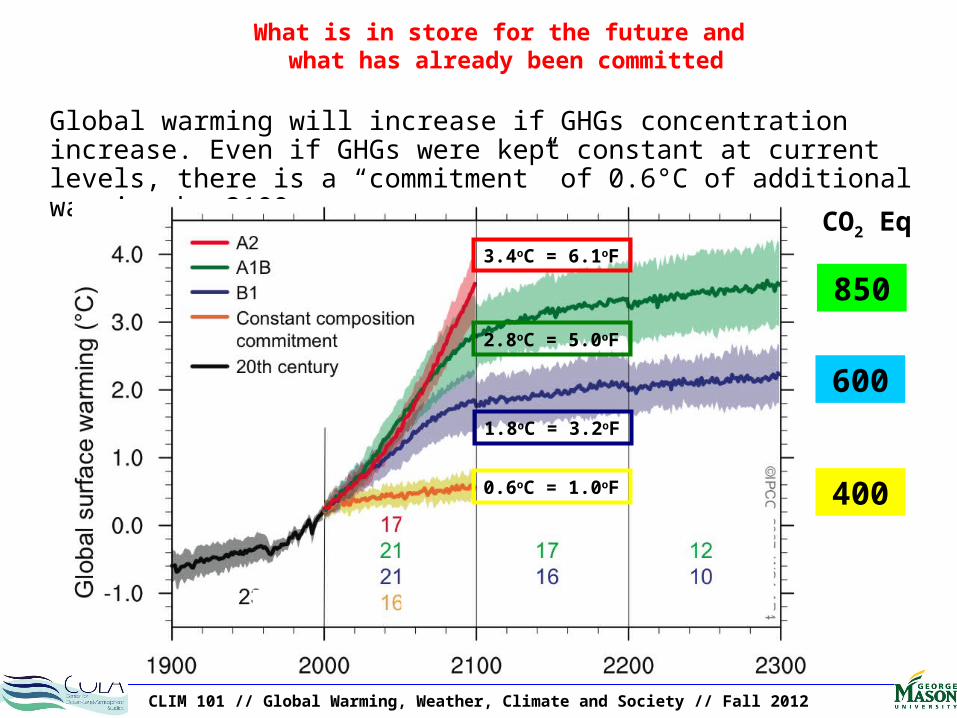
What is in store for the future and what has already been committed
Global warming will increase if GHGs concentration increase. Even if GHGs were kept constant at current levels, there is a “commitment” of 0.6°C of additional warming by 2100.
1.8oC = 3.2oF
2.8oC = 5.0oF
3.4oC = 6.1oF
CO2 Eq
850
600
4000.6oC = 1.0oF
CLIM 101 // Global Warming, Weather, Climate and Society // Fall 2012
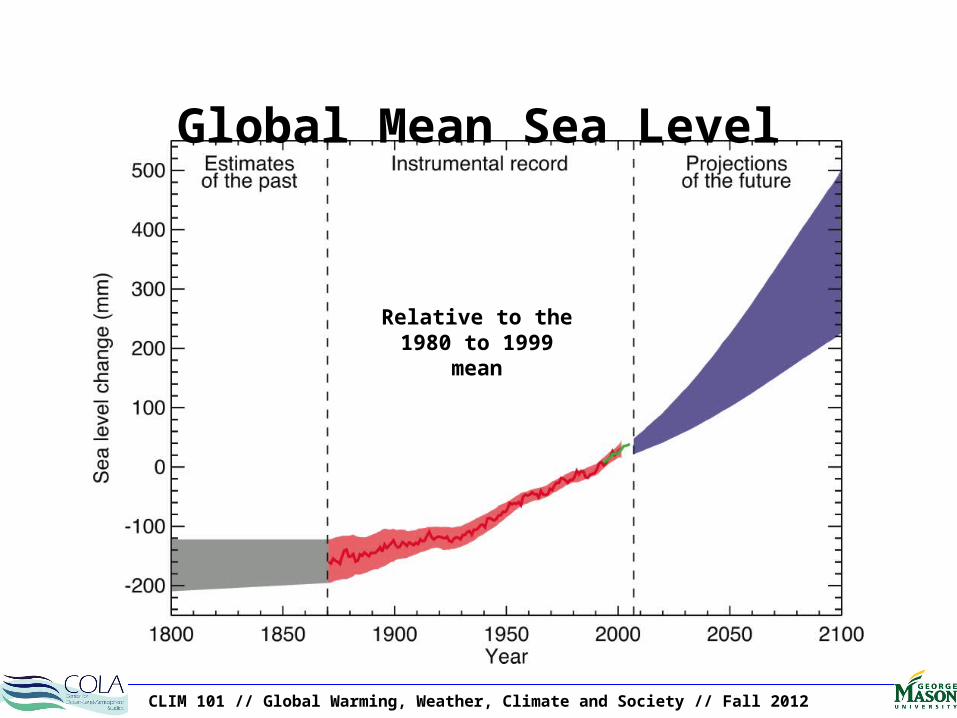
Relative to the 1980 to 1999 mean
Global Mean Sea Level
CLIM 101 // Global Warming, Weather, Climate and Society // Fall 2012
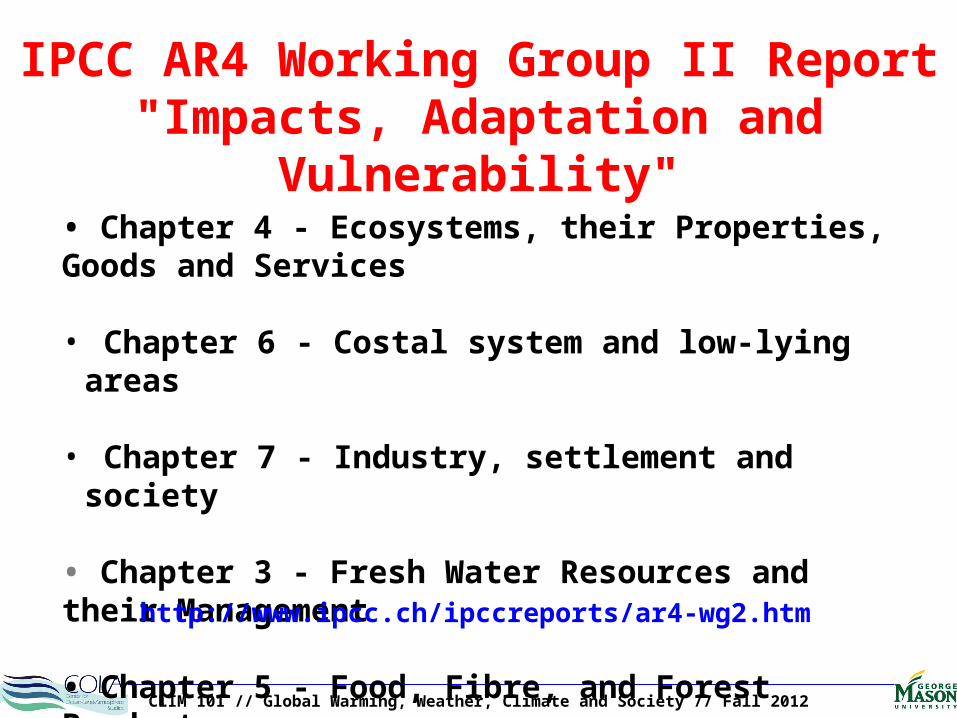
IPCC AR4 Working Group II Report "Impacts, Adaptation and
Vulnerability"• Chapter 4 - Ecosystems, their Properties, Goods and Services
• Chapter 6 - Costal system and low-lying areas
• Chapter 7 - Industry, settlement and society
• Chapter 3 - Fresh Water Resources and their Management
• Chapter 5 - Food, Fibre, and Forest Products
• Chapter 8 - Impacts on human health
http://www.ipcc.ch/ipccreports/ar4-wg2.htm
CLIM 101 // Global Warming, Weather, Climate and Society // Fall 2012
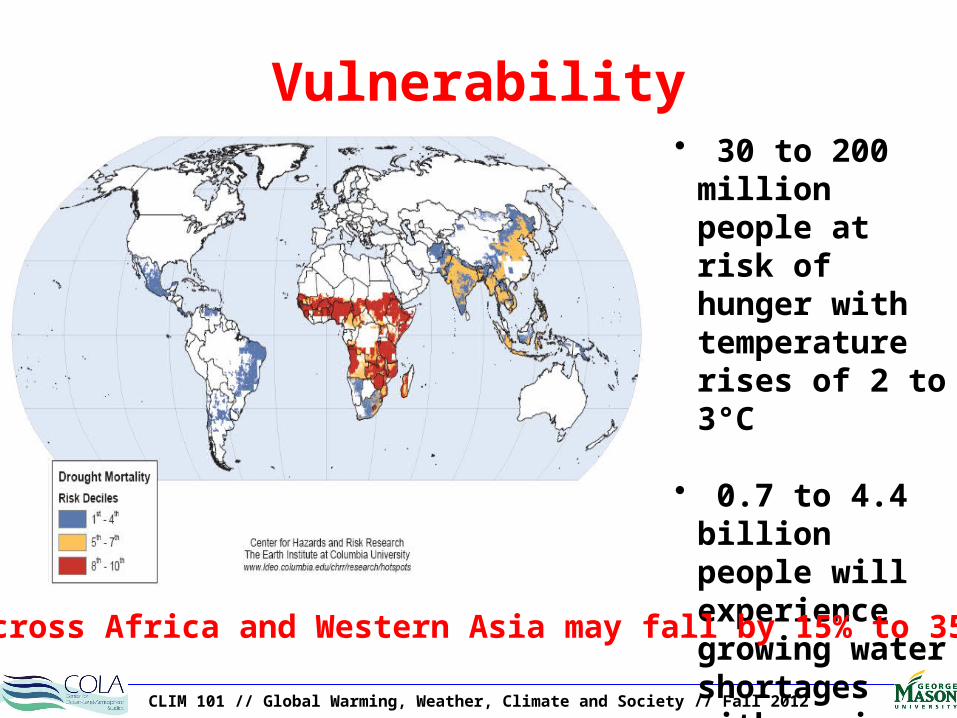
Vulnerability• 30 to 200
million people at risk of hunger with temperature rises of 2 to 3°C
• 0.7 to 4.4 billion people will experience growing water shortages with a rise of 2°CYields across Africa and Western Asia may fall by 15% to 35%
CLIM 101 // Global Warming, Weather, Climate and Society // Fall 2012
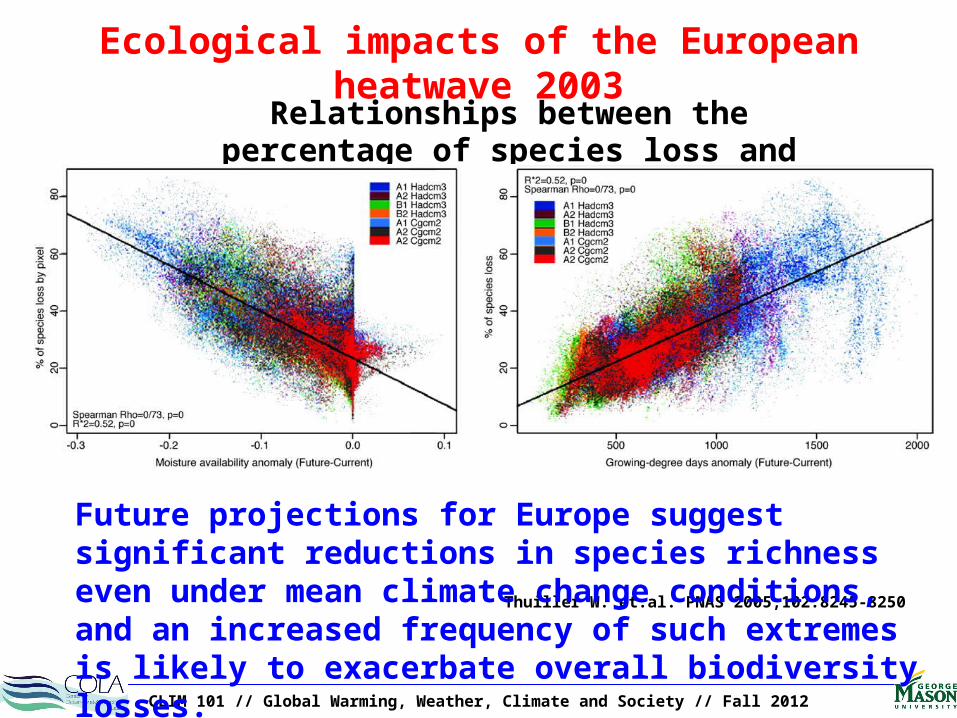
Ecological impacts of the European heatwave 2003
Relationships between the percentage of species loss and anomalies of moisture
availability and growing-degree days
Thuiller W. et.al. PNAS 2005;102:8245-8250
Future projections for Europe suggest significant reductions in species richness even under mean climate change conditions, and an increased frequency of such extremes is likely to exacerbate overall biodiversity losses.
CLIM 101 // Global Warming, Weather, Climate and Society // Fall 2012
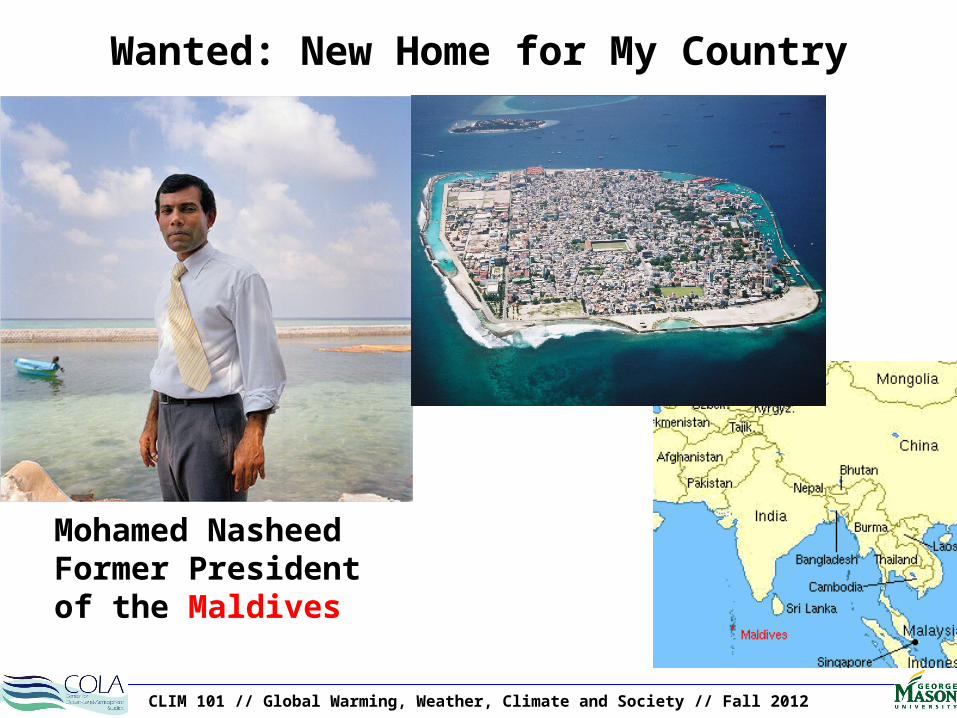
Mohamed Nasheed Former President of
the Maldives
Wanted: New Home for My Country
CLIM 101 // Global Warming, Weather, Climate and Society // Fall 2012
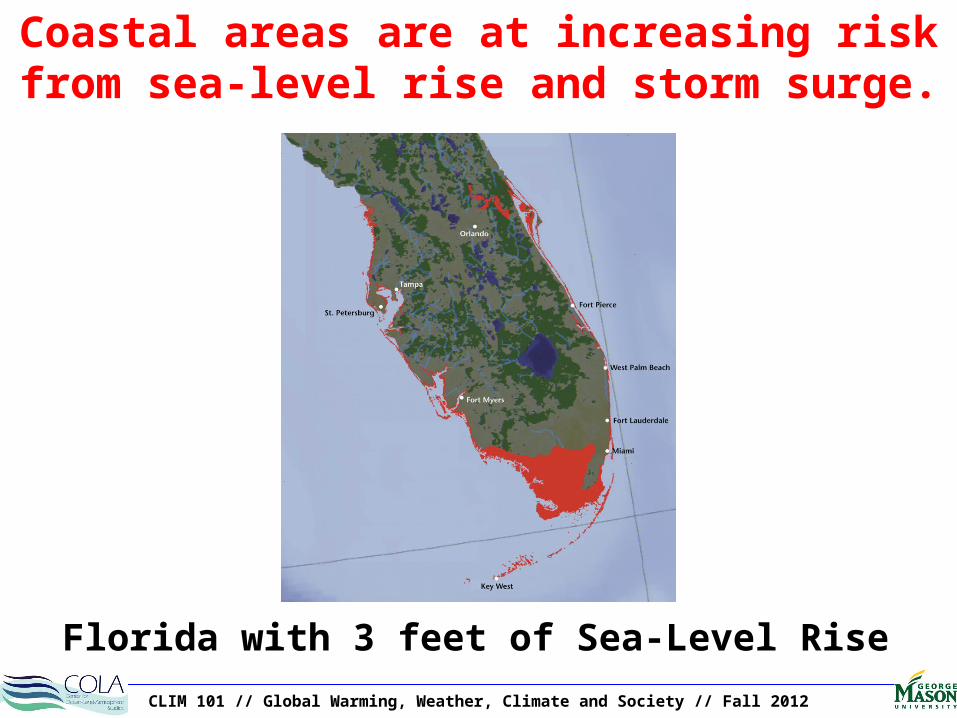
Florida with 3 feet of Sea-Level Rise
Coastal areas are at increasing risk from sea-level rise and storm surge.
CLIM 101 // Global Warming, Weather, Climate and Society // Fall 2012
Impacts
CLIM 101 // Global Warming, Weather, Climate and Society // Fall 2012
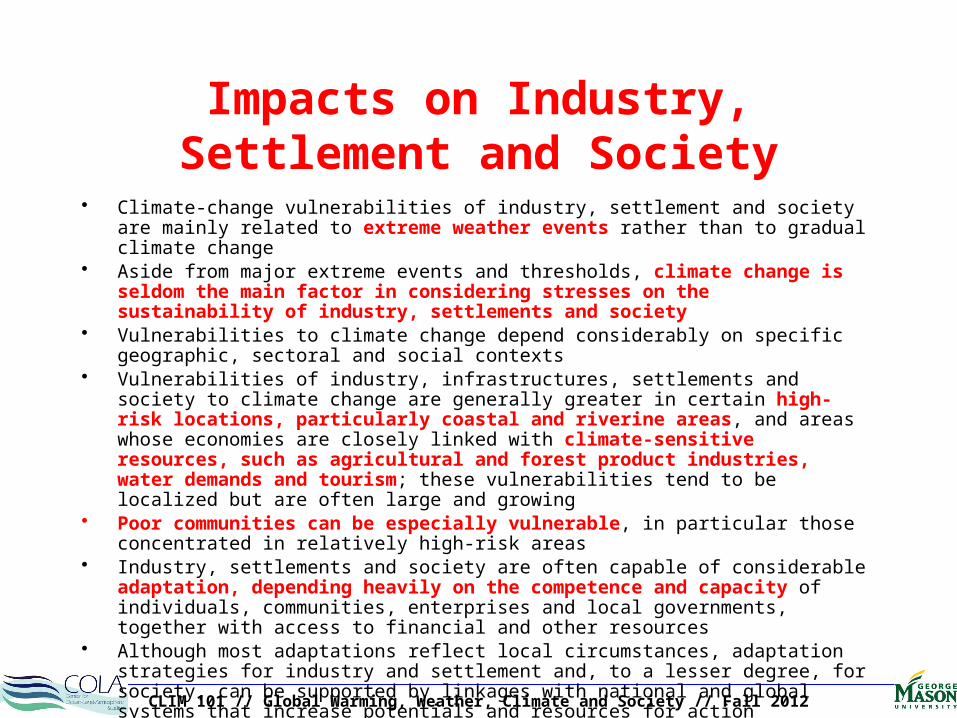
Impacts on Industry, Settlement and Society
• Climate-change vulnerabilities of industry, settlement and society are mainly related to extreme weather events rather than to gradual climate change
• Aside from major extreme events and thresholds, climate change is seldom the main factor in considering stresses on the sustainability of industry, settlements and society
• Vulnerabilities to climate change depend considerably on specific geographic, sectoral and social contexts
• Vulnerabilities of industry, infrastructures, settlements and society to climate change are generally greater in certain high-risk locations, particularly coastal and riverine areas, and areas whose economies are closely linked with climate-sensitive resources, such as agricultural and forest product industries, water demands and tourism; these vulnerabilities tend to be localized but are often large and growing
• Poor communities can be especially vulnerable, in particular those concentrated in relatively high-risk areas
• Industry, settlements and society are often capable of considerable adaptation, depending heavily on the competence and capacity of individuals, communities, enterprises and local governments, together with access to financial and other resources
• Although most adaptations reflect local circumstances, adaptation strategies for industry and settlement and, to a lesser degree, for society, can be supported by linkages with national and global systems that increase potentials and resources for action
CLIM 101 // Global Warming, Weather, Climate and Society // Fall 2012
Extreme and rare events are increasing with time …
CLIM 101 // Global Warming, Weather, Climate and Society // Fall 2012
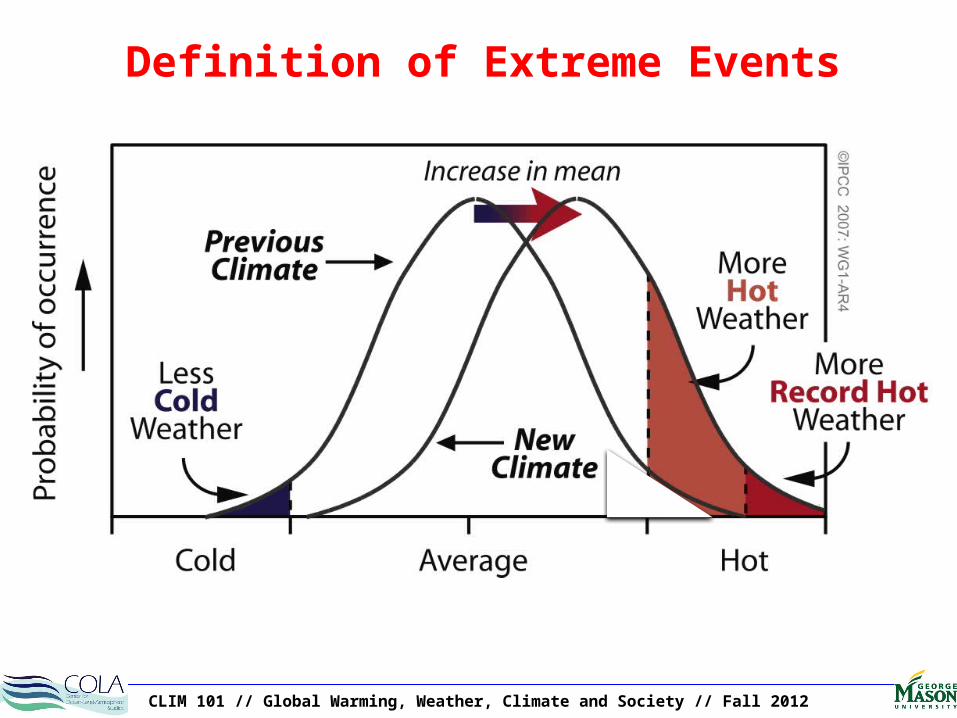
Definition of Extreme Events
CLIM 101 // Global Warming, Weather, Climate and Society // Fall 2012
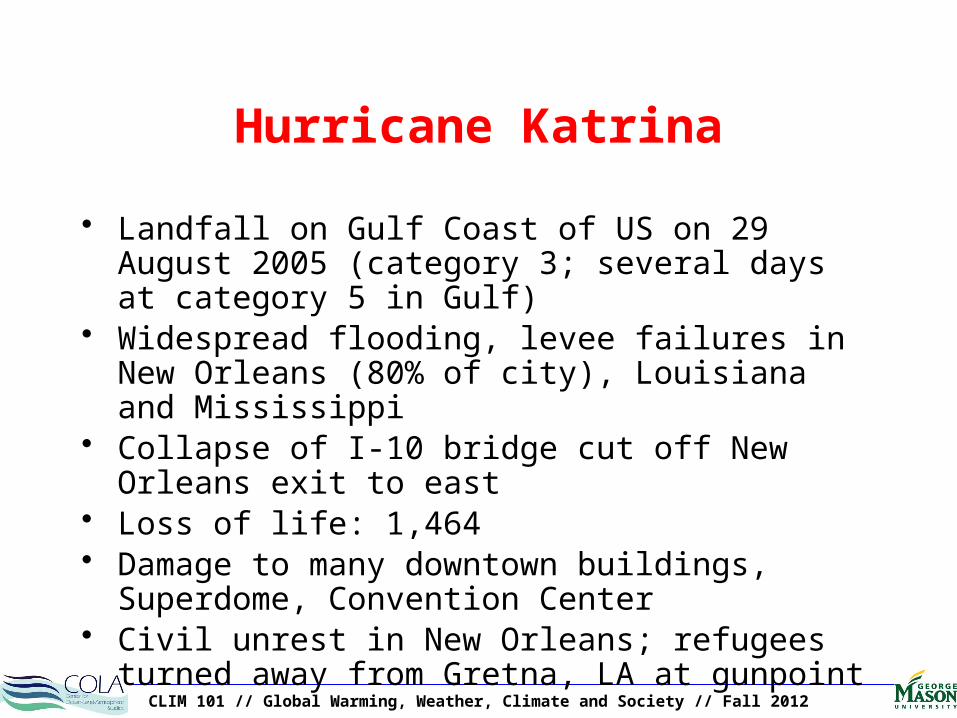
Hurricane Katrina
• Landfall on Gulf Coast of US on 29 August 2005 (category 3; several days at category 5 in Gulf)
• Widespread flooding, levee failures in New Orleans (80% of city), Louisiana and Mississippi
• Collapse of I-10 bridge cut off New Orleans exit to east
• Loss of life: 1,464• Damage to many downtown buildings, Superdome,
Convention Center• Civil unrest in New Orleans; refugees turned away
from Gretna, LA at gunpoint
CLIM 101 // Global Warming, Weather, Climate and Society // Fall 2012
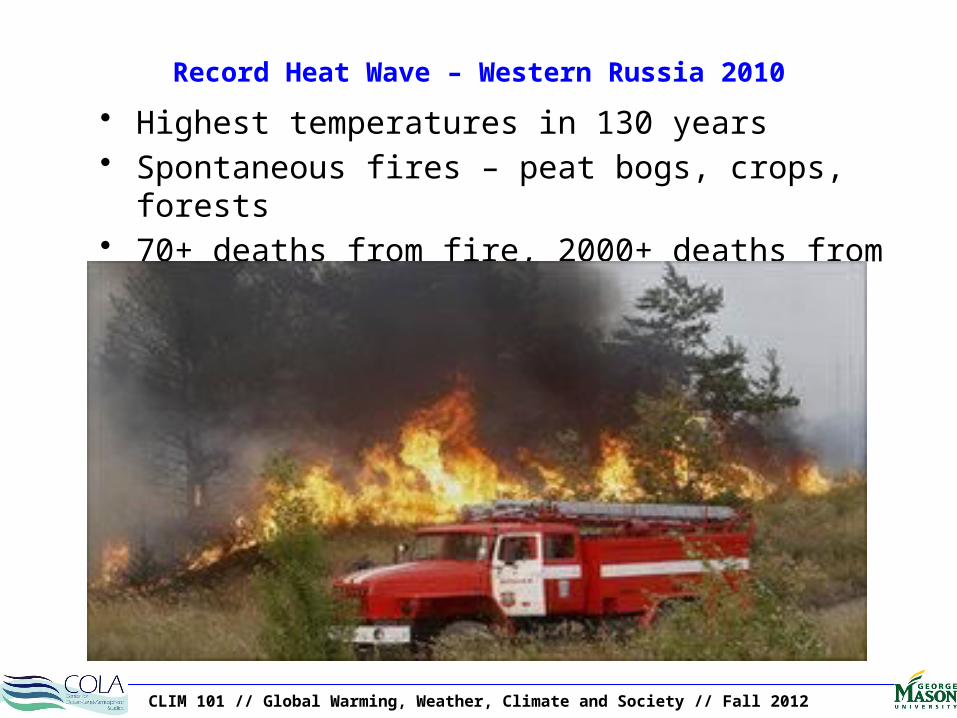
Record Heat Wave – Western Russia 2010
• Highest temperatures in 130 years• Spontaneous fires – peat bogs, crops, forests• 70+ deaths from fire, 2000+ deaths from drowning
CLIM 101 // Global Warming, Weather, Climate and Society // Fall 2012
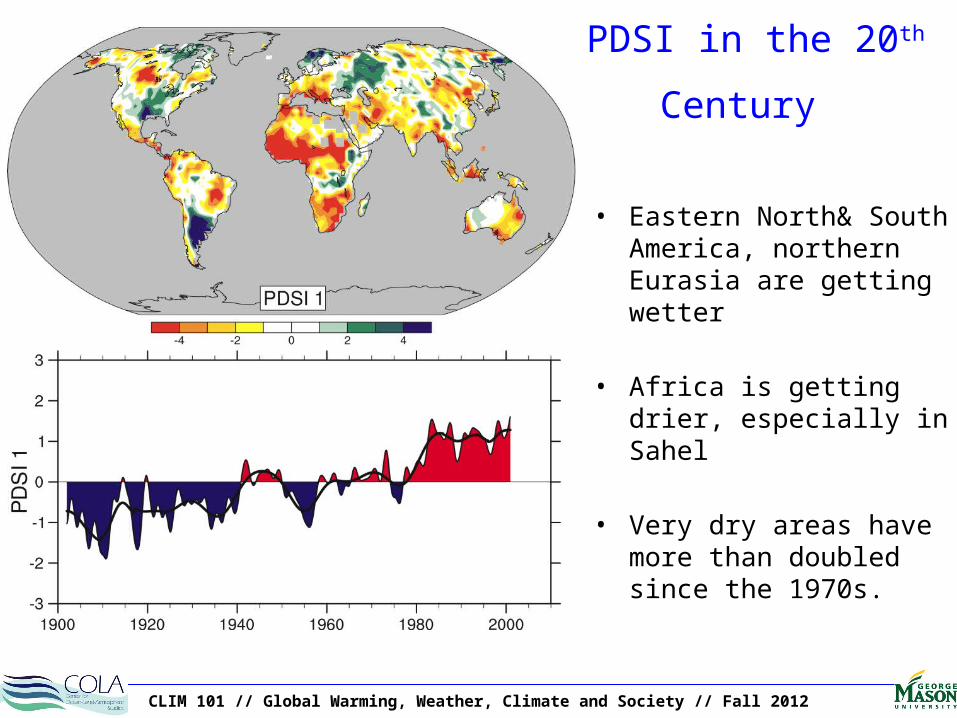
PDSI in the 20th
Century
• Eastern North& South America, northern Eurasia are getting wetter
• Africa is getting drier, especially in Sahel
• Very dry areas have more than doubled since the 1970s.
CLIM 101 // Global Warming, Weather, Climate and Society // Fall 2012
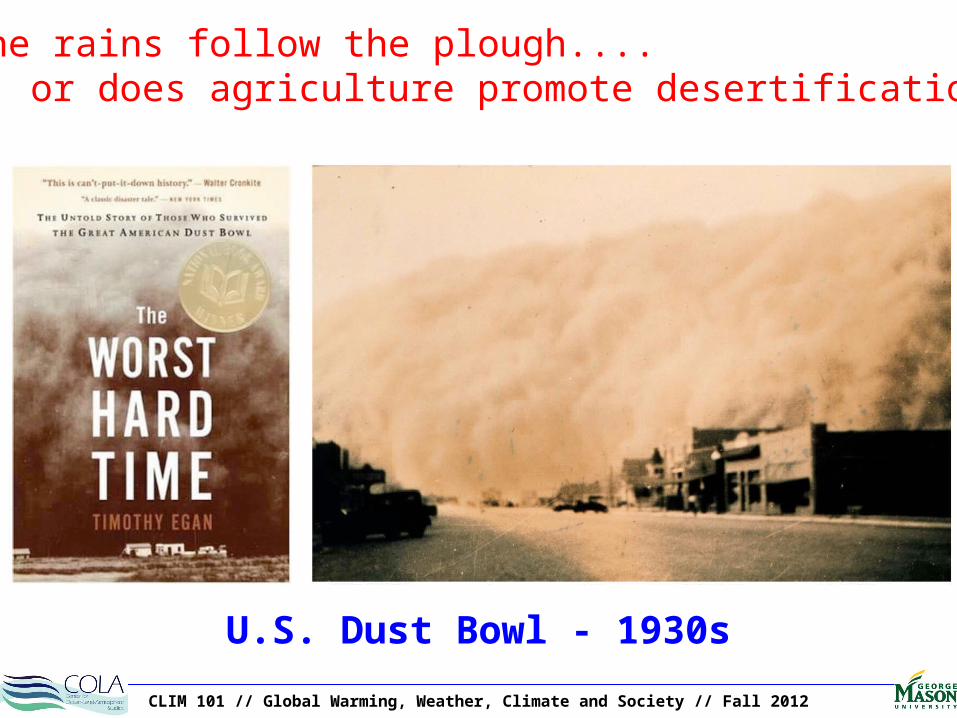
Do the rains follow the plough.... ... or does agriculture promote desertification?
QuickTime™ and a decompressor
are needed to see this picture.
QuickTime™ and a decompressor
are needed to see this picture.
U.S. Dust Bowl - 1930s

CLIM 101 // Global Warming, Weather, Climate and Society // Fall 2012
Droughts have multiple causes• land abuse• increasing demand on limited water resources• anomalous sea surface temperature patterns
We can’t attribute specific droughts to global warming
but we can say with some confidencethat global warming is likely to increase the incidence of drought, especially in semi-arid regions.
Drought and desertification, in turn, lead to higher daytime temperatures
Global Warming and Drought
CLIM 101 // Global Warming, Weather, Climate and Society // Fall 2012
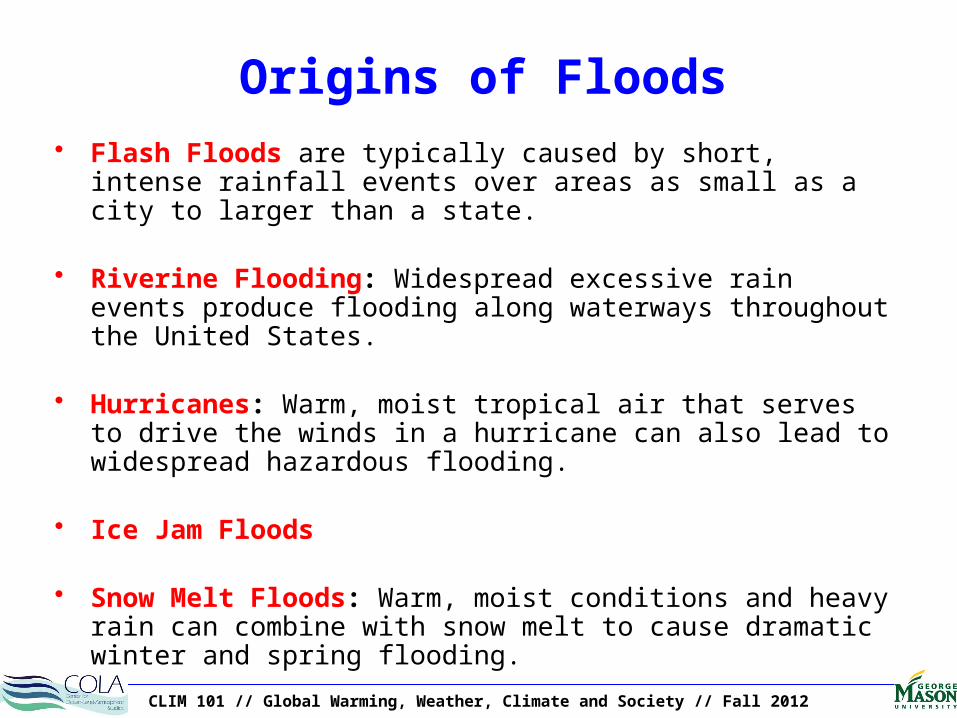
Origins of Floods• Flash Floods are typically caused by short, intense rainfall events
over areas as small as a city to larger than a state.
• Riverine Flooding: Widespread excessive rain events produce flooding along waterways throughout the United States.
• Hurricanes: Warm, moist tropical air that serves to drive the winds in a hurricane can also lead to widespread hazardous flooding.
• Ice Jam Floods
• Snow Melt Floods: Warm, moist conditions and heavy rain can combine with snow melt to cause dramatic winter and spring flooding.
CLIM 101 // Global Warming, Weather, Climate and Society // Fall 2012
Are floods increasing?
Trends in the frequency of flood events are difficult to quantify because
• River configurations and land use are continually changing
• Hourly rainfall data are available only over limited regions of the globe
the data are expensive and there are restrictions on their use
• Floods are rare events, especially when considered season-by-season
Like keeping track of “grand slam” home runs
it’s difficult to establish statistical significance when dealing with rare events.
But we believe floods should become more frequent because warmer air holds more water vapor.
CLIM 101 // Global Warming, Weather, Climate and Society // Fall 2012
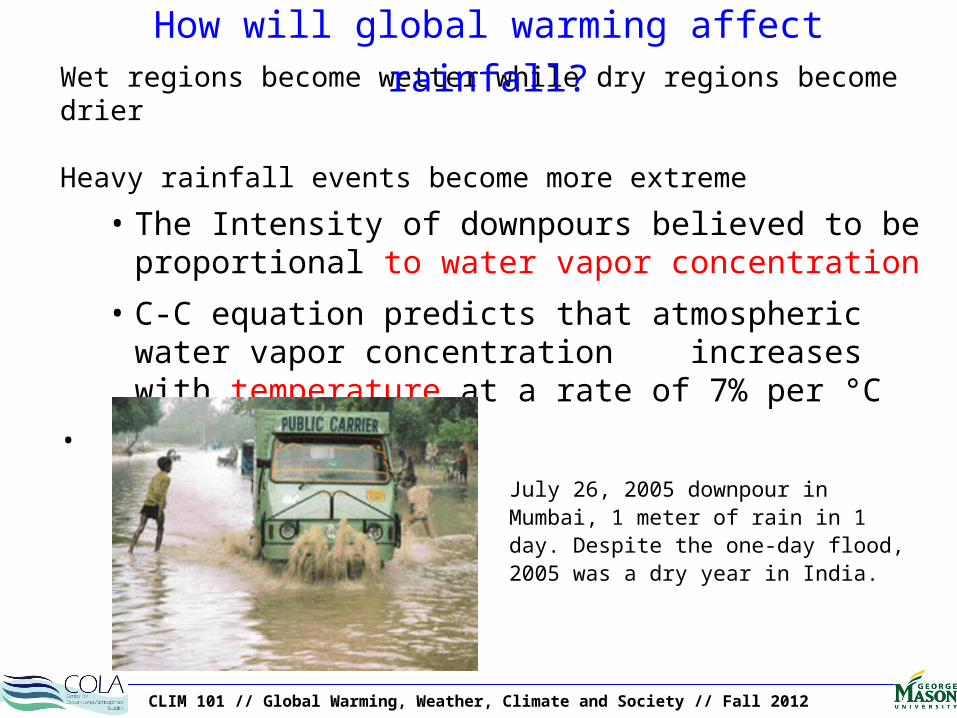
Wet regions become wetter while dry regions become drier
Heavy rainfall events become more extreme
• The Intensity of downpours believed to be proportional to water vapor concentration
• C-C equation predicts that atmospheric water vapor concentration increases with temperature at a rate of 7% per °C
•
How will global warming affect rainfall?
July 26, 2005 downpour in Mumbai, 1 meter of rain in 1 day. Despite the one-day flood, 2005 was a dry year in India.
CLIM 101 // Global Warming, Weather, Climate and Society // Fall 2012
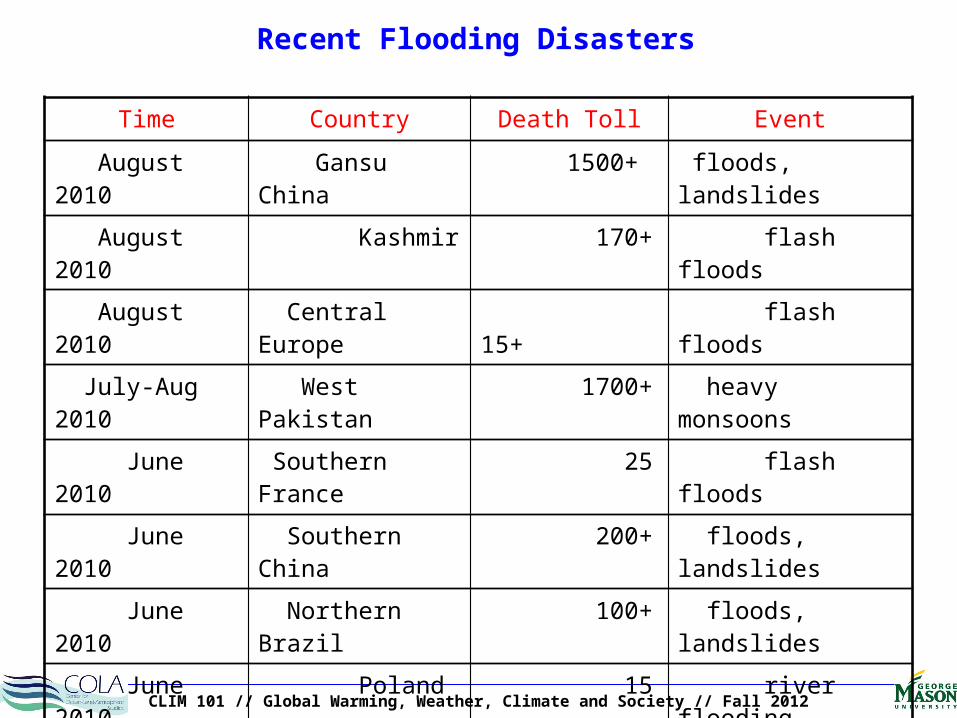
Recent Flooding Disasters
Time Country Death Toll Event
August 2010 Gansu China 1500+ floods, landslides
August 2010 Kashmir 170+ flash floods
August 2010 Central Europe 15+ flash floods
July-Aug 2010 West Pakistan 1700+ heavy monsoons
June 2010 Southern France 25 flash floods
June 2010 Southern China 200+ floods, landslides
June 2010 Northern Brazil 100+ floods, landslides
June 2010 Poland 15 river flooding
April 2010 Brazil 200+ rain, mudslides
March 2010 Uganda 350+ rain, mudslides
Feb 2010 Xanthia, France 50+ tempest, sea walls
Aug 2005 Katrina, USA 1,800+ hurricane, levees
CLIM 101 // Global Warming, Weather, Climate and Society // Fall 2012
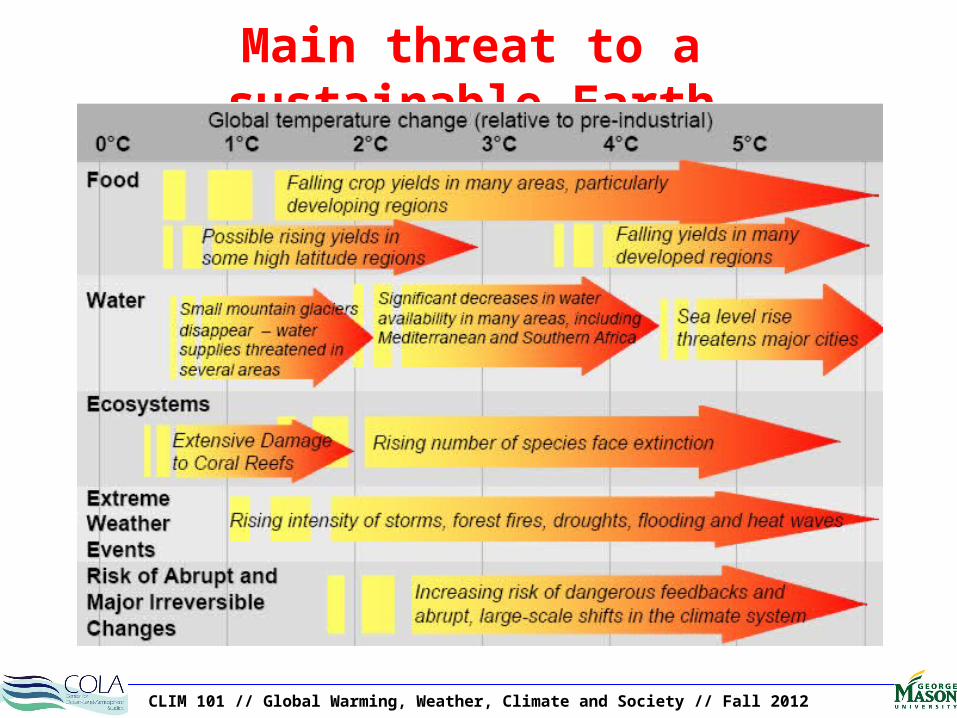
Main threat to a sustainable Earth