Embed Size (px)
Citation preview
Martínez-Solís et al. BioMedical Engineering OnLine 2014, 13:34http://www.biomedical-engineering-online.com/content/13/1/34
RESEARCH Open Access
A portable system with sample rate of 250 Hzfor characterization of knee and hip anglesin the sagittal plane during gaitFermín Martínez-Solís1*†, Abraham Claudio-Sánchez1†, José M Rodríguez-Lelis2†, Sergio Vergara-Limon3†,Víctor Olivares-Peregrino1† and Marciano Vargas-Treviño4†
* Correspondence: [email protected]†Equal contributors1Department of Electronics, NationalCenter for Research and TechnologicalDevelopment, Cuernavaca, Morelos,MexicoFull list of author information isavailable at the end of the article
Abstract
Background: Gait analysis and research have been developed to obtain characteristicsof movement patterns of people while walking. However, traditional measuring systemspresent different drawbacks that reduce their use and application. Among those drawbacksone can find: high price, low sampling frequency and limiting number of steps tobe analyzed. Traditional measuring gait systems carry out their measurement at frequenciesoscillating between 60 to 100 Hz. It can be argued about the need of higher samplingrates for gait measurements. However small displacements of the knee or hip for example,cannot be seen with low frequencies required a more detailed sampling and higherfrequency sampling. Bearing this in mind, in this paper is presented a 250 Hz systembased on accelerometers for gait measurement, and the particularities of knee and hipangles during gait are highlighted.
Methods: The system was designed with a PCI data acquisition card instrumented withan FPGA to achieve a rate sample of 250 Hz. The accelerometers were placed in thighsand legs to calculate the joint angles of hip and knee in the sagittal plane. The angleswere estimated using the acceleration polygon method without integrating theacceleration and without filters.
Results: The gait of thirty healthy people of Mexican phenotype was analyzed over aflat floor free of obstacles. The results showed the gait phases and particularitiesassociated with the walking style and people's laterality; the movement patterns weresimilar in the thirty persons. Based on the results, the particularities as the maximumamplitude in the angles and the shape in the movement patterns were related to theanthropometry and people phenotype.
Conclusions: The sampling frequency was essential to record 340 samples in single gaitcycle and so registering the gait cycle with its particularities. In this work were recorded anaverage of 8 to 10 gait cycles, and the results showed variation regarding works carried outin biomechanics laboratories; this variation was related to the method and reference frameused to obtain the joint angles and the accuracy of measurement system.
BackgroundThe process of human locomotion has been the subject of numerous studies in orderto comprehend the movements of the lower limb joints during gait. In general, thepurpose of the movement analysis during locomotion is to record in real-time thedifferent movements that the joints of the lower limbs perform during gait, withoutquantifying the forces produced by muscles [1].
© 2014 Martínez-Solís et al.; licensee BioMed Central Ltd. This is an Open Access article distributed under the terms of the CreativeCommons Attribution License (http://creativecommons.org/licenses/by/2.0), which permits unrestricted use, distribution, andreproduction in any medium, provided the original work is properly credited. The Creative Commons Public Domain Dedicationwaiver (http://creativecommons.org/publicdomain/zero/1.0/) applies to the data made available in this article, unless otherwisestated.
Martínez-Solís et al. BioMedical Engineering OnLine 2014, 13:34 Page 2 of 21http://www.biomedical-engineering-online.com/content/13/1/34
In the last two decades technological advances have allowed to develop new bio-
mechanics laboratories which are instrumented with camera systems, force platforms
and electromyography systems. These laboratories permit to estimate: the kinematics of
the lower extremities in 2D and 3D, ground reaction forces, and muscle activity at each
step [2,3]. In these laboratories some patterns have been established to describe the
movement of the lower limb joints during the gait cycle [4-8]. These patterns have been
considered as standard patterns of normal gait in orthopedics rehabilitation and
biomedical engineering because they are representative of people without considering
sex, age and anthropometry. The patterns are widely used not only to assess a normal
or pathological gait but also to design prosthetics, orthotics and exoskeletons for lower
limbs to improve the level in human-machine coordination [9-13]. Biomechanical
laboratories have some disadvantages such as: 1) the camera systems are expensive and
need complex instrumentation and environment setting, 2) the number of steps that
are analyzed are few because the analysis area in the laboratory is limited by the num-
ber of cameras and the force plates [2,14-16].
Another method to analyze human motion can be achieved through the portable sys-
tems. These systems have been developed as an alternative to gait analysis and reduce
some disadvantages of biomechanics laboratories. The portable measuring systems used
some inertial sensors like accelerometers, gyroscopes and magnetometers to obtain the
joint angles in the lower extremities. The portability of these systems allows to record
the kinematics of the lower limbs during several steps. The systems developed with
accelerometers measure the relative acceleration in corporal segments of the lower
limbs with respect to a framework. The measured acceleration reflected the intensity
and frequency in human movements.
The studies made with accelerometers for human movement analysis have increased
in the last decade. One aim of these studies is to capture movements of the joints
during daily activities to analyze positions and classify the different movements.
The systems instrumented with accelerometers have advantages such as the portabi-
lity of the system due to the size of the devices and the several gait cycles captured.
However, one main disadvantage is to obtain the joint angle through the integrating of
angular acceleration or angular velocity [2,9,17].
Willemsen et al. [18] developed a method that estimates the joint angles of the lower
limb without integrating the acceleration obtained in accelerometers. This method
requires two accelerometer pairs mounted on adjacent segments in the lower limb.
Dejnabadi et al. [2] reported a new technique to obtain the joint angles without inte-
grating the acceleration, so the angles are free of any source drift. Kun et al. [19] instru-
mented accelerometers and magnetometers to estimate the knee kinematics. The
method was based on two algorithms: 1) Based on the differences of measurement
obtained of fixed sensors, and 2) Based on the difference of measurement of virtual
sensors. Both algorithms were used to calculate the angles of flexion-extension,
abduction-adduction and inversion-eversion.
Correa and Balbinot [20] developed a measurement system based on accelerometers
to analyze the human gait. It is a wireless system with a virtual model of the human
body which has a sampling rate of 50Hz. The Accelerometers were placed on the thigh
and leg to measure the joint angles in hip and knee during the walking. This system
Martínez-Solís et al. BioMedical Engineering OnLine 2014, 13:34 Page 3 of 21http://www.biomedical-engineering-online.com/content/13/1/34
was compared with one videometry based system which showed a variation in the thigh
angle of 8.6 degrees, and the leg variation was about 21.8 degrees.
Godwin et al. [21] analyzed the accuracy of the inertial sensors (IMSs). The accuracy
was assessed through a planar pendulum in three situations: static, quasi-static and
dynamic. The results were compared with a Vicon gold-standard camera system. The
errors in quasi-static and static situations were of 0.3 degrees, and in the dynamic test
were between 1.9 and 3.5 degrees.
Several studies about motion analysis that have been made with accelerometers have
not reported the different phases of the gait cycle yet as the studies made in biomech-
anics laboratories. The major causes are related with the problems to obtain the joint
angles through the acceleration obtained by accelerometers placed at body segments,
and by low rate sample achieved by the systems developed.
The main problems of the systems developed with accelerometers are because of the
method to obtain the joint angles through the acceleration recorded by the accelerome-
ters, and by the low sampling frequencies achieved for developed systems.
This paper presents the characterization of one gait cycle obtained from a measure-
ment system developed with accelerometers. These inertial sensors have a measure-
ment rate of ±1.7 gravities. The measurement system achieved a sample rate of 250 Hz.
The accelerometers were placed on the thighs and legs to get the tilt angle in each cor-
poral segment using the method of polygon of acceleration considering the gravity vec-
tor as a reference point. Taking into account that the movements of the joints during
walking are cyclical in both lower limbs, the movement patterns in the joints should be
similar and then should show alternation in the movements of the right lower limb and
the left lower limb. The aim of the system was to record the joint angles during mul-
tiple cycles to obtain the motion pattern in the persons, and with it identify the particu-
larities and phases of gait.
MethodsHuman locomotion process is an activity developed by the lower extremities which
have the aim to move the center-mass toward the forehead. The movements performed
by the joints and corporal segments during gait have a frequency from 5 to 40 Hz [22].
According to [1] some physical activities such as walking, posture and transitional
activities can be classified using accelerometers placed in different segments of the body.
Method to obtain the tilt angle
The measurement electronic systems developed with accelerometers analyze the
motion through the acceleration measurement in the body segments of interest. This
method measures the acceleration of each segment, along an orthogonal system of
reference which reflects intensity and frequency in movements. Thus, to obtain the
kinematics of the lower limbs: first the tilt angles of the thighs and legs were obtained
independently and subsequently the kinematics to each lower limb was calculated.
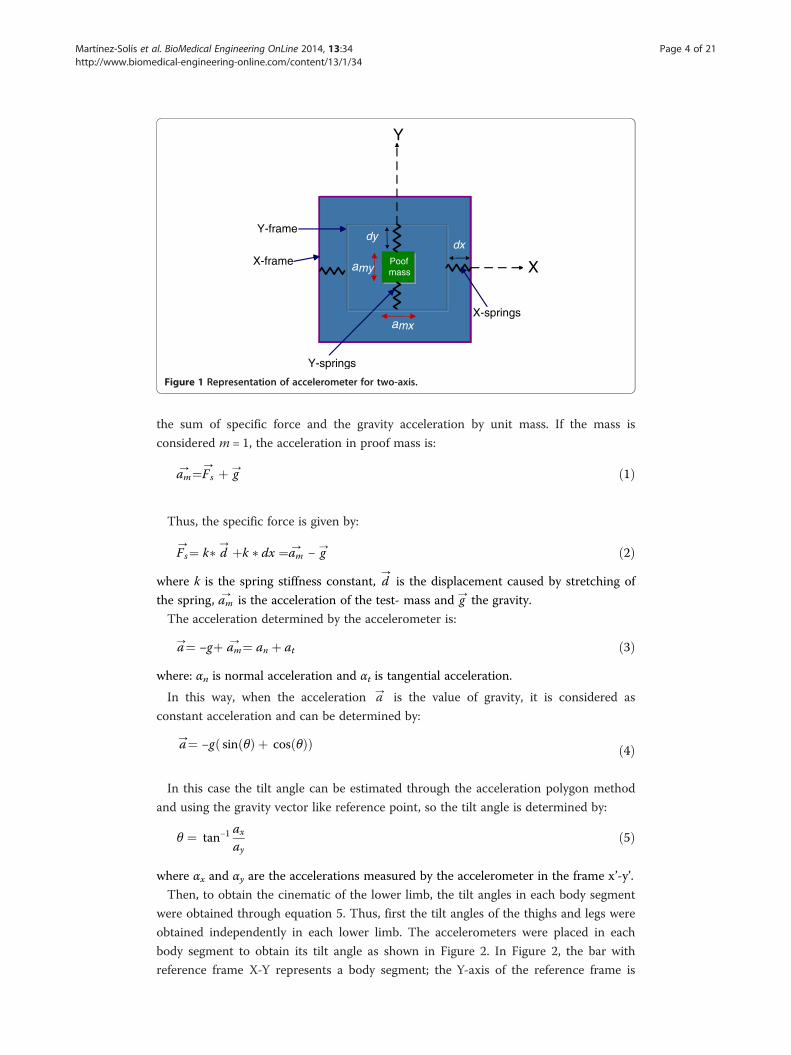
The tilt angles were obtained with accelerometers of two axes. According to [15] an
accelerometer of two axes have one proof mass, two frame and two springs as show
Figure 1. The accelerometer measurement the acceleration in the proof mass, which is
Y
X
dxdy
X-springs
Y-frame
Y-springs
X-frame
amx
amyPoofmass
Figure 1 Representation of accelerometer for two-axis.
Martínez-Solís et al. BioMedical Engineering OnLine 2014, 13:34 Page 4 of 21http://www.biomedical-engineering-online.com/content/13/1/34
the sum of specific force and the gravity acceleration by unit mass. If the mass is
considered m = 1, the acceleration in proof mass is:
am→ ¼Fs
→ þ g→ ð1Þ
Thus, the specific force is given by:
Fs→¼ k� d
→ þk � dx ¼am→ − g
→ ð2Þ
where k is the spring stiffness constant, d→
is the displacement caused by stretching of
the spring, am→
is the acceleration of the test- mass and g→
the gravity.
The acceleration determined by the accelerometer is:
a→¼ −gþ am
→ ¼ an þ at ð3Þ
where: αn is normal acceleration and αt is tangential acceleration.
In this way, when the acceleration a→ is the value of gravity, it is considered as
constant acceleration and can be determined by:
a→¼ −g sin θð Þ þ cos θð Þð Þ ð4Þ
In this case the tilt angle can be estimated through the acceleration polygon method
and using the gravity vector like reference point, so the tilt angle is determined by:
θ ¼ tan−1axay
ð5Þ
where αx and αy are the accelerations measured by the accelerometer in the frame x’-y’.
Then, to obtain the cinematic of the lower limb, the tilt angles in each body segment
were obtained through equation 5. Thus, first the tilt angles of the thighs and legs were
obtained independently in each lower limb. The accelerometers were placed in each
body segment to obtain its tilt angle as shown in Figure 2. In Figure 2, the bar with
reference frame X-Y represents a body segment; the Y-axis of the reference frame is
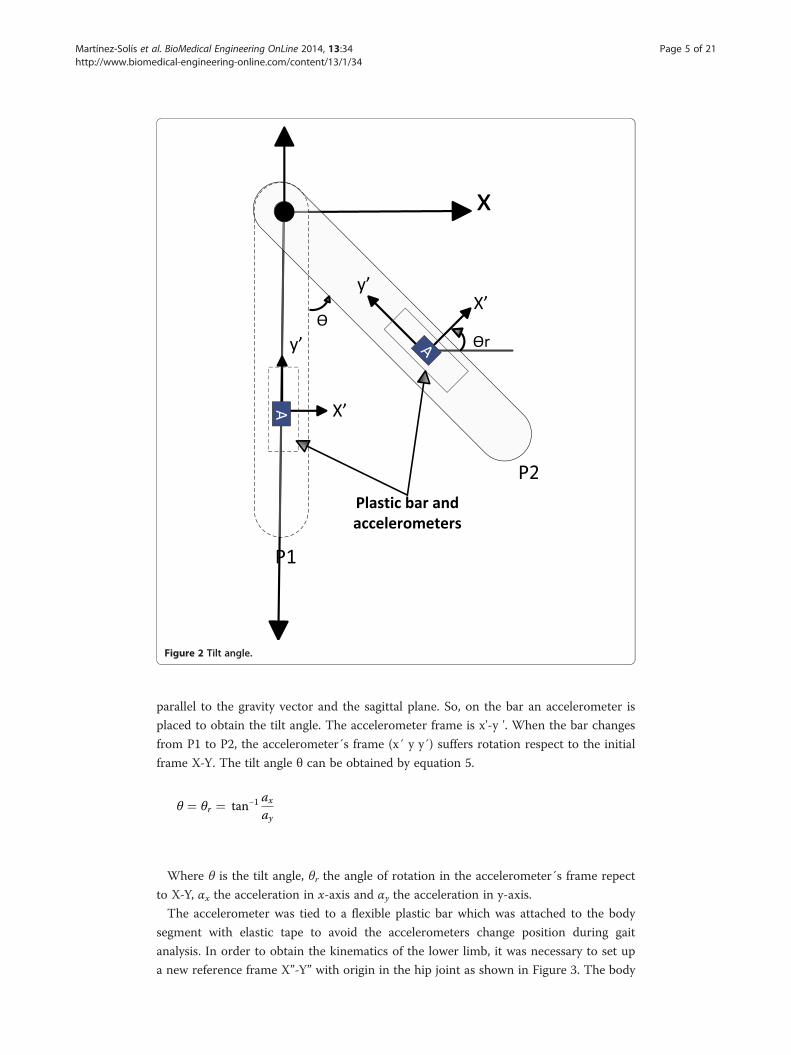
Figure 2 Tilt angle.
Martínez-Solís et al. BioMedical Engineering OnLine 2014, 13:34 Page 5 of 21http://www.biomedical-engineering-online.com/content/13/1/34
parallel to the gravity vector and the sagittal plane. So, on the bar an accelerometer is
placed to obtain the tilt angle. The accelerometer frame is x'-y '. When the bar changes
from P1 to P2, the accelerometer´s frame (x´ y y´) suffers rotation respect to the initial
frame X-Y. The tilt angle θ can be obtained by equation 5.
θ ¼ θr ¼ tan−1axay
Where θ is the tilt angle, θr the angle of rotation in the accelerometer´s frame repect
to X-Y, αx the acceleration in x-axis and αy the acceleration in y-axis.
The accelerometer was tied to a flexible plastic bar which was attached to the body
segment with elastic tape to avoid the accelerometers change position during gait
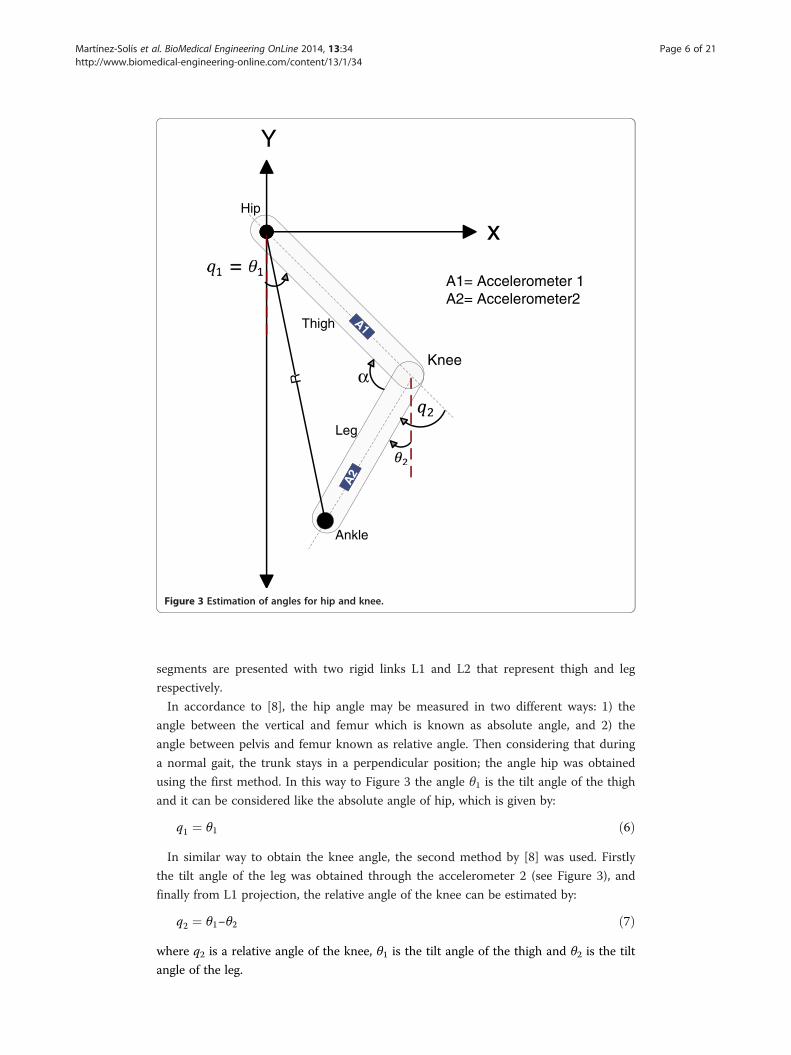
analysis. In order to obtain the kinematics of the lower limb, it was necessary to set up
a new reference frame X”-Y” with origin in the hip joint as shown in Figure 3. The body
A1
α
x
Y
Hip
Knee
Ankle
A1= Accelerometer 1A2= Accelerometer2
Thigh
Leg
R
A2
Figure 3 Estimation of angles for hip and knee.
Martínez-Solís et al. BioMedical Engineering OnLine 2014, 13:34 Page 6 of 21http://www.biomedical-engineering-online.com/content/13/1/34
segments are presented with two rigid links L1 and L2 that represent thigh and leg
respectively.
In accordance to [8], the hip angle may be measured in two different ways: 1) the
angle between the vertical and femur which is known as absolute angle, and 2) the
angle between pelvis and femur known as relative angle. Then considering that during
a normal gait, the trunk stays in a perpendicular position; the angle hip was obtained
using the first method. In this way to Figure 3 the angle θ1 is the tilt angle of the thigh
and it can be considered like the absolute angle of hip, which is given by:
q1 ¼ θ1 ð6Þ
In similar way to obtain the knee angle, the second method by [8] was used. Firstly
the tilt angle of the leg was obtained through the accelerometer 2 (see Figure 3), and
finally from L1 projection, the relative angle of the knee can be estimated by:
q2 ¼ θ1−θ2 ð7Þ
where q2 is a relative angle of the knee, θ1 is the tilt angle of the thigh and θ2 is the tilt
angle of the leg.
Martínez-Solís et al. BioMedical Engineering OnLine 2014, 13:34 Page 7 of 21http://www.biomedical-engineering-online.com/content/13/1/34
In Figure 3 the total length of the lower limb is determined by:
α ¼ cos−1L1k k2 þ L2k k2− Rk k2
2 L1k k L2k k
!ð8Þ
R2 ¼ L12 þ L22 ð9Þ
where L1 and L2 are the length in thigh and leg, and R is the total length.
Measurement system
Winter [11] reported that the gait analysis made over 71 Hz provides useful particularities
to determine the gait pattern. However, it may be possible that for an upper sample rate,
the movement patterns can present some particularities associated to the walking style of
people. Therefore, the sampling rate in the measurement system in this work was above
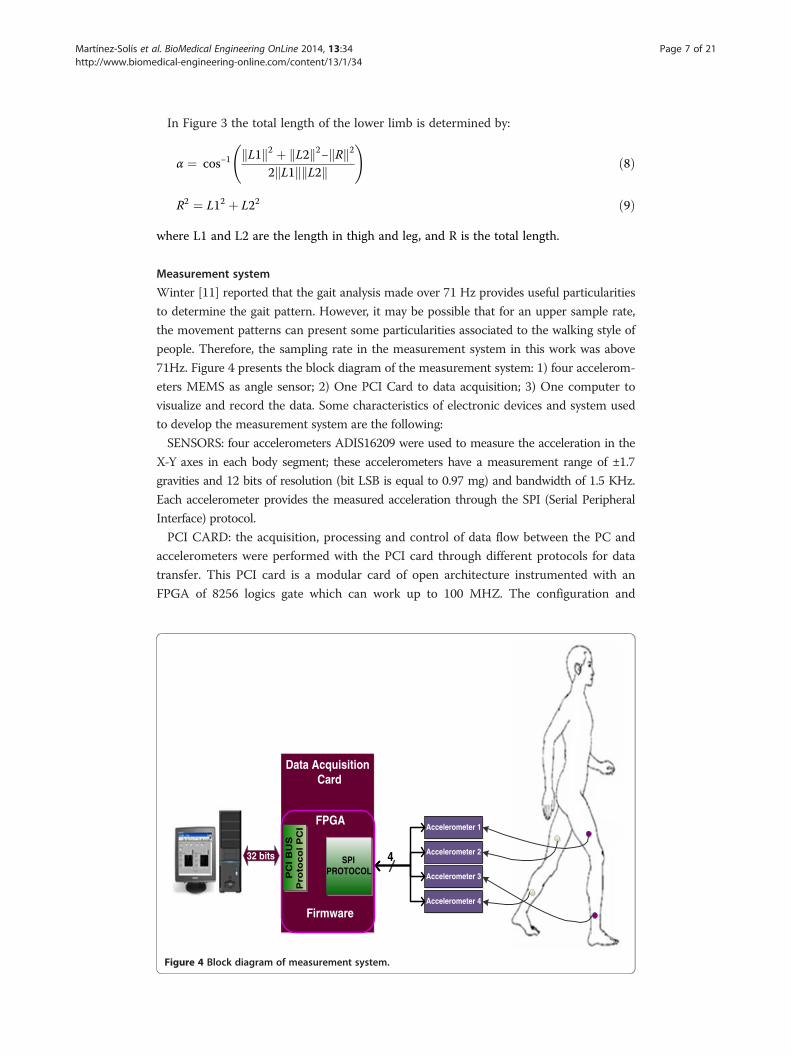
71Hz. Figure 4 presents the block diagram of the measurement system: 1) four accelerom-
eters MEMS as angle sensor; 2) One PCI Card to data acquisition; 3) One computer to
visualize and record the data. Some characteristics of electronic devices and system used
to develop the measurement system are the following:
SENSORS: four accelerometers ADIS16209 were used to measure the acceleration in the
X-Y axes in each body segment; these accelerometers have a measurement range of ±1.7
gravities and 12 bits of resolution (bit LSB is equal to 0.97 mg) and bandwidth of 1.5 KHz.
Each accelerometer provides the measured acceleration through the SPI (Serial Peripheral
Interface) protocol.
PCI CARD: the acquisition, processing and control of data flow between the PC and
accelerometers were performed with the PCI card through different protocols for data
transfer. This PCI card is a modular card of open architecture instrumented with an
FPGA of 8256 logics gate which can work up to 100 MHZ. The configuration and
Accelerometer 1
Accelerometer 2
Accelerometer 3
Accelerometer 4
Data AcquisitionCard
SPIPROTOCOLP
CI B
US
Pro
toco
l P
CI
32 bits 4
FPGA
Firmware
Figure 4 Block diagram of measurement system.
Martínez-Solís et al. BioMedical Engineering OnLine 2014, 13:34 Page 8 of 21http://www.biomedical-engineering-online.com/content/13/1/34
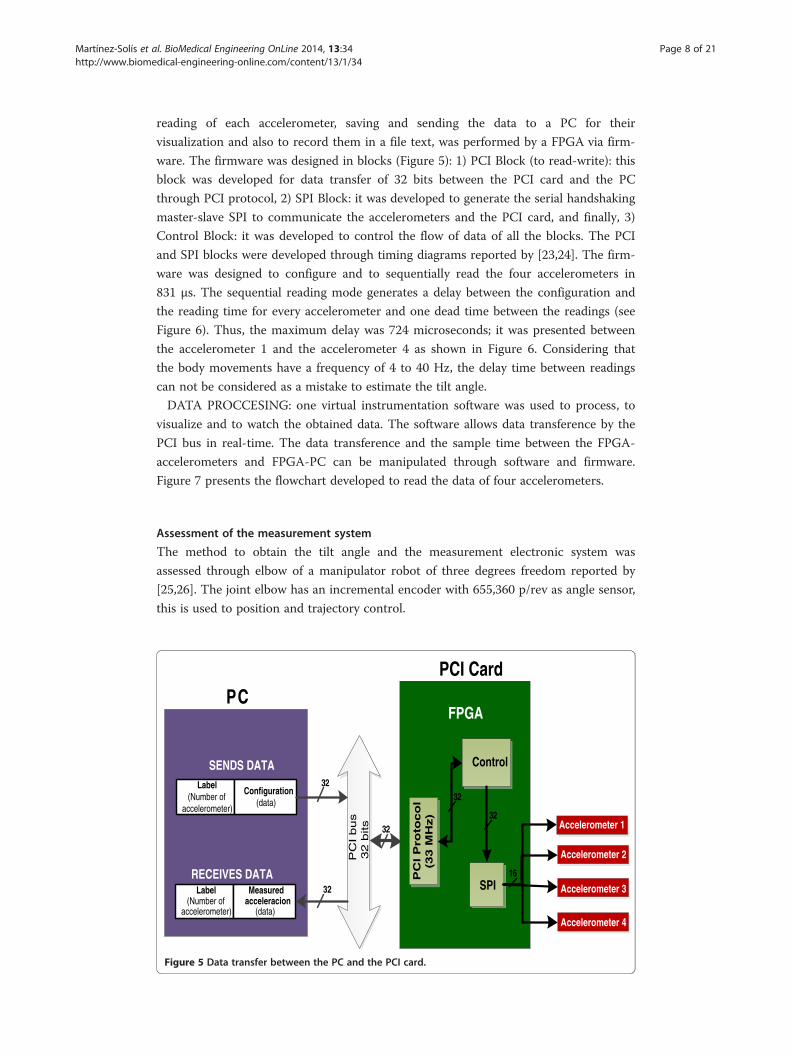
reading of each accelerometer, saving and sending the data to a PC for their
visualization and also to record them in a file text, was performed by a FPGA via firm-
ware. The firmware was designed in blocks (Figure 5): 1) PCI Block (to read-write): this
block was developed for data transfer of 32 bits between the PCI card and the PC
through PCI protocol, 2) SPI Block: it was developed to generate the serial handshaking
master-slave SPI to communicate the accelerometers and the PCI card, and finally, 3)
Control Block: it was developed to control the flow of data of all the blocks. The PCI
and SPI blocks were developed through timing diagrams reported by [23,24]. The firm-
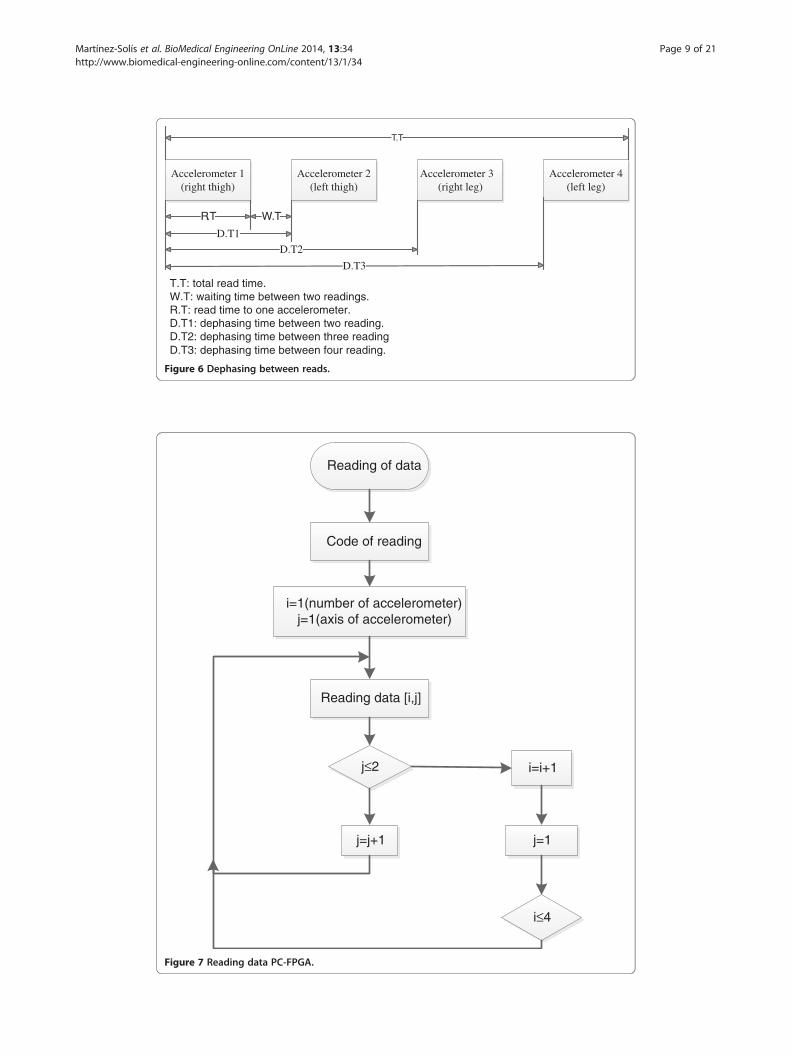
ware was designed to configure and to sequentially read the four accelerometers in
831 μs. The sequential reading mode generates a delay between the configuration and
the reading time for every accelerometer and one dead time between the readings (see
Figure 6). Thus, the maximum delay was 724 microseconds; it was presented between
the accelerometer 1 and the accelerometer 4 as shown in Figure 6. Considering that
the body movements have a frequency of 4 to 40 Hz, the delay time between readings
can not be considered as a mistake to estimate the tilt angle.
DATA PROCCESING: one virtual instrumentation software was used to process, to
visualize and to watch the obtained data. The software allows data transference by the
PCI bus in real-time. The data transference and the sample time between the FPGA-
accelerometers and FPGA-PC can be manipulated through software and firmware.
Figure 7 presents the flowchart developed to read the data of four accelerometers.
Assessment of the measurement system
The method to obtain the tilt angle and the measurement electronic system was
assessed through elbow of a manipulator robot of three degrees freedom reported by
[25,26]. The joint elbow has an incremental encoder with 655,360 p/rev as angle sensor,
this is used to position and trajectory control.
Label(Number of
accelerometer)
Configuration(data)
SENDS DATA
Label(Number of
accelerometer)
Measuredacceleracion
(data)
RECEIVES DATA PC
I P
roto
co
l(3
3 M
Hz)
Control
SPI
Accelerometer 4
Accelerometer 3
Accelerometer 2
Accelerometer 1
PC
PC
I bus
32 b
its
FPGA
32
32
32
32
32
16
PCI Card
Figure 5 Data transfer between the PC and the PCI card.
Accelerometer 1(right thigh)
Accelerometer 2(left thigh)
Accelerometer 3(right leg)
Accelerometer 4(left leg)
T.T
R.T W.T
D.T1
D.T2
D.T3
T.T: total read time.W.T: waiting time between two readings.R.T: read time to one accelerometer.D.T1: dephasing time between two reading.D.T2: dephasing time between three readingD.T3: dephasing time between four reading.
Figure 6 Dephasing between reads.
Reading of data
Code of reading
i=1(number of accelerometer)j=1(axis of accelerometer)
Reading data [i,j]
j≤2 i=i+1
i≤4
j=1j=j+1
Figure 7 Reading data PC-FPGA.
Martínez-Solís et al. BioMedical Engineering OnLine 2014, 13:34 Page 9 of 21http://www.biomedical-engineering-online.com/content/13/1/34
Martínez-Solís et al. BioMedical Engineering OnLine 2014, 13:34 Page 10 of 21http://www.biomedical-engineering-online.com/content/13/1/34
The accelerometer was tied on the link of elbow such as shown in Figure 2. The
robot elbow was controlled through trajectory tracking control reported by [26]; the
base and shoulder robot were fixed at zero degrees without movement. The trajectory
was determined by:
x ¼ 90 � sin tð Þ ð10ÞThe elbow link described an oscillation from 90 to -90 degrees with the vertically as
reference point; the trajectory was constant velocity of 1 rad/sec. The trajectory tracking
control presented an error of 0.68 degrees during the evaluation test.
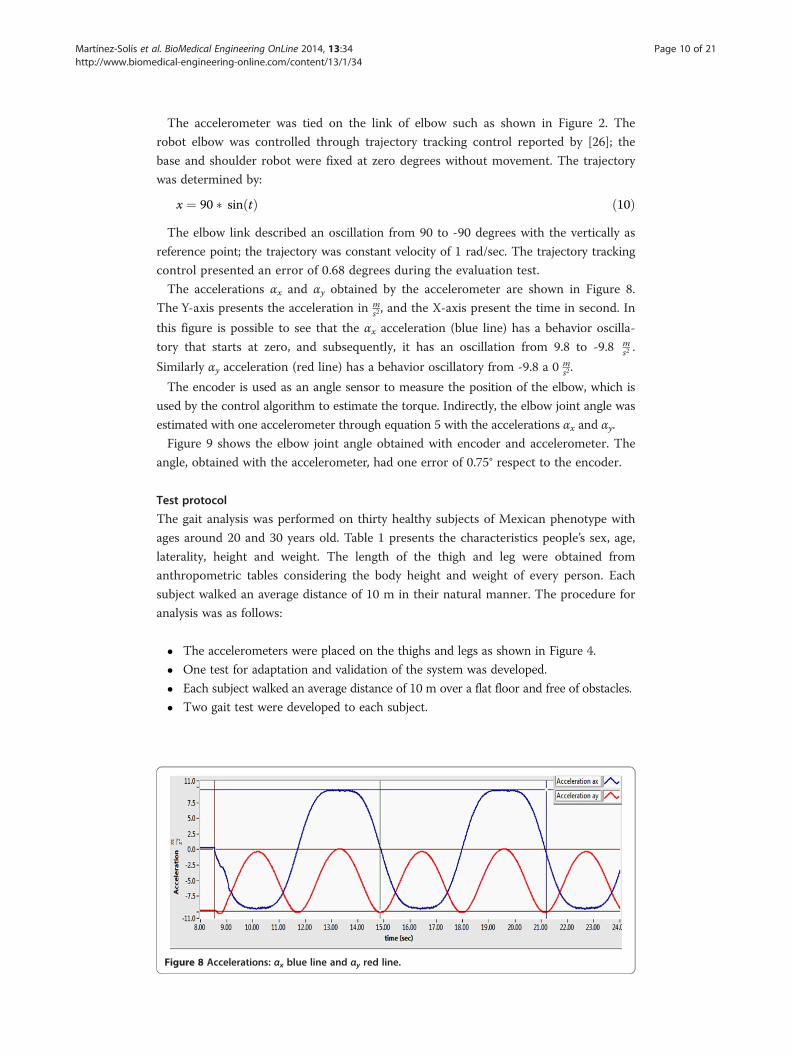
The accelerations αx and αy obtained by the accelerometer are shown in Figure 8.
The Y-axis presents the acceleration in ms2 , and the X-axis present the time in second. In
this figure is possible to see that the αx acceleration (blue line) has a behavior oscilla-
tory that starts at zero, and subsequently, it has an oscillation from 9.8 to -9.8 ms2 .
Similarly αy acceleration (red line) has a behavior oscillatory from -9.8 a 0 ms2.
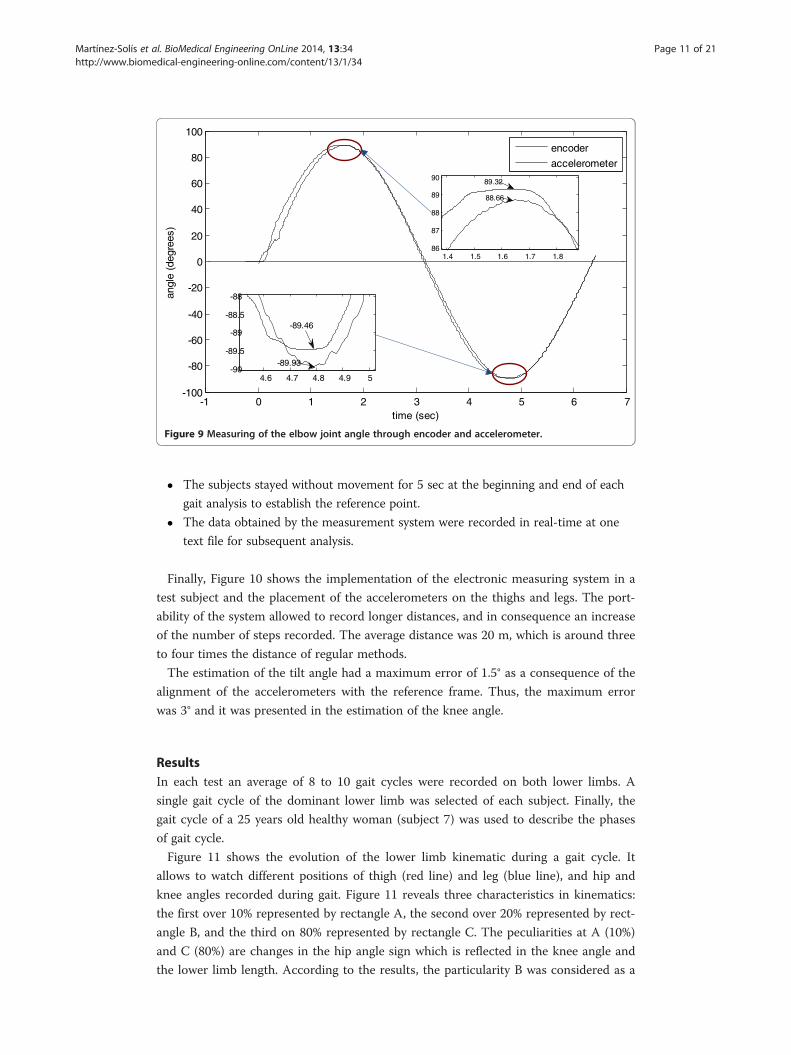
The encoder is used as an angle sensor to measure the position of the elbow, which is
used by the control algorithm to estimate the torque. Indirectly, the elbow joint angle was
estimated with one accelerometer through equation 5 with the accelerations αx and αy.
Figure 9 shows the elbow joint angle obtained with encoder and accelerometer. The
angle, obtained with the accelerometer, had one error of 0.75° respect to the encoder.
Test protocol
The gait analysis was performed on thirty healthy subjects of Mexican phenotype with
ages around 20 and 30 years old. Table 1 presents the characteristics people’s sex, age,
laterality, height and weight. The length of the thigh and leg were obtained from
anthropometric tables considering the body height and weight of every person. Each
subject walked an average distance of 10 m in their natural manner. The procedure for
analysis was as follows:
� The accelerometers were placed on the thighs and legs as shown in Figure 4.
� One test for adaptation and validation of the system was developed.
� Each subject walked an average distance of 10 m over a flat floor and free of obstacles.
� Two gait test were developed to each subject.
Figure 8 Accelerations: αx blue line and αy red line.
-1 0 1 2 3 4 5 6 7-100
-80
-60
-40
-20
0
20
40
60
80
100
time (sec)
angl
e (d
egre
es)
encoder
accelerometer
1.4 1.5 1.6 1.7 1.886
87
88
89
90 89.32
88.66
4.6 4.7 4.8 4.9 5-90
-89.5
-89
-88.5
-88
-89.46
-89.93
Figure 9 Measuring of the elbow joint angle through encoder and accelerometer.
Martínez-Solís et al. BioMedical Engineering OnLine 2014, 13:34 Page 11 of 21http://www.biomedical-engineering-online.com/content/13/1/34
� The subjects stayed without movement for 5 sec at the beginning and end of each
gait analysis to establish the reference point.
� The data obtained by the measurement system were recorded in real-time at one
text file for subsequent analysis.
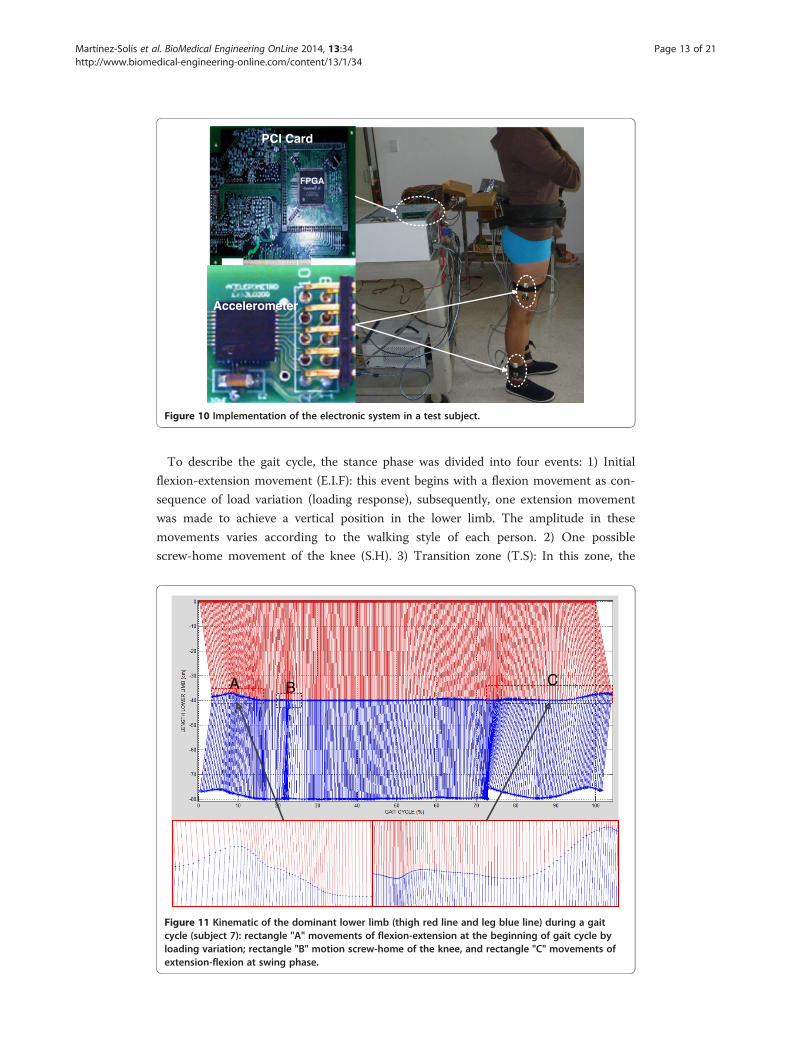
Finally, Figure 10 shows the implementation of the electronic measuring system in a
test subject and the placement of the accelerometers on the thighs and legs. The port-
ability of the system allowed to record longer distances, and in consequence an increase
of the number of steps recorded. The average distance was 20 m, which is around three
to four times the distance of regular methods.
The estimation of the tilt angle had a maximum error of 1.5° as a consequence of the
alignment of the accelerometers with the reference frame. Thus, the maximum error
was 3° and it was presented in the estimation of the knee angle.
ResultsIn each test an average of 8 to 10 gait cycles were recorded on both lower limbs. A
single gait cycle of the dominant lower limb was selected of each subject. Finally, the
gait cycle of a 25 years old healthy woman (subject 7) was used to describe the phases
of gait cycle.
Figure 11 shows the evolution of the lower limb kinematic during a gait cycle. It
allows to watch different positions of thigh (red line) and leg (blue line), and hip and
knee angles recorded during gait. Figure 11 reveals three characteristics in kinematics:
the first over 10% represented by rectangle A, the second over 20% represented by rect-
angle B, and the third on 80% represented by rectangle C. The peculiarities at A (10%)
and C (80%) are changes in the hip angle sign which is reflected in the knee angle and
the lower limb length. According to the results, the particularity B was considered as a
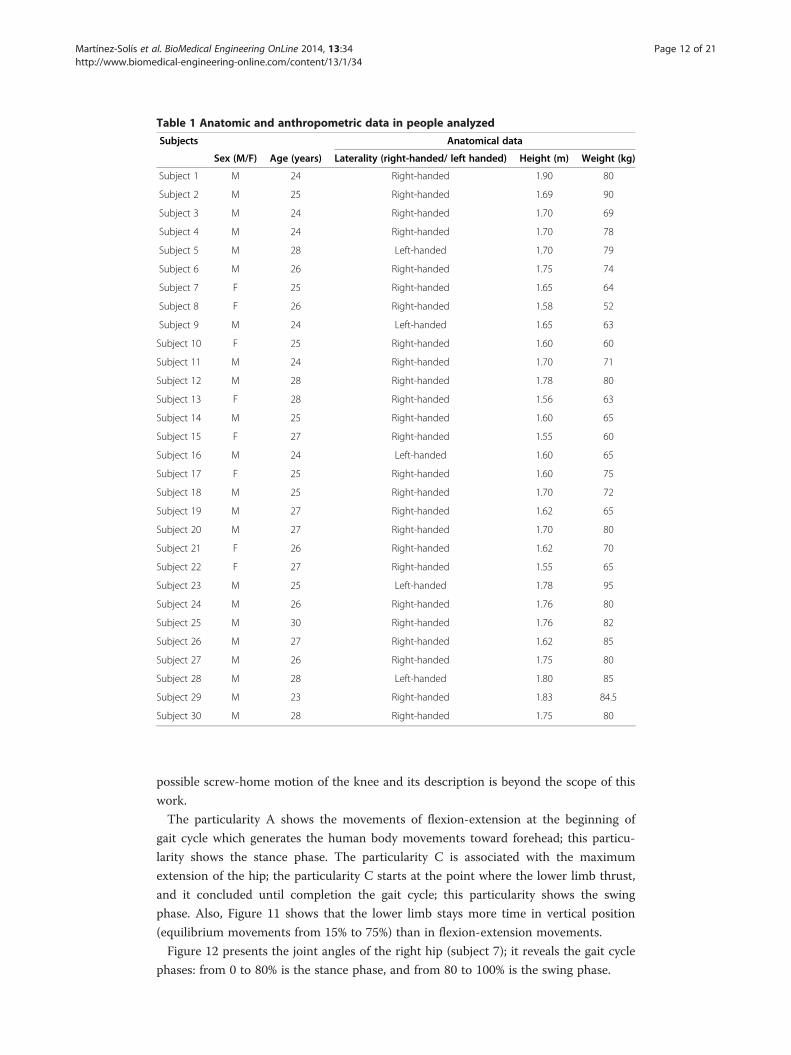
Table 1 Anatomic and anthropometric data in people analyzed
Subjects Anatomical data
Sex (M/F) Age (years) Laterality (right-handed/ left handed) Height (m) Weight (kg)
Subject 1 M 24 Right-handed 1.90 80
Subject 2 M 25 Right-handed 1.69 90
Subject 3 M 24 Right-handed 1.70 69
Subject 4 M 24 Right-handed 1.70 78
Subject 5 M 28 Left-handed 1.70 79
Subject 6 M 26 Right-handed 1.75 74
Subject 7 F 25 Right-handed 1.65 64
Subject 8 F 26 Right-handed 1.58 52
Subject 9 M 24 Left-handed 1.65 63
Subject 10 F 25 Right-handed 1.60 60
Subject 11 M 24 Right-handed 1.70 71
Subject 12 M 28 Right-handed 1.78 80
Subject 13 F 28 Right-handed 1.56 63
Subject 14 M 25 Right-handed 1.60 65
Subject 15 F 27 Right-handed 1.55 60
Subject 16 M 24 Left-handed 1.60 65
Subject 17 F 25 Right-handed 1.60 75
Subject 18 M 25 Right-handed 1.70 72
Subject 19 M 27 Right-handed 1.62 65
Subject 20 M 27 Right-handed 1.70 80
Subject 21 F 26 Right-handed 1.62 70
Subject 22 F 27 Right-handed 1.55 65
Subject 23 M 25 Left-handed 1.78 95
Subject 24 M 26 Right-handed 1.76 80
Subject 25 M 30 Right-handed 1.76 82
Subject 26 M 27 Right-handed 1.62 85
Subject 27 M 26 Right-handed 1.75 80
Subject 28 M 28 Left-handed 1.80 85
Subject 29 M 23 Right-handed 1.83 84.5
Subject 30 M 28 Right-handed 1.75 80
Martínez-Solís et al. BioMedical Engineering OnLine 2014, 13:34 Page 12 of 21http://www.biomedical-engineering-online.com/content/13/1/34
possible screw-home motion of the knee and its description is beyond the scope of this
work.
The particularity A shows the movements of flexion-extension at the beginning of
gait cycle which generates the human body movements toward forehead; this particu-
larity shows the stance phase. The particularity C is associated with the maximum
extension of the hip; the particularity C starts at the point where the lower limb thrust,
and it concluded until completion the gait cycle; this particularity shows the swing
phase. Also, Figure 11 shows that the lower limb stays more time in vertical position
(equilibrium movements from 15% to 75%) than in flexion-extension movements.
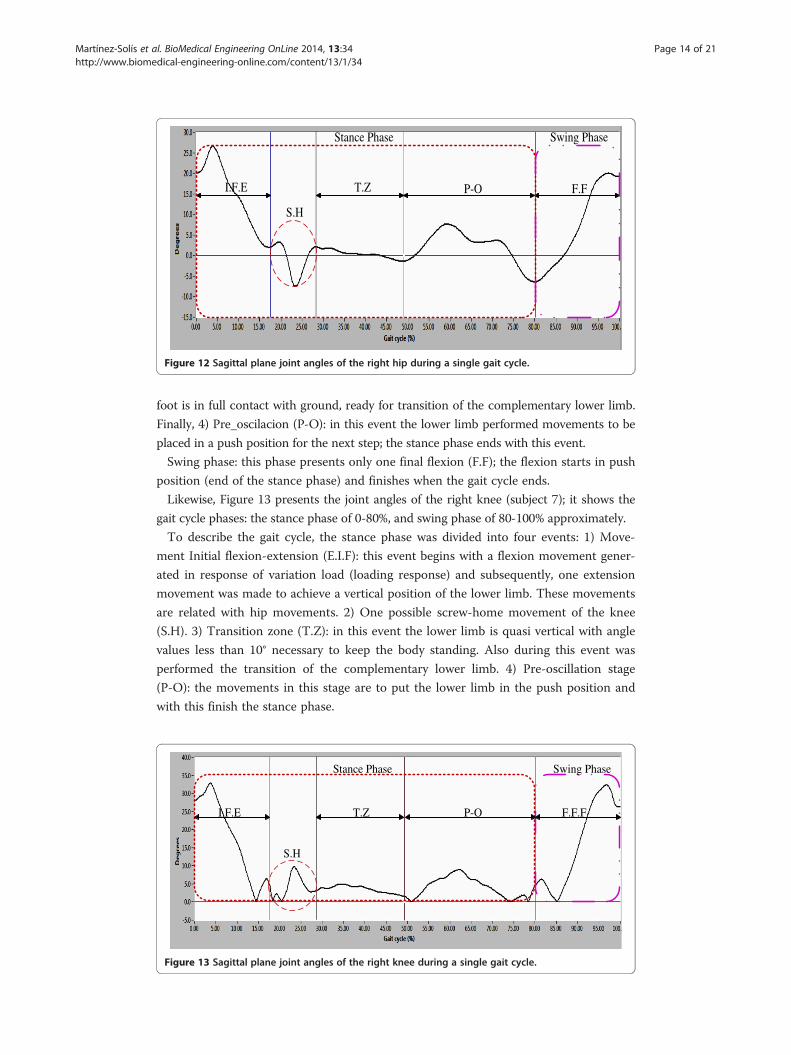
Figure 12 presents the joint angles of the right hip (subject 7); it reveals the gait cycle
phases: from 0 to 80% is the stance phase, and from 80 to 100% is the swing phase.
PCI Card
FPGA
Accelerometer
Figure 10 Implementation of the electronic system in a test subject.
Martínez-Solís et al. BioMedical Engineering OnLine 2014, 13:34 Page 13 of 21http://www.biomedical-engineering-online.com/content/13/1/34
To describe the gait cycle, the stance phase was divided into four events: 1) Initial
flexion-extension movement (E.I.F): this event begins with a flexion movement as con-
sequence of load variation (loading response), subsequently, one extension movement
was made to achieve a vertical position in the lower limb. The amplitude in these
movements varies according to the walking style of each person. 2) One possible
screw-home movement of the knee (S.H). 3) Transition zone (T.S): In this zone, the
A B C
Figure 11 Kinematic of the dominant lower limb (thigh red line and leg blue line) during a gaitcycle (subject 7): rectangle "A" movements of flexion-extension at the beginning of gait cycle byloading variation; rectangle "B" motion screw-home of the knee, and rectangle "C" movements ofextension-flexion at swing phase.
I.F.E
S.H
T.Z P-O F.F
Stance Phase Swing Phase
Figure 12 Sagittal plane joint angles of the right hip during a single gait cycle.
Martínez-Solís et al. BioMedical Engineering OnLine 2014, 13:34 Page 14 of 21http://www.biomedical-engineering-online.com/content/13/1/34
foot is in full contact with ground, ready for transition of the complementary lower limb.
Finally, 4) Pre_oscilacion (P-O): in this event the lower limb performed movements to be
placed in a push position for the next step; the stance phase ends with this event.
Swing phase: this phase presents only one final flexion (F.F); the flexion starts in push
position (end of the stance phase) and finishes when the gait cycle ends.
Likewise, Figure 13 presents the joint angles of the right knee (subject 7); it shows the
gait cycle phases: the stance phase of 0-80%, and swing phase of 80-100% approximately.
To describe the gait cycle, the stance phase was divided into four events: 1) Move-
ment Initial flexion-extension (E.I.F): this event begins with a flexion movement gener-
ated in response of variation load (loading response) and subsequently, one extension
movement was made to achieve a vertical position of the lower limb. These movements
are related with hip movements. 2) One possible screw-home movement of the knee
(S.H). 3) Transition zone (T.Z): in this event the lower limb is quasi vertical with angle
values less than 10° necessary to keep the body standing. Also during this event was
performed the transition of the complementary lower limb. 4) Pre-oscillation stage
(P-O): the movements in this stage are to put the lower limb in the push position and
with this finish the stance phase.
I.F.E T.Z P-O F.F.F
S.H
Stance Phase Swing Phase
Figure 13 Sagittal plane joint angles of the right knee during a single gait cycle.
Martínez-Solís et al. BioMedical Engineering OnLine 2014, 13:34 Page 15 of 21http://www.biomedical-engineering-online.com/content/13/1/34
The swing phase showed only one movement of flexion-extension (F.E.F): first, the
knee generates one flexion movement to avoid to trip up and to allow free oscillation
subsequently, the knee generates one extension movement which determines the length
and end of the step.
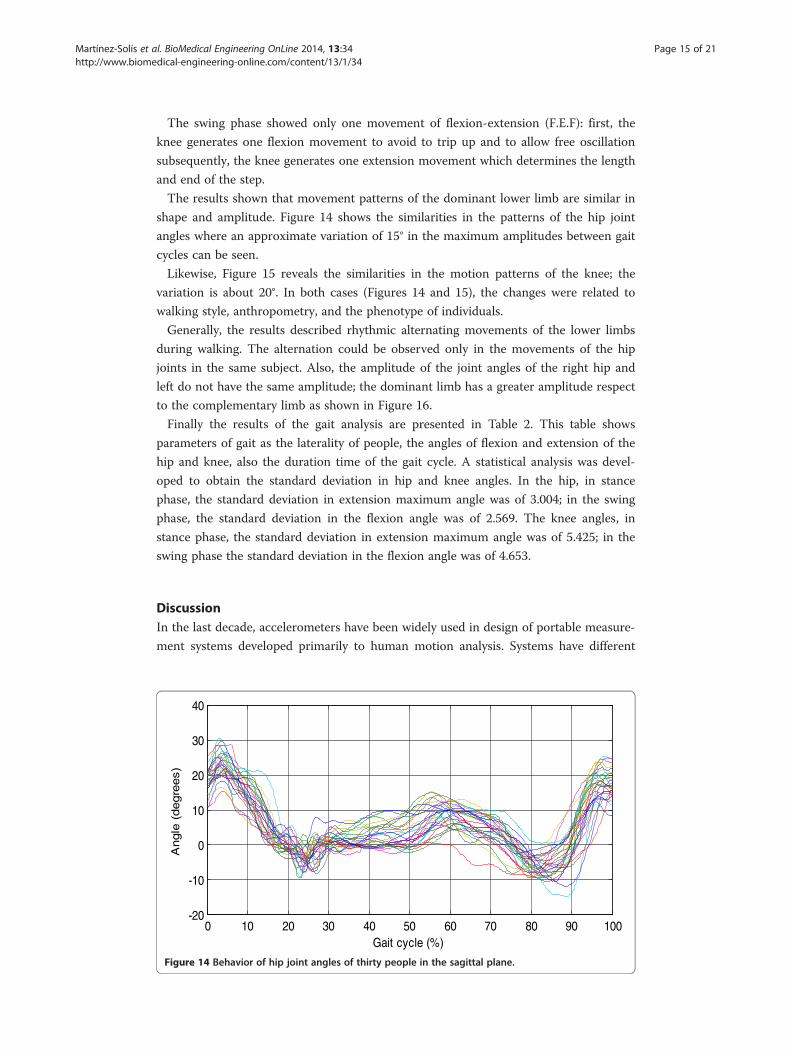
The results shown that movement patterns of the dominant lower limb are similar in
shape and amplitude. Figure 14 shows the similarities in the patterns of the hip joint
angles where an approximate variation of 15° in the maximum amplitudes between gait
cycles can be seen.
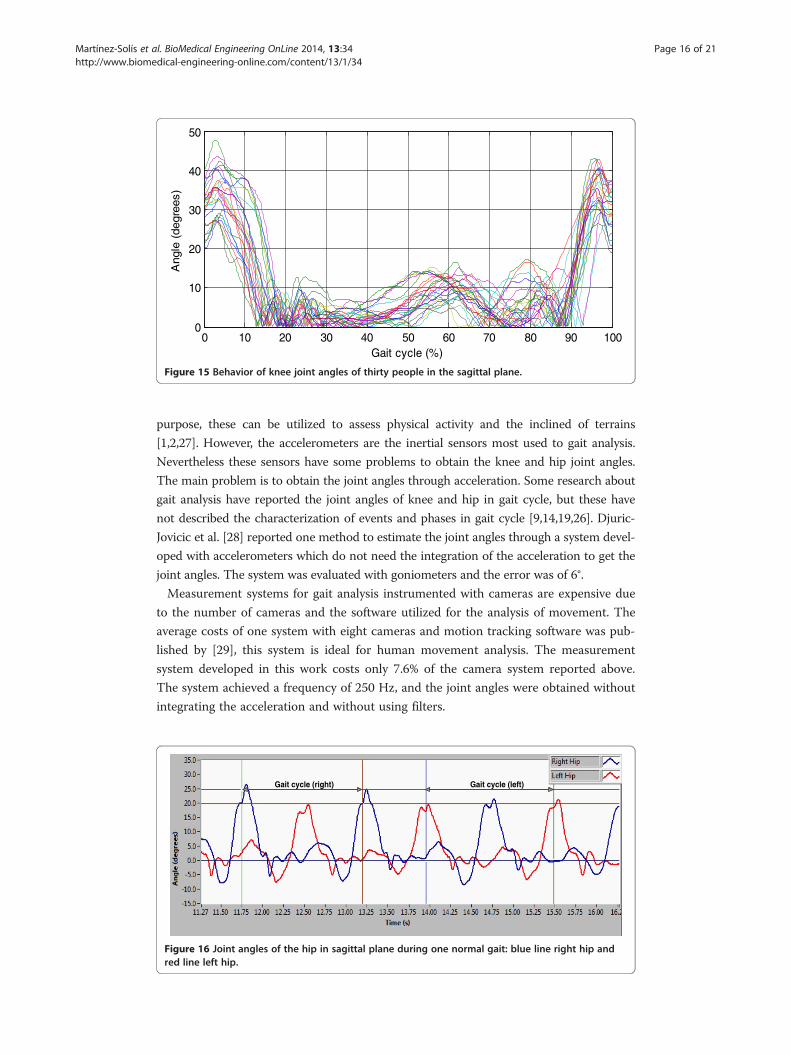
Likewise, Figure 15 reveals the similarities in the motion patterns of the knee; the
variation is about 20°. In both cases (Figures 14 and 15), the changes were related to
walking style, anthropometry, and the phenotype of individuals.
Generally, the results described rhythmic alternating movements of the lower limbs
during walking. The alternation could be observed only in the movements of the hip
joints in the same subject. Also, the amplitude of the joint angles of the right hip and
left do not have the same amplitude; the dominant limb has a greater amplitude respect
to the complementary limb as shown in Figure 16.
Finally the results of the gait analysis are presented in Table 2. This table shows
parameters of gait as the laterality of people, the angles of flexion and extension of the
hip and knee, also the duration time of the gait cycle. A statistical analysis was devel-
oped to obtain the standard deviation in hip and knee angles. In the hip, in stance
phase, the standard deviation in extension maximum angle was of 3.004; in the swing
phase, the standard deviation in the flexion angle was of 2.569. The knee angles, in
stance phase, the standard deviation in extension maximum angle was of 5.425; in the
swing phase the standard deviation in the flexion angle was of 4.653.
DiscussionIn the last decade, accelerometers have been widely used in design of portable measure-
ment systems developed primarily to human motion analysis. Systems have different
0 10 20 30 40 50 60 70 80 90 100-20
-10
0
10
20
30
40
Gait cycle (%)
Angle
(degre
es)
Figure 14 Behavior of hip joint angles of thirty people in the sagittal plane.
0 10 20 30 40 50 60 70 80 90 1000
10
20
30
40
50
Gait cycle (%)
Ang
le (
degr
ees)
Figure 15 Behavior of knee joint angles of thirty people in the sagittal plane.
Martínez-Solís et al. BioMedical Engineering OnLine 2014, 13:34 Page 16 of 21http://www.biomedical-engineering-online.com/content/13/1/34
purpose, these can be utilized to assess physical activity and the inclined of terrains
[1,2,27]. However, the accelerometers are the inertial sensors most used to gait analysis.
Nevertheless these sensors have some problems to obtain the knee and hip joint angles.
The main problem is to obtain the joint angles through acceleration. Some research about
gait analysis have reported the joint angles of knee and hip in gait cycle, but these have
not described the characterization of events and phases in gait cycle [9,14,19,26]. Djuric-
Jovicic et al. [28] reported one method to estimate the joint angles through a system devel-
oped with accelerometers which do not need the integration of the acceleration to get the
joint angles. The system was evaluated with goniometers and the error was of 6°.
Measurement systems for gait analysis instrumented with cameras are expensive due
to the number of cameras and the software utilized for the analysis of movement. The
average costs of one system with eight cameras and motion tracking software was pub-
lished by [29], this system is ideal for human movement analysis. The measurement
system developed in this work costs only 7.6% of the camera system reported above.
The system achieved a frequency of 250 Hz, and the joint angles were obtained without
integrating the acceleration and without using filters.
Gait cycle (right) Gait cycle (left)
Figure 16 Joint angles of the hip in sagittal plane during one normal gait: blue line right hip andred line left hip.
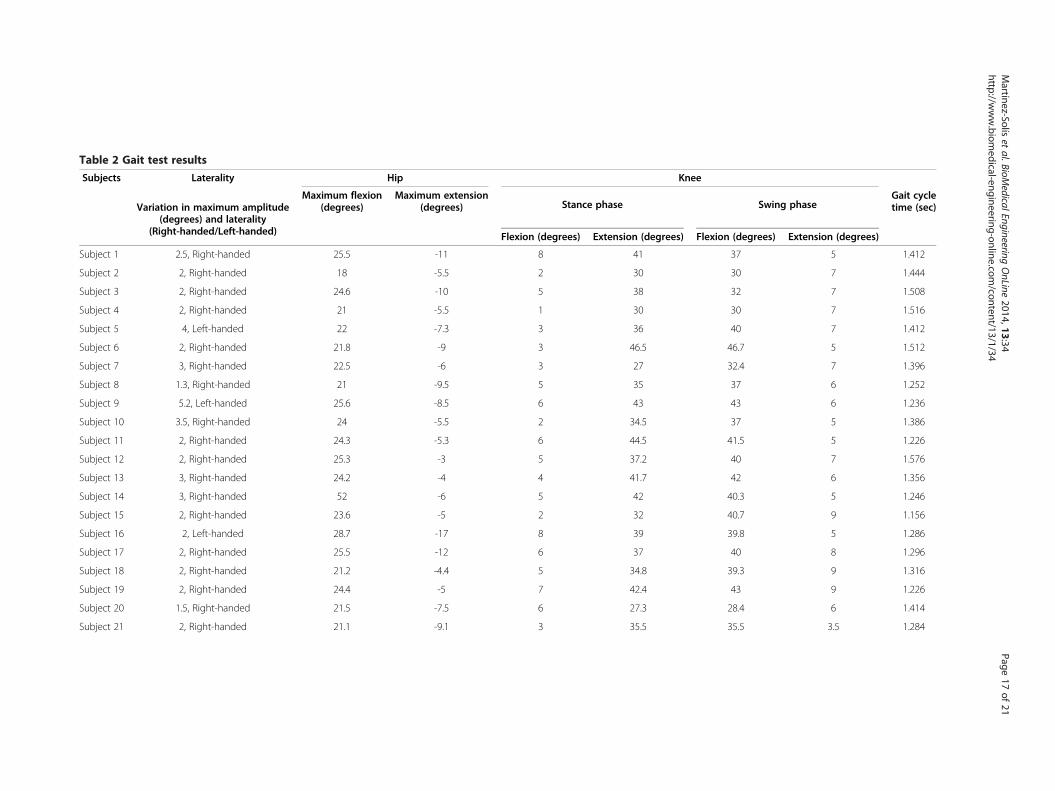
Table 2 Gait test results
Subjects Laterality Hip Knee
Variation in maximum amplitude(degrees) and laterality
(Right-handed/Left-handed)
Maximum flexion(degrees)
Maximum extension(degrees) Stance phase Swing phase
Gait cycletime (sec)
Flexion (degrees) Extension (degrees) Flexion (degrees) Extension (degrees)
Subject 1 2.5, Right-handed 25.5 -11 8 41 37 5 1.412
Subject 2 2, Right-handed 18 -5.5 2 30 30 7 1.444
Subject 3 2, Right-handed 24.6 -10 5 38 32 7 1.508
Subject 4 2, Right-handed 21 -5.5 1 30 30 7 1.516
Subject 5 4, Left-handed 22 -7.3 3 36 40 7 1.412
Subject 6 2, Right-handed 21.8 -9 3 46.5 46.7 5 1.512
Subject 7 3, Right-handed 22.5 -6 3 27 32.4 7 1.396
Subject 8 1.3, Right-handed 21 -9.5 5 35 37 6 1.252
Subject 9 5.2, Left-handed 25.6 -8.5 6 43 43 6 1.236
Subject 10 3.5, Right-handed 24 -5.5 2 34.5 37 5 1.386
Subject 11 2, Right-handed 24.3 -5.3 6 44.5 41.5 5 1.226
Subject 12 2, Right-handed 25.3 -3 5 37.2 40 7 1.576
Subject 13 3, Right-handed 24.2 -4 4 41.7 42 6 1.356
Subject 14 3, Right-handed 52 -6 5 42 40.3 5 1.246
Subject 15 2, Right-handed 23.6 -5 2 32 40.7 9 1.156
Subject 16 2, Left-handed 28.7 -17 8 39 39.8 5 1.286
Subject 17 2, Right-handed 25.5 -12 6 37 40 8 1.296
Subject 18 2, Right-handed 21.2 -4.4 5 34.8 39.3 9 1.316
Subject 19 2, Right-handed 24.4 -5 7 42.4 43 9 1.226
Subject 20 1.5, Right-handed 21.5 -7.5 6 27.3 28.4 6 1.414
Subject 21 2, Right-handed 21.1 -9.1 3 35.5 35.5 3.5 1.284
Martínez-Solís
etal.BioM
edicalEngineeringOnLine
2014,13:34Page
17of
21http://w
ww.biom
edical-engineering-online.com/content/13/1/34
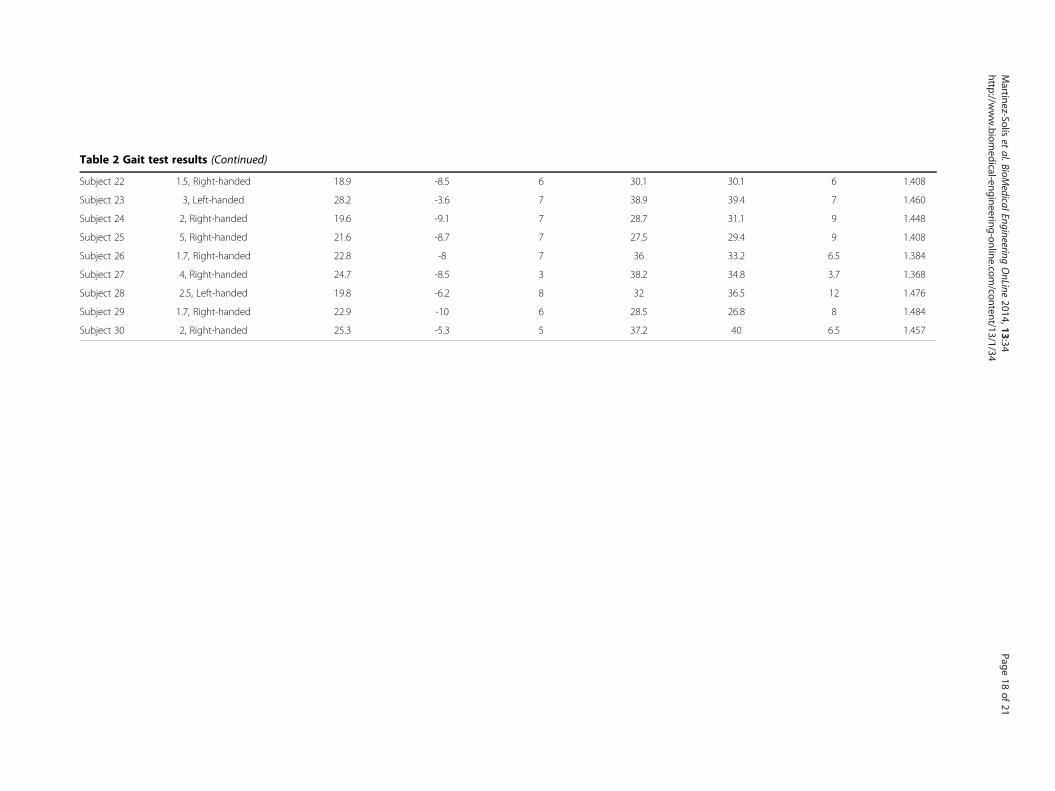
Table 2 Gait test results (Continued)
Subject 22 1.5, Right-handed 18.9 -8.5 6 3 .1 30.1 6 1.408
Subject 23 3, Left-handed 28.2 -3.6 7 3 .9 39.4 7 1.460
Subject 24 2, Right-handed 19.6 -9.1 7 2 .7 31.1 9 1.448
Subject 25 5, Right-handed 21.6 -8.7 7 2 .5 29.4 9 1.408
Subject 26 1.7, Right-handed 22.8 -8 7 6 33.2 6.5 1.384
Subject 27 4, Right-handed 24.7 -8.5 3 3 .2 34.8 3.7 1.368
Subject 28 2.5, Left-handed 19.8 -6.2 8 2 36.5 12 1.476
Subject 29 1.7, Right-handed 22.9 -10 6 2 .5 26.8 8 1.484
Subject 30 2, Right-handed 25.3 -5.3 5 3 .2 40 6.5 1.457
Martínez-Solís
etal.BioM
edicalEngineeringOnLine
2014,13:34Page
18of
21http://w
ww.biom
edical-engineering-online.com/content/13/1/34
0
8
8
7
3
8
3
8
7
Martínez-Solís et al. BioMedical Engineering OnLine 2014, 13:34 Page 19 of 21http://www.biomedical-engineering-online.com/content/13/1/34
The angles had an error on account of two factors: 1) the alignment of the acceler-
ometer with the vertical, and 2) the small displacement that could have the accelerom-
eter during analysis, these without considering the error of tilt angle of 0.75°. So the
maximum error in the hip angle was 1.55°, and 3.1° (approximately) in the knee angle,
the latter was higher because the angle knee depends on the tilt angles in the thigh and
leg. The average of the sample record in a single gait cycle was of 340 samples. The
aim was obtain the joint angles in knee and hip and its particularity to characterized
the even and phases in gait cycle; and additionally see as these could change when the
measurement system use a mobile reference frame. The method to calculate the tilt
angle only can be considered to angular velocities of 1 rad/sec.
The results described motion patterns of the joint of hip and knee with particularities
associated with people walking style. The capture of multiple gait cycles revealed a dif-
ference in the maximum amplitudes of the hip joint which was associated with the lat-
erality of the subject. Also, the results indicate that there are not two equal consecutive
motion patterns even if it is the same subject.
Regarding the characterization of the gait cycle, several works describe the joint angles of
hip and knee in the sagittal plane. These works show a standard movement pattern of the
lower limb joints [7,8,11,13,22]. Particularly the work reported by [8] shows the motion
pattern of hip and knee in the sagittal plane with the following characteristics: 1) in hip
reported three movements: two flexions about 29 degrees, one at beginning and another at
the cycle ends; and one extension of -15° about 50% of the gait cycle, 2) in knee reported
two flexion-extension movements: one of 0 to 30% of the gait cycle with an amplitude
approximately of 15°, and another in 30-100% of the gait cycle with an amplitude of 50°.
In this paper, the characterization of the gait cycle was performed in the sagittal
plane. Figures 12 and 13 present hip and knee angles with the gait phases (stance phase
and swing phase), as several authors have reported in [7,8,11].
For the characterization of the hip joint angle, it was necessary to divide the gait cycle in
5 events as shown in Figure 12. The gait cycle starts with a flexion movement about 6°
which determines the maximum amplitude. This movement is caused by the weight
change owing transition of the lower limb. As for the pattern the knee (see Figure 13), it
presents two movements of flexion-extension: one of 0-15% and other of 85-100% of the
gait cycle. The movements indicate that the gait cycle starts with an angle greater than 15°,
and it ends with an angle of similar amplitude. The average angular velocity registered dur-
ing gait was of 0.7 rad/sec it was presented at stance phase. Based on the obtained results,
it was observed that the angles vary as a consequence of the style walking, anthropometric
characteristics and people phenotype, but they are similar to the movement patterns.
Finally, the evolution of the joint movement of the dominant lower limb was showed
in Figure 11 to reproduce each captured movement by the measuring system. Graphic-
ally it was possible to observe that the flexions at the beginning and the end the cycle
ends are performed in time short intervals with regard to the movements made in the
transition and the movements of equilibrium to keep up body standing.
ConclusionsIn this work the kinematics of the lower limbs was obtained through a measurement
system developed with accelerometers. The results described different movement patterns
in comparison with the papers reported in literature. These differences are considered as
Martínez-Solís et al. BioMedical Engineering OnLine 2014, 13:34 Page 20 of 21http://www.biomedical-engineering-online.com/content/13/1/34
a consequence of the reference frame used to obtain the joint angles. The aim was to
obtain the gait cycle with the advantages and disadvantages that the method have.
The results showed the particularities that were related with the laterality of people
and one possible screw-home movement of the knee. Moreover, according to the
parameter similarities, the characterization could be used to obtain normal gait
patterns like the ones obtained in biomechanical laboratories.
The measurement system presented some advantages such as: 1) Portability: it
allowed to record several steps during the gait (a average 8 to 10 gait cycles). 2) Cheap
system: the electronic devices implemented are low cost and the instrumentation is not
complex, furthermore it is not necessary to adapt the system to the environment. 3)
The obtaining of the tilt angle without integrating the acceleration: this allowed that
the error in the joint angles was related with the accelerometers alignment.
The FPGA instrumented on PCI card allows to increase the number of accelerome-
ters or sensors others without affect the samples per second.
The length of the power cord limited the portability of the system, for this reason in
a future work, the accelerometers will be wireless to remove the power cord between
the accelerometers and the Pc.
Competing interestsThe authors declare that they have no competing interests.
Authors’ contributionsFM; Conducted the study, the analysis the data and wrote the manuscript. SV, VO and MV design the measurementsystem and helped in the interpretation of the results. JR and AC were involved in the design of study, interpreted ofresults and reviewed the manuscript for scientific content. All the authors read and approved the final manuscript.
AcknowledgementsFermin Martinez Solis wishes to acknowledge the financial support of the National Council of Science and Technologyfrom México (CONACYT).
Author details1Department of Electronics, National Center for Research and Technological Development, Cuernavaca, Morelos, Mexico.2Department of Mechanics, National Center for Research and Technological Development, Cuernavaca, Morelos, Mexico.3Autonomous University of Puebla, Puebla, Mexico. 4Autonomous University Benito Juárez of Oaxaca, Oaxaca, Mexico.
Received: 10 November 2013 Accepted: 5 March 2014Published: 31 March 2014
References
1. Che-Chang Y, Yeh-Liang H: A review of accelerometry-based wearable motion detectors for physical activitymonitoring. Sensor 2010, 10:7772–7788.2. Dejnabadi H, Jolles BM, Aminian K: A new approach to accurate measurement of uniaxial joint angles based
on a combination of accelerometers and gyroscopes. IEEE Trans Biomed Eng 2005, 52:1478–1484.3. Huang H, Kuiken TA, Lipschutz RD: A strategy for identifying locomotion modes using surface
electromyography. IEEE Trans Biomed Eng 2009, 56:65–73.4. Villa MA, Gutiérrez GE, Pérez MJ, Villa MA, Gutiérrez GE, Pérez MJ: Consideraciones para el análisis de la marcha
humana. Técnicas de videogrametría, electromiografía y dinamometría 1. Rev Ing Bioméd 2008, 2:16–26.5. Oberg T, Karsznia A, Oberg K: Joint angle parameters in gait: reference data for normal subjects, 10-79 years
of age. J Rehabil Res Dev 1994, 31:199–213.6. Pérez J, Pichardo A, Chávez D: Análisis de parametros cinemáticos de la marcha normal. Estudio y análisis de
patrones de marcha normal. Rev Mex Ortop Traum 1998, 19:372–376.7. Donal A: Kinesiology of the Musculoskeletal System. 1st edition. USA: Mosby, Inc; 2002:2002.8. Whittle MW: Gait Analisis an Introduction. 4th edition. London/GB: Elsevier Health Sciences; 2007:244.9. Tao W, Liu T, Zheng R, Feng H: Gait analysis using wearable sensors. Sensors 2012, 12:2255–2283.10. Detrembleur C, Vanmarsenille J, De CF: Relationship between energy cost, gait speed, vertical displacement of centre
of body mass and ef ciency of pendulum-like mechanism in unilateral amputee gait. Gait Posture 2005, 21:333–340.11. Winter D: Biomechanics and Motor Control of Human Movement. 2nd edition. Waterloo Ontario, Canada: John
Wiley & Sons, Inc.; 2005.12. Dugan SA, Bhat KP: Biomechanics and analysis of running gait. Phys Phys Med Rehabil Clin North Am 2005,
16:603–621.13. Dollar AM, Herr H: Lower extremity exoskeletons and active orthoses: challenges and state-of-the-art. IEEE
Trans Robot 2008, 24:144–158.
Martínez-Solís et al. BioMedical Engineering OnLine 2014, 13:34 Page 21 of 21http://www.biomedical-engineering-online.com/content/13/1/34
14. Dejnabadi H, Jolles BM, Casanova E, Fua P, Aminian K: Estimation and visualization of sagittal kinematics oflower limbs orientation using body-fixed sensors. IEEE Trans Biomed Eng 2006, 53:1385–1393.
15. Liu T, Inoue Y, Shibata K, Shiojima K: Three-dimensional gait analysis system with mobile force plates andmotion sensors. In 8th Int Conf Ubiquitous Robot Ambient Intell. IEEE; 2011:107–110.
16. Liu T, Inoue Y, Shibata K: A mobile force plate and three-dimensional motion analysis system for three-dimensionalgait assessment. IEEE Sensor J Sensor J 2012, 12:1461–1467.
17. Mayagoitia RE, Nene AV, Veltink PH: Accelerometer and rate gyroscope measurement of kinematics: an inexpensivealternative to optical motion analysis systems. J Biomech 2002, 35:537–542.
18. Willemsen A, Frigo C, Boom H: Lower extremity angle measurement with accelerometers-error and sensibilityanalysis. IEEE Trans Biomed Eng 1991, 38:1186–1193.
19. Kun L, Inoue Y, Shibata K, Enguo C: Ambulatory estimation of knee-joint kinematics in anatomical coordinatesystem using accelerometers and magnetometers. IEEE Trans Biomed Eng 2011, 58:435–442.
20. Correa D, Balbinot A: Accelerometry for the motion analysis of the lateral plane of the human body duringgait. Heal Technol 2011, 1:35–46.
21. Godwin A, Agnew M, Stevenson J: Accuracy of inertial motion sensors in static, quasistatic, and complexdynamic motion. J Biomech Eng 2009, 131:1–5.
22. Pons JL, Moreno JC, Brunetti FJ, Rocon E: Lower-Limb Wearable Exoskeleton. In Proc Rehabil Robot. Viena,Australia: I-Tech Education and Publishing; 2007:471–498.
23. ADIS16209. http://www.analog.com/static/imported-files/data_sheets/ADIS16209.pdf.24. Shanley T, Anderson D: PCI System Architecture, Fourth. USA: MindShare, Inc; 1999:123–139.25. Reyes F: Robótica: Control de Robots Manipuladores. 1st edition. México: Alfaomega; 2001.26. Reyes F, Rosaldo A: Polynomial family of PD-type controllers for robot manipulators control engineering practice.
Control Eng Pract 2005, 13:441–450.27. Wang N, Redmond SJ, Ambikairajah E, Celler BG, Lovell NH: Can triaxial accelerometry accurately recognize
inclined walking terrains? IEEE Trans Biomed Eng 2010, 57:2506–2516.28. Djuric-Jovicic MD, Jovicic NS, Popovic DB: Kinematics of gait: new method for angle estimation based on
accelerometers. Sensors 2011, 11:10571–10585.29. Moltenbrey K: Spotlight: your resourse for products, user publications, news, and market research.
Comput Graph World 2009, 7:32.
doi:10.1186/1475-925X-13-34Cite this article as: Martínez-Solís et al.: A portable system with sample rate of 250 Hz for characterization of kneeand hip angles in the sagittal plane during gait. BioMedical Engineering OnLine 2014 13:34.
Submit your next manuscript to BioMed Centraland take full advantage of:
• Convenient online submission
• Thorough peer review
• No space constraints or color figure charges
• Immediate publication on acceptance
• Inclusion in PubMed, CAS, Scopus and Google Scholar
• Research which is freely available for redistribution
Submit your manuscript at www.biomedcentral.com/submit