Embed Size (px)
Citation preview
RESEARCH ON RELATION BETWEEN CONTROL POINTS PRECISION AND GEOMETRIC CORRECTION ACCURACY
Hong Youtang
Department of Land Science and Technology, China University of Geosciences (Beijing)
KEY WORDS: Geometric, Accuracy, Correction, Image, Analysis, Precision ABSTRACT: Through ASTER, ETM, SPOT5 and IKONOS four kinds of remote-sensing images (a coarse correction) , this paper makes a geometric correction for these four remote sensing images, using the control points which are collected by calculating with topographic map, surveying in field with portable GPS, and GPS (technique of RTK), calculates the image coordinate of the corrected test points. At last, researching the relation between control points precision and geometric correction accuracy by statistical calculating. By means of comparison and analysis in a set of test, discovers that the more higher accuracy of control points, the more higher geometric accuracy of corrected images. But for low-mid resolution remote sensing images (such as ASTER. ETM etc.), as the accuracy of control points improving, the geometric accuracy of corrected images elevates a little; however, for high resolution images (such as SPOTS5. IKONOS, etc.), as the accuracy of control points improving, the geometric accuracy of corrected images elevates a lot.
1. INTRODUCTION
There are several methods to get control points which are needed in geometric correction of remote sensing images. The first is surveying in field by portable GPS. Secondly, calculating with topographic map. The last one is obtaining through GPS (technique of RTK) or other high precision surveying instruments. Over the three ways, the portable GPS operation is easy and convenience but a low precision. Although survey by GPS (technique of RTK) or other high precision survey instruments has a high precision, it is a lot of fieldwork and not suitable to work in large area. The precision is relate to the scale for calculating with map, generally, it’s easy to buy topographic map with the 1:50000 (1:10000 in same area) scale, even less. However the larger scale maps are difficult to get and most of them are in old period. It’s an influence for selecting control points. Practically, most of control points which are needed in geometry adjustment of remote sensing images can be calculated through topographic maps. So how about the precision of geometric correction with the control points are got by other collecting means? Also, whether we can adopt other appropriate means of collecting control points or not for the different spatial resolution remote sensing images in geometric correction. This paper makes a geometric correction with control points collected by the above-mentioned three kinds of methods, through ASTER, ETM, SPOT and IKONOS four kinds of remote-sensing images (a coarse correction) for the study. After comparative analysis we get the conclusions.
2. METHODS
In this research, we select a certain amount of control points which can be identified from the topographic map, the remote sensing and the field. Calculate coordinates of collecting control points respectively on 1:50000 and 1:10000 scale topographic maps (correct by 1:10000 scale one for IKONOS). At the same time, get control point coordinates with portable GPS and GPS (RTK) in the wild. And then accurately correcting ASTER, ETM, SPOT and IKONOS four kinds of remote sensing(quadratic polynomial method for correction, most of the neighboring pixels of resample) through the three sets of data
obtained, and calculating image coordinates of control points after accurate geometric correction. Finally ,by means of formula (1), we calculate and obtain point accuracy with accurate geometric correction for four kinds of remote sensing images, get the conclusions by comparative analysis.
N][ yyxx
P
δδδδδ
+±= (1)
N is the number of control points
2.1 Research on precision of geometric correction of remote sensing images by topographic map
Select obvious points of ground feature, for example, make junction, corners of buildings as control points of correction. The control points in ASTER, ETM and SPOT5 image are selected by 1:50000 topographic map of Beijing, 16 control points are in ASTER image, 13 are in ETM image, 16 are in SPOT image; the control points in IKONOS image are selected by 1:10000 topographic map of Daanshan area in Beijing, the number of control points is 16. The detailed distribution of GCP reference Figure 1 ----Figure 4.
Figure 1. ETM image and control points for correction
1129
The International Archives of the Photogrammetry, Remote Sensing and Spatial Information Sciences. Vol. XXXVII. Part B4. Beijing 2008
Figure 2. ASTER image and control points for correction
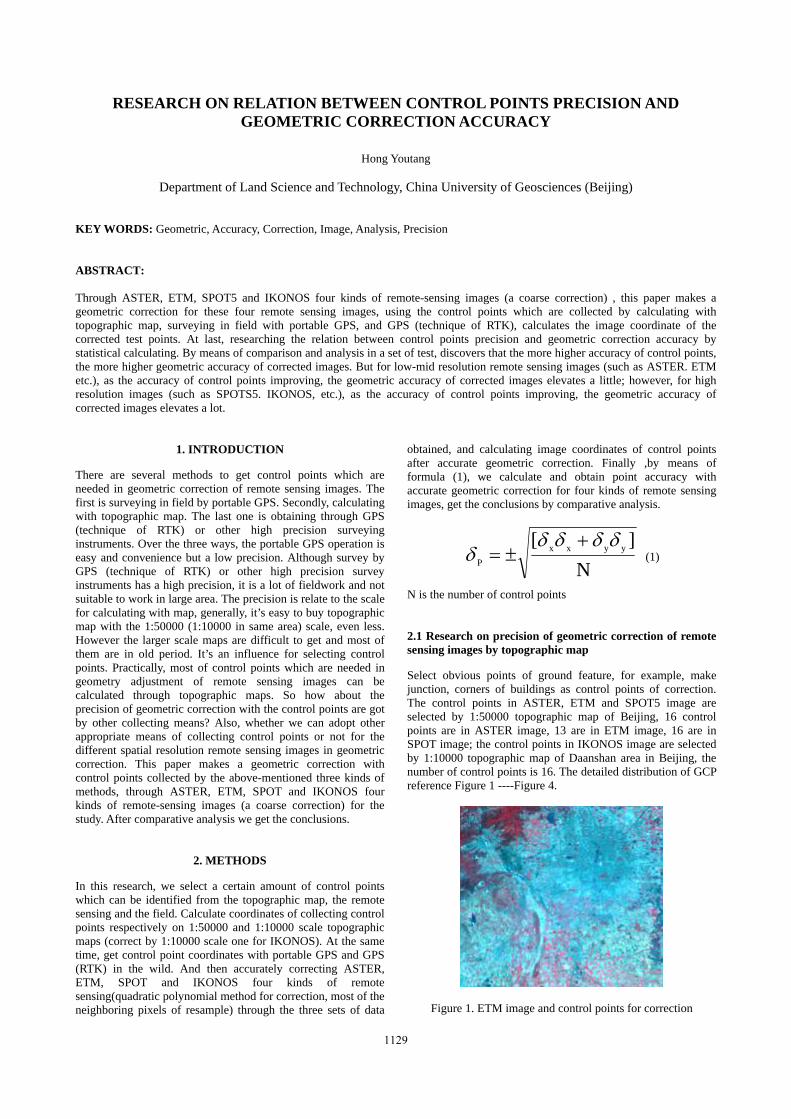
Figure 3. SPOT5 image and control points for correction
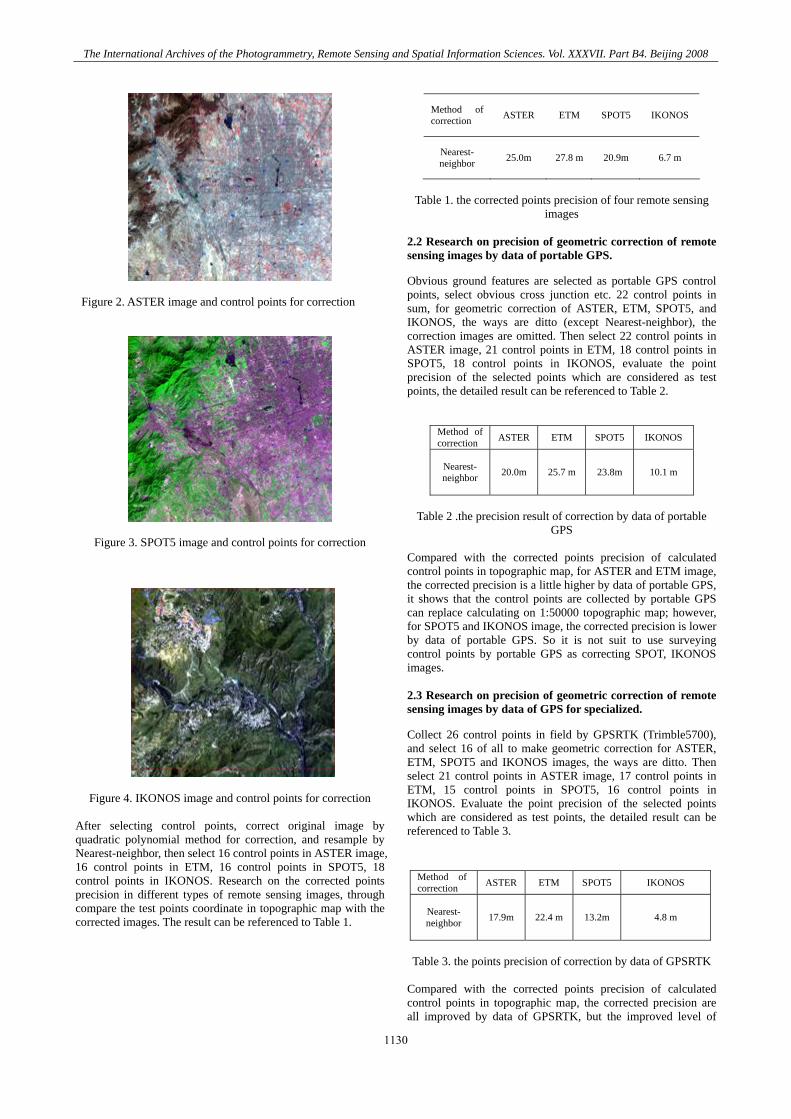
Figure 4. IKONOS image and control points for correction
After selecting control points, correct original image by quadratic polynomial method for correction, and resample by Nearest-neighbor, then select 16 control points in ASTER image, 16 control points in ETM, 16 control points in SPOT5, 18 control points in IKONOS. Research on the corrected points precision in different types of remote sensing images, through compare the test points coordinate in topographic map with the corrected images. The result can be referenced to Table 1.
Method of correction ASTER ETM SPOT5 IKONOS
Nearest- neighbor 25.0m 27.8 m 20.9m 6.7 m
Table 1. the corrected points precision of four remote sensing
images 2.2 Research on precision of geometric correction of remote sensing images by data of portable GPS.
Obvious ground features are selected as portable GPS control points, select obvious cross junction etc. 22 control points in sum, for geometric correction of ASTER, ETM, SPOT5, and IKONOS, the ways are ditto (except Nearest-neighbor), the correction images are omitted. Then select 22 control points in ASTER image, 21 control points in ETM, 18 control points in SPOT5, 18 control points in IKONOS, evaluate the point precision of the selected points which are considered as test points, the detailed result can be referenced to Table 2.
Method of correction ASTER ETM SPOT5 IKONOS
Nearest- neighbor 20.0m 25.7 m 23.8m 10.1 m
Table 2 .the precision result of correction by data of portable
GPS Compared with the corrected points precision of calculated control points in topographic map, for ASTER and ETM image, the corrected precision is a little higher by data of portable GPS, it shows that the control points are collected by portable GPS can replace calculating on 1:50000 topographic map; however, for SPOT5 and IKONOS image, the corrected precision is lower by data of portable GPS. So it is not suit to use surveying control points by portable GPS as correcting SPOT, IKONOS images. 2.3 Research on precision of geometric correction of remote sensing images by data of GPS for specialized.
Collect 26 control points in field by GPSRTK (Trimble5700), and select 16 of all to make geometric correction for ASTER, ETM, SPOT5 and IKONOS images, the ways are ditto. Then select 21 control points in ASTER image, 17 control points in ETM, 15 control points in SPOT5, 16 control points in IKONOS. Evaluate the point precision of the selected points which are considered as test points, the detailed result can be referenced to Table 3.
Table 3. the points precision of correction by data of GPSRTK
Compared with the corrected points precision of calculated control points in topographic map, the corrected precision are all improved by data of GPSRTK, but the improved level of
Method of correction ASTER ETM SPOT5 IKONOS
Nearest- neighbor 17.9m 22.4 m 13.2m 4.8 m
1130
The International Archives of the Photogrammetry, Remote Sensing and Spatial Information Sciences. Vol. XXXVII. Part B4. Beijing 2008
ASTER and ETM image is not good as SPOT5 and IKONOS image. It shows that high precision control points are in favour in improving the accuracy of geometric correction, but for different resolution images, the improving level is different; also shows that it is necessary to use high precision control points for geometric correction of images for high spatial resolution.
3. RESULTS AND CONCLUSIONS
By statistical calculation the result is following: (1) the precision of ASTER, ETM, SPOT5 and IKONOS four kinds of remote sensing are respectively 25 meters, 28 meters, 21 meters and 6.7 meters through accurate geometric correction by calculating control points in topographic map. (2) the precision of ASTER, ETM, SPOT5 and IKONOS four kinds of remote sensing are respectively 20 meters, 26 meters, 24 meters and 10.1 meters through accurate geometric correction by surveying control points in the wild. (3) the precision of ASTER, ETM, SPOT5 and IKONOS four kinds of remote sensing are respectively 18 meters, 22 meters, 13 meters and 4.8 meters through accurate geometric correction by GPS (technique of RTK ) or other high accurate survey instruments. By comparative analysis we obtain the following conclusions: (1)the correction accuracy of ASTER and ETM images using points surveyed by portable GPS is equivalent in comparison to the correction accuracy of ASTER and ETM images by calculating points on topographic map, and slightly higher than the latter. It shows that surveying points by portable GPS can be instead of calculating on 1:50000 scale topographic map. It is suggested that control points needed in geometric correction can be obtained by topographic maps or by portable GPS for ASTER and ETM images. (2)the correction accuracy of SPOT5 and IKONOS images using points surveyed by portable GPS is lower than the correction accuracy of ASTER and ETM images by calculating points in topographic map. So it is best not to use surveying control points by portable GPS to correct SPOT5, IKONOS images. (3)Using the points surveyed by GPS (technique of RTK ), the correction accuracy of the four images has been enhanced in comparison to using the points calculated in topographic map. Especially, the accuracy of SPOT and IKONOS images raises more. But it is not significant to improve the correction accuracy of ASTER and ETM images under improving the accuracy of the control points. (4)It shows that improving the accuracy of control points can increase the correction accuracy correspondingly. In order to get higher accuracy for the high spatial resolution remote sensing images , such as SPOT5 and IKONOS images, it is necessary to use higher precision control points . It is suggested that control points needed in geometric correction can be obtained by topographic maps or by GPS (technique of RTK ) for SPOT5
and IKONOS images .
ACKNOWLEDGEMENTS
This work was supported by Aero Geophysical Survey And Remote Sensing Center(NO:1212010611).The author would like to thank Chen Jianping,Tian Sufang and Gao Hui for their suggestion
REFERENCES
[1] Dial, Gene and Jacek Grodecki (2002b). “IKONOS Accuracy without Ground Control.” Proceedings of ISPRS Comission I Mid-Term Symposium, Denver, CO, November 10-15, 2002. [2] Grodecki, J. and Dial, G., IKONOS geometric accuracy validation". Proc. of ISPRS Commission I, Mid-Term Symposium, Denver, CO, November, 10-15, 2002. [3] Grodecki, J. IKONOS stereo feature extraction-RPC approach. Proceedings of 2001 ASPRS Annual Convention (CD ROM),2001, 23-27 April, St. Louis, Missouri, unpaginated. [4] Hattori S., Ono T., Fraser C., Hasegawa H..Orientation of high-resolution satellite images based on affine projection, International Archives of Photogrammetry & Remote sensing, Amsterdam,2000, 33(B3), p.p. 59-366. [5] Hanley, H.B. and Fraser, C.S., Geopositioning accuracy of Ikonos imagery: indications from 2D transformation". Photogrammtry. Rec.2001, 17(98), 317-329 [6] J. Grodecki and G. Dial, IKONOS Geometric Accuracy, Proceedings of Joint Workshop of ISPRS Working Groups I/2, I/5 and IV/7 on High Resolution Mapping from Space 2001, University of Hannover, Hannover, Germany, Sept 19-21, 2001. [7] Chen Jianping , Ding Huoping, Wang Gongwen, Li Qing. Modeling for Desertification Expansion Through Integrating GIS with Cellular Automata Model.Proceedings of IAMG’05: GIS and Spatial Analysis, Vol.1, 105-110 [8] Kim, J. R., Muller, J-. P.,. 3D Reconstruction from Very High Resolution Satellite Stereo and Its Application to Object Identification. Symposium on Geospatial theory, Processing and Applications, Ottawa.2002 [9] Fen Zhogkui,etc. Geometric Accuracy Analysis of Digital Inlay on TM Image and The Probe of Inlay Ways.RemoteSensingof Environment,1996,4(11):295- 301. [10] Liu Chun, Liu Dajie, Wang Jialin. Spatial visual of Geometric Correction Accuracy of High Resolution Satellite Images. Transaction of Tongji University, 2004,32(3):372-377. [11] Wang Xinmin, etc. Geometric Accuracy Analysis of Corrected Production of LANDSAT 5. Remote Sensing of Environment,1989,4(4):293-298.
1131

The International Archives of the Photogrammetry, Remote Sensing and Spatial Information Sciences. Vol. XXXVII. Part B4. Beijing 2008
1132