Embed Size (px)
Citation preview
143The Archives of Automotive Engineering – Archiwum Motoryzacji Vol. 82, No. 4, 2018
RESEARCH OF INDIVIDUAL FACTORS AFFECTING THE ENGINE POWER
WHILE A PASSENGER CAR OPERATION
BRANISLAV ŠARKAN1, ONDREJ STOPKA2, MÁRIA CHOVANCOVÁ3, IWONA RYBICKA4, LARISA M. KAPUSTINA5
University of Zilina, Institute of Technology and Business in Ceske Budejovice, Lublin University of Technology, Ural State University of Economics
Summary
Power of any kind of a car engine is considered to be one of the basic factors in order to choose or assess vehicles equipment or its appropriateness. It influences several operation properties including car maximum velocity, car acceleration, etc. A car producer shall issue the data about an engine power of a car in a form of its technical attributes, nevertheless an engine power specification is also stated in a car registration certificate. Engine power may be defined as the maximum engine output at given revolutions of an engine, i.e. maximum engine power. In most of cases of cars operation, various situations may occur in order to specify the maximum engine power value. This study addresses the issue of determining individual factors affecting the engine power while a passenger car in operation, i.e. testing the engine power on the single roller bench and related particular analysis.
Keywords: Engine power, passenger car, operation, single roller bench, research, road transport
1. Introduction
Engine power, more specifically its properties depending on engine revolutions, is con-sidered to be one of the basic factors of passenger cars. In order to test an engine power, various methods, uneven to each other, are known.
General methods to specify an engine power are, as follows [1-8]: • engine brake testing,• single roller bench testing,• dynamic testing while a car acceleration.
1 University of Zilina, Faculty of Operation and Economics of Transport and Communications, Department of Road and Urban Transport, Univerzitna 8215/1, 010 26 Zilina, Slovak Republic, e-mail: [email protected]
2 Institute of Technology and Business in Ceske Budejovice, Faculty of Technology, Department of Transport and Logistics, Okruzni 517/10, 370 01 Ceske Budejovice, Czech Republic, e-mail: [email protected]
3 Institute of Technology and Business in Ceske Budejovice, Faculty of Technology, Department of Transport and Logistics, Okruzni 517/10, 370 01 Ceske Budejovice, Czech Republic, e-mail: [email protected]
4 Lublin University of Technology, Faculty of Mechanical Engineering, ul. Nadbystrzycka 36, 20-618 Lublin, Poland, e-mail: [email protected]
5 Ural State University of Economics, 8 Marta, 62, 620144, Yekaterinburg, Russia, e-mail: [email protected]
144 The Archives of Automotive Engineering – Archiwum Motoryzacji Vol. 82, No. 4, 2018
Single roller bench testing [9] may be performed especially for the purpose of operability of testing itself, given the fact that an engine is not removed from a car while testing. Nevertheless, the problem consists in a fact that actually a power at the driving wheels periphery is measured, whereas an actual engine power on the crankshaft is supposed to be measured. The actual engine power value is specified subsequently applying particular correction process.
Power at the driving wheels periphery is specific factor to assess the state and features of entire car driving mechanism objectively without any removal process and with minimum time consumption. Power at the driving wheels periphery value enables to identify a car engine state. If deterioration regarding the engine power is observed, the engine failure will be diagnosed utilizing specific diagnostic device. Once the engine failure is removed, activities on the roller bench may continue.
Nevertheless [10], if the engine power testing is required to be performed, the exact value of loss power for each car type or total value of the power at the driving wheels periphery is to be specified. This power has always less value comparing to the value of effective engine power obtained by an engine running.
Distinction between the effective engine power and power at the driving wheels periphery is referred to as the power loss. It is generated by an internal resistance of the engine gear-box, shaft bearing friction as well as wheels rolling resistance. Unlike internal resistance of the engine gearbox and shaft bearing friction, having approximately the same values, wheels rolling resistance value increases with a car velocity as well as it is dependent on tires design, their inflation pressure, load factor on driving axles and current traffic and road circumstances (cylinders surface material of a single roller bench, their wheelbase) [11, 12].
2. Equipment, data and methods
Single roller bench is a high quality and very precise diagnostic equipment aimed to test a car engine power with inter-axle control regulation. One cylinder on a wheel enables to execute a long-lasting test without any risk of wheel damage. While testing, a car is in considerably higher position compared to the laboratory surface, and due to this aspect car may be cool down by flowing air more effectively [9, 13].
Based on required outputs, following kinds of tests may be performed on this device:
• engine power testing,
• load factor simulation,
• engine flexuosity testing,
• tachometer monitoring.
Specific technical parameters of the single roller bench are summarized in Table 1, as follows.
145The Archives of Automotive Engineering – Archiwum Motoryzacji Vol. 82, No. 4, 2018
Table 1. Specific parameters of the single roller bench. Source: [9]
Cylinders wheelbase610 mm diameter balanced roll, 737 inner track, 2,184.4 outer track width
Max horsepower 2,000 hp
Max absorption 900 hp
Inertia 705 kg
Max speed 322 km.h-1
Permissible axle load 2,500 kg
Top speed 320 km.h-1
Air requirements 80 PSI, dry, regulated, oil free;
Power requirements 230 VAC, single phase, 60 Hz, 40 Amps
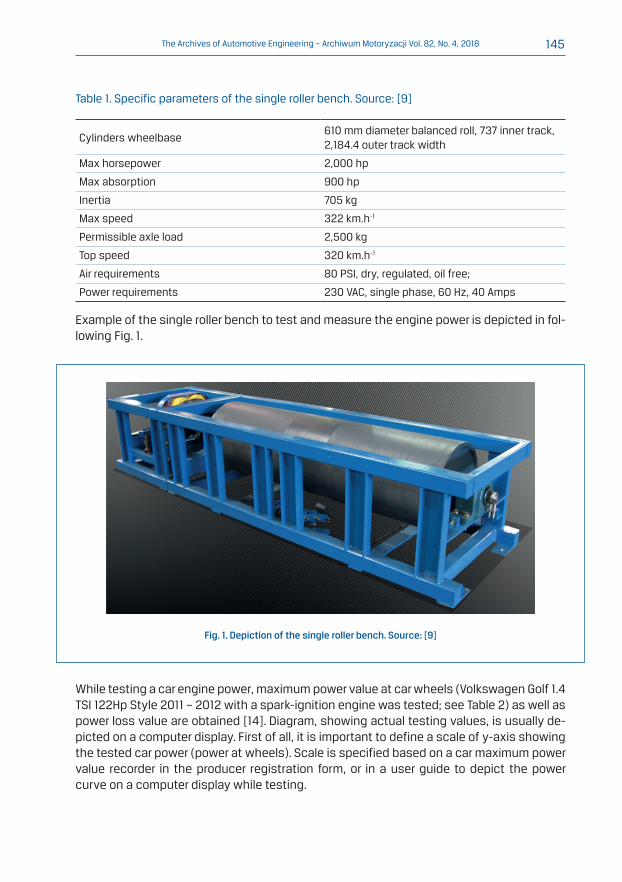
Example of the single roller bench to test and measure the engine power is depicted in fol-lowing Fig. 1.
Fig. 1. Depiction of the single roller bench. Source: [9]
While testing a car engine power, maximum power value at car wheels (Volkswagen Golf 1.4 TSI 122Hp Style 2011 – 2012 with a spark-ignition engine was tested; see Table 2) as well as power loss value are obtained [14]. Diagram, showing actual testing values, is usually de-picted on a computer display. First of all, it is important to define a scale of y-axis showing the tested car power (power at wheels). Scale is specified based on a car maximum power value recorder in the producer registration form, or in a user guide to depict the power curve on a computer display while testing.
146 The Archives of Automotive Engineering – Archiwum Motoryzacji Vol. 82, No. 4, 2018
Table 2. List of basic parameters of the tested car. Source: [14]
Car brand Volkswagen Golf Engine code CAXA
Engine volume 1,390 cm3 Length 4,199 cm
Fuel type Petrol Width 1,779 cm
Number of cylinders 4 Height 1,479 cm
Maximum performance 90 kW at 5,000 rpm Curb weight 1,190 kg
Maximum torque 200 Nm at 4,000 rpm Gross weight 1,820 kg
Maximum design speed 195 km.h-1 Number of valves 16
3. Outcomes
Testing process is resulted from the continuous car acceleration until penultimate gear shift on which the testing is running. It must be achieved up to a car velocity of 50 km.h-1, considering the fact that this value initiates an engine power testing. From this stage, it is important to completely press an accelerator pedal and monitor a computer display. Once the maximum engine power is reached, clutch will be turned off and accelera-tor pedal will be depressed. Subsequently, slowdown process is started which records a power loss (gearbox, wheels). After completion of the power testing, a chart of power curves depending on the defined technical standard will be shown on a computer dis-play [15-17].
If engine power testing is performed at several gear shifts [18], several data types may be obtained. It may be handy to analyze factor influencing the engine power more compre-hensively within entire engine revolutions range [19].
Fig. 2, as follows, shows the engine power curves recorded on the single roller bench ac-cording to common instructions (by producer). Maximum power testing at 1st gear shift appears to be uncertain. While a testing process at 1st gear shift, a higher power is already reached, nevertheless these values are not maximum values yet. Given this fact, following analysis takes into consideration values only at 2nd – 5th gear shifts. Due to the fact that the single roller bench is set up in order that each testing phase is always commenced at a car velocity of 50 km.h-1, at a higher gear shift, testing is commenced at lower engine revolutions. To provide the same engine revolutions range for all gear shifts, it is important to vary the single roller bench set up for each gear shift separately. This also influences the scope of subsequent research data [20, 21].

147The Archives of Automotive Engineering – Archiwum Motoryzacji Vol. 82, No. 4, 2018
Fig. 2. Engine power curves at each gear shift. Source: authors
While testing, it is obvious that maximum power values declared by the car producer are supposed to be reached at each gear shift (except for 1st gear shift) [22, 23].
All related engine power values measured when reaching the maximum engine power of the tested car are summarized in following Table 3.
Table 3. Related engine power values. Source: authors
Gear shiftP
NORM
[kW]P
M
[kW]P
WHEELS
[kW]P
LOSS
[kW]at n
M
[rpm]T
M
[Nm]at n
M
[rpm]
I 73.8 72.6 61.0 7.4 4,850 112.7 3,850
II 82.8 81.9 71.6 11.6 4,990 195.3 3,270
III 86.3 84.2 71.5 14.2 4,980 196.7 3,290
IV 86.4 84.8 68.5 19.3 4,985 198.8 3,245
V 84.7 83.4 65.7 21.8 4,975 194.5 3,275
Explanatory notes:power at wheels - P
WHEELS,
power loss - PLOSS
, maximum engine power - P
M,
normal engine power - PNORM
,engine torque - T
M,
engine revolutions - nM,
revolutions per minute - rpm.
148 The Archives of Automotive Engineering – Archiwum Motoryzacji Vol. 82, No. 4, 2018
Normal engine power is the engine output determined according to the particular technical standard [10]. Recorded maximum engine power PM is modified using a correction fac-tor CF (see equation 1) guaranteeing relation of outcomes to standardized surroundings circumstances.
The Archives of Automotive Engineering – Archiwum Motoryzacji Vol. 82, No. 4, 2018
While testing, it is obvious that maximum power values declared by the car producer are supposed to be reached at each gear shift (except for 1st gear shift) [22, 23].
All related engine power values measured when reaching the maximum engine power of the tested car are summarized in following Table 3.
Table 3. Related engine power values. Source: authors
Gear shift PNORM [kW]
PM [kW]
PWHEELS [kW]
PLOSS [kW]
at nM [rpm]
TM [Nm]
at nM [rpm]
I 73.8 72.6 61.0 7.4 4,850 112.7 3,850 II 82.8 81.9 71.6 11.6 4,990 195.3 3,270 III 86.3 84.2 71.5 14.2 4,980 196.7 3,290 IV 86.4 84.8 68.5 19.3 4,985 198.8 3,245 V 84.7 83.4 65.7 21.8 4,975 194.5 3,275
Explanatory notes: power at wheels - PWHEELS, power loss - PLOSS, maximum engine power - PM, normal engine power - PNORM, engine torque - TM, engine revolutions - nM, revolutions per minute - rpm. Normal engine power is the engine output determined according to the particular technical standard [10]. Recorded maximum engine power PM is modified using a correction factor CF (see equation 1) guaranteeing relation of outcomes to standardized surroundings circumstances.
𝐶𝐶𝐶𝐶𝐹𝐹𝐹𝐹 = 1013𝑝𝑝𝑝𝑝� 𝑇𝑇𝑇𝑇293�12 [-] (1)
where: p atmospheric pressure on a test bench [mbar]; T surroundings air temperature [°K].
Power loss PLOSS is the engine output recorded by a single roller bench once the maximum power at wheels is reached when executing so called slowdown test [24]. While slowdown, suitable gear shift remains engaged and engine power transfer to each wheel is interrupted by pressing the clutch pedal. It represents the total value of mechanical losses and rolling resistance values (power needs to be overcome in order to rotate spur gears in gearbox system and final drive unit as well as spin the wheels on the roller bench).
As can be seen, Table 3 summarizes increasing power loss values depending on a gear shift at the same engine revolutions. After all, this fact results in a less available engine power at the driving wheels periphery.
a) Maximum engine power at the driving wheels periphery depending on a car velocity
Depending on an increased car velocity, maximum engine power at the driving wheels periphery decreases. This kind of power is usable to overcome the driving resistances, i.e. aerodynamic resistance, climb resistance, etc.) [7, 25].
b) Power loss for each gear shift engaged
This power is calculated as a total value of mechanical losses in gearbox system and final drive mechanism along with a force needed to overcome a wheel rolling resistance. Undoubtedly, power loss depends on a car velocity. Testing distinctions in power loss values at each gear shift at certain moment of a car velocity may be attractive testing option. Obviously, depending on increasing gear shift engaged, power loss in gearbox and final drive system decreases [24, 26, 27].
c) Engine power usability to overcome the driving resistances
Based on the dependence of engine power curves at individual gear shift engaged, the engine power value to overcome other aspects of driving resistances may be specified. After determining the value of power to overcome aerodynamic resistance PAIR (see Eq. 2) within entire car velocity range, remaining power values to overcome the driving resistances at each gear shift may be specified [12, 28].
where: p atmospheric pressure on a test bench [mbar];
T surroundings air temperature [°K].
Power loss PLOSS is the engine output recorded by a single roller bench once the maxi-mum power at wheels is reached when executing so called slowdown test [24]. While slowdown, suitable gear shift remains engaged and engine power transfer to each wheel is interrupted by pressing the clutch pedal. It represents the total value of mechanical losses and rolling resistance values (power needs to be overcome in order to rotate spur gears in gearbox system and final drive unit as well as spin the wheels on the roller bench).
As can be seen, Table 3 summarizes increasing power loss values depending on a gear shift at the same engine revolutions. After all, this fact results in a less available engine power at the driving wheels periphery.
a) Maximum engine power at the driving wheels periphery depending on a car velocity
Depending on an increased car velocity, maximum engine power at the driving wheels periphery decreases. This kind of power is usable to overcome the driving resistances, i.e. aerodynamic resistance, climb resistance, etc.) [7, 25].
b) Power loss for each gear shift engaged
This power is calculated as a total value of mechanical losses in gearbox system and fi-nal drive mechanism along with a force needed to overcome a wheel rolling resistance. Undoubtedly, power loss depends on a car velocity. Testing distinctions in power loss val-ues at each gear shift at certain moment of a car velocity may be attractive testing option. Obviously, depending on increasing gear shift engaged, power loss in gearbox and final drive system decreases [24, 26, 27].
c) Engine power usability to overcome the driving resistances
Based on the dependence of engine power curves at individual gear shift engaged, the engine power value to overcome other aspects of driving resistances may be specified. After determining the value of power to overcome aerodynamic resistance PAIR (see Eq. 2) within entire car velocity range, remaining power values to overcome the driving resist-ances at each gear shift may be specified [12, 28].
149The Archives of Automotive Engineering – Archiwum Motoryzacji Vol. 82, No. 4, 2018
The Archives of Automotive Engineering – Archiwum Motoryzacji Vol. 82, No. 4, 2018
𝑃𝑃𝑃𝑃𝐴𝐴𝐴𝐴𝐴𝐴𝐴𝐴𝐴𝐴𝐴𝐴 = 12𝜌𝜌𝜌𝜌𝐴𝐴𝐴𝐴𝐴𝐴𝐴𝐴𝐴𝐴𝐴𝐴𝑐𝑐𝑐𝑐𝑥𝑥𝑥𝑥𝑆𝑆𝑆𝑆𝑣𝑣𝑣𝑣3 [kW] (2)
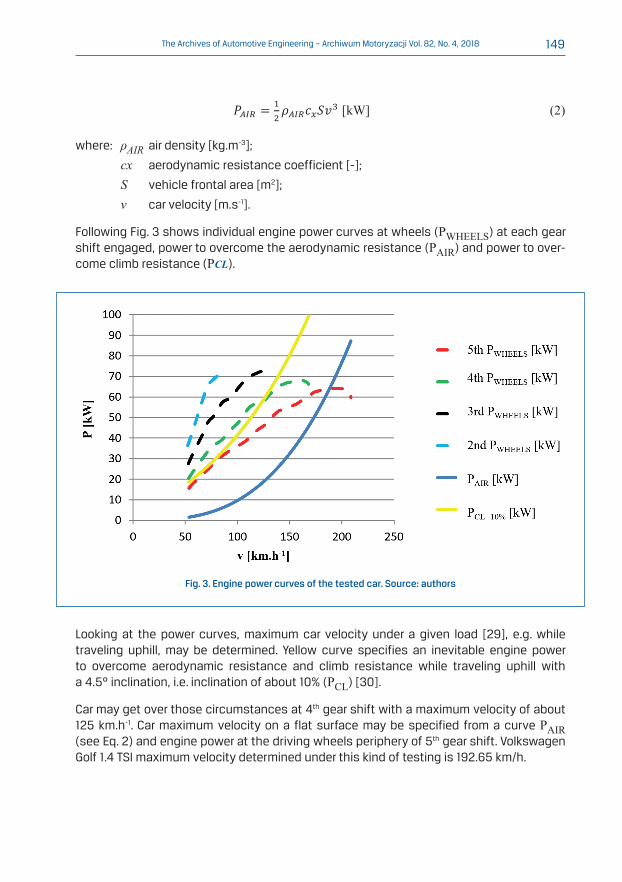
where: 𝜌𝜌𝜌𝜌𝐴𝐴𝐴𝐴𝐴𝐴𝐴𝐴𝐴𝐴𝐴𝐴 air density [kg.m-3]; cx aerodynamic resistance coefficient [-]; S vehicle frontal area [m2]; v car velocity [m.s-1].
Following Fig. 3 shows individual engine power curves at wheels (PWHEELS) at each gear shift engaged, power to overcome the aerodynamic resistance (PAIR) and power to overcome climb resistance (PCL).
Fig. 3. Engine power curves of the tested car. Source: authors
Looking at the power curves, maximum car velocity under a given load [29], e.g. while traveling uphill, may be determined. Yellow curve specifies an inevitable engine power to overcome aerodynamic resistance and climb resistance while traveling uphill with a 4.5° inclination, i.e. inclination of about 10% (PCL) [30].
Car may get over those circumstances at 4th gear shift with a maximum velocity of about 125 km.h-1. Car maximum velocity on a flat surface may be specified from a curve PAIR (see Eq. 2) and engine power at the driving wheels periphery of 5th gear shift. Volkswagen Golf 1.4 TSI maximum velocity determined under this kind of testing is 192.65 km/h.
4. Conclusion By optimizing engine combustion processes and catalysts installation, drivers and cars producers may considerably minimize a production of several greenhouse gases components, however CO2 production cannot be eliminated by establishing any commonly available device. One of suitable and commonly known possibilities to generally minimize CO2 production is to adjust and regulate cars fuel consumption.
The fuel economy of an automobile is the relationship between the distance traveled and the amount of fuel consumed by a car. Consumption can be expressed in terms of volume of fuel to travel a distance, or the distance traveled per unit volume of fuel consumed. Since fuel consumption of cars is a significant factor in air pollution, and since importation of motor fuel can be a large part of a nation's foreign trade, many countries impose requirements for fuel economy. Different methods are used to approximate the actual car engine power. The energy in fuel is required to overcome various losses (see previous chapters) encountered while propelling a car, and in providing power to vehicle systems such as ignition or air conditioning. Various strategies can be employed to reduce losses at each of the conversions between the chemical energy in the fuel and the kinetic energy of a car. Driver behavior can affect fuel economy; maneuvers such as sudden acceleration and heavy braking waste energy.
In regard to car fuel consumption itself, regulation may be provided by various methods, for instance, by engine power efficiency enhancing, minimizing driving resistances, optimizing car routings (pick-up and delivery routes optimization), etc. During a car riding, driving resistances influence car free movement negatively and try to
0
10
20
30
40
50
60
70
80
90
100
0 50 100 150 200 250
P [k
W]
v [km.h-1]
V. Pwheel [kW]
IV. Pwheel [kW]
III. Pwheel [kW]
II. Pwheel [kW]
Paer [kW]
Pelevation11%/5° [kW]
5th PWHEELS [kW]
4th PWHEELS [kW]
3rd PWHEELS [kW]
2nd PWHEELS [kW]
PAIR [kW]
PCL 10% [kW]
where: ρAIR air density [kg.m-3];
cx aerodynamic resistance coefficient [-];
S vehicle frontal area [m2];
v car velocity [m.s-1].
Following Fig. 3 shows individual engine power curves at wheels (PWHEELS) at each gear shift engaged, power to overcome the aerodynamic resistance (PAIR) and power to over-come climb resistance (PCL).
Fig. 3. Engine power curves of the tested car. Source: authors
Looking at the power curves, maximum car velocity under a given load [29], e.g. while traveling uphill, may be determined. Yellow curve specifies an inevitable engine power to overcome aerodynamic resistance and climb resistance while traveling uphill with a 4.5° inclination, i.e. inclination of about 10% (PCL) [30].
Car may get over those circumstances at 4th gear shift with a maximum velocity of about 125 km.h-1. Car maximum velocity on a flat surface may be specified from a curve PAIR (see Eq. 2) and engine power at the driving wheels periphery of 5th gear shift. Volkswagen Golf 1.4 TSI maximum velocity determined under this kind of testing is 192.65 km/h.
150 The Archives of Automotive Engineering – Archiwum Motoryzacji Vol. 82, No. 4, 2018
4. Conclusion
By optimizing engine combustion processes and catalysts installation, drivers and cars producers may considerably minimize a production of several greenhouse gases com-ponents, however CO
2 production cannot be eliminated by establishing any commonly
available device. One of suitable and commonly known possibilities to generally minimize CO
2 production is to adjust and regulate cars fuel consumption.
The fuel economy of an automobile is the relationship between the distance traveled and the amount of fuel consumed by a car. Consumption can be expressed in terms of volume of fuel to travel a distance, or the distance traveled per unit volume of fuel consumed. Since fuel consumption of cars is a significant factor in air pollution, and since importation of motor fuel can be a large part of a nation's foreign trade, many countries impose require-ments for fuel economy. Different methods are used to approximate the actual car engine power. The energy in fuel is required to overcome various losses (see previous chapters) encountered while propelling a car, and in providing power to vehicle systems such as igni-tion or air conditioning. Various strategies can be employed to reduce losses at each of the conversions between the chemical energy in the fuel and the kinetic energy of a car. Driver behavior can affect fuel economy; maneuvers such as sudden acceleration and heavy braking waste energy.
In regard to car fuel consumption itself, regulation may be provided by various methods, for instance, by engine power efficiency enhancing, minimizing driving resistances, optimiz-ing car routings (pick-up and delivery routes optimization), etc. During a car riding, driving resistances influence car free movement negatively and try to interrupt it. As mentioned, car engine needs to consume a certain volume of fuel in order to overcome this resistance. Nevertheless, various types of resistance does not have constant values when different traffic conditions; they vary depending on a driving style of the driver.
References[1] Martin N.P.D., Bishop J.D.K., Boies A.M. Emissions, performance, and design of UK passenger vehicles.
“International Journal of Sustainable Transportation” 11 (2017), p. 230-236. DOI: 10.1080/15568318.2016.1243282.
[2] He D.Q., Liu H., He K.B., Meng F., Jiang Y., Wang M., Zhou J.P., Calthorpe P., Guo J.X., Yao Z.L., Wang, Q.D., Energy use of, and CO2 emissions from China's urban passenger transportation sector - Carbon mitigation scenar-ios upon the transportation mode choices. “Transportation research Part A - Policy and Practice” 53 (2013), p. 53-67. DOI: 10.1016/j.tra.2013.06.004.
[3] Heywood J.B., Welling O.Z. Trends in Performance Characteristics of Modern Automobile SI and Diesel Engines. “SAE International Journal of Engines” 2 (2009), p. 1650-1662.
[4] Birtas A., Boicea N., Draghici F., Chiriac R., Croitoru G., Dinca M., Pavel N. On the assessment of performance and emissions characteristics of a SI engine provided with a laser ignition system. In: “IOP Conference Series: Materials Science and Engineering” 252 (2017). DOI: 10.1088/1757-899X/252/1/012071.
[5] Stradling R., Williams J., Hamje H., Rickeard D. Effect of octane on performance, energy consumption and emissions of two euro 4 passenger cars. “Transportation Research Procedia” 14 (2016), p. 3159-3168. DOI: 10.1016/j.trpro.2016.05.256.
[6] Torrao G., Fontes T., Coelho M., Rouphail N. Integrated indicator to evaluate vehicle performance across: Safety, fuel efficiency and green domains. “Accident Analysis and Prevention” 92 (2016), p. 153-167. DOI: 10.1016/j.aap.2016.03.008.
151The Archives of Automotive Engineering – Archiwum Motoryzacji Vol. 82, No. 4, 2018
[7] Bontoft C.A., Carbone R., Almena M.D.C., Farenback-Brateman J.H., Gueit J., Hovius H., Zemroch P.J. Phase 1: Effect of fuel octane on the performance of two euro 4 gasoline passenger cars. “Concawe Reports” 13 (2016).
[8] Ghilvacs M., Prisecaru T., Pop H., Apostol V., Prisecaru M., Pop E., Alexandru A. Performance analysis of ex-haust heat recovery using organic rankine cycle in a passenger car with a compression ignition engine. In: “IOP Conference Series: Materials Science and Engineering” 147 (2016). DOI: 10.1088/1757-899X/147/1/012147.
[9] MD – Mustang Dynanometer. MD-800 Series. 2018. [online: http://mustangdyne.com/products-and-servic-es/product_info/8974_MD-800-Series/, access: 05/28/2018].
[10] Singh P.K., Ramadhas A.S., Mathai R., Sehgal A.K. Investigation on combustion, performance and emissions of automotive engine fueled with ethanol blended gasoline. “SAE International Journal of Fuels and Lubricants” 9 (2016), p. 215-223. DOI: 10.4271/2016-01-0886.
[11] Jaskiewicz M., Lisiecki J., Lisiecki S., et al. Facility for performance testing of power transmission units. “Scientific Journals of the Maritime University of Szczecin” 42 (2015), p. 14-25.
[12] Ali S.M., Chakraborty A. Thermodynamic modelling and performance study of an engine waste heat driven adsorption cooling for automotive air-conditioning. “Applied Thermal Engineering” 90 (2015), p. 54-63. DOI: 10.1016/j.applthermaleng.2015.06.078.
[13] Sailer S., Buchholz M., Dietmayer K. Adaptive Model-Based Velocity Control by a Robotic Driver for Vehicles on Roller Dynamometers. In: “American Control Conference - ACC 2013” (2013), p. 1356-1361, Washington DC, USA. June17-19, 2013. ISSN 0743-1619.
[14] Cars-Data. All technical specs in one car database. 2009-2016 [online: http://www.cars-data.com/, access: 06/04/2018].
[15] Salim W.S.I.W., Mahdi A.A.M., Ismail M.I., Abas M.A., Martinez-Botas R.F., Rajoo S. Benefits of spark-ignition en-gine fuel-saving technologies under transient part load operations. “Journal of Mechanical Engineering and Sciences” 11 (2017), p. 3027-3037. DOI: 10.15282/jmes.11.4.2017.6.0272.
[16] Dumont O., Diny M., Lemort V. Experimental investigation of the valorization of the waste heat of a gaso-line engine based on a rankine cycle power system. In: “30th International Conference on Efficiency, Cost, Optimization, Simulation and Environmental Impact of Energy Systems - ECOS 2017” (2017).
[17] Eicke S., Zemke S., Trabelsi A., Dagen M., Ortmaier T. Experimental investigation of power hop in passenger cars. “SAE Technical Papers” (2015). DOI: 10.4271/2015-01-2185.
[18] Itabashi S., Murase E., Tanaka H., Yamaguchi M., Muraguchi T. New combustion and powertrain control tech-nologies for fun-to-drive dynamic performance and better fuel economy. “SAE Technical Papers” March (2017). DOI: 10.4271/2017-01-0589.
[19] Fjällman J., Mihaescu M., Fuchs L. Exhaust flow pulsation effect on radial turbine performance. In: “11th European Conference on Turbomachinery Fluid Dynamics and Thermodynamics - ETC 2015” (2015).
[20] Ganesh Ram S., Sriraman A., Design of drive mechanism for high pressure fuel injection system. “ARPN Journal of Engineering and Applied Sciences” 11 (2016), p. 7948-7950.
[21] Rinaldini C.A., Allesina G., Pedrazzi S., Mattarelli E., Savioli T., Morselli N., Tartarini P. Experimental investigation on a common rail diesel engine partially fuelled by syngas. “Energy Conversion and Management” 138 (2017), p. 526-537. DOI: 10.1016/j.enconman.2017.02.034.
[22] Hu B., Turner J.W.G., Akehurst S., Brace C., Copeland C. Observations on and potential trends for mechanically supercharging a downsized passenger car engine: A review. In: “Proceedings of the Institution of Mechanical Engineers, Part D: Journal of Automobile Engineering” 231 (2017), p. 435-456. DOI: 10.1177/0954407016636971.
[23] Inamdar S., Ravisankar M., Panwar A., Sridhar S., Hosur V., Chandru K. Development of 1.2L gasoline turbo-charged MPFI engine for passenger car application. “SAE International Journal of Engines” 10 (2017), p. 1-8. DOI: 10.4271/2017-26-0026.
[24] Blantin J.R., Polanka M.D., Ausserer J.K., Litke P.J., Baranski J.A. Energy Balance and Power Loss Pathway Study of a 120 cc Four-Stroke Internal Combustion Engine. “Journal of Engineering for Gas Turbines and Power - Transactions of the ASME” 140 (2018), Article Number: 072803. DOI: 10.1115/1.4038881.
[25] Lukáč M., Brumerčík F., Krzywonos L., Droździel P. Tension mechanism dynamic analysis. “Communications-Scientific Letters of the University of Žilina” 16, (2014), p. 182-186. ISSN 1335-4205.
[26] Punov P., Evtimov T., Milkov N., Descombes G., Podevin P. Impact of rankine cycle WHR on passenger car engine fuel consumption under various operating conditions. In: “ECOS 2015 - 28th International Conference on Efficiency, Cost, Optimization, Simulation and Environmental Impact of Energy Systems” (2015).

152 The Archives of Automotive Engineering – Archiwum Motoryzacji Vol. 82, No. 4, 2018
[27] Kučera A., Gašparík J., Kučera S., Kučera M. Hybrid passenger automobile and its distribution of power output. “Logi - Scientific Journal on Transport and Logistics” 2 (2011), p. 39-47. ISSN 1804-3216.
[28] Rahman A., Sharif S., Mohiuddin A.K.M., Ismail A.F., Izan, S.I. Intelligent control electromagnetic actuated con-tinuously variable transmission system for passenger car. In: “IOP Conference Series: Materials Science and Engineering” 184 (2017). DOI: 10.1088/1757-899X/184/1/012063.
[29] Niemczuk B., Nieoczym A., Caban J., Marczuk A. Analysis of chemical and energy properties of energy willow in the industrial burning. “Przemysl Chemiczny” 97 (2018), p. 44-48. DOI: 10.15199/62.2018.1.4.
[30] Ravaglioli V., Cavina N., Cerofolini A., Corti E., Moro D., Ponti F. Automotive turbochargers power estimation based on speed fluctuation analysis. In: “Energy Procedia” 82 (2015), p. 103-110. DOI: 10.1016/j.egypro.2015.11.889.