Embed Size (px)
Citation preview

ResearcH JournaL
ww
w.perkinsw
ill.com
2011 / VOL 03.01

Perkins+Will is an interdisciplinary design practice offering services in the areas of Architecture, Interior Design, Branded Environments, Planning + Strategies and Urban Design.
Copyright 2011 Perkins+Will All rights reserved.
Editors: Ajla Aksamija, Ph.D., LEED AP BD+C, CDT and Kalpana Kuttaiah, Associate AIA, LEED AP BD+C
Journal Design & Layout: Kalpana Kuttaiah, Associate AIA, LEED AP BD+C
Acknowledgements: With much APPRECIATION to everyone who contributed in many ways to the research work and articles published in this journal.
We would like to extend our VERY SPECIAL THANKS to: Emily Gartland.
RESEARCH JOURNAL 2011 / VOL 03.01

2011 / VOL 03.01

PERKINS+WILL RESEARCH JOURNAL / VOL 03.01
2
3
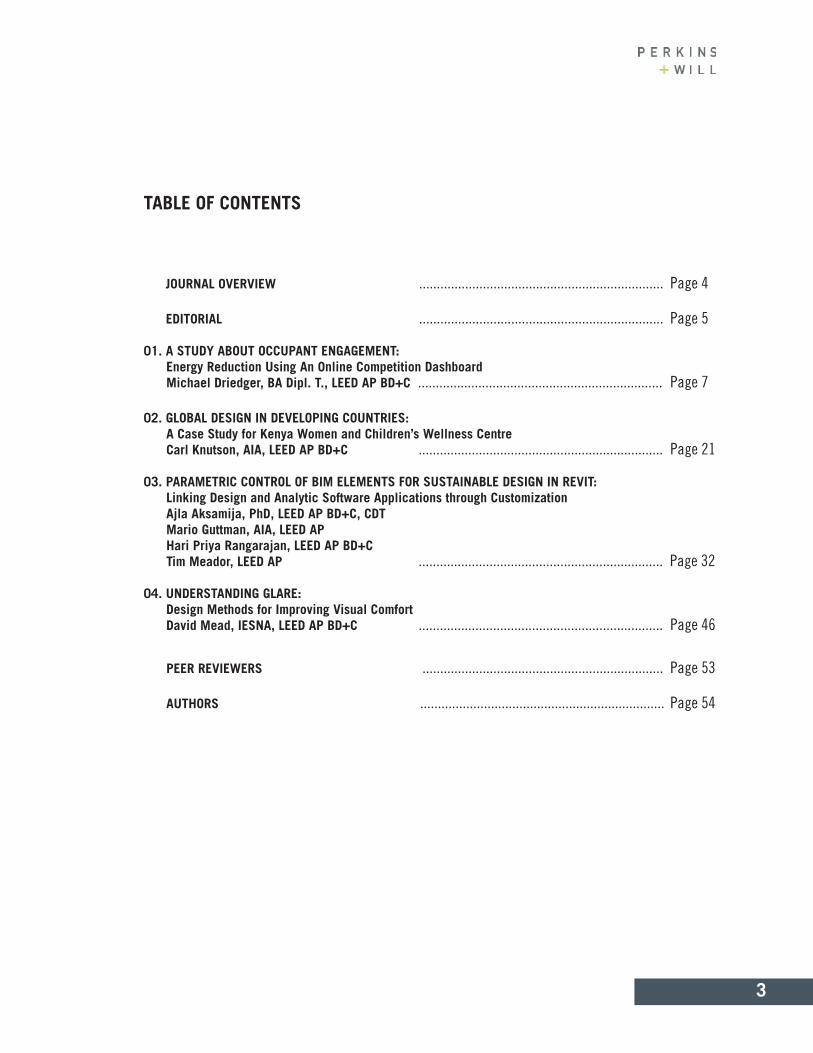
TABLE OF CONTENTS
JOURNAL OVERVIEW ..................................................................... Page 4
EDITORIAL ..................................................................... Page 5
01. A STUDY ABOUT OCCUPANT ENGAGEMENT: Energy Reduction Using An Online Competition Dashboard
Michael Driedger, BA Dipl. T., LEED AP BD+C ..................................................................... Page 7
02. GLOBAL DESIGN IN DEVELOPING COUNTRIES: A Case Study for Kenya Women and Children’s Wellness Centre
Carl Knutson, AIA, LEED AP BD+C ..................................................................... Page 21
03. PARAMETRIC CONTROL OF BIM ELEMENTS FOR SUSTAINABLE DESIGN IN REVIT: Linking Design and Analytic Software Applications through Customization
Ajla Aksamija, PhD, LEED AP BD+C, CDT Mario Guttman, AIA, LEED AP Hari Priya Rangarajan, LEED AP BD+C
Tim Meador, LEED AP ..................................................................... Page 32
04. UNDERSTANDING GLARE: Design Methods for Improving Visual Comfort
David Mead, IESNA, LEED AP BD+C ..................................................................... Page 46
PEER REVIEWERS .................................................................... Page 53 AUTHORS ..................................................................... Page 54

PERKINS+WILL RESEARCH JOURNAL / VOL 03.01
4
The Perkins+Will Research Journal documents research relating to architectural and design practice. Architec-tural design requires immense amounts of information for inspiration, creation, and construction of buildings. Considerations for sustainability, innovation, and high-performance designs lead the way of our practice, where research is an integral part of the process. The themes included in this journal illustrate types of projects and inquiries undertaken at Perkins+Will, and capture research questions, methodologies, and results of these inquiries.
The Perkins+Will Research Journal is a peer-reviewed research journal, dedicated to documenting and present-ing practice-related research associated with buildings and their environs. Original research articles, case studies and guidelines have been incorporated into this publication. The unique aspect of this journal is that it conveys practice-oriented research aimed at supporting our teams.
This is the fifth issue of the Perkins+Will Research Journal. We welcome contributions for future issues.
RESEARCH AT PERKINS+WILLResearch is systematic investigation into existing knowledge in order to discover or revise facts or add to knowledge about a certain topic. In architectural design, we take an existing condition and improve upon it with our design solutions. During the design process we constantly gather and evaluate information from different sources and apply it in novel ways to solve our design problems, thus creating new information and knowledge.
An important part of the research process is documentation and communication. We are sharing combined ef-forts and findings of Perkins+Will researchers and project teams within this journal.
Perkins+Will engages in the following areas of research: • Market-sector related research• Sustainable design• Strategies for operational efficiency• Advanced building technology and performance• Design process benchmarking• Carbon and energy analysis• Organizational behavior.
JOURNAL OVERVIEW
5
This issue of Perkins+Will Research Journal includes four articles that focus on different research topics, such as occupant engagement and behavior relating to energy reduction in office spaces; global design and construction considerations for architectural design in developing countries; customization of BIM software applications for sustainable design and parametric modeling in Revit and guidelines for minimizing glare when harvesting natural daylight.
“A Study of Occupant Engagement: Energy Reduction Using an Online Competition Dashboard” illustrates how occupant behavior in commercial office spaces can influence building energy performance and reduce energy consumption. The article discusses results of a two-week inter-office competition using online energy manage-ment and visualization software where seven Perkins+Will offices were engaged in this activity. The purpose of the competition was to reduce office energy use and to examine how energy use visualizations influence occupants’ behaviors. Actual energy savings depended on the size of the office, number of employees as well as environmental and climatic context.
“Global Design in Developing Countries: A Case Study for Kenya: Women and Children’s Wellness Centre” discusses relationships between architectural design and considerations for environmental and social context as well as local construction techniques. The article discusses design of a healthcare facility located in Nairobi, Kenya as a case study to illustrate how locality influenced design decisions and outcomes.
“Parametric Control of BIM Elements for Sustainable Design in Revit: Linking Design and Analytical Software Applications through Customization” discusses customization of Revit and development of a custom plug-in for this software application that allows data exchange between BIM and analytical applications and parametric control of BIM elements based on the numeric values coming from analytic software. The custom plug-in al-lows for import of any type of data through Excel, but the article discusses specific application for sustainable design. The environmental analytic data, such as incident solar radiation coming from Ecotect is used to para-metrically control dimensions and geometry of shading devices and façade elements.
“Understanding Glare: Design Methods for Improving Visual Comfort” reviews the definitions and methods to measure glare, such as Visual Probability (VCP) and the Unified Glare Rating (UGR) methods. It also reviews best practices for designing spaces that minimize glare when harvesting daylight, such as minimizing direct sunlight on working surfaces, use of active solar control and shading devices, separation of daylight from vi-sion glazing and the use of light-shelves.
Ajla Aksamija, PhD, LEED AP BD+C, CDTKalpana Kuttaiah, Associate AIA, LEED AP BD+C
EDITORIAL

PERKINS+WILL RESEARCH JOURNAL / VOL 03.01
6

7
01.A STUDY OF OCCUPANT ENGAGEMENT: Energy Reduction Using an Online Competition DashboardMichael Driedger, BA Dipl. T., LEED AP BD+C, [email protected]
ABSTRACTIt is well known that occupant behaviour is a factor that affects a building’s energy performance. While a good deal of study and research has been done on residential energy use, less research has focused on the behaviour of commercial office occupants. This paper explores how occupant engagement, coupled with a web-based energy challenge, can help identify opportunities for energy consumption reduction in buildings and lead to changes in building operations.
In a two-week energy competition using energy management software from Pulse™, more than 600 employees in seven offices were engaged in energy-conserving behavior that was aimed at reducing office energy use by ten percent per office. The primary theory tested within the study was whether an energy competition (focused on an electric car race) would be more compelling than simply displaying real-time information to building occupants. There were thousands of visits to the Pulse™ competition webpage, with most visits occurring during the final week of competition. The competition resulted in some office locations achieving daily reductions of energy con-sumption of up to 40 percent. Overall, the competition saved more than two Megawatt hours of electricity. The study revealed that harnessing rivalries using an electric car race resulted in greater than anticipated energy savings. The observations and lessons learned may inform upgrades to existing buildings and also potentially inform energy systems design.
KEYWORDS: occupant engagement, actual energy performance, metering and monitoring, dashboard, commu-nity based social marketing, behaviour change
A Study of Occupant Engagement
1.0 INTRODUCTIONThe buildings architects and engineers design do not always perform as intended. The ASHRAE 90.1-2004 User’s Guide points out that energy modeling is not meant to provide “an accurate prediction of actual energy consumption or costs for the building as it is actually built”, but to provide a baseline for compar-ing design strategies or for the purposes of comparison under a green building rating system1.The rationale for the proposed use of an energy model is largely based on the impossibility of predicting performance given the number of factors that can affect a simulation’s out-come in the real world. One of the most poorly under-stood factors within these simulations are the behavior patterns of the building occupants. In a 2006 study by Lawrence Berkeley Labs and the USGBC, it was found that modeled energy consumption of 21 LEED build-ings deviated significantly from actual performance. The actual energy consumption in one case was more
than 400 percent better than the modeled design and in another was 55 percent worse2. While modeling er-ror or a lack of information about building schedule or use are likely culprits for some of the deviation, there is no doubt that how the occupants or facility managers interacted with the building systems played a role.
The effects of behaviour are so powerful that the con-sumption in identical households – even those designed to be low-energy dwellings – can differ by a factor of two or more depending on the behaviour of the occupants3. Unlike filling a car with gas (a person knows how much he or she pays before they start driving), a building’s energy bill comes after the energy has been consumed. Energy utilities around North America have begun to work with different visualization techniques to encour-age energy reduction, but the gap between energy-consuming behaviour and the energy bill remains. The addition of real-time metering to solve this critical infor-
PERKINS+WILL RESEARCH JOURNAL / VOL 03.01
8
mation gap often yields only a minor effect on energy use, which is a topic covered in greater detail in section 3 of this paper.
While the study and engagement of the residential mar-ket has been substantial for the last four decades, the commercial sector is more poorly understood. Building operators and policy analysts have begun to take ac-tions to engage occupants who do not see financial re-turns on the energy that is saved by their thrifty behav-iour. Behaviour that reduces energy use is a harder sell when the financial benefits are not paid back directly to the occupants. Instead, the nature of competition be-tween individual colleagues or different offices can be a more powerful driver than financial gain. Utilities have also begun to explore this effect within billing data.
As part of a campaign to conserve energy and test how far occupants could be engaged without direct finan-cial reward, Pulse™ worked with Perkins+Will to create and administer an energy savings competition involving seven offices across North America.
A web-based energy visualization tool (here after re-ferred to as a “dashboard”) was developed for employ-ees to track and monitor real-time energy usage. Re-sults of a survey conducted showed a positive response to the competition, but revealed some needed changes to the communication around setting baselines and measuring relative performance.
2.0 EDUCATIONAL EFFECTS ON OCCUPANT BEHAVIOURResearch has been conducted in the field of occu-
pant engagement heavily since the energy crisis of the 1970s. Many government organizations in the United States started using large scale education initiatives to reduce home energy use. To study the effects of educa-tion alone, psychology staff from the University of Vir-ginia looked at the impact that intensive workshops had on residential energy conservation. Participants were exposed to three hours of education in a variety of for-mats. All of the material had been designed to impress upon participants the possibility of reducing home ener-gy use significantly through simple behaviour changes. The participants’ attitudes and beliefs were tested be-fore and after the workshops. While attendees indicated a greater awareness of energy issues and more appre-ciation for the many things that could be done to reduce utility costs and save resources, this awareness by more than 40 workshop participants only translated into the lowering of thermostats on hot water heaters (after three hours worth of information). Two participants did place insulation around their hot water heaters, but they had done so before the workshops even began5.
With the knowledge of how to save energy and the awareness that it will save money, most people will con-tinue to behave in ways that consume large amounts of resources. A significant number of barriers stand in the way of more sustainable behaviour, such as inconve-nience and indifference, which means that information campaigns alone will rarely change behaviour, since they only address one of the many barriers to behaviour change6. The lack of building specific resource reduc-tion associated with typical behaviour becomes even greater when the person occupying the space is not paying the bills. Many employers and designers have, therefore, turned to automated or “smart” building sys-
Office Employees Gross Area Heating/Cooling Heating/Cooling SupplySupply
ASHRAE Climate ASHRAE Climate ZoneZone4
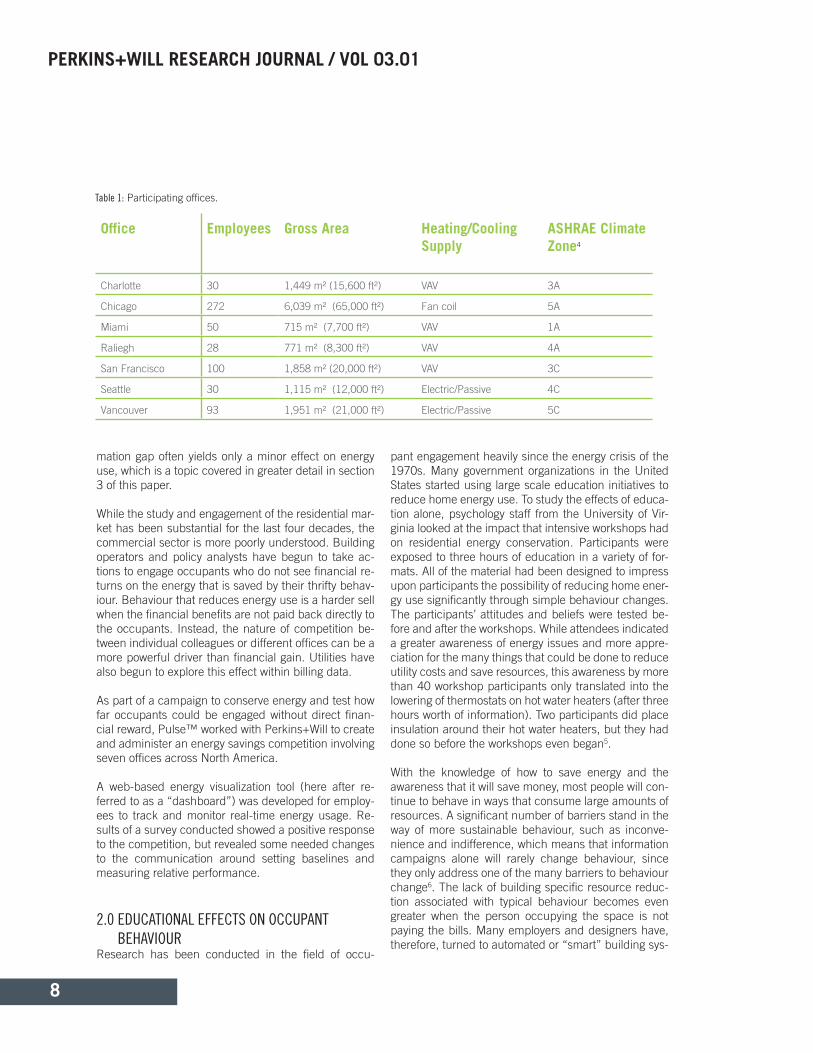
Charlotte 30 1,449 m² (15,600 ft²) VAV 3A
Chicago 272 6,039 m² (65,000 ft²) Fan coil 5A
Miami 50 715 m² (7,700 ft²) VAV 1A
Raliegh 28 771 m² (8,300 ft²) VAV 4A
San Francisco 100 1,858 m² (20,000 ft²) VAV 3C
Seattle 30 1,115 m² (12,000 ft²) Electric/Passive 4C
Vancouver 93 1,951 m² (21,000 ft²) Electric/Passive 5C
Table 1: Participating offices.
9
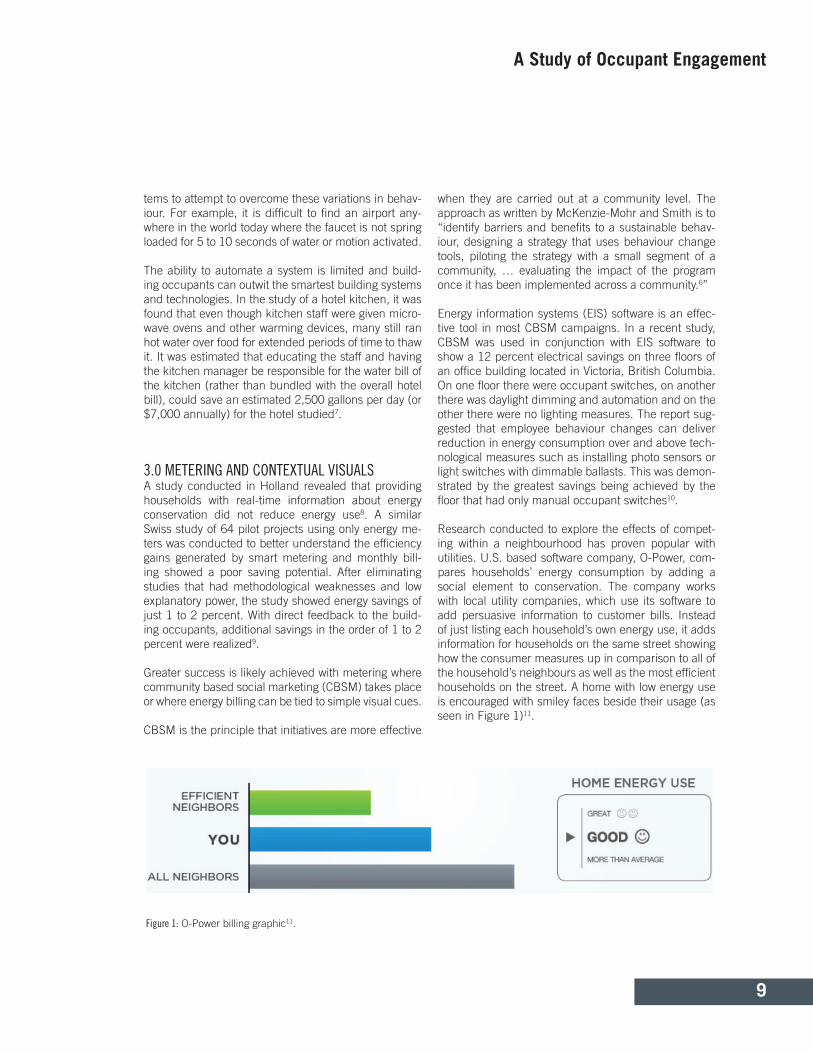
Figure 1: O-Power billing graphic11.
tems to attempt to overcome these variations in behav-iour. For example, it is difficult to find an airport any-where in the world today where the faucet is not spring loaded for 5 to 10 seconds of water or motion activated.
The ability to automate a system is limited and build-ing occupants can outwit the smartest building systems and technologies. In the study of a hotel kitchen, it was found that even though kitchen staff were given micro-wave ovens and other warming devices, many still ran hot water over food for extended periods of time to thaw it. It was estimated that educating the staff and having the kitchen manager be responsible for the water bill of the kitchen (rather than bundled with the overall hotel bill), could save an estimated 2,500 gallons per day (or $7,000 annually) for the hotel studied7.
3.0 METERING AND CONTEXTUAL VISUALSA study conducted in Holland revealed that providing households with real-time information about energy conservation did not reduce energy use8. A similar Swiss study of 64 pilot projects using only energy me-ters was conducted to better understand the efficiency gains generated by smart metering and monthly bill-ing showed a poor saving potential. After eliminating studies that had methodological weaknesses and low explanatory power, the study showed energy savings of just 1 to 2 percent. With direct feedback to the build-ing occupants, additional savings in the order of 1 to 2 percent were realized9.
Greater success is likely achieved with metering where community based social marketing (CBSM) takes place or where energy billing can be tied to simple visual cues.
CBSM is the principle that initiatives are more effective
when they are carried out at a community level. The approach as written by McKenzie-Mohr and Smith is to “identify barriers and benefits to a sustainable behav-iour, designing a strategy that uses behaviour change tools, piloting the strategy with a small segment of a community, … evaluating the impact of the program once it has been implemented across a community.6”
Energy information systems (EIS) software is an effec-tive tool in most CBSM campaigns. In a recent study, CBSM was used in conjunction with EIS software to show a 12 percent electrical savings on three floors of an office building located in Victoria, British Columbia. On one floor there were occupant switches, on another there was daylight dimming and automation and on the other there were no lighting measures. The report sug-gested that employee behaviour changes can deliver reduction in energy consumption over and above tech-nological measures such as installing photo sensors or light switches with dimmable ballasts. This was demon-strated by the greatest savings being achieved by the floor that had only manual occupant switches10. Research conducted to explore the effects of compet-ing within a neighbourhood has proven popular with utilities. U.S. based software company, O-Power, com-pares households’ energy consumption by adding a social element to conservation. The company works with local utility companies, which use its software to add persuasive information to customer bills. Instead of just listing each household’s own energy use, it adds information for households on the same street showing how the consumer measures up in comparison to all of the household’s neighbours as well as the most efficient households on the street. A home with low energy use is encouraged with smiley faces beside their usage (as seen in Figure 1)11.
A Study of Occupant Engagement

PERKINS+WILL RESEARCH JOURNAL / VOL 03.01
10
Figure 3: Campus Conservation Nationals energy reduction (percentage reduction).
Figure 2: Campus Conservation Nationals energy reduction (kWh).
The graph above shows the kWh savings of the top five campuses. The value in brackets ( ) represents the number of residential buildings participating in the competition.
The graph above shows the percentage reduction (another metric to show a winner) of the top five campuses. It is unclear what specific measures were implemented to achieve these savings but the competition website suggests that they were largely behaviour-driven.
TOP 5: Total Energy Reduction (kWh)
TOP 5:Overall Percent Reduction
11
These powerful visuals have begun to be a major ele-ment in behavioural campaigns around energy reduc-tion, as they both contextualize energy consumption and encourage competition.
4.0 COMBINING METERING, VISUALS CUES AND COMPETITIONAnother U.S. based software firm, Lucid Design Group out of California, has created an energy competition dashboard that has proven to be very effective in cam-puses across North America. The Campus Conserva-tion Nationals 2010 engaged more than 40 college and university campus residential houses. Some of the re-sults from this competition can be seen on the page 1012.
While a research paper on this competition has yet to be published, the three week competition hosted on November 1 to November 19, 2010, shows that the power of peer pressure and campus rivalries can work to save more energy than metering and displaying the information alone.
5.0 CHOOSING A COMPELLING COMPETITION VISUALWhile a simple arrow or line is often sufficient to convey when one team is ahead of another, the creation of a more compelling visual was desired for the energy com-petitions used by Perkins+Will. An electric car race was chosen as the competition metric for success. The car race was chosen since it was expected that employees would react more strongly to a race rather than a simple comparison graphic (i.e. bar charts). The more energy an office saved, the more energy (measured in kWh) that propelled the electric car forward. After the metric was chosen, Pulse™ began work on how to best make the visual compelling and accurate. A great deal of work was done by Pulse™ to ensure that the metric could be scaled to an office of any size (as a larger office had the potential to save more energy). Rather than create complex algorithms to address the issue, a simple sys-tem was put in place so that larger offices were given more cars to move forward rather than one (which did not appear in the visual to avoid confusion.) While it was explained via email and through the Pulse™ dashboard that the competition baseline was being set for each office to eliminate any perceived advantages, survey re-sults showed that many employees did not understand this subtlety.
The hope was that a competition based on an electric car race would be more compelling than a simple com-petition based around a quantity of savings. A map was later added by Pulse™ to help further enforce the idea that the energy saved could move a vehicle a set dis-tance. An email was sent to the Vancouver office during the initial competition that read “Help propel our elec-tric car to Seattle so we can drive there, knock on their door and say ‘You lose!’” The close working relationship and rivalry between the Seattle and Vancouver offices would prove to be a significant factor in the amount of energy the two offices saved. The survey results con-firmed that the electric car race was seen by the survey participants as the most compelling piece of the com-petition visualsi.
A live feed comment box that anyone could see online was added to the competition dashboard by Pulse™. The idea behind the live feed was that employees could write about the energy reduction strategy they would be implementing and others could indicate whether they were doing the same action (through a “did this” but-ton). The goal was that this type of social media inter-face would encourage participants to take on the posi-tive behaviours of their peers. While many employees used the tool in this manner, many also used it as a way to goad other offices and further challenge office participants. One exchange gives some insight into the competitive nature of the West Coast offices and the lev-el of hyperbole used within the live feed comment box.
• Seattle: “Seattle turned off all lights in the studio space. We are considering unscrewing the emer-gency lighting if needed.”
• San Francisco: “We have all shut down comput-ers and are all drawing by hand.”
• Vancouver: “We’ve started using beeswax can-dles for both light and heat. We’re considering replacing printers with a Gutenberg printing press.”
In these types of exchanges the “did this” button took on the role of the comment portions of social media sites with each response bringing more energy and creativity to the competition. While it is unclear if the live feed did anything to improve energy performance, it did serve to bring people back to the competition dashboard to see how an office was performing.
A Study of Occupant Engagement
[i] Other competition visuals are discussed further in section 10.
PERKINS+WILL RESEARCH JOURNAL / VOL 03.01
12
6.0 SETTING THE APPROPRIATE COMPETITION BASELINE In the inaugural test to explore how much energy could be saved through behavior and simple operating strate-gies alone, the Vancouver office challenged the Seattle office between September 20 and September 24, 2010. These two locations were the perfect testing ground as both offices:
• Had almost identical Energy Use Intensities (EUI) of around 100-110 kWh/m²/yr (31.7-34.9 BTU/ft²/yr.
• Were in the same general climate (4C).• Were passive heritage buildings with no cooling.• Were 100 percent electrically powered with the
entire office space reflected in the dashboard.
The EIS used a baseline point to create a standard for each location’s energy consumption. The baseline point is a critical benchmark against which the success of future energy and environmental strategies can be mea-sured. It functions as a meaningful line of comparison by predicting what the power values would have been if the savings measures had not been adopted. For the Pulse™ software used, a baseline point is essentially a streamlined typical curve point with a forced end date. The end date means that only readings during the base-line period are being used to build the predictive model. The typical curve represents how a building typically performs under similar conditions. It is based on histori-cal behaviour and correlates with weather conditions, time of day, day of week, month, season and other avail-able variables such as occupancy rate. A typical curve predicts the readings of a point based on a number of variables, some of which are definable and some of which are automatically determined by the system. If a
typical curve point is added to a chart, it will show how the building would normally perform during the time frame selected13.
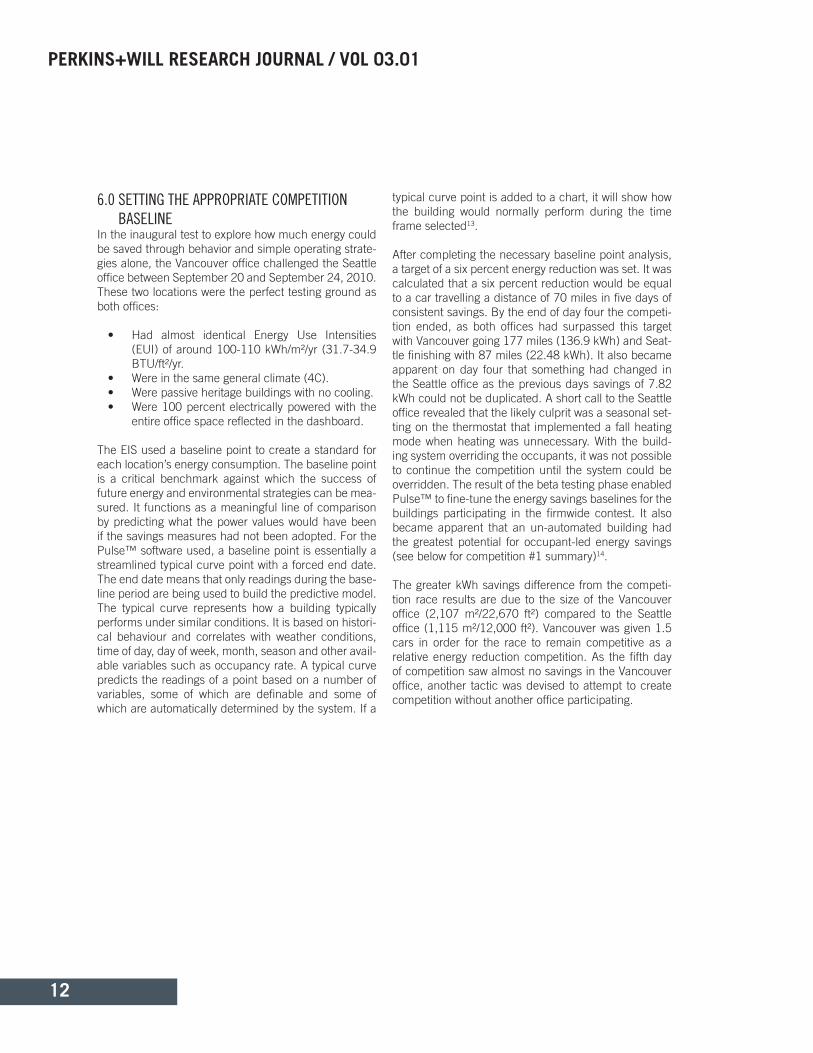
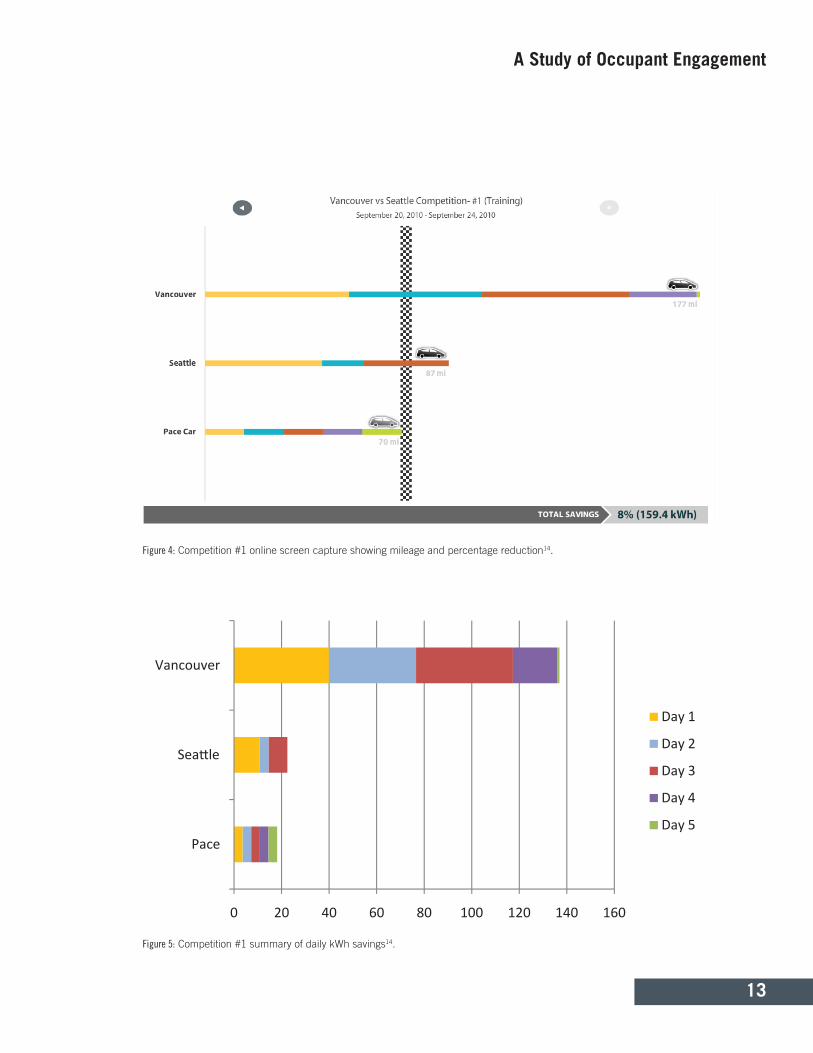
After completing the necessary baseline point analysis, a target of a six percent energy reduction was set. It was calculated that a six percent reduction would be equal to a car travelling a distance of 70 miles in five days of consistent savings. By the end of day four the competi-tion ended, as both offices had surpassed this target with Vancouver going 177 miles (136.9 kWh) and Seat-tle finishing with 87 miles (22.48 kWh). It also became apparent on day four that something had changed in the Seattle office as the previous days savings of 7.82 kWh could not be duplicated. A short call to the Seattle office revealed that the likely culprit was a seasonal set-ting on the thermostat that implemented a fall heating mode when heating was unnecessary. With the build-ing system overriding the occupants, it was not possible to continue the competition until the system could be overridden. The result of the beta testing phase enabled Pulse™ to fine-tune the energy savings baselines for the buildings participating in the firmwide contest. It also became apparent that an un-automated building had the greatest potential for occupant-led energy savings (see below for competition #1 summary)14.
The greater kWh savings difference from the competi-tion race results are due to the size of the Vancouver office (2,107 m²/22,670 ft²) compared to the Seattle office (1,115 m²/12,000 ft²). Vancouver was given 1.5 cars in order for the race to remain competitive as a relative energy reduction competition. As the fifth day of competition saw almost no savings in the Vancouver office, another tactic was devised to attempt to create competition without another office participating.
13
Figure 4: Competition #1 online screen capture showing mileage and percentage reduction14.
Figure 5: Competition #1 summary of daily kWh savings14.
A Study of Occupant Engagement
0 20 40 60 80 100 120 140 160
Pace
Vancouver
Day 1
Day 2
Day 3
Day 4
Day 5

PERKINS+WILL RESEARCH JOURNAL / VOL 03.01
14
Figure 6: Competition #2 online screen capture showing mileage and percentage reduction15.
Figure 7: Competition #2 summary of daily kWh savings15.
0 20 40 60 80 100 120 140 160
Pace
Vancouver
Day 1
Day 2
Day 3
Day 4
15
The following week a “workstation challenge” was undertaken in the Vancouver office. The office would compete against a pace car while two electrical usage monitors (“kill-a-watt”) would be placed on two select-ed workstations. Without telling anyone which worksta-tions were being monitored, the test was to see whether the Vancouver office could save more than the previous week’s 136.9 kWh. Without knowing whether they were competing against their colleagues the entire office managed to save 138.2 kWh in only four days, suggest-ing the energy reduction would have been greater than when the Vancouver office was competing against the Seattle office. The difference after the competition in the two metered workstations was less than 5 percent (even though one desk was near the atrium’s natural light and the other was near the stairwell with limited natural light). The desks were chosen as both employ-ees shared the same working hours and were known to have good conservation habits. This suggests that competition amongst the employees (not knowing if they were chosen) drove the reductions in the absence of a visible competitor (see below for competition #2 summary)15.
Based on the success of the pilot projects, Perkins+Will then took seven offices from across North America to further test the competition on a wider scale.
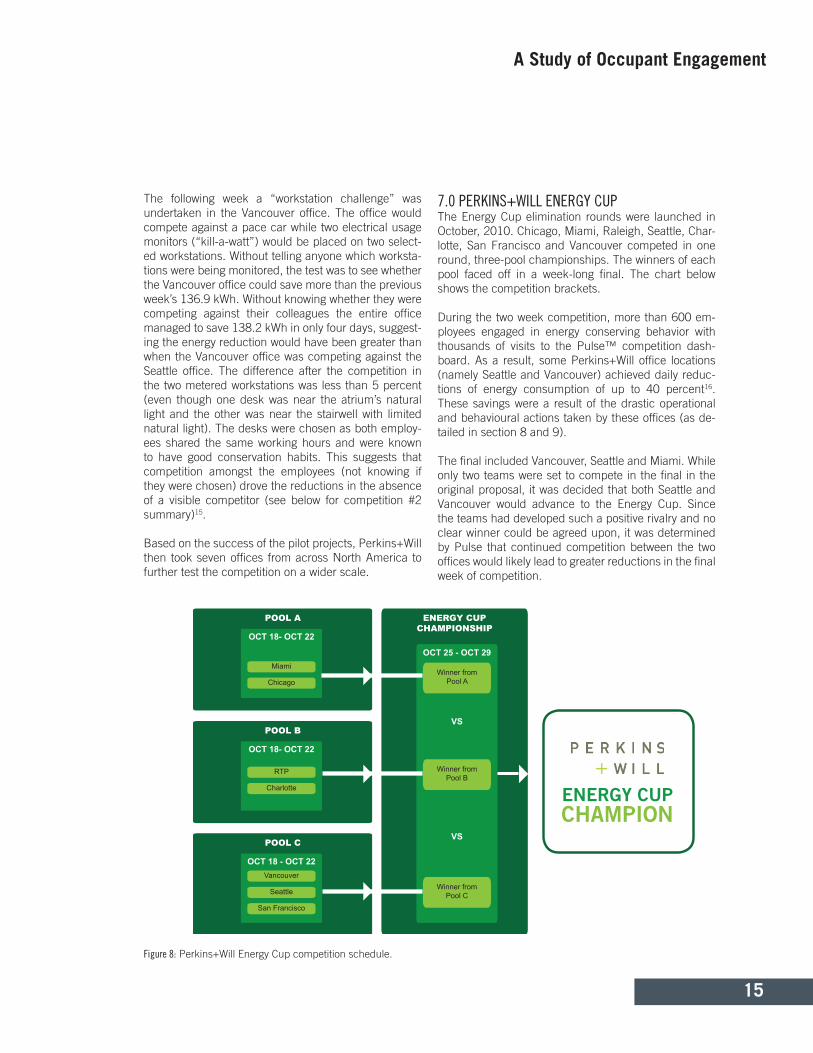
7.0 PERKINS+WILL ENERGY CUP The Energy Cup elimination rounds were launched in October, 2010. Chicago, Miami, Raleigh, Seattle, Char-lotte, San Francisco and Vancouver competed in one round, three-pool championships. The winners of each pool faced off in a week-long final. The chart below shows the competition brackets.
During the two week competition, more than 600 em-ployees engaged in energy conserving behavior with thousands of visits to the Pulse™ competition dash-board. As a result, some Perkins+Will office locations (namely Seattle and Vancouver) achieved daily reduc-tions of energy consumption of up to 40 percent16. These savings were a result of the drastic operational and behavioural actions taken by these offices (as de-tailed in section 8 and 9).
The final included Vancouver, Seattle and Miami. While only two teams were set to compete in the final in the original proposal, it was decided that both Seattle and Vancouver would advance to the Energy Cup. Since the teams had developed such a positive rivalry and no clear winner could be agreed upon, it was determined by Pulse that continued competition between the two offices would likely lead to greater reductions in the final week of competition.
A Study of Occupant Engagement
Figure 8: Perkins+Will Energy Cup competition schedule.
POOL A ENERGY CUP CHAMPIONSHIP
OCT 18- OCT 22
Miami
Chicago
POOL B
OCT 18- OCT 22
RTP
Charlotte
Vancouver
POOL C
OCT 18 - OCT 22
Seattle
San Francisco
OCT 25 - OCT 29
VS
VS
Winner from Pool C
Winner from Pool B
Winner from Pool A
ENERGY CUP CHAMPION

PERKINS+WILL RESEARCH JOURNAL / VOL 03.01
16
Competition summary results from the two weeks in-clude:
• Average energy reduction was 16 percent across the entire competition, with some offices saving over 40 percent on certain days.
• Reducing energy consumption in the offices saved a total of 750 kg (1653 lbs) of greenhouse gas emissions.
• The competition generated great interest in en-ergy reduction within the firm as evidenced by 3000 website visits to the competitions dash-board (the firm has approximately 1500 employ-ees).
The table above shows results during the two-week pe-riod. Offices that only competed for one week show only a single kWh energy reduction value, whereas the four other offices competed in both the preliminary round and the final. Miami’s apparently large energy reduc-tion is a result of a comparison with the only baseline available for the office at the time. The two weeks prior to the competition start saw a malfunction in the office HVAC system with non-stop cooling occurring 24 hours per day and employees bringing in electric baseboard heaters for warmth. As a result the office was able to save a considerable amount of energy from this base-line. It is worth noting that while Miami fixed this issue before the competition, the office also saw the highest persistent savings after the competition with no return to anything resembling the pre-competition baseline (the energy cup was handed from Seattle to Miami on April 26th 2011 for this reason). A clear explanation for the lack of savings in the Chicago office has yet to be properly defined. Energy data from this office shows the space performs in a consistent and predictable man-
ner regardless of the time of year. Anecdotage evidence from emails and conversations with Chicago employ-ees suggests the lack of savings may have resulted in a decrease in interest in the competition after the office came out to a very slow start (and Miami a very quick start) in the first week. This cannot, however, be con-firmed as evidence for a lack of energy reduction dur-ing and after the competition as various other factors could be affecting the Chicago office’s lack of energy reduction. The final week of competition saw an overall savings of more than a Megawatt hour of energy with the two week competition saving more than two Megawatt hours. The combined area of the offices that achieved this level of savings was approximately 3,940 m² (42,400 ft²).
The Energy Cup saw no clear winner with the final deci-sion being made to declare a tie between Vancouver and Seattle. While seen by some as an unpopular deci-sion by the arbiter (Pulse™), no one was prepared for how close the final results would be. A lesson learned for future competitions was to be clearer about the ac-tual end of the competition. An email was sent out con-firming that “at noon PST the winner will be the office who has driven the furthest”. The issue came when it was realized that due to a time delay of 12 minutes be-tween when the information was collected and when it was displayed on the dashboard meant there was some confusion about when the competition was finished. Vancouver was the winner at 12:00 PST (by 1 mile) but Seattle had pulled ahead by 2 mile at 12:12 PST. As a result the Energy Cup was initially shared by these two west coast offices.
Office Energy Reduction GHG reduction Local GHG of UtilityLocal GHG of Utility
Chicago 19.56 kWh 723 g CO2e 37 g CO2e /kWh
Miamii 376.4 + 397.6 = 774 kWh 455,886 g CO2e 589 g CO2e /kWh
Charlotte 105.5 kWh 60,480 g CO2e 576 g CO2e /kWh
RTPi 146 + 38.78 = 185 kWh 106,560 g CO2e 576 g CO2e /kWh
San Francisco 170.5 kWh 43,350 g CO2e 255 g CO2e /kWh
Seattleii 217.9 + 236.5 = 454 kWh 62,652 g CO2e 138 g CO2e /kWh
Vancouveri 249.4 + 363 = 612.4 kWh 22,658 g CO2e 37 g CO2e /kWh
TOTAL 2320.96 kWh 752 kg CO2e
Table 2: Details of Perkins+Will Energy Cup reductions.
[ii] These offices competed in the preliminary round and the final. Week one and week two are therefore shown.

17
8.0 BEHAVIOURS OBSERVED DURING THE ENERGY COMPETITION Notes were taken during the competition and behavior observed through field study in the Vancouver office. The successful behavioral patterns that were persistent after the competition in Vancouver included:
• Switching off boardroom lights and task lights• Use of standby power for laptops and desktops
and turning off monitors when away from desks (estimated to have the most effect on energy re-duction)
• Turning off computers of employees not in for the day (automatic start up for software upgrades happen each morning at 6 am necessitating a shut off of computers without users).
Extreme behavioral patterns during the competition that were not persistent after the competition in Vancouver included:
• Lower than practical lighting levels (task lights and dimmed monitors only)
• No use of heating during a period that would have normally required heating
• No coffee after 10 am (machines turned off).
While observational notes were not taken in other offic-es, emails and phone conversations provided some in-formation about the actions taken. Similar measures to those shown above were described in Seattle and San Francisco. The change to coffee drinking habits came as a live feed post from the Miami office with similar actions as those from the Pacific Northwest described. Phone conversations suggested that after a slow start on day one, the Chicago office had lost morale and office interest in competition had weaned such that very little savings were observed. Stronger interest in the Raleigh Technology Park (RTP) and Charlotte offices translated into solid reductions, but less extreme measures were taken in North Carolina.
9.0 OPERATIONAL CHANGES Some rather drastic operational changes were made in the Vancouver, Seattle and San Francisco offices. These were largely a result of the behavioral actions not being seen as enough to win the competition. The desire to win the competition was stronger than anticipated, but the attention during the competition did lead to some creative operational changes.
Operational changes that are intended to become per-sistent in the Vancouver office include:
• Turning off under-used refrigerators and consoli-dating food and beverages.
• Naturally ventilating the server room when pos-sible (open door also heats the office space).
• Turning down the set point of the water heater (very inefficient heater).
• Removal of lights in areas that do not require them (near atrium and ones that provide decora-tive lighting).
Extreme operational changes made during the competi-tion that are not likely to become persistent in the Van-couver office include:
• Turning off heat recovery ventilators.• Turning off all refrigerators.• Running laptops on batteries.
These operational changes were either implemented or suggested by Vancouver office employees.
Office upgrades recommended to the Vancouver office after the competition included:
• Add light switch to accounting office.• Add a light switch for atrium perimeter lighting.• New more efficient water heater.• Make standby power setting after 20 minutes
automatic on all computers.• Motion sensors in kitchen, exit stairs and new
sensors in boardrooms.• LED upgrade throughout the office (after lighting
is adjusted and wiring upgraded).• Add a separate switch for the hall lighting and
copy areas.• Removal of all halogen lighting to be replaced
with more energy efficient LED replacements.• Set up protocol for naturally ventilating the serv-
ers.• Set up a shut down protocol for un-used com-
puter terminals.• Removal of older fridges and consolidation of
fridge goods to fewer fridges.• Insulating loading dock elevator doors.
The Vancouver office has begun a number of these op-erational upgrades. As tenant fit ups are implemented further measures will be added. Other offices also re-ported changes to their operations as a result of the energy competition. The Charlotte office became aware that their HVAC system was running both day and night. With so many eyes on the competition dashboard, this operational issue was quickly fixed. Building operation-al issues in the Miami office were addressed the week before the competition began.
A Study of Occupant Engagement

PERKINS+WILL RESEARCH JOURNAL / VOL 03.01
18
10.0 EMPLOYEE RESPONSEA survey was conducted by Pulse™ the week follow-ing the competition. Respondents from all five offices participated in the survey with the highest number of re-spondents coming from the Vancouver (20 of 93 for 22 percent) and Chicago (28 of 272 for 10 percent) offices.
The survey revealed that most (75 percent) employ-ees felt their office operated fairly efficiently, but that there was opportunity for improvement. That level of improvement was limited in some offices as the Seattle and Vancouver offices were passive with greater control by the occupants and the Chicago and Charlotte office had the least control over their systems. There was a direct correlation between the amount of energy saved during the competition (Vancouver and Seattle tied for first place) and the ability for an office to control base building systems and lighting (Chicago and Charlotte finished last).
More than half of the employees (63 percent) felt they had control over some aspects in their work area, but that most of the energy use was controlled centrally and thus there was little they could do aside from con-trol their own spaces. This assumption was supported when greater than 90 percent of those surveyed felt they could control their computers and lighting, but little else. When asked about what level of effort they placed into the competition, 15 percent stated they were fanatical about their devotion to energy reduction, 43 percent were highly engaged and 36 percent were moderately engaged. When asked about how they felt about the competition, 85 percent said it was either a good or great experience. This was confirmed when 85 percent said they would be interested in participating in a future energy saving competitions, with some re-spondents suggesting the firm should challenge other consulting firms.
There was a great deal of other positive feedback within the survey about how the competition could be im-proved. A wide variety of opinions were put forward, but some consistent themes did appear such as “Secret competitions! Our offices go to crazy extremes, maybe say one week this month will be part of the contest but we won’t tell you which one!”; “A competition that we would be unaware of until the final results”; and “The competition should be a month or greater in length to really alter behaviour.” What is important about these survey results is not their statistical relevance (as the response rate was so low), but that of the respondents who felt the race results were unfair or confusing, all agreed the competition was useful and that future com-
petitions should be held.
The competition proved to be a success in engaging occupants. The race visual of the car seems to have been the most effective competition tool to encourage employee energy reduction (73 percent) while the of-fice demand curve showing office consumption was second at 44 percent. While the race visual proved to be the strongest element, the survey revealed a great deal of confusion regarding how the competition base-line was set. One respondent stated, “The parameters should be more clearly established before the week of the competition. Change the format to percentage en-ergy saved and not base it on kWh saved as this unfairly gives advantage to larger offices.” This suggests that even though the competition visual showed both a per-centage savings and kWh savings, the participants were not always aware of both metrics. While the information about handicapping of larger offices was emailed to all participants, this information proved to be something that many participants may not have understood. It is likely that future competitions will both prepare em-ployees in advance of the competition on the param-eters and simplify some of the race values. Regardless whether employees understood the metrics of the com-petition, the nature of competing alone seems to have been both popular and effective.
11.0 CONCLUSIONThe primary theory tested within the study was incon-clusive due to the low number of survey respondents and an inability to find a control group during the com-petition period. The competition based on an electric car race did, however, prove to be more compelling than simply making energy information available in real-time for the low number of respondents to the survey. The energy reduction results were much greater than the 10 percent expected before the competition began. Survey respondents agreed that the electric car was the most effective visual and without understanding the vi-sual in all cases, the act of racing proved to be enough to encourage behaviour change within this group.
The contest generated a great deal of enthusiasm for energy conservation among company employees and was well-received overall. Running the energy savings competition yielded significant savings and fostered creative approaches to energy conservation. While some of the reductions have not been persistent, long-term savings are realized by engaging a building’s occu-pants and letting them see the impact of their collective actions. The contest also drove innovative operational

19
adjustments and uncovered opportunities to save ener-gy that would not have been identified otherwise (such as the consolidation of refrigeration and elimination of un-needed refrigerators). Several offices saw persistent savings of up to 17 percent after the competition while others reverted back to their older patterns of use. The Energy Cup will likely be improved upon as it becomes an annual event that will help perpetuate the savings achieved during the inaugural event. Future competi-tions will also allow for better data collection and further analysis of behaviour patterns.
Given the extreme actions taken by some employees during the competition, it seems reasonable to ques-tion whether the employees had a positive reaction to the competition. The follow up survey, however, showed that 85 percent, most of the survey respondents, report-ed having a positive experience with the competition. A majority of those surveyed and questioned outside of the survey felt that future competitions should in fact be longer to better embed energy conservation behavior into day-to-day operations.
Given the success of the competition, the firm plans to add more offices to the energy management dash-board in 2011 and will likely monitor water reduction in future contests. In the years to come, Pulse™ and Perkins+Will will continue to implement studies and build robust tools for greater resource conservation.
AcknowledgmentsThanks to Pulse’s™ Owen Rogers and Daniel Laf-ferty for providing technical data and information. Da-vid Mead and Ryan Bragg of the Vancouver office of Perkins+Will provided valuable insight during review of the findings and analysis of this paper.
REFERENCES[1] ASHRAE, (2004). Standard 90.1-2004: Energy Standard for Buildings Except Low-Rise Residential Buildings, Atlanta, GA: American Society of Heating, Refrigerating, and Air-Conditioning Engineers, Inc.
[2] Diamond,R., Opitz, M., Hicks, T., Vonneida, B. and Herrera, S., (2006). “Evaluating the Site Energy Performance of the First Generation of LEED-Certified Commercial Buildings”, Proceedings of the 2006 Sum-mer Study on Energy Efficiency in Buildings, American Council for an Energy Efficient Economy, Washington DC, August, LBNL-59853.
[3] Mattern, Friedemann, Staake T. and Weiss, M., (2010. “ICT for Green - How Computers Can Help Us to Conserve Energy”, Proceedings of the 1st Interna-tional Conference on Energy Efficient Computing and Networking, Passau, Germany, pp. 1-10.
[4] Crawle, D., Torcellini, P., Long, N., Bonnema, E., Field, K. and Peterson, K., (2010). “Modeling Energy Savings”, ASHRAE Journal’s Guide to Standard 189.1, June, pp. S30-32.
[5] Geller, E. S., (1981). “Evaluating Energy Conserva-tion Programs: Is verbal Report Enough”, Journal of Consumer Research, Vol. 8, pp. 331-335.
[6] McKenzie-Mohr, D. and Smith,W., (1999) Fostering Sustainable Behavior: An Introduction to Community Based Social Marketing, Gabriola Island, BC: New So-ciety Publishers.
[7] O’Neill & Siegelbaum and The RICE Group, (2002). Hotel Water Conservation; A Seattle Demonstration, Report, Retrieved on 2/8/2011from http://www.p2pays.org/ref/37/36217.pdf
[8] Midden, C. J., Meter, J. E., Weening, M. H., and Zieverink, H. J., (1983). “Using Feedback, Reinforce-ment and Information to Reduce Energy Consumption in Households: A Field-Experiment”, Journal of Eco-nomic Psychology, Vol. 3, No. 1, pp. 65-86.
[9] S. Darby, S., (2006). “The Effectiveness of Feed-back on Energy Consumption:. A Review for DEFRA of the Literature on Metering, Billing and Direct Displays”, Report, Retrived on 5/5/2011 from, 2006. http://www.eci.ox.ac.uk/research/energy/downloads/smart-meter-ing-report.pdf
[10] Owen, T., (2011). “Salmon Employee Engagement and Energy Information Software Supporting Carbon Neutrality”, Report, Retrieved on 2/19/2011 from http://eec.ucdavis.edu/ACEEE/2010/data/papers/2148.pdf
[11] Image taken from O-Power, accessed on 2/19/2011 from http://www.opower.com/
[12] Generated from dashboard data, accessed on 2/10/2011 from http://buildingdashboard.net/cincin-nati//
[13] Information courtesy of Pulse™ energy. Informa-tion can be found on the members only site requiring login to mypulsenergy.com.
A Study of Occupant Engagement

20
[14] Pulse™ energy website, accessed on 2/19/2011 from http://my.pulseenergy.com/PerkinsWill/dash-board#/competition/25
[15] Pulse™ energy website, accessed on 2/19/2011 from http://my.pulseenergy.com/PerkinsWill/dash-board#/competition/45
[16] Pulse™ energy website, accessed on 2/19/2011 from http://my.pulseenergy.com/PerkinsWill/dash-board#/competition/104
PERKINS+WILL RESEARCH JOURNAL / VOL 03.01
21
Global Design in Developing Countries
02.GLOBAL DESIGN IN DEVELOPING COUNTRIES: A Case Study for Kenya Women and Children’s Wellness CentreCarl Knutson, AIA, LEED AP, [email protected]
ABSTRACTThis article discusses several key principles for foreign architects doing work overseas in the global workplace. The article uses the Kenya Women and Children’s Wellness Centre as a case study in the development of tech-niques for the appropriate design process in Kenya. Although targeted specifically to Nairobi (Kenya), the in-formation gathered and the processes established work effectively throughout the developing world. The areas of focus include social and cultural considerations, local environmental considerations and local construction practices. Specifically, the article targets techniques in the developing world due to less robust infrastructure and construction methodologies. The article also contends that the process of design in the developing world requires further consideration of local social issues than in the westernized world.
KEYWORDS: Africa, global design, social context, construction methodologies, developing nations
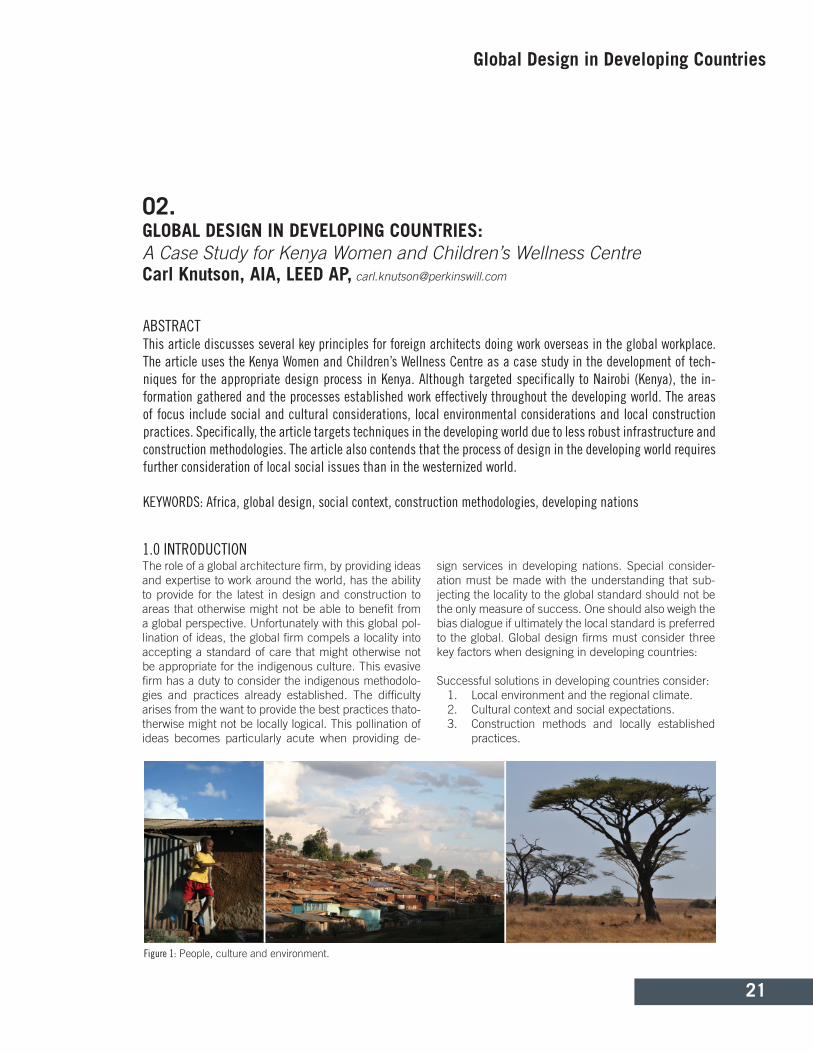
Figure 1: People, culture and environment.
The role of a global architecture firm, by providing ideas and expertise to work around the world, has the ability to provide for the latest in design and construction to areas that otherwise might not be able to benefit from a global perspective. Unfortunately with this global pol-lination of ideas, the global firm compels a locality into accepting a standard of care that might otherwise not be appropriate for the indigenous culture. This evasive firm has a duty to consider the indigenous methodolo-gies and practices already established. The difficulty arises from the want to provide the best practices thato-therwise might not be locally logical. This pollination of ideas becomes particularly acute when providing de-
sign services in developing nations. Special consider-ation must be made with the understanding that sub-jecting the locality to the global standard should not be the only measure of success. One should also weigh the bias dialogue if ultimately the local standard is preferred to the global. Global design firms must consider three key factors when designing in developing countries:
Successful solutions in developing countries consider:1. Local environment and the regional climate.2. Cultural context and social expectations.3. Construction methods and locally established
practices.
1.0 INTRODUCTION

22
Figure 2: Wellness Village location, Nairobi, Kenya.
PERKINS+WILL RESEARCH JOURNAL / VOL 03.01
These three strategies should be considered and im-plemented as part of the design process and tailored specifically to the country in consideration. These strat-egies should then be refined through research, local guidance, experience and expertise. Benchmarking also provideds a means to assess the project perfor-mance relative to other national and international exist-ing healthcare facilities. Facilities are assessed with the understanding that the manner of implementation in the developed world is not necessarily the correct approach in the developing world. For example, if the building energy use intensity in the developed world was imple-mented in buildings in developing world the global en-ergy consumption would be unsustainable. Additionally, what might be considered efficient today in the world’s largest economies might not necessarily appropriate to the developing world.
2.0 PROJECT BACKGROUND AND DESIGN HISTORYThe vision of the Jordan Foundation, based in Chicago, is to provide a 21st century, state-of-the-art wellness vil-lage for the women and children of Kenya. Their work is focused on health, well-being, counseling and educa-tion. By providing this facility to the local community, they will elevate the standard of medical care in Nairobi while providing for the future of Kenyans through edu-cation and training. The Foundation’s mission is global care tailored to local needs. Key to their mission is to
provide a modern healthcare building that is not intimi-dating to the local users and to provide a high level of design using local expertise and to make the building locally appropriate while providing comfort and perfor-mance comparable to a global standard. These factors became the genesis of the Kenyan design mission.
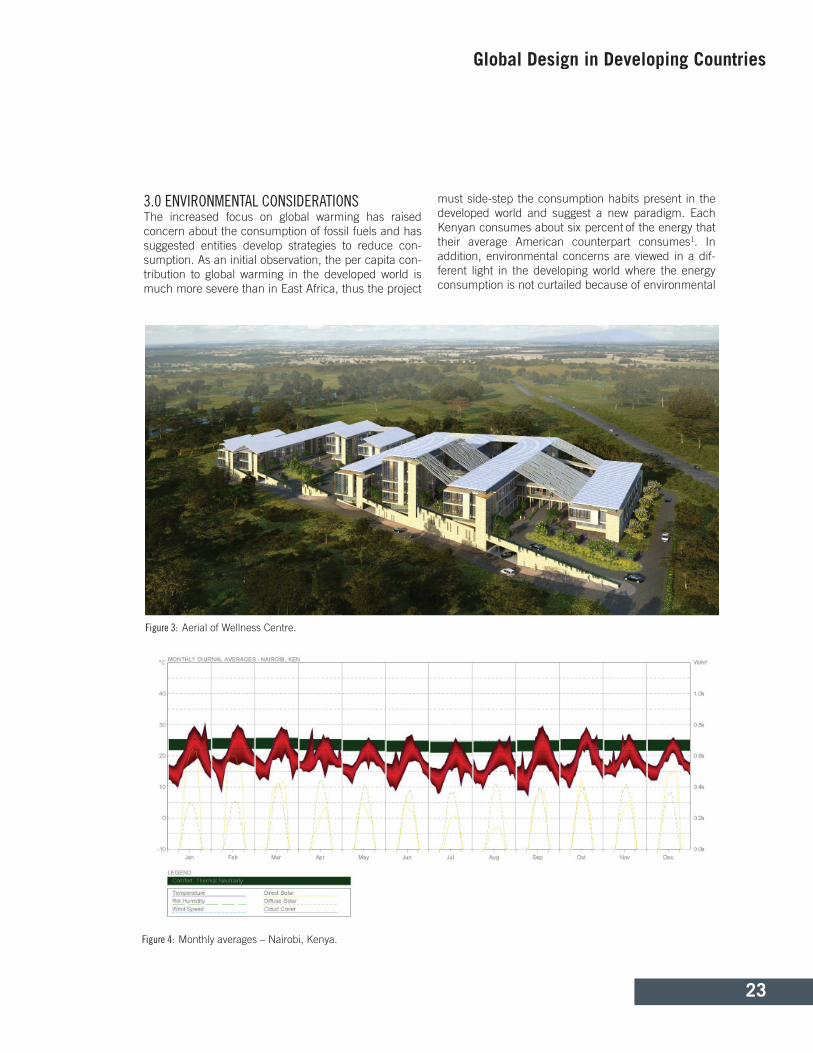
Located on the campus of United States International University (USIU) northeast of downtown Nairobi, the Kenya Women and Children’s Wellness Centre provides services to the surrounding communities, the city of Nairobi and all those underserved throughout the coun-try. Figure 2 indicates the relationship of the village to the USIU campus and its proximity to downtown Nai-robi. The overall project is comprised of several program elements that share a common bond of wellness. The key facility components include a 170-bed inpatient hospital, outpatient clinics for women and children, an institute of learning, Gender Violence Recovery Center (GVRC), family hostel and a forensics laboratory joined together in a campus setting as shown in Figure 3. The facilities are organized on-site by privacy, adjacency and accessibility overlooking the rolling plateau of east Africa. The project is designed to support national re-search by creating an effective science and technology institution capable of developing and adapting to world class technologies. The variety of complimentary well-ness facilities provides a holistic approach to well-being that bridges local, traditional and global medical care.
23
Figure 3: Aerial of Wellness Centre.
3.0 ENVIRONMENTAL CONSIDERATIONSThe increased focus on global warming has raised concern about the consumption of fossil fuels and has suggested entities develop strategies to reduce con-sumption. As an initial observation, the per capita con-tribution to global warming in the developed world is much more severe than in East Africa, thus the project
must side-step the consumption habits present in the developed world and suggest a new paradigm. Each Kenyan consumes about six percent of the energy that their average American counterpart consumes1. In addition, environmental concerns are viewed in a dif-ferent light in the developing world where the energy consumption is not curtailed because of environmental
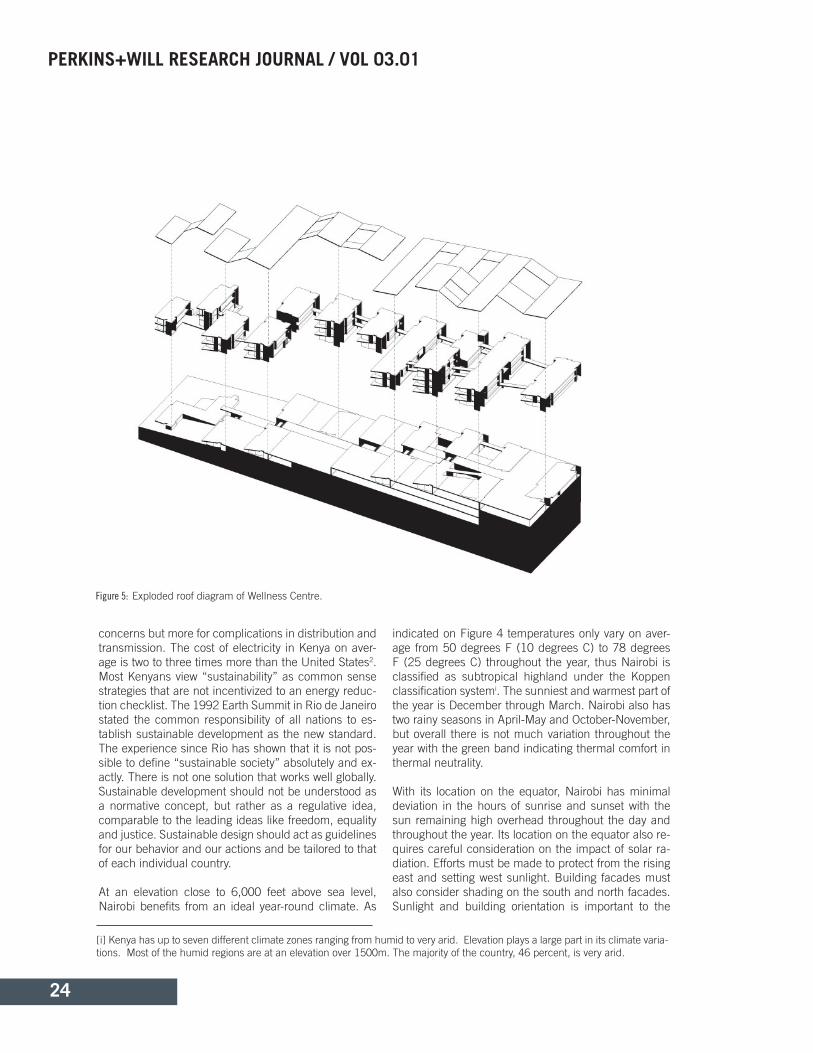
Figure 4: Monthly averages – Nairobi, Kenya.
Global Design in Developing Countries
24
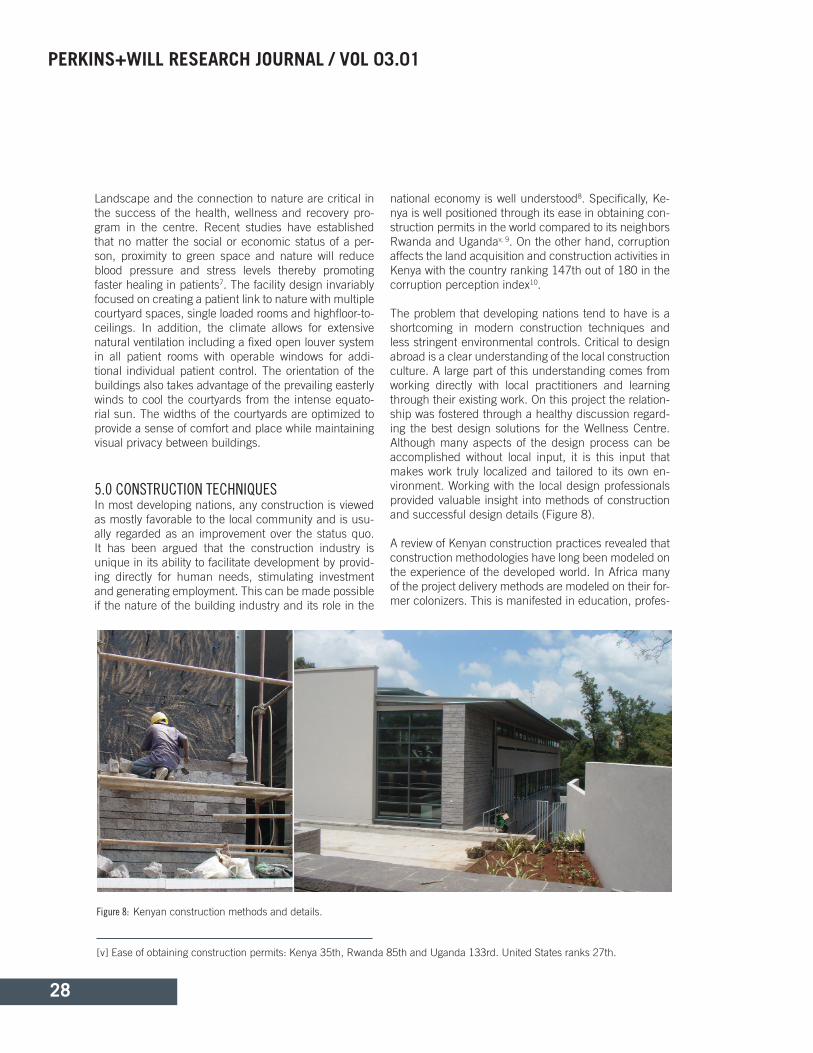
Figure 5: Exploded roof diagram of Wellness Centre.
PERKINS+WILL RESEARCH JOURNAL / VOL 03.01
concerns but more for complications in distribution and transmission. The cost of electricity in Kenya on aver-age is two to three times more than the United States2. Most Kenyans view “sustainability” as common sense strategies that are not incentivized to an energy reduc-tion checklist. The 1992 Earth Summit in Rio de Janeiro stated the common responsibility of all nations to es-tablish sustainable development as the new standard. The experience since Rio has shown that it is not pos-sible to define “sustainable society” absolutely and ex-actly. There is not one solution that works well globally. Sustainable development should not be understood as a normative concept, but rather as a regulative idea, comparable to the leading ideas like freedom, equality and justice. Sustainable design should act as guidelines for our behavior and our actions and be tailored to that of each individual country.
At an elevation close to 6,000 feet above sea level, Nairobi benefits from an ideal year-round climate. As
indicated on Figure 4 temperatures only vary on aver-age from 50 degrees F (10 degrees C) to 78 degrees F (25 degrees C) throughout the year, thus Nairobi is classified as subtropical highland under the Koppen classification systemi. The sunniest and warmest part of the year is December through March. Nairobi also has two rainy seasons in April-May and October-November, but overall there is not much variation throughout the year with the green band indicating thermal comfort in thermal neutrality.
With its location on the equator, Nairobi has minimal deviation in the hours of sunrise and sunset with the sun remaining high overhead throughout the day and throughout the year. Its location on the equator also re-quires careful consideration on the impact of solar ra-diation. Efforts must be made to protect from the rising east and setting west sunlight. Building facades must also consider shading on the south and north facades. Sunlight and building orientation is important to the
[i] Kenya has up to seven different climate zones ranging from humid to very arid. Elevation plays a large part in its climate varia-tions. Most of the humid regions are at an elevation over 1500m. The majority of the country, 46 percent, is very arid.

25
Figure 6: Stereographic sun path diagram.
health of the building occupants while understanding the need to provide for protection from too much sun-light or glare.
There are several cities that benefit from the same cli-mate conditions as Nairobi including the nearby cities of Kigali, Rwanda and Bujumbura, Burundi. The cli-mate immediately suggests that the types and complex-ity of mechanical systems present in the more extreme climates of the northern and southern hemisphere need not be present in high plateaus of East Africa. This alleviates and simplifies many of the enclosure systems used in Nairobi, often eliminating walls, insulation, win-dows and doors where not necessary for privacy, acous-tics or security. The local climate culture also allows for more variation of the “inside” temperature than highly mechanized westernized standards. Kenyans will com-monly work in warmer or cooler spaces than their coun-terparts in developed nations. The simplified enclosure systems and mechanical requirements provide for a reduction in building areas that would typically be re-served for mechanical ventilation in North American and European projects. The Nairobi building model also prefers a higher quantity of externalized spaces, single loaded corridors and smaller floor plates that take advantage of daylight.
Another strong influence on the environmental design
of the facility was optimizing the sun utilization to the design of the wellness facility. The effective solar yearly radiation in Nairobi is approximately 1900 kWh/m2 with the highest intensity January through Marchii. These levels are comparable to the southwestern United States and provide ample opportunities for solar power, solar hot water and daylighting, but also require thoughtful design strategies to reduce solar gain through over-hangs and external shading devices.
As part of the environmental research of the building, the Perkins+Will Tech Lab determined the optimal ori-entation, potential kWh production and payback period of the installation of a solar photovoltaic system3. The report determined that the high solar radiation and con-stant levels throughout the year provided an ideal sce-nario for the investment in solar power and domestic hot water. In addition, the high cost and unreliable source of electrical power from the government-owned KPLC further resulted in the provision of multiple alternative sources of power for the functionality of the healthcare facility. The renewable energy recommended for the building influenced the roof design, as shown on Figure 5, which is optimized to its location one degree south of the equator.
For all the renewable energy benefits that the sun pro-vides, steps also have to be considered in the design
Global Design in Developing Countries
[ii] Nairobi has 1900 kWh/m2 of annual solar radiation compared to Phoenix, AZ with 2100 kWh/m2 and Seattle with 1200 kWh/m2.

PERKINS+WILL RESEARCH JOURNAL / VOL 03.01
to reduce or eliminate solar gain without compromising the ability to daylight the patient rooms, classrooms and counseling spaces. This was achieved with two com-plimentary design strategies. Constant throughout the entire building perimeter, a two meter overhang pro-vides a fixed level of control from the sunlight. In addi-tion, the overhangs support a louvered screen system that further diffuses the sunlight that is optimized to its particular orientation. The long north and south facades are substantially protected from direct solar radiation while the short east and west facades have porches to help buffer the interior spaces against the low sunlight angles. Of particular design influence is the stereo-graphic solar diagram, shown in figure 6, that illustrates the high overhead sun position throughout the year with sunlight hitting the building from all directions because of Nairobi’s equatorial location.
Environmentally, the width of the building was an im-portant design consideration. Fixed at 14 meters wide including the overhangs, the width plays an important role in daylighting and the collection of rainwater. The building width was determined by two factors, the abil-ity to daylight to protect against intermittent power sup-plies and the optimal width that would provide for a single-loaded condition, a double-loaded condition and a double-loaded condition with a centralized storage. The single loaded condition is used for classrooms-corridor and patient ward-corridor. The double loaded condition is the typical patient room-corridor-support or office-corridor-office. The third condition combines the double-loaded condition with an additional layer of support or storage that does not require daylight. This condition was implemented in the outpatient and GVRC conditions. A result of the building width, the 14 meter shed roof provides an ideal scenario to collect rainwa-ter. The Wellness Centre will use rainwater to supple-ment to landscape irrigation and gray-water fixtures.
The environmental considerations implemented in the Wellness Centre were optimized to the conditions using local data, customs and constraints along with bench-marking against other healthcare facilities, global trends and past project experience. Typical African architects, developers, builders and owners often overlook the site as one of the significant elements of sustainable de-velopment and construction and thus special consid-eration was given on the preservation and reintroduc-tion of the environment and landscape into the building design4.
4.0 SOCIAL CONSIDERATIONSForeign architects must also take into consideration the unique customs and social mores when suggesting the needs of the local occupants versus global standards. In the case of Kenya, citizens are generally group-orien-tated rather than individualistic. “Harambee,” defines the Kenyan approach to others they meet in lifeiii. The concept is about mutual assistance, mutual effort, mu-tual responsibility and community self-reliance5. Using this social standard as guidance provided the appropri-ate balance between global healthcare standards and local customs in healthcare delivery. To that end, re-finements were made to the design and the process to customize the hospital typology to be uniquely Kenyan.
Some of the early considerations discussed in the plan-ning and development of the Wellness Centre were the access to the site and the building’s position on the site. The long rectangular ten acre site is located at a remote corner of the USIU campus, that until recently, was not completely accessible. In tandem with the design of the centre, the Kenyan government is constructing the new 31 km northern bypass road that connects the city of Nairobi from east to west. This new roadway sits along the south edge of the site, making accessibility to the site relatively easy. With the ease of access, the team had concerns about traffic and safety due to the local commuting customs. The transit system, heav-ily influenced by matatu’s or mini-buses, makes for a necessary “evil” in providing cheap public transit within a largely unregulated system. The decision to restrict mini-bus access to the site by providing a distinct off-site bus stop alleviates many safety, security and noise concerns of not regulating access. Another important social consideration is the needs of the walking public. Most Kenyans will walk distances unheard of in the rest of the world. It would not be unreasonable to expect that people would walk 12 km from downtown Nairobi to the site. Considerations were made in providing the infrastructure necessary to access the site by a large number of walking public along with supporting a sys-tem of specialized buses dedicated to serving the local community.
The building’s integration into the site was also care-fully considered to satisfy political concerns of all stake-holders. Although the project is headed by the Jordan Foundation, they have made it a priority throughout the design process to include several other groups in the
26
[iii] Coming from the Bantu word meaning “to pull together”.

27
decision process while reinforcing their inspired vision for the facility. These stakeholders include USIU, the Kenyan government and the United States government. As part of this stakeholder involvement there were vari-ous discussions in regards to the visual impact of the facility and visibility of the project within the commu-nity. One discussion involved the need for a “glass and steel” building that “reflected” the notion of world-class healthcare in a modern facility. Furthermore, to supple-ment the notion of a world-class building it should be very visible and make a statement in this formerly roll-ing farmland. In review of the target audience, the team ultimately suggested a much less grandiose design approach that minimized the visual cacophony of the building and integrated it well into its surroundings. This approach was pursued for two reasons: visibility and perception. Because most of the visitors to the Wellness Centre will be from the villages surrounding Nairobi, the building needed to relate to its surroundings. An unap-proachable, reflective glass building was not the image the centre wanted to promote. Secondly, minimizing the visual size of the building on the site was impor-tant to help focus on the delivery of healthcare and not the extravagance visible in the modern US healthcare systems. The practicality was achieved by burying large portions of the diagnostic facilities and daylighting with courtyards and light wells as shown in pink in figure 7.
Another aspect of the site organization that was purely culturally driven was the placement of the different pro-gram elements on the site. The facility is specifically de-signed for women and children as a direct response to the gender discrimination that exists in Kenya. Although better than the northern African countries, Kenya ranks 96 out of 134 countries in gender equality. In sub-Saha-
ran Africa, countries like Lesotho and South Africa have been able to bridge the gender gap by focusing on edu-cation and health equalityiv. In the Health and Survival Equality Index, Kenya performs poorly against neigh-boring counties Uganda and Madagascar6. To help bridge this gap the Wellness Centre is focused on an in-tegrated approach of health, education, counseling and family support. One of the primary goals of the James R. Jordan Foundation International is to “encourage and engage communities, providing the resources, support and motivation to ultimately help themselves.”
To help reduce prevalence of gender discrimination in Kenya, an essential component in the Wellness Center is the Gender Violence Recovery Center. Placement and vision of this counseling and group therapy program on site was critical to its success. To make abused women feel protected from their abusers, the GVRC was delib-erately sited away from the main entry and secluded from the main entry. Also special provisions were made to make private patent entries and courtyards designed for group therapy away from other campus activities. Particular care was made to keep the GVRC away from the forensics lab because of potential inference that abusers might conjure because of their proximity. Talk-ing to a counselor should not imply that evidence is being collected against an abuser. Figure 7 indicates the organization of the major program elements on the site accounting for cultural and privacy concerns. The placement of the family village, day care and Institutes of Learning adjacent to the GVRC was designed to aug-ment the success of the centre by providing women and families the means to improve their personal situation through empowerment.
Figure 7: Program organization on the site.
Global Design in Developing Countries
[iv] Gender equality rank of Lesotho (8th) and South Africa (12th) Kenya ranks 15 out of 25 in sub-Saharan Africa.
28
PERKINS+WILL RESEARCH JOURNAL / VOL 03.01
Landscape and the connection to nature are critical in the success of the health, wellness and recovery pro-gram in the centre. Recent studies have established that no matter the social or economic status of a per-son, proximity to green space and nature will reduce blood pressure and stress levels thereby promoting faster healing in patients7. The facility design invariably focused on creating a patient link to nature with multiple courtyard spaces, single loaded rooms and highfloor-to- ceilings. In addition, the climate allows for extensive natural ventilation including a fixed open louver system in all patient rooms with operable windows for addi-tional individual patient control. The orientation of the buildings also takes advantage of the prevailing easterly winds to cool the courtyards from the intense equato-rial sun. The widths of the courtyards are optimized to provide a sense of comfort and place while maintaining visual privacy between buildings.
5.0 CONSTRUCTION TECHNIQUESIn most developing nations, any construction is viewed as mostly favorable to the local community and is usu-ally regarded as an improvement over the status quo. It has been argued that the construction industry is unique in its ability to facilitate development by provid-ing directly for human needs, stimulating investment and generating employment. This can be made possible if the nature of the building industry and its role in the
national economy is well understood8. Specifically, Ke-nya is well positioned through its ease in obtaining con-struction permits in the world compared to its neighbors Rwanda and Ugandav, 9. On the other hand, corruption affects the land acquisition and construction activities in Kenya with the country ranking 147th out of 180 in the corruption perception index10.
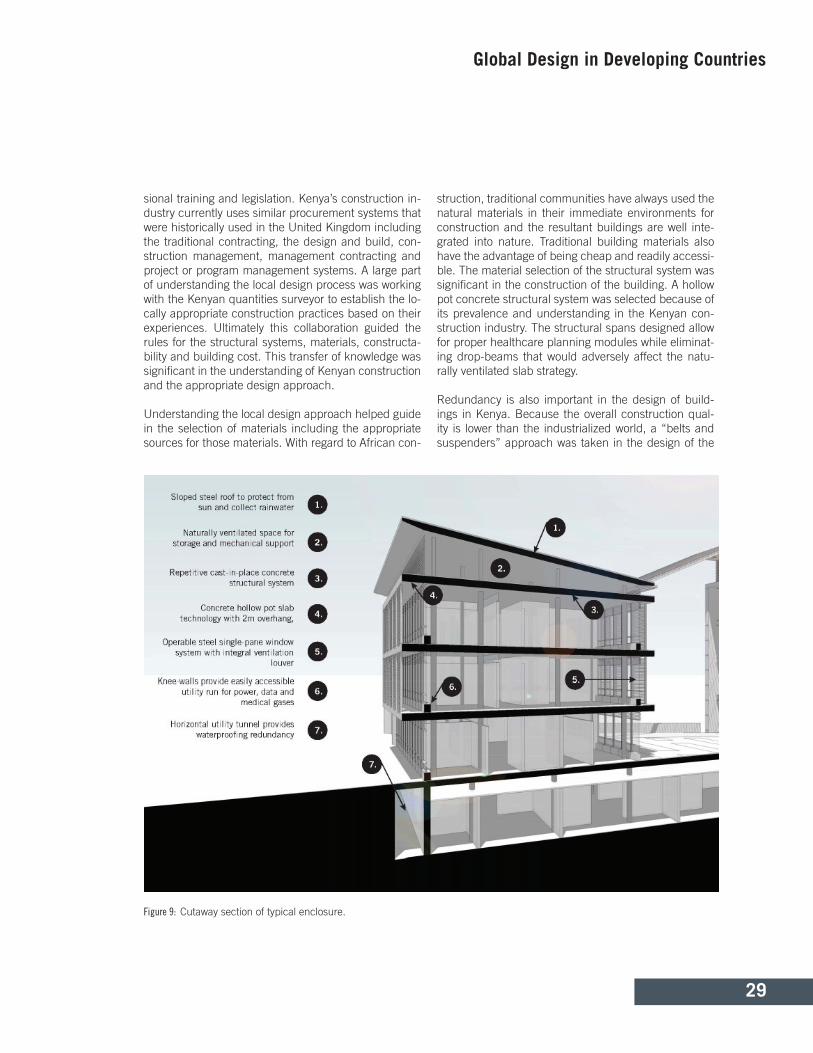
The problem that developing nations tend to have is a shortcoming in modern construction techniques and less stringent environmental controls. Critical to design abroad is a clear understanding of the local construction culture. A large part of this understanding comes from working directly with local practitioners and learning through their existing work. On this project the relation-ship was fostered through a healthy discussion regard-ing the best design solutions for the Wellness Centre. Although many aspects of the design process can be accomplished without local input, it is this input that makes work truly localized and tailored to its own en-vironment. Working with the local design professionals provided valuable insight into methods of construction and successful design details (Figure 8).
A review of Kenyan construction practices revealed that construction methodologies have long been modeled on the experience of the developed world. In Africa many of the project delivery methods are modeled on their for-mer colonizers. This is manifested in education, profes-
Figure 8: Kenyan construction methods and details.
[v] Ease of obtaining construction permits: Kenya 35th, Rwanda 85th and Uganda 133rd. United States ranks 27th.
29
sional training and legislation. Kenya’s construction in-dustry currently uses similar procurement systems that were historically used in the United Kingdom including the traditional contracting, the design and build, con-struction management, management contracting and project or program management systems. A large part of understanding the local design process was working with the Kenyan quantities surveyor to establish the lo-cally appropriate construction practices based on their experiences. Ultimately this collaboration guided the rules for the structural systems, materials, constructa-bility and building cost. This transfer of knowledge was significant in the understanding of Kenyan construction and the appropriate design approach.
Understanding the local design approach helped guide in the selection of materials including the appropriate sources for those materials. With regard to African con-
struction, traditional communities have always used the natural materials in their immediate environments for construction and the resultant buildings are well inte-grated into nature. Traditional building materials also have the advantage of being cheap and readily accessi-ble. The material selection of the structural system was significant in the construction of the building. A hollow pot concrete structural system was selected because of its prevalence and understanding in the Kenyan con-struction industry. The structural spans designed allow for proper healthcare planning modules while eliminat-ing drop-beams that would adversely affect the natu-rally ventilated slab strategy.
Redundancy is also important in the design of build-ings in Kenya. Because the overall construction qual-ity is lower than the industrialized world, a “belts and suspenders” approach was taken in the design of the
Figure 9: Cutaway section of typical enclosure.
Global Design in Developing Countries
30
PERKINS+WILL RESEARCH JOURNAL / VOL 03.01
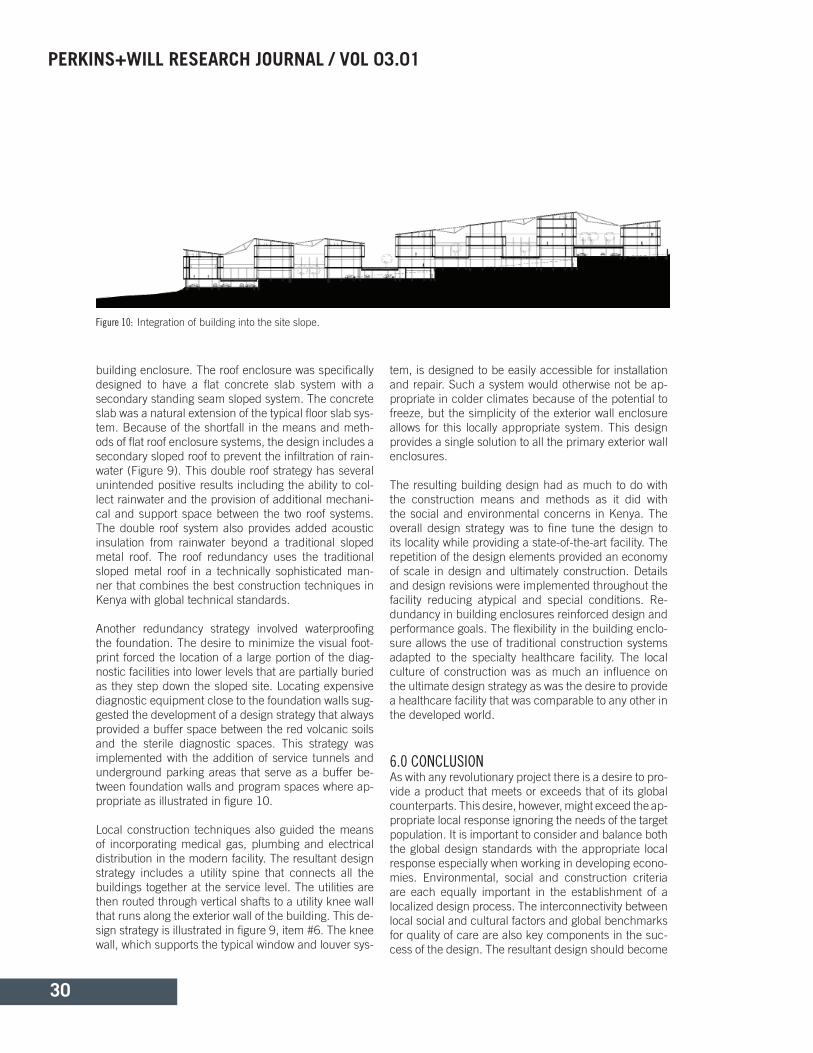
building enclosure. The roof enclosure was specifically designed to have a flat concrete slab system with a secondary standing seam sloped system. The concrete slab was a natural extension of the typical floor slab sys-tem. Because of the shortfall in the means and meth-ods of flat roof enclosure systems, the design includes a secondary sloped roof to prevent the infiltration of rain-water (Figure 9). This double roof strategy has several unintended positive results including the ability to col-lect rainwater and the provision of additional mechani-cal and support space between the two roof systems. The double roof system also provides added acoustic insulation from rainwater beyond a traditional sloped metal roof. The roof redundancy uses the traditional sloped metal roof in a technically sophisticated man-ner that combines the best construction techniques in Kenya with global technical standards.
Another redundancy strategy involved waterproofing the foundation. The desire to minimize the visual foot-print forced the location of a large portion of the diag-nostic facilities into lower levels that are partially buried as they step down the sloped site. Locating expensive diagnostic equipment close to the foundation walls sug-gested the development of a design strategy that always provided a buffer space between the red volcanic soils and the sterile diagnostic spaces. This strategy was implemented with the addition of service tunnels and underground parking areas that serve as a buffer be-tween foundation walls and program spaces where ap-propriate as illustrated in figure 10.
Local construction techniques also guided the means of incorporating medical gas, plumbing and electrical distribution in the modern facility. The resultant design strategy includes a utility spine that connects all the buildings together at the service level. The utilities are then routed through vertical shafts to a utility knee wall that runs along the exterior wall of the building. This de-sign strategy is illustrated in figure 9, item #6. The knee wall, which supports the typical window and louver sys-
tem, is designed to be easily accessible for installation and repair. Such a system would otherwise not be ap-propriate in colder climates because of the potential to freeze, but the simplicity of the exterior wall enclosure allows for this locally appropriate system. This design provides a single solution to all the primary exterior wall enclosures.
The resulting building design had as much to do with the construction means and methods as it did with the social and environmental concerns in Kenya. The overall design strategy was to fine tune the design to its locality while providing a state-of-the-art facility. The repetition of the design elements provided an economy of scale in design and ultimately construction. Details and design revisions were implemented throughout the facility reducing atypical and special conditions. Re-dundancy in building enclosures reinforced design and performance goals. The flexibility in the building enclo-sure allows the use of traditional construction systems adapted to the specialty healthcare facility. The local culture of construction was as much an influence on the ultimate design strategy as was the desire to provide a healthcare facility that was comparable to any other in the developed world.
6.0 CONCLUSIONAs with any revolutionary project there is a desire to pro-vide a product that meets or exceeds that of its global counterparts. This desire, however, might exceed the ap-propriate local response ignoring the needs of the target population. It is important to consider and balance both the global design standards with the appropriate local response especially when working in developing econo-mies. Environmental, social and construction criteria are each equally important in the establishment of a localized design process. The interconnectivity between local social and cultural factors and global benchmarks for quality of care are also key components in the suc-cess of the design. The resultant design should become
Figure 10: Integration of building into the site slope.

31
a fusion of global ideas localized to the people it serves. The Wellness Centre in Kenya is customized to people of Nairobi and no one else. This project illustrates that the model for healthcare and sustainability is different around the world and the criteria with which we mea-sure their performance must be adjusted to its locality. There is no one solution approach but resultant design should be customized without compromise in quality or building performance. As development becomes equal-ized through globalization it will become apparent that the design response in the developing world will have to be adjusted to its locality due to energy and infrastruc-ture shortfalls. Ironically the lessons learned in the de-veloping world will encourage a revolution in the design and sustainable approaches worldwide.
AcknowledgmentsDoloris Jordan, James R. Jordan FoundationMaria Webb, James R. Jordan FoundationTimothy Vaulkhard, Triad Architects KenyaRalph Johnson, Perkins+WillG. William Doerge, Perkins+Will
REFERENCES[1] World Resource Institute, (2005). Retrieved on 2/8/2011 from http://www.wri.org/
[2] U.S. Energy Information Administration, (2010). “Electricity Prices for Households”, Retrieved on 2/8/2011 from http://www.eia.doe.gov/emeu/interna-tional/elecprih.html
[3] Aksamija, A., (2010). “Kenya Women and Chil-dren’s Wellness Centre: PV Cost and Energy Production Analysis”, Tech Lab Annual Report 2010, Retrieved on 2/8/201 from http://www.perkinswill.com/research/tech-lab-annual-report-2010.html
[4] Schafer, K., (1994). “Site Design and Planning for Sustainable Construction”, Proceedings of the First In-ternational Conference of CIB TG, Tampa, Florida, No-vember 6-9.
[5] Chieni, S. N., (1998). “The Harambee Movement in Kenya”, Retrieved on 3/3/2011 from http://boleswa97.tripod.com/chieni.htm
[6] Hausmann, R., Tyson, L. and Zahidi, S., (2010). The Global Gender Gap Report 2010, Geneva, Switzer-land: World Economic Forum.
[7] Mitchell, R. and Popham, F., (2008). “Effect of Ex-posure to Natural Environment on Health Inequalities”, The Lancet, Vol. 372, pp. 1655-1660.
[8] Rodwin, L., ed. (1987). Shelter, Settlement and De-velopment. Boston, MA: Allen & Unwin.
[9] World Bank, (2011). Doing Business 2011, Report, Washington, DC: The World Bank.
[10] United States Agency for International Develop-ment, (2009). Kenya’s Agenda for Action: Commercial Legal and Institutional Reform, USAID.
Global Design in Developing Countries

PERKINS+WILL RESEARCH JOURNAL / VOL 03.01
32
03.PARAMETRIC CONTROL OF BIM ELEMENTS FOR SUSTAINABLE DESIGN IN REVIT: Linking Design and Analytical Software Applications through Customization
ABSTRACTUsing analytic data as a driver to control the geometry of BIM elements is currently a promising method for parametric creation of design elements such as sun shades, which respond to environmental constraints such as incident solar radiation or solar angles. This can be done qualitatively, but evaluating multiple options with many variables is time consuming. A preferred method is to use analytical data coming from applications such as Ecotect to parametrically control BIM families. This article reviews customization of the Autodesk Revit BIM authoring software to allow for data exchange between BIM and analytical applications (Revit and Ecotect), where analytic data is used to control the geometry of Revit families. The article first discusses concepts of solar radiation and relationships to optimum design of shading devices and previous parametric modeling work done in other software applications. Then, development of a custom plug-in for Revit that allows import of numeric data and parametric control of Revit families based on these values is discussed. Also, relationships to Ecotect and data exchange between these different software applications are discussed, followed by a case study.
KEYWORDS: BIM, parametric design, sustainability, analysis, software customization
Ajla Aksamija, PhD, LEED AP BD+C, CDT, [email protected]
Mario Guttman, AIA, LEED AP, [email protected]
Hari Priya Rangarajan, LEED AP BD+C, [email protected]
Tim Meador, LEED AP, [email protected]
1.0 INTRODUCTIONRecent developments in computational design tools are providing methods for improved design practices. Enhanced design representations, energy and thermal simulations and improved collaboration using digital media are some of the benefits of advanced compu-tational tools. Building Information Modeling (BIM) is currently one of the major paradigm shifts in the build-ing industry where the primary elements of change are:
• Representation of building elements as data-rich 3D objects, rather than as combination of 2D or-thogonal views and written documents.
• Use of an interdisciplinary, comprehensive, building model as the source for derived “views”, rather than a collection of “drawings” that is used to infer a 3D design.
A BIM provides a common database of information about a building including its geometry and attributes. It is an integrated, comprehensive building model that stores the information contained in traditional building documents such as drawings, specification and con-struction details as well as additional 3D information and metadata in a centralized or distributed database. The goal of BIM is to provide a common structure for information sharing that can be used by all agents in the design process and construction. It virtually simu-lates design and construction and provides groundwork for collaborative design since all the relevant informa-tion such as spatial organization, building components, building systems (mechanical, electrical, plumbing, HVAC) can be incorporated into building descriptions.
Visualization of design in three-dimensional space is one of the advantages of BIM; however, it is not the only capability and the integrative nature of contents
Parametric Control of BIM Elements for Sustainable Design in Revit
33
must be emphasized. A BIM can also be used for simu-lations, building performance predictions and environ-mental analysis where the data contained in the BIM is used for daylight studies, energy analysis and solar access studies.
Typical workflow and data exchange between BIM and environmental analysis applications requires export of model geometry from BIM to analysis applications. Nu-merous examples of this process are available1,2. Best practices for data exchange between BIM and environ-mental analysis software depend on the analysis objec-tives and what type of information/data is needed. For example, for determination of building massing that minimizes solar exposure or incident solar exposure on the facade, data exchange through DXF file format is adequate. For these types of studies, geometric prop-erties of the building massing or component under analysis (for example, part of the façade with shading devices) are sufficient. These basic parameters can be embedded in the model from the earliest stages of the design process and can be used for investigation of dif-ferent design options through environmental analysis.
For other types of studies such as daylight or thermal analysis, enriched information about interior spatial or-ganization, material properties and properties of shad-ing surfaces is needed. Therefore, information stored in “design” BIM needs to be exported as “analysis” BIM. For example, Autodesk Ecotect® analysis software is de-signed to be used during the early stages of the design process and can be effectively used for a variety of ana-lytical functions such as shadow analysis, shading, so-lar exposure studies, lighting and daylight studies. Data exchange between BIM and analytical software can be performed through Green Building XML (gbXML) schema, a computer language specifically developed to facilitate transfer of building properties stored in BIM to analysis tools.
Currently, data exchange between BIM and analytical software is relatively easy to accomplish. It is very chal-lenging to import analysis results back into the BIM and control geometry of its elements based on the re-sults. The objective of this research was to investigate the functionalities of a custom-built plug-in for the Au-todesk Revit® platform that allows import of analytical results such as solar radiation striking a surface, into the BIM model. It enables importing of data and para-metric control of Revit families based on the numeric values contained in the imported data. It was tested in relation to building façade design, specifically focus-ing on optimizing design of shading devices using solar
radiation data obtained from Ecotect analysis software. The underlying drive for the research was to ease the information exchange between BIM design and analy-sis applications, specifically focusing on effective use of real analytic data for parametrical control of model geometry in Revit.
In this article, first we define parametric design as a rule-based design method where design models can be manipulated based on certain constraints. We also discuss the concepts of insolation and design rules for the optimal design of shading elements since the driver for this research has been to use parametric tools for design of sustainable elements. Then, we focus on the description of earlier work in non-BIM software applica-tions where we have used design rules for parametric design of shading devices, based on the building’s loca-tion and latitude. Following this discussion, we focus on the customization of Revit and development of a plug-in that allows users to import analytic data into Revit and to parametrically control Revit families based on the numeric values. Several test cases are shown, illus-trating this process in detail where solar angles or solar radiation data (coming from analytic applications) have been used to control positioning or geometry of shading devices and curtain wall panels.
2.0 PARAMETRIC DESIGN AND SUSTAINABLE ARCHITECTUREWhat exactly constitutes parametric modeling? These processes and tools are relatively new to the architec-tural community and are based on the concept of rules, constraints, features and associations between param-eters and objects in the model such as geometry. The rules and constraints, usually consisting of mathemati-cal formulas, data values or numbers can be used to control the properties of the model or an object in a model such as geometry, shape or size. The underly-ing driver for parametric design is to be able to quickly adapt the characteristics of a model component based on a certain rule without having to recreate the entire model for each design iteration. The rules, or numeric values, may represent structural loads, environmental data (such as solar radiation, solar angles, wind veloc-ity), or simply a change in dimensions.
The benefits of parametric tools in practice have been acclaimed while also acknowledged as increasing in complexity and time required for certain design tasks3. For example, there are case studies where parametric design methods have been used to determine build-ing geometry and curvature of the cladding design for
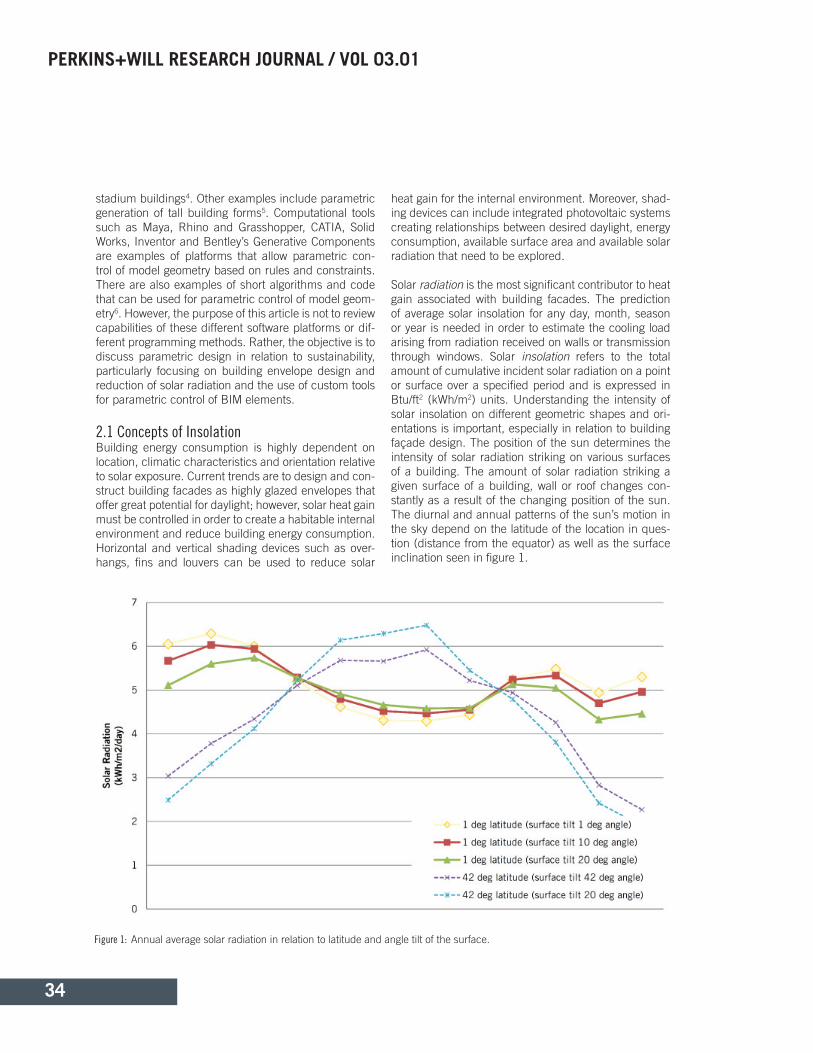
PERKINS+WILL RESEARCH JOURNAL / VOL 03.01
34
stadium buildings4. Other examples include parametric generation of tall building forms5. Computational tools such as Maya, Rhino and Grasshopper, CATIA, Solid Works, Inventor and Bentley’s Generative Components are examples of platforms that allow parametric con-trol of model geometry based on rules and constraints. There are also examples of short algorithms and code that can be used for parametric control of model geom-etry6. However, the purpose of this article is not to review capabilities of these different software platforms or dif-ferent programming methods. Rather, the objective is to discuss parametric design in relation to sustainability, particularly focusing on building envelope design and reduction of solar radiation and the use of custom tools for parametric control of BIM elements.
2.1 Concepts of InsolationBuilding energy consumption is highly dependent on location, climatic characteristics and orientation relative to solar exposure. Current trends are to design and con-struct building facades as highly glazed envelopes that offer great potential for daylight; however, solar heat gain must be controlled in order to create a habitable internal environment and reduce building energy consumption. Horizontal and vertical shading devices such as over-hangs, fins and louvers can be used to reduce solar
heat gain for the internal environment. Moreover, shad-ing devices can include integrated photovoltaic systems creating relationships between desired daylight, energy consumption, available surface area and available solar radiation that need to be explored.
Solar radiation is the most significant contributor to heat gain associated with building facades. The prediction of average solar insolation for any day, month, season or year is needed in order to estimate the cooling load arising from radiation received on walls or transmission through windows. Solar insolation refers to the total amount of cumulative incident solar radiation on a point or surface over a specified period and is expressed in Btu/ft2 (kWh/m2) units. Understanding the intensity of solar insolation on different geometric shapes and ori-entations is important, especially in relation to building façade design. The position of the sun determines the intensity of solar radiation striking on various surfaces of a building. The amount of solar radiation striking a given surface of a building, wall or roof changes con-stantly as a result of the changing position of the sun. The diurnal and annual patterns of the sun’s motion in the sky depend on the latitude of the location in ques-tion (distance from the equator) as well as the surface inclination seen in figure 1.
Figure 1: Annual average solar radiation in relation to latitude and angle tilt of the surface.

35
2.2 Selection of Shading DevicesSelection of shading devices depends on building orien-tation since each side of the building receives different amounts of solar radiation. Generally, horizontal devices should be used for south façades (north for south-ern hemisphere) since these types reduce solar heat gain throughout the year. Vertical devices such as fins should be used on east and west facades and prefer-ably should be able to rotate depending on the daily sun path. Shading of the south facades should respond to seasonal, while east and west façades should respond to daily changes in the position of the sun.
If tilted shading devices are used, the optimal angle is generally equal to latitude for fixed horizontal elements. If horizontal shading devices can be rotated, seasonal changes can be accounted for by adjusting the angle depending on the location (latitude) and different sea-sons. For fixed devices, selecting preferred season or averaging values for different seasons can optimize shading efficiency.
Overhang design that incorporates horizontal shading devices can be sized according to the building location and data obtained from the sun path diagram (solar azimuth and altitude). Dimensions are dependent on horizontal and vertical shading angles.
Rotating angle of vertical shading devices should re-spond to daily and monthly sun path as well as building orientation angle. These can be expressed in relation to sun azimuth or horizontal shading angle. Deviation from true north can be accounted for by subtracting relative orientation angle. The methodology and steps to optimize design of shading elements include:
• Determination of the overheated period, based on building’s location and climate, to select months and periods when shading is needed.
• Determination of the critical solar angles for the design.
• Determination of the physical properties of the shading devices such as type (horizontal or verti-cal) depending on the building’s orientation, sun tracking capabilities and dimensions.
2.3 Shading Geometry, Architectural Components and Parametric DesignThe principles of insolation and sun shading, described in the previous section, define an architectural problem as they are applied to a building design. The functional requirements of shading devices also offer aesthetic op-portunities when combined with other design objectives creating interesting patterns and unique façade solu-tions. Projections and recesses, varied size and scale of louvers, and degrees of light and shade, can be com-bined in different permutations to create architectural interest. As seen in figure 2, horizontal fins are used on the south facade with a 45 degree angle maintained be-tween the varying depths of the fins. Figure 3 illustrates vertical fins on the west and east façades, screening balconies and living quarters and offering visual privacy to the units facing each other. Figure 4a has a 14.7 ft (4.5 meter) modular screen that wraps the building on the southern façade and ties the different programmatic elements together. The fins are rotated based on the latitude. Figure 4b shows the inclined fins with different positions for summer, winter and spring.
In our previous work the use of these elements was studied in projects through the use of MEL (Maya Em-bedded Language) scripting in Maya software. These studies led to an understanding of the parameters that control an individual fin and how fins can be populated within different geometries. Exploration and position-ing of vertical and horizontal shading devices using the
Figure 2: Shading elements as major architectural component (Community Center, Texas).
Parametric Control of BIM Elements for Sustainable Design in Revit

PERKINS+WILL RESEARCH JOURNAL / VOL 03.01
36
Figure 3: Vertical fins (Residential mixed-use tower, Abu Dhabi).
Figure 4a: Horizontal fins as screens (Residential mixed use building, Abu Dhabi).
Figure 4b: Rotation of louvers that follow seasonal changes and parametric control.
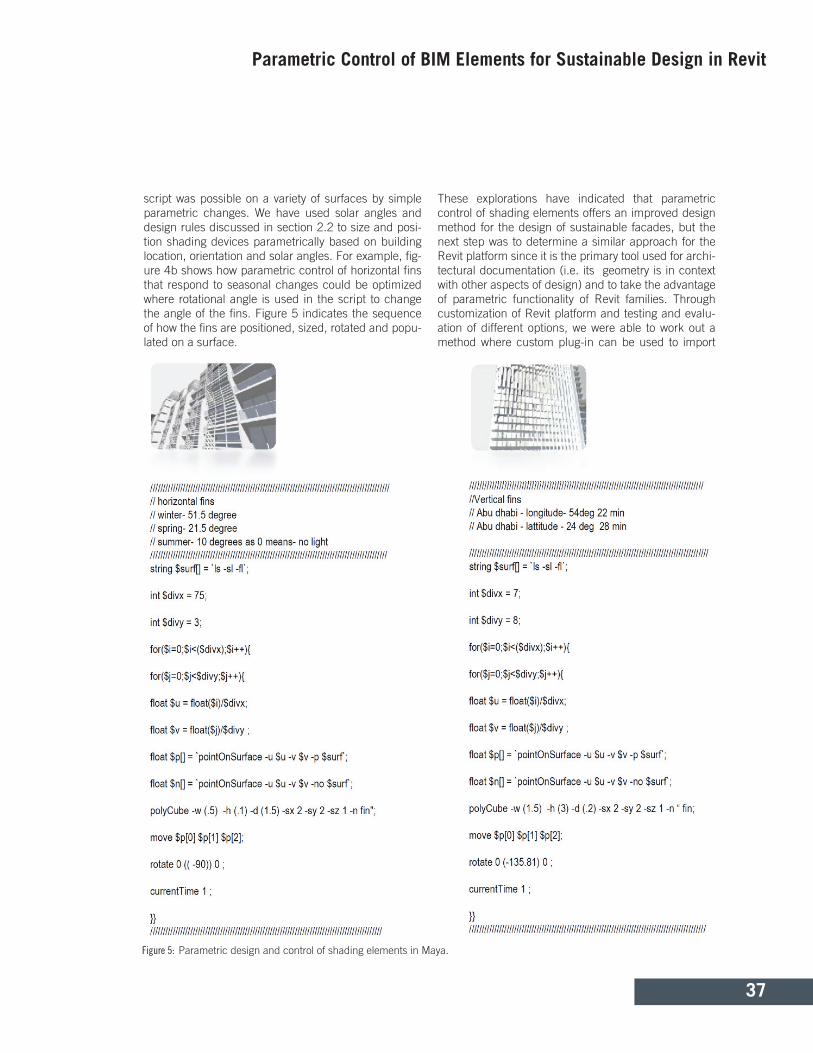
37
script was possible on a variety of surfaces by simple parametric changes. We have used solar angles and design rules discussed in section 2.2 to size and posi-tion shading devices parametrically based on building location, orientation and solar angles. For example, fig-ure 4b shows how parametric control of horizontal fins that respond to seasonal changes could be optimized where rotational angle is used in the script to change the angle of the fins. Figure 5 indicates the sequence of how the fins are positioned, sized, rotated and popu-lated on a surface.
These explorations have indicated that parametric control of shading elements offers an improved design method for the design of sustainable facades, but the next step was to determine a similar approach for the Revit platform since it is the primary tool used for archi-tectural documentation (i.e. its geometry is in context with other aspects of design) and to take the advantage of parametric functionality of Revit families. Through customization of Revit platform and testing and evalu-ation of different options, we were able to work out a method where custom plug-in can be used to import
Figure 5: Parametric design and control of shading elements in Maya.
Parametric Control of BIM Elements for Sustainable Design in Revit

PERKINS+WILL RESEARCH JOURNAL / VOL 03.01
38
analytical data into Revit to control the geometry of shading devices. We have used Excel spreadsheets to hold the analytic data coming from Ecotect analysis software and supply numeric values to Revit for para-metric control through a custom tool. The process diagram is shown in figure 6, indicating how the data exchange between Revit, Ecotect and Excel is carried out. Components of the tool are discussed in detail in the next section as well as connectivity mechanisms be-tween Revit and Excel.
3.0 CUSTOMIZATION OF REVIT
3.1 Use of a Custom Programming ApproachThe team considered alternative approaches for provid-
ing the parametric functionality. Although commercial applications that provide much of the required capabil-ity are available and other programming environments could have been used to develop a solution, an applica-tion based on the Revit Application Programming Inter-face (API) linked to Microsoft Excel was selected.
The custom programming strategy has several advan-tages over so-called “user friendly” applications such as Grasshopper, that provide a graphical user interface and generate code in the background.
Although the graphical interfaces are “easy” to use for the production of quick, dramatic results, they are not as explicit about the imbedded decision process that lead to the final form. Computer programming code de-
Figure 6: Process diagram showing the data transfer between different applications for parametric control of BIM elements.
REVIT
ECOTECT
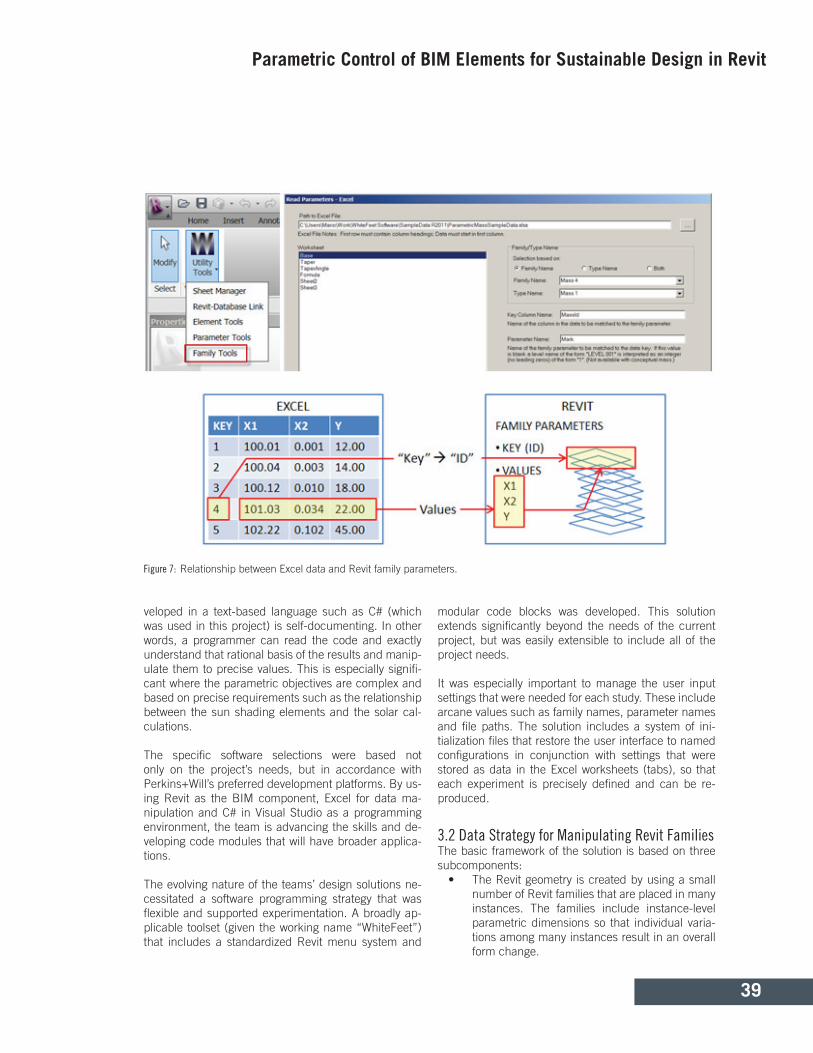
39
veloped in a text-based language such as C# (which was used in this project) is self-documenting. In other words, a programmer can read the code and exactly understand that rational basis of the results and manip-ulate them to precise values. This is especially signifi-cant where the parametric objectives are complex and based on precise requirements such as the relationship between the sun shading elements and the solar cal-culations.
The specific software selections were based not only on the project’s needs, but in accordance with Perkins+Will’s preferred development platforms. By us-ing Revit as the BIM component, Excel for data ma-nipulation and C# in Visual Studio as a programming environment, the team is advancing the skills and de-veloping code modules that will have broader applica-tions.
The evolving nature of the teams’ design solutions ne-cessitated a software programming strategy that was flexible and supported experimentation. A broadly ap-plicable toolset (given the working name “WhiteFeet”) that includes a standardized Revit menu system and
modular code blocks was developed. This solution extends significantly beyond the needs of the current project, but was easily extensible to include all of the project needs.
It was especially important to manage the user input settings that were needed for each study. These include arcane values such as family names, parameter names and file paths. The solution includes a system of ini-tialization files that restore the user interface to named configurations in conjunction with settings that were stored as data in the Excel worksheets (tabs), so that each experiment is precisely defined and can be re-produced.
3.2 Data Strategy for Manipulating Revit FamiliesThe basic framework of the solution is based on three subcomponents:
• The Revit geometry is created by using a small number of Revit families that are placed in many instances. The families include instance-level parametric dimensions so that individual varia-tions among many instances result in an overall form change.
Figure 7: Relationship between Excel data and Revit family parameters.
Parametric Control of BIM Elements for Sustainable Design in Revit
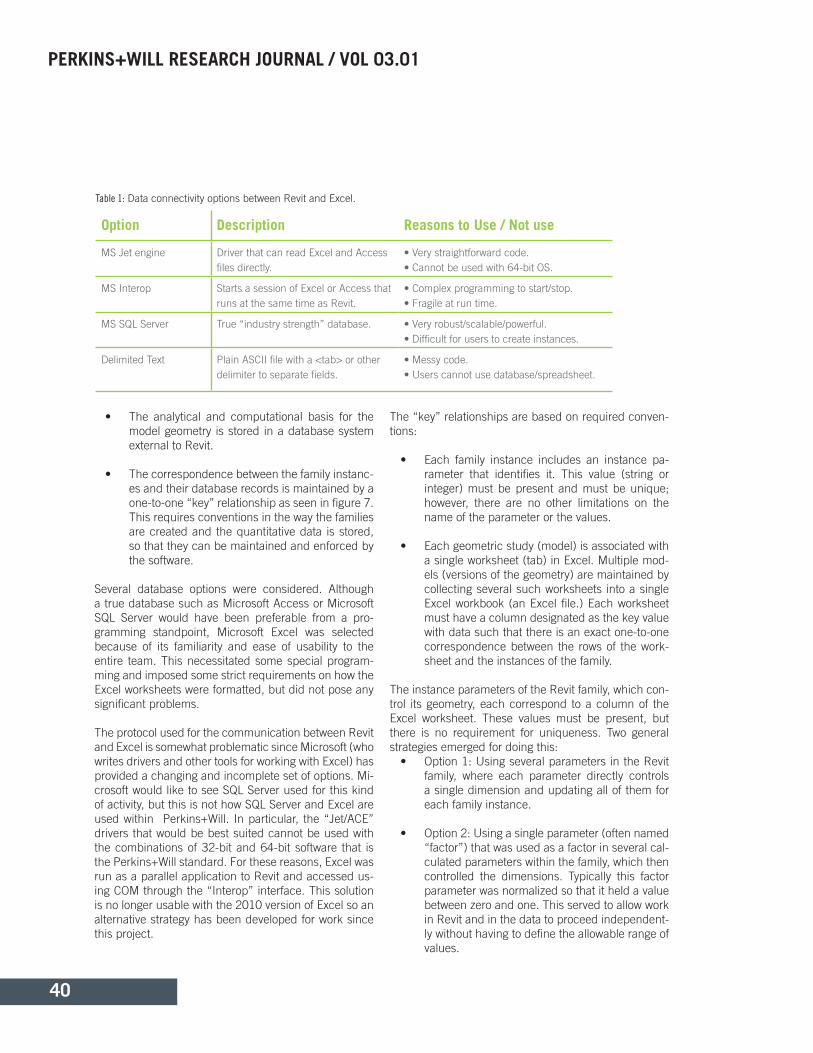
PERKINS+WILL RESEARCH JOURNAL / VOL 03.01
40
• The analytical and computational basis for the model geometry is stored in a database system external to Revit.
• The correspondence between the family instanc-es and their database records is maintained by a one-to-one “key” relationship as seen in figure 7. This requires conventions in the way the families are created and the quantitative data is stored, so that they can be maintained and enforced by the software.
Several database options were considered. Although a true database such as Microsoft Access or Microsoft SQL Server would have been preferable from a pro-gramming standpoint, Microsoft Excel was selected because of its familiarity and ease of usability to the entire team. This necessitated some special program-ming and imposed some strict requirements on how the Excel worksheets were formatted, but did not pose any significant problems.
The protocol used for the communication between Revit and Excel is somewhat problematic since Microsoft (who writes drivers and other tools for working with Excel) has provided a changing and incomplete set of options. Mi-crosoft would like to see SQL Server used for this kind of activity, but this is not how SQL Server and Excel are used within Perkins+Will. In particular, the “Jet/ACE” drivers that would be best suited cannot be used with the combinations of 32-bit and 64-bit software that is the Perkins+Will standard. For these reasons, Excel was run as a parallel application to Revit and accessed us-ing COM through the “Interop” interface. This solution is no longer usable with the 2010 version of Excel so an alternative strategy has been developed for work since this project.
The “key” relationships are based on required conven-tions:
• Each family instance includes an instance pa-rameter that identifies it. This value (string or integer) must be present and must be unique; however, there are no other limitations on the name of the parameter or the values.
• Each geometric study (model) is associated with a single worksheet (tab) in Excel. Multiple mod-els (versions of the geometry) are maintained by collecting several such worksheets into a single Excel workbook (an Excel file.) Each worksheet must have a column designated as the key value with data such that there is an exact one-to-one correspondence between the rows of the work-sheet and the instances of the family.
The instance parameters of the Revit family, which con-trol its geometry, each correspond to a column of the Excel worksheet. These values must be present, but there is no requirement for uniqueness. Two general strategies emerged for doing this:
• Option 1: Using several parameters in the Revit family, where each parameter directly controls a single dimension and updating all of them for each family instance.
• Option 2: Using a single parameter (often named “factor”) that was used as a factor in several cal-culated parameters within the family, which then controlled the dimensions. Typically this factor parameter was normalized so that it held a value between zero and one. This served to allow work in Revit and in the data to proceed independent-ly without having to define the allowable range of values.
Option Description Reasons to Use / Not use
MS Jet engine Driver that can read Excel and Access files directly.
• Very straightforward code.• Cannot be used with 64-bit OS.
MS Interop Starts a session of Excel or Access that runs at the same time as Revit.
• Complex programming to start/stop.• Fragile at run time.
MS SQL Server True “industry strength” database. • Very robust/scalable/powerful.• Difficult for users to create instances.
Delimited Text Plain ASCII file with a <tab> or other delimiter to separate fields.
• Messy code.• Users cannot use database/spreadsheet.
Table 1: Data connectivity options between Revit and Excel.

41
3.3 Solution WorkflowsThe basic workflow occurred in three steps:
• Families were developed and placed in Revit.
• An Excel file was created. In some cases the Excel data was imported from another program, specifically Ecotect in this project for obtaining solar radiation values. In other cases, all of the data manipulation was done in Excel.
• The WhiteFeet program was launched from the Revit Add-ins menu. The name of the key pa-rameter, the path to the Excel file and the name of worksheet and other settings were filled in. The synchronization process was launched from a command button.
The effect of these steps was to update the parameter values of all of the family instances. After the WhiteFeet program exited, Revit then regenerated the families, re-sulting in the new form.
The initial development of the program was for use in creating complex building forms. These typically were tall towers that included changes in dimension and twisting of the plan geometry at each floor as seen in
figure 8. In these studies, a family instance represented a floor. The geometry of the instance was independently controlled at the top and the bottom of the floor to give an overall smooth effect. Generic solids, mass objects and adaptive components were used successfully in this way.
Beginning with the sun shading explorations, the pro-gram was adapted for use with families that constituted repeated instances of wall elements. In some cases these were simply arrayed families and in others they were panels imbedded in a Revit curtain wall family. The behavior was the same in both cases because Re-vit allows the addressing of the imbedded families as if they were placed separately.
To make it easier to manage the families, a convention for defining their identifiers was used. In this, the rows were assigned letter names, the columns integer names and the cells were named by combining these two val-ues. This was easily accomplished by creating three separate parameters, naming the rows and columns in elevation views where they could be selected as groups and using another WhiteFeet tool to concatenate the values to the ID parameter.
Figure 8: Example of Revit family instance (tower floor) and Excel data used to derive of the twisting geometry of the tower.
Parametric Control of BIM Elements for Sustainable Design in Revit

PERKINS+WILL RESEARCH JOURNAL / VOL 03.01
42
As more complex surfaces were developed, the same process was applied to mesh surfaces containing adap-tive component cells in the Revit Conceptual Design Environment. Although the naming of the cells followed a similar strategy to the planar curtain walls, the irregu-larities in the patterns necessitated a refined strategy for identifying the separate rows and columns. A special WhiteFeet tool was developed for this purpose. In some cases these needed to be assigned arbitrarily.
4.0 CASE STUDY: COMPUTATIONAL REVIT FAMILIES AND PARAMETRIC CONTROL Revit and the WhiteFeet utility menu can be used to create parametric dynamic shading systems driven by Ecotect solar incidence data. A number of curtain wall and different shading method case studies were gener-ated. As an example, in the following case study we il-lustrate how a curtain panel pattern family can be used
to panelize free-form surfaces with dynamic geometry. For modifying curtain wall pattern families, the suggest-ed method is to nest complex geometries in separate families as seen in figure 9. This allows each compo-nent of the curtain panel to be tested independently and properly “flexed” or tested in Revit with a range of possible values that would come from the solar radia-tion data.
There are two different types of behavior in the hosted geometry within the conceptual design environment. When hosting points on other points, the created point will have a parameter named “Offset” shown in figure 10. This specifies the point’s offset in the “Z” direction from the host point. The second hosted behavior is the “Hosted” parameter. This results when a point is hosted on a reference line. This parameter can range from 0 to 1 and controls where on the hosted line the point falls. We call it a “Factor” parameter as seen in figure 11. This benefits the Revit family in several aspects. First, it
Figure 9: Example of nested families.
Figure 10: “Offset” and “Hosted” parameters in Revit.
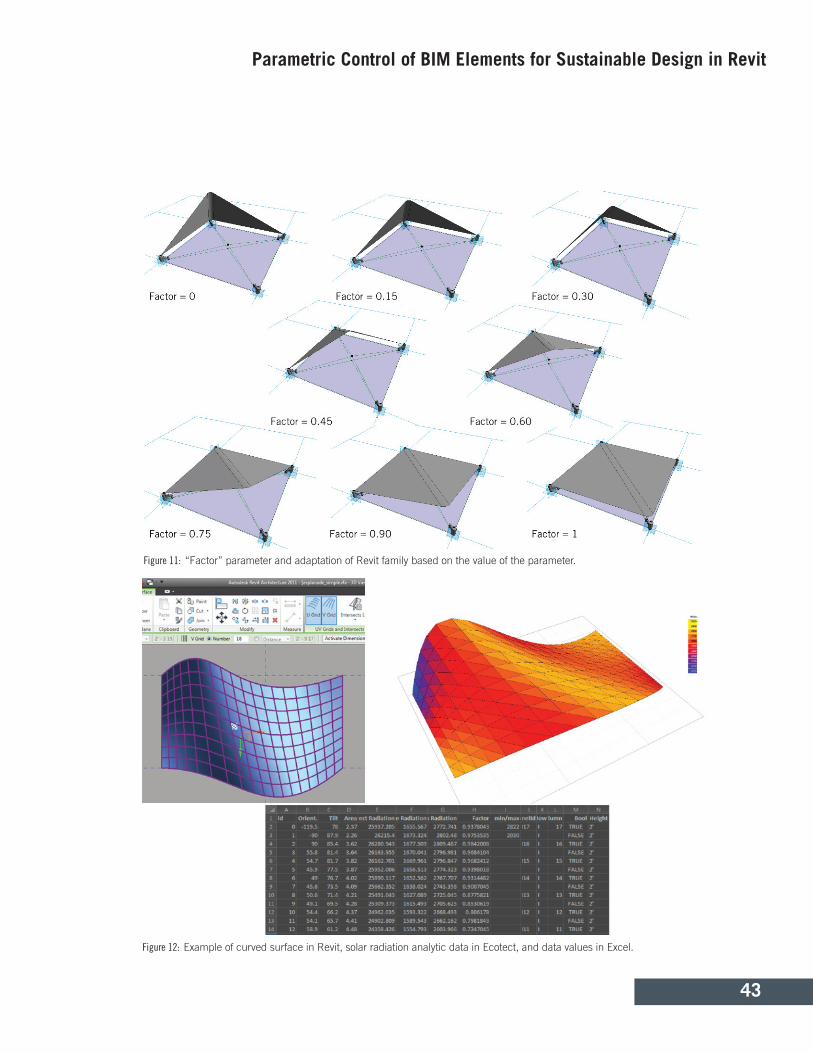
43
Figure 11: “Factor” parameter and adaptation of Revit family based on the value of the parameter.
Figure 12: Example of curved surface in Revit, solar radiation analytic data in Ecotect, and data values in Excel.
Parametric Control of BIM Elements for Sustainable Design in Revit
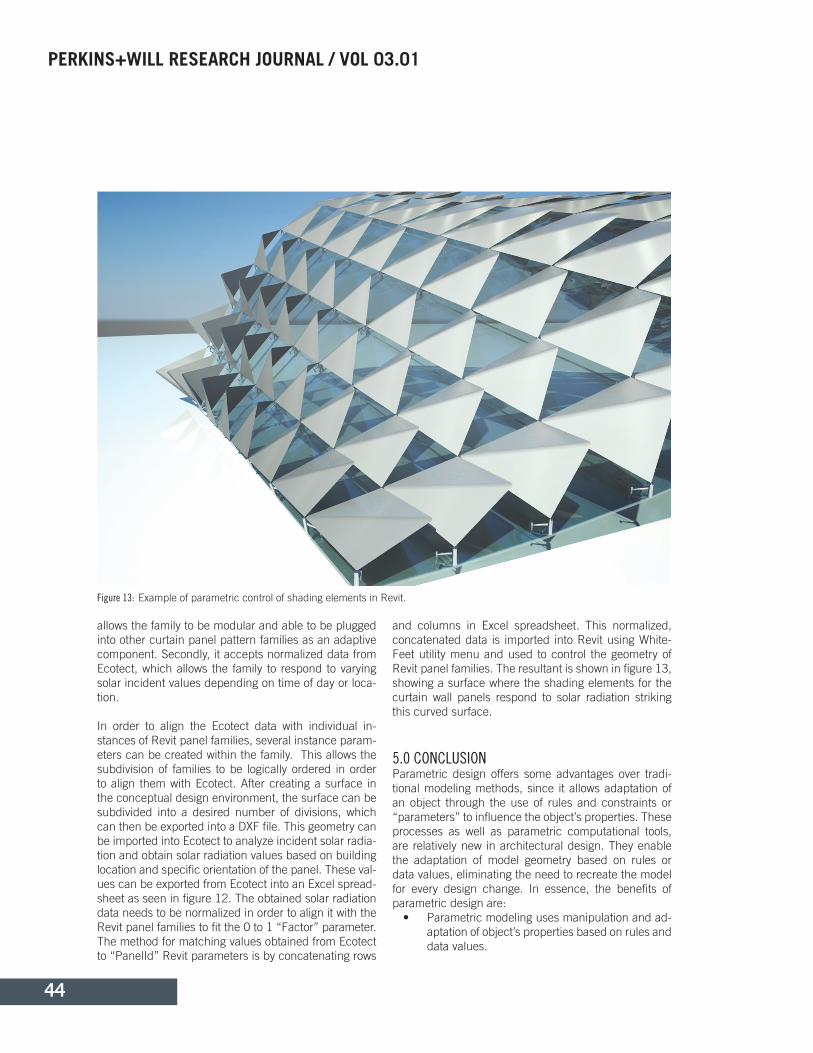
PERKINS+WILL RESEARCH JOURNAL / VOL 03.01
44
allows the family to be modular and able to be plugged into other curtain panel pattern families as an adaptive component. Secondly, it accepts normalized data from Ecotect, which allows the family to respond to varying solar incident values depending on time of day or loca-tion.
In order to align the Ecotect data with individual in-stances of Revit panel families, several instance param-eters can be created within the family. This allows the subdivision of families to be logically ordered in order to align them with Ecotect. After creating a surface in the conceptual design environment, the surface can be subdivided into a desired number of divisions, which can then be exported into a DXF file. This geometry can be imported into Ecotect to analyze incident solar radia-tion and obtain solar radiation values based on building location and specific orientation of the panel. These val-ues can be exported from Ecotect into an Excel spread-sheet as seen in figure 12. The obtained solar radiation data needs to be normalized in order to align it with the Revit panel families to fit the 0 to 1 “Factor” parameter. The method for matching values obtained from Ecotect to “PanelId” Revit parameters is by concatenating rows
and columns in Excel spreadsheet. This normalized, concatenated data is imported into Revit using White-Feet utility menu and used to control the geometry of Revit panel families. The resultant is shown in figure 13, showing a surface where the shading elements for the curtain wall panels respond to solar radiation striking this curved surface.
5.0 CONCLUSIONParametric design offers some advantages over tradi-tional modeling methods, since it allows adaptation of an object through the use of rules and constraints or “parameters” to influence the object’s properties. These processes as well as parametric computational tools, are relatively new in architectural design. They enable the adaptation of model geometry based on rules or data values, eliminating the need to recreate the model for every design change. In essence, the benefits of parametric design are:
• Parametric modeling uses manipulation and ad-aptation of object’s properties based on rules and data values.
Figure 13: Example of parametric control of shading elements in Revit.
45
• Multiple design options and design iterations can be created by modifying object attributes and properties (such as dimensions or shape) without recreating the entire model.
• Analytical data developed in response to envi-ronmental constraints, or other types of logic-based control, can be used to derive geometry.
There are also limitations to parametric model design, which are:
• Parametric modeling requires use of advanced computational tools, which require investment and time.
• In some instances, this design method also re-quires customization of software applications for implementation.
• The logic behind the architectural design pro-cess must be understood in order to be imple-mented in the parametric design and it can be difficult to express in quantifiable terms in some instances.
In this work we presented relationships between para-metric design and sustainability, particularly focusing on building facade design and methods to reduce solar radiation. We have discussed the concepts of insolation and the dependency of the actual values on latitude and orientation of the surface in relation to the sun’s position. We have also discussed basic rules for the de-sign of shading devices that are based on a building’s orientation as well as steps for optimizing performance of shading devices. These rules have been implement-ed and parametrically tested on surface geometries using Maya modeling software and custom algorithm (MEL script), where positioning, sizing and typologies of shading devices are easily controlled and manipulated. These explorations showed that the parametric control of shading elements offers improved design method for the design of sustainable facades, but it was also necessary to investigate whether a similar method can be applied to Revit since this BIM platform is currently used for architectural design and documentation. We have tested a custom tool for Revit that can be used to import analytic data such as solar radiation values to control geometry of Revit families.
This process proved beneficial for determination of building forms and parametric design of elements that respond to environmental constraints and data such as insolation. Future implementation and testing of this tool and process should focus on other applications and parameters, testing values such as wind velocity and response of the building form design.
Additional NotesA previous version of this work has been presented at the Autodesk University 2010 Conference. A re-cording of the presentation and associated hand-out material is available at: http://au.autodesk.com/?nd=class&session_id=6854.
The custom software may be downloaded from: http://www.whitefeet.com/License.htm.
AcknowledgmentsAuthors would like to acknowledge Richard Adams and Jeffrey Erath (Community Center, Texas); Shubhankar Sanyal, Steve Kunin and Wieren Chen (Abu Dhabi proj-ects).
REFERENCES[1] Aksamija, A., (2010). “Analysis and Computation: Sustainable Design in Practice”, Design Principles and Practices: An International Journal, Vol. 4, No. 4, pp. 291-314.
[2] Aksamija, A., and Mallasi, Z., (2010). “Building Per-formance Predictions: How Simulations Can Improve Design Decisions”, Perkins+Will Research Journal, Vol. 2, No. 2, pp. 7-32.
[3] Aish, R., and Woodbury, R., (2005). “Multi-Level In-teraction in Parametric Design”, Lecture Notes in Com-puter Science, Vol. 3638, pp. 151-162.
[4] Hudson, R., (2008). “Frameworks for Practical Parametric Design in Architecture”, Proceedings of the 26th eCAADe Conference, Antwerpen, Belgium, pp. 847-854.
[5] Park, S. M., Elnimeiri, M., Sharpe, D. C., and Kraw-czyk, R. J., (2004). “Tall Building Form Generation by Parametric Design Process”, Proceedings of the CT-BUH 2004 Conference, Seoul, Korea.
[6] Woodbury, R., (2010). Elements of Parametric De-sign, Retrieved on 3/15/11 from http://www.designpat-terns.ca/.
Parametric Control of BIM Elements for Sustainable Design in Revit

PERKINS+WILL RESEARCH JOURNAL / VOL 03.01
46
04.UNDERSTANDING GLARE:
ABSTRACTDaylight harvesting in architecture is a complicated task as the most prominent characteristic of daylight is its variability. There are many methods of estimating how daylight will benefit spaces, but too often the potential for glare is not properly addressed during design. This is especially prevalent in office space environments. A far too common scene is an office space with paper or foil taped to the glazing to keep glare sources from disturbing occupants. This article outlines what glare is, how it can be measured, when it is critical to analyze the poten-tial for glare and solutions to keep occupants comfortable and at the same time optimize daylight harvesting throughout the year.
KEYWORDS: daylight harvesting, glare, passive shading, solar control, visual comfort
Design Methods for Improving Visual Comfort
David Mead, NCARB, IES, LEED AP BD+C, [email protected]
1.0 INTRODUCTION: WHAT IS GLARE?In the world of daylighting design it is important to un-derstand the terms “glare” and “brightness” in order to use the proper vocabulary when designing spaces to achieve occupant visual comfort. A common definition for glare is a very harsh, bright, dazzling light. Bright-ness is often used incorrectly to explain the illuminance in a space. Brightness should only be used for non-quantitative references to physiological sensations and perceptions of light, not as a synonym for the photomet-ric terms illuminance and luminance or the radiometric term radiance1.
The IESNA indentifies glare as two sensations, disability glare and discomfort glare. Disability glare is defined as “the effect of stray light in the eye whereby visibility and visual performance are reduced”2. Discomfort glare is defined as “glare that produces discomfort.” It does not necessarily interfere with visual performance or visibil-ity2. An example of disability glare is the sensation a per-son experiences on a bright sunny day surrounded by snow. The overall luminance values of the environment are too bright for the eyes to handle without shading or lowering the overall luminance values with sunglasses. An example of discomfort glare is the sensation one feels when working at a computer screen and having direct sunlight in the field of view such that it is difficult
to read the monitor due to the high luminance values of the direct sunlight.
In order to understand disability glare and discomfort glare, one must understand the difference between lu-minance and illuminance values. Though most lighting designs are based upon illuminance values, the per-ceived brightness of our environment that can cause visual discomfort is best described in luminance values. Luminance is the luminous intensity that is given off at a point on a surface at a given direction. It is a met-ric to describe the amount of light that is emitted from an object at a specific angle. Illuminance is the total amount of light from all angles on a surface. It is a ratio of the quantity of light reaching a surface and the sur-face area that is illuminated. Most designers are aware of illuminance, but luminance is rarely discussed. It is important that individuals understand luminance as it is the best representation of what the human eye actually perceives.
Though the world of science has a solid understanding of the physics of light, the human response is not as clear, since it is a perceived physiological response to lighting conditions. For example, studies have shown that relative luminance contrast is not the only variable that can effect discomfort glare3. Individuals are more likely to experience glare under artificial lighting condi-
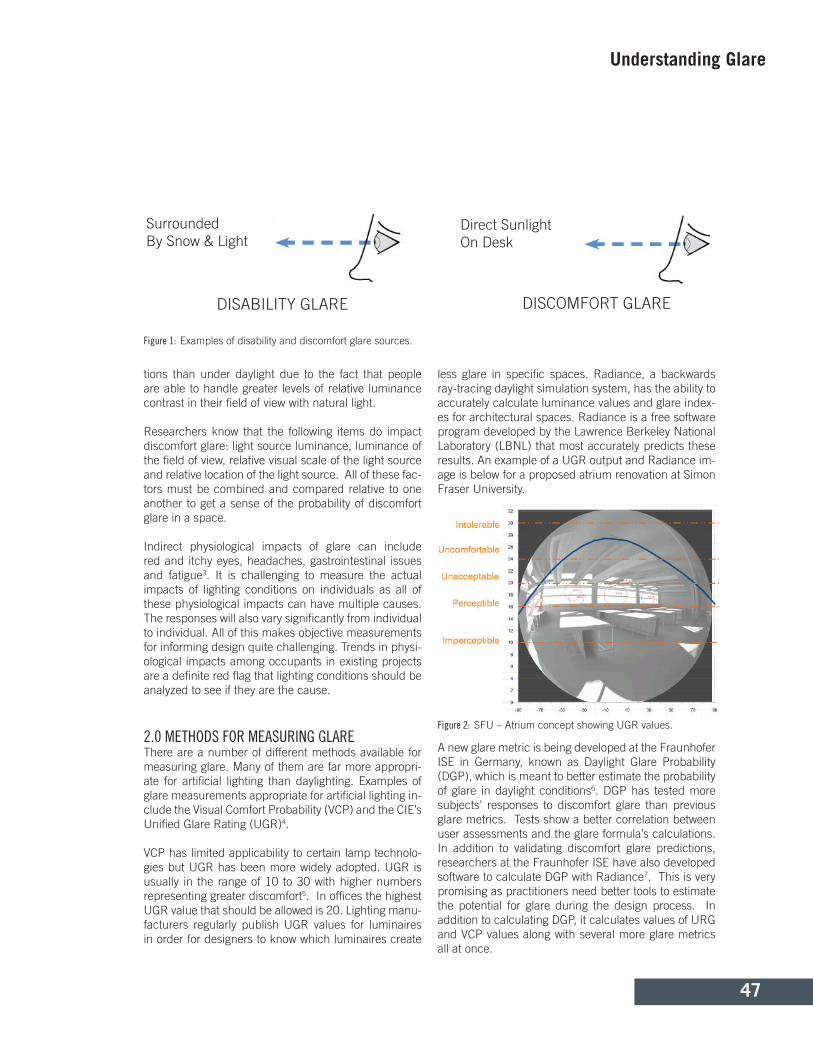
Understanding Glare
47
tions than under daylight due to the fact that people are able to handle greater levels of relative luminance contrast in their field of view with natural light.
Researchers know that the following items do impact discomfort glare: light source luminance, luminance of the field of view, relative visual scale of the light source and relative location of the light source. All of these fac-tors must be combined and compared relative to one another to get a sense of the probability of discomfort glare in a space.
Indirect physiological impacts of glare can include red and itchy eyes, headaches, gastrointestinal issues and fatigue3. It is challenging to measure the actual impacts of lighting conditions on individuals as all of these physiological impacts can have multiple causes. The responses will also vary significantly from individual to individual. All of this makes objective measurements for informing design quite challenging. Trends in physi-ological impacts among occupants in existing projects are a definite red flag that lighting conditions should be analyzed to see if they are the cause.
2.0 METHODS FOR MEASURING GLAREThere are a number of different methods available for measuring glare. Many of them are far more appropri-ate for artificial lighting than daylighting. Examples of glare measurements appropriate for artificial lighting in-clude the Visual Comfort Probability (VCP) and the CIE’s Unified Glare Rating (UGR)4.
VCP has limited applicability to certain lamp technolo-gies but UGR has been more widely adopted. UGR is usually in the range of 10 to 30 with higher numbers representing greater discomfort5. In offices the highest UGR value that should be allowed is 20. Lighting manu-facturers regularly publish UGR values for luminaires in order for designers to know which luminaires create
less glare in specific spaces. Radiance, a backwards ray-tracing daylight simulation system, has the ability to accurately calculate luminance values and glare index-es for architectural spaces. Radiance is a free software program developed by the Lawrence Berkeley National Laboratory (LBNL) that most accurately predicts these results. An example of a UGR output and Radiance im-age is below for a proposed atrium renovation at Simon Fraser University.
A new glare metric is being developed at the Fraunhofer ISE in Germany, known as Daylight Glare Probability (DGP), which is meant to better estimate the probability of glare in daylight conditions6. DGP has tested more subjects’ responses to discomfort glare than previous glare metrics. Tests show a better correlation between user assessments and the glare formula’s calculations. In addition to validating discomfort glare predictions, researchers at the Fraunhofer ISE have also developed software to calculate DGP with Radiance7. This is very promising as practitioners need better tools to estimate the potential for glare during the design process. In addition to calculating DGP, it calculates values of URG and VCP values along with several more glare metrics all at once.
Figure 1: Examples of disability and discomfort glare sources.
Figure 2: SFU – Atrium concept showing UGR values.
DISABILITY GLARE
Surrounded By Snow & Light
Direct Sunlight On Desk
DISCOMFORT GLARE

PERKINS+WILL RESEARCH JOURNAL / VOL 03.01
48
3.0 CRITICAL SPACES TO CONTROL GLAREWith an understanding of what glare is and how to measure it, the next steps are to isolate areas of high concern. Disability glare is highly uncommon inside buildings, so the analysis and design needs to focus on the potentials for discomfort glare. This is applicable to designers, building owners and building operators as a building’s design and the manner in which it is oper-ated have direct impacts on the potential for discomfort glare.
In order to properly design building envelopes to har-vest daylight and control discomfort glare, it is critical that designers consider an occupant’s relationship to glazing. This relationship goes beyond an occupant’s location in space in plan or section. Our eyes experi-ence the entire field of view so it is critical that any lines of sight to glazing on any surface be considered, since discomfort glare can come from anywhere in the field of view. This is best measured using fish eye camera views generated with computer simulations. Radiance can be used to help identify glazing with the potential for creat-ing discomfort glare.
Figure 3: SFU – Atrium concept showing DGP glare sources.
Figure 5: EEEL – Typical teaching laboratory Radiance lumi-nance view showing UGR values.
Figure 4: SFU – Atrium concept showing false color illumination.
Figure 6: EEEL – Typical teaching laboratory Radiance luminance view with a human eye filter showing the relative perception of light.

49
Before running any simulations, there are elements part of an envelope design that should be carefully considered as potential sources of visual discomfort. In general, any glazing elements (whether transparent or translucent) that have direct lines of sight to the upper portions of the sky should be considered as potential sources of glare. Rooms with proportionally high ceil-ings are especially susceptible to this as occupants can have direct lines of site to the top of the sky dome where the highest average luminance values occur. Any trans-lucent materials (e.g. fritted glass, Kalwall or Okalux) should also be carefully considered as the diffusion of light can be such that the relative luminance of a mate-rial creates significant glare in a space.
Once potential glare sources have been identified they will need to be controlled. Solar control devices that help manage glare need to be designed with ownership and control in mind. Ownership in this context refers to the ability to control shading devices. This is very important to understand in office environments as individuals may not have ownership over the controls of shading devices that can eliminate sources of discomfort glare. For ex-ample, it is possible that a window providing wonderful daylight for part of an office is creating visual discomfort for another portion.
When discomfort glare is possible the following ques-tions need to be raised: Who has ownership over con-trolling solar control devices? If someone lowers shad-ing devices who is responsible for raising them back up once the source of discomfort has passed? If the devices are automated, is there a manual override in case the building controls are not sophisticated enough
to handle all the hours of potential discomfort glare? Are automated controls working to raise shading devices once the hours of potential glare have passed? Who is responsible for tuning the controls once a building is occupied to ensure occupant comfort? All of these questions need to be asked during the design process to create buildings that are visually comfortable to oc-cupy year round.
4.0 SOLUTIONS TO KEEP OCCUPANTS COMFORTABLE AND TO MAXIMIZE DAYLIGHT HARVESTINGThe best place to start when studying the potential for discomfort glare during the design process is to do a di-rect sun study. This involves assessing a design space-by-space and examining how direct sunlight will affect working surfaces throughout the year. A good metric to follow is the “thirty minute rule”. This establishes a baseline for good solar and potential glare control by ensuring that direct sunlight is not on any working sur-face for more than thirty minutes for any day throughout the year. This recognizes the fact that direct sunlight in a building is not necessarily a bad thing until it be-comes a long term visual disturbance. If direct sunlight is hitting a working surface then the glazing that is the source of the direct sunlight will require some level of solar control. Stereographic diagrams are an excellent way to understand how direct sunlight hits working sur-faces throughout the year. These diagrams measure a point in space and show graphically an annual sunpath and the hours and months that the point receives direct sunlight.
Figure 7: EEEL – Typical teaching laboratory stereographic diagram.
Figure 8: EEEL – Typical teaching laboratory stereographic diagram.
Understanding Glare

PERKINS+WILL RESEARCH JOURNAL / VOL 03.01
50
The ultimate goal for a project is to control daylight such that no direct sunlight reaches working surfaces throughout the year. This will likely require some level of active solar control devices to properly manage di-rect sunlight. These targets reduce the likelihood of dis-comfort glare on working surfaces, but there is still the potential for visual discomfort in an occupant’s field of view.
One of the best design strategies for any project to optimize daylight and control the potential for glare is to separate daylight glazing from vision glazing. Day-light glazing typically includes anything above 2m (7ft) though it can be higher depending on the size of the room relative to a façade. The following diagram shows this in elevation. Note that glazing below 0.75m (2.5 ft) adds very little to help daylight a space while adding solar heat gain.
Passive shading solutions are the lowest maintenance option for controlling the potential for visual discom-fort. A good example of a passive device for controlling the potential for glare is a light shelf. It is a common misconception that light shelves help bring more light deeper into a space. They actually tend to reduce the overall light level in a space throughout the year (espe-cially in overcast sky conditions). What light shelves do very well is separate daylight glazing from vision glazing so that direct lines of site to the upper portions of the sky are masked from occupants. This is very important as the sky has much higher luminance values on aver-age in the upper portions of the sky dome. A light shelf shields occupants from potential glare in this zone while creating the potential to control vision glazing separately from daylight glazing. This allows occupants to lower operable shades in the vision glazing zone at times when direct sunlight is reaching working surfaces. It also creates the opportunity for daylight glazing to allow indirect sunlight into the space without direct sunlight hitting working surfaces.
The majority of buildings require some form of operable shading devices to assist in visual comfort throughout the year. Discomfort glare can occur even with glaz-ing that faces due north as the relative luminance of the sky on overcast days can be high enough to create discomfort glare in working environments. In urban en-vironments it is also possible to have discomfort glare occur from reflections from surrounding buildings in any orientation.
When operable shading devices are required there are many options to choose from. Interior operable shades come in many variations. There are a number of very innovative internal and external shades that can help control visual comfort and optimize daylight.
Many buildings are starting to have greater amounts of automation with shading systems. This is important in office environments as occupants often are better at putting shades down than lifting them back up. The best option is to have automated shades with manual overrides. This will allow for shades to be automated to optimize the number of hours that daylight harvesting is possible while giving occupants the power to control their own visual comfort. With proper daylight sensors, artificial lighting layouts and zoned controls, buildings can save enormous amounts of energy, create a health-ier environment for occupants with natural light and meet occupants relative visual comfort needs.
In addition to operable shading devices, there is a new technology known as electrochromic glazing that can innovatively control glare, optimize daylight harvesting and reduce maintenance costs. Electrochromic glazing is one variety of what is commonly called ‘switchable glass’ currently available on the market. This technol-ogy uses a small amount of voltage to darken the glass such that it can go from a visible light transmittance (VLT) of around 60 percent to less than 10 percent (e.g. 3 percent). In addition to lowering the VLT of the glass, which will help with glare control, it also reduces the so-lar heat gain coefficient that helps reduce cooling loads. The current technology takes a few minutes to switch from high levels of transparency to low levels, but it is likely to speed up as the technology advances.
This glass is more expensive when compared to other glazing, but when the costs of operable shading sys-tems and high performance glazing are included, elec-trochromic glazing can be an economic alternative.
Figure 9: Typical proportions for vision and daylight glazing.
Daylight Glazing0.75m +up
Vision Glazing1.25m
Least Useful Glazing0.75m
51
5.0 CONCLUSIONBy understanding the potentials of discomfort glare and methods to control it the future for energy savings and visual comfort will be much brighter. Radiance gives designers the ability to predict the possibility for glare during the design process. Glare analysis should be undertaken early in the design process for any spaces with direct lines of sight to the upper portions of the sky. Glare analysis will assist in understanding how external fixed sunshades perform and where operable shading devices are needed. Translucent materials should be carefully considered if no operable shading devices are planned to be installed in front of them. Following these measures will help ensure building occupants can en-joy the benefits of daylight without visual discomfort.
REFERENCES[1] GSA, (1996). United States Federal Standard 1037C, The Federal Glossary of Telecommunication Terms, FED-STD-1037C, General Services Administra-tion.
[2] Rea M.S., ed., (2000). Lighting Handbook: Refer-ence and Application, 9th edition, New York, NY: Illumi-nating Engineering Society of North America.
[3] Eble-Hankins, M. L. and Waters, C. E., (2009). “Subjective Impression of Discomfort Glare from Sourc-es of Non-Uniform Luminance”, IESNA LEUKOS, Vol. 6, No. 1, pp. 52.
[4] Eble-Hankins, M. L. and Waters, C. E., (2004). “VCP and UGR Glare Evaluation Systems: A Look Back and A Way Forward”, IESNA LEUKOS, Vol. 1., pp. 8.
[5] Boyce, P. and Raynham, P., (2009). The Society of Light and Lighting Handbook, London, UK: The Char-tered Institution of Building Services Engineers (CIBSE).
[6] Wienold, J., (2009). “Dynamic Daylight Glare Evalu-ation”, Proceedings of the Eleventh International IBPSA Conference, Glasgow, Scotland, pp. 944-951.
[7] Wienold, J., (2009). “Evalglare - A Radiance Based Tool for Glare Evaluation”, 8th International Radiance Workshop.
Understanding Glare

PERKINS+WILL RESEARCH JOURNAL / VOL 03.01
52

53
PEER REVIEWERS
DR. MOHAMED BOUBEKRIUniversity of Illinois at Urbana-Champaign; School of Architecture
JOSHUA EMIG Auburn University; College of Architecture, Design and Construction
DR. NEVEEN HAMZA Newcastle University; School of Architecture, Planning and Landscape
RICK HINTZPerkins+Will
DR. IVANKA IORDANOVA Université de Montréal; L’École d’Architecture
DR. JONG-JIN KIM University of Michigan; Taubman College of Architecture and Urban Planning
BRUCE TOMAN Perkins+Will

54
MICHAEL DRIEDGERMichael is a LEED® Canada Accredited Professional (BD+C specialty) with 15 years of experience working in the construction trades and in architecture. His work ex-perience has helped develop his talents in contract administration, project man-agement and LEED coordination on a range of projects within the commercial, healthcare, residential and recreational sectors. He has been involved in a number of projects at the community scale and has developed a number of policy papers for the City of Vancouver, Richmond, and for the United States Green Building Council. He is currently working on more than 13 billion dollars worth of LEED construction on projects in North America and internationally.
CARL KNUTSONCarl is an associate principal and designer at Perkins+Will where he has worked on many projects worldwide, most recently in Kenya, Saudi Arabia and China. Throughout his architecture career, he has worked domestically and internationally in South America, Asia, Europe, Middle East and Africa. His projects have included various typologies including healthcare, education, high-rise and mixed-use developments. He has also contributed to several publications including “Ideas+Buildings Vol.1”, “Ideas+Architecture” and “Building the 19th Century”.
AJLA AKSAMIJADr. Aksamija is a building technology researcher and leads Perkins+Will’s Tech Lab. Tech Lab is an on-going research program of the Excellence in Execution Initiative to advance the performance of project designs, to improve design decision mak-ing and documentation and to promote commitments to sustainability, innovation, performance and value. Dr. Aksamija has worked on developing building analysis applications, implementation of novel materials in architectural design, develop-ment of computational models and has collaborated with researchers from various disciplines—engineering, computer science and material science. She has contrib-uted to several books, has published numerous research articles and has presented at national and international conferences.
AUTHORS
01.
02.
MARIO GUTTMANMario is a senior associate and the Firmwide Design Applications Research Leader for Perkins+Will. In this role, he promotes research on the advanced use of software and its application to building industry design practice. Mario holds degrees in mathematics and architecture, is a licensed architect and is LEED accredited. In addition to nearly 30 years of practicing architecture, he has worked in software development, computer-aided facility management and construction. He has been an active participant in industry standards organizations and a frequent speaker in support of Integrated Project Delivery.
03.
03.
PERKINS+WILL RESEARCH JOURNAL / VOL 03.01

55
Authors
03.
03.
04. DAVID MEAD David is a licensed architect with extensive expertise in the integrated de-sign process. He specializes in integrating architectural designs with ener-gy-efficient daylighting and mechanical systems. His diverse professional experience allows him to help bridge the technical design gaps that some-times exist between architects and engineers.
TIM MEADORTim Meador is a Design Application Manager for Perkins+Will. With five years of architectural project experience, he has worked on several major projects to completion. His current focus is overseeing all aspects of digital design that involves Revit, training and BIM implementation. In addition to his experience in the field of architecture, he has also worked in the com-puter software development industry as a QA Engineer.
HARI PRIYA RANGARAJANHari Priya Rangarajan is a member of the architecture staff at Perkins+Will. She has five years of experience in architectural projects spanning residential, institutional, healthcare and high-rise mixed-use. Her passion is enhancing building designs through the implementation of advanced software applications and research-based design. She has a Bachelors of Architecture from RVCE, Bangalore, India and a Masters in Advanced Architectural Design from Columbia University, New York, NY.


Through its “Green Initiative” Program, Phase 3 Media offers
recycled and windpowered paper stocks, recycles all of its
own post-production waste, emails all client invoices, and
uses environmentally friendly, non-toxic cleaning supplies,
additionally Phase 3 Media donates 5% of all sales from its
recycled product lines to Trees Atlanta.
This piece is printed on Mohawk sustainable paper which is
manufactured entirely with Green-e certifi cate wind-generated electricity.

© 2011 Perkins+Will All Rights Reserved
For more information, please send an email to [email protected]