Embed Size (px)
Citation preview

ResearcH JournaL
ww
w.perkinsw
ill.com
2011 / VOL 03.02

Perkins+Will is an interdisciplinary design practice offering services in the areas of Architecture, Interior Design, Branded Environments, Planning + Strategies and Urban Design.
Copyright 2011 Perkins+Will All rights reserved.
Editors: Ajla Aksamija, Ph.D., LEED AP BD+C, CDT and Kalpana Kuttaiah, Associate AIA, LEED AP BD+C
Journal Design & Layout: Kalpana Kuttaiah, Associate AIA, LEED AP BD+C
Acknowledgements: With much APPRECIATION to everyone who contributed in many ways to the research work and articles published in this journal.
We would like to extend our VERY SPECIAL THANKS to: Emily Gartland.
RESEARCH JOURNAL 2011 / VOL 03.02

2011 / VOL 03.02

PERKINS+WILL RESEARCH JOURNAL / VOL 03.02
2

3
TABLE OF CONTENTS
JOURNAL OVERVIEW ..................................................................... Page 4
EDITORIAL ..................................................................... Page 5
01. A DESIGN-BASED APPROACH TO COLLECTING EVIDENCE: Translating Design Investigation into a Valid Research Model
Diana K. Davis, AIA, LEED AP BD+C Bowman O. Davis, Jr., PhD ..................................................................... Page 7
02. uPOD: A MODULAR LIVING ENVIRONMENT FOR STUDENTS: The Case for Today’s Community
Dana Anderson, AIA, NCARB, LEED AP Yanel de Angel Salas, AIA, NCARB, LEED AP Austin Poe ..................................................................... Page 16
03. THE INFORMATION CONTENT OF BIM: An Information Theory Analysis of Building Information Model (BIM) Content
Mario Guttman, AIA, LEED AP ..................................................................... Page 29
04. PERFORMANCE-DRIVEN DESIGN AND PROTOTYPING: Design Computation and Fabrication
Ming Tang, LEED AP BD+C Ajla Aksamija, PhD, LEED AP BD+C, CDT
Michael Hodge, MARCH, AIAA, ACADIA Jonathon Anderson, MFA, ACADIA, IDEC ..................................................................... Page 42
05. BIM ON THE WAN: Autodesk’s Revit and the Wide Area Design Problem
Victor Okhoya, Associate AIA ..................................................................... Page 50
PEER REVIEWERS .................................................................... Page 61 AUTHORS ..................................................................... Page 62

PERKINS+WILL RESEARCH JOURNAL / VOL 03.02
4
The Perkins+Will Research Journal documents research relating to architectural and design practice. Architec-tural design requires immense amounts of information for inspiration, creation and construction of buildings. Considerations for sustainability, innovation and high-performance designs lead the way of our practice where research is an integral part of the process. The themes included in this journal illustrate types of projects and inquiries undertaken at Perkins+Will and capture research questions, methodologies and results of these inquiries.
The Perkins+Will Research Journal is a peer-reviewed research journal dedicated to documenting and present-ing practice-related research associated with buildings and their environments. Original research articles, case studies and guidelines have been incorporated into this publication. The unique aspect of this journal is that it conveys practice-oriented research aimed at supporting our teams.
This is the sixth issue of the Perkins+Will Research Journal. We welcome contributions for future issues.
RESEARCH AT PERKINS+WILLResearch is systematic investigation into existing knowledge in order to discover or revise facts or add to knowledge about a certain topic. In architectural design, we take an existing condition and improve upon it with our design solutions. During the design process we constantly gather and evaluate information from different sources and apply it in novel ways to solve our design problems, thus creating new information and knowledge.
An important part of the research process is documentation and communication. We are sharing combined ef-forts and findings of Perkins+Will researchers and project teams within this journal.
Perkins+Will engages in the following areas of research: • Market-sector related research• Sustainable design• Strategies for operational efficiency• Advanced building technology and performance• Design process benchmarking• Carbon and energy analysis• Organizational behavior
JOURNAL OVERVIEW

5
This issue of Perkins+Will Research Journal includes five articles that focus on diverse research topics, such as evidence-based design in healthcare; design of a modular student housing unit; analysis of information content in BIM; relationships between digital design and fabrication and network challenges associated with BIM data sharing.
“A Design-Based Approach to Collective Evidence: Translating Design Investigation into a Valid Research Model” discusses evidence-based design research and applications in the built environment, particularly relating to healthcare design. It presents results of a research project conducted on a neonatal intensive care unit where the efficiency of the design and the impact on patient’s medical progress and the medical staff was studied. The article relates research process to the design process and correlates scientific research methods to design problems.
“uPod: A Modular Living Environment for Students: The Case for Community” presents design inquiry into mov-able, transformable student housing. The article presents a design solution for a modular, pod-style student housing unit that would be able to adapt to students’ lifestyle and living preferences. It also discusses possible spatial arrangements and configurations for living-learning communities.
“The Information Content of BIM: An Information Theory Analysis of Building Information Model (BIM) Content” relates cost and value of information embedded in BIMs. It compares the conventional and model-based design process and presents four principles that relate cost, value and the quantity of information contained in the model-based representation. It also suggests ways to increase value of information in BIMs, such as combining conventional and model-based representations, use of parametric design methods and use of BIMs during the construction and occupancy design phases.
“Performance Driven Design and Prototyping: Design Computation and Fabrication” discusses an integrated design method and the use of computational tools for design exploration, analysis and fabrication. It discusses the development of a collaborative course where simulations, modeling, parametric design and fabrication are used to investigate and optimize design solutions based on their performance, such as response to environ-mental constraints. Digital fabrication is used as a method to study and investigate physical behavior of the design, such as materiality and constructability. Several projects are presented as outcomes using different digital fabrication methods, such as CNC-milling and laser cutting.
“BIM on the WAN: Autodesk’s Revit and the Wide Area Design Problem” discusses networking and data shar-ing challenges with BIM for geographically dispersed collaborative projects. It reviews several techniques that can be used, such as accessing models through remote desktop and distributed servers. It reviews results of a comparitive analysis for data sharing using four different methods.
Ajla Aksamija, PhD, LEED AP BD+C, CDTKalpana Kuttaiah, Associate AIA, LEED AP BD+C
EDITORIAL

PERKINS+WILL RESEARCH JOURNAL / VOL 03.02
6

7
01.A DESIGN-BASED APPROACH TO COLLECTING EVIDENCE: Translating Design Investigation into a Valid Research Model Diana K. Davis, AIA, LEED AP BD+C [email protected]
Bowman O. Davis, Jr., PhD, [email protected]
ABSTRACTEvidence Based Design (EBD) research analyzes the built environment through a very rigorous lens, one that takes its methodology from scientific protocol. Most environmental designers are not well versed in the utility of scientific methodology for demonstrating design efficacy, even though they employ a similar method of question-ing. Using a previously published study as a model, an approach to EBD research is outlined that uses shared precepts between these two seemingly disparate disciplines. Design questions are assessed as to their subjec-tive or objective nature and translated into testable hypotheses. Literature reviews aid in understanding where a study fits within a larger body of research and in determining if it will affirm or refute prior findings. Subject populations are assessed and sub-divided to best determine the impact of design interventions. Once the subject population is determined, various methods for collecting and analyzing data are used to ensure statistical valid-ity, though the assessment of causality may not be possible or demonstrable.
KEYWORDS: evidence based design (EBD), neonatal intensive care unit (NICU), healthcare design
A Design-Based Approach to Collecting Evidence
1.0 INTRODUCTIONAt its most fundamental level, the design process is a method of problem solving similar to scientific inquiry. Though it is rarely expressed in those terms, the nature of design problem solving—the positing of questions and application of responses to seek the best overall so-lution—closely resembles the preliminary questioning and hypothesis formulation steps inherent in scientific methodology. Each new design challenge poses a num-ber of questions, whether initiated by the client or the design team. Should the proposed solution address an aesthetic or functional deficiency with the previous de-sign? Does the design improve upon an already estab-lished typology or create a new one? Are there opera-tional or technological factors that influence the design response? The design process involves the creation of scenarios that determine which design concept is the best fit for the existing project constraints, the client’s or user’s concerns, the desired aesthetic or environmental enhancements and the economy of material and tech-nology. Having arrived at satisfactory answers to design questions such as these, testing the efficacy of those solutions represents a logical extension of the design process into the realm of scientific inquiry.
For a culture predisposed to consider scientific inquiry and design study as emerging from entirely different approaches and points-of-view, these avenues may seem antithetical. Historically, the creative process of design was perceived to be hindered by the goal of obtaining measurable results. Yet, creativity is just as applicable to the construct of quantifiable tests of a design’s functionality as it is to the design itself. The psychological response to architectural design is often described in terms more perceptual than quantifiable. It is a commonly held misconception that design pro-tocol proceeds, unlike hypothesis-based science, with the goal of unanticipated consequences. If asked, most designers would say they approach any design problem with the desire to provide both functional and aesthetic benefits, though these benefits often defy qualification or quantification. As the professional practice of archi-tectural, interior and landscape design (referred to here as “environmental design”) becomes increasingly spe-cialized by building type, there is a consequent push to create a published body of knowledge around the various highly-specialized or highly-technical building types. It is important to create schools where children learn well, offices that facilitate productive and stable workers, hospitals that contribute to healing and there

PERKINS+WILL RESEARCH JOURNAL / VOL 03.02
8
are resultant pressures to show that the resource com-mitments to these projects yield demonstrable results.
The term “Evidence Based Design” has come into par-lance to define a dialogue around the results of design inquiry. Evidence Based Design (EBD) can be defined simply as the application of research-based, quantifi-able metrics to design decisions. It can involve either consulting research studies before making design deci-sions or using a completed design to test a new hypoth-esis. Though applicable to many project types, the term has been applied most often to healthcare projects be-cause of the conceptual synergy with Evidence Based Medicine. Sackett, a pioneer in evidence-based medical practice, describes it as “the conscientious, explicit and judicious use of current best evidence in making deci-sions about the care of the individual patient…integrat-ing individual clinical expertise with the best available external clinical evidence from systematic research.”1 Similarly, Evidence Based Design requires viewing the built environment through a very rigorous lens, one that takes its methodology from scientific protocol. Though it is an approach to design validation with which most environmental designers feel uncomfortable, the pres-sure is increasing to contribute to this emerging body of knowledge. This urgency fuels hasty attempts at EBD studies, many of which only confuse the issue by mak-ing it difficult to find actionable data within a body of indecisive research. By applying scientific methodology to the questions that most designers can easily articu-late, a process can be mapped for translating a design question into a problem that lends itself to quantifiable study. Just as design itself is a methodology with dis-creet steps, designing a research project can be ap-proached in a similar manner.
2.0 METHODOLOGY AND FINDINGSTo illustrate the research design process, a published EBD study by an interdisciplinary team of an architect, medical director, researcher and nurse will be refer-enced. For specific details regarding the experimental protocols and findings, the reader is referred to the Journal of Perinatology papers on “Documenting the NICU Design Dilemma.”2, 3 In 2008, Perkins+Will and Cabell Huntington Hospital completed the design and construction of a new, single family room neonatal in-tensive care unit (NICU) to replace an existing multi-patient, open bay ward facility. Since both the hospital and the architectural firm were interested in exploring the efficacy of the new design, a study was initiated to test the impacts of building design on patient medical
progress, their parents and the attending NICU staff. The research team was assembled early to monitor all stages of the transition from the multi-patient ward, through the relocation and into occupancy of the new unit. Marshall University Institutional Review Board for Research with Human Subjects (IRB) approval was se-cured for the complete research protocol including all surveys and patient records access. Since the research team was multi-disciplinary, data were collected from a number of sources and examined from a variety of perspectives.
The first step in resolving either a design problem or a scientific problem is to determine its subjective or objec-tive nature. When thinking about the issues addressed by a design, it is useful to consider the most basic goals of the project and attempt to pose them as questions. Was there a specific client concern addressed by the project team? Did the design team approach the project with a proposed improvement to an existing condition or with a response to a previous project? It is more likely that many issues were being addressed at once: the complex nature of environmental design means that there are many agendas being balanced in the search for a favorable solution. Sometimes these agendas are at odds. Is the best design also the most economical solution? Can enhanced space and privacy coexist with efficiency and travel distance? Do existing conditions prevent the most ideal solution from prevailing? In the referenced study, the core question was twofold. When debating the investment in a larger, more expensive facility, would neonates have improved outcomes in a private room environment and would staff and parents demonstrably benefit from the new facility?
Once the problem has been stated, it must be analyzed as to the nature of the questions it provokes. Some questions lend themselves to quantifiable answers. In the case of healthcare projects, when one is dealing with an ailing patient population seeking treatment in a physical plant, one can ask “how much improvement occurred that could be attributed to the facility design?” or, “did the patient population improve more quickly in one design compared to another?” Numerical data can be collected to answer such objective questions. How-ever, it is also possible to ask, “how much more satisfied were the subjects with the new environment?”, “did patients or staff prefer one setting over another?” Even such questions exploring subjective perceptions can be assessed with a quantifiable tool, such as a survey questionnaire, that can define the perceived degree of preference. Just as human performance metrics, such as efficiency or stress levels, can be measured, so can

9
levels of perceived efficiency or stress. It is important to distinguish between measures of reality and perception, as both can be valid indicators of design performance. The referenced study allows for both. The investigators are able to collect realistic data regarding the physical outcomes of the neonates in two dramatically different NICU environments and they are able to ask parents and staff how they feel about the two contrasting en-vironments quantifying their perceptions with validity-tested questionnaires.
Scientific inquiry is founded on the fundamental prin-ciple of the repetition of experimentation in a controlled setting. The validity of scientific conclusions is based on achieving comparable results from an experimental design over numerous replicates. Studies of environ-mental design do not exist in a laboratory setting where an identical study can be easily repeated. That does not mean it is not important to recognize that any EBD study fits within a larger body of research and contributes to a research dialogue. It is important when applying EBD to a design problem to search the existing literature and to become familiar with similar studies that have been performed and published. More importantly, a literature search provides insight into structuring the problem statement. It can yield a better understanding of the subject population while providing a guide for structur-ing a similar study. This protocol allows new research to affirm or to refute prior findings, thus advancing the body of knowledge in the discipline.
Once the problem has been identified and a review of other studies undertaken, a hypothesis can be devel-oped. The hypothesis differs from the problem state-ment in that it defines the parameters to be tested. It is not a question, but a statement to be proven or dis-proven. If the hypothesis forms a subjective statement, it will lead to one kind of methodology for investigation. If it is an objective statement, it will dictate another. In the referenced NICU study, there were two hypotheses that resulted in two study designs, one subjective and one objective. The first hypothesis was that the parents of neonates would prefer a private room environment, but that clinicians would not. This hypothesis was de-rived from a literature search that revealed a predic-tion of different effects of single family rooms on the differently impacted NICU constituencies.4 Because this hypothesis was based purely on subjects’ percep-tions of their environment, it required survey question-naires to generate quantifiable data.5 The second study hypothesis was that neonates would progress more rapidly in their development and be discharged more quickly in a private room environment. Again, the lit-
erature suggested that a hygienic, quiet, private room with controllable lighting and parental bedside access would decrease neonate apnea, facilitate infant feeding tolerance and increase maternal breast milk production and breastfeeding success. These factors could lead to shortened patient length of stay, an outcome desirable to both families and hospital administration. Since the research team had secured prior approval for research with human subjects, they could access clinical prog-ress metrics and discharge times to collect the essential data for testing this hypothesis.
Hypotheses such as these are similar to what design-ers refer to as a “parti”. Though the parti defines the goal of the design study, it does not prescribe the pre-cise design solution. There could be many options for a design that could support a given parti, but one will be chosen for its sufficiency to balance the require-ments of the project. Similarly, in developing an EBD investigation, there may be several scenarios that could be constructed for testing a hypothesis, but one should emerge as the best case. In a subjective study, the scenario-testing problem is one of selecting survey questions that will yield valid responses. The design of a good questionnaire is not simply a matter of assembling a set of questions, as any of us who have confronted a vague or confusing survey can attest. A reliable survey is “validity tested” to ensure that there is little chance of poor phrasing yielding ambiguous results. If this route of investigation is chosen, a thorough literature search may yield a validity-tested set of questions that could be applied to the problem being addressed. If no simi-lar validity-tested survey tool can be located and per-mission secured for its use, it is advisable to consult a psychological or sociological researcher to assist in preparing a questionnaire together with any required disclaimers and anonymity statements.
Institutional Review Boards exist in research institu-tions as a means of protecting the health, welfare and privacy of human study subjects. Institutional Review Boards for Research with Human Subjects commonly have template forms detailing the measures required to ensure subject awareness, confidentiality and ano-nymity in a research protocol. Such templates can be adapted by prospective researchers to fit their unique situations. Whether collecting survey data or clinical metrics from human subjects, IRB approval will likely be required. Though protocol details will vary from one IRB to another, the approval process is likely to be time consuming and it should be undertaken as soon as a project prospectus is finalized. The IRB will need to ap-prove the study design, review the qualifications of the
A Design-Based Approach to Collecting Evidence

PERKINS+WILL RESEARCH JOURNAL / VOL 03.02
10
researchers and understand the types of information required and the methods for its collection. It is there-fore helpful and often necessary, to collaborate with a clinician or researcher associated with the institution in question who has the required credentials and can liai-son with the IRB. It is also important when dealing with data involving human subjects to work with a clinician or researcher who understands the study population in question and who can protect participants’ privacy and overall welfare.
In an objective study, in which data is collected about a subject population, particularly a patient population in a healthcare setting, the design of the investigation is even more critical. Many research studies err by casting too broad a net of study subjects. It is critical to examine the nature of the subject population to determine where the largest impact of the design intervention might be seen. To minimize statistical variability in the resultant data, it is best to focus on a sub-set of subjects who can best reflect the intervention. The neonate sub-ject population is an excellent example. Babies enter a neonatal intensive care unit with a variety of clinical diagnoses and likely outcomes. Sadly, a segment of that vulnerable patient population may be too critically ill to respond to any intervention. Another segment of the NICU population includes infants who have been admitted for minor post-natal complications that need short-term observation before being sent home. They are on the unit for far too little time to benefit from any design modifications. For these reasons, in the refer-enced study, the admitting neonatologist agreed to tri-age the study patients into five subgroups according to illness severity as defined by the Physician’s Estimate of Mortality Risk (PEMR).6 While the study recorded imminent mortality events (PEMR = 5), it limited the recording of patient progress to only the middle-scoring PEMR groups 2-4. This protocol provided test and con-trol populations that represented the majority of typical NICU admissions and that could best reflect resultant outcomes from time spent in each of the unit designs.
Though there are a variety of conditions in the built en-vironment from which data and research can be col-lected through quantifiable means, many EBD studies are focused on the impact of a design on human sub-jects and seek to describe the impact of a design fea-ture on a population of building users. Traditional scien-tific inquiry involves designing research studies around the observation of specifically selected variables while controlling as many other related variables as possible, meaning that all conditions affecting the experimental and control variables must be identical except for the
one being investigated. Adjusting one variable within a context of several constants provides an immediate indication of the effects of treatment and can often be a strong indication of a causal relationship. How-ever, such a strictly controlled experiment is difficult to achieve with multivariate human subjects and design environments. To further complicate the picture, a design solution by its very nature seeks to adjust or improve upon many environmental factors. This means any study design must contend with multiple variables. Therefore, rather than attempting to control or limit these environmental variables in the entire study population, the researcher must seek to limit the study to a smaller subgroup of subjects experiencing selected aspects of the design environment. If the characteristics of experimental and control subgroups can be more narrowly defined, a lesser degree of variability will be seen in the study population and a smaller sample size will be needed for statistical validity.
Understanding the nature of the study population and carefully documenting the demographic characteris-tics of its members also allows experimental and con-trol populations to be “pair matched.” Pair matching means that individuals can be paired with other similar individuals within test and control groups to determine the effects of a selected environmental modification on similar subject pools. The need for pair matching can impact the scope of data collection significantly by re-quiring an increased number of study participants to ensure that there are sufficiently large subject pools for statistical comparison. The NICU design study referenced here collected data on 240 neonates and showed dissimilar representation of PEMR groups 1 and 4 in the study groups. After pair matching accord-ing to gender, gestational age and PEMR category, only 170 subjects were available for comparison, but all PEMR categories were comparably represented in both experimental and control subgroups (Figure 1). Con-sequently, a number of the neonates on one unit did not have a similar pairing in the other facility and could not, therefore, be included in the sample. Some of the resultant study groups became so small that they could no longer be compared with statistical validity. PEMR 4 subjects, the highest acuity category in the study, had only six matched pairs and therefore no definitive con-clusions about comparative progress could be deter-mined for this subject group.
Unlike traditional laboratory research in which an ex-periment is designed so that it may, and should, be

11
repeated, research related to the built environment is often limited by time and resources to a single event. Construction of a new facility often means the demoli-tion or repurposing of an older facility that represented the baseline control conditions for the study. If valid comparisons are to be made, it may be necessary to proceed with the initial data collection in the existing facility while the new facility is being planned or con-structed. Software programs are available that can aid in analysis of data and in estimating sample size for a study investigation, but some preliminary data are re-quired to estimate the statistical variability from the pro-posed study groupsi.
Given the innate variability of human subjects, it is likely that a large number of subjects for both experimental and control groups will be required for statistical anal-ysis. Without the ability to perform a pilot study or to repeat an observation, as is common with laboratory ex-periments, it is advisable to err on the side of more data than less. Additionally, recording all possible demo-graphic information about the study population ensures that information, seemingly insignificant at the outset, will be available if needed when final analyses are per-formed. Information collected about clinical roles and prior experience proved critical in interpreting the data from healthcare staff and subject parents in the Cabell NICU study. A serendipitous correlation between facility preference and clinical role was seen with healthcare staff, which would have been impossible to determine retrospectively given the anonymous nature of the sur-vey (Figure 2). When using subjective study question-naires, it is also important to control for naïveté among study participants who may have experience with only one facility design and may be inherently biased for or against a given built environment. In the referenced study, transitional parents, those present over the re-location from the existing to the new facility and with experience in both unit designs, served as a control for naïve parents who had seen only one of the two designs (Figure 3).
Focusing on selected modifications to the environment and attempting conclusions related to the effects of such modifications may ignore other, equally significant variables. For the referenced NICU study, measure-ments of light levels, sound levels and indoor air quality were taken at varying distances from the entrances and nursing stations to ensure that the study could com-pletely and adequately describe the physical differenc-es between the older and newer environments. Showing that noise and light levels were better controlled in the private room NICU environment allowed researchers to reference other studies on the effects of noise and light cycling on neonatal development and to posit that improved outcomes were affected by the more con-trolled environment of private rooms. Though improved neonate progress and breastfeeding success could be demonstrated on the private room unit, a direct causal relationship could not be attributed (Figures 4 and 5). Similarly, research findings demonstrated convincing positive correlations between noise levels, airborne par-ticulates and CO2 levels with periods of heavy visitor and staff activity on the older, open bay unit. Excessive noise can distract healthcare staff, increasing the likelihood of errors while also disrupting sleep patterns of neonates and retarding their developmental progress. The con-sequences of excessive noise could increase lengths of stay and add to the costs of hospitalization.
In studies involving human subjects, outcomes could reflect the result of any one of several changed variables or some combination. In deriving conclusions from a completed study, it is important to state only the clearly verifiable results and to describe the controlled param-eters without attempting to address a causal relation-ship that may not be supported by the data or the study design. Including discussion of the possible reasons for study outcomes may, however, inspire or assist others who are planning similar studies or facility modifica-tions.
A Design-Based Approach to Collecting Evidence
[i] Systat Software, Inc., San Jose, CA. Retrieved on 11/2011 from www.sigmaplot.com

PERKINS+WILL RESEARCH JOURNAL / VOL 03.02
12
Figure 1: PEMR Distributions in NICU patient populations.
The advantage of pair matching study subjects was seen when examining critically the Physician’s Estimate of Mortality Risk (PEMR) triage distributions (Figure 1 above). Before pair matching, moderately ill (PEMR 1) and severely ill (PEMR 4) groups were disproportion-
ately represented in the test and control populations. Such disparities could have biased patient progress and length of stay metrics, introducing undesirable variabil-ity and obscuring statistical significance in final data analyses.

13
Figure 2: NICU Staff perceptions of physical facility.
Figure 3: Subject naïvete in parental survey data.
A Design-Based Approach to Collecting Evidence
Figure 2 above, compares NICU staff responses grouped by staff position demonstrating that prior ex-perience can bias perception. Physicians and nurse practitioners, more likely trained in private room situ-ations, showed preferences for healthcare delivery in the single family room facility. Nurses, more commonly trained in ward-type facilities, preferred an open bay fa-cility design. Nurses expressed concerns for adequacy of patient care and were apparently uncomfortable with dependence upon electronic monitoring and communi-cation in the private rooms. However, both staff groups appreciated the increased privacy, light control and noise reduction in the private rooms.
Figure 3 below, demonstrates that naïvete existed with-in parental survey data by comparing inexperienced parental responses, those with experience in only one of the two facility designs, with those from experienced, transitional parents who were present through the relo-cation and had seen both facility designs. Naïve parents saw differences only in lighting control, overall privacy and socialization opportunities with other parents. Ex-perienced parents generally preferred the private room environment in all instances except for socialization with other parents, a problem anticipated with isolating patients and their families in private rooms. It is remark-able that noise disturbance was perceived as a problem only when parents had experienced the quieter, private room environment.

PERKINS+WILL RESEARCH JOURNAL / VOL 03.02
14
Figure 4: PEMRs 2 and 3 patient progress.
Figure 5: Breastfeeding success.
Figure 4 above, demonstrates that neonates in private rooms showed fewer apnea events, nosocomial inci-dents and total parenteral nutrition (TPN) days than the open bay cohort. They transitioned earlier to enteral nutrition with shorter intervals to formula and mother’s breast milk (MBM) start.
Figure 5 below, shows that neonates in private rooms transitioned from total parenteral nutrition (TPN) to mother’s breast milk (MBM) earlier and more mater-nal-infant dyads were discharged breastfeeding. More mothers in private rooms sustained lactation beyond the immediate postpartum surge in milk production.

15
3.0 CONCLUSIONThe formulation and execution of a research study re-quires significant resources and time for designers and their clients. The extensive financial and manpower re-source requirements, combined with the one-chance nature of data collection, highlight the importance of careful and early experimental design. Creativity can be practiced in the construction of research studies to yield innovative solutions to the design-related chal-lenges of the built environment. The subjective nature of the design process and the multivariate nature of hu-man subjects and environments require researchers to be creative in structuring investigations and cautious in assuming causal relationships. Nevertheless, it is im-portant to accumulate a body of research pertaining to the built environment from as many different investiga-tive sources as possible. The more valid and creative studies that can be performed, the more credence is added to the design decision-making process, all the while documenting the benefits of professional inter-vention in the spaces that structure much of our lives.
AcknowledgmentsThe authors would like to express appreciation for the efforts of the staff and leadership of the Cabell Hun-tington Hospital NICU, particularly Renee Domanico, MD, and Fina Coleman, BSRN, for their data collection and co-authorship of the referenced EBD study. Jeff Tyner, AIA, continues to provide tremendous support to the ongoing EBD research within the Atlanta office of Perkins+Will.
REFERENCES[1] Sackett, D.; Rosenberg, W., Gray, J., Haynes, R., and Richardson, W., (1996). “Evidence-Based Medi-cine - What It Is and What It Isn’t”, British Medical Jour-nal, Vol. 312, No. 7023, pp 71-72.
[2] Domanico, R., Davis, D., Coleman, F., and Davis, B., Jr., (2010). “Documenting the NICU Design Dilem-ma: Parent and Staff Perceptions of Open Ward versus Single Family Rooms”, Journal of Perinatology, Vol. 30, No. 5, pp 343-351.
[3] Domanico, R., Davis, D., Coleman, F., and Davis, B., Jr., (2011). “Documenting the NICU design dilemma: comparative patient progress in open-ward and single family room units”, Journal of Perinatology, Vol. 31, pp 281-288.
[4] White, R., (2003). “Individual Rooms in the NICU—an Evolving Concept”, Journal of Perinatology, Vol. 23, Suppl. 1, pp S22-S24.
[5] Miles, M., Carlson, J., & Brunson, S., (1998). The Nurse Patient Support Tool (NPST), Report, Retrieved on 5/2005 from http://nursing.unc.edu/crci/instru-ments/npst/pempst.htm.
[6] Gray, J., Richardson, D., McCormick, M., Workman-Daniels, K., and Goldman, D., (1992). “Neonatal Ther-apeutic Intervention Scoring System: A Therapy Based Severity-of-Illness Index”, Pediatrics. Vol. 90, No. 4, pp 561-567.
A Design-Based Approach to Collecting Evidence

PERKINS+WILL RESEARCH JOURNAL / VOL 03.02
16
02.uPOD: A MODULAR LIVING ENVIRONMENT FOR STUDENTS: The Case for Today’s Community
ABSTRACTInstitutions have prioritized the development of new residence halls that respond to incoming student classes who expect more privacy, social space, technology and fewer boundaries than any previous generation. To ad-dress the difference between student expectations with the current built norm, we have envisioned a new living model that can be implemented in new or existing structures, challenging preconceived notions by creating a flexible and transformable living environment for students. In this space, privacy and communal lines can be easily blurred and re-formed to suit students’ group and individual needs. It is a repositionable modular system of parts and reinterpreting the essential program of needs in residential life: a place to socialize, study, store belongings and sleep.
KEYWORDS: mobility, flexibility, modularity, loft-style living, Living-Learning communities, plug-ability, com-pactness
Dana Anderson, AIA, NCARB, LEED AP, [email protected]
Yanel de Angel Salas, AIA, NCARB, LEED AP, [email protected]
Austin Poe, [email protected]
1.0 INTRODUCTIONLife on college and university campuses in the 21st cen-tury will be influenced by an integrally connected global community, increased advances in personal technolo-gies and less separation between living and learning environments in higher education as the current trends indicate. Students are embracing a mobile lifestyle. Single digital devices contain much of what yesterday’s students would store in bookcases, desktop comput-ers and backpacks; all which required a great deal of space and limited mobility. Current residence halls are very static, composed of a uniform grouping of rooms. This rigid layout not only requires significant energy to reconfigure, but also decreases the opportunity for a student to shape their personal and community space. It is our premise that the next generation of students will be searching for a more flexible and reconfigurable environment that allows for personal adaptation. Our investigation into a new mobile and transformable liv-ing environment challenges the current student living norms. We recognize that educational institutions of-ten prefer to provide a variety of living experiences and that this flexible living environment may have specific
applications. One example is to apply the concept to Living-Learning programs, where key advantages re-late to programmatic and spatial flexibility and swing beds for peaks in student enrollment growth. Another implementation relates to institutions that have adaptive reuse projects with minimal investments to the exist-ing structure. A third application is to institutions that are committed to pushing the concept of living envi-ronments to gain broader diversity in their residential portfolio.
This investigation tests the boundaries of current stu-dent living situations in college and university housing by creating an environment with no traditional fixed-wall boundaries for bedrooms, study or lounge space within suites or apartments. It envisions a true loft-style living. We are proposing a personal living unit, the uPOD, that can be moved to combine or separate small student communities in order to share common interest or spe-cial friendships. In this new living style, a student may decide to move within the floor of the building or to an-other building taking their desk, bed, bookcase, dresser and technology with him or her by disconnecting from his current community, a true 21st century student no-

uPOD A Modular Living Environment for Students
17
mad, forming communities, breaking away, then re-forming new communities (Figure 1).
The following investigation looks to the future of the uPOD lifestyle and how the next generation of students may re-invent student housing in the 21st century.
1.1 Project DescriptionSince the 1960s, architectural history and theory have featured the emergence of pod-like architecture: cap-sule-like designs with individual controls for comfort and entertainment. These capsules were not flexible or reconfigurable, but static. We have taken the concept of pod architecture further and applied it to a new stu-dent residential living style. We envision a modular sys-tem of parts that form a pod-like space, which can be adaptable, reusable, flexible and mobile. Within a fixed space, a student could use the uPOD system to cre-ate and edit his or her space at will. Roommates could manipulate the uPOD so that one sleeps while the other hosts a study group and then rearrange it again to ac-commodate a movie night with other students on their floor.
Inherent in the flexibility and potential of an “open plan” is the technical solution of visual and acoustical privacy. We have explored privacy needs by developing archi-tectural and acoustical strategies that delineate degrees of visual and aural privacy. For example, a variety of open and enclosed spatial configurations may be pos-sible through uPOD parts that slide, fold, collapse or swivel. Gauging the success of these configurations de-pends largely on understanding the acoustical proper-ties of the material and geometry. The research process questioned preconceived threshold conditions between spaces, reconsidering the traditional programmatic ele-ments common to bedrooms versus living rooms, and bathrooms versus kitchens.
Concepts that integrate technology in the uPODs were carefully studied with consulting experts framing sev-eral key issues. Should computer monitors or television screens be embedded in folding panels? Can energy-efficient equipment be used? Can light fixtures be fold-ed or reconfigured to accommodate a refolded wall that splits a dining room into a study carrel and a TV lounge? Where can electrical and data outlets be integrated and to what degree could lighting, sound and media be accessed wirelessly? Preliminary material finishes considered sustainability, performance, durability and capacity to absorb or reflect sound. Ideas regarding the acoustic properties of the uPOD geometry, arrangement within the loft and potential materials were conceived in consultation with Acentech. Life safety concerns were addressed by Rolf Jensen & Associates, Fire Protection consultants. Conclusions on materials, their acousti-cal performance and fire protection strategies are still in development, but preliminary recommendations are presented in this article.
2.0 A FLEXIBLE LIFESTYLETraditionally, residence halls provide defined and in-flexible boundaries between spaces. Students live, work and socialize within the spatial limitations of their rooms, their halls and their study lounges. Even the most recent residence hall models advertise a “new” living style, but often deliver a traditional dormitory that is simply augmented with additional communal spaces. We believe a loft space will allow for maximum flexibility. This concept is applicable to adaptive reuse projects such as urban warehouses, office spaces and cam-pus classroom buildings. This new living environment also lends itself to Living-Learning communities where academic or student-interest programs and initiatives necessitate diverse spatial reconfigurations. In addition to these strategies, an open loft approach pushes the boundaries for a more sustainable vision, as it requires
Figure 1: uPOD initial study model of deployment and possible spatial arrangements.

PERKINS+WILL RESEARCH JOURNAL / VOL 03.02
18
minimal wall partitions and less construction material. The focus on sustainability has great importance that aligns with a shift in how the next generations live and shape their environment through a sustainable lens.
We studied nomadic living and the importance of the ability for individuals to break away and re-form commu-nities. Throughout history, shelter for nomadic commu-nities has been designed to accommodate the regional climate and to use local materials. These materials are assembled in very specific ways in order to maximize comfort and survival. The ability to dismantle and move these structures greatly depends on the weight and size of their parts. In some cases, a modular-based shelter is constructed then abandoned after a season of hunting as in the case of the igloo structures on Igloolik Island, Nunavut, Canada1. In other cases, shelters are decon-structed and taken along when the community moves on. For these nomadic communities (including those in Kenya, Ethiopia and Somalia), lightweight mobility is important as they depend on camels and donkeys to transport the deconstructed shelter parts. A flexible lifestyle permits change and provides adaptability on demand. Today, this lightweight mobility is possible with the technological advances that allow built components to be more compact.
Modern temporary shelters were studied to better di-agnose their typical characteristics of compactness, minimalism and space optimization. The material selec-tion for temporary shelters depends on many aspects including durability, weight, transportability, sustain-ability and programmatic purpose. Examples that were investigated included campers, boats, eco pods built by architecture students, shipping containers, the now-demolished Capsule Hotel, the 1960’s Archigram explo-rations, a Yurt with photovoltaic panels and the Dubai Airport Sleep Box serving transient visitors. In studying each of these precedents, we researched strategies that address ventilation, electricity and water needs. While these strategies vary depending on mobility, many in-volve a plug approach where the shelter can move and be plugged into designed server hubs. The plug-ability concept became a key part of our uPOD vision.
2.1 Student Life TrendsResidence halls have seen a slow, steady plan evolution despite the rapid evolution of students’ expectations and needs. No longer referred to as “dormitories”, the nature of residence halls has changed in the ameni-ties they provide, the residential image expected by stu-dents (similar to what they experienced at homes) and the fact that schools use them as marketing for recruit-ing studentsi.
In the 1950s, there was an increase in the construction of dormitories in campuses across the country, which has provided the framework infrastructure for much of the living environments. The plan configuration of these traditional dormitories mainly included a series of bed-rooms on a double-loaded corridor, most likely double- or triple-occupancy with community bathrooms and little to no social spaces for the community. There were, of course, exceptions to this format. For example, MIT’s Baker House (1946) by architect Alvar Aalto created an undulating, single-loaded floor plan with 43 bed-rooms and 22 different room shapes that overlooked the Charles River. The building was characterized by a variety of public spaces for students to study, lounge and dine. The single loaded corridor was designed with a generous width where the community could formally and informally interact.
More recent traditional plan residence hall models in-clude semi-suites (double-occupancy bedrooms shar-ing one bathroom), a series of single bedrooms sharing bathrooms and living rooms or combinations of both. There has also been an emphasis on providing more community spaces for different levels of interaction: in-crease of study spaces and lounges per floor and more robust community programs at ground level. Double height spaces or vertical connections between floors are also valued as successful strategies to bring part of the see-and-be-seen concepts in student centers di-rectly into the residential communities. For example, at MIT’s Simmons Hall (2001) by architect Steven Hall, vertical connectivity among floors was designed to fos-ter interaction between students and create a sense of community.
[i] Residence halls have become a recruitment tool, here are two examples of how institutions deal with students and parents demands: 1) This fall St. Mary’s College of Maryland placed students in a cruise ship while they renovate a sick Residence Hall (“Moldy Dorms Ship Students Off to Sea”, de Vise, Daniel, Washington Post report, Retrieved on 10/26/2011 from http://www.washingtonpost.com/local/education/mold-plagued-st-marys-college-students-to-live-on-cruise-ship/2011/10/26/gIQAMC-N3JM_story.html), 2) A private company in Denver operates The Regency Student Housing Community, offering students with Resort style amenities while providing a Residential Hall experience (Retrieved on 10/27/2001 from http://www.regencystud-enthousing.com).

19
Figure 4: Examples of spatial configurations.
Figure 2: uPOD compacted and deployed. Figure 3: uPOD’s rings are programmed from more public activities to more private activities.
uPOD A Modular Living Environment for Students

PERKINS+WILL RESEARCH JOURNAL / VOL 03.02
20
In general, the traditional plan is not adaptable to changes in program and does not allow for versatility in spatial arrangement. Technological advancements have shifted the way in which students interact and col-laborate to study and share information. But, the basic needs of the individual remain constant: privacy, secu-rity and a pleasant living space. As a response to these student interaction shifts, the flexible living environment of the uPOD focuses on the pod’s modular form and spatial flexibility and possible configurations including the parts’ positions and mobility. The key programmat-ic elements are also considered: a place to socialize, study, store belongings and sleep.
2.2 The uPODWhat if the concept of a residence hall is transformed and the student’s room is a uPOD on wheels that can easily be transported through a door (Figure 2)? We are proposing a compact living unit that transforms into a loft style space, resulting in a single occupancy room of about 90 square feet when fully deployed. The unit is composed of four rings of framed spaces that ex-pand and become a living uPOD. The uPOD can de-ploy beyond its enclosed configuration, extending the living space. Each of the four rings of the uPOD is pro-grammed from more public activities to more private activities (Figure 3): 1. Ring 1: Social Interaction Characteristics: This ring provides a translucent piv-
oting door that doubles as a writable surface. A pivoting translucent table or work surface allows communal studying or meeting with friends.
2. Ring 2: Individual Study Characteristics: This ring provides a desk surface
and a shelf that folds down, but can also be kept unfolded for more floor area.
3. Ring 3: Personal Belongings Characteristics: This ring provides a demountable
tube that can be used as a closet hanging rod or a privacy curtain. Mirror surfaces and shelves act as a vanity or a dressing area.
4. Ring 4: Sleeping / Relaxing Characteristics: This ring provides a low bed position
that can be used as a sofa and a high bed position that allows for more closet space below the bed platform.
The direct application for directors of residence life at colleges and universities would be to assign each stu-dent a uPOD for the duration of the academic year. On move-in day, uPODs are moved into an open plan space where students arrange them adjoining other uP-ODs to form suites of small communities following dif-ferent organizational patterns (Figure 4). The uPOD is then plugged into the ceiling or floor for power and data. This process is as follows:1. Step 1 Move-in: Wheel the uPOD to the pre-assigned
location, lock it in and plug it into electrical, data and mechanical connections.
2. Step 2 Expand: Expand each segment of the uPOD into a defined area, a habitable space.
3. Step 3 Deploy: Create community by deploying the box in a variety of spatial arrangements.
2.3 Traditional Plan vs. uPOD PlanA community of 40 students at a floor level was studied, comparing a traditional residential hall with private bed-rooms with an open loft space without walls (Figure 5). The study maintained the same floor plan dimensions (50’ x 200’), but the loft version assumed egress stairs occurred outside of the space assumed for the uPODs. The purpose of the comparison was to prove that by
Figure 5: Case study comparison for a population of 40 students in a traditional dormitory versus a loft community with uPODs.
TRADITIONAL DORMITORY: 40 STUDENTS IN SINGLE BEDROOMS CASE STUDY: 40 STUDENTS IN A LOFT COMMUNITY

21
uPOD A Modular Living Environment for Students
Figure 6: Sectional perspective illustrating private living spaces.
Figure 9: View of community lounges and study areas.
Figure 7: Conceptual model photo illustrating scale and interior amenities.
Figure 8: View of community kitchen/lounge area.

PERKINS+WILL RESEARCH JOURNAL / VOL 03.02
22
removing the rigid walls of a typical residential floor, greater flexibility would be achieved for uPODs to be arranged in a variety of configurations (Figure 6). The amount of required area of a typical single bedroom oc-cupancy and the uPOD is comparable, about 90 net square feet. However, more tangible differences are the uPOD’s mobility, the interior components’ versatility and the ability to reconfigure interior and exterior community space (Figure 7).
In this comparison, the wet cores for both bathrooms (WC) and kitchens (K) are maintained as defined in separate volumes. The main difference is that in a tradi-tional residence hall the wet cores are enclosed rooms, but, in the loft style community, kitchens are open spaces envisioned as social magnets (Figure 8). In the uPOD, the bathroom cores are located in such a way that the floor can be zoned into smaller communities, creating community lounges and study areas (Figure 9).
2.4 Living-Learning Communities Case StudiesA Living-Learning community is a group of students who share common interests and live together. In higher education institutions, these groups usually form around an academic interest. Students in these com-munities strive academically because of the sense of membership, personal connections and the educational events that extend the learning experience outside the classroom2. This Living-Learning model takes different shapes depending on the institution’s goals, the space available (existing or new) and the curricular connec-tions to the program. Following are four case studies offering very different accommodations for Living-Learn-ing communities.
University of Tennessee at Chattanooga, Chattanooga, Tennessee (2011) – Through a housing master plan process, Living-Learning communities were developed as part of the future vision for existing and new residence halls. The existing condition option considered a minimal retrofit of two existing residence halls. These residence halls currently have inefficient space usage mostly through classrooms, meetings rooms, lounge, activity room and a community kitchen (Figure 10). When considering new residence halls with Living-Learning communities, the design concept was based on a semi-suite configu-ration with a centralized project room and lounge/kitch-en area (Figure 11). Within each concept, students will be able to receive faculty visits for informal discussion.
Roger William University, Bristol, Rhode Island (2009) – Designed to accommodate a mix of seven suite and apartment types, one of the project goals was to expand the Living-
Learning communities on campus. One of the seven residential units was purposely designed as a 10-per-son suite for these Living-Learning groups (Figure 12). The Living-Learning program on campus is based on student interest groups that are formed for a semester or longer. Within the suite, the large living room is also used as a project room.
Appalachian State University, Boone, North Carolina (2012) – The Living-Learning community is programmed for honor students and is integrated with academic space. The classrooms and offices are in a 3-story L-shaped build-ing, forming the south and east sides of the exterior courtyard. This courtyard provides the focal point of the project development focusing living and learning on a common platform. The lower level contains a series of classrooms and lounges that connect to the outdoor space (Figure 13). The upper levels of the Living-Learn-ing housing are organized in semi-suites (36 students per level) with central and corner lounges.
Bridgewater State University, Bridgewater, Massachusetts (2013) – The 500-bed residence hall integrates an exterior courtyard between Living-Learning communities and 4-bed and 6-bed student suites (Figures 14 and 15). To further physically differentiate the Living-Learning com-munities, they are dynamically expressed on the exte-rior façade with projecting project rooms that represent the core learning spaces. Three students share a semi-suite configuration and groups of 12 students share two types of shared spaces. One of those shared spaces is the project room, the other is a common area within the public corridor. By having these shared spaces, the design intent is to promote cross-pollination within the Living-Learning community. The Living-Learning com-munities are designed along single-loaded corridors to create internal transparency on the courtyard side of the building.
uPOD Living-Learning - Several specific, organizational pat-terns were studied for Living-Learning communities at the scale of a floor community: circular, bar, linear, circular hybrid, loop and village. These patterns illus-trate spatial arrangements where students may choose to live for specific collaborative learning experiences. Living-Learning communities of 14 students may share a smaller floor plate or suite loft:1. Circular plan (Figure 16) is based on two circular
spaces formed by seven students, each sharing a common kitchen area and two bathroom cores.
2. Circular hybrid plan (Figure 17) is based on a mod-ification to the circular plan, illustrating how two smaller circular groups could be rearranged into a single unifying space.

23
Figure 10: Lower and ground level of a Living-Learning study consisting of minimal retrofits in two existing residence halls, University of Tennessee at Chattanooga, Chattanooga, Tennessee, Housing Master Plan (2011).
Figure 14: Typical floor plan and community/population diagram of the Living-Learning wing illustrating ratio of students per Living-Learning suite as project rooms shift along the single loaded corridor, new residence hall at Bridgewater State University, Bridgewater, Massachusetts (2013).
uPOD A Modular Living Environment for Students
Figure 11: Plan study for a new Living-Learning community, University of Tennessee at Chattanooga, Chattanooga, Tennessee, Housing Master Plan (2011).
Figure 12: A 10-person Living-Learning suite at the North Campus Residence Hall, Roger Williams University, Bristol, Rhode Island (2009).
Figure 13: Ground and typical plan of the Honor’s Living-Learn-ing community at Appalachian State University, Boone, North Carolina (2012).

PERKINS+WILL RESEARCH JOURNAL / VOL 03.02
24
Figure 15: Interior and exterior views of the Living-Learning project rooms in the new residence hall at Bridgewater State Univer-sity, Bridgewater, Massachusetts (2013).
Figure 18: Village organization pattern of a uPOD Living-Learn-ing community.
Figure 16: Circular organization pattern of a uPOD Living-Learning community.
Figure 17: Circular-hybrid organization pattern of a uPOD Living-Learning community.
3. Village plan (Figure 18) is based on an ad-hoc or organic organization of linked boxes with perim-eter kitchen and bathroom cores. This approach suggests two types of informal community spaces that are captured between the boxes or “winding streets.” Others are located in front of the kitchen and bathroom areas.
2.5 Materials and Construction Technology: Concept DevelopmentA series of strategies are being studied for the uPOD materiality and construction. The design vision is one of simplicity and clean lines where “less is more” and tec-tonics follow a pragmatic, yet minimal approach (Figure 19).
Materials: Sustainable principles are one of the main driv-ers in material research and important factors include low carbon, recyclability potential and post-consumer recycled content. Honeycomb wood and wood lami-nates, formed plastic and fiberglass have been studied due to their thin, strong characteristics. The core mate-rial for the uPOD must be lightweight and the exterior material needs to be durable.
Structural Stability: The ring segments of the uPOD will be stabilized with bracing members. The most stable rings are 1 and 4 (see section 2.2). Inner rings 2 and 3 have a top horizontal bracing member at one side. Since the rings are relatively thin (1.5 to 3in.) interior reinforce-ment will be required. Attention to corner connections will allow seamless transitions with imbedded structural reinforcing angles.
Compactness and Versatility: Ring 2 contains a desk with book shelves; Ring 3 contains a vanity with storage shelves. Foldable and thin shelving systems have been

25
Figure 19: Exploded perspective of the uPOD illustrating material and construction strategies.
uPOD A Modular Living Environment for Students
studied for these inner rings to provide an “accordion” movement, or a “Russian doll” effect. When the uPOD is fully compacted or deployed, the interior surfaces must be free of protruding elements. In general, col-lapsible and retractable elements are important for space optimization and programmatic versatility. Mini-mal moving elements and ease in handling the parts is also important for user durability.
Mobility: The integration of lightweight materials, de-mountability, size and compactness facilitate mobility. Transporting the uPOD in its most compact form will require retractable wheels, such as wheel mechanics of an ambulance stretcher. Once in place, ball bearing sliders technology coupled with felt strips will allow each ring to telescope easily.
Deployment: The telescoping concept described above provides ultimate flexibility once the independent rings can be configured in different and purposeful spatial configurations. When the uPOD is deployed as an en-closed room there is complete security through the en-try door and with the ring’s side edges that have an in-terior locking mechanism. When the uPOD is deployed beyond the room configuration the sense of security is compromised to an extent because the ceiling is open. On the sides, a strong privacy stretch fabric can be un-rolled and locked into the ring edges.
Ergonomics: Human proportions, comfort and ADA acces-sibility were analyzed and incorporated into the design. The weight of the moving parts considered unfolding, pivoting, moving and lifting actions. Transition strips can
12
3
4
5
7
9
9
10
11
12
13
14
15
16
86
1 Lighting Control2 Temperature/Sound Control3 Translucent Wall Partition/Desk4 Translucent Door5 ADA Transition Strip6 Lightweight Privacy Stretched Screen7 Edge Hinges/Locking Mechanism8 Lightweight/Foldable Bookshelf System9 Retractable Task Light10 Desk11 Structural Bracing12 Vanity Mirror13 Lightweight/Foldable Vanity Shelf System14 Storage Drawers15 Bed16 Sliding Windows

PERKINS+WILL RESEARCH JOURNAL / VOL 03.02
26
be incorporated into the uPOD entry door and in other floor transition edges. The interior of the uPOD room has more than five feet of a free radius. The design and location of task lights, thermostats, light and white noise controls are ergonomic and ADA compliant. In terms of life safety, strobe lights could be incorporated in the uPOD for the hearing impaired.
2.6 Acoustics, MEP Systems and Life Safety ConsiderationsDegrees of physical and acoustical privacy were studied with a single-occupancy uPOD configurationii. Varia-tions of privacy levels are illustrated in Figure 20 and are based on order of magnitude, ranging from most private to most public. The most private spatial configuration provides the most acoustical separation. On the op-posite side of the spectrum, the most open and public spatial configuration provides the least acoustical value. Strategies studied and considered for sound attenu-ation included a partial stretched fabric on top of the uPOD. The fabric can be backed with a solid material with sound masking qualities. For added visual privacy on the sides of the unit, a lightweight privacy stretched fabric can be used when the uPOD is deployed. Other sound attenuation techniques include a flexible gasket along the upper seams to prevent high sound trans-mission when the uPod is in enclosed configuration. A sound masking device would give the user the ability to control volume/intensity to mitigate noise levels from the loft environment.
Integration of mechanical, electrical and plumbing sys-tems were studied in two different scenarios, both as-suming the uPOD is located within a loft space where HVAC, sprinklers and general lighting are provided for the overall space. Both scenarios also assume that the uPOD has integrated energy efficient lighting; tempera-ture, lighting and sound controls; and smoke detectors. The loft space will be equipped with infrastructure sys-tem hook-ups arranged in a grid pattern (both in the ground and ceiling). UPODs can be stationed at any of these points.
A “Flush Floor” scenario (Figure 21) would have a flex-ible mechanical duct and sprinkler hose line feed from the main branches on the ceiling. In this scenario a cer-tified professional would have to connect the sprinkler and mechanical lines, which might reduce the possi-bility of moving the uPOD frequently. However, direct sprinkler line connections will likely be required only when the uPOD is in its compact, enclosed form. If the uPOD is fully deployed with each ring separated, the overall sprinkler system of the loft space is sufficient for fire suppressioniii. The uPOD can be plugged into elec-trical and data outlets located on the floor.
A “Raised Floor” scenario (Figure 21) will not require mechanical lines coming from the ceiling, instead the air will be supplied from a raised floor. The uPOD floor surface will have a floor diffuser. To get air circulating in-side the uPOD, users can align the location of the raised floor diffusers with the uPOD diffuser. In this scenario,
[ii] Acoustical strategies were discussed with Rose Mary Su from Acentech Inc., acoustic consultants, http://www.acentech.com/[iii] When the uPOD is in its enclosed position forming a room, life safety, mechanical and electrical strategies need to be compli-ant with all codes that apply to a bedroom design. When the uPOD is deployed in space, since each ring is less than 4’ wide, the ceiling sprinkler system might be sufficient.
Figure 20: Diagram illustrating degrees of acoustical and physical privacy depending of spatial arrangement of the uPOD’s rings.
DEGREES OF PRIVACY< High
Physical
Acoustical
More Private - More Quite Less Private - Less Quite
DEGREES OF PRIVACY
Low >

27
Figure 21: Illustration of the uPOD room as flush and raised floor scenarios with systems interaction.
uPOD A Modular Living Environment for Students
1
2 3
4
5
17
68
9
11
12
13
14
15
21
20
18
19
16
10
7
17
16
1 HVAC Ducts2 Sprinkler System3 Sprinkler Hose Connection to Pod4 Air Diffuser5 Overhead Lighting6 Integrated Lighting7 Smoke Detector8 Sound Barrier9 Lighting Control10 Temperature/Sound Control11 Translucent Wall Partition/Desk12 ADA Transition Strip13 Desk14 Task Light15 Lightweight/Foldable Shelf System16 Vanity Mirror17 Structural Bracing18 Bed19 Storage20 Sliding Window21 Electrical Connection
1
2
3
45
18
68
9
11
12
13
3
14
15
21
2220
19
16
17
10
7
18
6
111117111
1 HVAC Ducts2 Sprinkler System3 Air Diffuser4 Overhead Lighting5 70% Perforated Ceiling6 Integrated Lighting7 Smoke Detector8 Sound Barrier9 Lighting Control10 Temperature/Sound Control11 Translucent Wall Partition/Desk12 ADA Transition Strip13 Raised Floor System14 Desk15 Task Light16 Lightweight/Foldable Shelf System17 Vanity Mirror18 Structural Bracing19 Bed20 Storage21 Sliding Window22 Electrical Connection

PERKINS+WILL RESEARCH JOURNAL / VOL 03.02
28
direct sprinkler hose feeds are not required if the uPOD ceiling is 70% perforated as per NFPA 13iv. Electrical and data outlets will also be accessible from the raised floor. This scenario liberates the uPOD from mechanical duct and sprinkler connections and maximizes mobility on demand making it truly mobile. Acoustical perfor-mance might be compromised due to the open ceiling, but sound masking devices might mitigate noise con-cerns.
Fire suppression and related life safety issues were studied for the uPOD as an individual unit and for floor communitiesv. Unobstructed fire egress paths would need to be maintained in floor communities. The en-forcement of clear egress paths in larger loft spaces or floor plates can be partially solved by establishing clear demarcation paths with either low wall partitions or other elements. Enforcing maximum occupancy load for large spaces will be necessary to ensure that the assembly use group will not change within floor plates, particularly given the possibility that students could re-locate all of the uPODs on a floor to a central location. This concern has the greatest life safety issues.
3.0 CONCLUSION: VISION FOR THE NEXT GENERATIONStudents share many essential needs, physical and so-cial, despite specific generational characteristics. Resi-dence halls have been able to fulfill those basic needs through evolution of units within fixed walls and the creative programming. However, the true challenge with future developments will be the ability to create spaces that have enough flexibility to evolve with future genera-tions. Institutions have already housed the Millennials (born between 1981-1991), the generation character-ized as tenacious and tech-savvy multi-taskers. What does this mean for our current generation?3 The lessons learned from Millenials will be applied and advanced as we think about this next generation – and beyond to the Digital Natives (born between 2000-2009), who are connected, consumer-oriented, globalized and more instant minded. Evolving technologies will allow small, compact, mobile living with a focus on sustainable ma-terials and reducing our carbon footprint, this is the vi-sion of the uPOD.
ACKNOWLEDGMENTSThe authors would like to acknowledge several people who contributed to the project at various stages. From the Perkins+Will Boston office: David Damon, Higher Education Market Sector Leader, for his constructive criticism and proof reading this article; Jeff Lewis, Tech-nical Director, for his input on constructability, materials and technical solutions; designer Ed Dudley for creat-ing two beautiful illustrations (Figures 19 and 21); and architect Patrick Cunningham for insightful critiques at key moments of development. We also like to ac-knowledge two key research resources: Rose Mary Su, Acoustical consultant at Acentech and Ron Melucci, Fire Protection consultant at Rolf Jensen & Associates. Finally, we would like to thank Tony Montefusco, Ex-ecutive Director of University Housing Operations and Planning from Roger Williams University, for providing practical advice and Living-Learning application ideas.
REFERENCES[1] Oliver, P., (2003). Dwellings, New York, NY: Phaidon Press Inc.
[2] Bonk, C., Wisher, R., and Nigrelli, M., (2004). “Learning Communities, Communities of Practices: Principles, Technologies and Examples”, Learning to Collaborate, Collaborating to Learn, in Littlton, K., Miell, D., and Fanlkner, D., eds., Hauppange, NY: Nova Sci-ence Publishers, Inc.
[3] Pew Research Center, Pew Social & Demographic Trends, (2010), “Millennials: Confident. Connected. Open to Change”, Report, Retrieved on 09/2010 from http://pewsocialtrends.org/2010/02/24/millennials-con-fident-connected-open-to-change/
[v] Fire protection and life safety issues were consulted with Ron Melucci from Rolf Jensen & Associates.[iv] NFPA 13: Standard for the Installation of Sprinkler Systems, current edition 2010 from National Fire Protection Association.

29
The Information Content of BIM
03.THE INFORMATION CONTENT OF BIM: An Information Theory Analysis of Building Information Model (BIM) ContentMario Guttman, AIA, LEED AP, [email protected]
ABSTRACTThe application of general information theory to pragmatic problems within the architecture, engineering, con-struction, owner and operator (AECOO) industry is explored in this article. Some basic principles about the nature of information and how it provides value are defined and applied to current issues in the use of building informa-tion modeling (BIM) and integrated project delivery (IPD) in design and construction. The analysis exposes some common misconceptions that have led to unsatisfactory results and tensions within the industry. It concludes that the general principles of information theory are applicable to BIM and that this approach will enhance the way BIM and IPD are discussed. Some ways of improving project outcomes by basing decisions on a more rigorous theoretical basis are suggested.
KEYWORDS: cost, value, model-based design, documentation, practice
1.0 INTRODUCTION The architecture-engineering-construction-owner-oper-ator (AECOO) industry is undergoing a process transfor-mation that is generally discussed in terms of building information modeling (BIM) and integrated project de-livery (IPD). While there is little doubt that this change is both positive and of historic magnitude, this article looks critically at some aspects of it. This criticism is not based in nostalgia for old methods or reactionary objec-tions to new ones. Rather, it comes from the author’s conviction that this kind of transformation requires de-tailed development grounded in critical thinking even more than it requires visionary thinking.
For example, the mission of the mid-twentieth century to put a man on the moon was not a new idea and it was not achieved through seminars on the desirability of the journey. Instead, it entailed engineering, espe-cially about the many ways in which the mission could fail. Likewise, the notions of BIM are not a recent in-vention: Engelbart’s Augmenting Human Intellect: A Conceptual Framework, outlined the basic principles of BIM and with amazingly prescient detail in 19621. What has changed between then and now has not been the vision, but the technological capabilities of the com-puter industry; and these are the result of disciplined development more than philosophical refinement of the objectives.
It is in that spirit that this analysis examines some par-ticular aspects of current BIM and IPD practice. The purpose is not to indict these innovations, but to ac-knowledge them as necessary and inevitable improve-ments to the industry and to understand how to better manage the factors that make them valuable.
While the topics of BIM and IPD often appear together, they actually do not address exactly the same kind of process change. BIM is a technology innovation that enables a better way of working and design documen-tation while IPD defines a legal and contractual con-text in which this work takes place. Moreover, these are complex topics that are not consistently defined within the industry and that, even when taken together, do not represent the full extent of the information topics that are relevant to this industry. For these reasons, the con-text of this paper is defined as follows:• The discussion is limited to the AECOO industry
and generally refers to buildings as distinguished from civil engineering, landscape architecture and other kinds of construction.
• It is assumed that the larger team (including the owner, architect, design consultants, builder and sub-contractors) are facile with using BIM and committed to a BIM-based work process. In this context, BIM means a set of 3-D object-based models including non-geometric data, which is ca-

30
PERKINS+WILL RESEARCH JOURNAL / VOL 03.02
pable of representing all aspects of how the build-ing will be built and operated. Moreover, every in-stance of each building component is represented, so that these elements can potentially be managed individually over the entire life of the building. Inso-far as the BIM is augmented with conventional 2D drawings and textual documents (such as specifi-cations and schedules), these will be considered part of the BIM, without concern as to whether this is a proper definition in other contexts.
• It is further assumed that the AECOO team is work-ing within a contractual and legal framework that is effectively a true IPD, irrespective of the actu-al details of these kinds of contracts as they are emerging in the industry. In this sense, the analysis really applies primarily to BIM and the discussion will focus on how information is managed when it is shared freely amongst all of the participants in whichever technological data form is most useful. IPD is referenced only because it has become the common way of referring to this open exchange and the term is used here in the broadest and most inclusive way. In particular, none of the informa-tion theoretical aspects of BIM are excluded even where they depend on being part of an IPD-like process.
Within this context, AECOO industry practitioners have acquired a large body of experience and examples of using BIM to create projects. These include many that strongly suggest that this new way of working should and will largely replace traditional methods over the next several decades. At the same time, significant problems have emerged with these new processes. These have led to an ongoing debate about which specific proce-dures should be adopted by the industry. While this ac-tivity is substantive and probably healthy, it has been documented and analyzed in a way that is relatively non-scientific in its methodology. Specifically lacking is an awareness that the “information” implicit in “build-ing information model” behaves according to scientific principles that are broader than the AECOO industry.• The premise of this study is that general principles
of information theory are applicable to BIM. Its purpose is to show how such analysis will enhance the industry conversation about BIM-related prac-tice and improve the outcomes of the projects that result from its use. However, information theory is a broad topic that is not generally familiar to an AECOO audience, so for purposes of this article, it needs to be defined in simple terms. To this end, it
is defined as a science in the sense that it proposes principles that can be tested, which is concerned with how information behaves in very general ways, irrespective of whether it is information about a par-ticular profession or project.
• The approach is necessarily somewhat mathemati-cal. However, the AECOO industry (or the author, for that matter) does not use truly rigorous mathe-matics in its work. For these reasons, the assertions are quite abstract and do not include rigorous defi-nitions or proofs. At this time there is no practical likelihood that the industry will have good measure-ments for the values we are analyzing (information content and effort) and there is no compelling rea-son to attempt a more quantitative approach, per-haps based on accounting data, for now.
• In general, quantities are expressed without units and relationships are expressed as proportions us-ing the symbol “” (rather than as equalities using “=”.) This acknowledges that the actual values are not going to be known while still permitting study of the relationships.
A more rigorous mathematical approach and the devel-opment of better quantitative data would be welcome contributions of further research.
2.0 BACKGROUNDThe history and basic concepts of information theory are nicely developed in Glieck’s recent book The Informa-tion2. This paper draws heavily on that background and does not attempt to replicate even parts of it. What is especially significant to the AECOO industry is that infor-mation theory is a true science as distinguished from an unstructured collection of opinions. Further, as Glieck’s history points out, disciplines that make formal use of information methods, particularly the computer indus-try, are likely to overwhelm those that remain rooted in a pre-information-age point of view.
Authoritative sources for scientific theory on BIM and IPD are sorely lacking. The bulk of the conversation within the industry has taken place in PowerPoint, often copied from other PowerPoints and without references or trustworthy sources or even accompanying text. Probably the best organized and most comprehensive book about BIM is Eastman, Teicholz and Liston’s BIM Handbook, which gives a broad overview of the topic and ventures into some practical guidance on how to practice it3. Jernigan’s BIG BIM little bim, promotes a

31
particular point of view that the “right” way to do BIM requires rich information and a high level of team inte-gration4. The National BIM Standard, developed by a wide range of industry experts under the auspices of the National Institute of Building Science (NIBS), is a widely referenced resource that is currently in develop-ment of its second version5. The American Institute of Architects (AIA)’s Integrated Project Delivery: A Guide, initiated by a committee of the AIA California Council and then rewritten as a publication of the National body, has served as a quasi-standard for how IPD is defined in the industry and what its goals should be6. Unfortu-nately, all of these references suffer from a writing style that is characteristic of the AECOO industry, in which process analysis is based on anecdote and relatively lacking in general theory. Particularly troubling is the blurring of actual experiences with anticipations of how the authors hope to see the industry change. One of the objectives of this article is to provide a basis for a more rigorous way of talking about these topics.
Analyses of information usage sometime make ref-erence to the data/information/knowledge/wisdom (DIKW) hierarchy as the basis for certain process strategies7. This philosophy dates at least back to the American philosopher Mortimer Adler’s writings in the early part of the twentieth century. It distinguishes data (raw information), information (organized data), knowl-edge (applicable information) and wisdom (the ability to use knowledge appropriately). While potentially useful, the DIKW hierarchy terminology differs from common usage in the AECOO industry, so it is avoided in this discussion. In particular, the implication that data is explicitly transformed into information does not reflect how BIM is typically applied. Where the DIKW system distinguishes data from information, in this industry it is often the same thing that is being referred to, even as its usefulness changes. Likewise, at the other extreme, whether the information in a BIM constitutes knowledge or even wisdom is not addressed. Rather, information is used in this discussion in the common, practical sense that a BIM or other documents contain information necessary to construct a building. An extension of this discussion to explore the use of knowledge would be another area of useful research.
3.0 PRINCIPLESIt is possible to consider information as analogous to energy as it is described in the physical sciences (the analogy is not precise, but contributes to understand-ing). In this sense, information is something slightly ethereal that we can sense, measure and use, even though we cannot really see it or know exactly what it is. The analogy is useful because it suggests ways in which fundamental principles can be applied to information in general, independent of any specific instance.
3.1 Cost of InformationLike energy, information is relatively easy to obtain, but not necessarily of value. Just as the heat energy that is a byproduct of equipment is usually a wasteful liability, unstructured information is typically not useful. We can even see it become detrimental when it overloads our data servers and obscures the information that we are actually looking for.
In the next section of this article, the value of informa-tion is defined in more detail. At this point it is enough to observe that some information (what we will call High-value Information) is worth more than other information (Low-value Information).
Moreover, just as there are no perpetual motion ma-chines in physics, there is no free information. Like energy, information has a tendency to degrade from a higher-value state to a lower-value one through a pro-cess of entropy. This occurs even if the information is not being used in any way; if it exists, it is in a process of being degraded. Effort is necessary to prevent this and maintain a steady state. This incurs a cost, which is manifested in acquiring data, interpreting and main-taining it, authoring models and so on.
The effort needed to maintain information that we al-ready have is one of the most frequent sources of fric-tion within the AECOO community. Idealism around BIM encouraged by marketing promotion includes an implicit misconception that all information is good and that more information is better. As a result, when BIM information is exchanged, the recipients often have un-warranted expectations about the value of the informa-tion being delivered to them.
The Information Content of BIM

32
PERKINS+WILL RESEARCH JOURNAL / VOL 03.02
This cost of information is expressed as the following Principle 1:
Principle 1:The effort cost of acquiring and maintaining quality in-formation is proportional to the amount of information.
Where, CINFORMATION = the effort cost of creating and maintaining information and
AINFORMATION = the amount of information,then: CINFORMATION AINFORMATION
This is a significant assertion. Potentially, capable prac-titioners could find ways to avoid its consequences, perhaps with economies of scale or very smart technol-ogy; or, it might be that crowdsourcing with the new social media will make information free. However, today we are increasingly burdened with excess information. Initially it impacts our information technology infra-structure, but even greater cost comes with the human activity of organizing, evaluating and (too infrequently) deleting it.
3.2 Value of InformationIn balance to this cost, information also has value, which derives from its capacity to inform decisions (that, in turn, enable actions). This definition of value is based on a premise, adopted for purposes of this discussion, that AECOO practice is fundamentally about decision making. In this view, decisions may range from the very broad ones of conceptual design, to very specific ones during construction. They may affect aesthetics, costs, schedules, utility and many other things, but they are the fundamental actions that enable a project to be conceived and to go forward to completion.
However, these various decisions are not equally im-portant. Clearly they differ in their scope ranging from those that are very focused to those with broad implica-tions, but that scope is not significant to this discussion since we are not working with actual values and can assume the effect of scope has been normalized. On the other hand, there are two aspects of a decision that do make it important:• Relevance: Some project entity, the design/building
team during construction or the owner/operator following construction, must actually make the de-cision. Information that informs purely hypothetical questions is not considered valuable in this con-text.
• Cost Effect: The actual building elements that are af-fected by the decision must be relatively expensive
in terms of their design, acquisition, installation and maintenance. Although there are other objec-tives in a project that are not monetary (aesthetics, for example), it is those that affect the budget that are the most difficult to resolve and consequently, make the most use of information.
The value of information comes from its ability to en-able making these important, cost-related decisions. As a result, such value can be ranked on a scale that extends from low to high and is analogous to potential in physics:• Low-value Information: Information that lacks rel-
evance, cost significance or structure is not use-ful for decision making. It is similar to raw heat in physics; it is definitely there, but it is not useful.
• High-value Information: At the other extreme, informa-tion that can be used is like potential energy. It has the capacity to do the work of informing decisions, just as a power source can do work in a motor.
(Note that the term “potential information”, which might be more consistent with the energy terminology, is not used since its common meaning would be misleading.)
This value of information is expressed as the following Principle 2:
Principle 2:The value of information is proportional to the cost of acquisition and maintenance of the relevant tangible building elements being modeled.
Where,VINFORMATION = the value of information andCASSETS = the cost of the relevant tangible building assets,
then:VINFORMATION CASSETS
For example, when the design team spends excessive time modeling detail that does not have much useful value to the builders, such as the framing in a parti-tion, their time is wasted. On the other hand, relatively detailed modeling of an expensive component, like the curtain wall, can prevent costly field adjustments and rework.
3.3 Combined BIM Process Value EquationThese principles 1 and 2 can be combined into a single cost-benefit expression of the value of a BIM, in both the sense that the process of creating it was informative and that it is useful as a finished product. This expres-sion can be applied broadly to any of the tasks for which

33
the extended team (designer, builder, owner and opera-tor) elects to use BIM.
The value of a BIM process is defined by how it is useful to the project team. It will be derived more easily when the process is applied to construction elements that are expensive in some way (time consuming to design, costly to purchase, entails time to install, hard to main-tain) and can be managed relatively easily in the BIM (well defined, modularized, can be abstracted.) Con-versely, such value will be difficult to derive from less important, highly commoditized elements especially if they are difficult to model.
Looking at value and cost at the same time is useful be-cause, even with the very imprecise quantitative values we are using, it helps to understand the relative costs and benefits of different kinds of BIM processes. In other words, it identifies which activities will be valuable to a project team and which will waste their resources.
This combined value of a BIM process is expressed as the following Principle 3:
Principle 3:The value of a BIM process is proportional to the ac-quisition and maintenance cost of the relevant tangible building elements being modeled and inversely propor-tional to the quantity-based cost of developing andmaintaining the information.
Where, VBIM = the ultimate value to a project of a BIM process and CASSETS = the cost of the relevant tangible building assets and AINFORMATION = the amount of information,then: VBIM CASSETS / AINFORMATION
This principle is evident in Computer-Aided Facility Management (CAFM) where projects designed to track spaces, which have a high capital cost and do not re-quire much information maintenance, tend to be more successful than attempts to track furniture, which is not inherently worth much and is very difficult to keep track of. In the planning and executing of CAFM projects, it is usually more important to ensure that the overall effort will not be too onerous and will provide real value than to focus on the selection and fine tuning of the CAFM software.
Failure to grasp this principle is another source of fric-tion. For example, building owners have been frustrated
in their efforts to adapt the BIM models used during the creation of their buildings to CAFM. In fact, this should not be surprising since these BIM models tend to con-tain a lot of information, which is costly to use relative to the cost of the facility elements being managed. For example, it is not currently practical to update a BIM model every time a light fixture is replaced; there simply is not enough information payback to justify the effort.
4.0 INHERENT INFORMATION IN MODEL-BASED DESIGNApplying these principles in the context of typical proj-ect work requires establishing quantitative values for the amount of information that is inherent in the BIM model.
4.1 Distinction of Conventional and Model-based RepresentationsIt is not realistically possible to measure the information content of a BIM in any absolute sense, but a relative measure of how it differs from an alternative approach is useful. For this purpose, two kinds of AECOO docu-mentation are distinguished:• Conventional: The design methodologies used in con-
struction over roughly the last century, including “hand-drafting” and computer-aided design (CAD) seek to minimize the amount of documentation re-quired to achieve the goals of a project. Although largely two-dimensional and drawing-centric, they have included three-dimensional components as well as other kinds of non-drawing media. What distinguishes them is that they rely heavily on an abstract language to represent typical conditions, which are then extrapolated to define the complete project. For example, a simple two-dimensional symbol consisting of one line and one arc that references a schedule is all that is necessary to represent a door. The schedule may include some additional detail about dimensions, frame condi-tions, lights etc., but even this information is fairly abstract. (Note that “CAD” in this context is used to mean “drafting” that uses a computer; it is not used to mean the broader category of all “use of computers in the aid of design.”)
• Model-based: In contrast to the conventional meth-ods, the more recent model-based approaches seek to completely represent the full extent of the project. For every individual building element that will be constructed, there is exactly one cor-responding model element. Moreover, the model elements include detailed geometry and possibly
The Information Content of BIM

PERKINS+WILL RESEARCH JOURNAL / VOL 03.02
non-geometric attributes that simulate the built el-ements in detail. To continue with the door exam-ple, a model typically includes a three-dimensional representation of the leaf including any openings, a frame with an accurate profile and even hard-ware for every door instance. (This is not to say that every detail of the project is modeled. Drafting is a legitimate component of BIM, but it is an ad-junct to the model that is not relevant to the defi-nition of “model-based”). What distinguishes the model-based approach from the conventional one is that it seeks to reduce the reliance on abstrac-tion. Although there are practical limits, ideally a model represents the completed project in signifi-cant detail over its entire scope. (Current model-based design theory goes even beyond this adding non-graphic data to the model, such as product specifications, that would have been managed separately in a conventional approach. While im-portant, such information is not included in this analysis.)
4.2 Information Content of Conventional and Model-based RepresentationsA model-based representation of a project requires more information than a conventional one. For exam-
ple, to define a solid rectilinear element in conventional terms requires four two-dimensional points and a value for the third dimension. To represent the same element in three dimensions requires eight three-dimensional points.
Moreover, in conventional documentation this element would typically be detailed in one place and then ex-plicitly keyed or implicitly inferred to apply to many in-stances where it occurs; whereas in the model-based representation, every instance is represented. This means that even a small difference in the information cost of a single item is multiplied many times.
There are a number of simplifications and exclusions in this analysis. For example, the conventional represen-tations rely on cultural conventions for how two-dimen-sional documents represent three-dimensional shapes in plans and sections. Similarly, a model relies on a complex BIM authoring context that brings new capa-bilities to the design process. These contexts supply ad-ditional information making it more difficult to measure information quantity in any absolute sense. However, for purposes of this discussion, they will be assumed to be relatively insignificant and approximately equal so that they can be ignored.
34
Figure 1: Data required to define shape.
The conventional form uses four two-dimensional points and a height.The model-based form uses eight three-dimensional points.

35
Figure 2: Data required for multiple occurrences of a shape.
The conventional form uses one instance and four references to that instance. The model-based form uses four instances.
What the previous two figures illustrate is that, given a linear relationship between the number of objects in a project and the amount of information required to represent them with conventional means, a model based representation will increase that requirement by a significant factor. This is expressed in the following Principle 4:
Principle 4:The quantity of information in a model-based repre-sentation of a project is greater than that of a conven-tional representation by a factor of the number of build-ing elements.
Where,NELEMENTS = the number of building elements and ACONVENTIONAL = the amount of information in a conventional representation,AMODEL-BASED = the amount of information in a model-based representation k = a factor > 1,
then:ACONVENTIONAL NELEMENTSAMODEL-BASED k x NELEMENTS
and therefore:AMODEL-BASED k x ACONVENTIONAL
or, AMODEL-BASED ACONVENTIONAL
Of course, having an estimate for k would be very use-ful. No basis for one is included in the current discus-sion, but from an informal examination of file sizes and the work experience of project teams it is conjectured that k is at least 2 and possibly much more.
5.0 IMPACT ON BIM IMPLEMENTATIONCombining Principles 3 and 4
VBIM CASSETS / AINFORMATION
AMODEL-BASED ACONVENTIONAL
and recalling that,
VBIM = the ultimate value to a project of a BIM process
a similar value expression for conventional represen-tation could be defined as,
VCONVENTIONAL = the ultimate value to a project of a conventional process,
leading to a conclusion that: VBIM VCONVENTIONAL
In other words, that there is an inherent problem with model-based representations like BIM in that, for a given asset cost, the value return from BIM is less than that of a conventional process. This derivation is a for-mal way of stating a concern, sometimes voiced by de-signers that are not working in an IPD context, that BIM
The Information Content of BIM

36
PERKINS+WILL RESEARCH JOURNAL / VOL 03.02
projects are less profitable than conventional ones. We do see examples of this effect when BIM is introduced into a design office that has been using conventional methods of design representation. A typical experience is something like:• BIM is adopted as a way of reducing the amount
of time required to document a project for the pur-pose of improving profitability.
• However, the initial BIM projects take longer to complete, resulting in lost profits. Although this is initially attributed to the cost of switching to BIM, the so-called “learning curve”, the problem does not completely go away with subsequent projects.
• This results in a debate about the merits of a mod-el-based approach. The proponents of BIM argue that the real problem is that the BIM information is not being properly leveraged to improve productiv-ity during construction, through reduced changes, more advanced construction process and other advantages.
• Critics argue that this is not a valid comparison since recouping value during construction is not the primary goal of the BIM author. The general advancement of the firm’s capabilities and those of the AECOO industry as a whole, while laudable, do not contribute to the design office’s profitability.
This debate illustrates the mathematical derivation regarding the inherent difficulty with achieving value from BIM. However, the mathematical expression is not useful as a principle because we are not interested in holding the contributing factors as constants. On the contrary, for a number of reasons (outside of the scope of this discussion) there are compelling arguments that BIM should and will become the exclusive means of representing projects in our industry. The purpose of the current analysis is to understand how the factors that contribute to value can be manipulated in order to ensure that model-based BIM provides better value than conventional methods.
Principle 3 suggests two basic strategies for increasing VBIM:
• Reducing CINFORMATION by reducing AINFORMATION
• Increasing the leveraged impact of CASSETS
A number of possible means for achieving these are possible, three of which are developed in the following sections.
5.1 Lowering Information Costs Through the Use of Conventional MethodsSuccessful BIM projects make good use of conventional documentation techniques. Conversely, projects that at-tempt to represent every design decision in their models tend to require additional work to complete.
While some conventional representation occurs in all BIM projects, the ideal proportion of it and the specific kinds of decisions that it should be used to represent, are not obvious. A benefit of this information cost-value analysis is that it provides guidance on how the distinc-tion should be made.
For example, a small reveal in the exterior skin of a building represents a relatively small construction and maintenance cost, but a large amount of information is required to represent it in a model. For these reasons, reveals are usually better not modeled, but represented as an abstraction (typically a three-dimensional model line or a two dimensional drafting line) and defined completely as drafted elements in details.
On the other hand, major building elements such as wall, floors and structure represent significant costs and are relatively easy to model. These elements are typical-ly developed early in the BIM and maintained through the duration of the project.
Similarly, minor elements such as fixtures and furniture are often represented as plan symbols since they do not represent a lot of value and are difficult to model while significant equipment and systems such as those in hospitals and laboratories are increasingly being mod-eled because of their relative cost significance.
There are some subtle factors that may affect this bal-ance. For example, if a client or user group needs to see a three-dimensional representation of the furniture in order to make decisions, then it becomes worthwhile to model the furniture in some detail. In terms of the information analysis, what this really represents is an increase in the cost of the furniture; the manufacturer’s price may not have changed, but the cost of delivering it has. This can be expressed in the context of principle 3 as:
CASSETS – SIMPLE PURCHASE CASSETS – THREE-DIMENSIONAL REVIEW
and therefore,
if AINFORMATION = fixed amount
VBIM – SIMPLE PURCHASE < VBIM – THREE-DIMENSIONAL REVIEW

Some of the underlying factors may change over time as well. For example, engineers often prefer to repre-sent structural, mechanical and other systems as ab-stractions (such as a single, two-dimensional line) while the design is evolving. The builder, who is concerned with constructability, may want to represent the same design decisions in a model. Again, in terms of informa-tion analysis, this really represents a change in the asset cost. The distinction is subtle since the asset does not appear to have changed, but it is there: the builder has to pay real money for materials and installation whereas the engineers have only invested in their means of ser-vice (i.e., they might need to revise the documents). This idea is developed further in the following section on BIM Execution Planning.
Although this strategy is often viewed as regressive in terms of moving forward with BIM, it is an important component of a firm’s business strategy for adopting BIM. We should not try to “prove our BIM prowess” by asking project teams to create complex, multi-purpose models that overextend the team’s capacity. Truly capa-ble BIM practitioners are willing to represent themselves as also using conventional practice.
5.2 Lowering Information Costs through Design AutomationNevertheless, as the industry shifts towards a greater proportion of model-based representation, the focus is on how to reduce the information cost of representing decisions. This strategy is initially useful because it can improve project profitability within the context of a con-ventional contract without depending on the benefits of some form of IPD.
The goal is to reduce the effect of Principle 1, namely to reduce the unit cost of creating information. This has two components: reducing the amount of information and reducing the cost of creating and maintaining a given amount of it.
Reducing the amount of information that must be man-aged is not the same as reducing the complexity or usefulness of the results. For example, a model-based representation of a wall created with primitive elements (lines and planes) requires a lot of information com-pared to a conventional plan representation. However, a wall created in a parametric BIM authoring tool may only require a start and an end point. The parametric version requires significantly less information to author even though its meaning, in terms of what will be con-structed, is the same. (This is assuming that the wall is
properly defined and does not include additional, low-value collateral information).
Reducing the cost of creating information is achieved through smart working methods that achieve a given amount of information more easily. For example, if a li-brary of parametric walls is pre-defined, then walls can be created more easily than if the design team had to create them from scratch. Even the work of subsequent users necessary to ensure that they remain valid is re-duced if they can refer back to the library for validation of the intrinsic decisions.
In general terms, these kinds of strategies are examples of automation. Although they are sometimes expressed in terms of “standardization”, the benefit does not come from conformity, but from some processes that leverage consistency. In the examples, creating a wall with para-metric commands is a direct example of automation as provided by computer programming; having the walls predefined is an indirect kind of automation in that it supports the use of the direct application. Even basic conventions, such as a standard sheet layout, are re-ally components in a “soft” automation that is not im-plemented with computer commands. In other words, standards are really the specifications of an automated process, which may or may not (yet) be implemented as a parametric computer-based process.
5.3 Leveraging Information Value during Construction and OccupancyThe previous examples notwithstanding, it is ultimately a more successful business strategy to increase value than to reduce cost. The most significant gains will come from outside the scope of traditional services provided by architectural and engineering design firms. This includes both actual construction as well as the design that has traditionally been done by contractors and sub-contractors. For this reason, this strategy of in-creasing the information value of BIM, more than the previous options, must occur within a true IPD, a less explicit “IPD-ish” arrangement, a design-build agree-ment or a similar context where information is shared freely. There are several ways this can occur:• Additional design usage of the BIM model: The fact that the
BIM model exists may give rise to uses that were not planned when it was conceived. For example, an owner may use it for marketing purposes; or a building operator may use it to manage user expec-tations and plan moves. In many cases, these addi-tional uses leverage counts and other non-graphic data that was not essential to the initial purpose of the BIM, but are a useful byproduct.
37
The Information Content of BIM

38
PERKINS+WILL RESEARCH JOURNAL / VOL 03.02
• Savings during construction: Planning the construc-tion, as distinguished from the intent of the design, can benefit from virtual construction, i.e. using BIM methodologies to simulate construction in advance of the actual construction. This has the potential to expose problems, reduce purchasing costs and enable more efficient planning and on-site construction processes.
• Support for computer-aided facility management (CAFM): Although a BIM model that was created for design and construction purposes is not directly usable for facility management purposes, there is poten-tial that it could inform a CAFM system. It is also likely that building owners and operators will be-come more BIM capable and use models that are more appropriate to their needs.
In information terms, these additional uses really reflect hidden costs in the ultimate project. In the examples, the marketing and move-management costs were al-ways there even if they were not initially associated with the BIM effort. Likewise the builder needs to manage constructability with or without a BIM and CAFM sys-tems always require good information. The significance of analyzing these uses in terms of the cost-value of in-formation is that articulating these relationships clarifies how the additional information costs of the BIM should be recouped from value identified in the marketing, moving, building and CAFM budgets.
This information analysis also defines more clearly where BIM strategies will achieve easier successes.
Certainly they will be more applicable to high-cost, information-rich projects such as hospitals and labora-tories, as differentiated from more generic projects like commercial office buildings and tenant improvement. In fact, empirical experience has shown that the former lead in the adoption of BIM while the latter are moving more slowly.
6.0 INFORMATION OVER TIMEUp to this point, the analysis has looked at the quanti-ties of information and value as being static rather than its tendency to degrade over time. However, in actual projects especially as it is used by a wider team, infor-mation has different meanings at different times. This section looks at some of the implications in general terms. These are potential topics for a more detailed, mathematical analysis of the related costs and values.For example, high-value information that is not yet needed is not very useful and relatively expensive to maintain. Likewise, missing information can have a high cost relative to its inherent information content. What is true may change with time as well. For example, ac-curate and detailed information about an out-of-date building code will suddenly change from high-value to low-value. This is especially an issue in fast-changing business, such as healthcare, where equipment re-quirements may change significantly between design and occupancy. Better ways of expressing this time component would be useful in determining what is im-portant.
Figure 3: Use of automation to reduce the amount of information.
The parametric wall is defined with only two two-dimensional points. A pre-defined library reduces the information required to define the parametric behavior.

39
6.1 BIM Execution PlanningThe phases of design, building and operation are be-coming less distinct as the industry becomes more inte-grated in how project teams collaborate and as informa-tion management tools like BIM enable more non-linear processes. Nevertheless, from a business perspective the designers, builders, owner and operators still repre-sent distinct groups with differing informational needs. To address these, BIM project management increas-ingly includes the development of a BIM Execution Plan that defines the roles and responsibilities of the partici-pants and schedules the major tasks. Typically, such a plan includes a Level of Detail Matrix that8,9,10,11: • Cross references classes of built elements with the
team members responsible for modeling those ele-ments and tracks how these assignments change over the major phases of the project.
• Specifies for each phase, a “detail level” of the model typically expressed as “100”, “200”, … “500” or a similar measure.
This matrix is important to the BIM authors in planning their work, but it is more important to the project in terms of the underlying decisions that model evolution represents. In this sense, the term “Level of Detail” is misleading in that it implies that the components ap-pear early in the project as very coarse objects, that are then replaced with more refined ones over time. While that may be true in a few cases, in actual prac-tice model elements are typically missing entirely until a stage where they are represented by relatively detailed objects. In the early phases these may be unfinished constituting:• Placeholders: Relatively detailed objects that do not
necessarily represent the actual built element. For example, even an early-design BIM will likely in-clude openings, furniture, equipment and other objects drawn from the same library that will ul-timately be used to prepare construction docu-ments.
• Estimates: Conservative boundaries that ensure space, budget and adjacency for something that will be designed in the future. For example, over-sized structural steel members are estimated until the design has stabilized to the point where they can be engineered.
In other words, while the BIM may not be getting visibly more detailed, the underlying decisions that it repre-sents are getting made. For this reason the term Level of Completeness is used in this examination of infor-mation content. Completeness, in this context, really
expresses positions on the scale of low-value to high-value information defined earlier and suggests some principles for BIM planning:• Completion derives from high-value information;
low value information does not contribute, yet has a cost. For this reason the placeholder BIM ele-ment is not an ideal strategy because it introduces a lot of low-value information.
• The objective of BIM planning should be to defer completeness (where it does not affect other deci-sions) in order to reduce costs due to the quantity of information. This is contrary to a common as-sumption that “earlier is better”; asking construc-tion subcontractors to waste time in conceptual design meetings, for example.
It would be very useful if the software industry were to provide BIM tools that are better at expressing these kinds of tentative decisions, but they currently do not. Project teams sometimes approximate an expression by making elements a particular color, transparent or some other graphic means, but this is not common practice.
6.2 Life-Cycle Information ManagementEach stakeholder typically holds information in their own store and in a different form making information analysis most significant at the interfaces between them. This yields some useful guidelines for the team’s objectives.
There has been extensive discussion in the industry about how much information is lost during these transi-tions with the inference that there is a lot of value to be captured by reducing this loss. For example, the National Institute of Standards and Technology (NIST) study Cost Analysis of Inadequate Interoperability in the U.S. Capital Facilities Industry12 and the subsequent response from the Construction Users Roundtable (CURT) Collaboration, Integrated Information and the Project Lifecycle in Building Design, Construction and Operation13 attributes $-billions of waste to the lack of information interoperability at these points.
Much of the current thinking about IPD envisions an increasing number of smaller exchanges replacing the larger packages that have characterized the industry. In this vision, phases can be essentially eliminated in favor of a continuous flow of information that is timely and appropriate to the current need. However, while the current information loss is very real and the potential benefits of more integrated information management strategies are promising, these changes have not come easily to the industry. In many instances the rewards
The Information Content of BIM
40
PERKINS+WILL RESEARCH JOURNAL / VOL 03.02
have been elusive and this is the source of some cur-rent frustration with BIM.
The reason for the difficulty can be understood in infor-mation terms by examining the low-to-high measure of information value. What conventional practice achieved in the hand-offs between phases was a significant re-duction in low-value information. This did not represent a loss. In fact, it reduced the cost of the information. The historical importance of professionalism in disci-plines like architecture and engineering came from their taking responsibility for the quality of the informa-tion they delivered. Great care was taken not to transfer information that was even potentially inaccurate.
The transition to BIM and the expectation that BIM models will be shared has disrupted this principle. The problem is often expressed as a concern about “liabil-ity”, but the legal implications are not the issue in this analysis. Even if we assume a very close, completely indemnified relationship, it is still not good professional-ism to deliver low-value information. The more funda-mental problem is that information of uncertain quality must be assumed to have low value entailing a cost to be certified as high-value even if the information itself does not change. For example, an architectural model that shows the location of a pipe has no value to an owner unless the builder has actually verified its as-built location in an auditable way.
Certainly the industry direction is not to restrict sharing rather it will be to distinguish more clearly the quality of the information. Unfortunately, there is not yet an obvi-ously good way of doing this. Today BIM models are typically delivered to other parties accompanied by a disclaimer that states, that the model is of uncertain accuracy and should be used entirely at the recipient’s own risk. This seemingly legalistic tactic actually ex-presses a profound information fact: that the informa-tion value of the model is much lower to the recipient than it is to the author.
Unfortunately, this is sometimes discussed as if it were a defect in the source model. In fact, the BIM authors have very little knowledge about the downstream needs and even less motivation to service them. As a result, it has been common practice to essentially rebuild the model during the transition from the design team to the building team. This should not be surprising or discour-aging. The cost of creating a BIM model from scratch is not very high. The true cost is the decisions that it represents. The process of rebuilding the model is not necessarily a wasteful exercise, but a relatively straight-
forward way of extracting high-value and eliminating low-value information.
This devaluation of the information value is not entirely a characteristic of the information itself, but a reflection of the social context of who authored it and how much it can be trusted as a result. One of the effects of a more integrated project structure is to raise that level of trust. This has the effect of reclassifying low-value informa-tion as high-value even though the information has not changed. It is hoped that these emerging improve-ments, based on better interpersonal relationships, will enable better use of a BIM model without trying to force fit it from its intended use to an inappropriate one.
7.0 CONCLUSIONThis analysis demonstrates that the general principles of information theory are applicable to BIM. Further development of this approach will enhance the con-versation about BIM and IPD and can improve project outcomes.
Some basic principles of information have been de-fined:• Information has an inherent cost, which is propor-
tional to the quantity of information and subject to a process of entropy.
• The value of information is a function of its quality, which is defined in terms of its usefulness in mak-ing decisions.
• Although model-based documentation has inher-ently more information, this does not necessarily result in more cost if automation and other strate-gies are used to produce it more efficiently and its value is leveraged over additional uses.
This approach helps to explain some problems with BIM adoption by exposing misunderstandings and un-realistic expectations, such as the failure to understand that:• All information is not of equal value and may even
be detrimental. Simply having more information is not necessarily useful.
• Applying information to lower-value decisions is in-herently inefficient and will eventually lead to per-ceived failure in the BIM process.
• Life-cycle information management should not involve the indiscriminate accumulation of infor-mation and redoing BIM work may be an effective strategy for distinguishing high value from low-val-ue information.

This kind of analysis can also provide useful guidance to project teams, including:• Defining the proper balance between drafting and
modeling.• Strategies for BIM planning that maximize the ef-
ficient use of information and avoid wasteful main-tenance of low-value information.
REFERENCES[1] Engelbart, D., (1962). Augmenting Human In-tellect: A Conceptual Framework, Summary Report AFOSR-3223, Menlo Park, CA: Stanford Research In-stitute.
[2] Gliek, J., (2011). The Information, New York, NY: Pantheon.
[3] Eastman, C., Teicholz, P., Sacks, R., and Liston, K. BIM Handbook: A Guide to Building Information Model-ing for Owners, Managers, Designers, Engineers, and Contractors, Hobeken, NJ: John Wiley & Sons.
[4] Jernigan, F., (2007). Big BIM little bim, Salisbury, MD: 4Site Press.
[5] NBIMS, (2007). National BIM Standard – United States, Version 1, Part 1, Washington, D.C.: National Institute of Building Sciences.
[6] AIA National and AIA California Council, (2007). In-tegrated Project Delivery: A Guide, Washington, D.C.: American Institute of Architects.
[7] DIKW, Wikepedia: http://en.wikipedia.org/wiki/DIKW.
[8] AIA, AIA Document E202 - 2008, Building Infor-mation Modeling Protocol Exhibit, Washington, D.C.: American Institute of Architects.
[9] Computer Integrated Construction Research Pro-gram, (2009). BIM Project Execution Planning Guide – Version 1.0, University Park, PA: Pennsylvania State University.
[10] Autodesk, (2010). Autodesk BIM Deployment Plan, San Rafael, CA: Autodesk, Inc.
[11] VA Office of Construction and Facilities Manage-ment, (2010). The VA BIM Guide, Washington, D.C.: Department of Veterans Affairs.
[12] Gallaher, M., O’Connor, A., Dettbarn, J., and Gil-day, L., (2004). Cost Analysis of Inadequate Interop-erability in the U.S. Capital Facilities Industry, Report, Gaithersburg, MD: National Institute of Standards and Technology.
[13] Architectural/Engineering Productivity Committee, (2004). Collaboration, Integrated Information and the Project Lifecycle in Building Design, Construction and Operation, Report, Cincinnati, OH: Construction Users Roundtable.
41
The Information Content of BIM

PERKINS+WILL RESEARCH JOURNAL / VOL 03.02
42
04.PERFORMANCE-DRIVEN DESIGN AND PROTOTYPING:
ABSTRACTThis article discusses performance-driven design and fabrication as one of the emerging approaches in archi-tectural design, where computational tools are used for integrated design exploration, analysis and fabrication. It discusses development of a new course that integrates simulations into the design process with special con-sideration for parametric design. Simulations and digital modeling are used to investigate design performance while fabrication is used as rapid prototyping method to explore forms, material properties and actual physical characteristics of the design. This course was a collaboration between University of Cincinnati, Perkins+Will and University of North Carolina Greensboro. The objectives were to investigate best practices for performance-driven design and the correlation between digital modeling and physical prototyping through digital fabrication tech-niques. The article presents several student projects from the course that explore the general process.
KEYWORDS: performance-driven design, analytics, fabrication, computation
Design Computation and Fabrication
Ming Tang, LEED AP BD+C, [email protected]
Ajla Aksamija, PhD, LEED AP BD+C, CDT, [email protected]
Michael Hodge, MARCH, AIAA, ACADIA, [email protected]
Jonathon Anderson, MFA, ACADIA, IDEC, [email protected]
1.0 INTRODUCTIONBy using computer-aided design (CAD)/computer-aided manufacturing (CAM) and simulation tools, architects and designers are integrating digital computation with analytical design processes and fabrication techniques. These processes are emerging as a new direction in computational design and provide unprecedented methods for the exploration of form, analysis of physical properties and simulation of building performance. To test the use of computational methods for model gener-ation, analysis, decision-making and design communi-cation, a new course, “Performance-Driven Design and Prototyping”, was developed in the School of Architec-ture and Interior Design at the University of Cincinnati during spring 2011. Co-taught by Professor Ming Tang, Dr. Ajla Aksamija, Mike Hodge and Professor Jonathon Anderson, this course covered parametric modeling techniques associated with performance-based design and digital fabrication. The course explored the integra-tion of parametric design, building performance evalua-tion, analysis, visualization and physical representation. Rapid prototyping and digital fabrication methods were
used to study design at varied scales and for reviewing constructability.
We used video conferencing and podcasts for remote collaboration and teaching. This method was also used as a means to critique student projects. As a result, eight projects were designed and fabricated in the Rapid Prototyping Center at the University of Cincinnati. This article reviews the foundations of performance-driven design and digital fabrication, their use in architectural design process and outcomes of the course.
2.0 WHAT IS PERFORMANCE-DRIVEN DESIGN?The central feature of performance-driven design is a process supported by an analytical evaluation of envi-ronmental performance based upon simulating physi-cal conditions. The performance results then become the input for form-finding and basis of geometric modeling through the use of digital tools. Quantifiable predictions through simulations and modeling help in identifying strategies and methods to improve building

Performance-Driven Design and Prototyping
43
performance1. For example, the objectives for attaining extremely low and zero energy buildings rely on sev-eral strategies including the use of passive methods, advanced building technologies and renewable en-ergy sources. There is a need to quantify the benefits of each individual methodology and relate them to a specific design problem, building, climate and context. Quantifiable predictions during the different stages of the design process help establish matrices that can be used to measure improvements by using these different strategies.
A design method that integrates energy, environmental and other types of analysis at early design stages is the basis of performance-based design. The differences between this approach and traditional design methods are1:• Traditional Method: has certain deficiencies because:
(1) it includes simplified assumptions based on rules-of-thumb that can be imprecise (for exam-ple, forcing an aesthetic feature); and (2) may not be accurate in relation with performance measure-ment of design solution.
• Building Performance-Based Design Method: has power in assessing the performance of a design solution be-cause it: (1) uses performance measures with ac-tual quantifiable data and not rules-of-thumb; (2) aims to develop a simulation model of a complex physical system; (3) uses the model to analyze and predict behavior of the system; and (4) produces a quantifiable evaluation of the design.
Performance-driven design integrates design objectives and analysis/simulations, such as solar radiation, to reach solutions based on input parameters and design logic to establish results of design process. Figure 1 is an example of an integrated design workflow combining analysis and parametrically responsive surface panels. In this case, solar radiation data is used to determine the degree of shading needed to protect a complex geo-metric form and reduce solar heat gain. The design of shading elements and their form is parametrically de-termined based on the solar radiation analysis results2.
Oxman describes this approach as a determinant and method for the creation of architectural form. She states, “in such circumstances digital design diverges from a design paradigm in which the formal manipulative skills and preferences of the human designer externally con-trol the process to one in which the design is informed by internal evaluative and simulation processes.”3 Dur-ing the last decade, performance-based design has be-come the leading digital design methodology in a spec-trum of emerging design computation methods. It is transforming practice, research and development and education. This new course explored the generation of spaces and building components by regulating a series of parameters driven by performance-based factors. In this investigation, students furthered their understand-ing of space by discovering how parameters affect the overall performance quality and character of a spatial artifact. Digital tools such as Maya, Rhino, Grasshopper and Ecotect were introduced to the process for simula-tion, digital form-finding and fabrication.
Figure 1: Design of building skin and shading elements in response to solar radiation data.

PERKINS+WILL RESEARCH JOURNAL / VOL 03.02
44
3.0 WHY IS THE PHYSICAL REALIZATION AN ESSENTIAL PART OF THE DESIGN?Representations of architectural design have evolved to reflect the changes in building technology, materi-als, design practices and construction. Advancements in information technology allowed for novel representa-tional methods through primarily CAD systems, three-dimensional modeling and simulations of building performance4. Furthermore, parametric thinking and CAM tools have yielded a significant leap for design-ers, where they are able to explore digital fabrication and material processing techniques. As Castle argues, “the onset of CAD/CAM interfaces that allows designers to design directly for manufacture has placed produc-tion potentially back in the hands of the architects.”5 By combining parametric design tools with rapid prototyp-ing techniques in the design process, designers and ar-chitects have powerful real-time capabilities to generate multiple design options, iterate conceptual approaches and end with scaled artifacts to study, review and cri-tique their design solutions.
Digitally generated solutions lend themselves to fused deposition modeling (FDM or 3D powder print), CNC milling or laser cutting methods. Part of the design challenge, when designing with digital fabrication as a driver, is the ability to realize the conceptual idea within size limitations and allowances of the current fabrica-tion tools. As Iwamoto describes, “as in conventional construction processes, information is translated from one format to another to communicate with the build-er – only in this case the builder is a machine.”6 For example, one of the challenges is how to break down complex forms, which are automatically generated from a performance-driven design process, as simpli-fied components that can be realized by fabrication and assembling. Through a slicing method, a complex form can be easily divided into a large quantity of 2D contours or patterns. For instance, these components can be labeled and cut with laser cutters or CNC milling machines and then re-assembled to reveal the com-plex form. The workflow from performance information, such as solar radiation, to the pattern of building skin, to
the G-code of CNC machine stimulated many interest-ing approaches among projects, which are discussed in the next sections.
4.0 COLLABORATIONIn this academic and professional collaboration, topics such as parametric design, fabrication and simulations were introduced with the objective to design and fabri-cate a building component based on performance-driv-en design. Ming Tang covered fundamental principles of performance-driven design and essential computer skills with various software and methodologies. Dr. Ajla Aksamija and Mike Hodge covered performance-driven design in practice, application of simulation tools during the design process through several real projects where performance-driven design methods have been used. They also shared results of research projects and inter-nal tools they developed for parametric design.2 Jona-thon Anderson covered various fabrication techniques such as vacuum modeling, casting and CNC patterning/folding. The course focused on the following key ele-ments:• Performance-driven design methodologies: Key concepts
and issues in the application of performance-based design were introduced. Case studies and several group projects were developed to challenge students to design a building skin that responds to environmental input parameters.
• Rapid prototyping: Digital fabrication technologies were used as rapid prototyping method to develop different physical models (study, development and final models). Here, the direct capability of digital model-to-fabrication served as a means of produc-ing a tangible “artifact” to study and/or represent milestones through the design process and devel-opment.
Digital production processes that were used during the course allowed for distinct design and fabrication phases (Figure 2). The design phase required the use of simulations and parametric modeling techniques for the design of forms and components based on perfor-
Figure 2: Digital design production process.

45
mance data. The fabrication phase introduced differ-ent techniques such as laser cutting, CNC milling, 3D printing and assembly. The final outcomes were physi-cal prototypes of the designed components.
Each student produced a few conceptual models in-cluding a set of diagrams used to understand the re-lationships between performance and the resulting actions that generated the form. They produced final prototypes of their designs, which demonstrated the transition from design concept, performance-driven so-lution to fabricated assemblies (Figure 3).
This teaching method received positive feedback from students and colleagues at the University of Cincinnati. Video conferencing, blog postings and data sharing provided efficient ways to communicate among the col-laborators located in four different locations. Students greatly appreciated the opportunity to talk to profes-sionals who are using the digital tools in practice. In the course evaluation, students anonymously described that the most important aspect of the course was, “in-sight into techniques how the parametric design can/may impact architecture in a practical way”.
Figure 3: Examples of fabricated components.
Performance-Driven Design and Prototyping

PERKINS+WILL RESEARCH JOURNAL / VOL 03.02
46
5.0 PROJECTS AND COURSE OUTCOMESAt the end of ten teaching weeks, students were ex-posed to performance-driven design methodologies and fabrication techniques. Students demonstrated ad-vanced modeling skills to explore complex forms with parametric design processes. They also demonstrated various digital fabrication skills with CNC milling, laser cutting and casting as manufacturing methods. The fol-lowing are a few selected projects.
5.1 Parabolic ElasticityThe purpose of this project was to explore material prop-
erties of casting urethane elastomers and their struc-tural behavior. The form was derived based on tensile stresses and deflections of this material and behavior of a building skin component. The material performance became the design driver where the tensile stresses in the material were tested and adapted to a rigid frame. CNC-milled high density foam mold served as the cast-ing medium for liquid urethane elastomers. Series of lines were cut in the mold to form surface texture on the components. After all individual urethane elastomer components cured, they were assembled using alumi-num connectors (Figure 4).
Figure 4: Project example with fabricated cast urethane elastomers.

47
5.2 Geometric MorphThe purpose of this project was to investigate paramet-ric design as it relates to a component of a building skin with varying percentage of openings and con-trolled geometry. The module was designed as an ex-truded octagon, consisting of square openings where the scale of the aperture was controlled parametrically
based on design constraints. The design rule was that openings would be smallest at low points and largest at high points, which resulted in a gradient across the entire surface. This component was fabricated by laser cutting where the negative shapes were cut from mat-board to reveal the fabricated components and com-plex geometry (Figure 5).
Figure 5: Project example with laser cut parametrically-derived geometry.
Performance-Driven Design and Prototyping

48
PERKINS+WILL RESEARCH JOURNAL / VOL 03.02
5.3 Parabolic WeaveThe objective of this project was to create a shading system that responds to varying levels of solar radia-tion. The system consists of a metal frame and series of threads woven through the frame. The metal frame can be expanded and collapsed, changing the porosity
levels between the strings. The metal frame was fabri-cated from aluminum panels using CNC milling. Steel joints were manually fabricated and the prototype was assembled by joining individual aluminum frames and weaving string (Figure 6).
Figure 6: Project example with CNC-milled aluminum frames and movable parts.

6.0 CONCLUSION AND FUTURE COLLABORATIONNew developments in advanced computational tools and methods are offering unprecedented ways for de-sign exploration and evaluations. Performance-based design that integrates simulations and analysis in the design process has an advantage over traditional de-sign methods since it allows a certain design iteration to be measured and evaluated against different solutions. Also, digital fabrication techniques allow for creation of physical prototypes, which can be used to evaluate con-structability, material behavior and selection as well as aesthetic qualities. In this article, we discussed a collab-orative course focusing on performance-driven design and prototyping, which explored integration of simula-tions, environmental analysis, parametric design and digital fabrication. The projects showed that students learned effectively through emerging technologies that were introduced in the class. By engaging the students in an interactive and collaborative learning process through web conferencing and social media, we have created a rich learning environment crossing the bridge between academic institutions and architectural prac-tice. During the current fall quarter of 2011, a studio course has been launched at the University of Cincin-nati to further the collaboration and research.
ACKNOWLEDGEMENTSAuthors would like to acknowledge graduate students and their projects: 1) Parabolic Elasticity: Trevor Jordan and Brian Ballok; 2) Geometric Morph: Sarah Vaz; 3) Parabolic Weave: Ari Peskovtiz. Other graduate stu-dents that were involved in the “Performance-Driven Design & Prototyping” course are: Alexander Mega, Derek Sommers, Diane Guo, Frederik Berte, Gael Ta¬bet, James Herrmann, Jeff Badger, Jeffrey Renger-ing, Jessica Helmer, Kristen Flaherty, Mark Talma, and Victoria Saunders, (University of Cincinnati).
REFERENCES[1] Aksamija, A., and Mallasi, Z., (2010). “Building Per-formance Predictions: How Simulations Can Improve Design Decisions”, Perkins+Will Research Journal, Vol. 2, No. 2, pp. 7-32.
[2] Aksamija, A., Guttman, M., Rangarajan, H., and Meador, T., (2010). “Parametric Control of BIM Ele-ments for Sustainable Design in Revit: Linking Design and Analytical Software Applications through Custom-ization”, Perkins+Will Research Journal, Vol. 3, No. 1, pp. 32-45.
[3] Oxman, R., (2008). “Performance-Based Design: Current Practices and Research Issues”, International Journal of Architectural Computing, Vol. 6, No. 1, pp. 1-17.
[4] Aksamija, A., and Iordanova, I., (2010). “Computa-tional Environments with Multimodal Representations of Architectural Design Knowledge”, International Journal of Architectural Computing, Vol. 8, No. 4, pp. 439-460.
[5] Castle, H., (2005). “Design through Making”, Archi-tectural Design, Vol. 75, No. 4, pp. 4.
[6] Iwamoto, L., (2009). Digital Fabrications: Architec-tural and Material Techniques, New York, NY: Princeton Architectural Press.
49
Performance-Driven Design and Prototyping

50
PERKINS+WILL RESEARCH JOURNAL / VOL 03.02
05.BIM ON THE WAN:
ABSTRACTAs architects computerize their design practices they are faced with unique networking challenges. One of these is the “wide area design” problem. This is the problem of collaborating on large architectural projects from geo-graphically dispersed locations. Revit, in particular, presents acute collaboration challenges owing to its large monolithic file sizes and its rigid synchronous database architecture.
In this article we describe the unique networking challenges faced by design professionals. We explain the factors that impact network performance and using these factors, we describe and evaluate two possible solutions to the wide area design problem currently under consideration at Perkins+Will – Remote Desktop and Revit Server.
We end with some testing results of Revit WAN performance using both Remote Desktop and Revit Server.
KEYWORDS: networking, WAN, collaboration, remote desktop, revit server
Autodesk’s Revit and the Wide Area Design Problem
Victor Okhoya, Associate AIA, [email protected]
1.0 INTRODUCTIONIn the last ten years a revolution has been gathering momentum in the realm of building design practice with the introduction of building information modeling software applications. At the same time, the “network effect” has been sweeping through both the consumer and business worlds. Cheaper access to computing re-sources and advancement in network speeds and tech-nologies mean that today, business processes are, to a great extent, conducted on-line, whether through the cloud or by software as a service or through remote ac-cess to computing resources.
This growing reliance on, and expectation of, remote computing access has presented a special challenge to the design community and architects in particular. Ar-chitectural software has tended to lag in terms of gener-al development due to the specialized and niche market nature of architectural business needs and computer processing requirements tend to be steep because of the graphical nature of design. In fact, it is only in the last few years that online project collaboration on the same design model has begun to be a possibility for building designers.
As usual, the hype has tended to shadow the realities. Early attempts to solve the wide area network problem for designers were based on various wide area optimi-zation strategies and were met with much enthusiasm. Technologies such as wide area network accelerators like Riverbed’s Steelheads or wide area file services (WAFS) from Globalscape and Cisco were thought to be the panacea until it was realized that they are only part of the solution. Despite thousands of dollars of informa-tion technology (IT) investments, many leading archi-tectural practices found that while these technologies improved IT performance, they did not solve the Revit collaboration issue in a satisfactory way. This is because of the unique character of architectural practice when compared to other industries that are serviced by IT infrastructure for which these technologies may have proved adequate.
This is why it is important for architectural IT practi-tioners to understand the underlying networking is-sues as they evaluate different alternatives to the wide area design problem. Unfortunately, despite the acute computational challenges faced by designers, many IT professionals do not understand design or design soft-

BIM on the WAN
51
ware. This means that there is less research into solu-tions and less reliable information to inform strategic decision making. Even when information is available it tends to be too technical, intended for academics or IT professionals or too distorted intended for marketing. This article is a contribution to bridging this information gap in a fashion that is accessible to the architectural IT practitioners.
The article is structured in this following manner: we begin by describing the unique wide area network chal-lenges faced by architectural practices and then ex-plain the factors that impact WAN performance. Using these as a base reference, we describe and evaluate the performance profile of Remote Desktop and Revit Server. We conclude with the results of a quantitative test of Revit performance over the WAN.
2.0 THE UNIQUE WAN CHALLENGE FOR ARCHITECTURAL PRACTICESAlthough most architectural design practices in North America are now fully computerized, the digitization of the design process has come with some unique chal-lenges. First, visualization of design data is by definition graphical and this means it commands large amounts of resources in terms of processing capabilities, mem-ory and storage requirements. As an example, the rec-ommended specification for Revit Architecture is dual core processors running at above 3.0 GHz clock cycles, 4GB of RAM and file sizes on large projects easily sur-
pass 200MB. Three years ago these were considered top of the line specifications for standard laptop com-puters. At that time, it was difficult to run Revit projects on a laptop, whereas most other business needs were adequately catered for.
As a consequence, the network requirements for de-sign applications are demanding on a local area net-work (Figure 1). Gigabit technology is recommended for adapters, Ethernet and switches. On a WAN it has not been conceivable to attempt collaborating synchro-nously on centralized Revit projects from dispersed lo-cations until very recently.
The requirements of current business processes de-mand that designers must now conform to the need to share and access design data across large distances in real time. Large organizations with branch offices need to leverage resources across their different loca-tions; projects need to be done collaboratively between different organizations with one organization providing specialized design expertise from a remote location and another providing the actual project management at the location of the project. These situations need design data to be shared concurrently over wide area networks and the internet in general and this has proved to be a steep challenge.
A second challenge unique to design applications is their cumbersome software architecture that has not been designed or implemented for optimum network deployment. Where most enterprise level applications
Figure 1: Revit 2012 recommended specifications from Autodesk.
• Microsoft Windows 7 32-bit Enterprise, Ultimate, Professional, or Home Premium edition, Microsoft Windows Vista 32-bit (SP2 or later) Enterprise, Ultimate, Business, or Home Premium edition, or Micro-soft Windows XP (SP2 or later) Professional or Home edition
• For Microsoft Windows 7 32-bit or Microsoft Windows Vista 32-bit: Intel Pentium 4 or AMD Athlon dual core processor, 3.0 GHz (or higher) with SSE2 technology
• For Microsoft Windows XP: Intel Pentium 4 or AMD Athlon dual core, 1.6 GHz (or higher) with SSE2 tech-nology
• 4 GB RAM • 5 GB free disk space • 1,280 x 1,024 monitor with true color • Display adapter capable of 24-bit color for basic graphics, 256 MB DirectX 10-capable graphics card
with Shader Model 3 for advanced graphics Microsoft Internet Explorer 7.0 (or later) • Microsoft Mouse-compliant pointing device • Download or installation from DVD • Internet connectivity for license registration

52
have boasted distributed software architecture that is easy to deploy on networks large and small, architectur-al design software has tended towards desktop centric, file-based processing.
Revit, in particular, is built upon a monolithic, propri-etary database format that generates large project files (typically over 200MB) and is doubly challenged by processing graphics as well as parametric database relationships. Revit’s native solution to the project col-laboration question is a two-tier, database replication architecture with a server-based central file and client-based local files that are exact duplicates of the central file linked over a network. The central file performs re-cord level locking coordination and permits manually triggered synchronizations by the local files (Figure 2).
Although this central-local file approach may sound like a network-based solution, it suffers from the defect that the synchronization procedure transfers a large amount of data in one process call. It is true that the process is optimized to transmit only changes to the file since the last transmission. On large projects this can still be sig-nificant enough to last several seconds or a few minutes over slow connections.
Simple edits can also be affected by the record locking mechanisms due to the possibility of multiple paramet-ric relationships with objects that are not being edited.
Even though only one object may be chosen for editing by the user, Revit must check the edit state of several objects that may be in relationships with the edited ob-ject. This slows down performance and in the event of an edit lock to any of the related objects, Revit throws an exception that requires manual intervention through an edit request.
To add to this are some pragmatic factors working against the architect. Architectural firms tend to be comparatively small organizations and will typically not be capitalized to invest heavily in IT and network infra-structure. Design software is also a specialized niche market with relatively few vendors active in providing solutions to design professionals. This means that de-sign applications are not highly optimized for under-lying technologies and indeed IT infrastructure is not designed with design applications at the forefront of considerations. This makes it harder to deploy such ap-plications in environments like the internet where the long range network capabilities are still far behind the processing capability of the desktop or the LAN.
For Revit, this has meant that projects have had to be undertaken by teams at a single location. If at all a proj-ect was to be attempted by teams at more than one location, then the very project had to be split into more than one chunk and these chunks treated as separate projects and only assembled into a single whole peri-
PERKINS+WILL RESEARCH JOURNAL / VOL 03.02
Figure 2: Revit collaboration architecture over a LAN
CENTRAL FILE
LOCAL FILELOCAL FILE
Synchronize with Central
Synchronize with Central
Edit Request Borrowing

odically for coordination purposes. Needless to say, this approach is suboptimal and defeats the very reason for a single file database solution.
However, collaborating synchronously over a WAN is far from easy and has been virtually impossible with-out network enhancements like WAN optimizations and technologies that build on these optimizations such as Remote Desktop and Revit Server. To understand why and to better understand the strategies for solving the problem, we first need to understand the factors that impact network performance over the WAN.
3.0 WAN PERFORMANCE FACTORSThe following factors directly impact the performance of applications being deployed over a WAN: bandwidth, latency and throughput. In addition, protocols that are used by applications also contribute to WAN perfor-mance degradation. Finally, factors not inherent to the network like workstation hardware or operating systems also play a role, but we will not consider these factors in our analysis since they tend to hold constant across the WAN performance approach being considered1,2.
3.1 Bandwidth Bandwidth is given by the number of bits that can be transmitted over the network in a certain period of time (Figure 3). For example, a network might have 10Mbps bandwidth meaning it can deliver 10 million bits every second. In a LAN environment the available bandwidth
is generally higher than the requirements of two com-municating computers. Hence, remote desktop com-puting or thin clients is an attractive solution over to-day’s high speed LANs.
In a WAN environment, however, points of over-sub-scription or points of aggregation are often encoun-tered. These occur where several incoming links have to contend for fewer outgoing links through a switch or a router. This means that the switch or router must queue traffic, which causes delays. Further, WAN links will have different bandwidth capacities. Thus, several higher speed links may be in contention for a low speed link that only compounds the delay (Figure 3).
In addition, network protocols also introduce a signifi-cant amount of processing overhead, thus reducing the effective throughput of the transmissions. Trans-port protocols like TCP will add overhead in the form of segmenting, window management and acknowledge-ments. Network and data link protocols like IP and Eth-ernet add overhead due to packeting and framing. All these impact the effectiveness of WAN performance. This performance degradation is particularly acute for the designer who is typically transacting large volumes of data.
It is important to note that the ‘b’ in Mbps is a small ‘b’. eight bits make a byte and, therefore, when one talks about streaming a 200 MB Revit file across a WAN con-nection, they are essentially speaking about streaming 1600 Mb or 1.6 Gb.
53
Figure 3: The bandwidth problem.
BIM on the WAN

54
It is also worth noting that most non-specialists think of bandwidth when they think of network performance. After throwing hardware at a problem (i.e., buying new computers), the next step in solving performance is-sues is usually to try to increase bandwidth. Unfortu-nately, bandwidth is only one of a number of factors and taken by itself may not make very much of a difference. Both Remote Desktop and Revit Server act to mitigate bandwidth as a factor in network performance, but they do so in very different ways as we shall see.
3.2 LatencyLatency corresponds to how long it takes a transmission to travel from one end of a network to the other (Figure 4). Latency is measured in terms of time and could be one-way latency, the time taken from one end of a net-work to the other or it could be round trip time, which is the time to send a transmission to the other end of the network and back again. Latency has three main components: • Propagation: has to do with the fact that nothing
travels faster than the speed of light• Transmission: is a function of the bandwidth and
packet size• Queuing: packets need to be stored and processed
in the network before transmission.
Apart from geographical distance apart, some factors impacting latency include serialization delays, which is the amount of time for a network device to extract data from one queue and package it onto the next net-work for transmission; processing delays, which are the amount of time spent within the network node such as router, switch or firewall, determining how to handle a piece of data based on set rules; and forwarding delays,
which is the amount of time to determine where to for-ward a piece of data.
Another major factor affecting latency is the use of the Transmission Control Protocol (TCP). First, TCP must establish a connection, which involves the exchange of synchronization and acknowledgement responses. Second, TCP provides guaranteed service, which in-volves acknowledgment of successful receipt of data and a number of integrity checks, all of which increase the transmission delay.
Latency is one of the main factors impacting Remote Desktop and Revit Server. For Remote Desktop, even though a comparatively small amount of data is being transmitted across the WAN, this data still experiences latency related delays. In the case of Revit Server, high latency between the central server and the localized servers can impact the user experience for specific syn-chronization operations.
Other factors that affect network performance are throughput and the choice and design of network proto-cols. Throughput, or the net effective data transmission rate, is impacted by capacity, latency and packet loss. Protocols can act as a barrier to WAN performance if, for example, they were designed for a LAN environment and do not scale very well to the WAN. In this article we focus on bandwidth and latency as the major factors affecting WAN performance.
4.0 THE REMOTE DESKTOP PROTOCOLRemote Desktop Protocol (RDP) is a proprietary proto-col developed by Microsoft, which provides a user with a graphical interface to another computer. Formerly
PERKINS+WILL RESEARCH JOURNAL / VOL 03.02
Figure 4: The latency problem.
Long distance high latency
Short distance low latency

known as Terminal Services, it is the protocol that drives Microsoft’s version of a thin client solution.
In a Remote Desktop session, all computing is done on the remote computer (Figure 5). The local computer connects to the remote computer over the intervening network and only sends keyboard and mouse input over the network. The remote computer, in turn, sends back graphic display updates after processing the requested tasks. Application data does not stream over the net-work and this keeps bandwidth requirements low, thus enhancing performance.
In considering the performance of RDP as a solution to the Revit WAN collaboration issue, we need to ask two questions. First, is thin client computing truly a viable solution to the wide area design problem? Second, is RDP a good thin client solution for graphical applica-tions?
Although a thin client solution effectively circumvents the WAN bandwidth problem by removing the need to stream application data, it does nothing about the la-tency problem since the reduced RDP signals still have to travel the full length of the network path from the client to the remote server.
This means that, regardless of the bandwidth, if a WAN has a high latency (say 1000 milliseconds), then every operation that would take a second on a local computer will appear to take two seconds using RDP over the WAN. This means tasks will appear to have a lag and depending on the severity of this lag, the end user ex-perience can become intolerable. In reality, continental latency times fluctuate, but are in the order of 100 mil-liseconds in North America3. This value, though small,
has the cumulative effect of making the remote applica-tion appear to run significantly slower to the end user.
The second question is whether Microsoft’s Remote Desktop is actually a good thin client solution for graphic applications. According to Nieh and Yang, we can measure thin client applications according to four characteristics that influence their performance: display encoding, encoding compression, display update policy and client caching4.
Display encoding refers to the basic data type used to transmit screen updates such as a pixel. Encoding compression is the type of compression applied to the graphic data before transmission. Update policy is the policy for determining when screen updates are sent from the remote computer to the client, while the client cache is a cache for display data types that then do not have to be resent from the remote computer.
Yang et al. performed tests to measure the performance of six popular thin-client platforms running over a wide range of network access bandwidths5. They studied the behavior of these platforms when downloading web pages as well as when streaming video. Since graph-ics rendering is an approximation of video rendering at lower frame refresh rates, we present their findings with respect to video performance. We also restrict the discussion to the 1.5 to 10 Mbps bandwidth range as being most representative of current WAN bandwidths that Revit users encounter.
The remote desktop clients that were tested included Citrix MetaFrame, Microsoft Remote Desktop (Terminal Services), AT&T Virtual Network Computing, Sun’s Tar-antella, Oracle’s Sun Ray and Apple’s X. According to
55
Figure 5: : Remote desktop architecture.
BIM on the WAN
Remote Desktop Connection
Remote Nodewith Local File
Local Node
Central File
Remote LAN
Remote Node
WAN
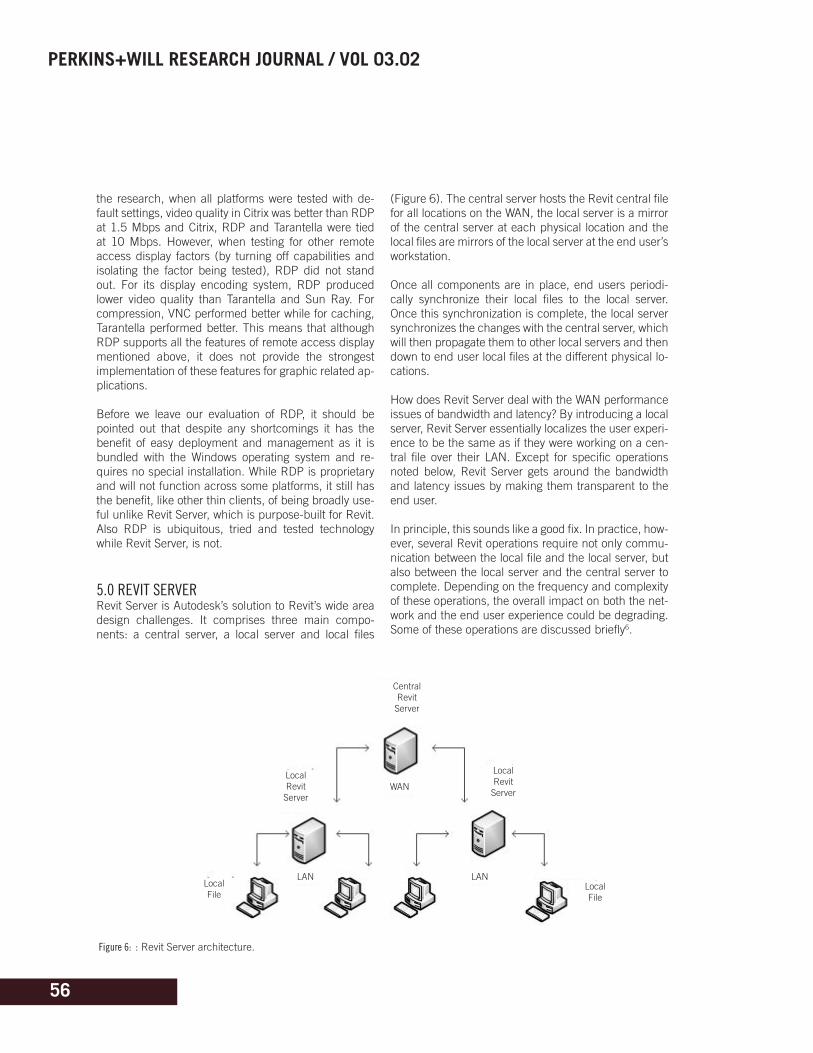
56
the research, when all platforms were tested with de-fault settings, video quality in Citrix was better than RDP at 1.5 Mbps and Citrix, RDP and Tarantella were tied at 10 Mbps. However, when testing for other remote access display factors (by turning off capabilities and isolating the factor being tested), RDP did not stand out. For its display encoding system, RDP produced lower video quality than Tarantella and Sun Ray. For compression, VNC performed better while for caching, Tarantella performed better. This means that although RDP supports all the features of remote access display mentioned above, it does not provide the strongest implementation of these features for graphic related ap-plications.
Before we leave our evaluation of RDP, it should be pointed out that despite any shortcomings it has the benefit of easy deployment and management as it is bundled with the Windows operating system and re-quires no special installation. While RDP is proprietary and will not function across some platforms, it still has the benefit, like other thin clients, of being broadly use-ful unlike Revit Server, which is purpose-built for Revit. Also RDP is ubiquitous, tried and tested technology while Revit Server, is not.
5.0 REVIT SERVERRevit Server is Autodesk’s solution to Revit’s wide area design challenges. It comprises three main compo-nents: a central server, a local server and local files
(Figure 6). The central server hosts the Revit central file for all locations on the WAN, the local server is a mirror of the central server at each physical location and the local files are mirrors of the local server at the end user’s workstation.
Once all components are in place, end users periodi-cally synchronize their local files to the local server. Once this synchronization is complete, the local server synchronizes the changes with the central server, which will then propagate them to other local servers and then down to end user local files at the different physical lo-cations.
How does Revit Server deal with the WAN performance issues of bandwidth and latency? By introducing a local server, Revit Server essentially localizes the user experi-ence to be the same as if they were working on a cen-tral file over their LAN. Except for specific operations noted below, Revit Server gets around the bandwidth and latency issues by making them transparent to the end user.
In principle, this sounds like a good fix. In practice, how-ever, several Revit operations require not only commu-nication between the local file and the local server, but also between the local server and the central server to complete. Depending on the frequency and complexity of these operations, the overall impact on both the net-work and the end user experience could be degrading. Some of these operations are discussed briefly6.
PERKINS+WILL RESEARCH JOURNAL / VOL 03.02
Figure 6: : Revit Server architecture.
WAN
LAN LAN
Central Revit Server
LocalRevit Server
LocalRevit Server
LocalFile
LocalFile

Element borrowing requires local servers to communi-cate with the central server before they can grant per-missions for an element to a local file. This is because permission states reside exclusively on the central server to prevent editing conflicts. On high latency net-works, these permissions cannot be granted without the experience of a lag. In fact, on high latency networks, it is recommended that users explicitly check out work-sets rather than rely on transparent element borrowing to avoid this permissions related lag.
Synchronizing to central by end users requires that changes are committed not only to the local server, but also to the central server for the operation to complete. On low bandwidth or high latency WANs, this can take significantly longer than synchronizing to central over a LAN. Moreover, a slow synchronize to central operation by a distant user will impact other users who cannot save to the locked central file. Teams, therefore, need to coordinate their synchronization times and this requires additional tools and management.
Depending on whether or not local server caches are up to date, the reload latest operation may also need to pull data down from the central server and in this case, the operation will slow down on high latency networks. This makes the operation unpredictable when using Revit Server whereas on a LAN, it is usually a fast one way data stream.
In addition, while localizing the user experience seems like a good way to get around the performance issues of bandwidth and latency, in the case of Revit Server this comes with substantial cost in administrative complex-ity7. Revit Server must be installed on Windows Server 2008 or later and on 64-bit systems. Microsoft.NET framework 3.5 SP1 or later is required. Further, an ad-ministrative install and configuration of IIS 7.0 or later is required.
Installing the central and local servers requires con-figuration of the server firewalls to allow ICMP requests. Then the servers are installed and configured to run as services whenever the server boots up. Permissions should be established for the Revit Server Administrator on both the central and local servers. Finally, the Revit Server extension should be installed on the end user machine and they can proceed to create local files from their local server as they normally would.
In order to execute synchronizations with the central file, users will need to establish communications by connecting to the Revit Server. Also managers are able
to perform basic management tasks by using the web based Revit Server Administrative Console.
Clearly there is much more to configure and manage than in the standard installation of Revit over a LAN. Since this is all done to run just one application and given the persistent latency issues we discussed above, these negatives must counterbalance what seems a gi-ant positive of localizing the Revit WAN experience to LAN performance.
6.0 COMPARATIVE ANALYSISThe following test results were taken to investigate the impact of the WAN on Revit processes when using RDP as well as Revit Server. The test was made over the Perkins+Will WAN between Vancouver with 10Mbps download and upload speed and Chicago with 45Mbps download and upload speed. All testing was done on Perkins+Will computational nodes to keep the hardware as close to uniform as possible. The Revit test file was chosen as a 200MB single file project that would rep-resent an average sized project in most of Perkins+Will offices. The tasks were chosen as being representative of typical procedures that a user would undertake on a Revit project, but that would clock sufficient cycles to be measured for comparison. The testing methodol-ogy involved performing each measurement twice with a third measurement to resolve any large discrepancy. In performing such tests a distinction should be made between processing performance and response per-formance. Processing performance has to do with how long the computer takes to perform tasks. Response performance, on the other hand, has to do with how smooth the user perceives interaction with the com-puter to be.
Response performance is hard to measure quantita-tively since it could involve aspects such as one sec-ond additional delay in cursor response time or a slower screen refresh rate as examples. It could, nonetheless, cumulatively cause the user experience to be as intoler-able as processing delays.
Four different scenarios were tested (Table 1):1. Revit Server with the central server in Chicago, the
local server in Vancouver and the central Revit file in Chicago.
2. Remote Desktop with the local client in Vancouver, remote computer in Chicago and the Revit file in Chicago.
3. Direct access over the WAN with the local com-puter in Vancouver and the Revit file in Chicago.
57
BIM on the WAN

58
4. A control Remote Desktop scenario over a 1Gbps LAN with the local computer in Vancouver, the re-mote computer in Vancouver and the Revit file in Vancouver.
The tasks for the test were:1. Open the file detached from central.2. Open the file a second time detached from central
to account for caching.3. Select all modeled objects in a 3D view.4. Select and swap 95 instances of exterior wall to a
different type.5. Create an array of 20 grouped room suites.6. Save the file as a new central file.7. Delete the suites created in 6 above and synchro-
nize the file to central.
From the results, we can conclude that over a com-paratively high performance WAN such as that between Vancouver and Chicago:
• For tasks involving network calls such as opening and saving files, Revit Server consistently performs poorer than Remote Desktop. It even performs poorer than direct access over an optimized WAN. For tasks that do not involve network calls, perfor-mance is about even.
• Display latency delays are not significant in mea-suring processing performance over the WAN. However, this is not to say that they are not a fac-tor in the response performance that contributes to the overall user experience.
• The overall performance of Revit is still primarily dependent on the power of the desktop rather than the underlying network infrastructure. Regardless
of the networking approach, in-process applica-tion tasks run at about the same clock speeds. It is only when application data needs to be transferred across the network that performance differences are observed.
These results are probably quite different for lower bandwidth WANs. Also, it is worth pointing out that these tests were done under single user conditions. Under multiple user conditions Revit Server’s coordina-tion of synchronizing to central may well provide perfor-mance enhancements. However, these considerations are outside the scope of this article.
7.0 CONCLUSIONIn this article we have undertaken to explain the unique networking challenges faced by architects. We have ex-plained the performance factors that affect a WAN. We then used these factors to describe the performance of two approaches to the wide area design problem - Re-mote Desktop and Revit Server. We ended with test re-sults of Revit performance under specified conditions.
From our discussion and testing, it is clear that under WAN conditions that are becoming commonplace, 10Mbps and above, Remote Desktop provides faster processing performance than Revit Server. At these bandwidths, latency related processing lags are neg-ligible. Also, only network related tasks are impacted; locally processed tasks are minimally impacted by the underlying networking approach.
If Revit Server has a place it may be in the event of high numbers of dispersed users working simultaneously, or
PERKINS+WILL RESEARCH JOURNAL / VOL 03.02
Task Revit Server
Remote Desktop on the WAN
Remote Desktop Remote Desktop on the LAN on the LAN
Direct access Direct access over the WANover the WAN
Open file 2:26:30 1:08:90 0:28:70 1:00:40
Open file cached 2:09:80 0:39:40 0:28:30 0:40:70
Select all 3D objects 0:28:20 0:30:40 0:24:40 0:23:50
Swap out exterior walls 0:37:50 0:39:90 0:35:40 0:35:10
Create group array 0:47:40 0:45:90 0:44:70 0:47:10
Save the file as new central 3:45:20 1:09:90 1:07:20 1:54:50
Synchronize to central 1:47:30 0:16:80 0:14:60 0:25:20
Table 1: Revit WAN test results in minutes.
under low bandwidth conditions such as to small office locations, or under high latency situations such as over a transcontinental link. Under these conditions, perfor-mance degradation of the other approaches may leave Revit Server as the best alternative by attrition. More testing is required to determine if this is the case.
REFERENCES[1] Peterson, L. and Davie, B., (2007). Computer Net-works: A Systems Approach, San Francisco, CA: Else-vier.
[2] Grevers, T. and Christner, J., (2007). Application Ac-celeration and WAN Optimization Fundamentals, India-napolis, IN: Cisco Press.
[3] Juniper Networks, (2005). Accelerating Application Performance across the WAN, White Paper, Retrieved on 9/2011 from http://www-05.ibm.com/uk/juniper/pdf/accelerating_application_performance_acros_the_wan_whitepaper.pdf.
[4] Nieh, J., and Yang, S., (2000). “Measuring the Multimedia Performance of Server-Based Comput-ing,” Proceedings of the 10th International Workshop on Network and Operating System Support for Digital Audio and Video, Retrieved on 9/2011 from http://www.sigmm.org/archive/NOSSDAV/NOSSDAV00.pdf
[5] Yang, S., Nieh, J., Selssky, M., and Tiwari, N., (2002). “The Performance of Remote Display Mecha-nisms for Thin-Client Computing,” Proceedings of the 2002 Usenix Annual Technical Conference, Retrieved on 9/2011 from www.usenix.org/event/usenix02/full_papers/yang/yang_html/.
[6] DC CADD, (2010). Autodesk Revit Server Instal-lation, Configuration and Workflow, White Paper, Re-trieved on 9/2011 from http://www.dccadd.com/papers/Revit%20Server%20White%20Paper.pdf.
[7] Autodesk, (2011). Use of Revit Server on High Latency Networks, White Paper, Retrieved on 9/2011 from http://de0qmbqba3hfm.cloudfront.net/attach-ments/53504/0.
59
BIM on the WAN

PERKINS+WILL RESEARCH JOURNAL / VOL 03.02
60

61
PEER REVIEWERS
SCOTT DIETZArchitecture & Digital Design Computation
Savannah College of Art and Design
HILDA ESPINALPerkins+Will
DR. FRANCOIS GROBLERConstruction Engineering Research Laboratory
US Army Corps of Engineers
DR. CAROL SUE HOLTZSchool of Nursing
Kennesaw State University
KAREN KENSEKSchool of Architecture
University of Southern California
DR. HYUNJOO KIMDepartment of Civil and Environmental Engineering,
California State University, Fullerton
DR. SINEM KORKMAZSchool of Planning, Design & Construction
Michigan State University
STEVE SANDERSONCASE
DAVID SHEEHANPerkins+Will
DR. MARDELLE McCUSKEY SHEPLEYCenter for Health Systems & Design
Texas A&M University
BRIAN SKRIPACDesignGroup

62
DIANA DAVISDiana is a registered project architect and healthcare planner in the Atlanta office of Perkins+Will specializing in the design of neonatal and adult critical care units, sur-gery centers and clinical laboratories. Her research interests include the application of “Lean” planning principles to clinical laboratory design and the implications of evidence based design within the healthcare environment. She served as co-editor for the second volume of Perkins+Will’s Ideas+Buildings series and was co-author of two refereed articles in the Journal of Perinatology comparing patient progress and parental and staff satisfaction between open bay ward and single family room NICU designs.
BOWMAN DAVISDr. Davis is Professor Emeritus with the Department of Biology and Physics at Kennesaw State University. He has held adjunct research positions at Georgia Institute of Technology with research interests in neurobiology and aging. He presently consults with Perkins+Will on evidence based design studies in neonatal intensive care, cardiovascular care and postoperative surgical management facilities. Previous publications range from academic textbooks and manuals to journal articles on the biochemistry of aging and neurobiological and behavioral model systems.
DANA ANDERSONDana has more than 20 years of experience in a wide range of renovation and new construction projects for institutional and corporate clients. His work in the Higher Education sector is fueled by his interest in the integration of learning technologies that extend beyond the classroom to living environments and enrich the residence life experience. His most recent projects include residence halls at Bridgewater University, Roger William University and Appalachian State University. Dana is a registered architect, NCARB and is LEED accredited.
AUTHORS
01.
01.
YANEL DE ANGEL SALASYanel, an architect with more than 12 years of experience, is interested in transformative spaces and ephemeral environments. Her extensive academic research on ephemeral architecture includes a recent fellowship at the MacDowell Colony studying a contemporary version of triumphal carts for the Palio ritual in Siena, Italy. In the Higher Education sector, she has focused on residence halls, student centers, learning environments and the integration of carbon neutral, sustainable, Net-Zero energy buildings. She is a registered architect, NCARB and is LEED accredited.
02.
02.
PERKINS+WILL RESEARCH JOURNAL / VOL 03.02

63
Authors
03.
02.
04.
04.
MING TANGMing Tang is the an assistant professor at the School of Architecture and Interior Design, University of Cincinnati. His multi-disciplinary research includes parametric architecture and urban design, fabrication, BIM, performance-driven design, computation, virtual reality, GIS, simulation, interactive design and visual effects. His research has been published in various international conferences, journals, books and exhibitions. He is the author of the book, Urban Paleontology: Evolution of Urban Forms. He founded his design firm, Tang & Yang Architects, LLC and has won numerous international design awards.
AJLA AKSAMIJA Dr. Ajla Aksamija is a building technology researcher and leads Perkins+Will’s Tech Lab. Tech Lab is an on-going research program of the Excellence in Execution Initia-tive to advance the performance of project designs, to improve design decision mak-ing and documentation and to promote commitments to sustainability, innovation, performance and value. Dr. Aksamija has worked on developing building analysis applications, implementation of novel materials in architectural design, develop-ment of computational models and has collaborated with researchers from various disciplines—engineering, computer science and material science. She has contrib-uted to several books, has published numerous research articles and has presented at national and international conferences.
MARIO GUTTMANMario is a senior associate and the firmwide design applications research leader for Perkins+Will. In this role, he promotes research on the advanced use of software and its application to building industry design practice. Mario holds degrees in mathematics and architecture, is a licensed architect and is LEED accredited. In addition to nearly 30 years of practicing architecture, he has worked in software development, computer-aided facility management and construction. He has been an active participant in industry standards organizations and a frequent speaker in support of building information modeling and integrated project delivery.
AUSTIN POEAustin is an intern from the University of Hawaii and is currently working towards a Doctorate of Architecture degree. He has previous modular design experience work-ing with the Ohio State University and the University of Hawaii on the Department of Energy Solar Decathlon proposals. He has worked as a graduate assistant for the Futures of Higher Education - Campuses 2060 with University of Hawaii professors Raymond Yeh and Jim Dator.

64
PERKINS+WILL RESEARCH JOURNAL / VOL 03.02
MICHAEL HODGEMichael is a designer in the Atlanta office of Perkins+Will and a design technol-ogy leader. He is involved in a number of firmwide initiatives where approaches to design computation are being investigated and defined. He is the coordinator/mod-erator of a firmwide focus group “nD.” The group is an interdisciplinary think-tank, currently organized to bridge research and development as applicable to process-centric design approaches. The nD group is a collection of individuals in the firm researching, promoting knowledge management and developing techniques and methods adapting computation to the design culture of the firm.
JONATHON ANDERSONJonathon Anderson is an assistant professor of Interior Architecture at the University of North Carolina Greensboro. He received a masters of fine arts from Savannah College of Art and Design and holds an architecture degree from Southern Illinois University. His work explores how industrial manufacturing and CNC technology influence the design process. Jonathon is the founder and coordinator of the CAMstudio (computer. aided. making studio), housed in the department of Interior Architecture at UNCG. He has published and presented work around the world and is a founding partner of the international design firm sur:FACE and a research firm MADcubic.
VICTOR OKHOYAVictor is a trained architect and a design applications manager with Perkins+Will. He has ten years of experience in BIM-related consulting and is currently a Masters in IT candidate at Harvard’s Extension School.
AUTHORS
04.
04.
05.

65
Authors

Through its “Green Initiative” Program, Phase 3 Media offers
recycled and windpowered paper stocks, recycles all of its
own post-production waste, emails all client invoices, and
uses environmentally friendly, non-toxic cleaning supplies,
additionally Phase 3 Media donates 5% of all sales from its
recycled product lines to Trees Atlanta.
This piece is printed on Mohawk sustainable paper which is
manufactured entirely with Green-e certifi cate wind-generated electricity.

© 2011 Perkins+Will All Rights Reserved
For more information, please send an email to [email protected]