Embed Size (px)
Citation preview

Research
In
Engineering and Technology Education
NATIONAL CENTER FOR ENGINEERINGAND TECHNOLOGY EDUCATION
This material is based on work supported by the NationalScience Foundation Under Grant No. ESI-0426421
Engineering Design Activity: Understanding How Different Design Activities Influence Students’
Motivation in Grades 9-12
Final Report
A Seed Grant Research Project
funded by
National Center for Engineering and Technology Education (NCETE)
Oenardi Lawanto, PhD – Utah State University (PI) Gary Stewardson, PhD – Utah State University (Co-PI)
August 31, 2009
Engineering Design Activity: Understanding How Different Design Activities Influence Students’ Motivation in Grades 9-12 Page 1
Engineering Design Activity: Understanding How Different Design Activities Influence
Students’ Motivation in Grades 9-12
Oenardi Lawanto, PhD – Utah State University (PI)
Gary Stewardson, PhD – Utah State University (Co-PI)
Abstract
The objective of this study was to evaluate grade 9-12 students’ motivation while
engaged in two different engineering design projects: marble-sorter and bridge designs. The
motivation components measured in this study were focused on students’ intrinsic (IGO) and
extrinsic (EGO) goal orientations, task value (TV), self-efficacy for learning and performance
(SELP), and control belief (CB). After finishing each project, students were asked to complete an
Engineering Design Questionnaire (EDQ) survey instrument. The instrument consisted of 26
items modified from motivational scales of the Motivated Strategies for Learning Questionnaire
(MSLQ).Besides the motivational scales, five demographic and two open-ended questions
exploring students’ most and least motivating aspects about their designs were added to the
instrument.
From the statistical tests, the results showed a significant difference on students’ IGO
during marble-sorter and bridge design activities. Students’ intrinsic goal orientation was
significantly higher on bridge design than marble-sorter design. Students who planned to major
in engineering or technology education were more significantly motivated working on the two
design activities than those who whose majors were in other areas. Students’ EGO did not appear
to be correlated to their IGO, TV, SELP, and CB. Common themes associated with student
motivation in the activities are presented in this report.
Introduction
There is a shortage of engineering students in many engineering colleges and universities.
Scholars and educators argue that one of the reasons for the limited number of students interested
in engineering education is because of their lack of sufficient science and mathematics skills.
Various efforts, such as inviting students to participate in engineering design competitions and
advocating students to enter engineering school have been attempted to attract high school
students to enroll; however, these efforts have been less than successful. In the educational
research domain, few studies have been conducted to investigate the issue from the perspective
of the students’ perception about engineering activities. Is the lack of science and mathematics
skills the main reason for the shortage, or are there other factors, such as insufficient analytic
skills that demotivate students to engage in engineering design activities? Although there may be
numerous factors that contribute to the shortage of engineering students, evaluating student
motivation in relation to different design activities should positively contribute to the knowledge
building in the field of engineering and technology education particularly at the precollege level.
This study was to evaluate how approaches to solve a design problem affect students’ motivation
in grades 9-12.
Engineering Design Activity: Understanding How Different Design Activities Influence Students’ Motivation in Grades 9-12 Page 2
To solve an engineering design challenge, grade 9-12 students were encouraged to apply
a standard set of steps to systematically lead to a solution. As educators, it may seem logical to
assume that these rigorous engineering problem-solving steps may influence how the students
perceive the design process and what engineering is all about. The students’ perception of their
engineering design activities impacts their motivation to learn about engineering and pursue the
curriculum as their field of study in college.
Inasmuch as the intent of this study is to better understand how different approaches to
solving an engineering design problem impact students’ motivation, two distinct design projects
were chosen: a design challenge that relies on design analysis (i.e., bridge design) and one that
relies on a creative trial-and-error process (i.e., marble sorter). Approximately 80 students in
grades 9-12 from several schools that implemented the Project Lead the Way (PLTW)
curriculum participated in the study. Two versions of the Engineering Design Questionnaires
(EDQ) were used to assess students’ motivation: EDQ-Bridge-Design (EDQ-BD) and EDQ-
Marble-Sorter-Design (EDQ-MSD). One research question was constructed to guide the study:
How do analysis-focused and creative trial-and-error-focused design activities impact students’
motivation?
Purpose of the Study
The purpose of this study was to better understand how different approaches to solving an
engineering design problem impact students’ motivation. This study evaluated students’
motivation while working on two distinct engineering design activities: a design challenge that
relies on design analysis and one that relies on a creative trial-and-error process. The design
analysis is analogous to the engineering design procedure and the creative trial-and-error
approach is associated with a technological problem solving approach.
Relevant Literatures
Engineering challenges that deal with both the design and construction of devices that
satisfy constraints are increasingly used in K-12 science courses (Sadler et al., 2000). These
engineering design projects engage students in ―open-ended, science-based problem-solving
situations" (Samuel, 1986, p. 218). According to engineering and technology education
literature, K-12 instructors and college faculty involved in these relevant fields have reported
high levels of student enthusiasm for these competitions. Sadler et al. (2000) further argued that
many high school physics teachers have experimented with engineering challenges in their
classes. These efforts generally use various construction materials to implement the time-
constrained building of a working device designed to solve some imagined problem and ―allow
only a single competitive test after weeks of building‖ (Sadler et al., 2000, p. 300). Engineering
design projects used in these courses are usually complex and time-consuming. The challenges
emphasize design and communication solutions to complex problems and seldom optimize the
utilization of the fundamental scientific principles (Sadler et al., 2000). Few studies have
examined how different problem-solving approaches in engineering design influence high school
students’ motivation.
Motivation is a drive that stimulates students to achieve their objectives (e.g., academic
success). Motivation can be embodied by goal-oriented behavior and reflects ―the willingness of
the students to exert high levels of effort toward achieving goals‖ (Chowdhury & Shahabuddin,
Engineering Design Activity: Understanding How Different Design Activities Influence Students’ Motivation in Grades 9-12 Page 3
2007, p. 1). Motivation has an effect on how and why people learn as well as their performance
(Pintrich & Schunk, 1996). It consists of several aspects: intrinsic motivation, extrinsic
motivation, and self-efficacy, all of which have been widely discussed insofar as their
interrelationship and effects on academic performance. While intrinsic motivation is defined as
the student’s inner inclination to engage in tasks for reasons such as challenge, curiosity, and
mastery, the extrinsic reward (a source of extrinsic motivation) is one external incentive to the
performance (Chowdhury & Shahabuddin, 2007). Self-efficacy refers to judgments about one’s
abilities to succeed in a given task (Bandura, 1997). In addition, it refers to beliefs in one’s skills
to ―mobilize the motivation, cognitive resources, and courses of action needed to meet given
situational demands‖ (Wood & Bandura, 1989, p. 408). Self-efficacy applies to a variety of
contexts and is a good predictor of performance and behavior (Bandura, 1978, Gist & Mitchell,
1992). Numerous studies (e.g., Bandura & Schunk, 1981; Brown & Inouyne, 1978; Schunk,
1981; Weinberg, Gould, & Jackson, 1979) have suggested that strong self-efficacy beliefs are
more likely to stimulate people to exert greater efforts to overcome a challenge, while weak self-
efficacy beliefs tend to reduce people’s efforts or even enable them to quit (Chowdhury &
Shahabuddin, 2007). Self-efficacy beliefs influence people’s behavior and motivation in several
ways: they determine the difficulties of the goals people set for themselves; how much effort
they exert; how persistent they are when confronted with difficulties; and their resilience to
failures (Chowdhury & Shahabuddin, 2007). Task value refers to the students’ perception of
whether the task is interesting, important, and useful. Control of learning involves students’
beliefs that learning depends on their endeavors rather than external causes, such as the teacher.
In this sense, if students believe that their efforts towards achieving satisfactory outcomes have a
positive influence on their learning, they will be more likely to engage in learning activities
strategically and effectively.
Among numerous studies on motivation, there is a long-standing controversy over
whether extrinsic rewards undermine intrinsic motivation. The central source of the
contemporary debate is Deci, Koestner, and Ryan’s (1999a) widely held claim that ―tangible
rewards tend to have a substantially negative effect on intrinsic motivation‖ (pp. 658-659). A
number of scholars, including Eisenberger, Pierce, and Cameron, have offered contradictory
statements and evidence to argue against the perspective of Deci et al. For example, Eisenberger
et al. proposed the notion that the effects of extrinsic and intrinsic rewards are not interactive, but
generally additive (Mawhinney, 1990; Porter & Lawler, 1968; Staw, 1977). Mawhinney (1979)
argued that ―We have not found support for the Deci-type theory. To the contrary, we have found
evidence indicating that those people who are most highly intrinsically motivated by a task are
those least likely to exhibit any post extrinsic reinforcement decrement to intrinsic motivation‖
(Mawhinney, Dickinson, & Taylor, 1989; Mawhinney, 1979; pp.188-189). Nevertheless, few
studies have focus on the comparison of students’ motivation, including intrinsic and extrinsic
motivation, during two different engineering design activities that require two distinct problem-
solving strategies.
Project Lead the Way
Project Lead the Way (PLTW) is a national nonprofit educational organization that
provides middle and high school students with hands-on, rigorous, and preliminary courses
involved in engineering or biomedical sciences. It creates partnerships with public schools,
Engineering Design Activity: Understanding How Different Design Activities Influence Students’ Motivation in Grades 9-12 Page 4
higher education institutions, and the private sector to prepare students for a successful career in
the field of science, engineering, and engineering technology.
Historically, PLTW was launched in 1996 and first introduced to 12 New York State high
schools in the 1997-1998 school year. Based on generous grants and hard work, PLTW was
established as an independent nonprofit program by 1997. With the advent of its second decade,
PLTW continues to grow and develop while continuing to provide rigorous and challenging
courses. So far, the program has spread to 3,000 schools in 50 states as well as the District of
Columbia.
Project Lead the Way (PLTW) curriculum activities were chosen for this study for two
reasons. The primary reason was in the PLTW course, Principle of Engineering (POE), there are
two hands-on problem solving activities that utilize two different problem-solving techniques,
both common in engineering. The second reason is PLTW requires formal training of all of its
teachers insuring more consistency in the delivery of the curriculum.
Principle of Engineering
The purpose of Principles of Engineering (POE), one of the courses in the high school
program, is to explore technology systems and manufacturing processes, and address the social
and political consequences of technological change through a combination of activities-, project-,
and problem-based learning. It acquaints students with a wide range of careers in engineering
and technology. The two activities selected from the POE course were the marble-sorter activity
and the bridge design activity.
Marble-Sorter and Bridge Design Activities
The intent of the marble-sorter project is to design and build a device that sorts three
different colors (blue, transparent, and opaque) of marbles into their respective bins. The marble-
sorting activity requires a problem solving approach which requires creative thinking and testing
for positive or negative feedback. Students design, assemble, program, and test multiple systems
and subsystems before settling on a final solution. Prior to designing and building their marble
sorters, students study data acquisition and control and programming techniques, and the
assembly of Fischertechnik components. The Fischertechnik kits are the sources of all
components except the hopper and the bin-moving systems.
The marble sorter consists of several functional systems, including the hopper,
separation, sensing, trap door, and bin-moving systems, all of which work together through a
computer interface to accomplish the objective. The hopper system enables the marbles to align
in a single-file line in order to move them into the receiver channel smoothly under the influence
of gravity. The function of the separation system is to separate the marbles so that they fall into
the testing chamber, one at a time. The sensing system, which consists of a lamp and a photo
resistor, detects the colors of the marbles, and its readings are used to determine which bin to
move. The sensing system operates the trap door system as well. The marble falls into the bin
under the control of a trap door mounted at the bottom of the testing chamber.
In the bridge design project, students used knowledge of material properties and the
effects of stress to design and construct a bridge made from balsa wood. The goal of the project
was to design and build a bridge that can hold the largest load while minimizing the bridge
weight. The bridge design activity requires a problem solving approach which emphasizes the
analysis aspect of the engineering design process. Prior to designing and building their bridge,
students learn about the strength of materials through a hands-on tensile testing activity, learn to
Engineering Design Activity: Understanding How Different Design Activities Influence Students’ Motivation in Grades 9-12 Page 5
solve free body diagram, and stimulate structures through a variety of software packages.
Through the design analysis process, students have predictive design solution prior to building
their design.
The students were required to work in small groups to finish the project on their own.
Each group needed to figure out how to design and construct the device. While the group
members had different ideas on how to build the sorter, another objective was to resolve conflicts
and agree on the most logical solution to the project. In addition to gaining hands-on experience
in engineering, they learned to work in a team where each member’s knowledge and skills were
used to the best advantage. They needed to combine their strengths to achieve the objective.
During the project, the students learned how to cooperate and compete with others to achieve
deadlines, budgets, communication, and interpersonal relationships.
The Study
Research Questions
One broad research question was constructed to guide this study: How do analysis-
focused and creative trial-and-error-focused design activities impact students’ motivation?
Study Participants
One hundred twenty three students from five high schools participated in the study. These
schools implement Project Lead the Way curriculum and were located in Indiana, Missouri, and
Utah. One hundred and four students completed the EDQ for marble-sorter design, and 53
students completed EDQ for bridge design. Among the five schools, only two had successfully
completed both marble-sorter and bridge design activities, and only 34 students completed both
EDQ surveys.
Instrumentation
This study utilized an Engineering Design Questionnaires (EDQ) survey instrument to
assess student’s motivation. Two versions of EDQ (i.e., EDQ-Bridge Design and EDQ-Marble-
Sorter Design) were used in this study. Basically, those two versions are identical, except the
instruction provided in each version was specifically made to reflect each type of design activity
(i.e., Bridge Design, Marble-Sorter Design). A statement such as ―Please think of your marble-
sorter design activity while reading these statements,‖ or ―Please think of your bridge design
activity while reading these statements‖ was used. The motivational scales in EDQ were taken
from the Motivated Strategies for Learning Questionnaire (MSLQ) survey instrument. Five
demographic and two open-ended questions were added in both versions of the EDQ to provide
additional information about each student.
The Motivated Strategies for Learning Questionnaire (MSLQ) is a self-report instrument
developed by Pintrich, Smith, Garcia, and McKeachie (1991) to assess college students’
motivational orientations and their use of different learning strategies for a college course.
Although MSLQ is designed for a college course, the researchers chose this instrument for three
reasons: (1) This is the only instrument available that measures motivation with the value and
expectancy components; (2) This instrument has been widely used in educational research in
college and lower-level education courses; (3) Because the course in which the study participants
enrolled (i.e. Principle of Engineering) is college credit equivalent, it was expected that
statements in this survey would be understood by sophomore and junior high school students.
Engineering Design Activity: Understanding How Different Design Activities Influence Students’ Motivation in Grades 9-12 Page 6
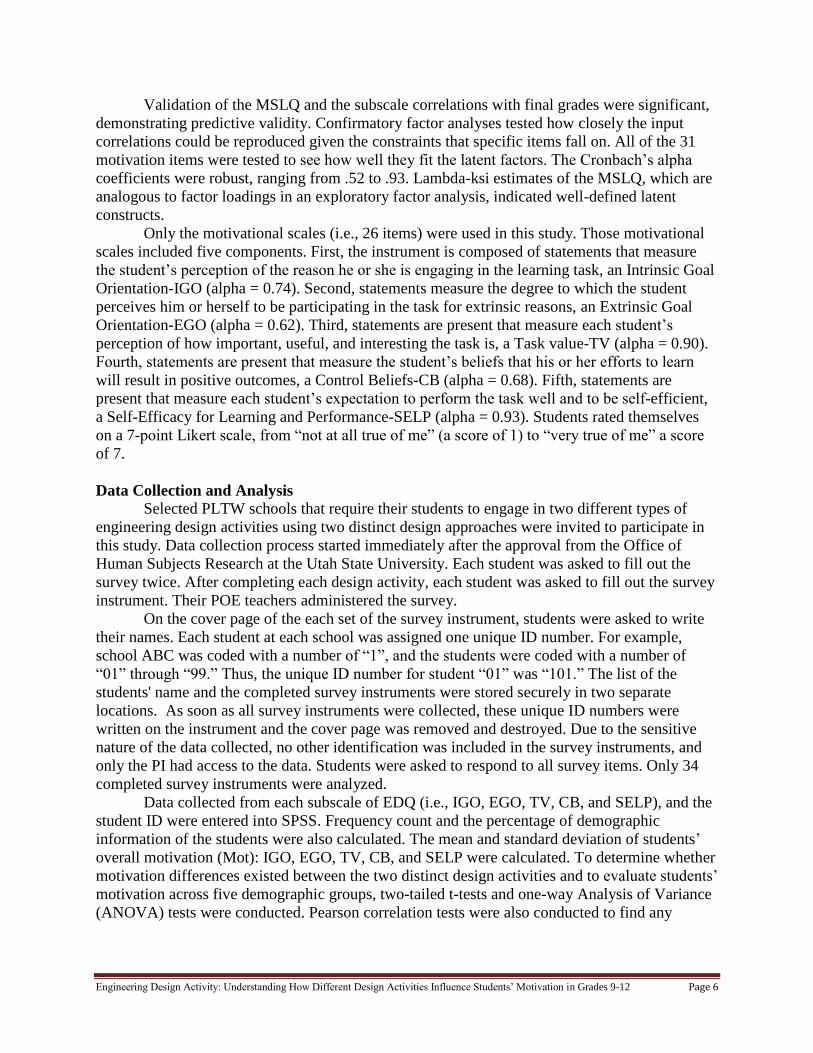
Validation of the MSLQ and the subscale correlations with final grades were significant,
demonstrating predictive validity. Confirmatory factor analyses tested how closely the input
correlations could be reproduced given the constraints that specific items fall on. All of the 31
motivation items were tested to see how well they fit the latent factors. The Cronbach’s alpha
coefficients were robust, ranging from .52 to .93. Lambda-ksi estimates of the MSLQ, which are
analogous to factor loadings in an exploratory factor analysis, indicated well-defined latent
constructs.
Only the motivational scales (i.e., 26 items) were used in this study. Those motivational
scales included five components. First, the instrument is composed of statements that measure
the student’s perception of the reason he or she is engaging in the learning task, an Intrinsic Goal
Orientation-IGO (alpha = 0.74). Second, statements measure the degree to which the student
perceives him or herself to be participating in the task for extrinsic reasons, an Extrinsic Goal
Orientation-EGO (alpha = 0.62). Third, statements are present that measure each student’s
perception of how important, useful, and interesting the task is, a Task value-TV (alpha = 0.90).
Fourth, statements are present that measure the student’s beliefs that his or her efforts to learn
will result in positive outcomes, a Control Beliefs-CB (alpha = 0.68). Fifth, statements are
present that measure each student’s expectation to perform the task well and to be self-efficient,
a Self-Efficacy for Learning and Performance-SELP (alpha = 0.93). Students rated themselves
on a 7-point Likert scale, from ―not at all true of me‖ (a score of 1) to ―very true of me‖ a score
of 7.
Data Collection and Analysis
Selected PLTW schools that require their students to engage in two different types of
engineering design activities using two distinct design approaches were invited to participate in
this study. Data collection process started immediately after the approval from the Office of
Human Subjects Research at the Utah State University. Each student was asked to fill out the
survey twice. After completing each design activity, each student was asked to fill out the survey
instrument. Their POE teachers administered the survey.
On the cover page of the each set of the survey instrument, students were asked to write
their names. Each student at each school was assigned one unique ID number. For example,
school ABC was coded with a number of ―1‖, and the students were coded with a number of
―01‖ through ―99.‖ Thus, the unique ID number for student ―01‖ was ―101.‖ The list of the
students' name and the completed survey instruments were stored securely in two separate
locations. As soon as all survey instruments were collected, these unique ID numbers were
written on the instrument and the cover page was removed and destroyed. Due to the sensitive
nature of the data collected, no other identification was included in the survey instruments, and
only the PI had access to the data. Students were asked to respond to all survey items. Only 34
completed survey instruments were analyzed.
Data collected from each subscale of EDQ (i.e., IGO, EGO, TV, CB, and SELP), and the
student ID were entered into SPSS. Frequency count and the percentage of demographic
information of the students were also calculated. The mean and standard deviation of students’
overall motivation (Mot): IGO, EGO, TV, CB, and SELP were calculated. To determine whether
motivation differences existed between the two distinct design activities and to evaluate students’
motivation across five demographic groups, two-tailed t-tests and one-way Analysis of Variance
(ANOVA) tests were conducted. Pearson correlation tests were also conducted to find any
Engineering Design Activity: Understanding How Different Design Activities Influence Students’ Motivation in Grades 9-12 Page 7
correlation between the five motivational aspects. As it is for open-ended questions, common
themes and frequency count for each theme were coded.
Results
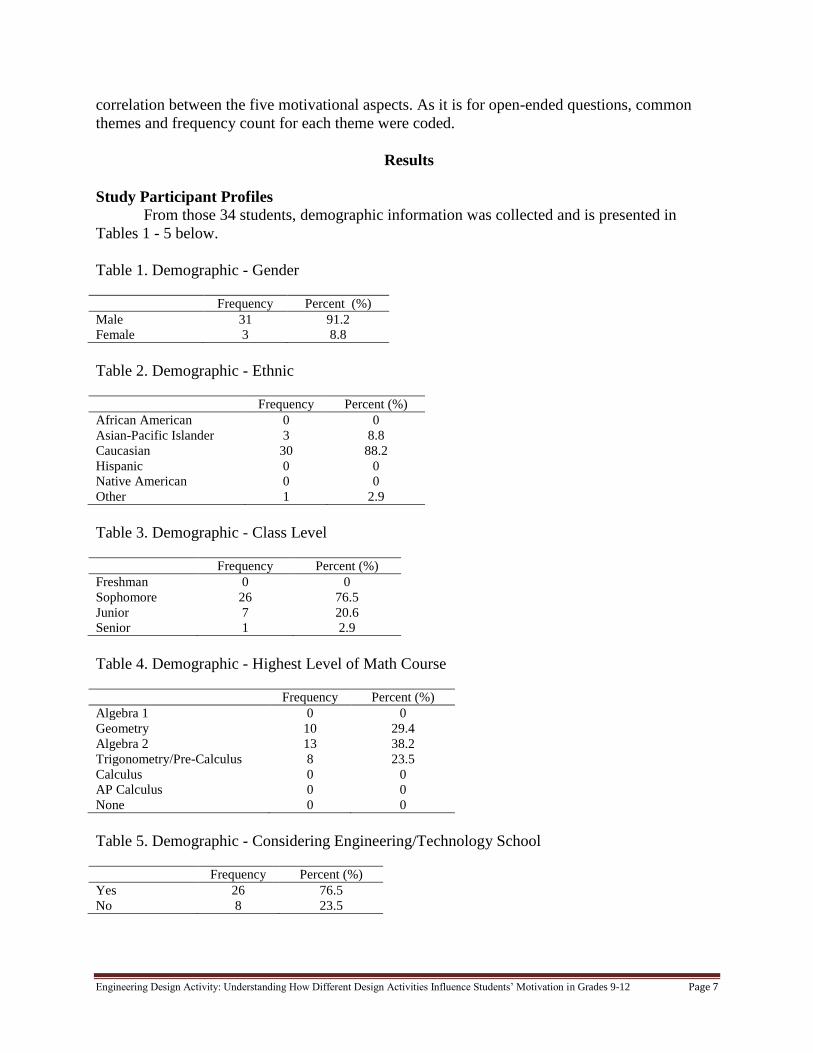
Study Participant Profiles
From those 34 students, demographic information was collected and is presented in
Tables 1 - 5 below.
Table 1. Demographic - Gender
Frequency Percent (%)
Male 31 91.2
Female 3 8.8
Table 2. Demographic - Ethnic
Frequency Percent (%)
African American 0 0
Asian-Pacific Islander 3 8.8
Caucasian 30 88.2
Hispanic 0 0
Native American 0 0
Other 1 2.9
Table 3. Demographic - Class Level
Frequency Percent (%)
Freshman 0 0
Sophomore 26 76.5
Junior 7 20.6
Senior 1 2.9
Table 4. Demographic - Highest Level of Math Course
Frequency Percent (%)
Algebra 1 0 0
Geometry 10 29.4
Algebra 2 13 38.2
Trigonometry/Pre-Calculus 8 23.5
Calculus 0 0
AP Calculus 0 0
None 0 0
Table 5. Demographic - Considering Engineering/Technology School
Frequency Percent (%)
Yes 26 76.5
No 8 23.5
Engineering Design Activity: Understanding How Different Design Activities Influence Students’ Motivation in Grades 9-12 Page 8
Students’ Motivation
A. Descriptive Statistics of Students’ Motivation
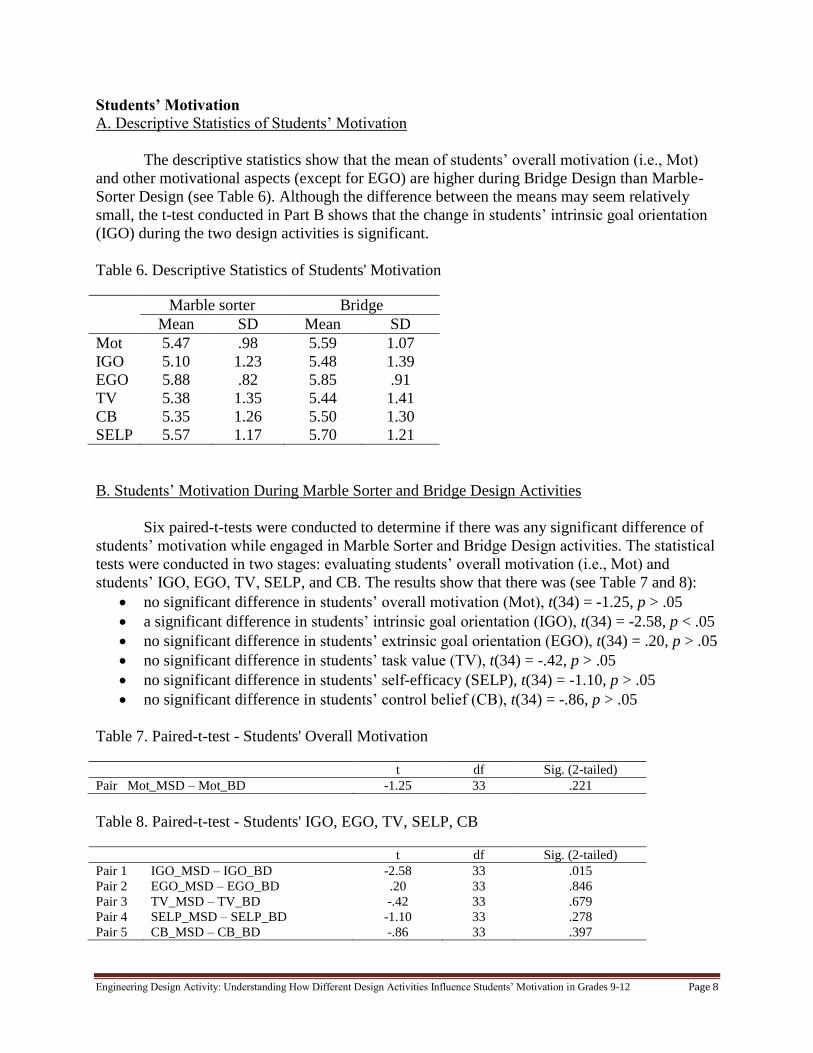
The descriptive statistics show that the mean of students’ overall motivation (i.e., Mot)
and other motivational aspects (except for EGO) are higher during Bridge Design than Marble-
Sorter Design (see Table 6). Although the difference between the means may seem relatively
small, the t-test conducted in Part B shows that the change in students’ intrinsic goal orientation
(IGO) during the two design activities is significant.
Table 6. Descriptive Statistics of Students' Motivation
Marble sorter Bridge
Mean SD Mean SD
Mot 5.47 .98 5.59 1.07
IGO 5.10 1.23 5.48 1.39
EGO 5.88 .82 5.85 .91
TV 5.38 1.35 5.44 1.41
CB 5.35 1.26 5.50 1.30
SELP 5.57 1.17 5.70 1.21
B. Students’ Motivation During Marble Sorter and Bridge Design Activities
Six paired-t-tests were conducted to determine if there was any significant difference of
students’ motivation while engaged in Marble Sorter and Bridge Design activities. The statistical
tests were conducted in two stages: evaluating students’ overall motivation (i.e., Mot) and
students’ IGO, EGO, TV, SELP, and CB. The results show that there was (see Table 7 and 8):
no significant difference in students’ overall motivation (Mot), t(34) = -1.25, p > .05
a significant difference in students’ intrinsic goal orientation (IGO), t(34) = -2.58, p < .05
no significant difference in students’ extrinsic goal orientation (EGO), t(34) = .20, p > .05
no significant difference in students’ task value (TV), t(34) = -.42, p > .05
no significant difference in students’ self-efficacy (SELP), t(34) = -1.10, p > .05
no significant difference in students’ control belief (CB), t(34) = -.86, p > .05
Table 7. Paired-t-test - Students' Overall Motivation
t df Sig. (2-tailed)
Pair Mot_MSD – Mot_BD -1.25 33 .221
Table 8. Paired-t-test - Students' IGO, EGO, TV, SELP, CB
t df Sig. (2-tailed)
Pair 1 IGO_MSD – IGO_BD -2.58 33 .015
Pair 2 EGO_MSD – EGO_BD .20 33 .846
Pair 3 TV_MSD – TV_BD -.42 33 .679
Pair 4 SELP_MSD – SELP_BD -1.10 33 .278
Pair 5 CB_MSD – CB_BD -.86 33 .397
Engineering Design Activity: Understanding How Different Design Activities Influence Students’ Motivation in Grades 9-12 Page 9
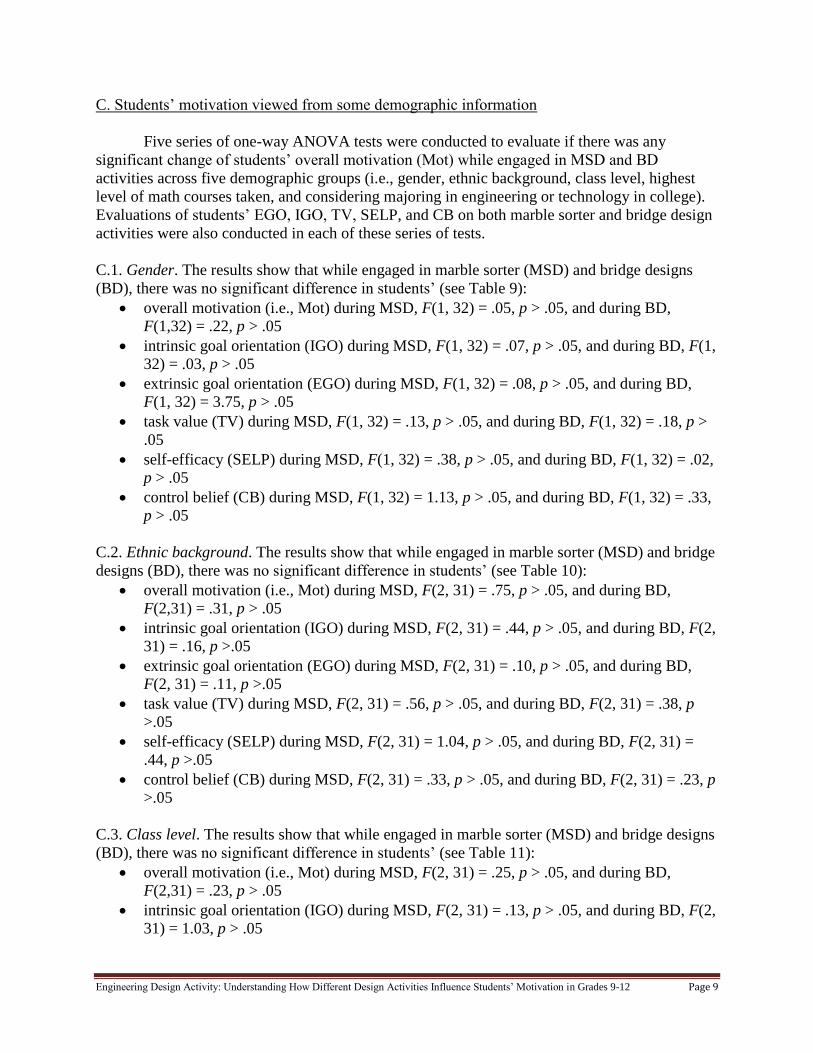
C. Students’ motivation viewed from some demographic information
Five series of one-way ANOVA tests were conducted to evaluate if there was any
significant change of students’ overall motivation (Mot) while engaged in MSD and BD
activities across five demographic groups (i.e., gender, ethnic background, class level, highest
level of math courses taken, and considering majoring in engineering or technology in college).
Evaluations of students’ EGO, IGO, TV, SELP, and CB on both marble sorter and bridge design
activities were also conducted in each of these series of tests.
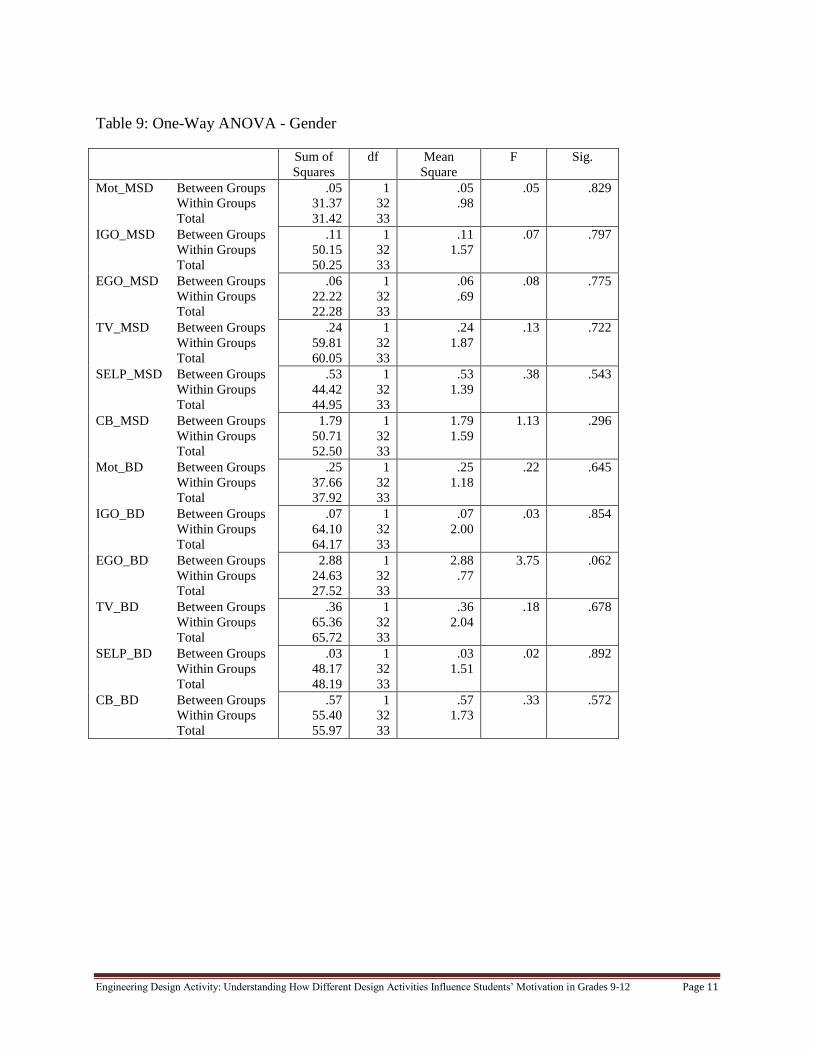
C.1. Gender. The results show that while engaged in marble sorter (MSD) and bridge designs
(BD), there was no significant difference in students’ (see Table 9):
overall motivation (i.e., Mot) during MSD, F(1, 32) = .05, p > .05, and during BD,
F(1,32) = .22, p > .05
intrinsic goal orientation (IGO) during MSD, F(1, 32) = .07, p > .05, and during BD, F(1,
32) = .03, p > .05
extrinsic goal orientation (EGO) during MSD, F(1, 32) = .08, p > .05, and during BD,
F(1, 32) = 3.75, p > .05
task value (TV) during MSD, F(1, 32) = .13, p > .05, and during BD, F(1, 32) = .18, p >
.05
self-efficacy (SELP) during MSD, F(1, 32) = .38, p > .05, and during BD, F(1, 32) = .02,
p > .05
control belief (CB) during MSD, F(1, 32) = 1.13, p > .05, and during BD, F(1, 32) = .33,
p > .05
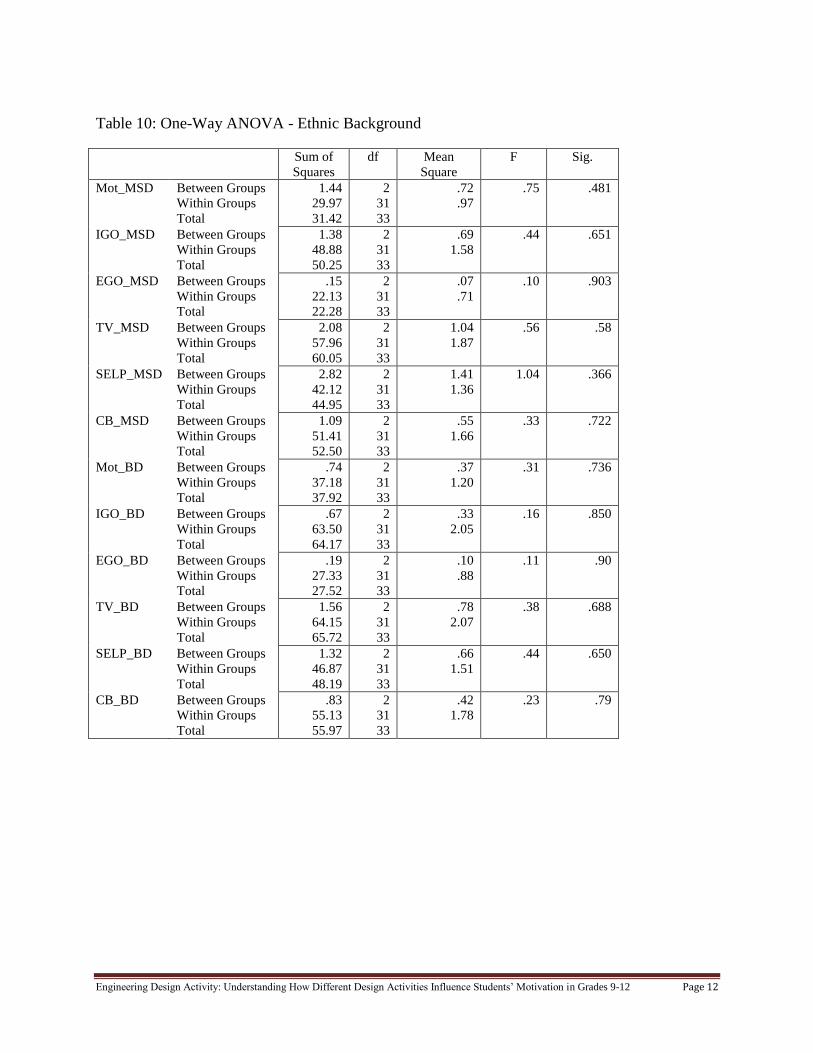
C.2. Ethnic background. The results show that while engaged in marble sorter (MSD) and bridge
designs (BD), there was no significant difference in students’ (see Table 10):
overall motivation (i.e., Mot) during MSD, F(2, 31) = .75, p > .05, and during BD,
F(2,31) = .31, p > .05
intrinsic goal orientation (IGO) during MSD, F(2, 31) = .44, p > .05, and during BD, F(2,
31) = .16, p >.05
extrinsic goal orientation (EGO) during MSD, F(2, 31) = .10, p > .05, and during BD,
F(2, 31) = .11, p >.05
task value (TV) during MSD, F(2, 31) = .56, p > .05, and during BD, F(2, 31) = .38, p
>.05
self-efficacy (SELP) during MSD, F(2, 31) = 1.04, p > .05, and during BD, F(2, 31) =
.44, p >.05
control belief (CB) during MSD, F(2, 31) = .33, p > .05, and during BD, F(2, 31) = .23, p
>.05
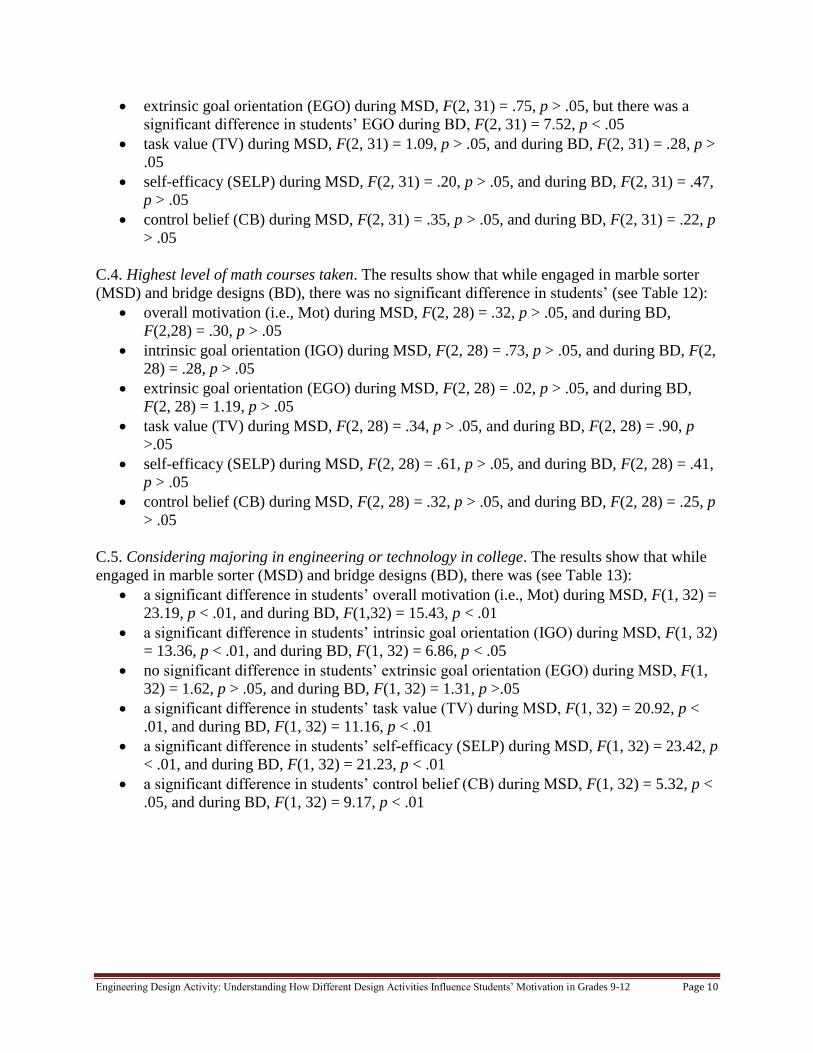
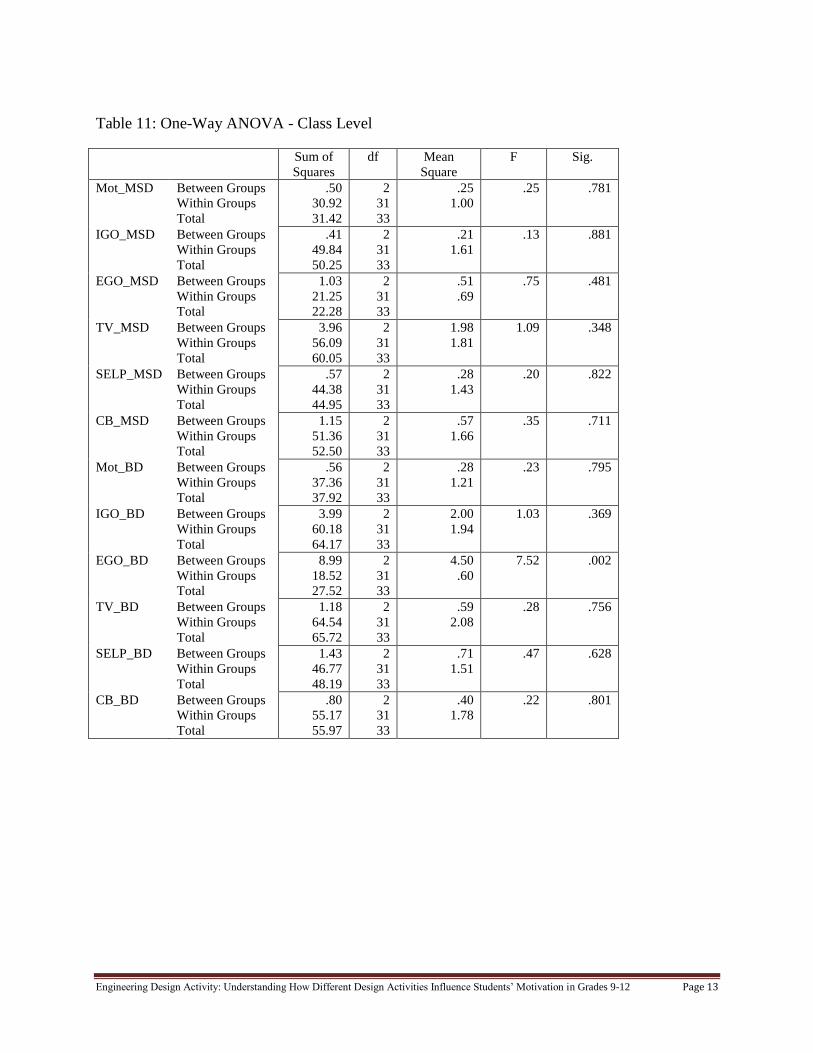
C.3. Class level. The results show that while engaged in marble sorter (MSD) and bridge designs
(BD), there was no significant difference in students’ (see Table 11):
overall motivation (i.e., Mot) during MSD, F(2, 31) = .25, p > .05, and during BD,
F(2,31) = .23, p > .05
intrinsic goal orientation (IGO) during MSD, F(2, 31) = .13, p > .05, and during BD, F(2,
31) = 1.03, p > .05
Engineering Design Activity: Understanding How Different Design Activities Influence Students’ Motivation in Grades 9-12 Page 10
extrinsic goal orientation (EGO) during MSD, F(2, 31) = .75, p > .05, but there was a
significant difference in students’ EGO during BD, F(2, 31) = 7.52, p < .05
task value (TV) during MSD, F(2, 31) = 1.09, p > .05, and during BD, F(2, 31) = .28, p >
.05
self-efficacy (SELP) during MSD, F(2, 31) = .20, p > .05, and during BD, F(2, 31) = .47,
p > .05
control belief (CB) during MSD, F(2, 31) = .35, p > .05, and during BD, F(2, 31) = .22, p
> .05
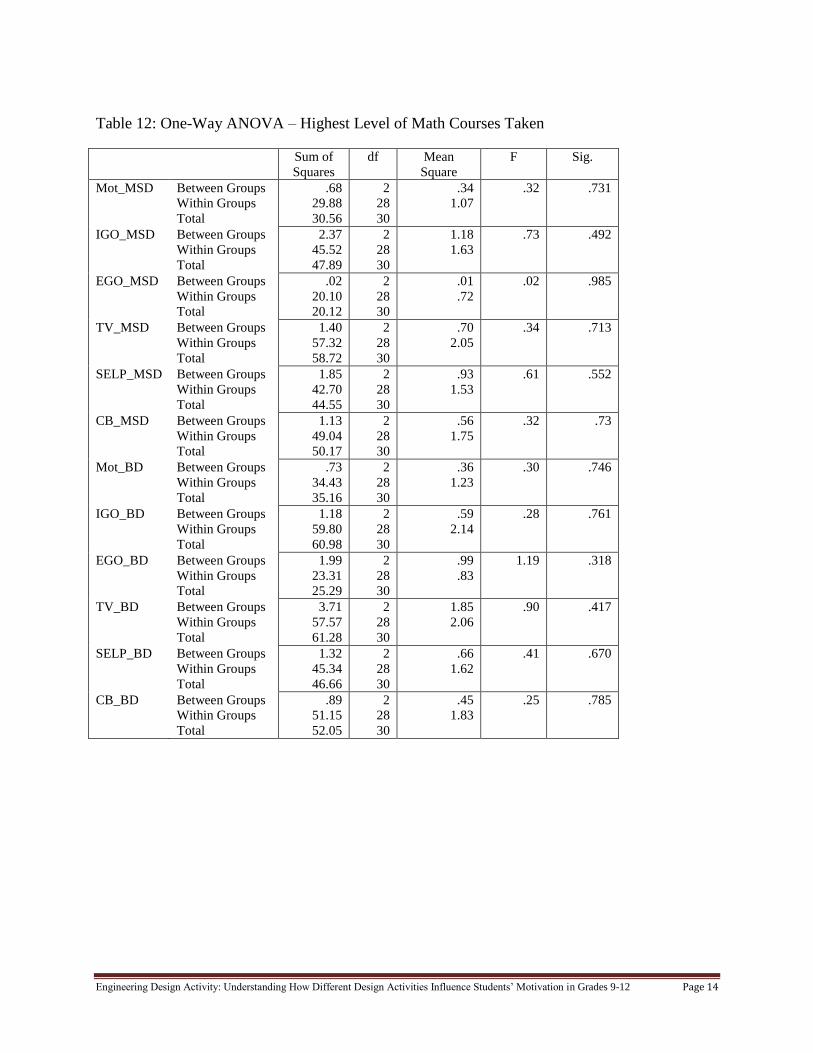
C.4. Highest level of math courses taken. The results show that while engaged in marble sorter
(MSD) and bridge designs (BD), there was no significant difference in students’ (see Table 12):
overall motivation (i.e., Mot) during MSD, F(2, 28) = .32, p > .05, and during BD,
F(2,28) = .30, p > .05
intrinsic goal orientation (IGO) during MSD, F(2, 28) = .73, p > .05, and during BD, F(2,
28) = .28, p > .05
extrinsic goal orientation (EGO) during MSD, F(2, 28) = .02, p > .05, and during BD,
F(2, 28) = 1.19, p > .05
task value (TV) during MSD, F(2, 28) = .34, p > .05, and during BD, F(2, 28) = .90, p
>.05
self-efficacy (SELP) during MSD, F(2, 28) = .61, p > .05, and during BD, F(2, 28) = .41,
p > .05
control belief (CB) during MSD, F(2, 28) = .32, p > .05, and during BD, F(2, 28) = .25, p
> .05
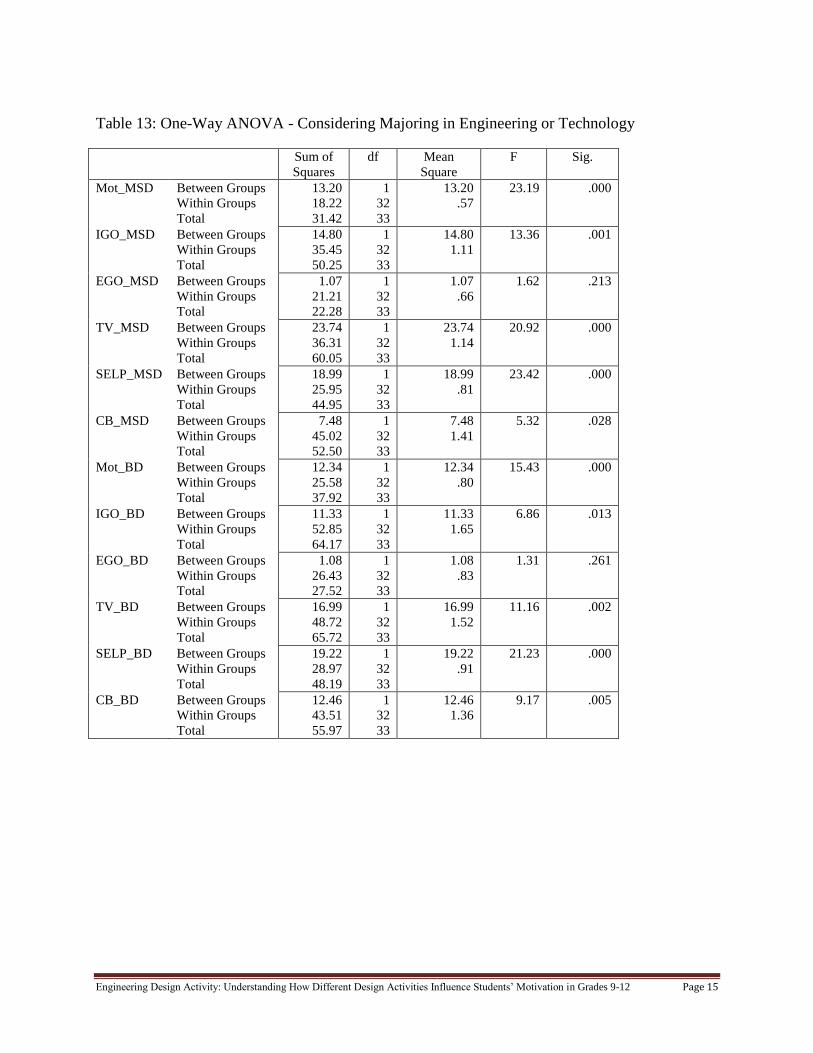
C.5. Considering majoring in engineering or technology in college. The results show that while
engaged in marble sorter (MSD) and bridge designs (BD), there was (see Table 13):
a significant difference in students’ overall motivation (i.e., Mot) during MSD, F(1, 32) =
23.19, p < .01, and during BD, F(1,32) = 15.43, p < .01
a significant difference in students’ intrinsic goal orientation (IGO) during MSD, F(1, 32)
= 13.36, p < .01, and during BD, F(1, 32) = 6.86, p < .05
no significant difference in students’ extrinsic goal orientation (EGO) during MSD, F(1,
32) = 1.62, p > .05, and during BD, F(1, 32) = 1.31, p >.05
a significant difference in students’ task value (TV) during MSD, F(1, 32) = 20.92, p <
.01, and during BD, F(1, 32) = 11.16, p < .01
a significant difference in students’ self-efficacy (SELP) during MSD, F(1, 32) = 23.42, p
< .01, and during BD, F(1, 32) = 21.23, p < .01
a significant difference in students’ control belief (CB) during MSD, F(1, 32) = 5.32, p <
.05, and during BD, F(1, 32) = 9.17, p < .01
Engineering Design Activity: Understanding How Different Design Activities Influence Students’ Motivation in Grades 9-12 Page 11
Table 9: One-Way ANOVA - Gender
Sum of
Squares
df Mean
Square
F Sig.
Mot_MSD Between Groups
Within Groups
Total
.05
31.37
31.42
1
32
33
.05
.98
.05 .829
IGO_MSD Between Groups
Within Groups
Total
.11
50.15
50.25
1
32
33
.11
1.57
.07 .797
EGO_MSD Between Groups
Within Groups
Total
.06
22.22
22.28
1
32
33
.06
.69
.08 .775
TV_MSD Between Groups
Within Groups
Total
.24
59.81
60.05
1
32
33
.24
1.87
.13 .722
SELP_MSD Between Groups
Within Groups
Total
.53
44.42
44.95
1
32
33
.53
1.39
.38 .543
CB_MSD Between Groups
Within Groups
Total
1.79
50.71
52.50
1
32
33
1.79
1.59
1.13 .296
Mot_BD Between Groups
Within Groups
Total
.25
37.66
37.92
1
32
33
.25
1.18
.22 .645
IGO_BD Between Groups
Within Groups
Total
.07
64.10
64.17
1
32
33
.07
2.00
.03 .854
EGO_BD Between Groups
Within Groups
Total
2.88
24.63
27.52
1
32
33
2.88
.77
3.75 .062
TV_BD Between Groups
Within Groups
Total
.36
65.36
65.72
1
32
33
.36
2.04
.18 .678
SELP_BD Between Groups
Within Groups
Total
.03
48.17
48.19
1
32
33
.03
1.51
.02 .892
CB_BD Between Groups
Within Groups
Total
.57
55.40
55.97
1
32
33
.57
1.73
.33 .572
Engineering Design Activity: Understanding How Different Design Activities Influence Students’ Motivation in Grades 9-12 Page 12
Table 10: One-Way ANOVA - Ethnic Background
Sum of
Squares
df Mean
Square
F Sig.
Mot_MSD Between Groups
Within Groups
Total
1.44
29.97
31.42
2
31
33
.72
.97
.75 .481
IGO_MSD Between Groups
Within Groups
Total
1.38
48.88
50.25
2
31
33
.69
1.58
.44 .651
EGO_MSD Between Groups
Within Groups
Total
.15
22.13
22.28
2
31
33
.07
.71
.10 .903
TV_MSD Between Groups
Within Groups
Total
2.08
57.96
60.05
2
31
33
1.04
1.87
.56 .58
SELP_MSD Between Groups
Within Groups
Total
2.82
42.12
44.95
2
31
33
1.41
1.36
1.04 .366
CB_MSD Between Groups
Within Groups
Total
1.09
51.41
52.50
2
31
33
.55
1.66
.33 .722
Mot_BD Between Groups
Within Groups
Total
.74
37.18
37.92
2
31
33
.37
1.20
.31 .736
IGO_BD Between Groups
Within Groups
Total
.67
63.50
64.17
2
31
33
.33
2.05
.16 .850
EGO_BD Between Groups
Within Groups
Total
.19
27.33
27.52
2
31
33
.10
.88
.11 .90
TV_BD Between Groups
Within Groups
Total
1.56
64.15
65.72
2
31
33
.78
2.07
.38 .688
SELP_BD Between Groups
Within Groups
Total
1.32
46.87
48.19
2
31
33
.66
1.51
.44 .650
CB_BD Between Groups
Within Groups
Total
.83
55.13
55.97
2
31
33
.42
1.78
.23 .79
Engineering Design Activity: Understanding How Different Design Activities Influence Students’ Motivation in Grades 9-12 Page 13
Table 11: One-Way ANOVA - Class Level
Sum of
Squares
df Mean
Square
F Sig.
Mot_MSD Between Groups
Within Groups
Total
.50
30.92
31.42
2
31
33
.25
1.00
.25 .781
IGO_MSD Between Groups
Within Groups
Total
.41
49.84
50.25
2
31
33
.21
1.61
.13 .881
EGO_MSD Between Groups
Within Groups
Total
1.03
21.25
22.28
2
31
33
.51
.69
.75 .481
TV_MSD Between Groups
Within Groups
Total
3.96
56.09
60.05
2
31
33
1.98
1.81
1.09 .348
SELP_MSD Between Groups
Within Groups
Total
.57
44.38
44.95
2
31
33
.28
1.43
.20 .822
CB_MSD Between Groups
Within Groups
Total
1.15
51.36
52.50
2
31
33
.57
1.66
.35 .711
Mot_BD Between Groups
Within Groups
Total
.56
37.36
37.92
2
31
33
.28
1.21
.23
.795
IGO_BD Between Groups
Within Groups
Total
3.99
60.18
64.17
2
31
33
2.00
1.94
1.03 .369
EGO_BD Between Groups
Within Groups
Total
8.99
18.52
27.52
2
31
33
4.50
.60
7.52 .002
TV_BD Between Groups
Within Groups
Total
1.18
64.54
65.72
2
31
33
.59
2.08
.28 .756
SELP_BD Between Groups
Within Groups
Total
1.43
46.77
48.19
2
31
33
.71
1.51
.47 .628
CB_BD Between Groups
Within Groups
Total
.80
55.17
55.97
2
31
33
.40
1.78
.22 .801
Engineering Design Activity: Understanding How Different Design Activities Influence Students’ Motivation in Grades 9-12 Page 14
Table 12: One-Way ANOVA – Highest Level of Math Courses Taken
Sum of
Squares
df Mean
Square
F Sig.
Mot_MSD Between Groups
Within Groups
Total
.68
29.88
30.56
2
28
30
.34
1.07
.32 .731
IGO_MSD Between Groups
Within Groups
Total
2.37
45.52
47.89
2
28
30
1.18
1.63
.73 .492
EGO_MSD Between Groups
Within Groups
Total
.02
20.10
20.12
2
28
30
.01
.72
.02 .985
TV_MSD Between Groups
Within Groups
Total
1.40
57.32
58.72
2
28
30
.70
2.05
.34 .713
SELP_MSD Between Groups
Within Groups
Total
1.85
42.70
44.55
2
28
30
.93
1.53
.61 .552
CB_MSD Between Groups
Within Groups
Total
1.13
49.04
50.17
2
28
30
.56
1.75
.32 .73
Mot_BD Between Groups
Within Groups
Total
.73
34.43
35.16
2
28
30
.36
1.23
.30 .746
IGO_BD Between Groups
Within Groups
Total
1.18
59.80
60.98
2
28
30
.59
2.14
.28 .761
EGO_BD Between Groups
Within Groups
Total
1.99
23.31
25.29
2
28
30
.99
.83
1.19 .318
TV_BD Between Groups
Within Groups
Total
3.71
57.57
61.28
2
28
30
1.85
2.06
.90 .417
SELP_BD Between Groups
Within Groups
Total
1.32
45.34
46.66
2
28
30
.66
1.62
.41 .670
CB_BD Between Groups
Within Groups
Total
.89
51.15
52.05
2
28
30
.45
1.83
.25 .785
Engineering Design Activity: Understanding How Different Design Activities Influence Students’ Motivation in Grades 9-12 Page 15
Table 13: One-Way ANOVA - Considering Majoring in Engineering or Technology
Sum of
Squares
df Mean
Square
F Sig.
Mot_MSD Between Groups
Within Groups
Total
13.20
18.22
31.42
1
32
33
13.20
.57
23.19 .000
IGO_MSD Between Groups
Within Groups
Total
14.80
35.45
50.25
1
32
33
14.80
1.11
13.36 .001
EGO_MSD Between Groups
Within Groups
Total
1.07
21.21
22.28
1
32
33
1.07
.66
1.62 .213
TV_MSD Between Groups
Within Groups
Total
23.74
36.31
60.05
1
32
33
23.74
1.14
20.92 .000
SELP_MSD Between Groups
Within Groups
Total
18.99
25.95
44.95
1
32
33
18.99
.81
23.42 .000
CB_MSD Between Groups
Within Groups
Total
7.48
45.02
52.50
1
32
33
7.48
1.41
5.32 .028
Mot_BD Between Groups
Within Groups
Total
12.34
25.58
37.92
1
32
33
12.34
.80
15.43 .000
IGO_BD Between Groups
Within Groups
Total
11.33
52.85
64.17
1
32
33
11.33
1.65
6.86 .013
EGO_BD Between Groups
Within Groups
Total
1.08
26.43
27.52
1
32
33
1.08
.83
1.31 .261
TV_BD Between Groups
Within Groups
Total
16.99
48.72
65.72
1
32
33
16.99
1.52
11.16 .002
SELP_BD Between Groups
Within Groups
Total
19.22
28.97
48.19
1
32
33
19.22
.91
21.23 .000
CB_BD Between Groups
Within Groups
Total
12.46
43.51
55.97
1
32
33
12.46
1.36
9.17 .005
Engineering Design Activity: Understanding How Different Design Activities Influence Students’ Motivation in Grades 9-12 Page 16
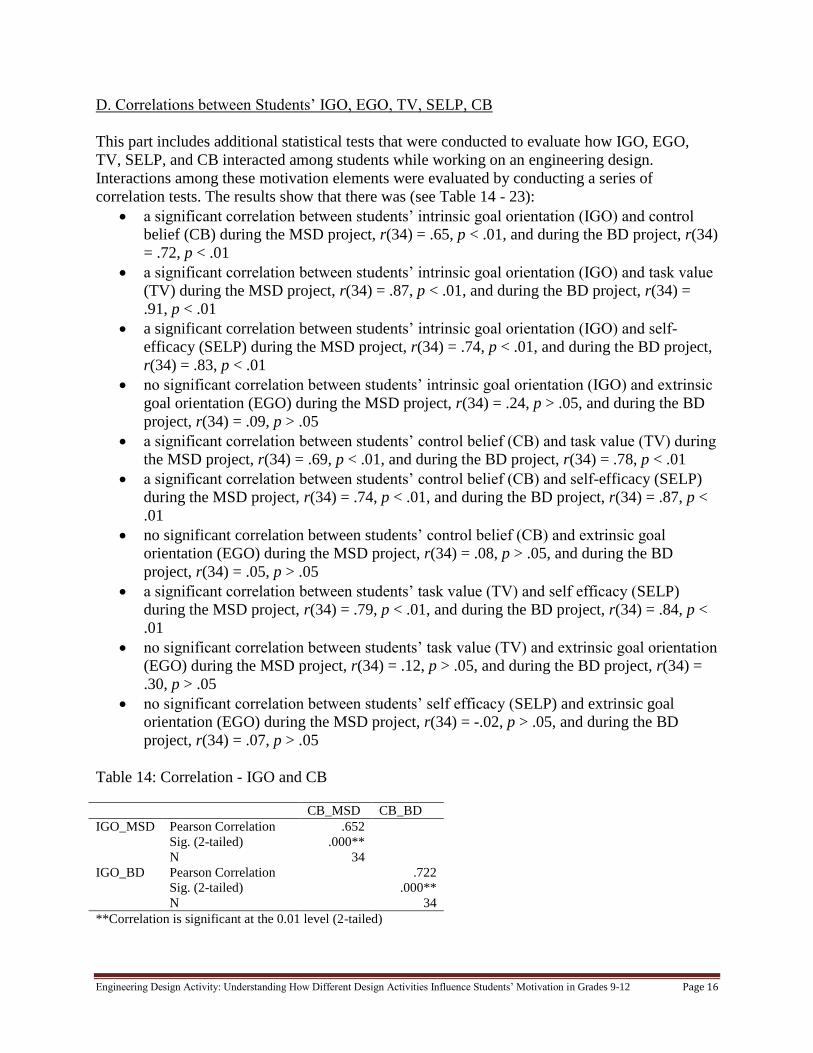
D. Correlations between Students’ IGO, EGO, TV, SELP, CB
This part includes additional statistical tests that were conducted to evaluate how IGO, EGO,
TV, SELP, and CB interacted among students while working on an engineering design.
Interactions among these motivation elements were evaluated by conducting a series of
correlation tests. The results show that there was (see Table 14 - 23):
a significant correlation between students’ intrinsic goal orientation (IGO) and control
belief (CB) during the MSD project, r(34) = .65, p < .01, and during the BD project, r(34)
= .72, p < .01
a significant correlation between students’ intrinsic goal orientation (IGO) and task value
(TV) during the MSD project, r(34) = .87, p < .01, and during the BD project, r(34) =
.91, p < .01
a significant correlation between students’ intrinsic goal orientation (IGO) and self-
efficacy (SELP) during the MSD project, r(34) = .74, p < .01, and during the BD project,
r(34) = .83, p < .01
no significant correlation between students’ intrinsic goal orientation (IGO) and extrinsic
goal orientation (EGO) during the MSD project, r(34) = .24, p > .05, and during the BD
project, r(34) = .09, p > .05
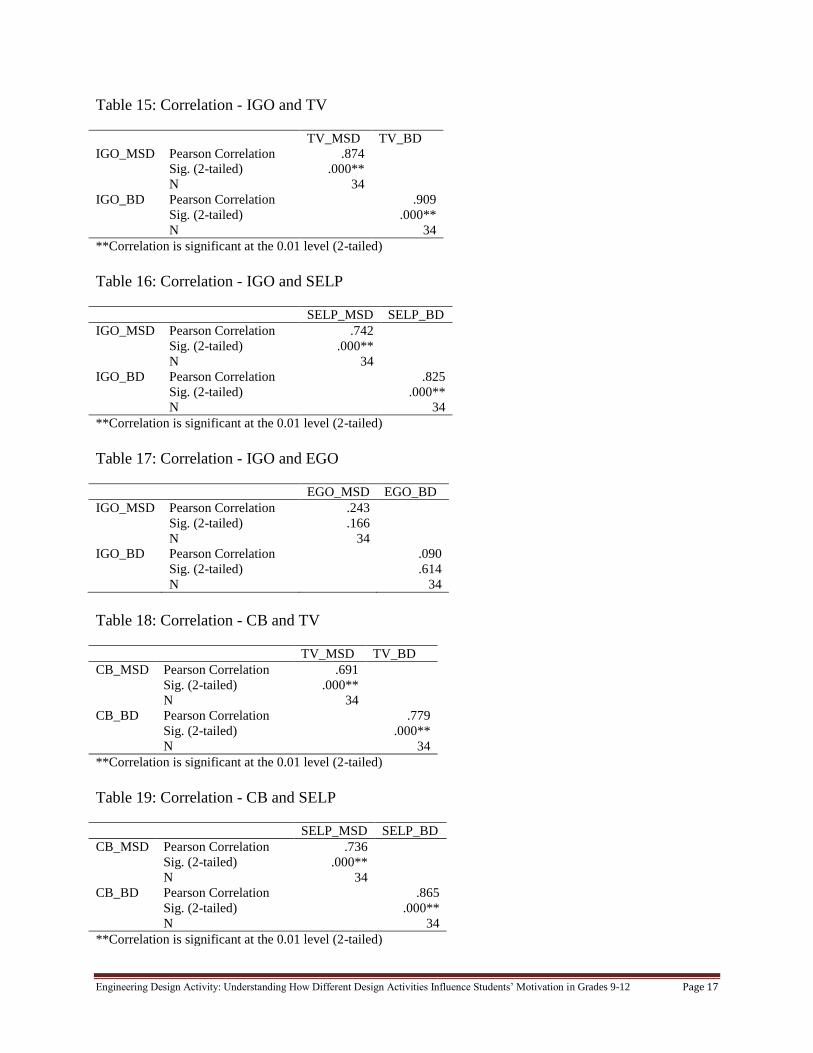
a significant correlation between students’ control belief (CB) and task value (TV) during
the MSD project, r(34) = .69, p < .01, and during the BD project, r(34) = .78, p < .01
a significant correlation between students’ control belief (CB) and self-efficacy (SELP)
during the MSD project, r(34) = .74, p < .01, and during the BD project, r(34) = .87, p <
.01
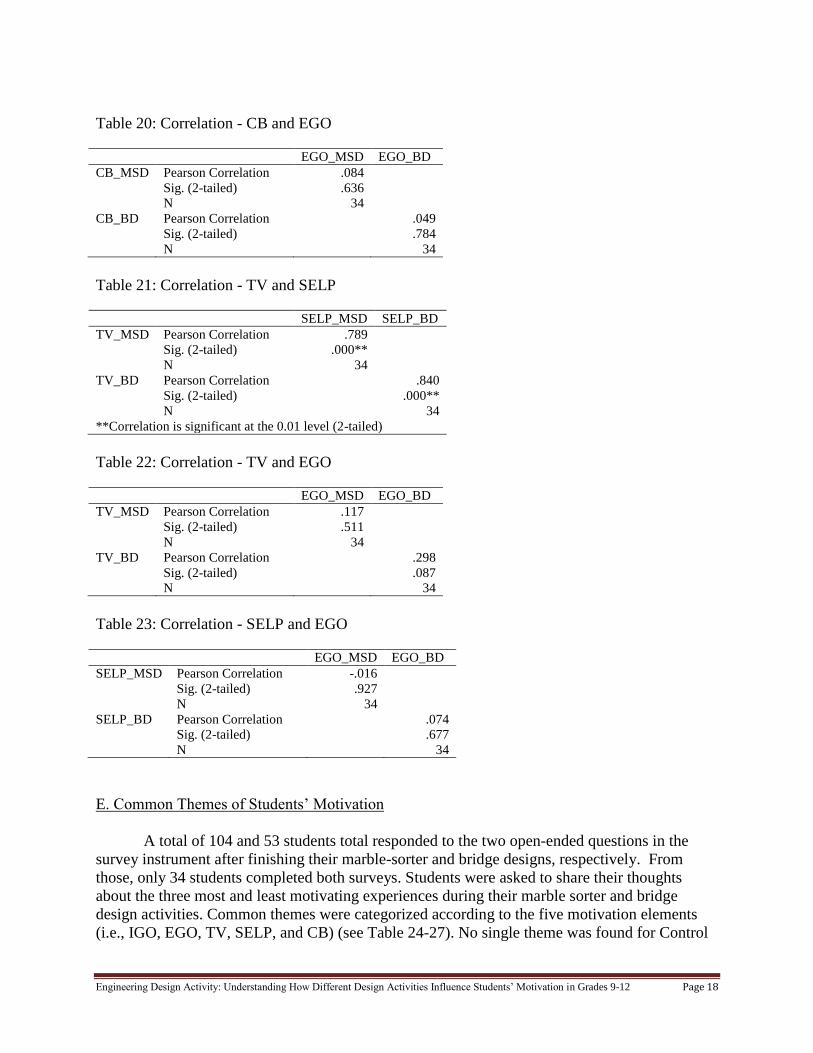
no significant correlation between students’ control belief (CB) and extrinsic goal
orientation (EGO) during the MSD project, r(34) = .08, p > .05, and during the BD
project, r(34) = .05, p > .05
a significant correlation between students’ task value (TV) and self efficacy (SELP)
during the MSD project, r(34) = .79, p < .01, and during the BD project, r(34) = .84, p <
.01
no significant correlation between students’ task value (TV) and extrinsic goal orientation
(EGO) during the MSD project, r(34) = .12, p > .05, and during the BD project, r(34) =
.30, p > .05
no significant correlation between students’ self efficacy (SELP) and extrinsic goal
orientation (EGO) during the MSD project, r(34) = -.02, p > .05, and during the BD
project, r(34) = .07, p > .05
Table 14: Correlation - IGO and CB
CB_MSD CB_BD
IGO_MSD Pearson Correlation
Sig. (2-tailed)
N
.652
.000**
34
IGO_BD Pearson Correlation
Sig. (2-tailed)
N
.722
.000**
34
**Correlation is significant at the 0.01 level (2-tailed)
Engineering Design Activity: Understanding How Different Design Activities Influence Students’ Motivation in Grades 9-12 Page 17
Table 15: Correlation - IGO and TV
TV_MSD TV_BD
IGO_MSD Pearson Correlation
Sig. (2-tailed)
N
.874
.000**
34
IGO_BD Pearson Correlation
Sig. (2-tailed)
N
.909
.000**
34
**Correlation is significant at the 0.01 level (2-tailed)
Table 16: Correlation - IGO and SELP
SELP_MSD SELP_BD
IGO_MSD Pearson Correlation
Sig. (2-tailed)
N
.742
.000**
34
IGO_BD Pearson Correlation
Sig. (2-tailed)
N
.825
.000**
34
**Correlation is significant at the 0.01 level (2-tailed)
Table 17: Correlation - IGO and EGO
EGO_MSD EGO_BD
IGO_MSD Pearson Correlation
Sig. (2-tailed)
N
.243
.166
34
IGO_BD Pearson Correlation
Sig. (2-tailed)
N
.090
.614
34
Table 18: Correlation - CB and TV
TV_MSD TV_BD
CB_MSD Pearson Correlation
Sig. (2-tailed)
N
.691
.000**
34
CB_BD Pearson Correlation
Sig. (2-tailed)
N
.779
.000**
34
**Correlation is significant at the 0.01 level (2-tailed)
Table 19: Correlation - CB and SELP
SELP_MSD SELP_BD
CB_MSD Pearson Correlation
Sig. (2-tailed)
N
.736
.000**
34
CB_BD Pearson Correlation
Sig. (2-tailed)
N
.865
.000**
34
**Correlation is significant at the 0.01 level (2-tailed)
Engineering Design Activity: Understanding How Different Design Activities Influence Students’ Motivation in Grades 9-12 Page 18
Table 20: Correlation - CB and EGO
EGO_MSD EGO_BD
CB_MSD Pearson Correlation
Sig. (2-tailed)
N
.084
.636
34
CB_BD Pearson Correlation
Sig. (2-tailed)
N
.049
.784
34
Table 21: Correlation - TV and SELP
SELP_MSD SELP_BD
TV_MSD Pearson Correlation
Sig. (2-tailed)
N
.789
.000**
34
TV_BD Pearson Correlation
Sig. (2-tailed)
N
.840
.000**
34
**Correlation is significant at the 0.01 level (2-tailed)
Table 22: Correlation - TV and EGO
EGO_MSD EGO_BD
TV_MSD Pearson Correlation
Sig. (2-tailed)
N
.117
.511
34
TV_BD Pearson Correlation
Sig. (2-tailed)
N
.298
.087
34
Table 23: Correlation - SELP and EGO
EGO_MSD EGO_BD
SELP_MSD Pearson Correlation
Sig. (2-tailed)
N
-.016
.927
34
SELP_BD Pearson Correlation
Sig. (2-tailed)
N
.074
.677
34
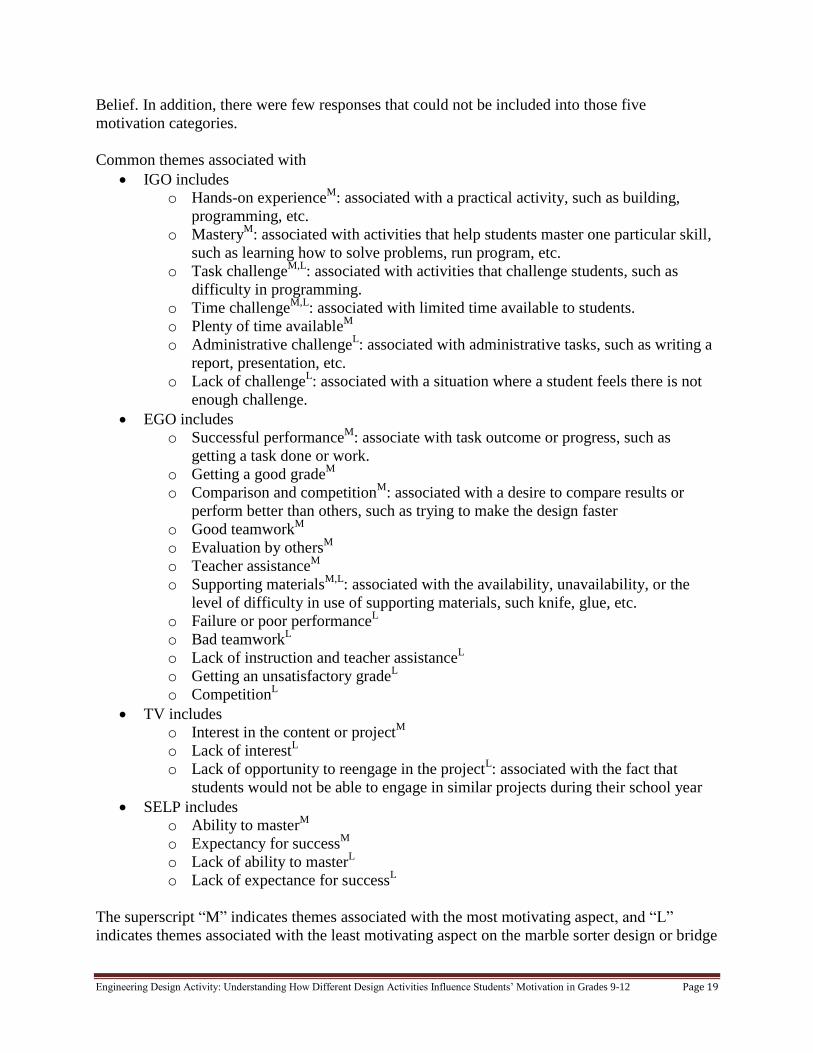
E. Common Themes of Students’ Motivation
A total of 104 and 53 students total responded to the two open-ended questions in the
survey instrument after finishing their marble-sorter and bridge designs, respectively. From
those, only 34 students completed both surveys. Students were asked to share their thoughts
about the three most and least motivating experiences during their marble sorter and bridge
design activities. Common themes were categorized according to the five motivation elements
(i.e., IGO, EGO, TV, SELP, and CB) (see Table 24-27). No single theme was found for Control
Engineering Design Activity: Understanding How Different Design Activities Influence Students’ Motivation in Grades 9-12 Page 19
Belief. In addition, there were few responses that could not be included into those five
motivation categories.
Common themes associated with
IGO includes
o Hands-on experienceM
: associated with a practical activity, such as building,
programming, etc.
o MasteryM
: associated with activities that help students master one particular skill,
such as learning how to solve problems, run program, etc.
o Task challengeM,L
: associated with activities that challenge students, such as
difficulty in programming.
o Time challengeM,L
: associated with limited time available to students.
o Plenty of time availableM
o Administrative challengeL: associated with administrative tasks, such as writing a
report, presentation, etc.
o Lack of challengeL: associated with a situation where a student feels there is not
enough challenge.
EGO includes
o Successful performanceM
: associate with task outcome or progress, such as
getting a task done or work.
o Getting a good gradeM
o Comparison and competitionM
: associated with a desire to compare results or
perform better than others, such as trying to make the design faster
o Good teamworkM
o Evaluation by othersM
o Teacher assistanceM
o Supporting materialsM,L
: associated with the availability, unavailability, or the
level of difficulty in use of supporting materials, such knife, glue, etc.
o Failure or poor performanceL
o Bad teamworkL
o Lack of instruction and teacher assistanceL
o Getting an unsatisfactory gradeL
o CompetitionL
TV includes
o Interest in the content or projectM
o Lack of interestL
o Lack of opportunity to reengage in the projectL: associated with the fact that
students would not be able to engage in similar projects during their school year
SELP includes
o Ability to masterM
o Expectancy for successM
o Lack of ability to masterL
o Lack of expectance for successL
The superscript ―M‖ indicates themes associated with the most motivating aspect, and ―L‖
indicates themes associated with the least motivating aspect on the marble sorter design or bridge
Engineering Design Activity: Understanding How Different Design Activities Influence Students’ Motivation in Grades 9-12 Page 20
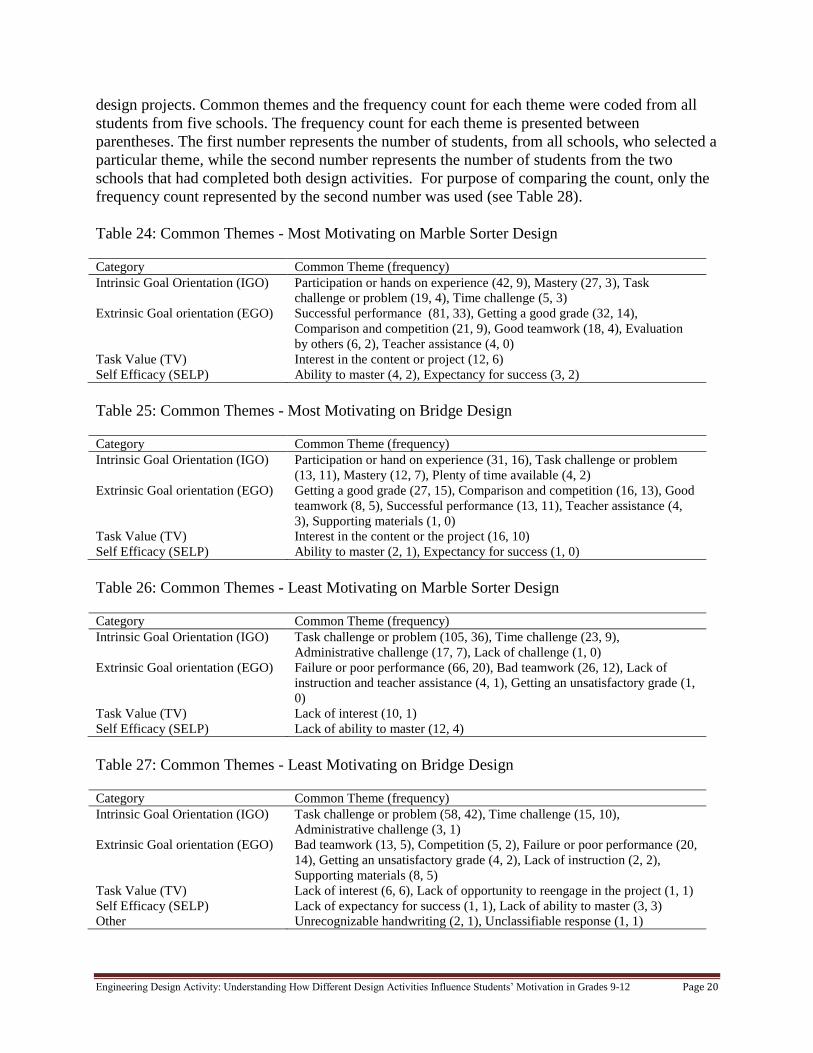
design projects. Common themes and the frequency count for each theme were coded from all
students from five schools. The frequency count for each theme is presented between
parentheses. The first number represents the number of students, from all schools, who selected a
particular theme, while the second number represents the number of students from the two
schools that had completed both design activities. For purpose of comparing the count, only the
frequency count represented by the second number was used (see Table 28).
Table 24: Common Themes - Most Motivating on Marble Sorter Design
Category Common Theme (frequency)
Intrinsic Goal Orientation (IGO) Participation or hands on experience (42, 9), Mastery (27, 3), Task
challenge or problem (19, 4), Time challenge (5, 3)
Extrinsic Goal orientation (EGO) Successful performance (81, 33), Getting a good grade (32, 14),
Comparison and competition (21, 9), Good teamwork (18, 4), Evaluation
by others (6, 2), Teacher assistance (4, 0)
Task Value (TV) Interest in the content or project (12, 6)
Self Efficacy (SELP) Ability to master (4, 2), Expectancy for success (3, 2)
Table 25: Common Themes - Most Motivating on Bridge Design
Category Common Theme (frequency)
Intrinsic Goal Orientation (IGO) Participation or hand on experience (31, 16), Task challenge or problem
(13, 11), Mastery (12, 7), Plenty of time available (4, 2)
Extrinsic Goal orientation (EGO) Getting a good grade (27, 15), Comparison and competition (16, 13), Good
teamwork (8, 5), Successful performance (13, 11), Teacher assistance (4,
3), Supporting materials (1, 0)
Task Value (TV) Interest in the content or the project (16, 10)
Self Efficacy (SELP) Ability to master (2, 1), Expectancy for success (1, 0)
Table 26: Common Themes - Least Motivating on Marble Sorter Design
Category Common Theme (frequency)
Intrinsic Goal Orientation (IGO) Task challenge or problem (105, 36), Time challenge (23, 9),
Administrative challenge (17, 7), Lack of challenge (1, 0)
Extrinsic Goal orientation (EGO) Failure or poor performance (66, 20), Bad teamwork (26, 12), Lack of
instruction and teacher assistance (4, 1), Getting an unsatisfactory grade (1,
0)
Task Value (TV) Lack of interest (10, 1)
Self Efficacy (SELP) Lack of ability to master (12, 4)
Table 27: Common Themes - Least Motivating on Bridge Design
Category Common Theme (frequency)
Intrinsic Goal Orientation (IGO) Task challenge or problem (58, 42), Time challenge (15, 10),
Administrative challenge (3, 1)
Extrinsic Goal orientation (EGO) Bad teamwork (13, 5), Competition (5, 2), Failure or poor performance (20,
14), Getting an unsatisfactory grade (4, 2), Lack of instruction (2, 2),
Supporting materials (8, 5)
Task Value (TV) Lack of interest (6, 6), Lack of opportunity to reengage in the project (1, 1)
Self Efficacy (SELP) Lack of expectancy for success (1, 1), Lack of ability to master (3, 3)
Other Unrecognizable handwriting (2, 1), Unclassifiable response (1, 1)
Engineering Design Activity: Understanding How Different Design Activities Influence Students’ Motivation in Grades 9-12 Page 21
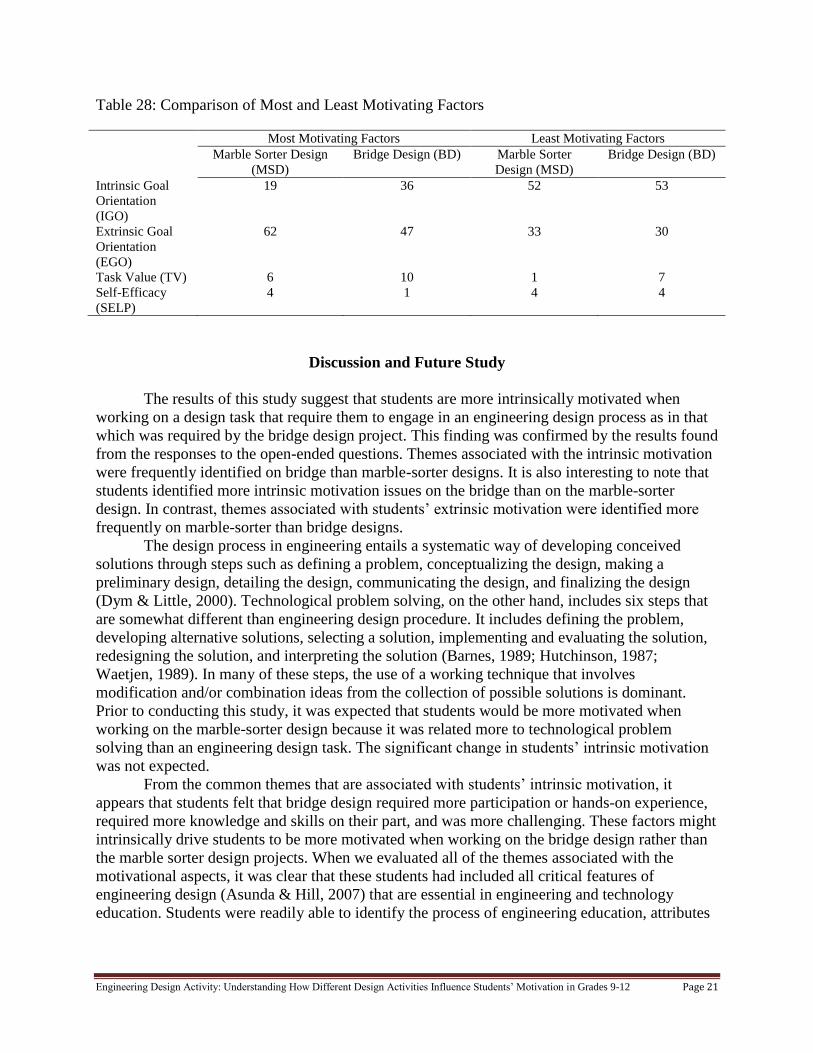
Table 28: Comparison of Most and Least Motivating Factors
Most Motivating Factors Least Motivating Factors
Marble Sorter Design
(MSD)
Bridge Design (BD) Marble Sorter
Design (MSD)
Bridge Design (BD)
Intrinsic Goal
Orientation
(IGO)
19 36 52 53
Extrinsic Goal
Orientation
(EGO)
62 47 33 30
Task Value (TV) 6 10 1 7
Self-Efficacy
(SELP)
4 1 4 4
Discussion and Future Study
The results of this study suggest that students are more intrinsically motivated when
working on a design task that require them to engage in an engineering design process as in that
which was required by the bridge design project. This finding was confirmed by the results found
from the responses to the open-ended questions. Themes associated with the intrinsic motivation
were frequently identified on bridge than marble-sorter designs. It is also interesting to note that
students identified more intrinsic motivation issues on the bridge than on the marble-sorter
design. In contrast, themes associated with students’ extrinsic motivation were identified more
frequently on marble-sorter than bridge designs.
The design process in engineering entails a systematic way of developing conceived
solutions through steps such as defining a problem, conceptualizing the design, making a
preliminary design, detailing the design, communicating the design, and finalizing the design
(Dym & Little, 2000). Technological problem solving, on the other hand, includes six steps that
are somewhat different than engineering design procedure. It includes defining the problem,
developing alternative solutions, selecting a solution, implementing and evaluating the solution,
redesigning the solution, and interpreting the solution (Barnes, 1989; Hutchinson, 1987;
Waetjen, 1989). In many of these steps, the use of a working technique that involves
modification and/or combination ideas from the collection of possible solutions is dominant.
Prior to conducting this study, it was expected that students would be more motivated when
working on the marble-sorter design because it was related more to technological problem
solving than an engineering design task. The significant change in students’ intrinsic motivation
was not expected.
From the common themes that are associated with students’ intrinsic motivation, it
appears that students felt that bridge design required more participation or hands-on experience,
required more knowledge and skills on their part, and was more challenging. These factors might
intrinsically drive students to be more motivated when working on the bridge design rather than
the marble sorter design projects. When we evaluated all of the themes associated with the
motivational aspects, it was clear that these students had included all critical features of
engineering design (Asunda & Hill, 2007) that are essential in engineering and technology
education. Students were readily able to identify the process of engineering education, attributes
Engineering Design Activity: Understanding How Different Design Activities Influence Students’ Motivation in Grades 9-12 Page 22
of engineering design, and assessment in their responses regarding the most and least motivating
factors about their projects.
Despite the limited number of data set gathered and analyzed in this study, a potential
topic for our future research may be associated with our effort to answer a general question like:
How does student motivation influence the cognitive processes during engineering design
activities? This question may lead us to several more specific questions, including what specific
metacognitive and task process are employed to meet the design goals.
Engineering Design Activity: Understanding How Different Design Activities Influence Students’ Motivation in Grades 9-12 Page 23
References
Asunda, P., & Hill, R. (2007). Critical features of engineering design in technology education.
Journal of Industrial Teacher Education, 44(1), 25-48.
Bandura, A. (1997). Self-efficacy: the exercise of control. New York: W.H. freeman &
Company.
Bandura, A. & Schunk, D.H. (1981). Cultivating confidence, self-efficacy, and intrinsic interest
through proximal self-motivation. Journal of Personality & Social Psychology, 41(3), 586-
598.
Bandura, A. (1978). Reflections on self-efficacy. Advances in Behavioural Research and
Therapy, 1(4), 237-269.
Barnes, J. (1989). Preparing children to solve problems. The Technology Teacher, 48(6), 25-29.
Brown Jr., & Inouyne, D.K. (1978). Learned helplessness through modeling: The role of
perceived similarity in competence. Journal of Personality and Social Psychology, 36(8),
900-908.
Chowdhury, M., & Shahabuddin, A. (2007). Self-Efficacy, motivation and their relationship to
academic performance of Bangladesh college students. College Quarterly, 10(1), 1-9.
Deci, E.L., Koestner, R., & Ryan, R.M. (1999a). A meta-analytic review of experiments
examining the effects of extrinsic rewards on intrinsic motivation. Psychological Bulletin,
125, 627-668.
Dym, C.L., & Little, M. (2000). Engineering design: A project-based introduction, John Wiley
& Sons, New York.
Eisenberger, R., Pierce, W.D., & Cameron, J. (1999). Effects of reward on intrinsic motivation—
Negative, neutral, and positive: Comment on Deci, Koestner, and Tyan (1999).
Psychological Bulletin, 125, 677-691.
Gist, M.E., & Mitchell, T (1992). Self-efficacy: A theoretical analysis of its determinants and
malleability. Academy of Management Review, 17(2), 183-211.
Hutchinson, P. (1987). In Report of the Commission on Technology Education, State of New
Jersey, Technology Education: Learning to Learn in a Technological World. Trenton, NJ:
New Jersey Department of Education.
Mawhinney, T.C. (1979). Intrinsic X extrinsic work motivation: Perspectives from behaviorim.
Organizational Behavior and Human Performance, 24, 411-440.
Mawhinney, T.C. (1990). Decreasing intrinsic “motivation” with extrinsic rewards: Easier said
than done. Promoting excellence through performance management. Haworth Press.
Mawhinney, T.C., Dickinson, A., & Taylor, L. (1989). The use of concurrent schedules to
evaluate the effects of extrinsic rewards on ―intrinsic motivation.‖ Journal of
Organizational Behavior Management, 10(1), 109-129.
Pintrich, P.R., & Schunk, D.H. (1996). Motivation in education: Theory, research, and practice.
Englewood Cliffs, NJ: Prentice Hall.
Pintrich, P.R., Smith, D.A.F., Garcia, T., & McKeachie, W.J. (1991). A manual for the use of the
Motivated Strategies for Learning Questionnaire (MSLQ). (ERIC Document Reproduction
Service No. ED338122).
Porter, L. & Lawler, E.E. III. (1968). Managerial attitudes and performance. Homewood, IL:
Richard D. Irwin.
Engineering Design Activity: Understanding How Different Design Activities Influence Students’ Motivation in Grades 9-12 Page 24
Sadler, P.M., Coyle, H.P., & Schwartz, M. (2000). Engineering competitions in the middle
school classroom: Key elements in developing effective design challenges. The Journal of
the Learning Sciences, 9(3), Design Education (2000), 299-327.
Samuel, A. (1986). Student centered teaching in engineering design. Instructional Science, 15(3),
213-38.
Schunk, D.H. (1981). Modeling and attribution effects on children’s achievement: A self-
efficacy analysis. Journal of Educational Psychology, 73 (1), 93-105.
Staw, B.M. (1977). Motivation in organizations: Toward synthesis and redirection. In B.M. Staw
and G.R.Salancik (Eds.), New directions in organizational behavior. Chicago: St. Clair
Press.
Waetjen, W.B. (1989). Technological problem solving. Reston, VA: International Technology
Education Association.
Weinberg, R.S., Gould, D., & Jackson, A. (1979). Expectations and performance: An empirical
test of Bandura’s self-efficacy theory. Journal of Sport Psychology, 1(4), 320-331.
Wood, R & Bandura, A. (1989). Social cognitive theory of organizational management.
Academy of Management Review, 14(3), 361-384.