Embed Size (px)
Citation preview
RESEARCH FOUNDATION INTERNATIONAL (INDIA)
Editor
Dharam Vir
Contemporary Social Sciences
Volume 24, Number 1 (January-March), 2015
(An Autonomous, Registered (1972), Recognized Charitable Organization of Social Scientists, Authors, Journalists and Social Activists)
Founder
Padma Shri S. S. Shashi
Editorial BoardFOUNDER
Padma Shri S. S. Shashi, Executive Chairman, Research Foundation International (India)
and Former Director General, Publications Division, Government of India, ‘Anusandhan’,
B-4/245, Safdarjung Enclave, New Delhi–110 029, India.
EDITOR
Dharam Vir, Former Head, Department of Post-graduate Studies and Research in
Sociology, Nanakchand Anglo Sanskrit College, CCS University, Meerut–250 004, India.
ASSOCIATE EDITORS
Sanjeev Mahajan, Department of Post-graduate Studies and Research in Sociology,
Nanakchand Anglo Sanskrit College, Ch. Charan Singh University, Meerut–250 004, India.
Richa Singh, Secretary (Academics), Social Science Division, Research Foundation
International (India), Delhi–110 029, India.
MANAGING EDITOR
Kamlesh Mahajan, Department of Sociology, Ismail National Mahila Post-graduate
College, Ch. Charan Singh University, Meerut–250 004, India.
BOOK REVIEW EDITOR
S. K. Gupta, Professor of Sociology (Retired), Panjab University, Chandigarh–160 014,
India.
CONSULTING EDITORS
Dr. A. K. Singh (Assistant Coordinator, IGNOU Centre, Rohini, Delhi); Prof. B. K. Nagla
(M. D. University, Rohtak); Prof. Bhoumik Deshmukh (University of Pune, Pune); Prof. I.
P. Singh (Former Head of Anthropology, Delhi University, Delhi); Prof. I. S. Chauhan
(Former Vice-Chancellor, Barakatulla University, Bhopal); Dr. László Vasa, Faculty of
Economics and Social Sciences, Szent István University, Hungary; Dr. Mamta Singh
(Academic Counsellor, IGNOU Centre, Rohini, Delhi); Dr. R. W. Sherman, Adjunct
Associate Professor, Silberman School of Social Work, New York; Prof. S. S. Sharma (CCS
University, Meerut); Prof. S. K. Gupta (Panjab University, Chandigarh); Prof. Satya
Prakash (Department of Law, N. A. S. College, Meerut); Prof. Wang Xiaoyi (Director, Rural
and Industrial Sociology, Institute of Sociology, Chinese Academic of Social Sciences,
Beijing, China); Dr. Y. N. Sharma ‘Arun’ (Member, Sahitya Academy).
ISSN 0302-9298
World Copyrights of articles published in CSS are controlled by Contemporary Social
Sciences, 1972. No part of this publication may be reproduced in any form without written
permission of the Editor.
Contents
1 Status of Rice Production in Jammu and Kashmir : An Economic
Analysis
Mysir Jeelani Kaloo and Tapan Choure 1
2 Knowledge, Attitudes and Practices (KAP) towards Family
Planning among Currently Married Women in Major States of India
Pramod K. Gupta and Sarita Verma 13
3 Plasma Technology in Textile : A Step towards the Green
Environment
Arpita Kothari 29
4 Education for the 21st Century : The Singapore Context
Marc Jonet 49
5 The Efficiency of John Dewey’s Teaching Method in relation to
Tourism and Leisure
Abbas Ardekanian and Abbas Hassani 79
6 Public Administration in Terms of Productivity and Efficiency :
Innovative Practices in Service Delivery
V. Rama Krishna, R. Shashidhar and Muniraju M. 85
7 Human Resource Management in PSBs : The Need of the Hour
Sarita Aggarwal 93
8 Rural Society and Health Facilities
Rangoli Chandra 103
9 Sedition Law and its Draconian Effects
Geetika Garg 111
10 Overview of Work Life Balance and Workers Performance in Bali
Dewi Puri Astiti 121
11 Comparison of E-image and True Image of Printed Cotton Fabrics
Sarabjeet Kaur and Surabhi Mahajan 129
12 Research on Agricultural Products Trade Current Situation and its
Competitiveness in China under Financial Crisis
Shasha Li 139
Journal of National Development
Aims and Scope
The Journal of National Development (JND) is an interdisciplinary bi-annual peer reviewed &refereed international journal committed to the ideals of a ‘world community’ and‘universal brotherhood’. The Journal is a joint effort of like-minded scholars in the field ofsocial research. Its specific aims are to identify, to understand and to help the process ofnation-building within the framework of a ‘world community’ and enhance research across the social sciences (Sociology, Anthropology, Political Science, Psychology, History,Geography, Education, Economics, Law, Communication, Linguistics) and relateddisciplines like like all streams of Home Science, Management, Computer Science,Commerce as well as others like Food Technology, Agricultural Technology, InformationTechnology, Environmental Science, Dairy Science etc. having social focus/implications.. It focuses on issues that are global and on local problems and policies that have internationalimplications. By providing a forum for discussion on important issues with a globalperspective, the JND is a part of unfolding world wide struggle for establishing a just andpeaceful world order. Thus, the JND becomes a point of confluence for the rivulets fromvarious disciplines to form a mighty mainstream gushing towards the formulation andpropagation of a humanistic world- view.
Publication Schedule
The Journal of National Development is published in volumes of approximately 250-300 pages, divided into two bi-annual issues–summer and winter. Besides, a special issue in Hindi isalso published every year to meet the demand of social scientists, both research scholarsand teachers of Hindi speaking states of India.
Subscription and Business Correspondence
The annual subscription is ` 1000 in India and US$ 60 abroad, including postage bySpeed-Post/Airmail. Special issue in Hindi is free with annual subscription. All thesubscriptions must be prepaid in favour of The Journal of National Development, payable atMeerut.
ISSN 0972-8309; NAAS Rating : 2.50; IBI FACTOR : 3.46
All correspondence pertaining to subscription, change of address, purchase of backnumbers, books for review and advertisements should be addressed to :
The Managing Editor
Journal of National Development
D-59, Shastri Nagar, Meerut-250 004 (India)
Tel : 91+121-2763765, 2770765; Mobile : 91+9412200765, 91+99997771669
<e-mail : [email protected]>
Website : www.jndmeerut.org
1
Status of Rice Production in Jammu and
Kashmir : An Economic Analysis
Mysir Jeelani Kaloo* and Tapan Choure**
Jammu and Kashmir is well acknowledged for both agricultural and horticultural, and has
maintained a first-rate status in all the States of India, but at the equivalent time rice being a staple
food for almost intact population is losing its status. Present study was based on the secondary data
in which linear multiple regression model used to understand the impact of area and irrigation on the
production of rice in Jammu and Kashmir, the data has revealed that both the variables has shown
85% of variation caused in the rice production Jammu and Kashmir, but at the same time area under
the rice production in Jammu and Kashmir is declining as there is continuously land diversion
taking place from rice to horticultural one as a result every year government has to import at a large
scale from the central pool.
[Key words : Rice, Jammu & Kashmir, Production, Multiple Regressions]
1. Introduction
Jammu and Kashmir’s economy is predominantly dependent on
agriculture and allied activities. The Kashmir valley is known for its sericulture
and cold-water fisheries. Wood from Kashmir is used to make high-quality
cricket bats, popularly known as Kashmir Willow. Kashmiri saffron is very
famous and brings the state a handsome amount of foreign exchange.
Agricultural exports from Jammu and Kashmir include apples, barley, cherries,
corn, millet, oranges, rice, peaches, pears, saffron, sorghum, vegetables, and
wheat, while manufactured exports include handicrafts, rugs, and shawls.
CONTEMPORARY SOCIAL SCIENCES, Vol. 24, Number 1 (January-March), 2015
* Research Scholar, School of Studies in Economics, Vikram University, Ujjain, MadhyaPradesh (India) E-mail: <[email protected]>
** Professor & Head, School of Studies in Economics, Vikram University, Ujjain, MadhyaPradesh (India) E-mail: <[email protected]>
Horticulture plays a vital role in the economic development of the state. With an
annual turnover of over 3 billion (US$51 million), apart from foreign exchange of
over 800 million (US$14 million), this sector is the next biggest source of income
in the state’s economy. The region of Kashmir is known for its horticulture
industry and is the wealthiest region in the state. Horticultural produce from the
state includes apples, apricots, cherries, pears, plums, almonds and walnuts. The
Doda district has deposits of high-grade sapphire. Though small, the
manufacturing and services sector is growing rapidly, especially in the Jammu
division. In recent years, several consumer goods companies have opened
manufacturing units in the region. The Associated Chambers of Commerce and
Industry of India (ASSOCHAM) have identified several industrial sectors which
can attract investment in the state, and accordingly, it is working with the union
and the state government to set up industrial parks and special economic zones.
In the fiscal year 2005–06, exports from the state amounted to 11.5 billion (US$190
million). However, industrial development in the state faces several major
constraints including extreme mountainous landscape and power shortage. The
Jammu & Kashmir Bank, which is listed as an S&P CNX 500 conglomerate, is
based in the state. It reported a net profit of 598 million (US$10 million) in 2008.
The Government of India has been keen to economically integrate Jammu and
Kashmir with the rest of India. The state is one of the largest recipients of grants
from New Delhi, totaling US$812 million per year. It has a mere 4% incidence of
poverty, one of the lowest in the country. In an attempt to improve the
infrastructure in the state, Indian Railways is constructing the ambitious
Kashmir Railway project at a cost of more than US$2.5 billion. Trains run on the
119 km Baramula-Qazigund section. The 17.5 km Qazigund-Banihal section
through the 11 km long Pir Panjal Railway Tunnel has been constructed.
Udhampur-Katra section may be ready in 2013. The Katra-Banihal section is
under construction. The route crosses major earthquake zones, and is subjected
to extreme temperatures of cold and heat, as well as inhospitable terrain, making
it an extremely challenging engineering project. It is expected to increase tourism
and travel to Kashmir. Three other railway lines, the Bilaspur–Mandi–Leh
railway, Srinagar-Kargil-Leh railway and the Jammu-Poonch railway have been
proposed. Jammu and Kashmir is home to several valleys such as the Kashmir
Valley, Tawi Valley, Chenab Valley, Poonch Valley, Sind Valley and Lidder
Valley. The main Kashmir valley is 100 km (62 mi) wide and 15,520.3 km2 (5,992.4
sq mi) in area. The Himalayas divide the Kashmir valley from Ladakh while the
Pir Panjal range, which encloses the valley from the west and the south, separates
2 Mysir Jeelani Kaloo and Tapan Choure
it from the Great Plains of northern India. Along the northeastern flank of the
Valley runs the main range of the Himalayas. This densely settled and beautiful
valley has an average height of 1,850 meters (6,070 ft) above sea-level but the
surrounding Pir Panjal range has an average elevation of 5,000 meters (16,000 ft).
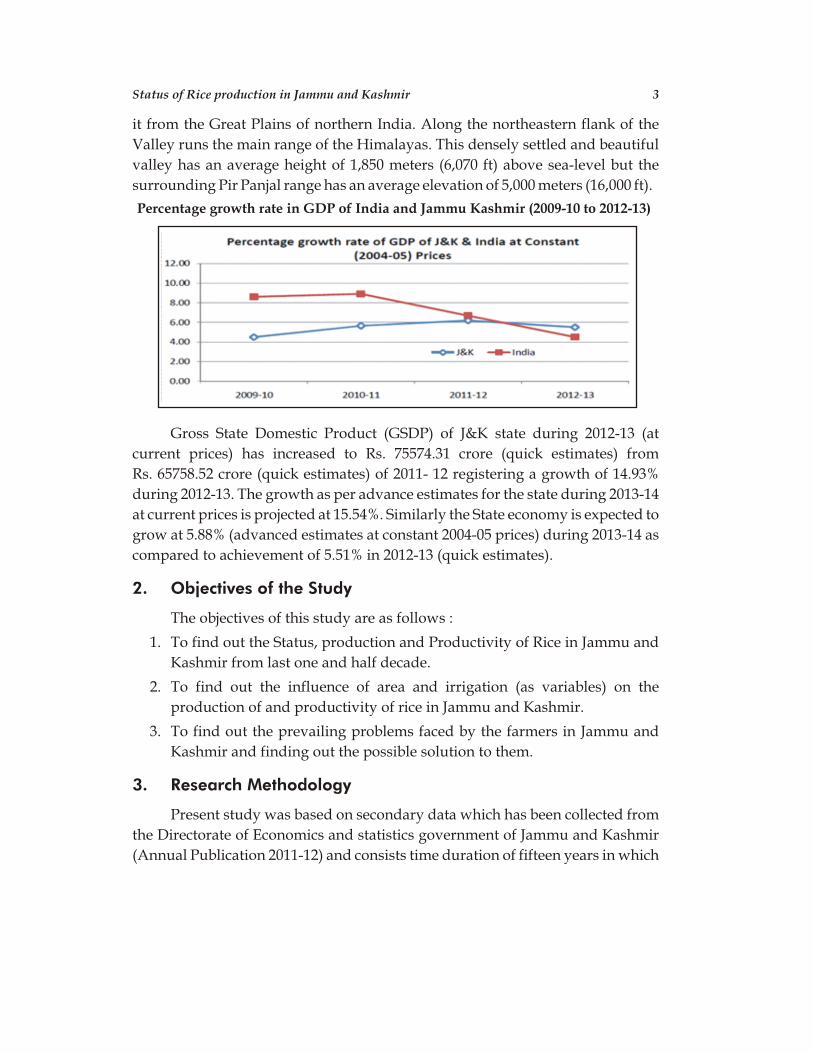
Percentage growth rate in GDP of India and Jammu Kashmir (2009-10 to 2012-13)
Gross State Domestic Product (GSDP) of J&K state during 2012-13 (at
current prices) has increased to Rs. 75574.31 crore (quick estimates) from
Rs. 65758.52 crore (quick estimates) of 2011- 12 registering a growth of 14.93%
during 2012-13. The growth as per advance estimates for the state during 2013-14
at current prices is projected at 15.54%. Similarly the State economy is expected to
grow at 5.88% (advanced estimates at constant 2004-05 prices) during 2013-14 as
compared to achievement of 5.51% in 2012-13 (quick estimates).
2. Objectives of the Study
The objectives of this study are as follows :
1. To find out the Status, production and Productivity of Rice in Jammu and
Kashmir from last one and half decade.
2. To find out the influence of area and irrigation (as variables) on the
production of and productivity of rice in Jammu and Kashmir.
3. To find out the prevailing problems faced by the farmers in Jammu and
Kashmir and finding out the possible solution to them.
3. Research Methodology
Present study was based on secondary data which has been collected from
the Directorate of Economics and statistics government of Jammu and Kashmir
(Annual Publication 2011-12) and consists time duration of fifteen years in which
Status of Rice production in Jammu and Kashmir 3
multiple regression models used to find out the impact of area and irrigation on
the production of rice in Jammu and Kashmir. Due to lack of data simple
compound growth rate was used for to find out the area, irrigation and
production for the year 2013 and 14.
4. Status of Rice in the Jammu and Kashmir
Jammu and Kashmir has a unique distinction of introducing the land
reforms. At that time about 1.82 lakh hectares of the land has been distributed.
Out of which about 0.94 lakh hectares were distributed free of cost among the
peasants with no much effort to be done. The state has abolished the absence of
landlordism. Over the years a neo – land holders have come into existence which
are comparable to absentee of land owners if not landlords holding large “jagirs”.
The reform period in the Jammu and Kashmir has got twin objective of giving the
cultivators his rightful place in the social system and also ensure more efficient
utilization of state resources with an objective to achieve the self sufficiency in
terms of rice production, although leaped forward from mere few lakh tones to
0.89 million tonnes.
Rice production in the Jammu and Kashmir is predominantly a mono
cropped activity with a very high consumption and most important staple food
than other states of India. The area under the rice is distributed by both the
regions in which about 40 percent of area is with Jammu division while as 60
percent of the area is with Kashmir division. Rice play an important role in the
livelihood of the people in the state, although the area under the crop is very
small as compared to other states of the India with only 0.27 m ha, but at the same
time plays an important role in the state economy. Rice productivity in the state is
very high with 2.2 t/ha compared with the national average productivity of
about 1.9 t/ha, although with the passage of time the Area under rice in J&K is
continuously decreasing. Rice in Jammu and Kashmir is grown only once in a
year because of the extreme climatic conditions, further it can be said that the
diversity in the agro climatic which when coupled with farmers preferences give
rise to wide range of grain preferences from bold, coarse grains in temperature
regions to fine, aromatic and basmati in subtropical areas. At the same time the
Jammu region represents almost all the zones ranging from the subtropical one to
mid hills extending to high hills constituting the temperature zone. Basmati rice
is grown on more than 32000 (2010-11) hectors of the area of Jammu division
particularly in the R.S Pora belt which is famous in the world for its famous for its
high aroma. The business from basmati rice annually fetches more than forty five
4 Mysir Jeelani Kaloo and Tapan Choure
Status of Rice production in Jammu and Kashmir 5
(45) crore of rupees. Thus the cultivation of the rice in this region offers a great
potential for its improvement, but at the same time there is a much worry to the
State of J&K in terms of food grain deficiency as it has already touched to 40
percent which will grow in the future as the deficiency is the process which
cannot be stopped, it is bound to happen as the farmers in the cash economy are
more concerned about the benefits which derive them from investment in rice
production to horticultural sector, it will be not surprising to see Kashmir
growing Apples only and Bihar cultivating rice. The deficiency in food grains
(Rice) can be reveled from the fact that the production of Rice in J&K is only seven
(7) lakh metric tons where as the demand is eleven (11) metric tonnes hence there
is a miss match in demand and supply which ultimately results in the inflation.
The deficiency in the food grains has been attributed to rampant conversion of
agricultural land and depleting efficiency of the land, as in Kashmir alone more
than two lakh Kanals of agricultural land of the net sown area has been converted
for commercial and other purposes, the only thing to cheer for the people of
Jammu and Kashmir is that the net production of rice is increasing despite the
land diversion as the methods of cultivation of rice has been shifted from
traditional practices to the modern ones.
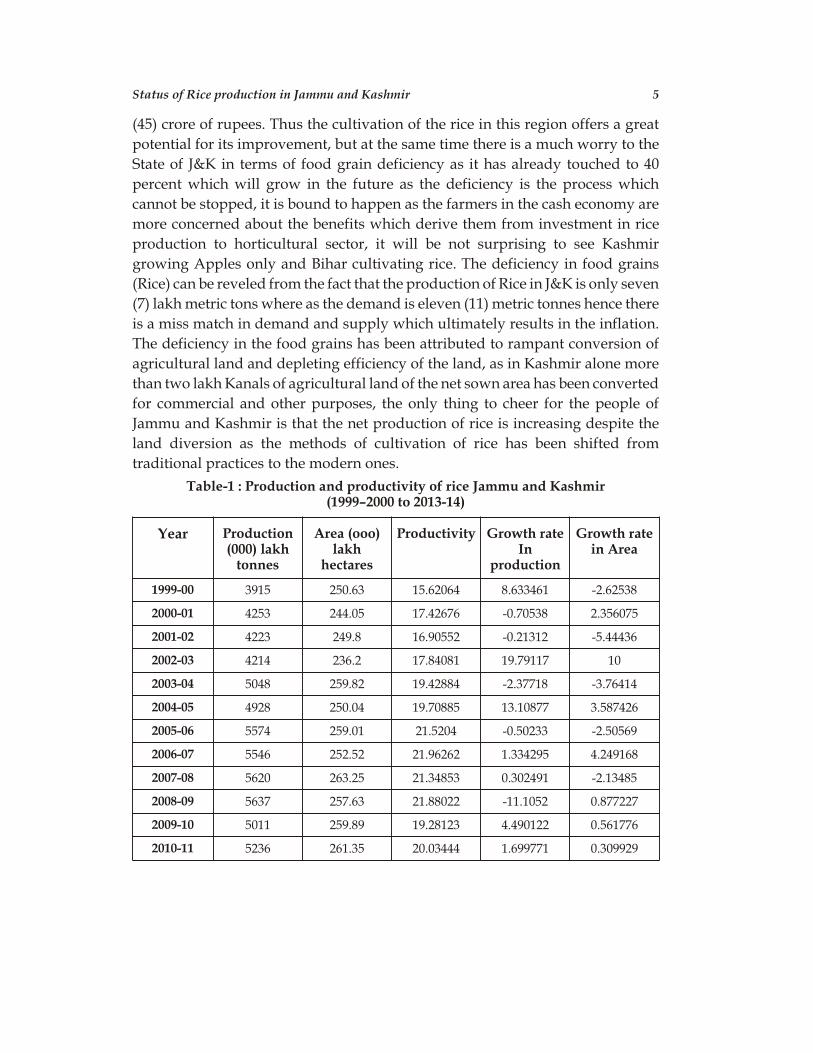
Table-1 : Production and productivity of rice Jammu and Kashmir(1999–2000 to 2013-14)
Year Production(000) lakh
tonnes
Area (ooo)lakh
hectares
Productivity Growth rateIn
production
Growth rate in Area
1999-00 3915 250.63 15.62064 8.633461 -2.62538
2000-01 4253 244.05 17.42676 -0.70538 2.356075
2001-02 4223 249.8 16.90552 -0.21312 -5.44436
2002-03 4214 236.2 17.84081 19.79117 10
2003-04 5048 259.82 19.42884 -2.37718 -3.76414
2004-05 4928 250.04 19.70885 13.10877 3.587426
2005-06 5574 259.01 21.5204 -0.50233 -2.50569
2006-07 5546 252.52 21.96262 1.334295 4.249168
2007-08 5620 263.25 21.34853 0.302491 -2.13485
2008-09 5637 257.63 21.88022 -11.1052 0.877227
2009-10 5011 259.89 19.28123 4.490122 0.561776
2010-11 5236 261.35 20.03444 1.699771 0.309929
2001-12 5325 262.16 20.31202 3.286385 -0.72856
2012-13 5500 260.25 21.13353 4.727273 -0.35735
2013-14 5760 259.32 22.21194 -100 -100
Source : Government of Jammu and Kashmir, Digest of Statistics (2010–11),
Directorate of Economics & Statistics.5
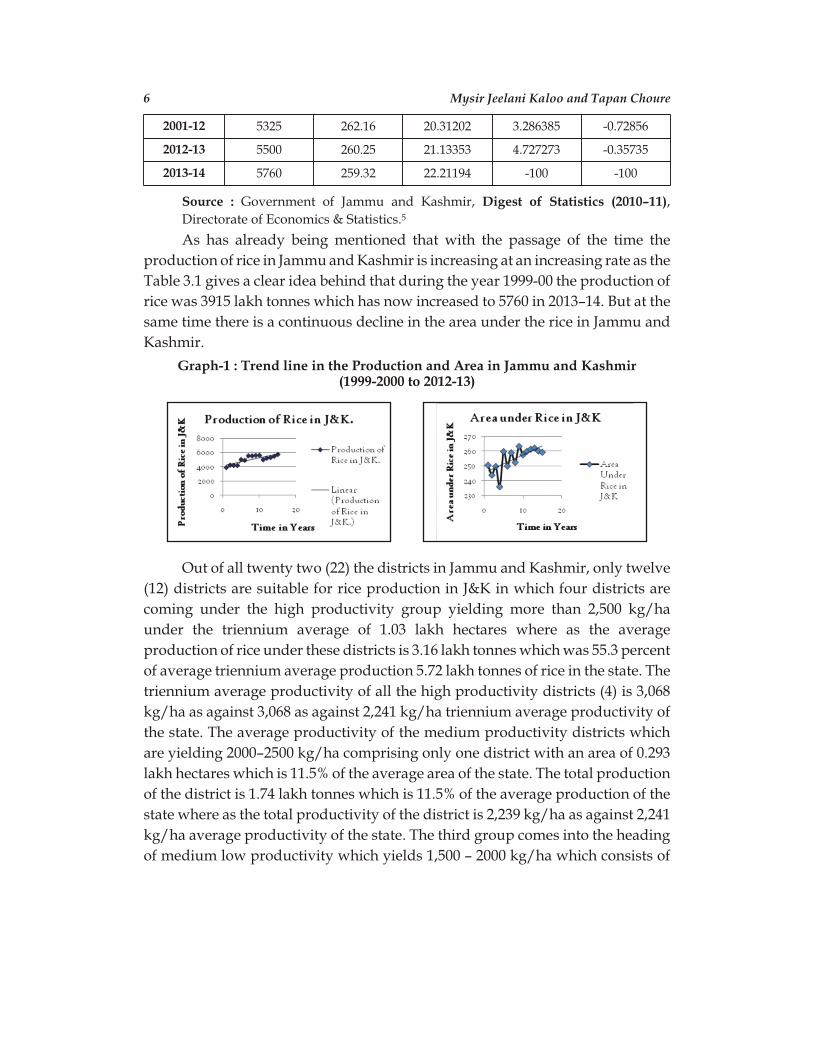
As has already being mentioned that with the passage of the time the
production of rice in Jammu and Kashmir is increasing at an increasing rate as the
Table 3.1 gives a clear idea behind that during the year 1999-00 the production of
rice was 3915 lakh tonnes which has now increased to 5760 in 2013–14. But at the
same time there is a continuous decline in the area under the rice in Jammu and
Kashmir.
Graph-1 : Trend line in the Production and Area in Jammu and Kashmir(1999-2000 to 2012-13)
Out of all twenty two (22) the districts in Jammu and Kashmir, only twelve
(12) districts are suitable for rice production in J&K in which four districts are
coming under the high productivity group yielding more than 2,500 kg/ha
under the triennium average of 1.03 lakh hectares where as the average
production of rice under these districts is 3.16 lakh tonnes which was 55.3 percent
of average triennium average production 5.72 lakh tonnes of rice in the state. The
triennium average productivity of all the high productivity districts (4) is 3,068
kg/ha as against 3,068 as against 2,241 kg/ha triennium average productivity of
the state. The average productivity of the medium productivity districts which
are yielding 2000–2500 kg/ha comprising only one district with an area of 0.293
lakh hectares which is 11.5% of the average area of the state. The total production
of the district is 1.74 lakh tonnes which is 11.5% of the average production of the
state where as the total productivity of the district is 2,239 kg/ha as against 2,241
kg/ha average productivity of the state. The third group comes into the heading
of medium low productivity which yields 1,500 – 2000 kg/ha which consists of
6 Mysir Jeelani Kaloo and Tapan Choure
five districts under the area off 1.09 lakh hectares which is 42.7% of the average
area under the state (2.55 lakh hectares). Whereas the production of rice under the
group was 1.74 lakh tonnes which was 30.4% of the average production of rice
under the state, the productivity of the rice under this group was 1,596 kg/ha as
against the 2,241 kg/ha of the average production off the state.
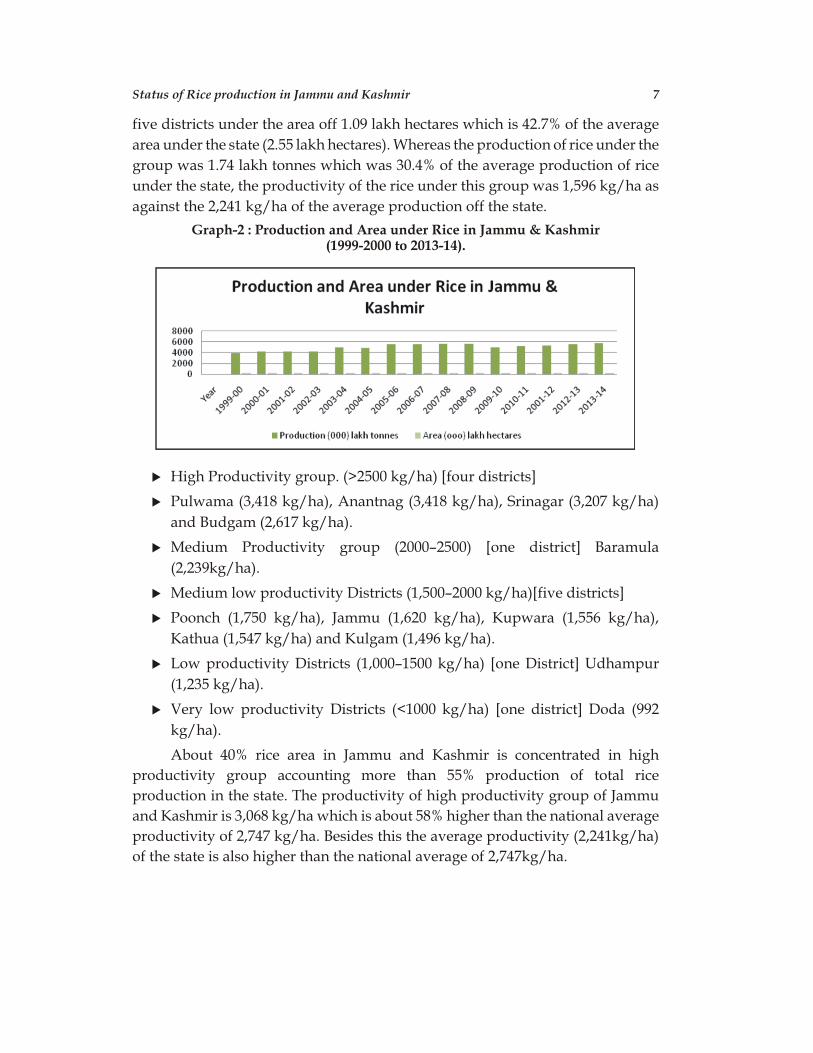
Graph-2 : Production and Area under Rice in Jammu & Kashmir(1999-2000 to 2013-14).
u High Productivity group. (>2500 kg/ha) [four districts]
u Pulwama (3,418 kg/ha), Anantnag (3,418 kg/ha), Srinagar (3,207 kg/ha)
and Budgam (2,617 kg/ha).
u Medium Productivity group (2000–2500) [one district] Baramula
(2,239kg/ha).
u Medium low productivity Districts (1,500–2000 kg/ha)[five districts]
u Poonch (1,750 kg/ha), Jammu (1,620 kg/ha), Kupwara (1,556 kg/ha),
Kathua (1,547 kg/ha) and Kulgam (1,496 kg/ha).
u Low productivity Districts (1,000–1500 kg/ha) [one District] Udhampur
(1,235 kg/ha).
u Very low productivity Districts (<1000 kg/ha) [one district] Doda (992
kg/ha).
About 40% rice area in Jammu and Kashmir is concentrated in high
productivity group accounting more than 55% production of total rice
production in the state. The productivity of high productivity group of Jammu
and Kashmir is 3,068 kg/ha which is about 58% higher than the national average
productivity of 2,747 kg/ha. Besides this the average productivity (2,241kg/ha)
of the state is also higher than the national average of 2,747kg/ha.
Status of Rice production in Jammu and Kashmir 7
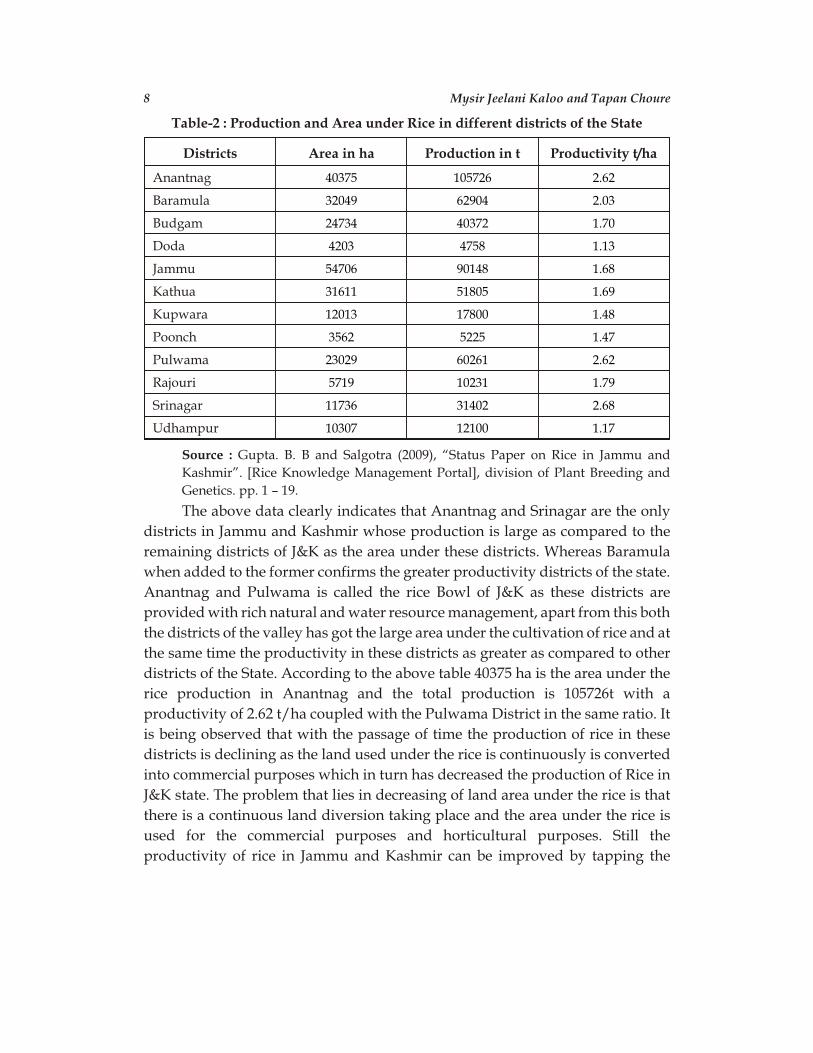
Table-2 : Production and Area under Rice in different districts of the State
Districts Area in ha Production in t Productivity t/ha
Anantnag 40375 105726 2.62
Baramula 32049 62904 2.03
Budgam 24734 40372 1.70
Doda 4203 4758 1.13
Jammu 54706 90148 1.68
Kathua 31611 51805 1.69
Kupwara 12013 17800 1.48
Poonch 3562 5225 1.47
Pulwama 23029 60261 2.62
Rajouri 5719 10231 1.79
Srinagar 11736 31402 2.68
Udhampur 10307 12100 1.17
Source : Gupta. B. B and Salgotra (2009), “Status Paper on Rice in Jammu and
Kashmir”. [Rice Knowledge Management Portal], division of Plant Breeding and
Genetics. pp. 1 – 19.
The above data clearly indicates that Anantnag and Srinagar are the only
districts in Jammu and Kashmir whose production is large as compared to the
remaining districts of J&K as the area under these districts. Whereas Baramula
when added to the former confirms the greater productivity districts of the state.
Anantnag and Pulwama is called the rice Bowl of J&K as these districts are
provided with rich natural and water resource management, apart from this both
the districts of the valley has got the large area under the cultivation of rice and at
the same time the productivity in these districts as greater as compared to other
districts of the State. According to the above table 40375 ha is the area under the
rice production in Anantnag and the total production is 105726t with a
productivity of 2.62 t/ha coupled with the Pulwama District in the same ratio. It
is being observed that with the passage of time the production of rice in these
districts is declining as the land used under the rice is continuously is converted
into commercial purposes which in turn has decreased the production of Rice in
J&K state. The problem that lies in decreasing of land area under the rice is that
there is a continuous land diversion taking place and the area under the rice is
used for the commercial purposes and horticultural purposes. Still the
productivity of rice in Jammu and Kashmir can be improved by tapping the
8 Mysir Jeelani Kaloo and Tapan Choure
uncultivated land, including the waste land and fallow land as there is a large
untapped land that needs to be addressed. At the same time there is a worst case
that degrades the production of rice in the valley is that the farmers face the
problem of dry and dismal picture owing to lack of rain and non availability of
water for irrigation. Due to a major and most essential food staple in the valley
there is a continuous rising problem of lack of rice production in the valley. The
problem of land diversion and lack of timely availability of necessary inputs in
the valley causes the mismatch in the demand and supply which results in
inflation and hence the poverty class and middle class are deeply infected.
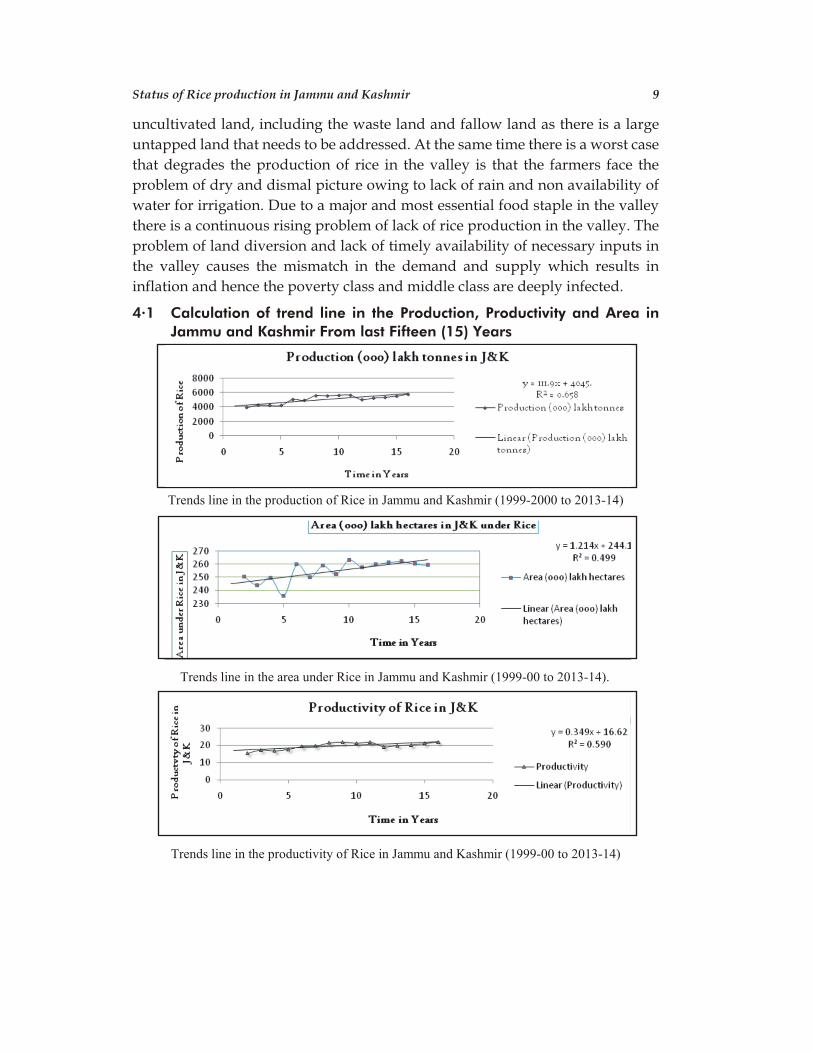
4.1 Calculation of trend line in the Production, Productivity and Area in
Jammu and Kashmir From last Fifteen (15) Years
Trends line in the production of Rice in Jammu and Kashmir (1999-2000 to 2013-14)
Trends line in the area under Rice in Jammu and Kashmir (1999-00 to 2013-14).
Trends line in the productivity of Rice in Jammu and Kashmir (1999-00 to 2013-14)
Status of Rice production in Jammu and Kashmir 9
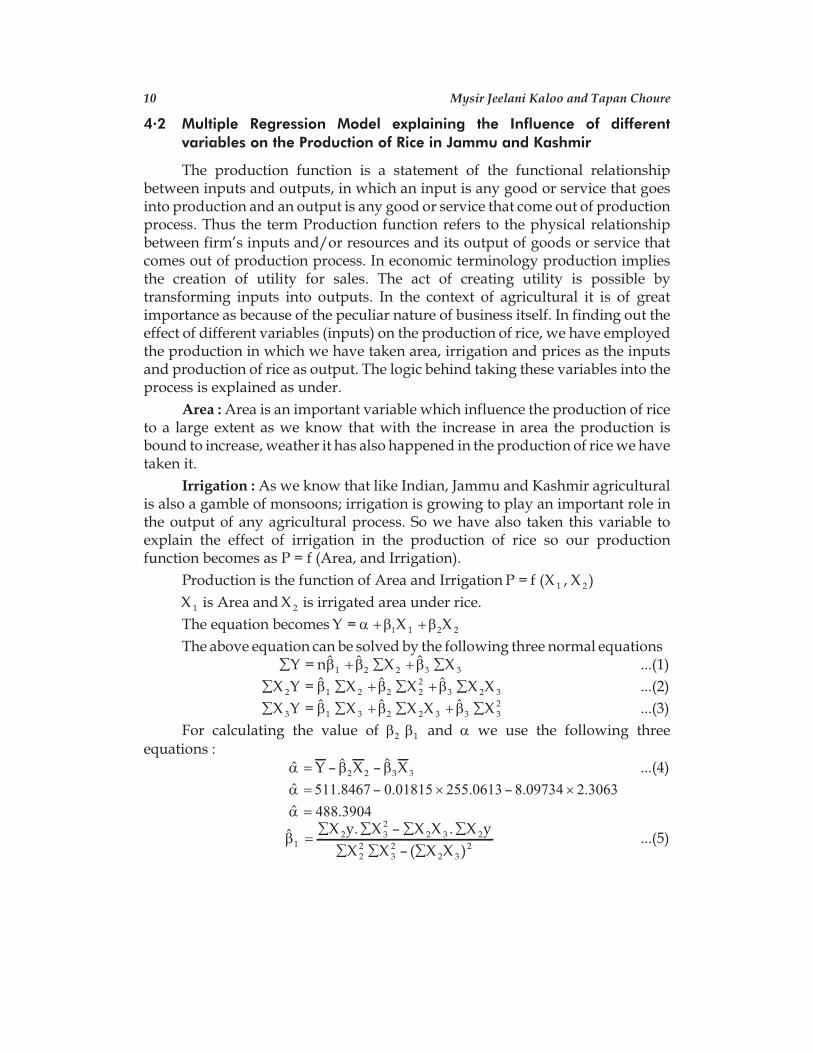
4.2 Multiple Regression Model explaining the Influence of different
variables on the Production of Rice in Jammu and Kashmir
The production function is a statement of the functional relationshipbetween inputs and outputs, in which an input is any good or service that goesinto production and an output is any good or service that come out of productionprocess. Thus the term Production function refers to the physical relationshipbetween firm’s inputs and/or resources and its output of goods or service thatcomes out of production process. In economic terminology production impliesthe creation of utility for sales. The act of creating utility is possible bytransforming inputs into outputs. In the context of agricultural it is of greatimportance as because of the peculiar nature of business itself. In finding out theeffect of different variables (inputs) on the production of rice, we have employedthe production in which we have taken area, irrigation and prices as the inputsand production of rice as output. The logic behind taking these variables into theprocess is explained as under.
Area : Area is an important variable which influence the production of riceto a large extent as we know that with the increase in area the production isbound to increase, weather it has also happened in the production of rice we have taken it.
Irrigation : As we know that like Indian, Jammu and Kashmir agriculturalis also a gamble of monsoons; irrigation is growing to play an important role inthe output of any agricultural process. So we have also taken this variable toexplain the effect of irrigation in the production of rice so our productionfunction becomes as P = f (Area, and Irrigation).
Production is the function of Area and Irrigation P = f (X X1 2, )
X 1 is Area and X 2 is irrigated area under rice.
The equation becomes Y = X X1 2a +b b1 + 2
The above equation can be solved by the following three normal equations å + å + åY = n X X2 3
$ $ $b b b1 2 3 ...(1)
å å + å + åX Y = X X X X22
2 32 1 2 2 3$ $ $b b b ...(2)
å å + å + åX Y = X X X X2 3 32
3 1 3 2 3$ $ $b b b ...(3)
For calculating the value of b b2 1 and a we use the following threeequations :
$ $ – $a = b bY – X X2 32 3 ...(4)
$ – –a = 511.8467 0.01815 255.0613 8.09734 2.3063´ ´
$a = 488.3904
$ –
– ( )b1 2
=å å å å
å å å
X y. X X X . X y
X X X X2 3
22 3 2
22
32
2 3
...(5)
10 Mysir Jeelani Kaloo and Tapan Choure
$ . . – . .
.b1
4483 130 0 05520695 5 87177 39 6224
826 1917734=
´ ´
´0 5520695 5 87177 2. – ( . ) = 1 01875.
$ – –
– ( )b2 2
=å å å å å
å å
X y. X X X X . X y
X X X X3 3
222
2 3 2
22
32
2 3
...(6)
$ . . – . .
.b2
39 6224 826 1917734 5 87177 4483 130
826 191773=
´ ´
4 0 05520695 5 87177 2´ . – ( . ) = 8 09734.
RX y + X y
y
2 2 3
2=
å å å
å
$b b1 2 ...(7)
R2 =´ + ´0 01875 4483 130 8 09734 39 6224
59234 437
. . . .
.
For estimating the standard errors of $b1 and $b2 we need to estimate of s u2
Rei
yi
22
2=
å
å1 – where å = åei yi R2 2 2( – )1
R2 = 18759 32
59234 4370 852123–
.
.. .
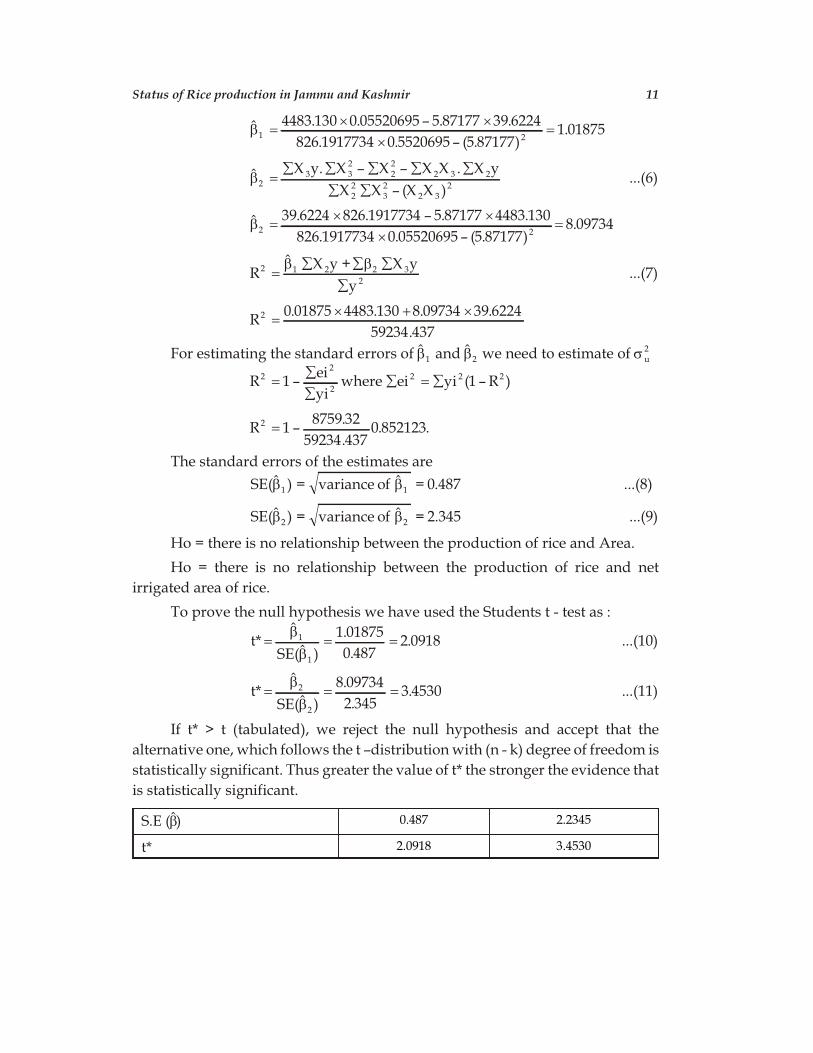
The standard errors of the estimates are
SE( ) = variance of = .487$ $b b1 1 0 ...(8)
SE( ) = variance of = 2.345$ $b b2 2 ...(9)
Ho = there is no relationship between the production of rice and Area.
Ho = there is no relationship between the production of rice and net
irrigated area of rice.
To prove the null hypothesis we have used the Students t - test as :
t* = = =$
$.
..
b
b
1
1
1 01875
0 4872 0918
SE( )...(10)
t* = = =$
$.
..
b
b
2
2
8 09734
2 3453 4530
SE( )...(11)
If t* > t (tabulated), we reject the null hypothesis and accept that the
alternative one, which follows the t –distribution with (n - k) degree of freedom is
statistically significant. Thus greater the value of t* the stronger the evidence that
is statistically significant.
S.E ($b) 0.487 2.2345
t* 2.0918 3.4530
Status of Rice production in Jammu and Kashmir 11
Hence we can conclude that there is a significant relationship between
production of rice and Area under rice in Jammu and Kashmir at (15 – 3 =1.782)
degree of freedom, and there exists a significant relationship between production
of rice and total irrigated area under rice in Jammu and Kashmir at (15 – 3 =1.782)
degree of freedom.
5. Conclusion
Rice production in Jammu and Kashmir has virtually come down from last
one and half decade, even though the government has taken some of the
appropriate procedures in increasing it. Even though the green revolution has
helped the state in increasing the production of rice but at the same time looking
for the future of rice in Jammu and Kashmir will come under additional pressure
from the intense competition of land and water due to changing climatic
condition, high price for fertilizers. This requires a careful analysis for the current
scenario and perspective with a view to identify researchable issues and the
appropriate strategies to address them. However there is still a scope for
improving rice production in this handicapped ecology through proper scientific
intervention and policy decision
References
1. Directorate of Economics & Statistics, Government of Jammu and Kashmir,
Digest of Statistics (2010 – 11), Directorate of Economics & Statistics.
2. Government of Jammu and Kashmir, Economic Survey, J & K 2013-14,
Directorate of Economics & Statistics, p. 4.
3. “Farmers in Jammu and Kashmir apprehend lower rice production due to lack
of rain”, Greater Kashmir, 19 July, 2013.
4. Gupta. B. B and Salgotra, Status Paper on Rice in Jammu and Kashmir.[Rice
Knowledge Management Portal], Division of Plant Breeding and Genetics, 2009,
pp. 1 – 19.
5. Harish Kunwar, “Train-Link for J & K Prosperity” Press Release, Press
Information Bureau, Government of India, dated 16 October 2008.
6. Kennedy John and Maria. M, Advanced Micro Economic Theory, New Delhi :
Himalayan Publishing House, 2000, pp. 276-279.
7. “Kashmir : the economy looks up”, The Economic Times, 18 June 2009. ê
12 Mysir Jeelani Kaloo and Tapan Choure
Article Received on January 30, 2015; Accepted on March 11, 2015
2
Knowledge, Attitudes and Practices (KAP)
towards Family Planning among
Currently Married Women in
Major States of India
Pramod K. Gupta* and Sarita Verma**
This paper is an attempt to find out knowledge, practice and attitude related to family
planning methods among currently married women. It is important to have broad knowledge about
family planning all methods in the context of Indian population growth. Several studies show that
there is long gap between knowledge and practices while using family planning methods. Unmet
pregnancies are a best example to non use of family planning method. There is also gap between
traditional method and modern method of family planning methods, peoples who are using family
planning method is not able to use modern method they still depend on traditional and spacing
method. Prevalence towards family planning method is either less or it is just unplanned among
women and man too. There is not organized planned among the couples for using specific methods.
Very few of them are using spacing method and sterilization and it is varied from state to state and
strata to strata.
[Keywords : Met and Unmet need, Contraceptive Method, Abortion,
Emergency Pills]
1. Introduction
KAP is parameter to have information about specific population to gather
what is known, believed and done in relation to a particular issue. Why it is that
CONTEMPORARY SOCIAL SCIENCES, Vol. 24, Number 1 (January-March), 2015
* Assistant Professor, Department of Sociology, Lucknow University, Lucknow, UttarPradesh (India) E-mail: <[email protected]>
** Research Scholar, Department of Sociology, Lucknow University, Lucknow, UttarPradesh (India) E-mail: <[email protected]>
the place where most knowledge on structure organization and learning is
allocated is also the place where the least of this knowledge gets put to use?
In 1952, the Indian Government was one of the first in the world to
formulate a national family planning programme, which was further expanded
to encompass maternal and child health, family welfare, and nutrition
programmes.
India is committed to promoting a small family norm and supporting
population control and development programmes. (Chandrasekhar, 1968 :
620-628) One of the fourteen Nations optimized their socio-demographic goals
has to control over fertility regulation and contraception with a wide range of
choices (Ministry of Health and Family Welfare, 2000). After 1976 government
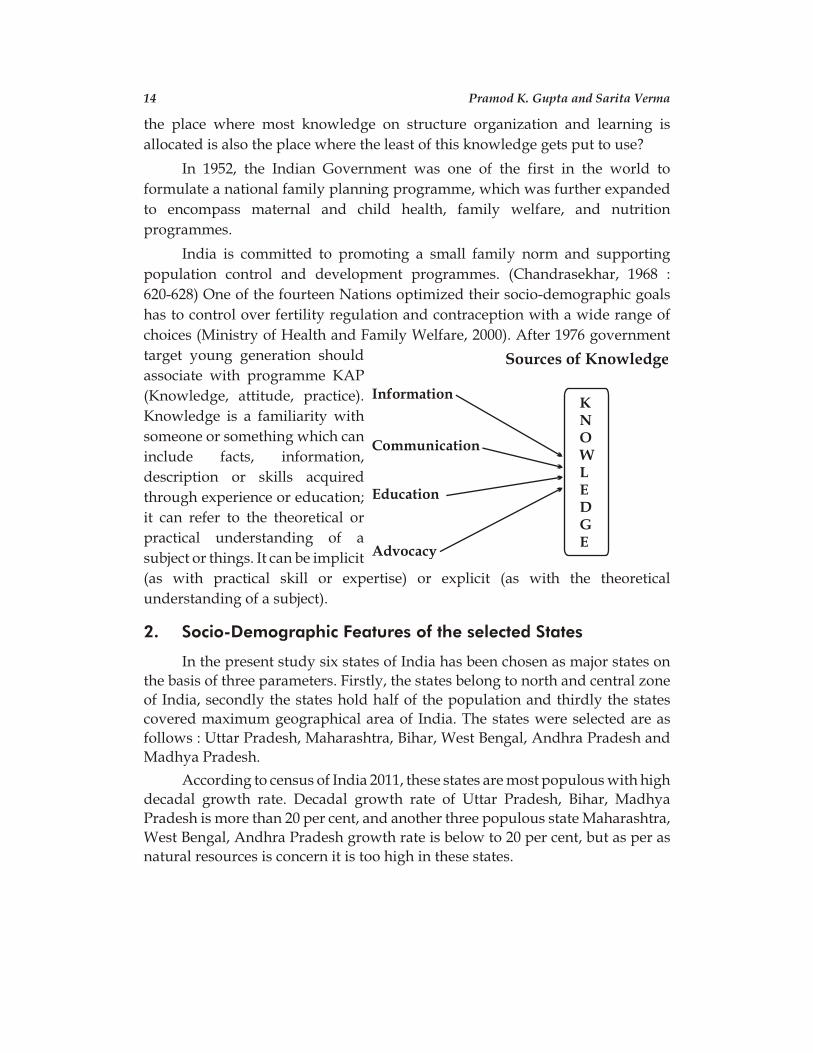
target young generation should
associate with programme KAP
(Knowledge, attitude, practice).
Knowledge is a familiarity with
someone or something which can
include facts, information,
description or skills acquired
through experience or education;
it can refer to the theoretical or
practical understanding of a
subject or things. It can be implicit
(as with practical skill or expertise) or explicit (as with the theoretical
understanding of a subject).
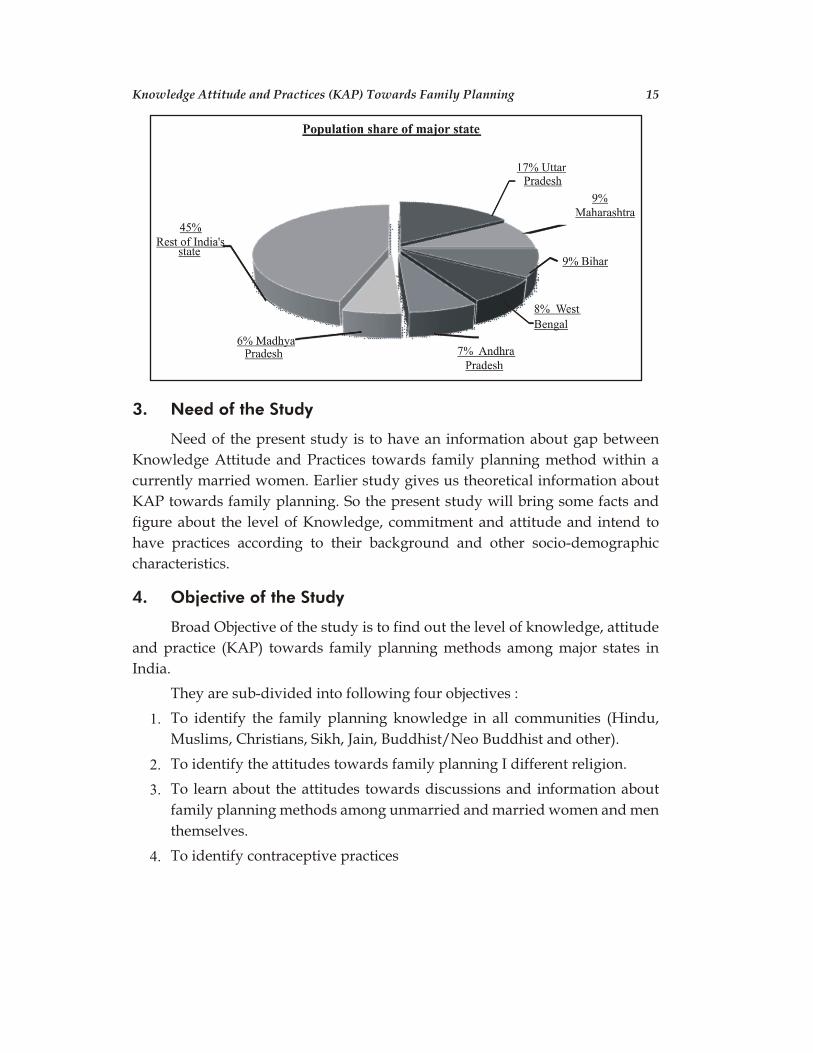
2. Socio-Demographic Features of the selected States
In the present study six states of India has been chosen as major states on
the basis of three parameters. Firstly, the states belong to north and central zone
of India, secondly the states hold half of the population and thirdly the states
covered maximum geographical area of India. The states were selected are as
follows : Uttar Pradesh, Maharashtra, Bihar, West Bengal, Andhra Pradesh and
Madhya Pradesh.
According to census of India 2011, these states are most populous with high
decadal growth rate. Decadal growth rate of Uttar Pradesh, Bihar, Madhya
Pradesh is more than 20 per cent, and another three populous state Maharashtra,
West Bengal, Andhra Pradesh growth rate is below to 20 per cent, but as per as
natural resources is concern it is too high in these states.
14 Pramod K. Gupta and Sarita Verma
Information
Communication
Education
Advocacy
KNOWLEDGE
Sources of Knowledge
3. Need of the Study
Need of the present study is to have an information about gap between
Knowledge Attitude and Practices towards family planning method within a
currently married women. Earlier study gives us theoretical information about
KAP towards family planning. So the present study will bring some facts and
figure about the level of Knowledge, commitment and attitude and intend to
have practices according to their background and other socio-demographic
characteristics.
4. Objective of the Study
Broad Objective of the study is to find out the level of knowledge, attitude
and practice (KAP) towards family planning methods among major states in
India.
They are sub-divided into following four objectives :
1. To identify the family planning knowledge in all communities (Hindu,
Muslims, Christians, Sikh, Jain, Buddhist/Neo Buddhist and other).
2. To identify the attitudes towards family planning I different religion.
3. To learn about the attitudes towards discussions and information about
family planning methods among unmarried and married women and men
themselves.
4. To identify contraceptive practices
Knowledge Attitude and Practices (KAP) Towards Family Planning 15
5. Methodology
This study is based on both primary and secondary data. Primary data has
been collected for the fulfilling of above objectives thus an interview has been
organized to using interview schedule. First of all, house listing were done in
selected area (Babuganj, Aliganj and Nishatganj) of Lucknow then on the basis of
pilot survey a list of respondents are being made. So, on the basis of list of the
respondents, purposive sampling was adopted for the selection of the
representative unit of the universe. And an interview has been conducted
through well structured schedule. So, the total sample size of the study were 25
couples and as per norm of the objectives and study currently married of women
were selected for the study, separate interview of female and their husband were
conducted and try to maintain the standards of the interviews. A secondary data
has been compiled to provide a comparative scenario on family planning. So, the
data has also been taken from National Family Health Survey (NFHS-2 & 3)
which has conducted by the Ministry of Health and Family Welfare, Government
of India and access by the International Institute for Population Sciences (IIPS),
Mumbai. So far, with the help of various statistical methods, graphs, diagrams
and chart has been introduced to analyze the tables.
6. Discussion
Indian cultural, social and religious aspects of a community have
influenced on family planning knowledge, attitude and, practice. The cultural
construct of Indian society which reinforces gender bias against men and
women, with varying degrees and variable contexts against the opposite sex, has
led to the continuation of India’s strong preference for male children. (Monica
Das : 2010 : 32-36). Its very strong reason families as well as couples are not using
any contraceptive prevalence. Religious and cultural factors have the potential to
influence the acceptance and use of contraception by couples from different
religious backgrounds in very distinct ways. (Amirrtha Srikanthan, Robert L.
Reid, 2007 : 129). In Islamic religion family and marriage are fundamental to
Islamic society. Sex is permitted provided it is used within marriage and may be
used for pro-creation and pleasure. The majority of Islamic jurists indicate that
family planning is not forbidden. Contraception may be used only within
marriage. Justifiable reasons for contraceptive usage include health risks,
economics, preservation of the woman’s appearance, and improving the quality
of offspring (Ibid : 132-133). In Hindu religion marriage is viewed as essential for
16 Pramod K. Gupta and Sarita Verma
the stability of social order. Reincarnation requires that children pray for the
souls of ancestors; how-ever, a cultural emphasis on party lineage has created
tremendous emphasis on the need for male children. Hindu religion regards the
decision to use contraception as a personal matter for women that is not usually
within the scope of religious injunction (Ibid :133).The Buddhist attitude towards
family planning allows both men and women the right to use any non-violent
form of contraception. Family planning is permissible and encouraged when the
intention to use contraception is wholesome or non-maleficent. The Buddhist
attitude towards family planning allows both men and women the right to use
any non-violent form of contraception. (Amirrtha Srikanthan, Robert L. Reid,
2007 : 134).
6.1 Knowledge of Family Planning Method
Family Planning method basically, refers to the practices that help
individuals or couples to avoid unwanted births, bring about wanted births,
regulate the intervals between pregnancies, control the time at which births
occurs in relation to the age of parents and determines the number of children in
the family.
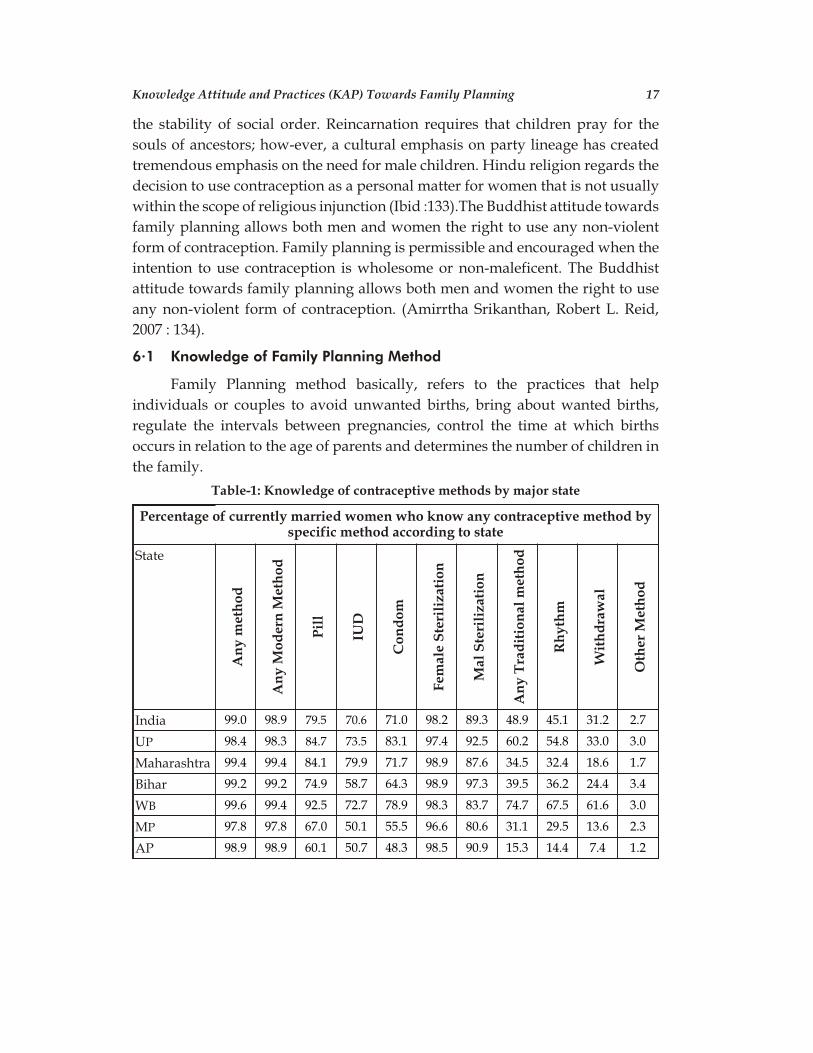
Table-1: Knowledge of contraceptive methods by major state
Percentage of currently married women who know any contraceptive method byspecific method according to state
State
do
hte
m y
nA
do
hte
M nr
ed
oM
yn
A
lliP
DUI
mo
dn
oC
noit
azilir
etS
ela
me
F
noit
azilir
etS l
aM
do
hte
m la
noiti
dar
T y
nA
mht
yh
R
la
war
dhti
W
do
hte
M re
htO
India 99.0 98.9 79.5 70.6 71.0 98.2 89.3 48.9 45.1 31.2 2.7
UP 98.4 98.3 84.7 73.5 83.1 97.4 92.5 60.2 54.8 33.0 3.0
Maharashtra 99.4 99.4 84.1 79.9 71.7 98.9 87.6 34.5 32.4 18.6 1.7
Bihar 99.2 99.2 74.9 58.7 64.3 98.9 97.3 39.5 36.2 24.4 3.4
WB 99.6 99.4 92.5 72.7 78.9 98.3 83.7 74.7 67.5 61.6 3.0
MP 97.8 97.8 67.0 50.1 55.5 96.6 80.6 31.1 29.5 13.6 2.3
AP 98.9 98.9 60.1 50.7 48.3 98.5 90.9 15.3 14.4 7.4 1.2
Knowledge Attitude and Practices (KAP) Towards Family Planning 17
NFHS-3
India 99.3 99.2 87.2 74.3 76.1 98.4 83.2 57.7 48.1 36.3 0.4
UP 99.5 99.5 95.1 88.0 93.5 98.9 91.2 73.2 69.0 42.4 0.4
Maharashtra 99.6 99.6 85.7 75.7 68.9 99.4 81.5 33.7 31.9 8.8 0.1
Bihar 100.0 100.0 95.7 79.1 81.9 99.9 92.3 75.3 50.8 51.4 0.2
WB 99.7 99.3 94.8 67.9 79.8 98.2 78.6 83.8 68.6 66.4 0.5
MP 99.8 99.8 92.7 71.3 83.6 99.7 97.0 71.3 60.9 46.6 0.0
AP 99.1 99.1 62.6 46.0 48.2 99.0 89.1 10.9 9.7 4.3 0.0
Source : NFHS-2 and NFHS-3, (India and State Report).
Inter-state variation in knowledge of contraception shows that knowledge
of any contraception method as well as any modern method has been nearly
universal in all states.
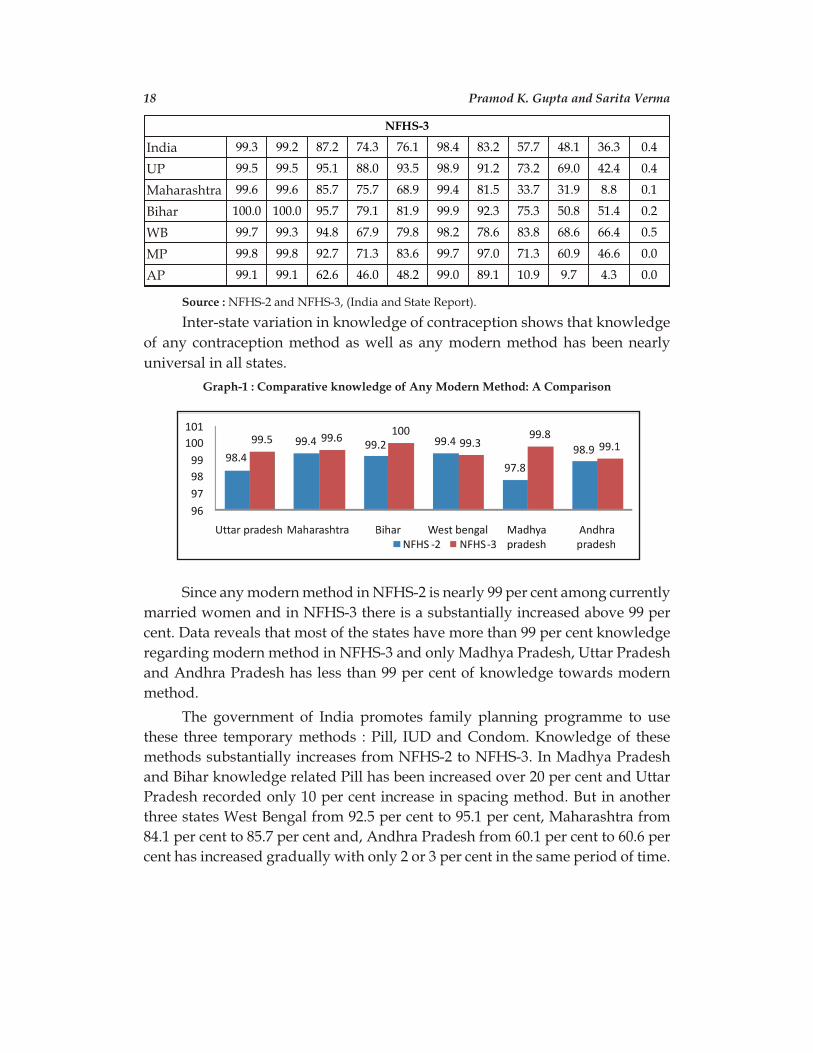
Graph-1 : Comparative knowledge of Any Modern Method: A Comparison
Since any modern method in NFHS-2 is nearly 99 per cent among currently
married women and in NFHS-3 there is a substantially increased above 99 per
cent. Data reveals that most of the states have more than 99 per cent knowledge
regarding modern method in NFHS-3 and only Madhya Pradesh, Uttar Pradesh
and Andhra Pradesh has less than 99 per cent of knowledge towards modern
method.
The government of India promotes family planning programme to use
these three temporary methods : Pill, IUD and Condom. Knowledge of these
methods substantially increases from NFHS-2 to NFHS-3. In Madhya Pradesh
and Bihar knowledge related Pill has been increased over 20 per cent and Uttar
Pradesh recorded only 10 per cent increase in spacing method. But in another
three states West Bengal from 92.5 per cent to 95.1 per cent, Maharashtra from
84.1 per cent to 85.7 per cent and, Andhra Pradesh from 60.1 per cent to 60.6 per
cent has increased gradually with only 2 or 3 per cent in the same period of time.
18 Pramod K. Gupta and Sarita Verma
In Uttar Pradesh, Maharashtra, and West Bengal, more than 70 per cent of
women reported knowledge about IUD. Another important fact of these states
having high density of population, and women are most likely to know about the
pill and men are most likely to know about condom. In Maharashtra state
knowledge about condom is decreasing but with high population growth rate
Madhya Pradesh reported expansion in related knowledge.
Knowledge of male and female sterilization has been increasing since
NFHS-2 to NFHS-3. Knowledge of female sterilization has been above to 95 per
cent in NFHS-2, and became nearly universal with 99 per cent. Knowledge of
male sterilization and any traditional method is less universalize as compared to
the female sterilization and modern method. Only in West Bengal and Uttar
Pradesh, currently married women have very precisely use the traditional
method with 74.7 per cent 60.2 per cent respectively. Only in Andhra Pradesh,
knowledge towards traditional method rates is decreasing.
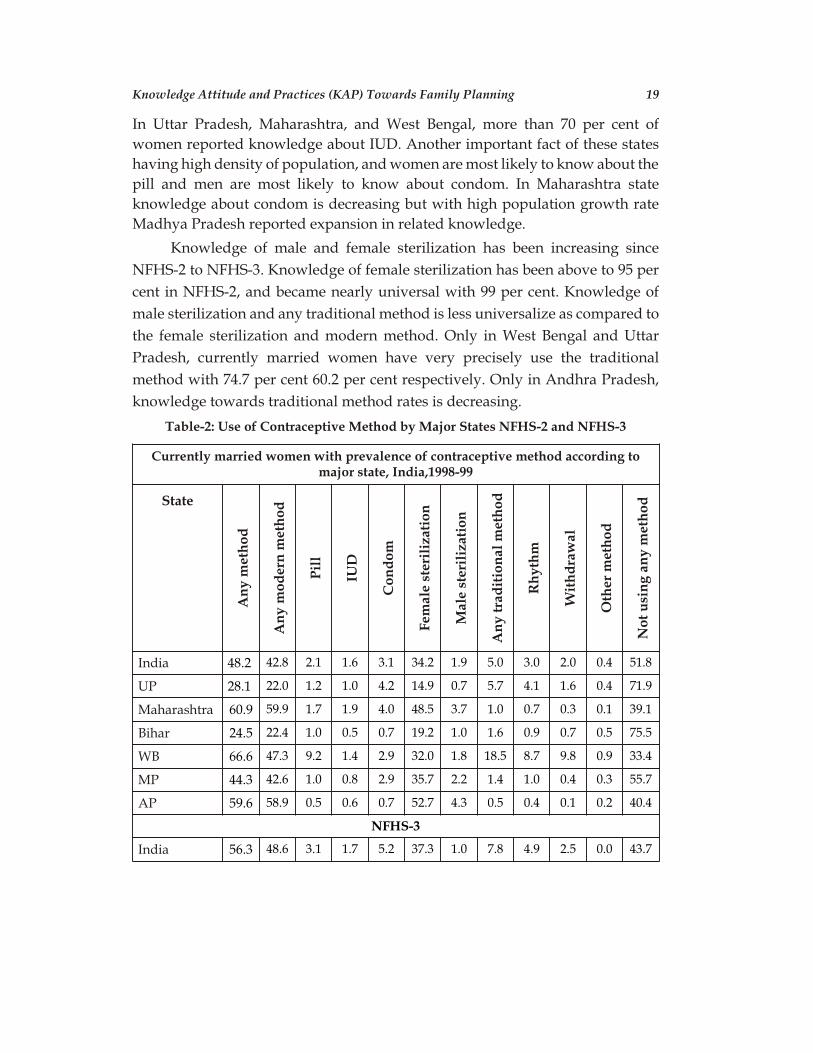
Table-2: Use of Contraceptive Method by Major States NFHS-2 and NFHS-3
Currently married women with prevalence of contraceptive method according tomajor state, India,1998-99
State
do
hte
m y
nA
do
hte
m nr
ed
om
yn
A
lliP
DUI
mo
dn
oC
noit
azilir
ets el
am
eF
noit
azilir
ets el
aM
do
hte
m la
noiti
dart
yn
A
mht
yh
R
la
war
dhti
W
do
hte
m re
htO
do
hte
m y
na
gnis
u to
N
India 48.2 42.8 2.1 1.6 3.1 34.2 1.9 5.0 3.0 2.0 0.4 51.8
UP 28.1 22.0 1.2 1.0 4.2 14.9 0.7 5.7 4.1 1.6 0.4 71.9
Maharashtra 60.9 59.9 1.7 1.9 4.0 48.5 3.7 1.0 0.7 0.3 0.1 39.1
Bihar 24.5 22.4 1.0 0.5 0.7 19.2 1.0 1.6 0.9 0.7 0.5 75.5
WB 66.6 47.3 9.2 1.4 2.9 32.0 1.8 18.5 8.7 9.8 0.9 33.4
MP 44.3 42.6 1.0 0.8 2.9 35.7 2.2 1.4 1.0 0.4 0.3 55.7
AP 59.6 58.9 0.5 0.6 0.7 52.7 4.3 0.5 0.4 0.1 0.2 40.4
NFHS-3
India 56.3 48.6 3.1 1.7 5.2 37.3 1.0 7.8 4.9 2.5 0.0 43.7
Knowledge Attitude and Practices (KAP) Towards Family Planning 19
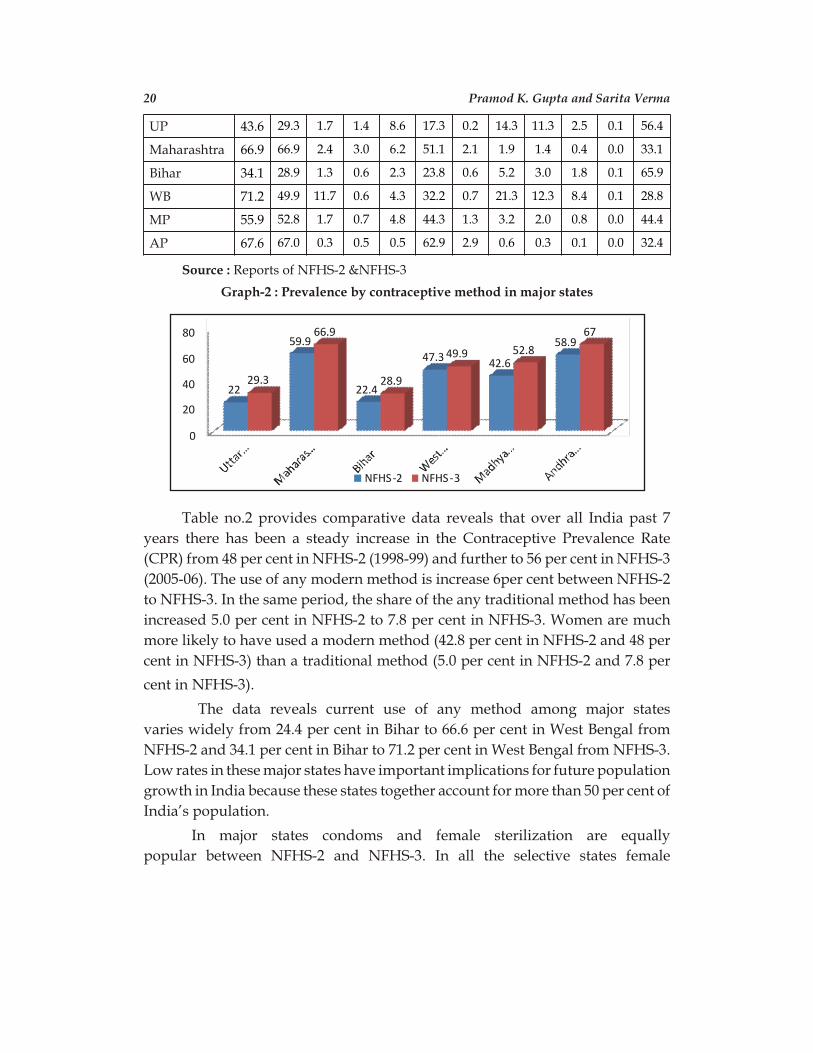
UP 43.6 29.3 1.7 1.4 8.6 17.3 0.2 14.3 11.3 2.5 0.1 56.4
Maharashtra 66.9 66.9 2.4 3.0 6.2 51.1 2.1 1.9 1.4 0.4 0.0 33.1
Bihar 34.1 28.9 1.3 0.6 2.3 23.8 0.6 5.2 3.0 1.8 0.1 65.9
WB 71.2 49.9 11.7 0.6 4.3 32.2 0.7 21.3 12.3 8.4 0.1 28.8
MP 55.9 52.8 1.7 0.7 4.8 44.3 1.3 3.2 2.0 0.8 0.0 44.4
AP 67.6 67.0 0.3 0.5 0.5 62.9 2.9 0.6 0.3 0.1 0.0 32.4
Source : Reports of NFHS-2 &NFHS-3
Graph-2 : Prevalence by contraceptive method in major states
Table no.2 provides comparative data reveals that over all India past 7
years there has been a steady increase in the Contraceptive Prevalence Rate
(CPR) from 48 per cent in NFHS-2 (1998-99) and further to 56 per cent in NFHS-3
(2005-06). The use of any modern method is increase 6per cent between NFHS-2
to NFHS-3. In the same period, the share of the any traditional method has been
increased 5.0 per cent in NFHS-2 to 7.8 per cent in NFHS-3. Women are much
more likely to have used a modern method (42.8 per cent in NFHS-2 and 48 per
cent in NFHS-3) than a traditional method (5.0 per cent in NFHS-2 and 7.8 per
cent in NFHS-3).
The data reveals current use of any method among major states
varies widely from 24.4 per cent in Bihar to 66.6 per cent in West Bengal from
NFHS-2 and 34.1 per cent in Bihar to 71.2 per cent in West Bengal from NFHS-3.
Low rates in these major states have important implications for future population
growth in India because these states together account for more than 50 per cent of
India’s population.
In major states condoms and female sterilization are equally
popular between NFHS-2 and NFHS-3. In all the selective states female
20 Pramod K. Gupta and Sarita Verma
Knowledge Attitude and Practices (KAP) Towards Family Planning 21
sterilization is by far the dominant contraceptive method. Female sterilization
method in Andhra Pradesh continues to be highly skewed, with 63 per cent of
users sterilized in NFHS-3, compared with 52.7 per cent in NFHS-2, as well as
followed by Maharashtra, Madhya Pradesh, West Bengal, and Bihar have
increased 3 to 9per cent users of sterilization between same period of time, and
Uttar Pradesh continues to be lowest position with 14.9 per cent in NFHS-2 to
17.2 per cent in NFHS-3. Uttar Pradesh, Bihar, and West Bengal states except
Maharashtra, Madhya Pradesh and Andhra Pradesh, also have current
contraceptive use rates below to national average.
Percentages of not using any contraceptive method among same group
another three states namely Uttar Pradesh, Bihar and Madhya Pradesh higher
than India’s ratio. In these states majority (more than 50per cent) of currently
married women has not used any contraceptive method. Population growth rate
is very high in Bihar (decadal growth rate 25.07 per cent) due to 75.5 per cent
women not using any contraceptive method in NFHS-2, followed by Uttar
Pradesh with 71.9 per cent. Therefore these not users rate are decreasing
gradually with 65.9 per cent in Bihar and 56.4 per cent in Uttar Pradesh from
NFHS-3. People become aware towards family planning but thought that family
planning is totally personal/individual matter so they do not want to talk about
with outsiders even own family members. If we talk about women some social,
religious factors are working behind their silence.
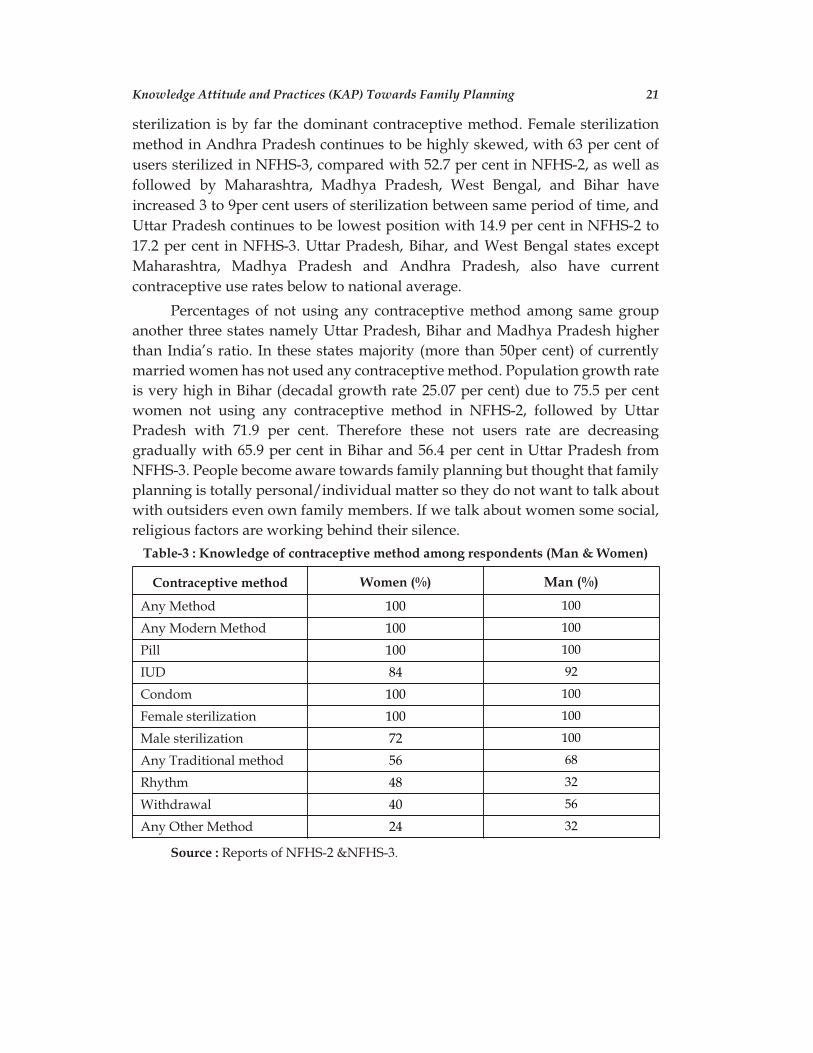
Table-3 : Knowledge of contraceptive method among respondents (Man & Women)
Contraceptive method Women (%) Man (%)
Any Method 100 100
Any Modern Method 100 100
Pill 100 100
IUD 84 92
Condom 100 100
Female sterilization 100 100
Male sterilization 72 100
Any Traditional method 56 68
Rhythm 48 32
Withdrawal 40 56
Any Other Method 24 32
Source : Reports of NFHS-2 &NFHS-3.
The data reveals that 100 per cent of respondents (male and female both)
have knowledge about any contraceptive method or it’s became universal.
Knowledge related specific method like modern method or traditional method
among the respondents; respondents have better knowledge about modern
contraceptives in comparison of traditional method. Knowledge related spacing
method(Pills, Condom) is nearly universal accept IUD, only 84 per cent women
have well known about this method rest of 16 per cent women haven’t
knowledge of IUD, as well as 92 per cent man have knowledge about IUD. All
female and male respondents know about female sterilization but only 72 per
cent female respondents know about male sterilization. Knowledge of any
traditional method is less well known among all male and female respondents.
Only 56 per cent female or 68 per cent male have knowledge about any
traditional method. With 32 per cent, male respondents have better knowledge
related any other method in the comparison of female with 24 per cent.
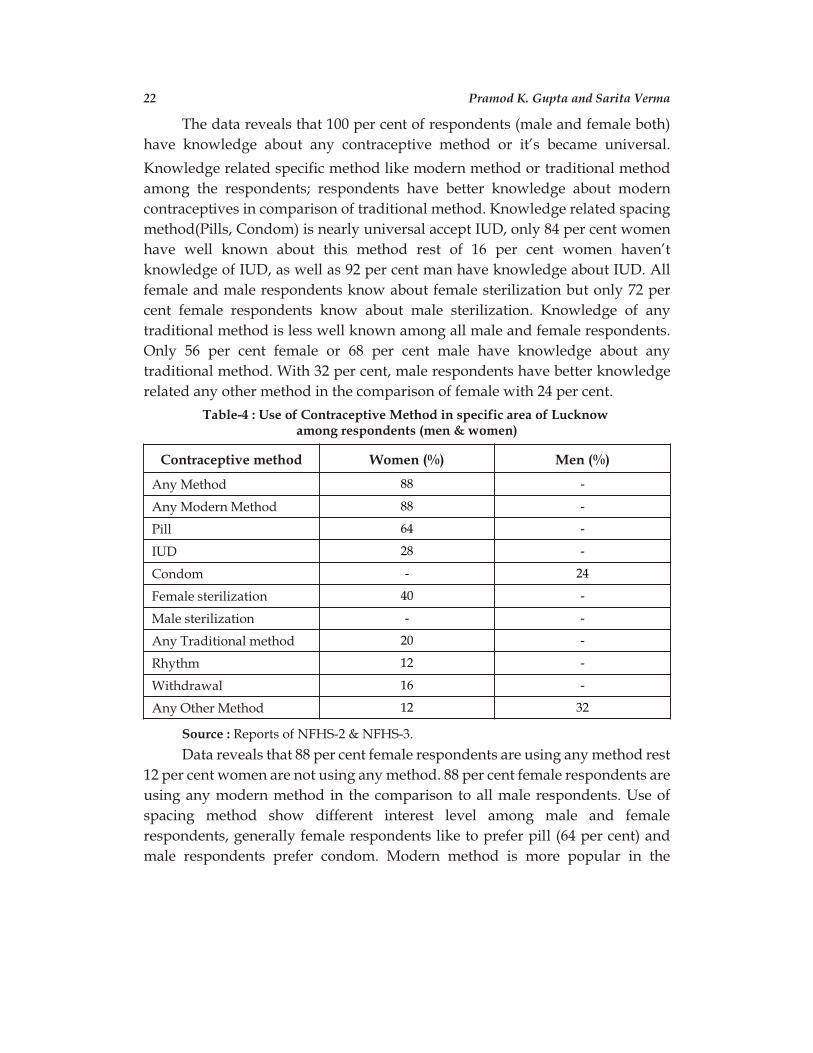
Table-4 : Use of Contraceptive Method in specific area of Lucknow among respondents (men & women)
Contraceptive method Women (%) Men (%)
Any Method 88 -
Any Modern Method 88 -
Pill 64 -
IUD 28 -
Condom - 24
Female sterilization 40 -
Male sterilization - -
Any Traditional method 20 -
Rhythm 12 -
Withdrawal 16 -
Any Other Method 12 32
Source : Reports of NFHS-2 & NFHS-3.
Data reveals that 88 per cent female respondents are using any method rest
12 per cent women are not using any method. 88 per cent female respondents are
using any modern method in the comparison to all male respondents. Use of
spacing method show different interest level among male and female
respondents, generally female respondents like to prefer pill (64 per cent) and
male respondents prefer condom. Modern method is more popular in the
22 Pramod K. Gupta and Sarita Verma

comparison of traditional method among user respondents. Only 20 per cent
female users are adopting traditional method. Only 12 per cent female and 32 per
cent male respondents use other method. Data reflect larger deference in
knowledge, attitude and practice, because respondent have knowledge about
contraceptive method but they do not prefer to use.
In present scenario couples prefer only one child, but most of couple want a
male child if they select only one child, if they select two child then they prefer
female child as second child, if their first child is female child they must want
another male child but if first child is male child they have very less likely to
choose another one. 80 per cent respondents have two children and 60 per cent
respondent’s first child is female child. On this issue education level is not
important because highly educated people think in same way as less educated
people though.
Adoption of family planning method by a couple is subject to gender basis
in Indian society. Study summaries that when a couple decides to choose a
permanent method or spacing method, wife is more likely adopt. Adoption of
family planning method viewed as a decision making process involving four
stages. In the first step, a couple decides whether to practice family planning or
not. Second step involves deciding between permanent methods and spacing
method as a choice. In the third step, it is decided who among the two (husband
and wife) will adopt family planning method. Finally, it is decided out of the
available methods which one is the most appropriate to be adopted. Male
respondents believe that family planning issue is totally female issue they do not
prefer any type of male contraceptive method, that’s way in this area female
contraceptive user is greater than male contraceptive user, only 24 per cent male
respondents are using contraceptive method (condom user). Male user thought
that spacing method (especially Pill which women prefer most) is not good for
women health also 100 per cent not convinced some risk factor is work at there.
Study suggests that age, education of wife and place of residence are important in
selection of male or female specific methods of family planning. Selection of
appropriate family planning method by a couple involves many factors together.
Findings of the study is important addition to present existing knowledge in this
regard play important role in selection process in all possible ways.
Data also show success of government family planning oriented program.
These program help to increase knowledge related family planning methods or
issues, most of the respondents said that they get knowledge or become aware
Knowledge Attitude and Practices (KAP) Towards Family Planning 23
with the help of government family planning program. Respondents said that
through these programs they became aware toward contraceptive method as
well as their health.
As well as knowledge is increasing implementation of knowledge also
increase. Study shows that as well as knowledge related family planning is
increasing, people behavior willingly or unwillingly towards use of method is
also increasing. Because knowledge will became change in human behavior. On
the basis of several norms Indian society is not open society for example- family
planning issues, sexual behavior, use of contraceptive etc. People having higher
qualification and situated reputed post do not like talk about these issues openly
due to their own norms, some community pressure, religious barriers etc. Less
educated people have great hesitation for consulting doctor on family planning
matter.
6.2 Socio-economic Differentials and Background Characteristics towards
KAP
In India lots of different factor are working behind Knowledge attitude
practice towards family planning method. These factors or background
characteristics is education, age, age of marriage, Residence, Religion, Caste/
tribe, Standard of living, and number of living child etc.
The contraceptive use among currently married women generally
increases with education, there is however, little difference in contraceptive use
between literate women who have and have not completed middle school. In the
case of spacing methods, use also tends to increase with education. Women with
at least a high school education much more use modern spacing methods or
contraceptive method according to illiterate women. On the other hand, as well
as women literacy rate is increasing use of female sterilization declines sharply.
However, Illiterate women have some lower prevalence of sterilization than
literate women. Contraceptive use increased between NFHS-2 and NFHS-3
among women of every educational level. The increasing rate, however, was
much more rapid among illiterate women than literate women between NFHS-2
to NFHS-3.
The higher education levels have greater impact on family size and as well
as rise in education level showed increasing awareness about different
contraceptive methods and go up to use of these contraceptive methods among
women. The outcome of female education mostly in increased age of marriage,
which as a result reduces the pregnancies, or prefer undergo in very late
24 Pramod K. Gupta and Sarita Verma
motherhood, and being more aware of available contraceptive methods helps in
limiting family size. Low rate of child birth not only help the families in
controlling their expenditures also helps women attaining the high level of
health, and education facilities for their own.
The age of women is a very important factor to decide uses of contraceptive
method, percentage of contraceptive users women are varies in different age
group. Ever use of any method and any modern method increases with the
woman’s age 15-17 up to age 35-39 and after age 39-40 decreases subsequently.
At age 35-39 mostly currently married women reported ever use of any
contraceptive method or ever use of a modern method and then decreases for
older women. Age factor has been almost similar in NFHS-2 to NFHS-3. More
than half of women are married before the legal minimum age of 18. Among
women age 20-49, the median age at first marriage is 17.2 years. Earlier married
women have long period of fertility and it is very important that this age group
must follow family planning method. By residence, the pattern of ever use of any
method by age is similar in urban and rural areas, although urban women are
more likely to have used contraception than rural women at every age. The extent
of ever use of female and male sterilization, the rhythm method, and withdrawal
is quite similar for urban and rural women in all age groups.
However, ever use of the pill, IUD, and condom by urban women
percentage exceeds that among rural women. Women below age 25 are more
likely to used modern and traditional spacing methods, where women age 25
and over are more likely to have undergone sterilization. Current use of all
modern methods except male sterilization is higher in urban areas than in rural
areas. The gap for condoms is especially wide in urban area, at their use of
condom is four times more than rural use. Religion wise data shows that the
highest contraceptive prevalence rate is among Janis, followed by
Buddhists/Neo-Buddhists and Sikhs. The contraceptive prevalence among
Hindus is higher than Muslims but lower than most other religions belonging
women. Use of the pill is highest among Muslims and Sikhs, use of the IUD is
highest among Sikhs, and use of condoms is highest among Sikhs and Jains. Male
sterilization is rare for all religious groups except Buddhists/Neo-Buddhists.
Use of female sterilization is lowest among Muslims and highest among
Buddhists/Neo-Buddhists. Since NFHS-1, contraceptive prevalence has
increased for all religious groups, but the largest increases have been for
Buddhists/Neo-Buddhists and Muslims. Use of traditional methods is highest
among Muslim and Christian women. Every religion have some values and
Knowledge Attitude and Practices (KAP) Towards Family Planning 25
followers of that religion have great respect towards it, like Hindu religion accept
that there is a duty to have a family during the householder stage of life, and so
are unlikely to use contraception to avoid having children altogether. As well as
Sikhs have no objection to birth control, Jains views on birth control has been
more willing to allow greater exceptions regarding its use to fit better within
modern society. In Buddhism and Muslims there is no widely recognized policy
on birth control. Traditional and orthodox families are not using contraceptive
method. But gradually traditional belief are changing, NFHS-2 & 3 reports
reveals increasing process in different religions. By caste or tribe, contraceptive
prevalence is highest among women who do not belong to scheduled castes,
scheduled tribes, or other backward classes, followed by women from scheduled
cast and other backward classes. Education level and economic status play
important role behind use of contraceptive prevalence among caste and tribes.
Contraceptive use is lowest among women from scheduled tribes. The
prevalence of female sterilization is highest among women from other backward
classes, but use of modern and traditional spacing methods is highest among
women from ‘other’ castes. By economic status, use of contraceptive method by
the families as is directly linked to economic factors of family. Well earning
family is able to use any method of family planning, and other hand some
families have not enough resource to purchase things so they can’t use these
methods or lower class people can’t purchase good quality of relative things.
7. Concluding Remark
The main objective of this study is to investigate about knowledge,
attitudes and practices towards family planning among Major States of India,
also description about previous and ongoing changes in KAP between NFHS-2
to NFHS-3.
7.1 Knowledge of Family Planning Method
From the above discussion, it may be concluded that though the
knowledge and awareness of Family Planning Methods among major states by
currently married women is so high but only half of the women adopts family
planning. Traditional methods are more common in backward area of major state
like West Bengal and Uttar Pradesh may be due to the lack of the complete
information about the use or effects of the modern methods. Before applying in
practice way it is important to have complete knowledge of related matter, if
verify knowledge about the family planning methods, it’s almost universal in all
major states in selected period of time. Female sterilization is the most widely
26 Pramod K. Gupta and Sarita Verma
known method. The government family planning programme promotes three
temporary methods: the pill, the IUD, and condoms. Of these three methods,
women are most likely to know about the pill (85percnt in NFHS-3) and men are
most likely to know about condoms (93per cent in NFHS-3) Knowledge about
contraceptive method is increasing gradually in all selected states, specific
knowledge like traditional method like rhythm and withdrawal is common
between older age group of women comparatively any modern method is widely
known among young age group women.
7.2 Attitude and Practice about Family Planning Method
The positive attitudes toward contraceptives have a significant association
with use of contraceptives. Unfortunately use of contraceptive method is nearly
half of related knowledge; majority of women is not using any contraceptive
method in all selected states. Users among currently married women use of any
modern contraceptive method greater than use of traditional method women.
Only in Andhra Pradesh and Maharashtra state has near to the national average,
and in these states knowledge of traditional method is decreasing but use of
traditional method increases gradually between NFHS-2 to NFHS-3. The IUD is
retained for a limited duration in rural India where it is used mainly as a spacing
device by lowly motivated young women who discontinue the method at the
slightest feeling of discomfort or abnormality. The most common reason related
to not using modern contraceptives among young women is the fear of side
effects from modern contraceptives. Number of children, age and attitudes is
significantly related to contraceptive use in this study. Women who were using a
contraceptive method may be they had experienced any problem with their
current method. This may be an underestimate of the extent of problems,
however, because women who have experienced problems by pill like users are
weakness/tiredness and headache/body ache/backache. Too much bleeding,
abdominal pain, and headache/body ache/backache are reported as problems
with spacing methods may have stopped using contraception altogether. Some
other regions like-religion, family, partner attitude, age of marriage, education,
residence and economical status etc. played important role in the use of
contraception. Muslim women are less likely to use contraceptives than women
of other religions Hindus and other religious groups. Women from the lowest
wealth quintile and scheduled-tribe women are less likely to use family planning
methods than most of other women. Women in India are more likely to use
contraception if they already have a son.
Knowledge Attitude and Practices (KAP) Towards Family Planning 27
The present study reflects towards the requirement of more awareness
programmes/campaigns etc, which emphasizing on the positive effects of the
use of contraception methods and clearing the misconceptions/doubts
regarding the ill effects of the family planning Knowledge. This study reveals
that education is one of the significant confounding factors to increase the
knowledge and practice of family planning among women in India.
References
Chandrasekhran, S., “How India is tackling her population Problem”, Demography,
5(2), 1968, 620-650.
Das, Monica, The EUs Contribution to Women’s Right and Women’s Inclusion :
Aspects of Democracy Building in South Asia with Special Reference to India,
Sweden : International IDEA, 2010, 32-36.
Government of India, Census of India, 2011, New Delhi, India : Office of the Registrar
General and Census Commissioner.
Ministry of Health and Family Welfare, 2000, Planning Commission, Government of
India.
National Family Health Survey, India, 1992-93, International Institute of Population
Sciences, India.
National Family Health Survey-2, State Report, India, 1998-99. International Institute
of Population Sciences, India.
National Family Health Survey-3, State Report, India, 2005-06. International Institute
of Population Sciences, India.
Srikanthan A, and L. Reid, “Religious and Cultural Influences on Contraception”,
Women’s Health, 30(2), 2008, 129–137. ê
28 Pramod K. Gupta and Sarita Verma
Article Received on January 23, 2015; Accepted on March 01, 2015
3
Plasma Technology in Textile : A Step
towards the Green Environment
Arpita Kothari*
The textile industry is searching for innovative production techniques to improve the
product quality, as well as society requires new finishing techniques working in environmental
respect. Plasma surface treatments show distinct advantages, because they are able to modify the
surface properties of inert materials, sometimes with environment friendly devices. The advantage
of plasma treatments is that the modification turns out to be restricted in the uppermost layers of
the substrate, thus not affecting the overall desirable bulk properties. The present paper is an
attempt to explain plasma technology in textile. Its specific focus is on the plasma, its application,
application techniques and recent undergoing development on the use of plasma physics. It has
been shown that sputtering, etching, chemical functionalization, free-radicals generation and UV
radiation are some of the most important effects conferred by plasma treatments to textiles. Plasma
treatments are increasing their presence in the textile industry for several applications.
[Keywords : Plasma, Atmospheric pressure plasma, Corona Discharge, Textile
Finishing, Hydrophobation]
1. Introduction
The textile industry is searching for innovative production techniques to
improve the product quality, as well as society requires new finishing techniques
working in environmental respect. Plasma surface treatments show distinct
advantages, because they are able to modify the surface properties of inert
materials, sometimes with environment friendly devices. For fabrics, cold
plasma treatments require the development of reliable and large systems. Such
CONTEMPORARY SOCIAL SCIENCES, Vol. 24, Number 1 (January-March), 2015
* Research Scholar, Department of Textile Technology, National Institute of Technology,Jalandhar, Punjab (India) E-mail: <[email protected]>
systems are now existing and the use of plasma physics in industrial problems is
rapidly increasing. On textile surfaces, three main effects can be obtained
depending on the treatment conditions: the cleaning effect, the increase of
microroughness (anti-pilling finishing of wool) and the production of radicals to
obtain hydrophilic surfaces. Plasma polymerisation, that is the deposition of
solid polymeric materials with desired properties on textile substrates, is under
development. The advantage of such plasma treatments is that the modification
turns out to be restricted in the uppermost layers of the substrate, thus not
affecting the overall desirable bulk properties. [7]
Plasma, the 4th state of matter is not so a strange thing, It had been first
developed by M. Faraday in 1880s and plasma concept was first proposed by I.
Langmuir in 1926. In the 1960s, the main industrial applications of (low-pressure)
plasmas have been in the micro-electronic industries. In the1980s their uses
broadened to include many other surface treatments, especially in the fields of
metals and polymers. In 1980s,in the textile field, low-pressure plasma
treatments of a variety of fibrous materials showing very promising results
regarding the improvements in various functional properties in plasma-treated
textiles. In recent times, commercial applicable atmospheric-pressure plasma
processing of textiles is under research.[7]
1.1 What is Plasma?
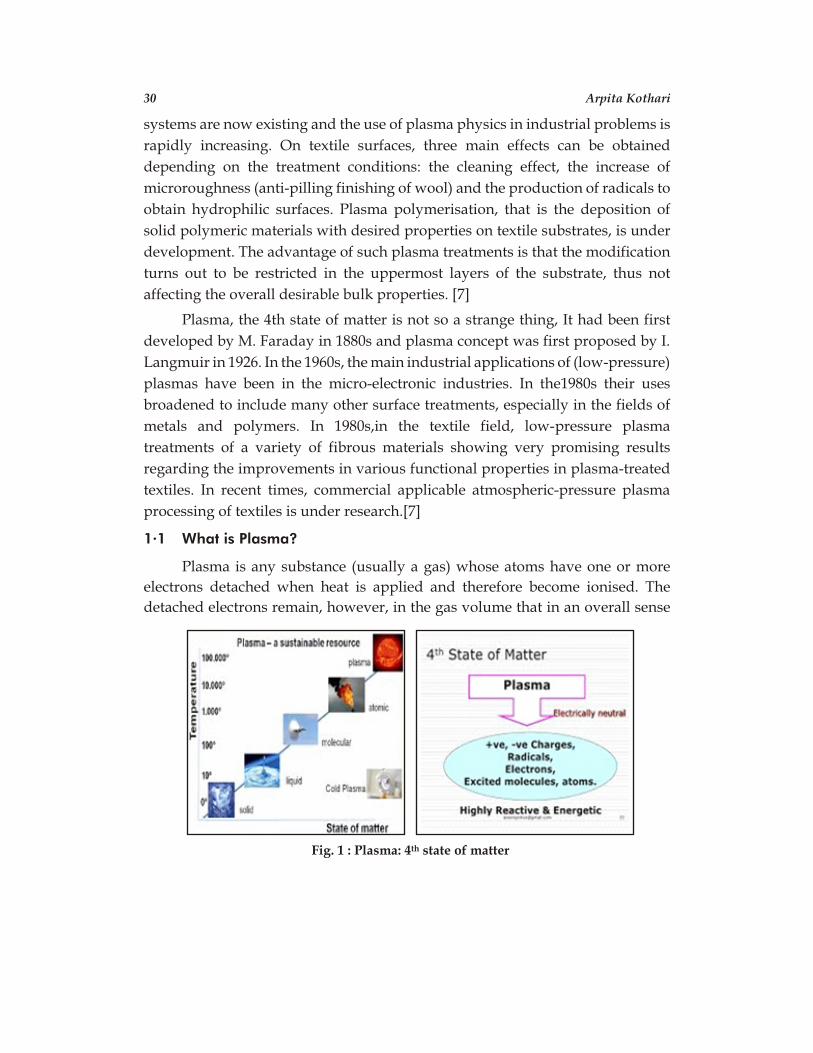
Plasma is any substance (usually a gas) whose atoms have one or more
electrons detached when heat is applied and therefore become ionised. The
detached electrons remain, however, in the gas volume that in an overall sense
30 Arpita Kothari
Fig. 1 : Plasma: 4th state of matter
remains electrically neutral. Thus, any ionised gas that is composed of nearly
equal numbers of negative and positive ions is called plasma.
The conventional wet treatments applied in textile processing for fibre
surface modification and others are associated with many constraints. These
treatments mainly concern with energy, cost and environmental issues.
Application of Plasma technology at low temperature in textile processing can
prove to be the best alternative for these issues. Unlike conventional wet
processes, which penetrate deeply into fibres, plasma only reacts with the fabric
surface that will not affect the internal structure of the fibres. Plasma technology
modify the chemical structure as well as the surface properties of textile
materials, deposit chemical materials (plasma polymerization) to add up
functionality, or remove substances (plasma etching) from the textile materials
for better applicability. The functional properties of the fabric can be modified by
Nano scale etching of surface by plasma gas particles. In textile processing, this
technology can be explored in various areas like pre-treatment, dyeing and
finishing through different methodology vis-à-vis Glow-discharge method,
Corona discharge method and Dielectric barrier discharge method to add
functionality and modification of surface properties of textile materials. Plasma
technology is applicable to most of textile materials for surface treatment and is
beneficial over the conventional process, since it do not alter the inherent
properties of the textile materials, It is dry textile treatment processing without
any expenses on effluent treatment, It is a green process and it is simple process.
This technology can generate more novel products to satisfy customer’s need and
requirement.
1.2 Gases commonly used for Plasma Treatments
u Chemically inert (e.g. helium and argon).
u Reactive and non-polymerisable (e.g. ammonia, air, and nitrogen).
u Reactive and polymerisable (e.g. tetra fluoroethylene, hexamethyl
disiloxane).
1.3 Principle of Plasma Processing
Plasma technology is a surface-sensitive method that allows selective
modification in the nm-range. If a textile to be functionalized is placed in a
reaction chamber with any gas and the plasma is then ignited, the generated
particles interact with the surface of the textile. In this way the surface is
specifically structured, chemically functionalized or even coated with nm-thin
film depending on the type of gas.
Plasma Technology in Textile 31
1.4 Types of Plasma
Different plasma based on different things are shown in table 1.[6]
Table 1 : Types of Plasma
On the basis of pressure Low pressure(0.01kpa)
Atmospheric pressure(100 kpa)
On basis of the temperature of electrons
and ions
Hot plasma(above 10000 degree)
Cold plasma(below 100 degree)
On basis of frequency of power supply Low frequency(40kHz)
Radio frequency(13.56MHz)
Microwave frequency(2.56GHz)
2. Plasma Technologies
2.1 Low Pressure Cold Plasma Technology
Low-pressure cold plasma technology is also referred to as vacuum plasma
technology. This technology has its origin in the processing of semiconductor
materials and printed circuit boards (PCB). Soon after its introduction in the
electronics industry, the path to incorporation into the textile and non-woven
sectors has been and remains troublesome.
The plasma state of a gas–also considered as the fourth aggregation state of
matter – can be reached if the gas is under sufficiently low-pressure and when
electromagnetic energy is provided to the gas volume. Under those
circumstances, the process gas will be partially decomposed into radicals and
atoms and will also be partially ionised. Depending on the frequency of the
electromagnetic energy, the pressure range in which equilibrium with a high
density of charged particles is reached might be different. For the radio frequency
range (typically 40 kHz or 13.56 MHz), normally the working gas pressure is kept
in the lower 0.1 mbar range, whereas for microwave sources, a working pressure
between 0.5 and 1 mbar is often used. In order to effect the plasma treatment in
sufficiently pure process gas conditions, a base pressure in the lower 0.01 mbar
needs to be reached. This can be done with two-stage roughing vacuum pumps
(rotary vane type) or with a dry pump or with a combination of either of those
pumps with a roots blower.
Plasma can bring several effects to substrates, depending on the plasma
mode and the process gases used. There are five major effects fine cleaning,
surface activation, etching, cross-linking and coating deposition.
32 Arpita Kothari
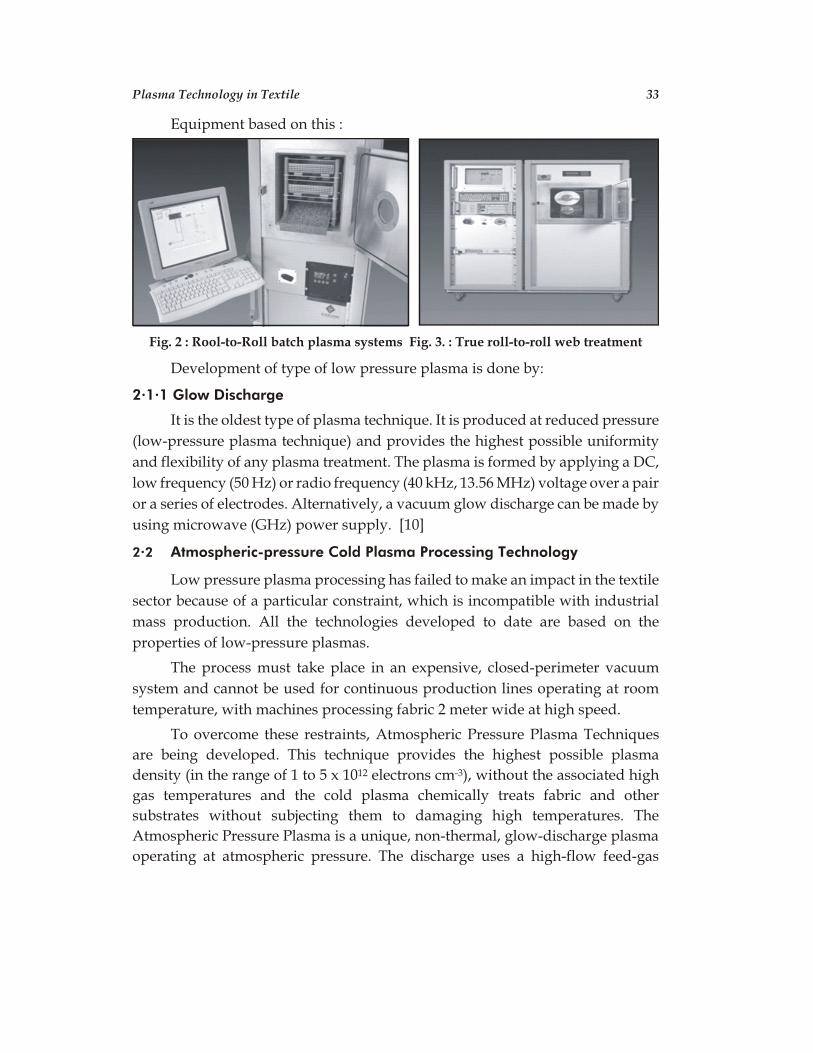
Equipment based on this :
Development of type of low pressure plasma is done by:
2.1.1 Glow Discharge
It is the oldest type of plasma technique. It is produced at reduced pressure
(low-pressure plasma technique) and provides the highest possible uniformity
and flexibility of any plasma treatment. The plasma is formed by applying a DC,
low frequency (50 Hz) or radio frequency (40 kHz, 13.56 MHz) voltage over a pair
or a series of electrodes. Alternatively, a vacuum glow discharge can be made by
using microwave (GHz) power supply. [10]
2.2 Atmospheric-pressure Cold Plasma Processing Technology
Low pressure plasma processing has failed to make an impact in the textile
sector because of a particular constraint, which is incompatible with industrial
mass production. All the technologies developed to date are based on the
properties of low-pressure plasmas.
The process must take place in an expensive, closed-perimeter vacuum
system and cannot be used for continuous production lines operating at room
temperature, with machines processing fabric 2 meter wide at high speed.
To overcome these restraints, Atmospheric Pressure Plasma Techniques
are being developed. This technique provides the highest possible plasma
density (in the range of 1 to 5 x 10¹² electrons cm-3), without the associated high
gas temperatures and the cold plasma chemically treats fabric and other
substrates without subjecting them to damaging high temperatures. The
Atmospheric Pressure Plasma is a unique, non-thermal, glow-discharge plasma
operating at atmospheric pressure. The discharge uses a high-flow feed-gas
Plasma Technology in Textile 33
Fig. 2 : Rool-to-Roll batch plasma systems Fig. 3. : True roll-to-roll web treatment
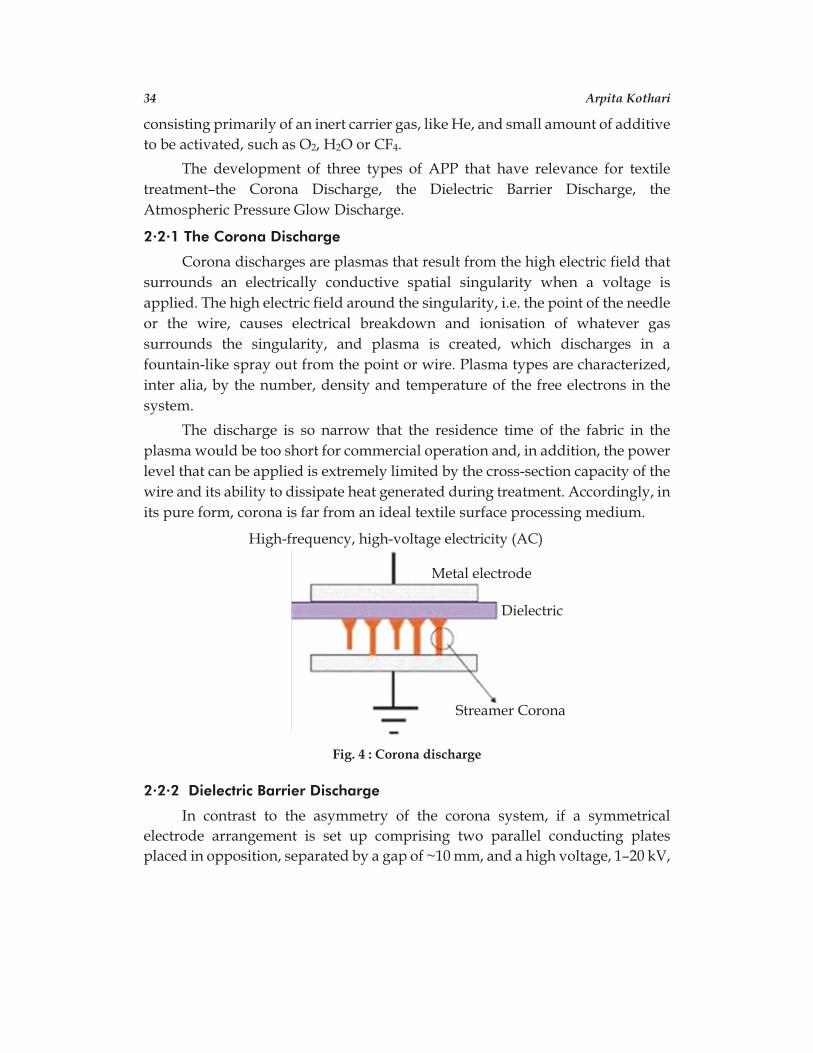
consisting primarily of an inert carrier gas, like He, and small amount of additive
to be activated, such as O2, H2O or CF4.
The development of three types of APP that have relevance for textile
treatment–the Corona Discharge, the Dielectric Barrier Discharge, the
Atmospheric Pressure Glow Discharge.
2.2.1 The Corona Discharge
Corona discharges are plasmas that result from the high electric field that
surrounds an electrically conductive spatial singularity when a voltage is
applied. The high electric field around the singularity, i.e. the point of the needle
or the wire, causes electrical breakdown and ionisation of whatever gas
surrounds the singularity, and plasma is created, which discharges in a
fountain-like spray out from the point or wire. Plasma types are characterized,
inter alia, by the number, density and temperature of the free electrons in the
system.
The discharge is so narrow that the residence time of the fabric in the
plasma would be too short for commercial operation and, in addition, the power
level that can be applied is extremely limited by the cross-section capacity of the
wire and its ability to dissipate heat generated during treatment. Accordingly, in
its pure form, corona is far from an ideal textile surface processing medium.
2.2.2 Dielectric Barrier Discharge
In contrast to the asymmetry of the corona system, if a symmetrical
electrode arrangement is set up comprising two parallel conducting plates
placed in opposition, separated by a gap of ~10 mm, and a high voltage, 1–20 kV,
34 Arpita Kothari
High-frequency, high-voltage electricity (AC)
Metal electrode
Dielectric
Streamer Corona
Fig. 4 : Corona discharge
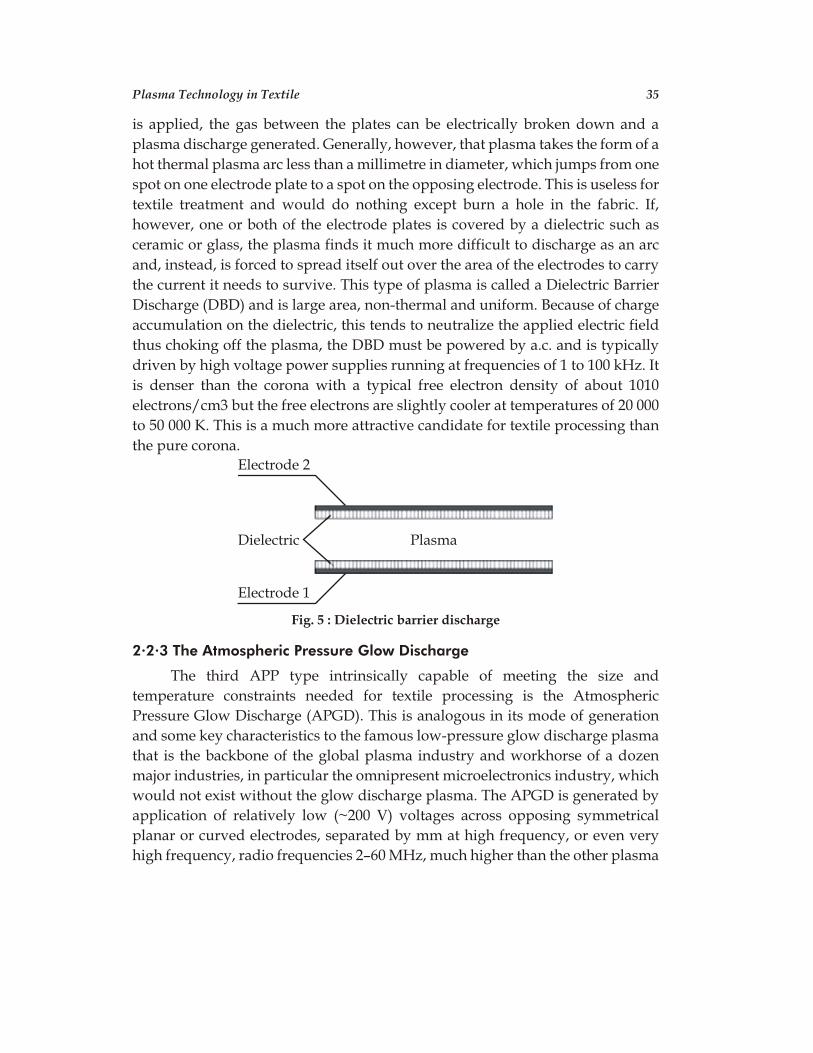
is applied, the gas between the plates can be electrically broken down and a
plasma discharge generated. Generally, however, that plasma takes the form of a
hot thermal plasma arc less than a millimetre in diameter, which jumps from one
spot on one electrode plate to a spot on the opposing electrode. This is useless for
textile treatment and would do nothing except burn a hole in the fabric. If,
however, one or both of the electrode plates is covered by a dielectric such as
ceramic or glass, the plasma finds it much more difficult to discharge as an arc
and, instead, is forced to spread itself out over the area of the electrodes to carry
the current it needs to survive. This type of plasma is called a Dielectric Barrier
Discharge (DBD) and is large area, non-thermal and uniform. Because of charge
accumulation on the dielectric, this tends to neutralize the applied electric field
thus choking off the plasma, the DBD must be powered by a.c. and is typically
driven by high voltage power supplies running at frequencies of 1 to 100 kHz. It
is denser than the corona with a typical free electron density of about 1010
electrons/cm3 but the free electrons are slightly cooler at temperatures of 20 000
to 50 000 K. This is a much more attractive candidate for textile processing than
the pure corona.
2.2.3 The Atmospheric Pressure Glow Discharge
The third APP type intrinsically capable of meeting the size and
temperature constraints needed for textile processing is the Atmospheric
Pressure Glow Discharge (APGD). This is analogous in its mode of generation
and some key characteristics to the famous low-pressure glow discharge plasma
that is the backbone of the global plasma industry and workhorse of a dozen
major industries, in particular the omnipresent microelectronics industry, which
would not exist without the glow discharge plasma. The APGD is generated by
application of relatively low (~200 V) voltages across opposing symmetrical
planar or curved electrodes, separated by mm at high frequency, or even very
high frequency, radio frequencies 2–60 MHz, much higher than the other plasma
Plasma Technology in Textile 35
Electrode 2
Electrode 1
Dielectric Plasma
Fig. 5 : Dielectric barrier discharge
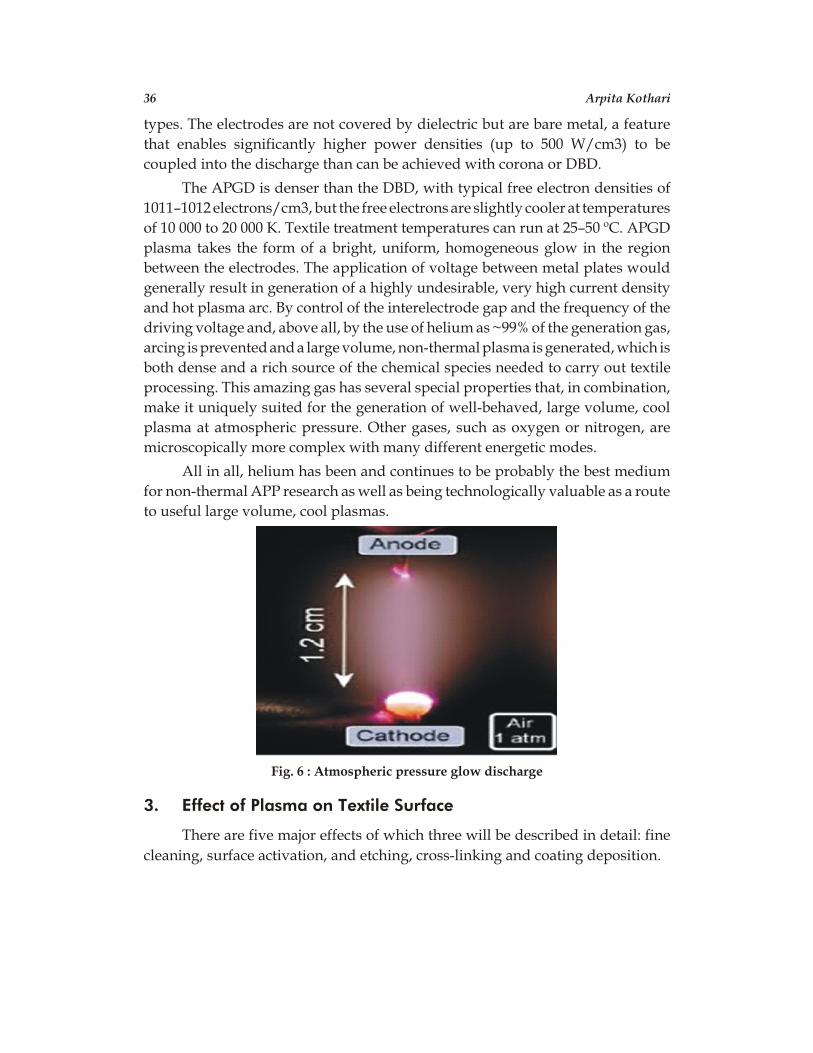
types. The electrodes are not covered by dielectric but are bare metal, a feature
that enables significantly higher power densities (up to 500 W/cm3) to be
coupled into the discharge than can be achieved with corona or DBD.
The APGD is denser than the DBD, with typical free electron densities of
1011–1012 electrons/cm3, but the free electrons are slightly cooler at temperatures
of 10 000 to 20 000 K. Textile treatment temperatures can run at 25–50 ºC. APGD
plasma takes the form of a bright, uniform, homogeneous glow in the region
between the electrodes. The application of voltage between metal plates would
generally result in generation of a highly undesirable, very high current density
and hot plasma arc. By control of the interelectrode gap and the frequency of the
driving voltage and, above all, by the use of helium as ~99% of the generation gas,
arcing is prevented and a large volume, non-thermal plasma is generated, which is
both dense and a rich source of the chemical species needed to carry out textile
processing. This amazing gas has several special properties that, in combination,
make it uniquely suited for the generation of well-behaved, large volume, cool
plasma at atmospheric pressure. Other gases, such as oxygen or nitrogen, are
microscopically more complex with many different energetic modes.
All in all, helium has been and continues to be probably the best medium
for non-thermal APP research as well as being technologically valuable as a route
to useful large volume, cool plasmas.
3. Effect of Plasma on Textile Surface
There are five major effects of which three will be described in detail: fine
cleaning, surface activation, and etching, cross-linking and coating deposition.
36 Arpita Kothari
Fig. 6 : Atmospheric pressure glow discharge
3.1 Surface Activation by Plasma
Surface activation by plasma is also referred to as chemical grafting
(Terlingen, 1993). It never occurs alone, but always occurs during/after plasma
cleaning. Indeed, in the case of a substrate subjected to a soft secondary plasma
which contains reactive species (e.g. oxygen atoms), the effect of those atoms will
be twofold: they will react with organic contamination which is present on the
substrate surface. Such organic contamination consists, in many cases, of loosely
bound hydrocarbons. Both H and C will react with oxygen and will leave the
substrate surface in the form of volatile H2O and CO2. Once the surface
molecules of a polymer are freed from contamination, they can react with the
oxygen atoms which will form carbonyl-, carboxyl- or hydroxyl functional
groups on the substrate surface. It is said that the polymer surface has been
chemically functionalised.
The effect of grafting carbonyl-groups onto a surface of PP, polyethylene
(PE), or polyesters such as polyethyleneterephthalate (PET) or polybuty-
leneterephthalate (PBT) gives rise to an increase in surface energy to levels higher
than 68 mN/m immediately after the plasma treatment. This effect is, however,
not permanent: it has a certain shelf-life. Once the substrate has been removed
from the plasma, and depending on the storage conditions, oxygen atoms will be
released again from the surface molecules. This will happen slowly over time.
After several days or even several months, the original surface energy of the
substrate will have returned. The rate at which this happens depends on the type
of substrate: e.g. PP has a fairly good shelf-life of a couple of weeks, whereas
silicones show a shelf-life of less than one day. It further depends on the plasma
conditions: an intensive plasma treatment will create a higher surface density of
functional groups and, as such, the shelf-life will be longer.
Plasma activation is being used in several fabric and nonwoven
applications in the textile industry:
u Fabrics for automotive and medical applications
u Pre-treatment before dyeing
u Activation of transportation textile before application of flame-retardant
chemistry
3.2 Etching by Plasma
In order to perform an efficient etching process, a direct plasma is normally
needed. In such a configuration, the substrate is bombarded with charged
Plasma Technology in Textile 37
particles (ions and electrons) and apart from a purely chemical effect; the
substrate is subjected also to a physical sputtering effect. In the case of textiles
and non-wovens, this effect of plasma treatment is not often used.
However, there is a certain potential even for fabrics. The textile market is
trying to make deep, dark colours and this is not easy to achieve. One way to do
this is to reduce the specular component of reflection of the fabric surface after
dyeing. A plasma etching leads to a controlled Nano- or micro-roughness,
increasing diffuse reflectance and minimizing the specular component. In
consequence, the dyed fabric will have an intenser darker colour after plasma
etching.
Etching requires the removal of several hundreds of nanometres and
etching processes are therefore slow. Needless to say, this technique is only
viable for very high-end textiles.
3.3 Thin Film Deposition by Plasma Polymerisation
A very important usage of low-pressure vacuum plasma technology is thin
film coating deposition by plasma polymerisation. In this specific case, reactive
precursor gases that can polymerise are being used as process gases (Yasuda,
1976). The precursor gases are broken into radicals that react with each other on
the substrate surface. The nature of the precursor gases will very much determine
the properties of the deposited coating. Coating thickness is normally in the
10–50 nm range (5–30 molecular layers).
The very first applications of plasma polymerisation were found in the
medical device industry. There are many industrial applications of thin film
deposition by plasma polymerisation in the technical textile and nonwoven
industry. Roughly, the coatings deposited in those industries can be categorised
under either (permanently) hydrophilic coatings or hydrophobic/oleo phobic
coatings. In most cases, the deposited coatings give rise to unique products that
are difficult or even impossible to produce using other technologies.
Application of deposition by plasma on textile:
u Hydrophobation of non-wovens for filtration applications
u Hydrophilic coatings on non-woven PP for battery separators
4. Application of Plasma Technology in Textile
Due to high restriction in the control of chemical processing of textile
materials, the new and innovative textile treatments are demanded. In this
38 Arpita Kothari
regard, plasma technology shows distinct merits due to its environmental
friendly and better treatment results.
Various eras where this technology can be explored includes pre-
treatments, other wet processes of textiles, technical textile and non-woven.
Plasma can modify the surface properties of textile materials, deposit chemical
materials (Plasma polymerisation) to add up functionality, or remove substances
(plasma etching) from the textile materials and used to produce innovative
functional textiles.
4.1 Desizing of Cotton Fabric
Plasma technology can be used to remove PVA sizing material from cotton
fibres. In conventional desizing process we use chemicals and hot water to
remove size. But desizing with plasma technology we can use either O2/He
plasma or Air/He plasma. Firstly the treatment breaks down the chains of PVA
making them smaller and more soluble. X-ray photoelectron microscopy results
reveal that plasma treatment introduces oxygen and nitrogen groups on the
surface of PVA which owing to greater polarity increase the solubility of PVA.
Of the two gas mixtures that were studied, the results also indicate that
O2/He plasma has a greater effect on PVA surface chemical changes than
Air/He plasma.
4.2 Dyeing
Several studies have shown that dye ability or printability of textiles can be
markedly improved by plasma treatments. This effect can be obtained on both
synthetic and natural fibres. Capillarity improvement, enhancement of surface
area, reduction of external crystallinity, creation of reactive sites on the fibres and
many other actions can contribute to the final effect depending on the operative
conditions. Also production of colours on fibres exploiting diffraction effects has
been attempted.
4.2.1 Dyeability of Natural Fibres
It has been reported that plasma treatment on cotton in presence of air or
argon gas increases its water absorbency which in turn increase both the rate of
dyeing and the direct dye uptake in the absence of electrolyte in the dye bath.
The contributory factors leading to this increase in dye uptake can be: i.
The change of the fabric surface area per unit volume due to the surface erosion.
ii. The etching effect of the plasma effect on the fibred mages the fiber surface and
Plasma Technology in Textile 39
also removes surface fiber impurities (e.g. cotton wax or any remaining warp
size, etc.). iii. The chemical changes in the cotton fiber surface (leading to
carbonyl and carboxyl groups in the fiber. iv. The possibility of the formation of
free radicals on the cellulosic chains of cotton. v. Thus the action of oxygen and
air plasma treatments modifies the surface properties of cotton and leads to an
increase in the rate and extent of uptake of direct dye.
The dye exhaustion rate of plasma treated wool has been shown to increase
by nearly 50%. It has been shown that O2 plasma treatment increases the
wetability of wool fabric thus leading to a dramatic increase in its wicking
properties. Also the disulphide linkages in the exocuticle layer oxidize to form
sulphonate groups (which are act as active sites for reactive dyes) which also add
to the wetability. The etching of the hydrophobic epicuticle and increase in
surface area also contributes towards the improvement in the ability of the fibers
to wet more easily.
4.2.2 Dyeability of Synthetic Fibres
In the synthetic fibres, plasma causes etching of the fibre and the
introduction of polar groups leading to improvement in dyeability. This has been
evaluated through in situ polymerization of acrylic acid in case of polyester,
polyamide and polypropylene fabrics. Plasma-induced surface modification of
microdenier polyester produces cationic dyeable polyester fiber. The researchers
believe that this technique can lead to a continuous flow system, low energy
consumption, and more environmentally friendly consumption, low
temperature dyeing technology on polyester substrates.
Polyamide (nylon6) fabrics have been treated with tetrafluoromethane low
temperature plasma and then dyed with commercially available acid and
dispersed dyes. Dyeing results showed that the plasma treatment slows down
the rate of exhaustion but does not reduce the amount of absorption of acid dyes.
The dyeing properties of disperse dyes on plasma treated nylon fabric charged
markedly when compared with untreated fabric. A slight improvement in
colorfastness was seen with the treated sample.
4.3 Textile Finishing
Unlike wet finishing processes, which penetrate deep into the fibres,
plasma treatment is restricted to surface reaction and limited to a surface layer of
around 100 Ao. Because of this various functionality and properties can be
imparted to both natural fibres and polymers, as well as to non-woven fabrics,
without having any adverse effect on their internal structures.
40 Arpita Kothari
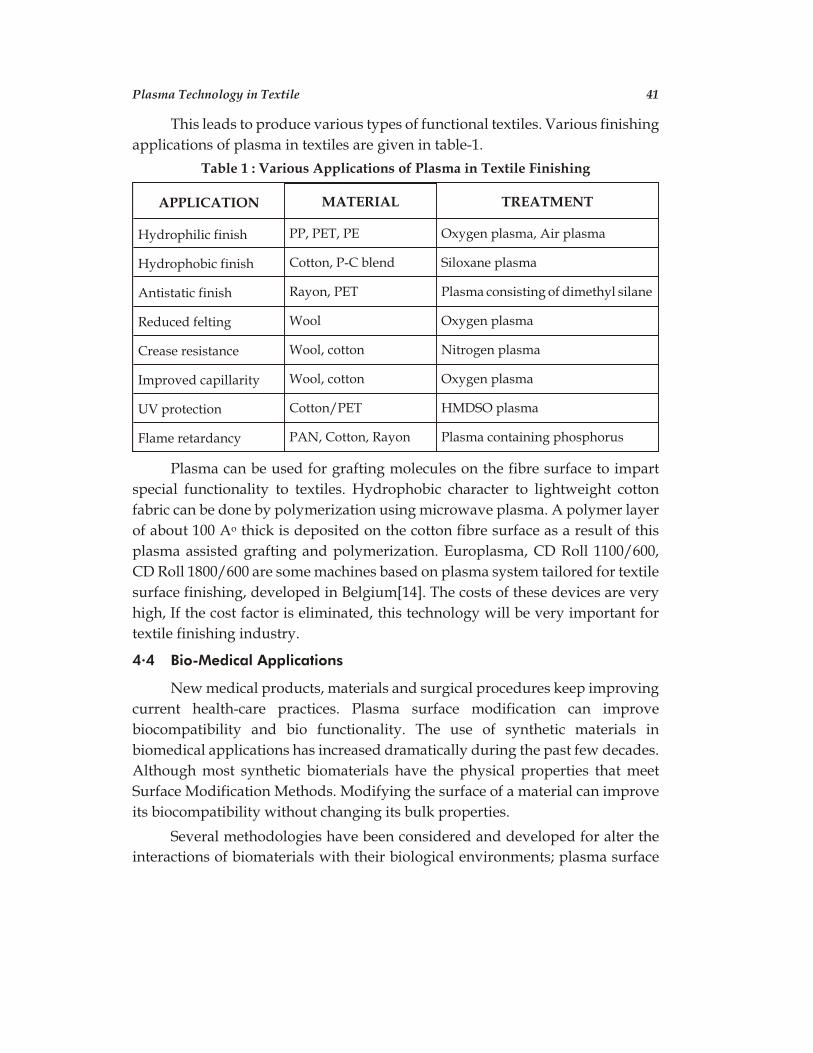
This leads to produce various types of functional textiles. Various finishing
applications of plasma in textiles are given in table-1.
Table 1 : Various Applications of Plasma in Textile Finishing
APPLICATION MATERIAL TREATMENT
Hydrophilic finish PP, PET, PE Oxygen plasma, Air plasma
Hydrophobic finish Cotton, P-C blend Siloxane plasma
Antistatic finish Rayon, PET Plasma consisting of dimethyl silane
Reduced felting Wool Oxygen plasma
Crease resistance Wool, cotton Nitrogen plasma
Improved capillarity Wool, cotton Oxygen plasma
UV protection Cotton/PET HMDSO plasma
Flame retardancy PAN, Cotton, Rayon Plasma containing phosphorus
Plasma can be used for grafting molecules on the fibre surface to impart
special functionality to textiles. Hydrophobic character to lightweight cotton
fabric can be done by polymerization using microwave plasma. A polymer layer
of about 100 Ao thick is deposited on the cotton fibre surface as a result of this
plasma assisted grafting and polymerization. Europlasma, CD Roll 1100/600,
CD Roll 1800/600 are some machines based on plasma system tailored for textile
surface finishing, developed in Belgium[14]. The costs of these devices are very
high, If the cost factor is eliminated, this technology will be very important for
textile finishing industry.
4.4 Bio-Medical Applications
New medical products, materials and surgical procedures keep improving
current health-care practices. Plasma surface modification can improve
biocompatibility and bio functionality. The use of synthetic materials in
biomedical applications has increased dramatically during the past few decades.
Although most synthetic biomaterials have the physical properties that meet
Surface Modification Methods. Modifying the surface of a material can improve
its biocompatibility without changing its bulk properties.
Several methodologies have been considered and developed for alter the
interactions of biomaterials with their biological environments; plasma surface
Plasma Technology in Textile 41
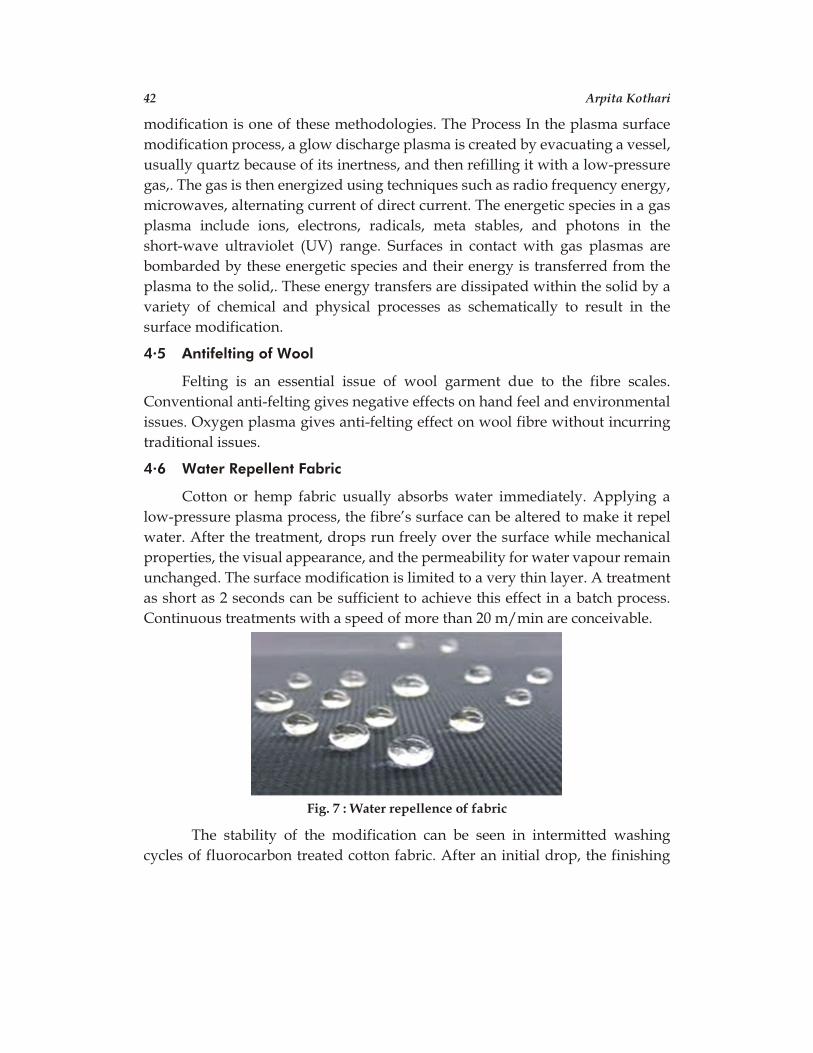
modification is one of these methodologies. The Process In the plasma surface
modification process, a glow discharge plasma is created by evacuating a vessel,
usually quartz because of its inertness, and then refilling it with a low-pressure
gas,. The gas is then energized using techniques such as radio frequency energy,
microwaves, alternating current of direct current. The energetic species in a gas
plasma include ions, electrons, radicals, meta stables, and photons in the
short-wave ultraviolet (UV) range. Surfaces in contact with gas plasmas are
bombarded by these energetic species and their energy is transferred from the
plasma to the solid,. These energy transfers are dissipated within the solid by a
variety of chemical and physical processes as schematically to result in the
surface modification.
4.5 Antifelting of Wool
Felting is an essential issue of wool garment due to the fibre scales.
Conventional anti-felting gives negative effects on hand feel and environmental
issues. Oxygen plasma gives anti-felting effect on wool fibre without incurring
traditional issues.
4.6 Water Repellent Fabric
Cotton or hemp fabric usually absorbs water immediately. Applying a
low-pressure plasma process, the fibre’s surface can be altered to make it repel
water. After the treatment, drops run freely over the surface while mechanical
properties, the visual appearance, and the permeability for water vapour remain
unchanged. The surface modification is limited to a very thin layer. A treatment
as short as 2 seconds can be sufficient to achieve this effect in a batch process.
Continuous treatments with a speed of more than 20 m/min are conceivable.
The stability of the modification can be seen in intermitted washing
cycles of fluorocarbon treated cotton fabric. After an initial drop, the finishing
42 Arpita Kothari
Fig. 7 : Water repellence of fabric
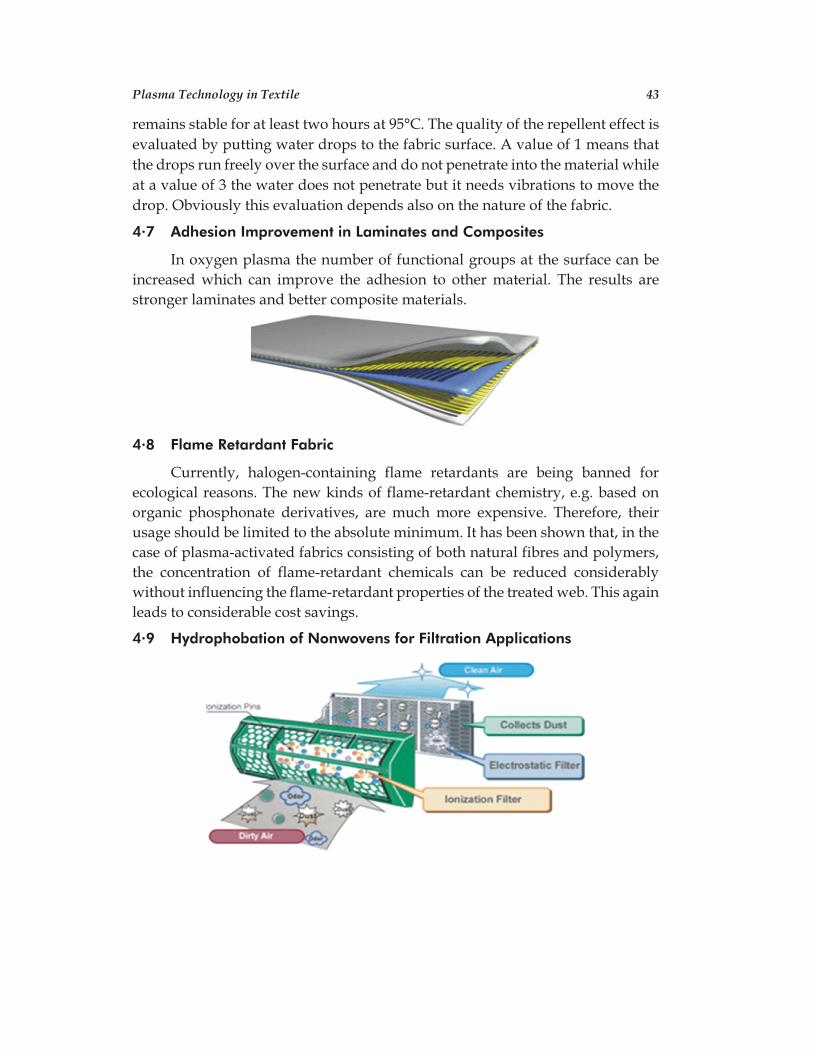
remains stable for at least two hours at 95°C. The quality of the repellent effect is
evaluated by putting water drops to the fabric surface. A value of 1 means that
the drops run freely over the surface and do not penetrate into the material while
at a value of 3 the water does not penetrate but it needs vibrations to move the
drop. Obviously this evaluation depends also on the nature of the fabric.
4.7 Adhesion Improvement in Laminates and Composites
In oxygen plasma the number of functional groups at the surface can be
increased which can improve the adhesion to other material. The results are
stronger laminates and better composite materials.
4.8 Flame Retardant Fabric
Currently, halogen-containing flame retardants are being banned for
ecological reasons. The new kinds of flame-retardant chemistry, e.g. based on
organic phosphonate derivatives, are much more expensive. Therefore, their
usage should be limited to the absolute minimum. It has been shown that, in the
case of plasma-activated fabrics consisting of both natural fibres and polymers,
the concentration of flame-retardant chemicals can be reduced considerably
without influencing the flame-retardant properties of the treated web. This again
leads to considerable cost savings.
4.9 Hydrophobation of Nonwovens for Filtration Applications
Plasma Technology in Textile 43
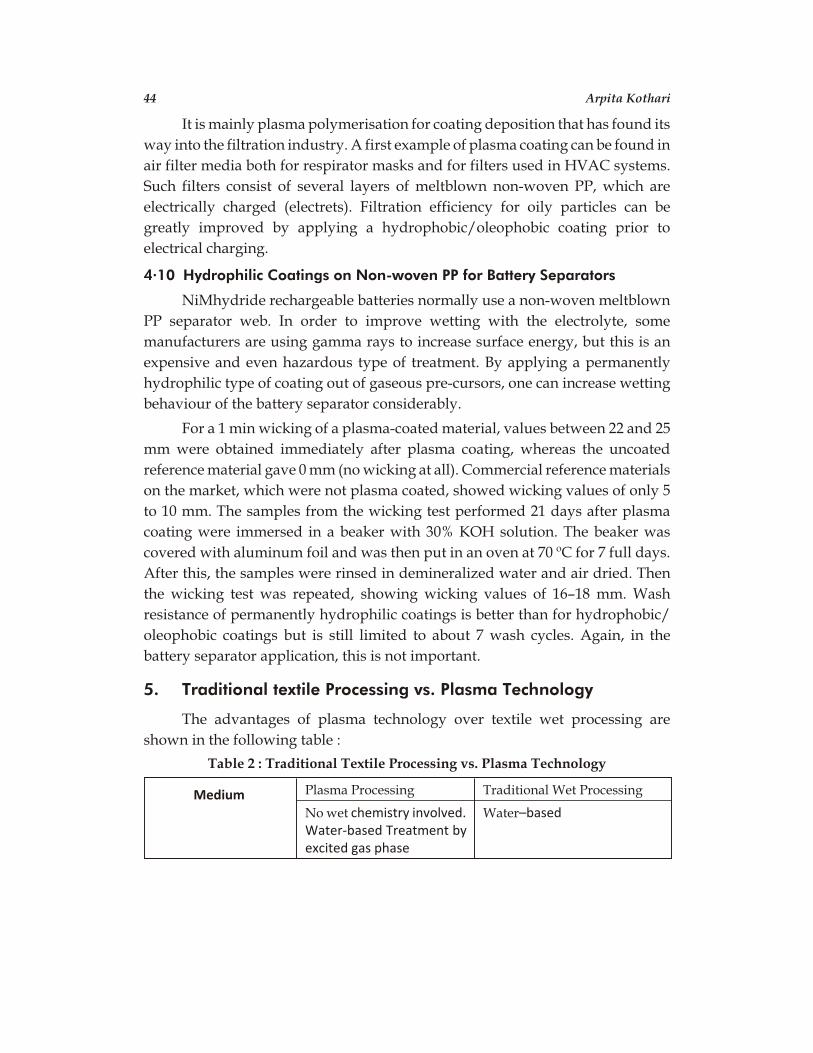
It is mainly plasma polymerisation for coating deposition that has found its
way into the filtration industry. A first example of plasma coating can be found in
air filter media both for respirator masks and for filters used in HVAC systems.
Such filters consist of several layers of meltblown non-woven PP, which are
electrically charged (electrets). Filtration efficiency for oily particles can be
greatly improved by applying a hydrophobic/oleophobic coating prior to
electrical charging.
4.10 Hydrophilic Coatings on Non-woven PP for Battery Separators
NiMhydride rechargeable batteries normally use a non-woven meltblown
PP separator web. In order to improve wetting with the electrolyte, some
manufacturers are using gamma rays to increase surface energy, but this is an
expensive and even hazardous type of treatment. By applying a permanently
hydrophilic type of coating out of gaseous pre-cursors, one can increase wetting
behaviour of the battery separator considerably.
For a 1 min wicking of a plasma-coated material, values between 22 and 25
mm were obtained immediately after plasma coating, whereas the uncoated
reference material gave 0 mm (no wicking at all). Commercial reference materials
on the market, which were not plasma coated, showed wicking values of only 5
to 10 mm. The samples from the wicking test performed 21 days after plasma
coating were immersed in a beaker with 30% KOH solution. The beaker was
covered with aluminum foil and was then put in an oven at 70 ºC for 7 full days.
After this, the samples were rinsed in demineralized water and air dried. Then
the wicking test was repeated, showing wicking values of 16–18 mm. Wash
resistance of permanently hydrophilic coatings is better than for hydrophobic/
oleophobic coatings but is still limited to about 7 wash cycles. Again, in the
battery separator application, this is not important.
5. Traditional textile Processing vs. Plasma Technology
The advantages of plasma technology over textile wet processing are
shown in the following table :
Table 2 : Traditional Textile Processing vs. Plasma Technology
Medium Plasma Processing Traditional Wet Processing
No wet chemistry involved. Water-based Treatment byexcited gas phase
Water–based
44 Arpita Kothari
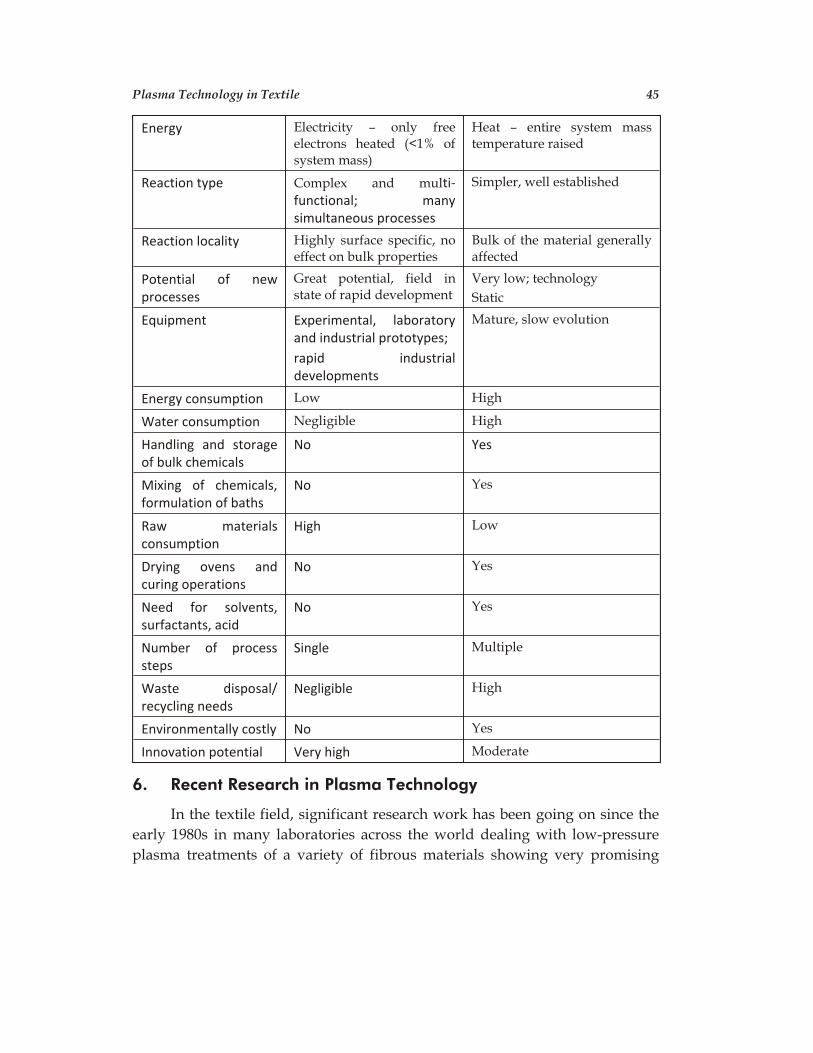
Energy Electricity – only freeelectrons heated (<1% ofsystem mass)
Heat – entire system masstemperature raised
Reaction type Complex and multi-functional; manysimultaneous processes
Simpler, well established
Reaction locality Highly surface specific, noeffect on bulk properties
Bulk of the material generallyaffected
Potential of newprocesses
Great potential, field instate of rapid development
Very low; technology
Static
Equipment Experimental, laboratoryand industrial prototypes;
rapid industrialdevelopments
Mature, slow evolution
Energy consumption Low High
Water consumption Negligible High
Handling and storageof bulk chemicals
No Yes
Mixing of chemicals,formulation of baths
No Yes
Raw materialsconsumption
High Low
Drying ovens andcuring operations
No Yes
Need for solvents,surfactants, acid
No Yes
Number of processsteps
Single Multiple
Waste disposal/recycling needs
Negligible High
Environmentally costly No Yes
Innovation potential Very high Moderate
6. Recent Research in Plasma Technology
In the textile field, significant research work has been going on since the
early 1980s in many laboratories across the world dealing with low-pressure
plasma treatments of a variety of fibrous materials showing very promising
Plasma Technology in Textile 45
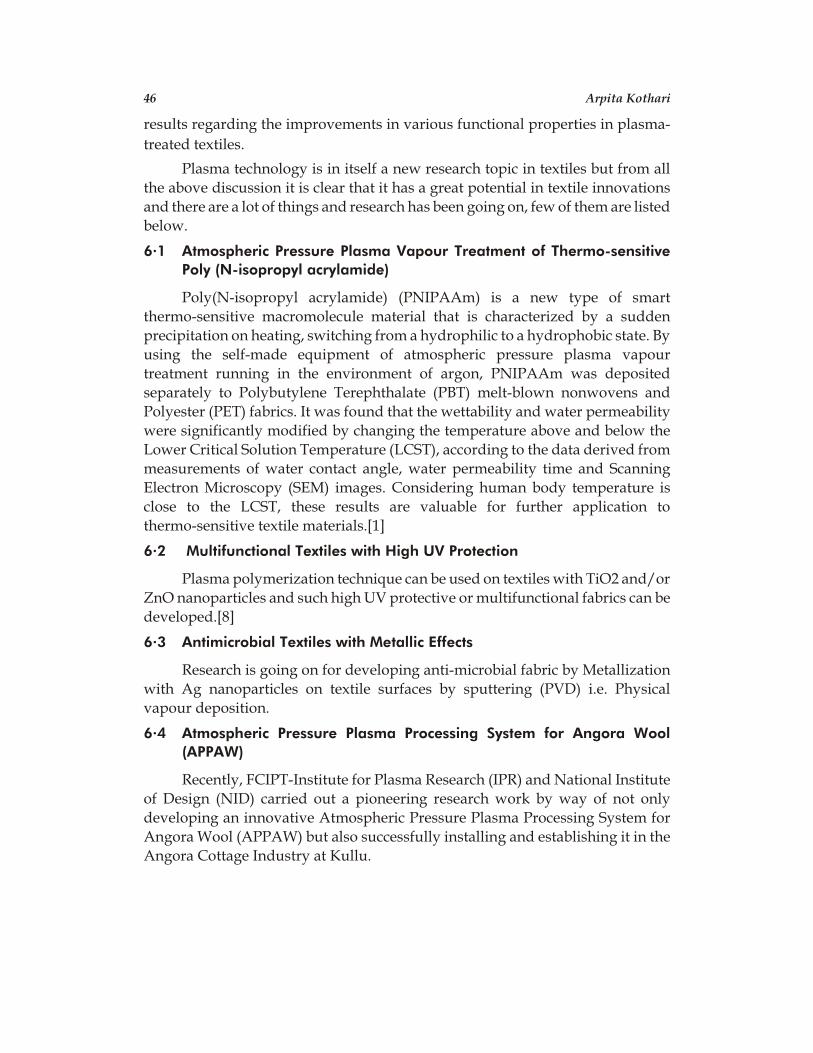
results regarding the improvements in various functional properties in plasma-
treated textiles.
Plasma technology is in itself a new research topic in textiles but from all
the above discussion it is clear that it has a great potential in textile innovations
and there are a lot of things and research has been going on, few of them are listed
below.
6.1 Atmospheric Pressure Plasma Vapour Treatment of Thermo-sensitive
Poly (N-isopropyl acrylamide)
Poly(N-isopropyl acrylamide) (PNIPAAm) is a new type of smart
thermo-sensitive macromolecule material that is characterized by a sudden
precipitation on heating, switching from a hydrophilic to a hydrophobic state. By
using the self-made equipment of atmospheric pressure plasma vapour
treatment running in the environment of argon, PNIPAAm was deposited
separately to Polybutylene Terephthalate (PBT) melt-blown nonwovens and
Polyester (PET) fabrics. It was found that the wettability and water permeability
were significantly modified by changing the temperature above and below the
Lower Critical Solution Temperature (LCST), according to the data derived from
measurements of water contact angle, water permeability time and Scanning
Electron Microscopy (SEM) images. Considering human body temperature is
close to the LCST, these results are valuable for further application to
thermo-sensitive textile materials.[1]
6.2 Multifunctional Textiles with High UV Protection
Plasma polymerization technique can be used on textiles with TiO2 and/or
ZnO nanoparticles and such high UV protective or multifunctional fabrics can be
developed.[8]
6.3 Antimicrobial Textiles with Metallic Effects
Research is going on for developing anti-microbial fabric by Metallization
with Ag nanoparticles on textile surfaces by sputtering (PVD) i.e. Physical
vapour deposition.
6.4 Atmospheric Pressure Plasma Processing System for Angora Wool
(APPAW)
Recently, FCIPT-Institute for Plasma Research (IPR) and National Institute
of Design (NID) carried out a pioneering research work by way of not only
developing an innovative Atmospheric Pressure Plasma Processing System for
Angora Wool (APPAW) but also successfully installing and establishing it in the
Angora Cottage Industry at Kullu.
46 Arpita Kothari
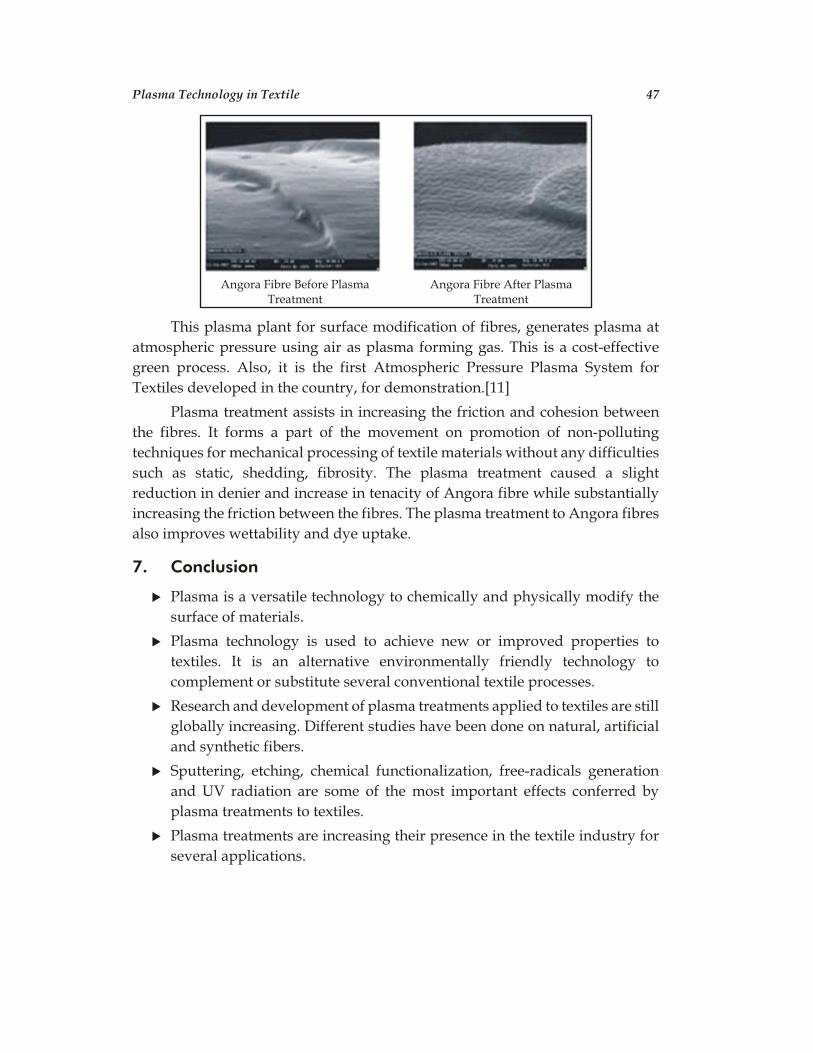
This plasma plant for surface modification of fibres, generates plasma at
atmospheric pressure using air as plasma forming gas. This is a cost-effective
green process. Also, it is the first Atmospheric Pressure Plasma System for
Textiles developed in the country, for demonstration.[11]
Plasma treatment assists in increasing the friction and cohesion between
the fibres. It forms a part of the movement on promotion of non-polluting
techniques for mechanical processing of textile materials without any difficulties
such as static, shedding, fibrosity. The plasma treatment caused a slight
reduction in denier and increase in tenacity of Angora fibre while substantially
increasing the friction between the fibres. The plasma treatment to Angora fibres
also improves wettability and dye uptake.
7. Conclusion
u Plasma is a versatile technology to chemically and physically modify the
surface of materials.
u Plasma technology is used to achieve new or improved properties to
textiles. It is an alternative environmentally friendly technology to
complement or substitute several conventional textile processes.
u Research and development of plasma treatments applied to textiles are still
globally increasing. Different studies have been done on natural, artificial
and synthetic fibers.
u Sputtering, etching, chemical functionalization, free-radicals generation
and UV radiation are some of the most important effects conferred by
plasma treatments to textiles.
u Plasma treatments are increasing their presence in the textile industry for
several applications.
Plasma Technology in Textile 47
Angora Fibre Before Plasma Treatment
Angora Fibre After PlasmaTreatment
References
[1] Yang Chena, Xiaoliang Tang, Baotong Chen a, Gao Qiu, “Atmospheric Pressure
Plasma Vapor Treatment of Thermo-sensitive Poly(N-isopropylacrylamide) and
Its Application to Textile Materials”, Journal of Fiber Bioengineering &
Informatics, 4(3), (2011), 285-290.
[2] Shah J. N. and S. R. Shah , “Innovative Plasma Technology in Textile Processing :
A Step towards Green Environment”, Research Journal of Engineering Sciences,
2(4), April 2013, 34-39.
[3] http://textilelearner.blogspot.in/2012/04/application-of-plasma-technology-i
n.html
[4] http://textilelearner.blogspot.in/2013/10/plasma-treatment-in-textiles.html
[5] S. F. Sadova and E. V. Pankratova, “Low-Temperature Plasma Surface
Modification of Textiles Made from Natural Fibers and Advanced
Technologies”, Plenary reports from the 5th international symposium on
theoretical And applied plasma chemistry, (September 3–8, 2008, Ivanovo,
Russia).
[6] G. Buyle, “Nanoscale finishing of textiles via plasma treatment”, Materials
Technology, 2009, 24, 46-51.
[7] R. Shishoo, Plasma Technology for Textiles, The Textile Institute, Woodhead
Publishing Limited.
[8] LEITAT Technological center, “Plasma technology applied to textiles”, T-POT
PROJECT, 18th June 2009 Terrassa (Spain)
[9] S. K. Chinta*, S. M. Landage and M. Sathish Kumar, “Plasma technology & Its
application in Textile wet Processing”, International Journal of Engineering
Research & Technology (IJERT), Vol 1,Issue 22, July 2011.
[10] Ms. Anita Desai, “Plasma technology: A review”, The Indian Textile Journal,
January 2008 issue.
[11] A Newsletter, “Plasma processing update”, Facilitation Centre for Industrial
Plasma Technologies, Institute for Plasma Research, Issue 56, January–April
2009. ê
48 Arpita Kothari
Article Received on February 23, 2015; Accepted on March 17, 2015
4
Education for the 21st Century : The
Singapore Context
Marc Jonet*
This paper focuses on the dichotomy between the Singapore Ministry of Education’s stated
desired outcome of education (DOE) and the realities faced by students and faculty alike. Since the
British East India Company (EIC) established a trading post in Singapore in 1819 and despite the
many reforms orchestrated by the Ministry of Education, which led Singapore’s education system to
be described as world-leading, students have not received an education that allows them to develop
the skills needed to survive in the newly defined economy. The system itself, despite claiming to be
inspired by the progressivism philosophical perspective - education should focus on the whole child -
is, in fact, much more essentialist in its approach - common core knowledge must be transmitted to
students in a systematic, disciplined way - and seems to be failing increasingly to prepare students
for the 21st Century and equip them with the seven necessary survival skills, as defined by business
leaders as well as character education skills, values and virtues.
[Keywords : Education, Skills, Politics, Leadership, Philosophy}
1. Introduction
As the Greek philosopher, Heraclitus (535-475 BCE) declared, “There is
nothing permanent except change,” and education, unfortunately, does not
escape this trend. Education principles seem to head in one direction, but as soon
as they do, there is a new wave of guidelines imposed on educators that tell them
what they must do. Education, and many other broad concepts, has as many
meanings as it has different contexts, and there is no real right or wrong
definition of what education encompasses. The definition of education argument
CONTEMPORARY SOCIAL SCIENCES, Vol. 24, Number 1 (January-March), 2015
* Senior Manager/Education Devt. (Paracounsellor), School of Film and Media Studies,Ngee Ann Polytechnic, 535 Clementi Road, Block 52, #07-04 (Singapore 599489)E-mail: <[email protected]>
has been going on for ages. For Socrates, education was literally leading out, from
the Latin e-ducere, what was within the pupils, but others felt it was necessary to
give students the necessary tools to get a position, a job, in the city.1
For Plato, the purpose of education was “to develop in body and soul all
the beauty and perfection of which they are capable” (Palmer, 2001). Since Plato,
hundreds of individuals, like Maria Montessori, John I. Goodlad, Ralph Winfred
Tyler, have had a tremendous influence on education, providing new ideas and
new paradigms on what education should be. For most parents, though,
education’s purpose is to develop children and give them the proper skills and
tools to find a job and earn a living. At the end of the day, what seems to be the
biggest issue in Singapore’s education is that it has not been the educators who
have led the country into a bubble test, computer-scored obsession; it has been
the political system. Education and schooling are parts of our society, and those
in power make decisions that directly impact students and teachers daily.
In order to assess if an education system is performing well, our Ministry of
education recommended a series of characteristics, skills, and knowledge,
known as desired outcomes of education (DOE) - that each student should
acquire upon the completion of formal education.
In Singapore, a student going through the education system can expect to
receive an education based on the following DOE :
He has a good sense of self-awareness, a sound moral compass, and the
necessary skills and knowledge to take on challenges of the future. He is
responsible for his family, community and nation. He appreciates the beauty of
the world around him, possesses a healthy mind and body, and has a zest for life.
In sum, he is a confident person who has a strong sense of right and wrong, is
adaptable and resilient. He knows himself, is discerning in judgment, thinks
independently and critically, and communicates effectively. He is a self-directed
learner who takes responsibility for his own learning, who questions, reflects and
perseveres in the pursuit of learning. He is an active contributor who is able to
work effectively in teams, exercises initiative, and takes calculated risks. He is
innovative and strives for excellence; and, is a concerned citizen who is rooted to
Singapore. He has a strong civic consciousness, is informed, and takes an active
role in bettering the lives of others around him.
50 Marc Jonet
1. The paper was written as part of the requirements for my Master in Science of
Education with concentration in counselling from Breyer State University, Panama.
In theory, these values are in line with the political movement called
progressivism–referred to as progressive education because its ideas and
practices intend to transform schools into effective agencies of a democratic
society. In short, this implies that all citizens should actively participate in
decisions that will affect all aspects of their lives, be it at the social, political, or
economic level.
In order to achieve this noble goal, two essential conditions need to be
present: the respect of each individual and those individuals’ unique
characteristics, such as cultural identity, interests, and abilities, and the
development of a system that will engage each citizen in the development of his
community while trying to achieve a common purpose. Unfortunately, this
cannot be observed on a daily basis, resulting in the questioning of the education
system in Singapore and whether it prepares students for the new economy.
2. Philosophy of Education
As previously illustrated, the desired outcome of education should be in
line with a child-centered or learner-centered learning approach. However, if we
take a close look at what is taking place in our classrooms, at the micro level, we
notice what John Goodlad described in his book, A Place Called School, as the
five basic patterns in classroom culture:
1. The focus is not on the individual. The class is treated as a group, and the
educator addresses it as a whole. We understand that this is probably the
consequence of a need to keep a tight control of the group, but
unfortunately, it leads to socialization;
2. Such tight control does not promote natural burst of joy, enthusiasm, or
anger, and the general atmosphere is rather neutral;
3. The majority of the activities taking place in classes are comprised of
listening to the educator, writing, and eventually, answering questions as
well as taking tests at regular intervals. Subjects like art and physical
education, where there is a little hands-on activity, are the exception;
4. Since the main objective is to score well on final exams or in international
competitions, the type of teaching becomes more and more rigid as the
students progress through their schooling; and
5. Very little, if anything, is done to encourage student’s natural curiosity, to
encourage them to think outside the box and explore the world around
them. At best, the basic memorization of facts is at the core of most
activities.
Education for the 21st Century : The Singapore Context 51
The results of such a practice is clearly in opposition to the initial intent
stated by the educational policy makers as it creates a system that produces
people who can ace examinations; unfortunately, it does not encourage the
development of the skills needed to make rigorous decisions on fundamental
aspects of life.
For Maria Montessori, the role of an education system is :
u Awaken the child’s spirit and imagination;
u Encourage his normal desire for independence and high self-esteem;
u Help him develop the kindness, courtesy, and self-discipline that will
allow him to become a full member of society;
u Help the child lean how to observe, question, and explore ideas
independently.
These roles are similar to Piaget’s idea of constructivism or social
constructivism, where he proposed, “children construct their own beliefs and
understandings from their experiences.” Unfortunately, in Singapore, students
have been spoon-fed information all their life, so when the students must think
outside the box or when they are given the opportunity to express feelings and
emotions, they are simply incapable of doing so. At best, these students express
feelings and emotions in a very bipolar fashion: I like; I do not like. It is as if we
want students to build their knowledge, but they need the opportunity to make
discoveries for themselves and practice their skills in real situations, which also
includes learning through failures and making mistakes, values that are
diametrically opposed to the core values of success and performance at the core
of Singapore society.
Jerome S. Bruner (1915) said, “Education is not simply a technical business
of well-managed information processing, not even simply a matter of applying
‘learning theories’ to the classroom or using the results of subject-centered
‘achievement testing.’ It is a complex pursuit of fitting a culture to the needs of its
members and their ways of knowing to the needs of the culture” (Jerome Bruner,
). However, Richard Stanley Peters (1919) claims that for education, distinct from
other things like training or indoctrination, to take place, three criteria must be
met. The criteria are that :
u Education implies the transmission of what is worthwhile to those who
become committed to it;
u Education must involve knowledge and understanding and some kind of
cognitive perspective that is not inert;
52 Marc Jonet
u Education at least rules out some procedures of transmission, on the
grounds that they lack willingness and voluntarism (Peters, 1966, p. 45,
119).
Let’s have a look at those statements one by one.
2.1 Education implies the transmission of what is worthwhile to those who
become committed to it
Depending on the sociopolitical background of a country, what is deemed
worthwhile might have been determined by those in power in order to maintain
better control over the population and the development of the nation. For
instance, in Singapore, one of the most conservative South-East Asian countries,
social values and education curriculum are highly dictated by the political
system. As time progresses, radical shifts in the needs of the nation versus the
needs of individuals may occur. Educational models from the past may no longer
fit the needs of the present.
If the education system is analyzed, a system under an extreme amount of
control is easily visible. In such context, the system does not respect a Socratic
view of education, which seeks to bring out what students had within. Instead,
the current system tries to focus on what is worthwhile, without consideration
for the individual or his strengths, aspirations, and motivations. It is clear that
what is worthwhile may vary from year to year. If there is a need for doctors
today, for instance, by the time they complete their education, there might be a
plethora of doctors, and they would have wasted their time and might become
unemployable. What is even more obvious and regrettable is that the system
seems to have forgotten to ask the opinions of one group of major stakeholders:
the educators themselves. Rarely do educators have the opportunity to voice
their concerns and observations, and when they were given this opportunity,
educators’ opinions are rarely well received.
2.2 Education must involve knowledge and understanding and some kind
of cognitive perspective, which is not inert
Herein lies the concept of nature versus nurture. The cognitive perspective
is by nature not inert, but at the same time, researchers–since Piaget’s
research–agree that cognitive development depends on physiological
maturation. The brain undergoes a series of genetically controlled changes
during infancy, childhood, and adolescence that allow increasingly sophisticated
thinking processes; hence, genetic make-up also has a part to play. Education is
not all about nurturing and developing an individual to fulfill his full potential.
Education for the 21st Century : The Singapore Context 53
Unfortunately, in today’s world, education is also seen as a business, and
students are perceived as customers. Education is a service, lecturers are service
providers and textbooks are like apparel. Institutions are more interested in the
number of students that apply for their courses, making their institution number
one in the country.
Knowledge and understanding are no longer the main focus of education.
The quantity of students receiving a passing grade is more valuable than the
quality of education provided, and students’ zones of proximal development are
rarely challenged. Lecturers are also no longer allowed to fail a student, except in
extreme cases, and grades are shifted according to bell curves. Educators are
constantly reminded to do their best to help students articulate their transition to
universities by being more generous (give better grades) to the top performers as
it will have an impact on their GPA.
Polytechnics (Tertiary Institutions) have also embraced the International
Organization for Standardization (ISO) with all its consequences. Unfortunately,
such quality control system only looks at processes rather than results, and at
best, it provides the user with a series of tools that assess conformance, not
performance. Educators spend hours formatting documents and filling in
templates to ensure that the establishment stays ISO certified. There hasn’t been
any correlative study that proves that ISO certification increases the number of
students at a school or quality of students registering in these programs.
Knowledge and understanding are, therefore, not assessed for the benefit of the
person receiving the education.
2.3 Education rules out some procedures of transmission, on the grounds
that they lack willingness and voluntarism
The methods of transmission used in education have nothing to do with
any form of willingness and voluntarism. Students are at the mercy of an
educator, and since he is the almighty in the eyes of most students, he is an
authority to be respected. However, there is not much respect for teachers in
classrooms any longer. From my observations, in some classrooms, teachers,
lecturers, and professors promote the idea that they represent the knowledge. I
do not see any willingness and voluntarism in that case.
In general, students are the one who have to fit in and conform to the
education system; the education system does not have to serve the needs of its
students.
54 Marc Jonet
Plato suggested that if children are allowed to learn about things they are
genuinely interested in, a natural fit will be observed, and those children can be
pushed in that direction. This is a reasonable claim. Plato also claimed that by
enforcing learning, students are not actually being taught as the forced
information will not stay in there mind, and they will miss the opportunity to
learn about something they are generally interested in. Herein lies the dilemma
and challenge of how to help students enjoy learning subjects and material that at
first glance they felt no interest in.
3. From Education to the Business of Education
If Plato had to be transported into today’s society, he would surely disagree
with our pedagogic methods. In the U.S.A., for instance, funding of high school is
in general based on test results. In better schools, more students pass tests with
higher grades, which means they receive more funding. The result is a
transformation of the schools into test-oriented entities. Students who are not
interested in simply memorizing facts might slowly lose interest and become
disconnected from what they have learned and even from school in general.
These students might lose opportunities to further their education at a higher
level, and they may be dismissed from the education system entirely.
At the polytechnic level in Singapore, a similar phenomenon is observed.
At these institutions, schools compete with each other to attract larger numbers
of students, and these institutions create and offer new diplomas every year, but
there is little concern for the quality of teaching or for students’ support and
welfare. In such environments, students rarely develop their thinking skills since
they have been trained to memorize rather than apply concepts.
These students lack natural curiosity, and if they find importance to some
subjects, assessments, and so on, it is mostly because it would benefit them from
an academic point of view; they are not interested in gaining the knowledge for
personal growth. The result of such an educational philosophy is that more and
more students who are only interested in going through the system are enrolled.
These students are not necessarily slow learners, but these students tend to lack
maturity–at both an intellectual and emotional level–and most of them simply
wait to receive orders from their teachers to start thinking, so to speak.
If society genuinely wants students entering polytechnics to be in line with
the prescribed DOE, it is at primary school that the issues should be addressed.
When sixteen-or seventeen-year-old students enter their polytechnic life,
Education for the 21st Century : The Singapore Context 55

cognitive patterns and methods for assessing issues have already been formatted
in such way that it is a daunting challenge for students to shift their thinking
patterns. If those issues are to be addressed, a review of philosophers or thinkers
on education, like Montessori, Bereiter, Gardner, or Goodlad, who made several
suggestions for improving schools in his book A Place Called School (1984), should
be conducted.
For schools to be more successful, Goodlad provided a vision that
encompasses the following principles:
1. Promote in all youth the dispositions, skills, and knowledge that will allow
them to fully participate in the social and political development of the
nation;
2. Ensure that all students have the same opportunity to learn, to learn how to
learn and what they need to learn, regardless of their learning abilities;
3. Education is not just a job but a responsibility; hence, it is vital to ensure
that all educators are equipped with this intrinsic vocation. All students
should understand the need to build a relationship and create a conducive
environment to promote learning;
4. Through personal experiences taking place at school, prepare students for
democracy, allowing them to understand the rules and their rights and
responsibilities as a citizen; and
5. Classrooms should represent a microcosmic society where educators must
be empowered to stand up for what they believe in. This is what Goodlad
refers as the educator serving as a steward at school.
Going a step further, in his book, The Twelve Major Goals of American Schools
(Goodlad, 1979), Dr Goodlad recommends twelve goals that he felt “are
important to allow the students, parents and teachers to have a greater part in
developing the school’s philosophy and working toward understanding the
effect of social change in the schools.” Those goals are:
A. Academic Goals :
u Mastery of basic skills or fundamental process because with technology at
the core of all activities, it is vital for an individual to learn those basic skills
in order to participate actively in the development of society; and
u Intellectual development because with the emergence of global trends and
the increasing level of sophistication and complexity of societies,
individual intellectual development is vital.
56 Marc Jonet

B. Vocational Goals :
u Career and vocational education because with an average of 40 hours spent
at work each week, an individual will assess his level of satisfaction based
mostly on how satisfied he is with his work. In order to make sound career
choices, it is vital for individuals to assess their personal aptitudes and
interests in regard to their career possibilities.
C. Social, Civic and Cultural Goals :
u Enculturation because the present must be approached by understanding
the past, which at the same time, gives a sense of identity and direction for
every student;
u Interpersonal relations because each child should learn how to appreciate
his own ethnic group’s values as well as the values of other groups;
u Autonomy because in order to survive in a fast–paced, changing world,
schools should help children develop their capacity to assume the
responsibility for their own needs;
u Citizenship because the process of democratization and the development
of a democracy require the constant involvement of citizens of all creeds at
both the social and political levels;
u Self-concept because this will serve as a feedback mechanism for personal
goals and desires; it is also known as self-construction or self-perspective;
and
u Moral and ethical character because Goodlad refers to the role that schools
need to play in nurturing the development of the capacity of the evaluation
of right or wrong behavior as well as moral conduct and integrity.
D. Personal Goals :
u Emotional and physical well-being because emotional stability and
physical fitness are necessary for achieving the other goals;
u Creativity and aesthetic perception because Goodlad refers to the ability to
create meaning while appreciating the creations of others as an essential
skill in self-realization and a skill that the society would benefit from; and
u Self-realization because by making an effort to develop themselves,
individuals will be more equipped to participate in the development of a
better society.
Education for the 21st Century : The Singapore Context 57
As Goodlad pointed out, too often the importance of learning is not at the
core of our education system. Parents, with the possible exception of Japan where
parents perceive the activity of going to school as similar to going to work, often
express their concerns of a learner-centered school system, stating that in such a
system, the teacher does not assume his responsibility and passes that
responsibility on to the student not realizing the value of self-discovery.
If we want our students to be sensitive to the world around them, it is vital
to cultivate and develop their sensibilities at a high level. They must be sensitive
to one another, so they will have successful relationships with others. This can
only take place, if educators are willing to play their part and actively participate
in school rejuvenation, so to speak.
For Dewey (1938),
“…Experience is primarily an active-passive affair; it is not primarily
cognitive…the pervasive emphasis on cognition and its separation from
affect poses a threat to our society in that our educational institutions may
produce cold, detached individuals, uncommitted to humanitarian goals.
Certainly, a modern society cannot function without ever increasing orders
of cognitive knowledge. Yet knowledge per se does not necessarily lead to
desirable behavior…unless knowledge is related to an affective state in the
learner, the likelihood that it will influence behavior is limited” (Dewey,
1938)
From Dewey’s perspective, education has two purposes: societal and
individual. Education should focus on the development of the individual as well
as the development of the society. Dewey (1938) maintained that, “education
should be progressive and experiential.” Dewey’s ideas can be summarized by
saying that education is not preparation for life; education is life itself; He said,
“Give the pupils something to do, not something to learn and if the doing is of
such a nature as to demand thinking; learning naturally results.”
The concept of education itself has been revisited many times under the
influence of Greek philosophers and their followers. The students are now, or at
least should be, at the center of the dialogue as they are assigned individual tasks,
keeping in mind their individuality.
4. Education and Politics
The question that remains is why this is not happening in Singapore. I
believe that the structure of the political situation is where the answer lies.
58 Marc Jonet
Singapore has an autocratic central government that has tight control over all
aspects of life, be it economical, political, or social. This political situation
minimizes individual rights while glorifying the nation.
Despite these critiques, the economic success of Singapore did not take
place by accident. Strategic planning and strong political will were the key
factors contributing to the development of Singapore’s fast-growing economy, a
modern city with high-tech infrastructures, a safe environment, and an
organized country that is well maintained. However, none of this took place
through public opinion.
Although there have been several attempts to engage Singaporeans in
discussions of issues about making Singapore a better place, more specifically
through a campaign called Singapore 21 launched in August 1997 by Prime
Minister Goh Chok Tong, political leaders have always urged caution because
there is a limit to how much they are willing to be challenged.
One might find this situation quite astounding, but as the socialization
processes took place simultaneously, be it from the primary socialization level at
home (where norms and values are received); the secondary level, which is what
takes place outside the home (where behavior specifics are learned); or formal
and information socialization (the army or by copying others behavior), most
Singaporeans simply learned to follow their leaders with few complaints and
little resistance to what was imposed on them.
The series of sudden protests following the last election also had an impact
on education as we have seen an increasing number of Parliament sessions
talking about issues regarding the education system in Singapore in the last few
months. In a recent Parliament session, Dr. Intan Azura Mokhtar asked the
Minister for Education if elitism still existed in schools, especially in
better-performing schools or those having a majority of well-to-do students.
Mr. Lawrence Wong (Minister of State, Ministry of Defense, and Ministry
of Education) replied:
We recognize that every child is different and that learning needs and
abilities are different. And that is why we have customized progression
pathways that are different. Not just one single track, but multiple
pathways to cater to the different abilities and needs of students. No single
pathway is superior to another. That should not be the mindset. The
diverse pathways are meant to cater to different learning needs and each
Education for the 21st Century : The Singapore Context 59
one customized for people with different needs. Somebody may be
academically slower and they may need a longer time to study and to
progress in their pathway, but they may be a slow learner initially and a
faster learner later on. So, what we also want to do is to have many bridges
and ladders across the different pathways, so that as you progress along
one pathway and as you do well subsequently, you can move on to a
different pathway–adapted, again, and customized to the needs of that
individual (Parliament No 12, 2012).
During another, more recent session, Mr. Yee Jenn Jong, a non-constituency
member from the opposition party (The Workers’ Party), asked the Minister for
Education what progress had been made on the holistic assessment approach for
education at the lower primary levels that places less emphasis on semestral
examinations, as recommended in the 2009 Report of the Primary Education
Review and Implementation (PERI) Committee.
The Senior Parliamentary Secretary to the Minister for Education (Ms. Sim
Ann) stated :
Sir, one of the recommendations of the Primary Education Review and
Implementation (PERI) Committee was to introduce more holistic
assessment to support learning. Holistic Assessment comprises the use of a
variety of age-appropriate assessment modes. The emphasis is on skills
development and to provide constructive feedback for meaningful
learning (Parliament No 12, 2012).
Changes do not to occur over night; however, it is clear that there are at
least some debates taking place at the Parliament level, and since a summary of
those debates is broadcast every time they take place, and with an opposition
stronger than ever, changes might finally be instituted.
5. The Strawberry Generation
On April 29, 2011, I had the opportunity to attend a seminar series entitled
“Transforming Education for the 21st Century,” organized by Educare
Singapore, which is a cooperative of the Singapore Teachers’ Union (STU). One
of the seminars that caught my attention was “Leading, Learning, and Teaching
in the 21st Century” presented by Tony Wagner, Ed.D., Innovation Education
Fellow at the Technology and Entrepreneurship Center at Harvard. I could not
have been more thrilled to see someone who spoke at length to the CEOs of major
60 Marc Jonet
companies, asking them about the qualities they were looking for in future
employees, and Dr. Wagner talked at length about the gap between what is
taking place in our schools and global achievement. He was finally in Singapore
to share his valuable insight.
What Dr. Wagner refers to as the global achievement gap is the gap
between what we are teaching and testing versus the skills the students will need
for careers, college, and citizenship in the 21st Century. During the short
two-hour session, Dr. Wagner also talked about what the seven survival skills,
which were the core of his talk. These skills are as follows:
5.1 Critical Thinking and Problem Solving
Critical thinking is the intellectually disciplined process of actively and
skillfully conceptualizing, applying, analyzing, synthesizing, and/or evaluating
information gathered from, or generated by, observation, experience, reflection,
reasoning, or communication that are used as a guide to belief and action
(Scriven and Paul, 1987).
5.2 Collaboration across Networks and Leading by Influence
“The biggest problem we have in the company as a whole is finding people
capable of exerting leadership across the board…Our mantra is that you lead by
influence, rather than authority” (Chandler,). In short, it is all about
collaboration, instead of commanding and controlling, as organizations are
becoming more and more global.
5.3 Agility and Adaptability
This particular concept refers to how fast both organizations and people
working in those organizations can adapt to the constantly changing
environment. Adaptability is defined as the capability of reshuffling both the
organization and the people working for it, in order to meet a different series of
requests.
5.4 Initiative and Entrepreneurship
The sense of initiative and entrepreneurship refers to an individual’s ability
to turn ideas into action. It is all about being creative, innovative, and being a
risk-taker as well as the ability to plan and manage projects in order to achieve
objectives.
Education for the 21st Century : The Singapore Context 61
5.5 Effective Oral and Written Communication
“The biggest skill people are missing is the ability to communicate: both
written and oral presentations. It’s a huge problem for us” (Neal,).
5.6 Accessing and Analyzing Information
We can’t talk about information literacy without first considering the
paradigm shift resulting from the role of technology in the delivery of and access
to information. Technology provides us with the ability to acquire a higher
volume of information faster. Learning has shifted from linear to hypermedia as
students move back and forth between different sources of information in a
non-sequential way. The question that remains is how to process, analyze, and
make use of that information effectively.
5.7 Curiosity and Imagination
Curiosity is an essential element of critical thinking. Michael Jung, senior
consultant at McKinsey & Company stated, “The most successful worker will not
merely adapt to working conditions that are given to him but be able to adapt in a
way that creates a position that fits his own profile.”
At first glance, it all makes perfect sense, and those so-called survival skills
might have been at the core of the education system for a while, and they were
probably implemented with some success. What has changed in the last decade,
however, is the composition of students entering our institutions. Some called
them the Net generation (Net Gen), others call them Generation Y, Generation Z,
Millennial Generation, and Echo Boomers..In her book Educating the Net
Generation, Diana G. Oblinger describe this generation with the following
attributes:
Digitally literate : Having been immersed into the world of technology
since birth, the Net Gen is able to intuitively use a variety of information
technology devices and navigate the Internet. Although most of them can
intuitively make use of technology, their understanding of the technology itself
and how to fully make use of it tends to be shallow.
Connected : “As long as this generation has been alive, the world has been
a connected place, and more than any preceding generation, they have seized the
potential of networked media.” While highly mobile, moving from work to
classes to recreational activities, the Net Gen is always connected.
62 Marc Jonet
Immediate : They multitask, moving quickly from one activity to another,
sometimes performing them simultaneously; unfortunately, this occurs with a
limited attention span.
Social : Despite not being at ease in face-to-face interactions, when it is time
to share personal information, opinions, and comments on social networks, the
Net Gen seems to be in their element. Clearly not understanding what public
domain means, they talk about everything and nothing, without any form of
restrain, and they label people they do not even know as friends.
Teams : The Net Gen prefers to work in team, and we can often assist with a
peer-to-peer approach, where students help each other. Often to their detriment,
the Net Gen finds peers more reliable than teachers when they are selecting what
is worth paying attention to.
Structure : They want parameters and procedures, and they have a
preference for clear structure and guidance rather than vague instructions.
Engagement and experience : The Net Gen likes to receive information at a
fast pace. In the classroom environment, this simply means that they will not pay
attention if the educator does not make the lesson interactive and engaging or if
the lesson is too slow. Unfortunately, this may also lead to a situation where they
do not take the time to process and reflect on information.
Visual and kinesthetic : According to Oblinger, in a study that replaced
text-based instruction with graphic instructions, the refusal to do the assignment
dropped while test scores increased.
Things that matter : According to Jeffrey R. Young, when given a choice,
this generation seems to prefer working on things that matter, such as addressing
an environmental concern or a community problem (Young, 2003).
In Asia, the Net generation has been labeled the strawberry generation.
Addressing the Singapore Scout Association’s 100th anniversary dinner in
February 2010, Senior Minister Goh Chok Tong described young Singaporeans
as “fragile like strawberries.” This was in reference to the Taiwanese expression
“Strawberry Generation” that described children as overly sheltered,
insubordinate, spoiled, not able to withstand pressure, and apathetic about what
happens around them. Like the strawberry, they tend to bruise very fast. During
the last thirteen years, a tremendous drop in the quality of students enrolling in
our polytechnic has been observed. Despite the expected 5 to 10% of exception,
Education for the 21st Century : The Singapore Context 63
quite a number of them lack commitment, they harbor an overall apathy for
learning, and they tend to lack curiosity.
6. The Need for Change in Leadership Styles
Singapore is one of the most modern ASEAN cities. Its infrastructure is
world class, its modes of transportation are efficient, its internet penetration is as
high as it has ever been, its system of fiber optics is spreading to modest housing
estates, and all its polytechnics are equally well equipped; they even have the
capacity to conduct distance-learning.
Everything has been done to satisfy the most demanding of our customers,
also known as students. If all the technology and infrastructures are in place and
if, without a single doubt, Singapore has an amazing pool of dedicated educators
who never cease to try to perform better, be inventive in their classrooms, and
give their best to the students they teach, then why is there such a gap between
our DOEs, the seven core skills stated earlier, and what we actually observe on a
daily-basis. I believe that it is in our management style that results in the bulk of
the problem; more specifically, it is in the way our managers tend to comply with
anything that comes their way, without asking too many questions.
Compliance might produce managerial efficiency, but it does not promote
a culture of inquiry. Leaders that intend to engage their employees need to
encourage questions, debates, and dialogues. Unfortunately, most of those
leaders tend to promote both a top-down managerial approach and an
unchallenged buy-in. Although the top-down approach is still predominant in a
number of corporations, the weaknesses of such an approach are becoming more
and more obvious, leading corporations to mix both the top-down and
bottom-up approaches. Too often, we assume that top-level managers are best
suited to be influential and get things done.
However, it is not necessarily true that these people have the ability to lead
and changes things and with clear vision and an innovative approach.
This particular style of management only promotes a detachment between
the original objectives of the corporation and the daily practice of individuals
who feel more and more disconnected from the top of the pyramid. Those small
groups of individuals develop alternate ways of exercising management and
develop their own micro-tasks, objectives, and visions. Although they practice all
of the above very often with good intentions, they are seen as disloyal, dishonest,
64 Marc Jonet
and difficult to manage simply because they are too challenging for the people in
power. The challenge for top management is to see that in those isolated groups,
there might be some valid strategic value that should be heard.
If those same top managers were to apply a bottom-up managerial
strategy, they would still provide the basic direction of the new initiative or
policy they wanted to implement, but they would invite team members at lower
level of management and end users to participate in each and every step of the
management process. The entire team would work together, avoiding the need to
enforce an unnatural buy-in. Each team member would then be allowed to come
up with solutions and focus on practical ways of solving the problem or
implementing the initiative, instead of being forced to apply abstract ideas. The
reason such a managerial approach is more beneficial for all parties involved is
because the more top-down, autocratic approach, usually causes resentment and
often leads to little success. The laissez-faire approach does not promote
sufficient monitoring of progress, which often leads to failure. This also often
leads to confusion as the end user will always propose solutions to problems that
were not clearly stated to start with.
How many times do we hear, “You should not have done it this way, this is
not what I expected, you should not write this, say that…” and so on, simply
because there was a total lack of clear directives to start with.
What seems to be missing in our schools is a more directed empowerment
style of leadership. This leadership approach, described by Robert Waterman in
The Renewal Factor: How the Best Get and Keep the Competitive Edge promotes
autonomy and creativity (empowerment) within a systematic framework that
stipulates clear, non-discretionary priorities and parameters (directed).
The reason corporate initiatives are very often not well received or simply
fail, besides the fact that they are simply imposed on the educators, is because
they are often not explained well, and the end user sees very little connection
between what he has been forced to do or implement and the relevance to his
work as educator.
The directed empowerment approach would keep the educators’ practice
in line with the original intended initiative, but it would provide a platform for
both the administrative team and the team of educators to gather together in an
effort to find a solution, to find practical ways to implement policies that would
satisfy both parties.
Education for the 21st Century : The Singapore Context 65
This is what Elmore called reciprocal accountability in his book School
Reform from the Inside Out: Policy, Practice, and Performance (Richard F. Elmore,
2003). In order for such a practice to succeed, leaders need to learn how to let go,
so they can help build the capability of each member of the group to accomplish
the task they have been working on.
The person at the top of the pyramid should ask himself the following
question: “What can I do to give people in this organization the tools and skills to
ensure their eventual success as they undertake this challenge?”
In a country like Singapore, which still practices some form of
Confucianism, where one prefers the harmony to the truth, the status quo to
changes, and the leader tends to surround himself by yes men and yes women,
which does not promote change, development, or creativity. Most often, people
at the top of the pyramid “ignore the invisible leadership of lower-level staff
members” (Murphy, 1988 : 655).
Promoting educators into leadership roles has been common practice for
quite some time, and educators are promoted to positions such as department
heads, curriculum developers, course managers, and section heads. In theory,
those specific positions provide an opportunity for educators to promote their
decision-making processes.
According to Nickse (1977), there are four reasons why promoting
educators as agents of change has a great opportunity for success:
1. Teachers have a vested interest. “They care about what they do and how
they do it and feel a sense of responsibility for their efforts”;
2. Teachers have a sense of history, they are “aware of the norms of their
colleagues”;
3. Teachers know the community, “have information concerning the values
and attitudes of the community”; and
4. Teachers can implement change. They “are where the action is…in the
position to initiate planned change on the basis of need.”
However, it seems that despite the attempts to promote educators into
leadership positions so they become leaders of change and extend their
leadership’s roles, these educators do not see themselves as leaders simply
because they are never consulted when it is time to develop new plans and
initiatives. Their contribution is still limited to what they are allowed to
66 Marc Jonet
contribute. Often, they feel pressured to comply with cumbersome of rules and
regulations and fill out an increasing amount of unnecessary paperwork.
Therefore, these educators feel that they have a title but no real power, and they
are given very few opportunities to voice their real concerns.
What I feel is lacking is, in fact, a personal vision, and without a vision,
those so-called leaders are merely playing a role of managers. It is vital for all
leaders to start with a personal vision as it will allow them to forge a shared
vision with their coworkers and will empower their teams to act according to this
common vision.
Leaders of educational change have a clear picture of what they want to
accomplish; they have the ability to visualize one’s goals. Their vision of their
school or district provides purpose, meaning, and significance to the work of the
school and enables them to motivate and empower the staff to contribute to the
realization of the vision (Mazzarella and Grundy, 1989).
According to Manasse (1986), vision includes the “development,
transmission, and implementation of an image of a desirable future…sharing of a
leader’s vision may differentiate true leaders from mere managers” (p. 151).
Sergiovanni stated, “School leaders have not only a vision but also the skills to
communicate that vision to others, to develop a shared vision, a shared covenant.
The development, transmission, and implementation of a vision is the
focus of leaders of educational change” (Sergiovanni, 1990). Sergiovanni has
described this aspect of leadership as bonding; leader and followers have a
shared set of values and commitment “that bond them together in a common
cause” (p. 23) in order to meet a common goal.
In Chrispeels’s (1990) report of effective schools, she stated, “if a school
staff has a shared vision, there is a commitment to change” (p. 39). The shared
vision becomes a “shared covenant that bonds together leader and follower in a
moral commitment” (Sergiovanni, 1990 : 24). “These teachers’ visions included
changes in the classroom, such as interdisciplinary curricula, varied student
grouping patterns, and instruction that included basic literacy as well as critical
thinking, creativity, inquisitiveness, and independence of thought” (Murphy,
Everston and Radnofsky, 1991 : 144).
Compared to the general adult population, who identify a good salary and
job security (Feistritzer, 1986 : iii) as the most satisfying aspects of a job; teachers
identify the three most satisfying aspects of teaching as :
Education for the 21st Century : The Singapore Context 67
1. “A chance to use your mind and abilities”;
2. “A chance to work with young people–see young people develop”; and
3. “Appreciation for a job well done” (Feistritzer, 1986 : iii).
4. According to Greenfield (1991), teachers’ work is not “motivated by
bureaucratic mandate or directives from superiors, but by a moral
commitment to children rooted in their awareness of the needs of these
children and their belief about the significance of their roles as teachers, in
these children’s lives” (p. 8). “The primary rewards for most teachers come
from students’ academic accomplishments–from feeling certain about their
own capacity to affect student development” (Rosenholtz, 1987 : 188).
I can, without a doubt, agree with the last two statements as I have seen
how proud and moved colleague educators were while attending a graduation
ceremony of students they had in their classes. Unfortunately, the educators
seem to be the only ones addressing the needs of students as students and not as
customers.
The rest of the structure around them seems to have only one objective, to
please the customer by constantly finding new ways to entertain
them–organizing events of all kinds–and prioritize the building of structures to
accommodate their needs. Higher levels of management even turn against their
educators if they feel the image of the school might be in danger. An educator
may reprimand a student or exercise another form of discipline, and
management may begin to turn against the educator in order to avoid losing face
due to fear that the brand–the school–will suffer from bad publicity.
This prioritization of students to academic staff has led many educators to
the conclusion that they do not count, that the management team does not care
about them, and they feel neglected. “To lead change the leader must believe
without question that people are the most important asset of an organization”
(Joiner, 1987 : 2). This can only take place if, the leader first values the
professional contributions of the staff, which depend on the leaders’ ability to
relate to people.
Finally, a good leader must be capable of fostering collaborative
relationship. “One finding to emerge repeatedly in studies of leaders, including
studies of educational leaders, is that leaders are people oriented” (Mazzarella
and Grundy, 1989 : 16). Gorton and McIntyre (1978) found that effective
principals had “an ability to work with different kinds of people having various
68 Marc Jonet
needs, interests, and expectations” as their strongest asset (Mazzarella and
Grundy, 1989 : 16).
Niece (1989 : 5) found that “effective instructional leaders are people
oriented and interactional." “Change must be initiated by leaders who are willing
to risk their reputations for the future benefit of their companies” (Joiner,
1987 : 4).
A good leader should possess the following qualities :
u Has a vision;
u Believes that schools are for learning;
u Values human resources;
u Is a skilled communicator and listener;
u Acts proactively; and
u Is willing to take risks.
7. Top-Down Leadership Style and its Impact on Students
Singapore’s school systems, with its top-down approach to discipline
strategies, strongly encourages group identity and conformity. However, when
the students graduate from these schools, they are expected to become creative,
original in their approaches, and demonstrate unique characteristics. Too often,
we stress conformity both in terms of behavior and in the approach to learning.
Learning through taking risks and failures are definitely not encouraged, and
often, students prefer to play-it-safe and obtain a passing grade instead of
venturing outside the box and risking failing or acing a subject.
If we want to fully embrace the 21st Century and its challenges, we need to
develop a new attitude toward adversity. It is vital to help our students develop
the ability to treat failures and mistakes as valuable experiences. As a fervent
believer in the concept of synchronicity, dear to the Swiss Psychiatrist Karl
Gustav Jung, I would say that there is no such thing as a coincidence. Everything
is just a meaningful event taking place in time and space, from which we can
learn valuable lessons. Jung invented the word synchronicity to describe what he
called “temporally coincident occurrences of a causal events.” Synchronicity is,
in fact, nothing less than a meaningful coincidence.
If, for just one moment, we were to stop the constant noise taking place in
our brain and start to analyze events taking place in our life using Jung’s theory,
it might help our students :
Education for the 21st Century : The Singapore Context 69
1. Understand that they only use a small percentage of their full capacity,
which will enforce their self-belief, the idea that they can accomplish what
they desire to accomplish and much more;
2. Make use of their intuition and ability to innovate;
3. Learn from each and every experience, be it a success or a failure, and learn
how flexible they can be and how quickly they can adapt to changes and
new environments.
Mastery of any skill creates a feeling of contentment. It makes us happy,
and psychological and educational researchers from Abraham Maslow to Martin
Seligman point out the intimate connection between our emotions and our ability
to learn and remember. Also, certain types of learning make us happier, which
helps us to learn more effectively.
The top-down approach of management has nothing to do with what we
are talking about here. As human beings, we develop our learning process
through evolution, by interacting with our environment and by extending our
zone of proximal development. In a time of such a high-level of complexity, with
access to a never-ending flow of new information, schools will have to adapt their
teaching pedagogy and offer new mode of learning while transforming and
preparing learners to be more adaptive to the world unfolding in front of them.
As Beetham and Sharpe (2007) found, this process involves engaging learners in
apprenticeships for different kinds of knowledge practice, and it will require new
processes of inquiry, dialogue, and connectivity.
Innovative new teaching pedagogies will need to include:
u Digital competencies that focus on creativity and performance;
u Strategies for meta-learning, including learner-designed learning;
u Inductive and creative modes of reasoning and problem-solving;
u Learner-driven content creation and collaborative knowledge-building;
and
u Horizontal (peer-to-peer) learning and contributions to communities of
learning.
Pedagogy 2.0–a framework derived from Web 2.0–offers a series of
guidelines to promote effective learning:
u Content should consist of micro units of content that augment thinking and
cognition and may include a wide variety of learner-generated resources
that are accrued from students creating, sharing, and revising ideas;
70 Marc Jonet
u Curriculum should not be fixed but dynamic, open to negotiation and
learner input, consisting of bite-sized modules, and interdisciplinary in
focus, and it should blend formal and informal learning;
u Communication where students are offered multiple opportunities for
open, social, peer-to-peer, and multi-faceted forms of visual, verbal, and
auditory communication using multiple media types to achieve relevance,
immediacy, and clarity;
u Learning processes should be situated, contextualized, reflective,
integrated with thinking processes, iterative, dynamic, and performance
and inquiry-based;
u Resources should include multiple informal and formal sources that are
media rich, interdisciplinary, and global in reach;
u Platforms, through a network of peers, teachers, experts, and communities,
should be open to students;
u Learning tasks should be authentic, personalized, experiential,
learner-driven and designed, and enable the creation of content and
innovative ideas from learners.
These principles represent the intersection between established
instructional design principles for the creation of constructivist, student-centered
learning environments.
In Nine Characteristics of High-Performing Schools, G. Sue Shannon and Pete
Bylsma (2007), offer resources to improve student learning. In 2002, specialists
from the Office of the Superintendent of Public Instruction (OSPI) reviewed more
than 20 studies on successful schools.
All the successful schools had the following attributes in common:
1. A clear and shared focus is required, so everybody knew where they are
going and why. The focus was on achieving a shared vision, and all – be it
educators or administrators - understand their role in achieving the vision.
The focus and vision are developed from common beliefs and values,
creating a consistent direction for everyone involved;
2. High standards and expectations for all students where teachers and staff
believe that all students can learn and meet high standards are required.
While recognizing that some students must overcome significant barriers,
Education for the 21st Century : The Singapore Context 71

these obstacles are not seen as insurmountable. Students are offered an
ambitious and rigorous course of study;
3. Effective school leadership where effective instructional and
administrative leadership is required to implement change processes.
Effective leaders are proactive and seek help when it is needed. They
nurture an instructional program and school culture conducive to learning
and professional growth. Effective leaders have different styles and
roles–teachers and other staff, including those in the district office, often
have leadership roles;
4. High levels of collaboration and communication are required, so there is
strong teamwork among teachers across all grades and with other staff.
Everybody is involved and connected to each other, including parents and
members of the community, to identify problems and work on solutions;
5. Curriculum, instruction, and assessments aligned with state standards are
necessary, so the planned and actual curricula are aligned with the
essential academic learning requirements (EALRs). Research-based
teaching strategies and materials are used. Staff understands the role of
classroom and state assessments, what the assessments measure, and how
student work is evaluated;
6. Frequent monitoring of learning and teaching are necessary, and a steady
cycle of different assessments identify students who need help. More
support and instructional time are provided, either during the school day
or outside normal school hours, to students who need more help. Teaching
is adjusted based on frequent monitoring of student progress and needs.
Assessment results are used to focus and improve instructional programs;
7. Focused professional development is necessary, so a strong emphasis is
placed on training staff in areas that are in needed the most. Feedback from
learning and teaching focuses on extensive and ongoing professional
development. The support is also aligned with the school or district vision
and objectives;
8. Supportive learning environment is necessary, so the school has a safe,
civil, healthy, and an intellectually stimulating learning environment.
Students feel respected and connected with the staff and are engaged in
72 Marc Jonet
learning. Instruction is personalized and small learning environments
increase student contact with teachers;
9. A high level of family and community involvement is required, so there is a
sense that everyone has a responsibility to educate students, not just
teachers and staff in schools. Families and community also play a vital role
in this effort.
In our new world of constantly shifting possibilities and opportunities, the
problems we are preparing our students for might not be the ones they will
encounter in real life. It is no longer important for them to state what they know;
it is more likely that what they can do with what they know will be required in
their curriculum vitae.
As David Chiem and Brian Caswell so brilliantly stated in their book The
3-Mind revolution; in order to survive in our new economy, the students will need
to learn how to develop what they call the champion mind, the learning mind
and the creative mind.
The champion mind is simply a different way of thinking, made of equal
parts of emotional intelligence, communication skills, self-awareness, and
self-confidence. As for the learning mind, if we can develop it so that we maintain
our natural curiosity about the world around us, to store and make use of
information effectively, we will be able to identify how we learn. If we can
develop the creative mind and apply creativity to the problems we face, and if we
strive to give creativity the emphasis it deserves in our schools, we might be able
to give each and every child the opportunity to contribute to the world around
them.
8. Summary and Conclusion
Fortunately and unfortunately, the dichotomy between the stated DOE
from the Singapore Ministry of Education and the reality faced by students and
faculty is not unique to Singapore, and neither is the global achievement gap
between what we should teach our children and what is really covered in our
curriculum, or how we teach. However, in conservative Asian societies, it is
probably the top-down approach that constitutes the biggest of all challenges.
Colleague educators from Singapore and neighboring countries have all shared
the same feelings of disconnect between what they face on a daily basis and the
Education for the 21st Century : The Singapore Context 73
policies dictated by their Ministry of Education, the President of their university,
their Boards of Trustees, and other decision makers.
Our school leaders seem to fail to provide the educators with adequate
tools to carry out their missions, focusing most of their time on key performance
indicators, the success of ISO certification, and other irrelevant statistics that, at
best, demonstrate some level of conformity but do not say much about
performance. Compliance, as we have seen, is a bureaucratic tendency, but it
does not promote or enable the intellectual inquiry and engagement required for
sustainable improvement. At best, it promotes a climate of resentment, cynicism,
and sarcasm.
To become architects of change, educators need to be fully engaged in
educational improvement efforts; they need to be allowed to voice out their
concerns, ideas, and disagreement in a supportive climate without fear of
reprisal. We need a new kind of leader; one that is willing to focus on helping the
team share knowledge, one that is willing to give the team members a voice. We
need a new kind of administrator; one that can both run our schools and
understand the challenges faced by educators on a daily basis.
Leaders should stop spending their time with other leaders, focusing on
strategic issues. Sure, strategic plans are important, but over time, leaders
become out of touch with the reality and problems faced by educators who are
the ones that get the work done. By isolating themselves, leaders become out of
sync with reality and tend to focus on and cater solely to issues related to other
leaders and managers.
Slowly things are changing, and there are an increasing number of
educators expressing the same message. Unfortunately, we have not yet reached
a critical mass. Educators need to stand united and dare to express their concerns
while offering solutions. Let’s not be passive-aggressive but pro-active and work
together to develop a new way of addressing the issues we face in our classrooms
and with our managers. For some, teaching is just a job, but for most, it is a
vocation, a calling. Things will not change overnight, but without a doubt, it
starts with a reflection, followed by some concrete action. Transformation
education is an ongoing task, but it has already started through the work we are
doing every day.
“We‘ve bought into the idea that education is about training and success,”
which is defined monetarily rather than by the students’ ability to think critically
74 Marc Jonet
and to challenge. We should not forget that the true purpose of education is to
make minds, not careers. A culture that does not grasp the vital interplay
between morality and power, which mistakes management techniques for
wisdom and fails to understand that the measure of a civilization is its
compassion not its speed or ability to consume, condemns itself to death (Chris
Hedges, 2009).
References
Bellon, T. and J. Beaudry, “Teachers’ Perceptions of their Leadership Roles in
Site-based Decision Making”, Paper presented at the Annual Meeting of the
American Educational Research Association, San Francisco, CA, 1992.
Bereiter, C., “Psychology and Early Education” in D. W. Brison and J. Hill (Eds.),
Psychology and Early Childhood Education, Monograph Series No. 4, Toronto,
Ontario : Institute for Studies in Education, 1968, 61-78.
Blumberg, A. and W. Greenfield, The Effective Principal: Perspectives on School
Leadership, Boston : Allyn & Bacon, 1980.
Blumberg, A. and W. Greenfield, The Effective Principal : Perspectives on School
Leadership (2nd Edition), Boston : Allyn & Bacon, 1986.
Boles, K. and V. Troen, “How teachers make restructuring happen”, Educational
Leadership, 49 (5), 1992, 53-56.
Bruner, J., The Culture of Education, Cambridge, MA : Harvard University Press, 1996.
Chiem D. and B. Caswell, The 3-Mind Revolution, Singapore:Marshall Cavendish
International (Asia) Private Limited, 2009.
Chrispeels, J. A., “Achieving and Sustaining School Effectiveness : A Five Year Study
of Change in Elementary Schools”, Paper presented at the Annual Meeting of the
American Educational Research Association, Boston, MA, 1990.
Culverwell, Edward Parnall, 1855-1931, The Montessori Principles and Practice : A
Book For Parents and Teachers, Cornell University Library, 2009.
Dewey, J., Democracy and Education : An Introduction to the Philosophy of
Education, New York : Free Press, 1966.
Elmore R. F., School Reform From the Inside Out : Policy, Practice, and Performance,
Cambridge, MA 02138 : Harvard Education Press, 2004.
Feistritzer, C. E., Profile of Teachers in The U.S., Washington DC : National Center for
Education Information, 1986.
Education for the 21st Century : The Singapore Context 75
Glasman, N. S., “Student achievement and the school principal”, Educational
Evaluation and Policy Analysis, 6(3), 1984, 283-296.
Goodlad, J. I., A Place Called School, New York : McGraw-Hill, 1984.
Goodlad, J. I., Educational Renewal: Better Teachers. Better Schools, San Francisco :
Jossey-Bass Publishers, 1994.
Gopinathan S., Towards a National System of Education in Singapore, 1945-73
(Oxford in Asia Current Affairs), Singapore : Oxford University Press, 1975, 86.
Greenfield, W. D., “The micropolitics of leadership in an urban elementary school”,
Paper presented at the Annual Meeting of the American Educational Research
Association, Chicago, IL., 1991.
Hallinger, P., L. Bickman and K. Davis, What Makes A Difference: School Context,
Principal Leadership, and Student Achievement. : The National Center for
Educational Leadership, Occasional Paper No. 3, Harvard Graduate School of
Education, Cambridge, MA, 1990.
Hedges, C., Empire of Illusion : The End of Literacy and the Triumph of Spectacle,
New York : Nation Books, 2009.
Heraclitus, Fragments (English and Greek Edition), New York : Penguin, 2008.
Hord, S. M., Facilitating Leadership : The Imperative for Change, Austin, TX :
Southwest Educational Development Laboratory, 1992.
Howey, K. R., “Why teacher leadership?”, Journal of Teacher Education, 34(1), 1988,
28-31.
Kho, E. M., Construction of femininity: Girls’ education in Singapore, 1959-2000
(Unpublished doctoral dissertation), National University of Singapore,
Singapore, 2004. (LC2410.S55 Kho).
Krug, S. E., C. Scott and S. Ahadi, An Experience Sampling Approach to the study of
principal instructional leadership I: Results from the Principal Activity
Sampling Form, Urbana, IL : The National Center for School Leadership,
University of Illinois at Urbana-Champaign, 1990.
Leithwood, K. A. and D. J. Montgomery, “Patterns of growth in principal
effectiveness”, Paper presented at the Annual Meeting of American Educational
Research Association, New Orleans, 1984.
Manasse, A. L., “Vision and leadership : Paying attention to intention”, Peabody
Journal of Education, 63(1), 1986, 150-173.
Mazzarella, J. A. and T. Grundy, “Portrait of a leader” in S. C. Smith and P. K. Piele
(Eds.), School Leadership : Handbook for Excellence Second Edition,
Washington, DC : Office of Educational Research and Improvement, 1989, 9-27.
76 Marc Jonet
Mazzarella, J. A. and S. C. Smith, “Leadership Styles” in S. C. Smith & P. K. Piele
(Eds.), School Leadership : Handbook for Excellence (Second Edition),
Washington, DC : Office of Educational Research and Improvement, 1989, pp.
28-52.
McLoughlin, C. and M. J. W. Lee, “Web 2.0 : The three p’s of pedagogy for the
networked society : personalization, participation, and productivity”,
International Journal of Teaching and Learning in Higher Education, 20(1), 2008,
10-27.
Murphy, J., C. M. Everston and M. L. Radnofsky, “Restructuring schools : Fourteen
elementary and secondary teachers’ perspectives on reform”, The Elementary
School Journal, 92(2), 1991, 135-148.
National Council for Excellence in Critical Thinking. Retrieved from http://
www.criticalthinking.org/pages/defining-critical-thinking/410
Nickse, R. S., Teachers as Change Agents, Washington, DC : National Education
Association, 1977.
Palmer, J. (Ed.)., Fifty Major Thinkers on Education : From Confucius to Dewey,
London and New York : Routledge, 2001.
Parliament of Singapore–SESSIONS. Retrieved from http://www.parliament. gov.
sg/publications-singapore-parliament-reports
Pejza, J. P., “The Catholic school principal : A different kind of leader”, Paper presented
at the Annual Meeting of the National Catholic Educational Association,
St. Louis, MO, 1985.
Seeley, D. S., “Visionary Leaders for Reforming Public Schools”, Paper presented at the
Annual Meeting of the American Educational Research Association, San
Francisco, CA, April 1992.
Sergiovanni, T. J., “The leadership needed for quality schools” in T. J. Sergiovanni and
J. H. Moore (Eds.), Schooling for Tomorrow : Directing Reforms to Issues That
Count, Boston : Allyn and Bacon, 1989, pp. 213-226.
Sergiovanni, T. J., “Adding value to leadership gets extraordinary results”,
Educational Leadership, 47(8), 1990, 23-27.
Shannon, G. S. and P. Bylsma, Nine Characteristics of High-Performing Schools,
Olympia, WA: Office of Superintendent of Public, 2007.
Sharpe, L. and S. Gopinathan, “After effectiveness: New directions in the Singapore
school system”, Journal of Educational Policy Study, 17(2), 2002, pp. 151-166.
Education for the 21st Century : The Singapore Context 77
Sirotnik, K. A., Renewing Schools & Teacher Education : An Odyssey In Educational
Change, Washington, DC : AACTE Publication,2001, p. 28. Program folder.
SOCIALBAKERS. Retrieved from http://www.socialbakers.com/facebook-
statistics/singapore (May 2012)
Stamford, T., Minute by Sir T.S. Raffles on the establishment of a Malay College at
Singapore Raffles, Thomas Stamford, Sir, 2009, pp. 1781-1826.
Wasley, P. A., Teachers Who Lead : The Rhetoric of Reform and the Realities of
Practice, New York : Teachers College Press, 1991.
Waterman, R., The Renewal Factor : How The Best Get And Keep The Competitive
Edge, New York : Bantam Books, 1998.
Waugh, R. F. & Punch, K. F., “Teacher receptivity to systemwide change in the
implementation stage”, Review of Educational Research, 57(3), 1987, 237-254.
Young, J. R. “A new take on what today’s students want from college”, Chronicle of
Higher Education, 49(21), A37, Jan. 31, 2003. ê
78 Marc Jonet
Article Received on February 03, 2015; Accepted on March 12, 2015
5
The Efficiency of John Dewey’s Teaching
Method in relation to Tourism
and Leisure
Abbas Ardekanian* and Abbas Hassani**
This paper is an attempt to analyze the efficiency of John Dewey’s teaching method in relating
to tourism and leisure. It has been shown that John Dewey’s teaching method can be used for
teaching leisure and tourism courses, because it is based on such important elements like thinking,
flexibility, thoroughness, profoundness, responsibility and change. As the subjects of tourism and
leisure courses are very varied and expanded, Dewey’s teaching method could provide effectiveness
and coherence in the students’ learnt matters because it consists of elements like realism,
responsibility, activeness, research and stimulation.
[Keywords : Teaching method, Tourism and leisure, Efficacy, Reflective
thinking, Reflective experiences]
Certainly the teaching method is very important in education and has a
great effectiveness in learning process. In other words, using an appropriate
teaching method helps the students not only to acquire information, thoughts,
and skills, but also helps them to profit from these treasures to develop their
social skills and to deepen their understanding of environment and themselves
too.
In the courses concerning tourism and leisure, using effective teaching
methods is even more important, because the nature of these courses not only
relates them directly to varied subjects, but also associates them with social,
CONTEMPORARY SOCIAL SCIENCES, Vol. 24, Number 1 (January-March), 2015
* Department of Education, Islamic Azad University, Boushehr Branch (Iran) E-mail:<[email protected]>
** Head, Department of Leisure and Tourism, Tourism Institute of Molavi (Iran) E-mail:<[email protected]>
ecological, historical, artistic, cultural and international changes. Thus, the
correct and comprehensive teaching methods must be used to arrive at a good
result in the important fact of education. The teaching methods containing
practical and theoretical procedures help the students to attain an organized
cognition of unknown facts. The expanding and varied subjects are the main
characters of tourism and leisure courses. And for teaching them effectively and
coherently, it is necessary to explore the principles and structures of appropriate
teaching methods and profit them to design appropriate teaching methods for
tourism and leisure. Practical aspect is one of the most important points in
designing teaching methods, but the practical aspect is based itself on a
theoretical fundamental.
John Dewey’s teaching method can be used for teaching leisure and
tourism courses, because it is based on such important elements like thinking,
flexibility, thoroughness, profoundness, responsibility and change.
Considering the mentioned points, the intention of the authors of present
paper is to take the attention of the individuals who are responsible in tourism
and leisure education, to the suitability of Dewey’s teaching method for tourism
and leisure. Surely applying his method in courses concerning tourism and
leisure will develop the student thinking and innovation, and this way an
effective step in teaching these courses could be taken.
John Dewey, American pragmatic philosopher and educator, according to
himself, is an instrumentalist. He thinks knowledge is the result of research. The
research method and its different steps in Dewey’s view are the different steps of
reflective thinking and reflective experience. The research method and its steps
are the steps of reflective thinking and experience. And reflective thinking can be
defined as active, careful and continuous examination of each idea or every
imaginative form of knowledge that leads to practical results, and this kind of
thinking and experience occur only in the atmosphere that exist an interaction
between the individual and his environment
Reflective thinking and experience is the base of Dewey’s educational
theory. Reflective thinking that in fact is his educational theory, according to
Dewey occurs in a reflective experience framework and situation. Dewey says:
education is from experience, by experience and for experience. But emphasis
only on experience is not enough, the quality of experience is very important too.
According to Dewey, reflective experience consists of two principles: affinity and
bilateral impact. The affinity principle of experience means every experience is
80 Abbas Ardekanian and Abbas Hassani
connected to other experiences, and continues in the later experiences. From
educational point of view every experience that is connected to other experiences
and makes other experiences possible, is more important. Thus the experience
that stimulates experiencing the other new experiences is a good experience and
the experience that makes the students dislike the other new experiences, is a bad
experience, because it prevents them from new experiences and in result
prevents their development.
Therefore, it is clear that the affinity principle of experience is attached to
the previous experiences but it is not separated from the later experiences either.
According to this principle every experience must be such an experience that gets
the student ready for future experiences.
The bilateral principle of experience also means every experience gainer
influences the environment at the same time that the environment influences
him; on the other hand every experience contains both internal and external facts.
The contact between these facts is called situation, hence according to bilateral
principle of experience, Dewey says:
This sentence that the individuals live in a unique world means they live in
series of situations. It means that they have bilateral relation with other
individuals and other things. The terms of situations and bilateral impact are
inseparables. Therefore it can be concluded that reflective thinking also begins
always by experiencing certain situations and in fact the reflective thinking is the
reflections of these situations.
One of the conclusions that Dewey draws from the unstable and changing
state of situations, is that, as it is not possible to foresee the future problems and
situations, then presenting any total solution to the students is impossible too.
Thus instead of presenting any problem and finding solution for it, we must
develop his problem solving ability. For this purpose the student must confront
with the problem himself and solve it by his proper effort, because as it was said
before, thinking process occurs in the situations that make problems.
In Dewey’s point of view learning is the behavior change caused by
experience, or, on the other hand it is the very reflective thinking and the best
way to develop it, is using scientific research method that the student must use it
himself. The student must use the same method that a researcher or a scientist
uses for finding a response for his problem.
The different steps that he follows are :
The Efficiency of John Dewey’s Teaching Method 81
1. At first he confronts with an ambiguous situation.
2. He asks himself precise questions about the problem.
3. He gathers information concerning the problem.
4. Profiting from the gathered information he tries to find a solution for his
problem.
5. Finally he tries to examine and evaluate his response.
For example: we imagine we want to teach a subject like religious tourism
in consumer behavior in tourism. According to Dewey’s teaching method, at
first, the student encounters with an ambiguous situation. Then he asks himself
some questions like: What is religious tourism? What are the particularities of a
religious atmosphere? What does the religious tourist look for? To find responses
for his questions he tries to search for and to gather information. After referring
to books and other documents, when the needed information was gathered,
perhaps he tries to experience himself he situation of a religious tourist,
according to the same questions that he has in mind. Or he ties to meet some
religious tourists in different places to ask them some questions concerning their
experiences. At last he finds responses for his questions using his experiences
and the obtained information. But the experience obtained from this situation
will certainly open the way for other experiences, because the student
experiences the total atmosphere that a religious tourist lives in. Perhaps this
experience leads the student to the conclusions like: to produce a total religious
atmosphere, isn’t it necessary the driver of the religious tourists’ bus be religious
too, or isn’t it necessary that a spiritual atmosphere dominates the bus, and isn’t it
necessary that the meals and the whole group be religious? This experience links
to the student’s previous experiences in his mind and prepares the ground for
new experiences. As the student can’t foresee the future, this experience will help
him to use his creativity and innovation to arrive at new experiences, confronting
the future situations. Therefore instead of presenting and solving certain
problems for the student, we try to develop his ability to solve the problems, so
that confronting the problems, could be able to use his creativity to solve the
encountered problems, because as it was told before, thinking process develops
in the situations that make problems.
Thus, it can be concluded that teaching process is planning and providing
reflective thinking and reflective experiences which lead the student to an ideal
learning.
82 Abbas Ardekanian and Abbas Hassani
As the environment is always in change and variation, the individual must
always put himself in new positions of thinking and experience so as to confront
with imbalance, caused by the changing environment. Therefore in such
situations a student reconstructs continuously his experiences to arrive at better
new experiences to lead him toward a better development. The process and
continuity of these reconstruction and organization are so that it could be
considered as an education process. By applying Dewey’s teaching method in a
reflective thinking and reflective experience, teaching process will take a research
form and the class will change to a research class, and the books and textbooks
become as research documents. In result the educational center will become a
research centre that the teacher’s role will be just leading the research process.
The reflective thinking and in result of it, the reflective experience are
interconnected matters that between them there are connection and succession.
The succession and connection between different steps of reflective thinking and
reflective experience are such important that we must prevent from any
separation among them, and at the same time it is necessary to prevent any
mixture between the steps too.
In these succession and connection every step originates from the previous
step and result in the later one. Concerning this point Dewey writes : Teaching art
must consist of unity, coherence, innovation and flexibility to arrive to an end like
every pure artistic work.
Therefore, in Dewey’s teaching method, organizing of learning contexts
and activities is so that the presented subjects mustn’t be separated from each
other, and the different steps must consist of necessary unity and coherence. In
other words, in his method every step depends on the previous step and is the
base and fundamental of later one. Thus the educational activities are leaded so
that the present experiences and course subjects be in relation with future
experiences and subjects, and teaching process mustn’t take an incoherent and
inhomogeneous form, because if not, the student will feel that the teaching
process has not the necessary coherence and affinity. And this feeling will spoil
the student confidence in teaching method and in result causes discordance in his
mind. Perhaps respecting the coherence and affinity in leisure and tourism
varied course subjects could be compared to a precious finely-woven carpet. As
the varied details of such a carpet are in deep and close relationship with each
other and with the total plan of the carpet, the different subjects of tourism and
leisure courses must also be related together to establish similar connection and
coherence in the student’s mind.
The Efficiency of John Dewey’s Teaching Method 83
Such a concept that originates from reflective thinking not only causes
more development in the student’s thinking, but also develops their aesthetic
conception in an ideal form, because such an artistic plan of teaching will
eliminate both teacher’s and student’s tiredness and will multiple their
motivation.
Therefore, the knowledge obtained by research and exploration in
reflective thinking method, replaces the knowledge obtained from ready-made
subjects, in result with the oldness of subjects and thoughts, the thinking ability
will not decline, on the contrary, day by day it will become more effective, more
productive and more innovative.
In conclusion, considering the reflective thinking particularities, the course
plan, consisting of coherence and continuity principles must possess an artistic
structure too, because it is necessary for coordination between work and
recreation. Co-ordination is necessary to establish balance and interaction
between purposefulness and playfulness of teaching process. In this way as the
important fact of teaching begins with thinking and research, it will have such an
attraction that in later steps also will result in thinking and research.
As the subjects of tourism and leisure courses are very varied and
expanded, Dewey’s teaching method could provide effectiveness and coherence
in the students’ learnt matters because it consists of elements like realism,
responsibility, activeness, research and stimulation.
References
1. John Dewey, How We Think, New York : D.C. Heath and Company, 1933 (1910).
2. John Dewey, The School and Society, London : The University of Chicago Press,
1990 (1900).
3. John Dewey, The Child and the Curriculum, London : The University of Chicago
Press, 1990 (1902).
4. W. F. Connell, A History of Education in the Twentieth Century World,
Canberra, Australia : Curriculum Development Centre, 1980.
5. Mir Abdel Hussein Naghibzadeh, Philosophy of Education, Tehran : Tahoori
Press, 2007 (1979) ê
84 Abbas Ardekanian and Abbas Hassani
Article Received on February 08, 2015; Accepted on March 18, 2015
6
Public Administration in Terms of
Productivity and Efficiency : Innovative
Practices in Service Delivery
V. Rama Krishna*, R. Shashidhar** and Muniraju M.***
The present study will be carried out with some specific objectives like public administration
efficiency and its productivity; to impart with consonance of philosophy of state; to probe into the
conceptual deficiencies of productivity and efficiency in public administration etc. will be studied
within the political independence which has envisaged for India a socialist economy, the
responsibility for which in terms of planning, resource mobilization and implementation. Further,
the paper explores that, it is a well-known fact an average probationer of the Indian Administrative
Service has hardly exhibited an abiding interest, in the acquisition of more knowledge as a
precondition for serving society. Finally the paper concludes highlighting administration should
evolve its agricultural and industrial policies on the principle of fairness both to labour and
management. A political executive developed in the art of statesmanship will be a valuable asset to
administration in democratizing its own management in order that the public sector may overcome
its inhibition to adopt measures aimed at enhancing the productivity of labour in the tune with the
time and in consonance with the philosophy of the state. Considering all the above aspects the paper
will conclude training and education needs should be addressed to ensure optimum levels of
performance and motivated employees and it matters influences the entire country and referred to
this issue by academia and administrators. The improvement of these issues will not only produce
CONTEMPORARY SOCIAL SCIENCES, Vol. 24, Number 1 (January-March), 2015
* Assistant Professor, Department of Political Science, Tumkur University, Tumkur,Karnataka (India) E-mail: <[email protected]>
** Assistant Professor, Department of Studies & Research in Business Administration,Tumkur University, Tumkur, Karnataka (India) E-mail: <[email protected]>
*** Assistant Professor, Department of Economics, Tumkur University, Tumkur, Karnataka(India) E-mail: <[email protected]>
happier and more productive employees, employees morale, employees efficiency but would probably
also lead to cost reduction and savings in the entire public sector of this country.
[Keywords : Efficiency, Morale, Public Private Partnership, Civil Service,
Service Delivery]
From a purely technical point of view, a bureaucracy is capable of attaining the highest degree of
efficiency, and is in this sense formally the most rational known means of exercising authority over
human beings. It is superior to any other form in precision, in stability, in the stringency of its
discipline, and in its reliability. It thus makes possible a particularly high degree of calculability of
results for the heads of the organization and for those acting in relation to it. It is finally superior both in
intensive efficiency and in the scope of its operations and is formally capable of application to all kinds of
administrative tasks. —Max Weber
The key problems in public administration—legality—and public management— efficiency—refer to
contractual difficulties between the principal and the agent, resulting from incentives, asymmetric
information and incomplete contracts. —Jan-Erik Lane
1. Introduction
As a relatively new and applied field, public administration is constantly
adapting to changing socio-political and economic conditions, and as a result is
not easy to classify. The most popular approach to teaching public
administration theory is to trace its evolution throughout time, putting different
theories in their historical context. The pursuit of effective public sector
administration may be explained as a series of ideas, each representing a step, or
increment, towards a complete theory of public administration. Viewed over
time, they have helped build a substantial reservoir of knowledge.
Public Administration as independent Subject of a social science has recent
origin. Traditionally Public Administration was considered as a part of political
science. But in Modern age the nature of state underwent change and it became
from police stale to social service state. As a consequence, the Public
Administration, irrespective of the nature of the political system, has become the
dominant factor of life. The modern political system is essentially ‘bureaucratic’
and characterized by the rule of officials. Hence modern democracy has been
described as ‘executive democracy’ or ‘bureaucratic democracy’. The
administrative branch, described as civil service or bureaucracy is the most
significant component of governmental machinery of the state.
86 V. Rama Krishna, R. Shashidhar and Muniraju M.
As an intellectual enterprise, public administration has reached a point of
radical departure from its own past. Public Administration’s Eighty Years in a
Quandary Public administration’s development as an academic field may be
conceived as a succession of four overlapping paradigms. As Robert T.
Golembiewski has noted in a perceptive essay on the evolution of the field, each
phase may be characterized according to whether it has “locus” or “focus.” Locus
is the institutional “where” of the field. A recurring locus of public
administration is the government bureaucracy, but this has not always been the
case and often this traditional locus has been blurred. Focus is the specialized
“what” of the field. One focus of public administration has been the study of
certain “principles of administration,” but, again, the foci of the discipline have
altered with the changing paradigms of public administration. As Golembiewski
observes, the paradigms of public administration may be understood in terms of
locus or focus; when one has been relatively sharply defined, the other has been
relatively ignored in academic circles and vice-versa. We shall use the notion of
loci and foci in reviewing the intellectual development of public administration
[1, p. 386].
2. The Measures of Efficiency and Efficiency Promotes
There is no accepted or reliable way of measuring the relative efficiency of
the public sector [2]. This problem is acknowledged internationally and is a
crucial factor when considering alternatives to the existing Efficiency Dividend
or how to encourage efficiency more broadly. Some of the main obstacles to
measuring public sector efficiency are the difficulty of accounting for changes in
quality and lack of a market price for many public sector outputs. Bench-marking
of common functions and services offers some opportunity to develop better
measures of efficiency. Many agencies consulted during the review noted the
value of bench-marking services or activities common to a group of agencies as a
way of encouraging efficiency through sharing information about best practice.
The review proposes that the bench-marking of common functions be pursued in
a more coordinated manner. This is a difficult but necessary task, since the
devolved nature of the Australian Government has over time led agencies to
develop different business systems and processes.
Public Administration in Terms of Productivity and Efficiency 87
Overall, the review found that agencies were pursuing efficiency as a
matter of necessity, so that they can continue to improve services, retain and
attract staff, manage the impact of the Efficiency Dividend, accommodate general
increases in costs, and respond to emerging ministerial priorities. Although
departmental outlays have grown in real terms since 2000–01, agencies argued
that growth in actual workloads has been higher still. The review notes that
generally agencies have flexibility in terms of their outputs and outcomes—in
particular, in policy, coordination and research areas. In the public sector this
means managers tend to maximize the quality of outputs for a given price, rather
than reducing the price for a given output, as is more likely to occur in the private
sector. Given this paradigm, an external mechanism is required if a reduction in
the cost of a output is the desired outcome.
3. Reviews
Public Administration and Management has an admirable clarity of its
arguments in the third edition volume on ‘Public Management and
Administration: An Introduction.’ [3, p. 3-6]. It does not suffer from the
limitations of country-specific studies, treating the NPM as an international
phenomenon. The new public administration in recent years there has been a
transformation in the management of the public sector. The rigid, bureaucratic
form of public administration which dominated for most of the 20th century has
been replaced by a flexible, market-based form of public management. Public
Management and Administration introduces and assesses the principles and
theories underlying changes in the management of the public sector.
Systematically revised and updated throughout, the third edition of this highly
successful text includes an entirely new chapter on the impact of e-governance
and expanded coverage of financial and performance management.
It is important to discuss theories and tenets of public administration from
the viewpoint of their impact on the development of the field, the rhetoric that
justified their embrace by the public, and the factors that shaped them. For this
reason we find it useful to present five great ideas that shaped the field,
combining their historical importance and theoretical distinctiveness. Public
administration is a subject of human inquiry with ancient roots. Contrary to
present practice, the ancients were preoccupied with governance of public affairs
as opposed to business, and very often, as in Greece, had disdain for commerce
88 V. Rama Krishna, R. Shashidhar and Muniraju M.
and management of business enterprise. Ancient empires created elaborate state
structures, and effectively operated an apparatus overseeing huge territories [4].
China gave the world the first civil service system some two thousand years ago,
while the Roman Empire set the structures of governance (e.g., the organization
of the executive branch into five main agencies) that many modern European
states borrowed in their development [5].
The study and systematic development of public administration in
America, however, is only scarcely more than a century-old phenomenon [6, p.
145]. It is a field of study that continuously adapts-both in practice and theory-to
the changing nature of the government in the twentieth century. Public
administration is often characterized as an application of social and other
sciences to public problems, thus bridging disciplines. Constantly trying to
define itself, public administration draws from multiple sources, with an effort to
reconcile often contradicting views.
During the evolution of American public administration, these questions
were often framed through public discourse in a much simpler, sharper and
sometimes conflicting pattern, often rejecting an established mentality or casting
it in dichotomous terms (i.e., administration is different from politics, public
management is different from private management), and often used as powerful
rhetoric to advance the development of the field [7, p. 225].
4. Innovation and New Forms of Public Administration
The ideas and practice of the NPM produced increased efficiency and
during the period of their dominance overall increases in productivity
‘externalities’ were significant. New forms of disadvantage arose, however, and
many discourses were excluded from the policy and management arena [8]. In
this article we concentrate on the exclusion and revival of ideas and practices
from community knowledge [9, p. 16]. This knowledge is re-emerging not just in
the public administration literature but also in economics’ ‘cluster theory’ [10]
and in geography’s new regionalism [11]. Essentially these theories all have a
focus on the significance of local area networks and their dynamic contribution to
innovation, wellbeing and prosperity. The key factors at play include local
leadership; institutional capacity; trust relations; the significance of history and
narratives; local area data; network relations and recognition of interdependence
between the worlds of social, economic, natural and human capital. These
Public Administration in Terms of Productivity and Efficiency 89
changes are not sweeping away the NPM nor are they likely to. Instead they are
being grafted onto the NPM ideas and instruments. A straightforward example
of this grafting is seen in the shift from contracts to Public Private Partnerships
where the shell of NPM is seen in the use of the contract but the elements of social
value may also be factored in.
Do such narratives of new concepts and practices in public administration
provide evidence for the emergence of a new paradigm? We’re not sure and
certainly much more comparative and international work is needed to determine
the extent to which this might be the case. At the very least, however, our
experience in Victoria of the move to balance the NPM ideas and instruments
shows social factors coming strongly back into public policy and management.
5. Conclusion
It is difficult to measure efficiency in the public sector, particularly because
of the problems associated with measuring changes in quality and outputs of
public administration. The ‘productivity gains in the public sector are very
difficult if not impossible to measure’. This poses a major obstacle to developing
a budget process that focuses on inefficiency. The problem also prevents us from
determining objectively what a suitable Efficiency Dividend rate should be. An
efficiency agenda that aims to engender substantial change should form part of a
long-term fiscal strategy: it would help place the Governments in a position
where it can respond flexibly to emerging priorities and manage budgetary
pressures. It is important to strike the right balance between necessity that
encourages efficiency and the re-sourcing that allows agencies to perform
effectively.
In practice the experience of moving to some of these new practices in
public administration has had both radical and conservative aspects. In terms of
the latter much of the new practice has been an overlay of gains built up during
the period of NPM. In this vein it may be seen as a re-balancing of the sources of
knowledge relevant to public management. The ‘resistant discourse’ of
community re-entering a domain dominated by market and bureaucratic
discourses.
A more radical interpretation would focus on the implications this
re-balancing has had for our understanding of how policy happens and therefore
for the skills and instruments it requires. Some of those involved in particular
90 V. Rama Krishna, R. Shashidhar and Muniraju M.
aspects of the move towards the new practices we have called ‘community
governance’ report that it ‘introduces conflict, heterogeneity and unpredicta-
bility into decision-making processes and challenges government and its
agencies to be less rigid and more adaptive.’ Our own view is that the new
practices are based on types of knowledge which have not historically been part
of public administration and for this reason it is driving forms of public
management innovation which may prove to constitute a new administrative
paradigm. Here the economic, social and human capital objectives are entwined;
distributive leadership is seen to be at work; local knowledge comes to the fore to
co-produce social and economic benefits simultaneously; networks are the
agency for action; and the reciprocal relations between participants create bonds
that foster creativity and competitive advantage. In short the endowments from
all forms of capital become interdependent instruments of policy making and
implementation. Understanding the relations between these factors and the
implications they have for public management- its knowledge frames, structures,
instruments and skills-is the challenge.
References
[1] Nicholas Henry., “Paradigms of Public Administration”, Public Administration
Review, Vol. 35, No. 4 July–August, 1975, American Society for Public
Administration, Wiley – Blackwell, 1975, 378-386
[2] Commonwealth of Australia., Review of the Measures of Agency Efficiency
Report, Commonwealth of Australia, Department of Finance and Deregulation,
Creative Commons Attribution 3.0, 2011, Australia.
[3] Owen E. Hughes., Public Management and Administration : An Introduction,
(3 ed.), Palgrave Macmillan, 2003, 3-6.
[4] Marc Holzer; Vatche Gabrielian., Five Great Ideas in American Public
Administration, What Is Public Administration; Part-1, 2003, Marcel Dekker,
Inc., Rutgers University, 2003.
[5] Wren, Daniel A., The Evolution of Management Thought, (4 ed.), New York :
Wiley, 1994.
[6] Frederickson, H. G., “The Lineage of New Public Administration”,
Administration and Society, 8, 1976, 144-174.
Public Administration in Terms of Productivity and Efficiency 91
[7] Roberts, Alasdair, “Demonstrating Neutrality: The Rockfeller Philanthropies
and the Evolution of Public Administration”, Public Administration Review, 54
(May-June 1994), 221-228.
[8] Michael Hess and David Adams, “Innovation in Public Management: the role
and function of community knowledge”, The Innovation Journal : The Public
Sector Innovation Journal, Volume 12(1), 2007, article 2.
[9] Porter, M., “Location, Competition and Economic Development: Local Clusters
in a Global Economy”, Economic Development Quarterly, 14(1), 2000, 15-34.
[10] Florida, R., The Rise of the Innovative Class, North Melbourne : Pluto Press,
2003.
[11] Cooke, P. and K. Morgan, The Associational Economy : Firms, Regions and
Innovation, Oxford: Oxford University Press, 1998. ê
92 V. Rama Krishna, R. Shashidhar and Muniraju M.
Article Received on January 28, 2015; Accepted on March 16, 2015
7
Human Resource Management in PSBs :
The Need of the Hour
Sarita Aggarwal*
Human resource management in the banks is indispensable as the bank is a service as well as
knowledge based industry, but the management of human resources has been neglected by the public
sector banks. The present paper is an attempt to explain the main issues which are concerned with the
management of human resources in public sector banks in the present era. It has been emphasized
that the banks need to attract right talent and take a holistic employee cycle approach to develop
human capital. Banks should have a proactive and transparent placement policy in order to provide
smooth flow of human resources to deficit areas, optimize human resource utilization, provide varied
work exposure to its employees, achieve cost effectiveness and minimize hardship to employees.
[Keywords : Human resource management, Banking sector, Recruitment
policy, Compensation policy, Reskilling]
1. Introduction
The liberalization, privatization, globalization wave sweeping through the
Indian economy has changed all the sectors of the economy particularly the
banking sector. In today’s volatile, uncertain, complex and ambiguous times, the
human resource needs of the organizations have changed drastically. The
management of human resources has become a challenging task. The
management of risk today is closely intertwined with the quality and
management of the people. The management of men is getting increasing
attention in the present era due to the advancement in telecommunications,
synthesis of information and advanced computer technology. The role of the
CONTEMPORARY SOCIAL SCIENCES, Vol. 24, Number 1 (January-March), 2015
* Associate Professor, K.L.S.D. College, Subhash Nagar, Daresi, Ludhiana, Punjab (India))E-mail: <[email protected]>
employees has changed. The competent and committed employees can improve
the operational efficiency of the banking sector, strengthen the financial health of
the banks and can help the banks to meet the challenges ahead. The human
resource management involves preparation of proper life cycle approach for the
employees i.e from recruitment to retirement. Human resource management in
the banks is indispensable as the bank is a service as well as knowledge based
industry, but the management of human resources has been neglected by the
public sector banks. The following are the main issues which are concerned with
the management of human resources in public sector banks in the present era:
1.1 Challenges going to be faced due to the opening up of Banking Sector
The global scenario is changing rapidly and the concept of global village is
coming into prominence. It means opening up of the banking sector to internal as
well as foreign players. In that case there will be a huge demand for experienced
talent as the new players would need people, who can start off the job right from
day one, the resultant impact would be a huge raid on talent especially from the
old generation private sector banks as well as the New generation private sector
banks to public sector banks.
1.2 Recruitment Policy
Banks require fit and suitable people. In their search, banks have been
visiting top universities and B-schools for recruitment mostly as ‘Specialists’ in
HR, Finance and Marketing etc. Most of these institutions are situated in metro
towns and cities and their students have a bias to work only in metropolitan
towns and capital cities. The majority of the students perceive a job in a bank as a
desk job in air-conditioned offices. Marketing assignment and rural postings are
looked down upon and such offers have either been rejected or officers start
looking for lateral movements soon after their joining. The recruitment process
should be modified in a manner that it is successful in getting the right people for
the right jobs. PSBs could adopt innovative and different hiring avenues, given
their existing compensation structure. The hiring norms in banking sector have
changed drastically in the present millennium. The scores of CIBIL (Credit
Information Bureau Ltd.) are checked as a part of pre-employment screening
process by private sector banks. Some private sector players are doing this only
for some positions viz compliance and governance roles, client facing and other
sensitive roles in the organization while others are doing it for all the jobs. The
players in the public sector also need to follow the same practice.
94 Sarita Aggarwal
1.3 Lateral Recruitment
The other serious challenge in the times to come will be the threat of lateral
hiring by public sector banks. With the increase in complexities in the banking
operations, there is an emerging need for skilled personnel for various critical
functions. PSBs are finding it increasingly difficult to recruit highly skilled
personnel at the existing levels of remunerations. Lateral recruitment has helped
PSBs to attract talent and provide opportunities for their growth and contribute
towards the growth of the organization. As already qualified personnel are
available so there is no need for extensive training. As per the Khandelwal
Committee recommendations, the public sector undertakings are going to face a
serious resource crunch to support their expansion plans as they will be facing
massive retirements in the coming years. Almost all the public sector banks had
recruited a sizeable chunk of their workforce during the post nationalization
period. It has been reported that an estimated six lac people will be required to fill
in the talent requirements of public sector banks within the next 4-5 years. The
Khandelwal Committee had recommended that PSBs be allowed to go for lateral
hiring to address their talent requirements so as to bridge the gap arising due to
large scale retirements and to support their massive expansion plans. The public
sector banks will be hunting for both experienced as well as younger workforce
into their stream and the challenges to retain them will be enormous as most of
the experienced bankers belonging to old generation private sector banks will
move on to a culture which supports their upbringing i.e. to public sector banks.
Moreover public sector banks would have to go for massive resource
mobilization and create a talent pool to address the brain drain which they might
encounter in the coming years. The banks would be going in the lateral
recruitment of technical, specialized and managerial staff.
1.4 Multi-generation Engagement
One of the main characteristic of public sector banks is that they have wide
mix of people belonging to different age profiles. There are a large junk of people
who have been recently recruited and there are these veterans who have worked
with the institution for a pretty long period of time. Having this diverse mix of
people in their work environment poses both an opportunity as well as a threat.
The opportunity is that the younger resources can be trained and passed on the
knowledge of the senior functionaries and the threat is that both communities
have different value systems, work culture and addressing this generation gaps
due to value differences, culture differences is going to be a serious challenge
Human Resource Management in PSBs 95
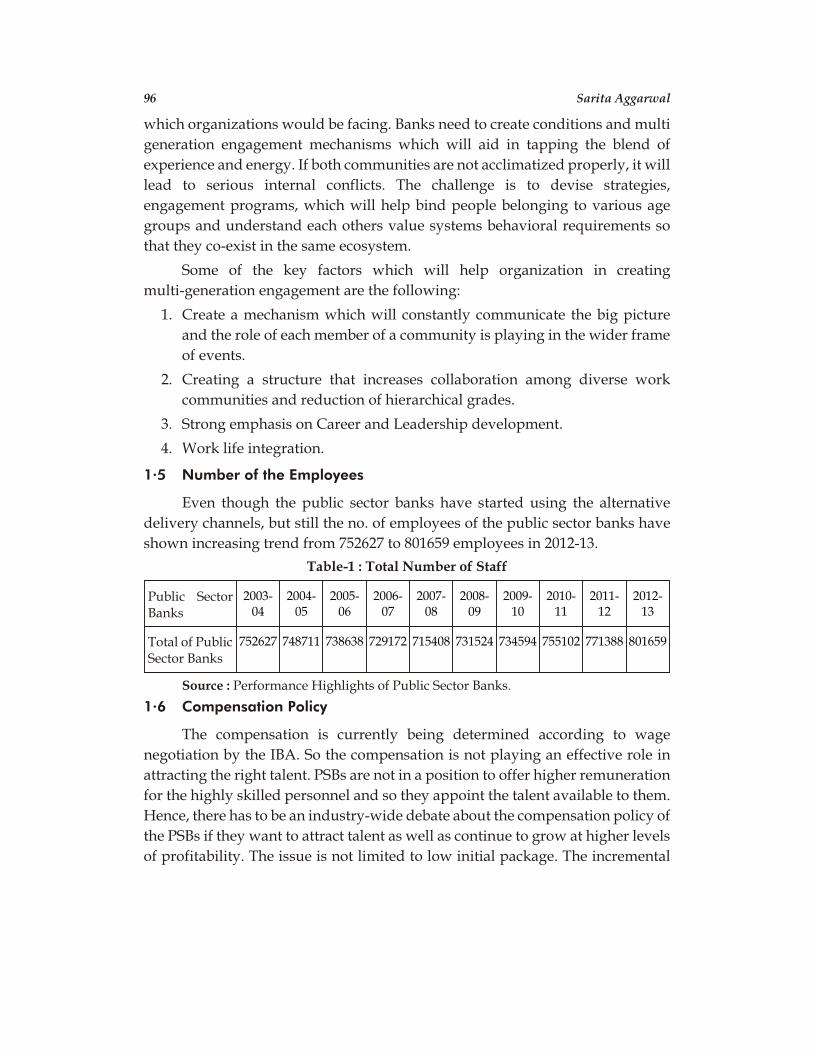
which organizations would be facing. Banks need to create conditions and multi
generation engagement mechanisms which will aid in tapping the blend of
experience and energy. If both communities are not acclimatized properly, it will
lead to serious internal conflicts. The challenge is to devise strategies,
engagement programs, which will help bind people belonging to various age
groups and understand each others value systems behavioral requirements so
that they co-exist in the same ecosystem.
Some of the key factors which will help organization in creating
multi-generation engagement are the following:
1. Create a mechanism which will constantly communicate the big picture
and the role of each member of a community is playing in the wider frame
of events.
2. Creating a structure that increases collaboration among diverse work
communities and reduction of hierarchical grades.
3. Strong emphasis on Career and Leadership development.
4. Work life integration.
1.5 Number of the Employees
Even though the public sector banks have started using the alternative
delivery channels, but still the no. of employees of the public sector banks have
shown increasing trend from 752627 to 801659 employees in 2012-13.
Table-1 : Total Number of Staff
Public SectorBanks
2003-04
2004-05
2005-06
2006-07
2007-08
2008-09
2009-10
2010-11
2011-12
2012-13
Total of Public Sector Banks
752627 748711 738638 729172 715408 731524 734594 755102 771388 801659
Source : Performance Highlights of Public Sector Banks.
1.6 Compensation Policy
The compensation is currently being determined according to wage
negotiation by the IBA. So the compensation is not playing an effective role in
attracting the right talent. PSBs are not in a position to offer higher remuneration
for the highly skilled personnel and so they appoint the talent available to them.
Hence, there has to be an industry-wide debate about the compensation policy of
the PSBs if they want to attract talent as well as continue to grow at higher levels
of profitability. The issue is not limited to low initial package. The incremental
96 Sarita Aggarwal
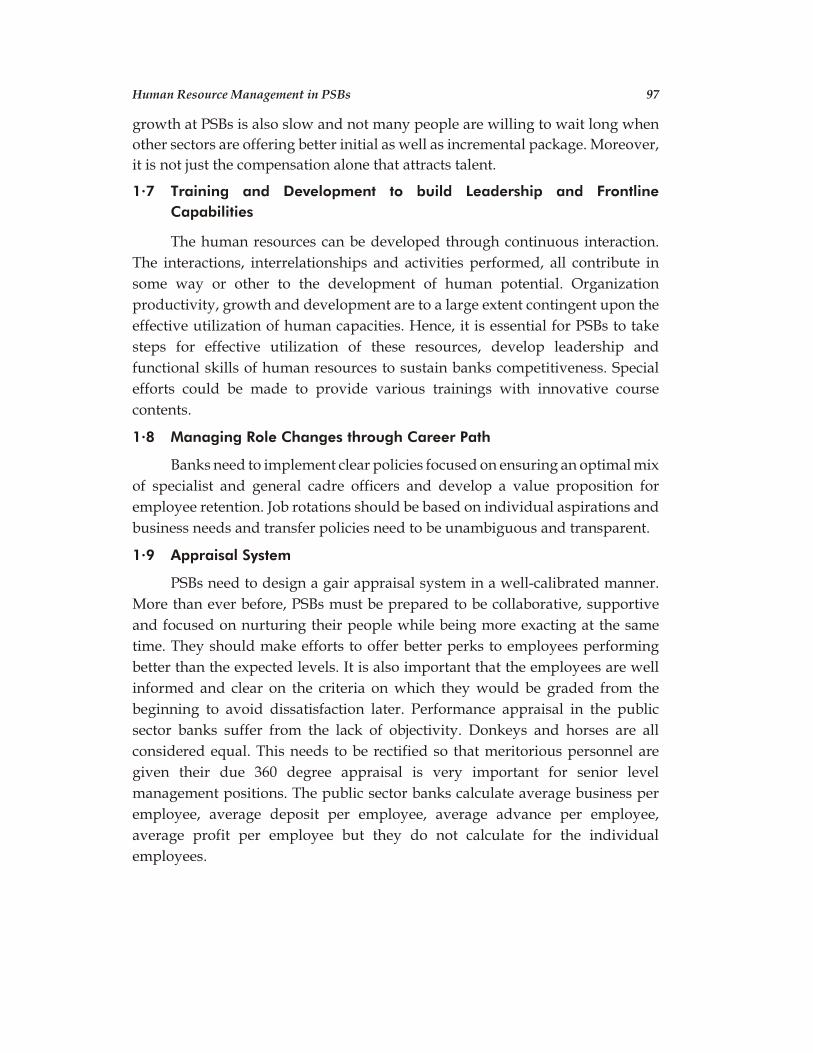
growth at PSBs is also slow and not many people are willing to wait long when
other sectors are offering better initial as well as incremental package. Moreover,
it is not just the compensation alone that attracts talent.
1.7 Training and Development to build Leadership and Frontline
Capabilities
The human resources can be developed through continuous interaction.
The interactions, interrelationships and activities performed, all contribute in
some way or other to the development of human potential. Organization
productivity, growth and development are to a large extent contingent upon the
effective utilization of human capacities. Hence, it is essential for PSBs to take
steps for effective utilization of these resources, develop leadership and
functional skills of human resources to sustain banks competitiveness. Special
efforts could be made to provide various trainings with innovative course
contents.
1.8 Managing Role Changes through Career Path
Banks need to implement clear policies focused on ensuring an optimal mix
of specialist and general cadre officers and develop a value proposition for
employee retention. Job rotations should be based on individual aspirations and
business needs and transfer policies need to be unambiguous and transparent.
1.9 Appraisal System
PSBs need to design a gair appraisal system in a well-calibrated manner.
More than ever before, PSBs must be prepared to be collaborative, supportive
and focused on nurturing their people while being more exacting at the same
time. They should make efforts to offer better perks to employees performing
better than the expected levels. It is also important that the employees are well
informed and clear on the criteria on which they would be graded from the
beginning to avoid dissatisfaction later. Performance appraisal in the public
sector banks suffer from the lack of objectivity. Donkeys and horses are all
considered equal. This needs to be rectified so that meritorious personnel are
given their due 360 degree appraisal is very important for senior level
management positions. The public sector banks calculate average business per
employee, average deposit per employee, average advance per employee,
average profit per employee but they do not calculate for the individual
employees.
Human Resource Management in PSBs 97
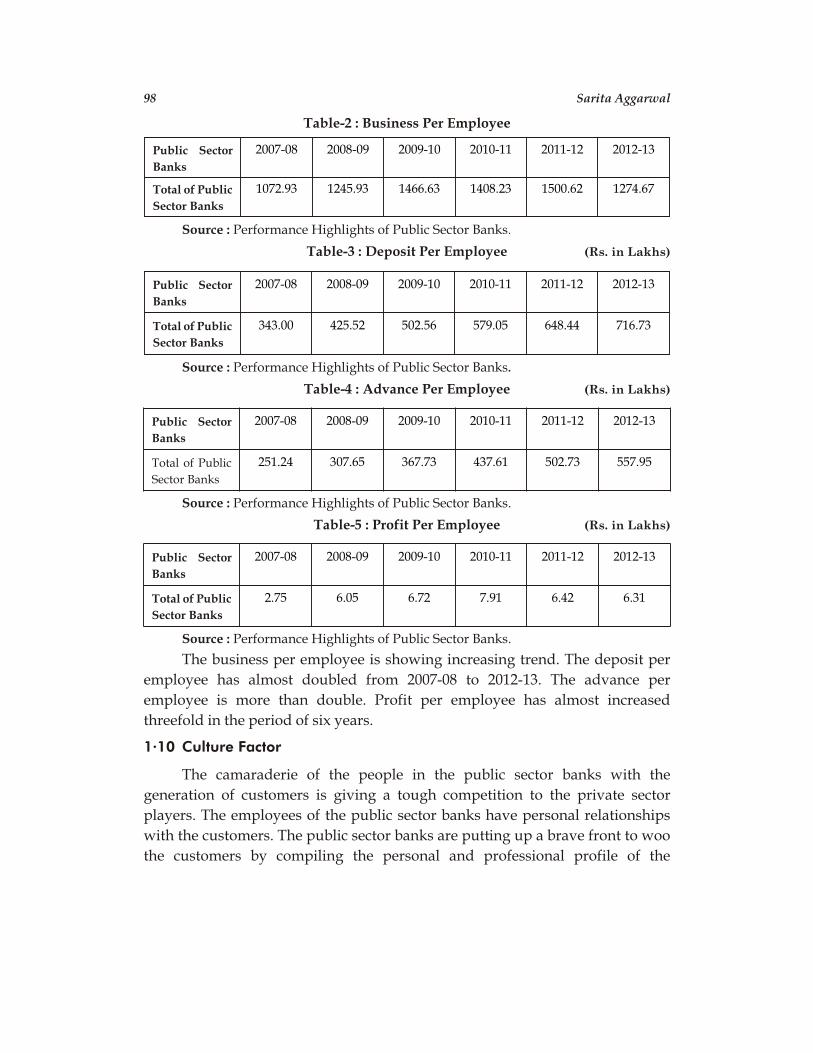
Table-2 : Business Per Employee
Public Sector
Banks
2007-08 2008-09 2009-10 2010-11 2011-12 2012-13
Total of Public
Sector Banks
1072.93 1245.93 1466.63 1408.23 1500.62 1274.67
Source : Performance Highlights of Public Sector Banks.
Table-3 : Deposit Per Employee (Rs. in Lakhs)
Public Sector
Banks
2007-08 2008-09 2009-10 2010-11 2011-12 2012-13
Total of Public
Sector Banks
343.00 425.52 502.56 579.05 648.44 716.73
Source : Performance Highlights of Public Sector Banks.
Table-4 : Advance Per Employee (Rs. in Lakhs)
Public Sector
Banks
2007-08 2008-09 2009-10 2010-11 2011-12 2012-13
Total of Public
Sector Banks
251.24 307.65 367.73 437.61 502.73 557.95
Source : Performance Highlights of Public Sector Banks.
Table-5 : Profit Per Employee (Rs. in Lakhs)
Public Sector
Banks
2007-08 2008-09 2009-10 2010-11 2011-12 2012-13
Total of Public
Sector Banks
2.75 6.05 6.72 7.91 6.42 6.31
Source : Performance Highlights of Public Sector Banks.
The business per employee is showing increasing trend. The deposit per
employee has almost doubled from 2007-08 to 2012-13. The advance per
employee is more than double. Profit per employee has almost increased
threefold in the period of six years.
1.10 Culture Factor
The camaraderie of the people in the public sector banks with the
generation of customers is giving a tough competition to the private sector
players. The employees of the public sector banks have personal relationships
with the customers. The public sector banks are putting up a brave front to woo
the customers by compiling the personal and professional profile of the
98 Sarita Aggarwal
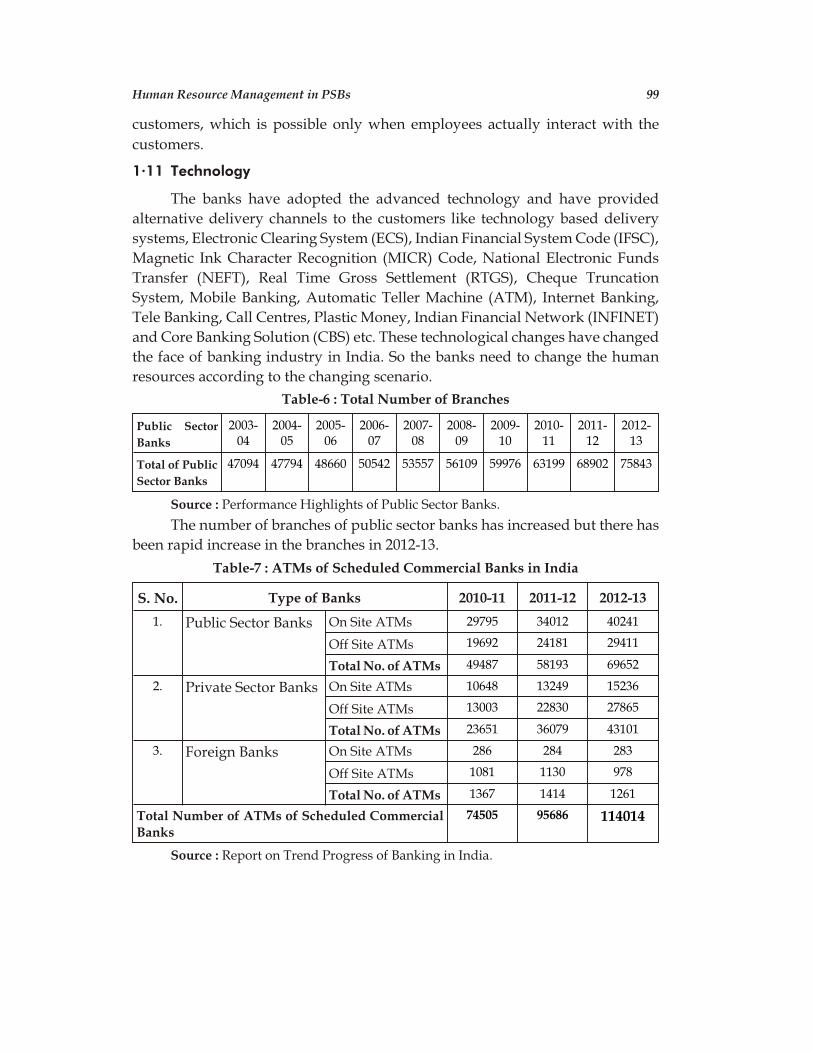
customers, which is possible only when employees actually interact with the
customers.
1.11 Technology
The banks have adopted the advanced technology and have provided
alternative delivery channels to the customers like technology based delivery
systems, Electronic Clearing System (ECS), Indian Financial System Code (IFSC),
Magnetic Ink Character Recognition (MICR) Code, National Electronic Funds
Transfer (NEFT), Real Time Gross Settlement (RTGS), Cheque Truncation
System, Mobile Banking, Automatic Teller Machine (ATM), Internet Banking,
Tele Banking, Call Centres, Plastic Money, Indian Financial Network (INFINET)
and Core Banking Solution (CBS) etc. These technological changes have changed
the face of banking industry in India. So the banks need to change the human
resources according to the changing scenario.
Table-6 : Total Number of Branches
Public Sector
Banks
2003-04
2004-05
2005-06
2006-07
2007-08
2008-09
2009-10
2010-11
2011-12
2012-13
Total of Public
Sector Banks
47094 47794 48660 50542 53557 56109 59976 63199 68902 75843
Source : Performance Highlights of Public Sector Banks.
The number of branches of public sector banks has increased but there has
been rapid increase in the branches in 2012-13.
Table-7 : ATMs of Scheduled Commercial Banks in India
S. No. Type of Banks 2010-11 2011-12 2012-13
1. Public Sector Banks On Site ATMs 29795 34012 40241
Off Site ATMs 19692 24181 29411
Total No. of ATMs 49487 58193 69652
2. Private Sector Banks On Site ATMs 10648 13249 15236
Off Site ATMs 13003 22830 27865
Total No. of ATMs 23651 36079 43101
3. Foreign Banks On Site ATMs 286 284 283
Off Site ATMs 1081 1130 978
Total No. of ATMs 1367 1414 1261
Total Number of ATMs of Scheduled CommercialBanks
74505 95686 114014
Source : Report on Trend Progress of Banking in India.
Human Resource Management in PSBs 99
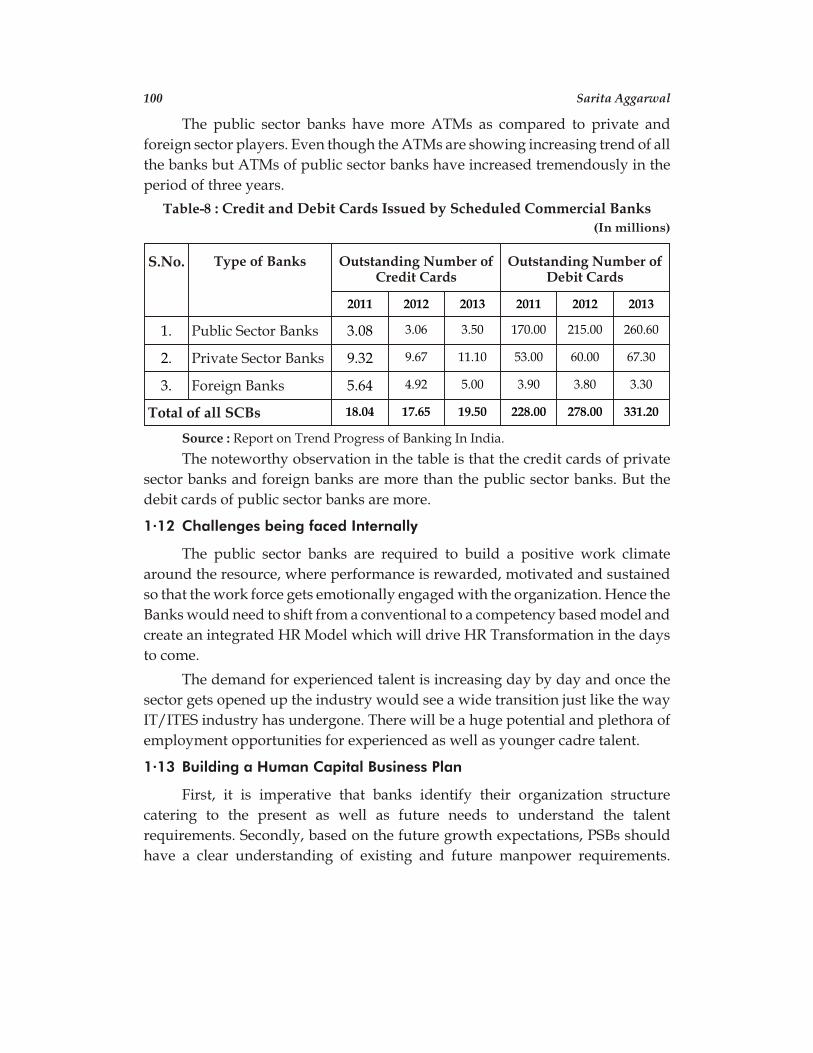
The public sector banks have more ATMs as compared to private and
foreign sector players. Even though the ATMs are showing increasing trend of all
the banks but ATMs of public sector banks have increased tremendously in the
period of three years.
Table-8 : Credit and Debit Cards Issued by Scheduled Commercial Banks
(In millions)
S.No. Type of Banks Outstanding Number ofCredit Cards
Outstanding Number ofDebit Cards
2011 2012 2013 2011 2012 2013
1. Public Sector Banks 3.08 3.06 3.50 170.00 215.00 260.60
2. Private Sector Banks 9.32 9.67 11.10 53.00 60.00 67.30
3. Foreign Banks 5.64 4.92 5.00 3.90 3.80 3.30
Total of all SCBs 18.04 17.65 19.50 228.00 278.00 331.20
Source : Report on Trend Progress of Banking In India.
The noteworthy observation in the table is that the credit cards of private
sector banks and foreign banks are more than the public sector banks. But the
debit cards of public sector banks are more.
1.12 Challenges being faced Internally
The public sector banks are required to build a positive work climate
around the resource, where performance is rewarded, motivated and sustained
so that the work force gets emotionally engaged with the organization. Hence the
Banks would need to shift from a conventional to a competency based model and
create an integrated HR Model which will drive HR Transformation in the days
to come.
The demand for experienced talent is increasing day by day and once the
sector gets opened up the industry would see a wide transition just like the way
IT/ITES industry has undergone. There will be a huge potential and plethora of
employment opportunities for experienced as well as younger cadre talent.
1.13 Building a Human Capital Business Plan
First, it is imperative that banks identify their organization structure
catering to the present as well as future needs to understand the talent
requirements. Secondly, based on the future growth expectations, PSBs should
have a clear understanding of existing and future manpower requirements.
100 Sarita Aggarwal
Finally, based on the gap, the PSBs should have a recruitment and succession
plan designed with a clear execution plan.
1.14 Performance Management
To develop a robust performance management system, banks need to link
compensation to performance. Any performance linked compensation system
must ensure clear and measurable targets, and a tight and fair process of
performance evaluation. It is necessary that banks adopt the right mix of
‘push’-motivation, recognition, career progression and capacity building and
‘pull’-more tangible factors like higher pay, better benefits and attractive perks.
The performance of the PSBs depends not just on the sum total of their
human capital but also on how effectively they draw out the best from their talent
bank at any point of time, through effective placements, performance appraisal,
rewards and recognition mechanism.
1.15 Reskilling
A new set of skills and knowledge are required to manage the emerging
challenges faced by banks. As banking techniques and technology are ever
changing, there is a need for continuous development of individual as well as
organizational skills to meet market requirements. Equipping bank personnel
with requisite knowledge and skills for coping with the present and future
banking needs is one of the biggest challenges for banks. Even the best candidate
selected is rarely 100-percent skilled. The banks need to re-skill their staff and
adopt better customer relationship management strategies to retain the existing
customers. The banking industry is losing 15% of the customers every year and
the cost of acquiring new customers is 5 times more than the cost of retaining the
existing customers so there is a need to develop the skills of customer
relationship management and e-customer relationship management in the
human resources of the public sector banks.
2. Conclusion
Banking industry is the backbone of every economy. Human resources
which have been the strength of public sector banks are now set to pose. The
banks need to attract right talent and take a holistic employee cycle approach to
develop human capital. Banks should have a proactive and transparent
placement policy in order to provide smooth flow of human resources to deficit
areas, optimize human resource utilization, provide varied work exposure to its
employees, achieve cost effectiveness and minimize hardship to employees.
Human Resource Management in PSBs 101
References
1. Aggarwal M. Anand and A. Krishnan Goyal, Emerging Trends in Banking
Finance and Insurance Industry, New Delhi : Daya Publishing House, 2009
2. Ahluwalia, I. and Q. F. R. Shanker (Eds.), Low Productivity and High Cost, New
Delhi : Tata, McGraw-Hill, 1985.
3. Bisht, N. S., R. C. Mishra and R. Belwal, “Liberalization & its Effect on Indian
Banking”, Finance India, 2001, 16(1), 147-152.
4. Commerce and Industry, Mangalore, Available from http://www. bis.org/
review/r050321g.pdf.
5. Das, A., “Profitability of Public Sector Banks : A Decomposition Model”, RBI
Occasional Papers, 1999, 2000.
6. “Database on Indian Banking 2003-2007”, IBA Bulletin, 2004, 2005, 2006, 2007
Special Issue, Indian Banking Association.
7. Kadam, K, “State owned Banks – still the best” Banking Annual Year 2002,
Business Standard, 2003, Available from http://www. businessstandard.com/
special/bankannual/2003/overview.htm
8. Ram Mohan T.T. “Deregulation and performance of public sector banks”, EPW,
Vol. XXXVII, No. 05, February 02, 2002.
9. “Report on Trend and Progress of Banking in India”, Reserve Bank of India,
Available from www.rbi.org
10. Rishi, M, and S. C, Saxena, “Technological innovations in the Indian Banking
Industry: the late bloomer”, Accounting, Business and Financial History, Vol.
14, 2004, .339–353.
11. Sheeba Kapil et. al.,“Benchmarking performance of Indian public sector
commercial Banks”, Indian Journal of Accounting, Vol. 34, December, 24-28.
12. Shenoy, P. S., “Public Sector Banks-Remarkable Turnaround”, The Hindu Survey
of Indian Industries, Chennai, 43-45.
13. Verma, M. S., “Commercial Banking in Next Millennium”, The Journal of Indian
Institute of Bankers, Oct-Dec. 1998, 152-155.
14. Websites of all public sector banks. ê
102 Sarita Aggarwal
Article Received on January 18, 2015; Accepted on March 14, 2015
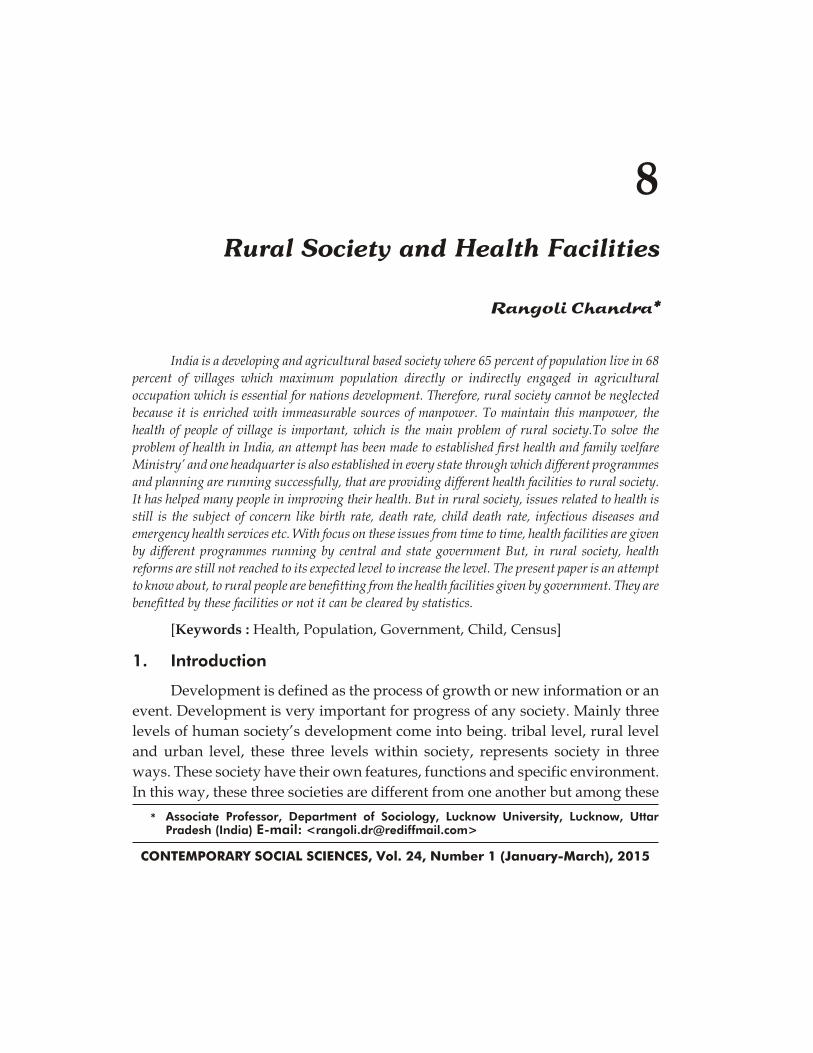
8
Rural Society and Health Facilities
Rangoli Chandra*
India is a developing and agricultural based society where 65 percent of population live in 68
percent of villages which maximum population directly or indirectly engaged in agricultural
occupation which is essential for nations development. Therefore, rural society cannot be neglected
because it is enriched with immeasurable sources of manpower. To maintain this manpower, the
health of people of village is important, which is the main problem of rural society.To solve the
problem of health in India, an attempt has been made to established first health and family welfare
Ministry’ and one headquarter is also established in every state through which different programmes
and planning are running successfully, that are providing different health facilities to rural society.
It has helped many people in improving their health. But in rural society, issues related to health is
still is the subject of concern like birth rate, death rate, child death rate, infectious diseases and
emergency health services etc. With focus on these issues from time to time, health facilities are given
by different programmes running by central and state government But, in rural society, health
reforms are still not reached to its expected level to increase the level. The present paper is an attempt
to know about, to rural people are benefitting from the health facilities given by government. They are
benefitted by these facilities or not it can be cleared by statistics.
[Keywords : Health, Population, Government, Child, Census]
1. Introduction
Development is defined as the process of growth or new information or an
event. Development is very important for progress of any society. Mainly three
levels of human society’s development come into being. tribal level, rural level
and urban level, these three levels within society, represents society in three
ways. These society have their own features, functions and specific environment.
In this way, these three societies are different from one another but among these
CONTEMPORARY SOCIAL SCIENCES, Vol. 24, Number 1 (January-March), 2015
* Associate Professor, Department of Sociology, Lucknow University, Lucknow, UttarPradesh (India) E-mail: <[email protected]>
rural society is more important as a point of universally developed society
community. Rural society have their own cultural, economic, social and political
framework.
The nature, framework, organization of rural society is contrary to urban
society. Rural society economics, social, cultural or political framework and
system have their own features that separate rural society from other societies, by
rural or agricultural society, means those societies whose members source of
earning is based on agriculture. We can not separate agricultural and rural
society from each other, they are complementary of one-another, inseparable
parts, whose features has maintained the enduring identity of rural society.
Smith has written that, ‘‘Peasant and rural oftenly are synonyms word. In other
words, little community, and rural community are complementary to each
other’’ (Smith, 1953 : 18).
The word ‘village’ has been used from ancient period. Foremost, village
had been used in the meaning of providing stability to social relations. In
Rigveda, the form of family was stated as very ancient. After that, the rise of word
‘Grriha’ has been determined from the meaning of grriha or mund. In this way,
Gotra has been originate as form of Grriha and construction of village has started
according to Gotra. The word village has been used in manuscripts, units of
social organization is also used in the meaning of village. A. R. Desai writes that
village is the unit of rural society. It is the theatre, where in the quantum of rural
life unfolds itself and functions. “Village is the first establishment of collective
residence system which is the production of agriculture economic system”
(Desai, 1994 : 127) village is the place where ancient men has given stability to his
unstable life lastly, village can be called as the title of providing statics to speed of
collective life and village is called as the important unit of social framework of
rural, where agriculture is started because agriculture has provide stability to
human and establishment based on this stability is entitled as ‘village’ those
elements resonance from the word ‘village’ are collectiveness, agriculture and
distinctiveness etc. on the basis of these elements, the existence of village is
possible. (Desai, 1994 : 127). From very long period of time, in India, no attention
has been given to the studies related to rural community. After Independence,
rural development has been accepted as the main aim and many researchers
started taking interest in the studies related to rural community. In this respect,
A. R. Desai (1994 : 1) has written that ‘‘A systematic study of the rural social
organization of its structure, function and evaluation has not only become
necessary but also urgent after the advent of Independence.’’
104 Rangoli Chandra
According to Sanderson (1942 : 278-79), ‘‘Rural Sociology is Sociology of
life in the rural environment.’’ It is clear from the definition that, the scientific
study of social life of people living in rural environment or village is called rural
sociology. Merrill and Eldredge (1955 : 336) hold that the rural community
comprises the constellation of institution and persons grouped about a small
centre and sharing common primary interest. According to Merrill and Eldredge,
as a community, the size of village is very small, according to Census of 2011,
about 69 percent population live in approximately 6 lac villages of India, out of
which more than 4 lac villages are there, whose population is less than one
thousand.
2. Health Facilities
Public health is very important for nation’s development.The module of
power of individual and production capacity of any nation is health. nation’s
industries and capacity of production of agriculture depends on population.
Lack of disease is not only considered as health but it is a re-conciliation of
individual’s natural and social external environment and is also a situation of
development according to human’s physical and mental capacity.
Problems related to health found in rural India are as follows :
u Due to lack of nutrition, approximately 80 percent below 5 years are
undernourished. Among pregnant women, about 50 percent of women are
suffering from anemia.
u Some communicable diseases like leprosy, tuberculosis, cholera etc. are
main diseases in villages.
u Lack of sanitation, diseases and death especially is children and women are
foremost general reasons.
With the aim of providing treatment facilities for the health of rural
population, government has started giving more emphasis on the basis of health
facilities in rural areas under the minimum necessary programme.
Different planning and programmes conducted by government for making
health society are : Establishment of central health and family welfare.
communicable disease control programme, National programme for eradication
of leprosy-1955, Health policy-1983, Health for poor, National programme for
control of blindness-1976, through all these programmes government tried to
concentrate on health development (India, 2005 : 486).
Rural Society and Health Facilities 105
In present time, different health facilities, planning and programmes are
conducted by government in rural areas. which are as follows :
2.1 National Rural Health Mission
Asha, Patient/welfare association-till now 31694 is established and 5.03
Lac VHSNC had established, Human as form of resources, 8871 doctors, 2025
specialities, 76643 ANM, 41609 nurse staff, in 459 districts 2024 MNV is running
in all over the country. Toll free number is also available for free ambulance
services. Under the subjection of NRAHM 12000 basic and emergency patent
vehicle is also provided. Janani sishu surakrsha programme for the institutional
delievery, free transportation, free food and blood has been also provided (India,
2014 : 387-388).
Family planning insurance plan India is first country family planning India
is the first country which started international family planning programme in
1952 which provided medical facilities and money for wages loss to those who go
under sterilization process. For vasectomy from 6800 to 1500 and for tubecolomy
Rs. 800 to 1000 common facilities and Rs. 1500 for personal health has been given
by government. Family planning insurance planning 29 Nov. 2005 , Health
insurance planning-for BPL families (1 unit of 5) provide per year smart card of
Rs. 30,000 based on free health insurance.
Delivery centre-some guidance are running for delivery for basic and
supplementary care-build capacity of health services of conferee, rural health
and nutrition day for providing health facilities for mother and children 871 Lac
established social health personnel (Asha) are appointed for health care services
and facilities for demand of community.
2.2 Child Health Programme
Establishment of care facilities and facilities based on integrated
management for diseases of infancy and nutritious. Integrated management for
newborns and child diseases and facilities before IMNCI. Home base nursing of
newborn. Universal immunization, adequate management and early identity of
intense respiratory infection, diarrhea and other infections. Boosting breast-
feeding for infants and small children. Management of children’s nutrition.
Providing vitamin A supplements, iron and folic acid supplements.
106 Rangoli Chandra
2.3 Initiative of Child Health
Facilities based on infants and child care. facilities based on integrated
management for newly borns and diseases of children (IMNCI) Home based new
born care (HBNC).
2.4 Nutritional Rehabilitation Centre
(NRC) for the treatment and management of malnourished childrens
under RCHM/NRHM programme, there is a planning of about 650 nutritional
rehabilitation centres. Among which till September 2012, 577 nutritional
rehabilitation centres of 14 states are running in all over the country.
2.5 Universal Vaccination Programmes
Indian government have provided 7 vaccine preventable diseases in the
programme like Diphtheria, Pertussis, tetanus, polio, measles and tuberculosis
and Hepatitis B.
2.6 Prevention of Pulse Polio
National vector disease control programme, revised national tuberculosis
control programme, National iodine deficiency disorder control programme,
National programme for prevention and control from cancer, diabetes,
cardiovascular diseases and strokes, Checkup of diabetes and hypertension,
national mental health programme, district mental health programme,
establishment of trauma facilities, national aid control programme,
According to present NSSO survey currently there are 291 person per lac of
population suffering from weakness facilities given by government to improve
health programme in rural areas some data are given below:-
Table-1 : Child Sex Ratio Rate : 1971-2011
Year 1971 1981 1991 2001 2011
India 964 962 945 327 914
U. P. 923 935 927 916 899
Table-2 : Average Child Sex Ratio Per 1000 Boys in India
Year 1971 1981 1991 2001 2011
Girls 964 962 945 927 914
Boys 1000 1000 1000 1000 1000
Rural Society and Health Facilities 107
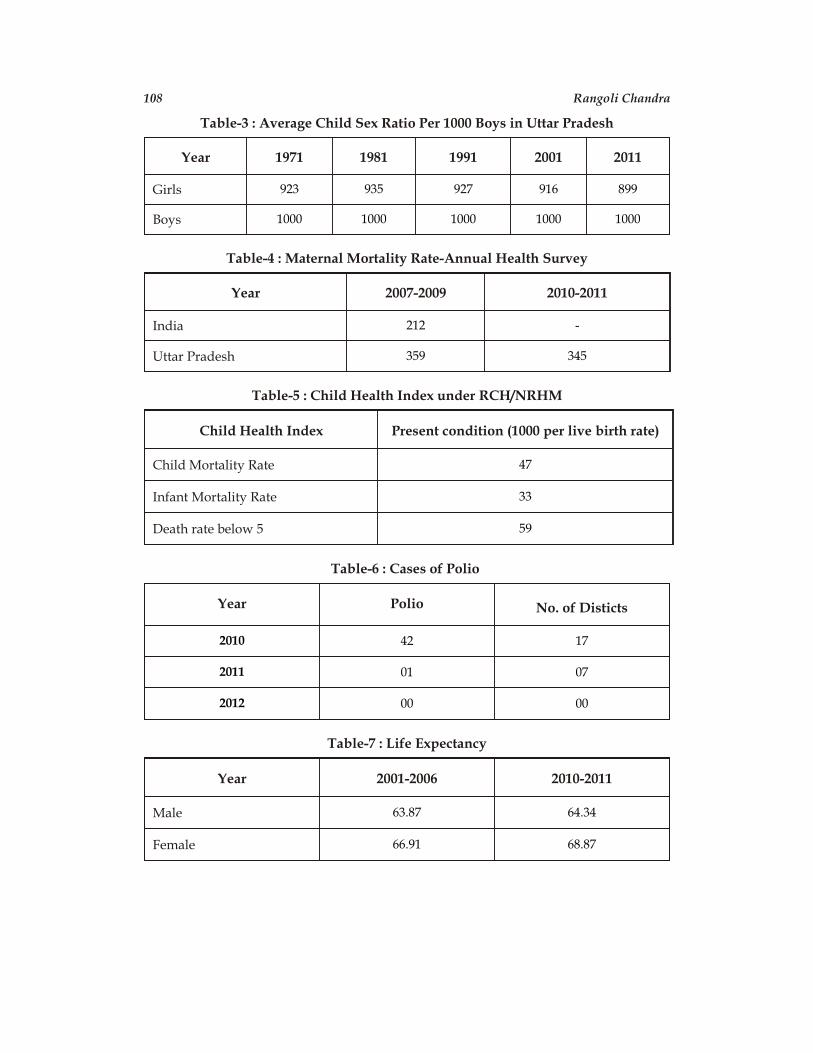
Table-3 : Average Child Sex Ratio Per 1000 Boys in Uttar Pradesh
Year 1971 1981 1991 2001 2011
Girls 923 935 927 916 899
Boys 1000 1000 1000 1000 1000
Table-4 : Maternal Mortality Rate-Annual Health Survey
Year 2007-2009 2010-2011
India 212 -
Uttar Pradesh 359 345
Table-5 : Child Health Index under RCH/NRHM
Child Health Index Present condition (1000 per live birth rate)
Child Mortality Rate 47
Infant Mortality Rate 33
Death rate below 5 59
Table-6 : Cases of Polio
Year Polio No. of Disticts
2010 42 17
2011 01 07
2012 00 00
Table-7 : Life Expectancy
Year 2001-2006 2010-2011
Male 63.87 64.34
Female 66.91 68.87
108 Rangoli Chandra
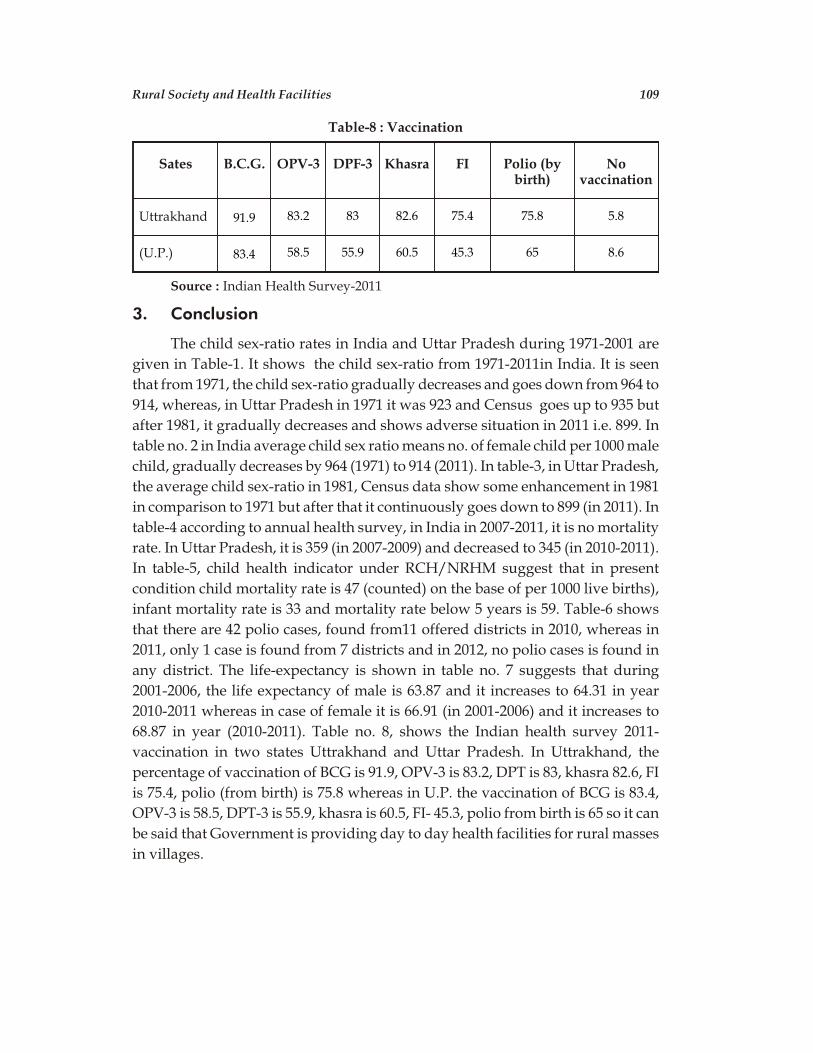
Table-8 : Vaccination
Sates B.C.G. OPV-3 DPF-3 Khasra FI Polio (bybirth)
Novaccination
Uttrakhand 91.9 83.2 83 82.6 75.4 75.8 5.8
(U.P.) 83.4 58.5 55.9 60.5 45.3 65 8.6
Source : Indian Health Survey-2011
3. Conclusion
The child sex-ratio rates in India and Uttar Pradesh during 1971-2001 are
given in Table-1. It shows the child sex-ratio from 1971-2011in India. It is seen
that from 1971, the child sex-ratio gradually decreases and goes down from 964 to
914, whereas, in Uttar Pradesh in 1971 it was 923 and Census goes up to 935 but
after 1981, it gradually decreases and shows adverse situation in 2011 i.e. 899. In
table no. 2 in India average child sex ratio means no. of female child per 1000 male
child, gradually decreases by 964 (1971) to 914 (2011). In table-3, in Uttar Pradesh,
the average child sex-ratio in 1981, Census data show some enhancement in 1981
in comparison to 1971 but after that it continuously goes down to 899 (in 2011). In
table-4 according to annual health survey, in India in 2007-2011, it is no mortality
rate. In Uttar Pradesh, it is 359 (in 2007-2009) and decreased to 345 (in 2010-2011).
In table-5, child health indicator under RCH/NRHM suggest that in present
condition child mortality rate is 47 (counted) on the base of per 1000 live births),
infant mortality rate is 33 and mortality rate below 5 years is 59. Table-6 shows
that there are 42 polio cases, found from11 offered districts in 2010, whereas in
2011, only 1 case is found from 7 districts and in 2012, no polio cases is found in
any district. The life-expectancy is shown in table no. 7 suggests that during
2001-2006, the life expectancy of male is 63.87 and it increases to 64.31 in year
2010-2011 whereas in case of female it is 66.91 (in 2001-2006) and it increases to
68.87 in year (2010-2011). Table no. 8, shows the Indian health survey 2011-
vaccination in two states Uttrakhand and Uttar Pradesh. In Uttrakhand, the
percentage of vaccination of BCG is 91.9, OPV-3 is 83.2, DPT is 83, khasra 82.6, FI
is 75.4, polio (from birth) is 75.8 whereas in U.P. the vaccination of BCG is 83.4,
OPV-3 is 58.5, DPT-3 is 55.9, khasra is 60.5, FI- 45.3, polio from birth is 65 so it can
be said that Government is providing day to day health facilities for rural masses
in villages.
Rural Society and Health Facilities 109
References
Smith, T. Lynn, The Sociology of Rural Life, New York : Harper, Harper Social Science
Series, 1953, 18.
Desai, A. R. (Ed.), Rural Sociology, Bombay : Popular Prakashan, 1994, 127.
Sanderson, D., Rural Sociology and Rural Social Organization, New York : John Willy
& Sons, 1942, 278 -279.
Merrill, Francis E. and H. Wentworth Eldredge, Culture and Society : An Introduction
to Sociology, Englewood Cliffs N.J. : Prentice Hall, 1955, 336.
Government of India, India 2005, A References Annual, Patiala House, New Delhi :
Ministry of Information & Broadcasting, Government of India, 2005, 486.
Government of India, India 2014, A References Annual, Patiala House, New Delhi :
Ministry of Information & Broadcasting, Government of India, 2005, 387, 288,
395, 397, 401.
Government of India, Annual Health Survey 2010-2011, New Delhi : Office of the
Registrar General and Census Commissioner, 2013. ê
110 Rangoli Chandra
Article Received on February 10, 2015; Accepted on March 20, 2015
9
Sedition Law and its Draconian Effects
Geetika Garg*
Sedition laws were used to curb dissent in England, but it was in the colonies that they
assumed their most draconian form, helping to sustain imperial power in the face of rising
nationalism in the colonies including India. The law of sedition has been formulated as a
constitutional weapon to safeguard the state by preventing a person from creating a sense of
‘disaffection’. The present paper is an attempt to analyze the draconian effects of Sedition laws. By
removing sedition from the terms included in Article 19(2) the Constitution makers signaled their
wish to move away from the colonial order where legitimate dissent was denied to Indians.
[Keywords : Sedition law, Draconian effects, Constitutional weapon, Freedom
of Speech]
A law should create a social framework for individual freedoms to be
realized. The State is only an institution through which law flows; it cannot use
law to perpetuate itself. The law on sedition serves the state and not the
community. It has become the slave of the State turning against society and
therefore it poses serious problems for the functioning of democracy in our
country.1
While sedition laws are part of a larger framework of colonial laws that are
now used liberally by both the central and state governments to curb free speech,
the specificity of these laws lie in the language of ‘disaffection’ and severity of the
punishment associated with them. Sedition laws were used to curb dissent in
England, but it was in the colonies that they assumed their most draconian form,
helping to sustain imperial power in the face of rising nationalism in the colonies
CONTEMPORARY SOCIAL SCIENCES, Vol. 24, Number 1 (January-March), 2015
* M.A., LL.M. and NET, 29, Shiv Sarovar, Bank Colony, Meerut, Uttar Pradesh (India)E-mail: <[email protected]>
including India. History is witness that some of the very prominent people have
been victims of this law like Mahatma Gandhi, Bal Gangadhar Tilak and Annie
Besant. It is ironic that these laws have survived the demise of colonial rule and
continue to haunt media personnel, human rights activists, political dissenters
and public intellectuals across the country.
Firstly, let us understand what does the word ‘sedition’ means. In law,
sedition is overt conduct, such as speech and organization, that is deemed by the
legal authority to tend toward insurrection against the established order.
Sedition often includes subversion of a constitution and incitement of discontent
(or resistance) to lawful authority. Under Section 124, of the Indian Penal Code,
‘Sedition’ has been defined as “Whoever by words, either spoken or written, or
by signs, or by visible representation, or otherwise, brings or attempts to bring
into hatred or contempt, or excites or attempts to excite disaffection towards the
Government established by law in India, shall be punished with imprisonment
for life, to which fine may be added, or with imprisonment which may extend to
three years, to which fine may be added, or with fine.”
Section 124A was introduced by the British colonial government in 1870
when it felt the need for a specific section to deal with the offence. It was one of
the many draconian laws enacted to stifle any voices of dissent at that time.
Mahatma Gandhi was prescient in recognizing the fundamental threat it
provided to democracy when he called it the ‘prince among the political sections
of the Indian Penal Code designed to suppress the liberty of the citizen.’2 The
framework of this section was imported from various sources-the Treason
Felony Act (operating in Britain), the common law of seditious libel and the
English law relating to seditious words. The common law of seditious libel
governed both actions and words that pertained to citizens and the government,
as well as between communities of persons.3
In 1898, section 124A was amended to reflect Justice Strachey’s
interpretation. The British included the terms ‘hatred’ and ‘contempt’ along with
disaffection. Disaffection was also stated to include ‘disloyalty and all feelings of
enmity’. While debating these amendments, the British Parliament took into
account the defence’s arguments in the Tilak case and the decisions in two
subsequent cases to ensure loopholes did not exist in the law.4 The debates in
Parliament demonstrate how ‘diverse customs and conflicting creeds’ in India
were used to justify the amendments.5 These amendments also introduced
112 Geetika Garg
section 153-A and section 505 of the IPC. The colonial government, particularly
the Bombay government, followed the changes in the law with a spate of
prosecutions against native newspapers.
Jawaharlal Nehru’s views were totally against this provision when he said
in 1951, “Take again Section 124 (A) of the Indian Penal Code. Now so far as I am
concerned that particular Section is highly objectionable and obnoxious and it
should have no place both for practical and historical reasons, in any body of
laws that one might pass. The sooner we get rid of it the better.”6
The law of sedition has been formulated as a constitutional weapon to
safeguard the state by preventing a person from creating a sense of ‘disaffection’.
It is a machinery to control the advent of agitation against the state. It also
imbibes the very idea of ‘Freedom of speech’ guaranteed under Article 19 in the
Constitution of India. In fact, it is the legitimate right of every citizen to expose
the misdeeds of the government it disapproves of, create disaffection and
disloyalty among the people and work for throwing it out of power. Disloyalty to
a government is different from disloyalty to the State. Of late this provision is
being used by the State to suppress the peaceful people’s movements and
Human Rights activists.
But, the scenario has changed now, as this law has been blandly interpreted
by the media as well as the government. The law of sedition extends to those
situations only, where there is a tendency to cause public disorder by use of
violence.
The irony of the sedition law used against nationalists like Gandhi and
Tilak continuing in the statute books of independent India was not lost on those
drafting the Constitution. While in their Draft Constitution, the Constitutional
Framers included ‘sedition’ as a basis on which laws could be framed limiting the
fundamental right to speech (Article 13)7, in the final draft of the Constitution
sedition was eliminated from the exceptions to the right to freedom of speech and
expression (Article 19 (2)). This amendment was the result of the initiative taken
by K. M. Munshi, a lawyer and an active participant in the Indian independence
movement. Munshi proposed these changes in the debates in the Constituent
Assembly.8 The way in which the sedition law has been used as a convenient
medium to stifle any form or expression of dissent or criticism mirrors the fears
and concerns expressed by some of the constitutional drafters regarding the ease
with which the sedition law can be misused and abused. Thus the framers of our
Sedition Law and its Draconian Effects 113
Constitution were clearly aware of the tainted history of sedition laws and did
not want the right to free speech of independent Indians restricted by these
draconian provisions.
The idea of having a Fundamental Right of freedom of speech seemed
rather inconsistent with the offence of sedition and that serving as a restriction on
speech as it did via the Privy Council interpretation in Sadashiv.9 Thus in the final
draft of the Constitution it was seen that the restrictions to the right under
19(1)(a) did not contain sedition within them.
However, sedition laws remained on the statute books post independence
and was used repeatedly by both central and state governments to stifle political
dissent. The first major constitutional challenge to sedition laws arose in the
fifties when the sedition law was struck down as being violative of the
fundamental right to the freedom of speech and expression in a trilogy of
cases:-Tara Singh Gopi (1950),10 Sabir Raza,11 and finally Ram Nandan in 1958.
In Tara Singh’s case, referring to the sedition law, Chief Justice Eric Weston
wrote: “India is now a sovereign democratic State. Governments may go and be
caused to go without the foundations of the State being impaired. A law of
sedition thought necessary during a period of foreign rule has become
inappropriate by the very nature of the change, which has come about.”
In Ram Nandan’s the constitutional validity of section 124A of the IPC was
challenged in an Allahabad High Court case12 that involved a challenge to a
conviction and punishment of three years imprisonment of one Ram Nandan, for
an inflammatory speech given in 1954. The court overturned Ram Nandan’s
conviction and declared section 124A to be unconstitutional.
However, this decision was overruled in 1962 by the Supreme Court in
Kedar Nath Singh v. State of Bihar,13 which held that the sedition law was
constitutional. The Court, while upholding the constitutionality of the judgement
distinguished between “the Government established by law” and “persons for
the time being engaged in carrying on the administration”. The court ruled that
the charge of sedition can only be slapped if the accused incited violence through
his speech. Otherwise, invoking the sedition law would violate freedom of
speech and expression guaranteed by the Constitution under Article 19, the apex
court had added.
But then again, the journalists, activists and writers fall prey to this
loophole in the judicial enactment of the same. The biggest irony is how the High
114 Geetika Garg
Courts have gone against the Supreme Court’s ruling that clearly demarcates
sedition from other acts by stating that “prosecution under the sedition law
requires incitement to violence”. And at no given point of time did Aseem
Trivedi resort to violence or propagate any such activity. More so, such an archaic
law even jeopardizes the International Covenant on Civil and Political Rights
ratified by India in 1979, which ensures full freedom of expression and prohibits
any kind of restrictions. Unfortunately, the sedition law is at the discretion and
mercy of those illiterate power holders who misuse the same to victimise those
who raise their voices against prejudiced and discriminatory systems and
corrupt practices.14
Thus, the very fundamental right of ‘Freedom of Speech and Expression’ is
misconstrued as it does not restrain a citizen from criticizing a political statement
given that the statement shall not incite or hurt the emotions of people against the
state. This does not include the appeal or protests done by the activists which
happens to be bona fide and is of purpose. Activists like Dr. Binayak Sen, had
been put under trial under the charges of sedition. Binayak Sen MBBS, MD; is an
Indian pediatrician, public health specialist and activist was found guilty of
sedition.15 He is the national Vice-President of the People’s Union for Civil
Liberties (PUCL). On 24 December 2010, the Additional Sessions and District
Court Judge B.P Varma Raipur found Binayak Sen, Naxal ideologue Narayan
Sanyal and Kolkata businessman Piyush Guha, guilty of sedition for helping the
Maoists in their fight against the state.They were sentenced to life
imprisonment.However he got bail in Supreme court on 16 April 2011.16 This is
an example where there is a misuse of this draconian law by political leaders in
power to suppress the representation of the society for a given cause. And
whenever the law fails its purpose, it must be repealed or removed.
In its current state, the yardstick that gauges the amplitude of disaffection
and the resultant violence is very vaguely defined and is highly subjective.
Raising its voice against such inhuman law, especially during times where
people around the world are being made freer in terms of expressing their views,
the International Human Rights Watch requested the Indian Parliament to
immediately repeal the sedition law, which local authorities are arbitrarily using
to silence peaceful political dissent.
If we take a glance on the examples from around the world related to this
law then we see that in September 2010, even the Ugandan judiciary ruled that its
Sedition Law and its Draconian Effects 115
sedition law was inconsistent with the principles of freedom of speech and ruled
in favour of Press freedom by declaring the criminal sedition offence as being
unconstitutional. The sedition law in Malaysia is used to curb criticism of the
state by non-Malays and to protect political elitism. However, this law is being
criticised considerably in that nation and is under review. In Singapore, the
maximum jail term for distributing a seditious publication is three years and not
a lifetime.While in developed countries like the UK, the last prosecution for
sedition occurred in 1972, by 1977, the common law offence of sedition was
abolished. The Sedition Act of 1798 in US that was used by the powers-that-be
and the elite classes of society for political and other benefits was abolished by
Thomas Jefferson after he came to power. Similarly, it was repealed in New
Zealand in 2007.17
While the United Kingdom abolished sedition laws in 2010, sedition
became a big issue in India the same year as noted writer Arundhati Roy,
amongst others, were sought to be charged with sedition18 for advocating
independence for the disputed Kashmir region. This is by no means the only
instance of sedition laws being used in contemporary India. Many human rights
activists have found themselves charged with sedition.19 On 10 September 2012,
Aseem Trivedi, a political cartoonist, was sent to judicial custody till 24
September 2012 on charges of sedition over a series of political cartoons against
corruption. Though the cartoons were derogatory to National Emblem and the
Constitution of India, the arrest of Aseem Trivedi under sedition has been
questioned by experts.20
Going through the many names that appear when one looks through the
recent history of how section 124A is being applied also gives weight to the
charge that a great divide presently exists between the Supreme Court and the
lower courts, one which is resulting in many instances of injustice for the judges
seem ignorant of the position of law in many parts of the country. The problem is
more so at the level of the trial court and the investigating authorities, with a
number of cases showing that the High Court grants bail or acquits the accused in
many ostensible cases of ‘sedition’.
It is a matter of utter disgrace that the world’s largest democracy is having
laws, which were once hurdles in the path of its own freedom struggle and
which are blatantly against the very definition of democratic rights in today’s
context.
116 Geetika Garg
The punishment of those accused of sedition begins with the legal process.
Even if they are ultimately freed, they have to go through a long legal process,
which serves as a punishment and a deterrent for those who dare to speak up.
The Hindu while discussing cases under sedition in 2010 also highlights the
bizarre case of a lecturer in Srinagar being arrested under section 124A because
he added questions on the unrest in Kashmir Valley in an examination.21 This is
not an isolated incident. The Times of India’s resident editor at Ahmedabad,
Bharat Desai, faced charges along with a senior reporter and a photographer, for
questioning the competence of police officials and alleging links between them
and the mafia.22 This was preceded by charges against one Manoj Shinde, the
editor of an Eveninger in Surat for ‘instigating people against a duly elected
government’. He had blamed Chief Minister Modi for the disastrous floods
which had occurred in the city.23 Students who cheered for Pakistan during Asia
Cup were charged under sedition is its current example of misuse. Cricket
between India and Pakistan indeed incites great passion in both countries and
followers of the two teams patriotism often gets unduly mixed with love for the
game. However, for its sheer perversity and unreason, the action of the Meerut
police in booking a group of students from Jammu & Kashmir on a charge of
sedition beats all previous instances of the misuse of this penal provision. The
charge of sedition under section 124A of IPC has been dropped, but only after
strong outrage evoked by this irrational act.24
The rampant misuse of the sedition law despite the judicial
pronouncement in Kedar Nath’s case circumscribing the scope of the law has
meant that there is a serious case for repealing this law. The above examples
demonstrate that Article 19(1)(a) continues to be held hostage by Section 124A
which has indeed proved Gandhi right in being the ‘prince of the political
sections of the IPC.’ There is no justification for a draconian law of this nature,
created to squash peaceful and non-violent dissent, to operate in a country,
which claims to be the world’s largest democracy.
India, however, still retains the law. Sedition is like war against people.
India has had a history of draconian laws. Such laws have been made and
withdrawn not because government understands democratic values but because
the government cannot sustain draconian provisions for long. So it keeps
changing their formal appearance. TADA which has been withdrawn had a
conviction rate of 0.1 per cent. TADA was replaced by POTA. It was equally
dangerous and was also withdrawn. Now we have UAPA 1967 which has been
Sedition Law and its Draconian Effects 117
amended to include the provisions of POTA. Such misuse of laws shows how the
state is at war against its own people. If the law is repealed it will be the biggest
victory of civil liberties.25
The current situation demands that we challenge this law. It is time to
question the kind of democracy prevalent in India. Democracy comes from the
French Revolution which reflected upon the art of making a Constitution. It had
successive Constitutions in 1789, 1791 and 1795 but most important was the
Constitution of 1792. It contained the right to resist against the government as a
fundamental right of the citizens. Resistance is natural in the course of history;
sedition makes it unnatural.
Seth Govind Das, a freedom fighter and, subsequently, a distinguished
Parliamentarian, was another supporter of removing ‘sedition’ from the Article.
He said: “I would like to recall to the mind of honourable Members of the first
occasion when section 124A was included in the Indian Penal Code… It is a
matter of pleasure that we will now have freedom of speech and expression
under this sub-clause and the word ‘sedition’ is also going to disappear.”26
Thus the framers of our Constitution were clearly aware of the tainted
history of sedition laws and did not want the right to free speech of independent
Indians restricted by these draconian provisions. By removing sedition from the
terms included in Article 19(2) the Constitution makers signaled their wish to
move away from the colonial order where legitimate dissent was denied to
Indians.
References
1. Report on All India Convention against Sedition and Other Repressive Laws,
New Delhi : Gandhi Peace Foundation, 31 January 2012.
2. A. G., Noorani, Indian Political Trials : 1775-1947, New Delhi : OUP, 2009, 235.
3. W. R. Donogh, A Treatise on the Law of Sedition and Cognate Offences in
British India, 1, Calcutta : Thakker, Spink and Co., 1911, 4.
4. R. Dhavan, Only the Good News : On the Law of the Press in India, New Delhi :
Manohar Publications, 1987, 287.
5. A. G., Noorani, Indian Political Trials: 1775-1947, New Delhi : OUP, 2009, 70.
6. Parliamentary Debates of India, Vol. XII, Part II (1951), p. 9621 cited in Para 81,
Ram Nandan v. State (AIR 1959 All 101)
118 Geetika Garg
7. Clause 13 cited on p. 7 of the Draft Constitution of India prepared by the
Drafting Committee. Constituent Assembly Debates of Wednesday 30-4-1947,
Vol. III, No. 3 at p. 445 where Clause 8 referred to above is reproduced cited in
Para 81, Ram Nandan v State (AIR 1959 All 101)
8. Constituent Assembly of India Part I Vol. VII, 1-2 December 1948, available at
http://parliamentofindia.nic.in/ls/debates/vol7p16b.htm accessed on 3
February 2011.
9. King Emperor v. Sadashiv Narayan Bhalerao (1947) L.R. 74 I.A. 89.
10. Tara Singh Gopi Chand v. The State (1951 CriLJ 449)
11. Sabir Raza v. The State, Cri App No. 1434 of 1955, D/- 11-2-1958 (All) cited in
Ram Nandan v. State (AIR 1959 All 101)
12. Ram Nandan v. State (AIR 1959 All 101)
13. Kedar Nath Singh v. State of Bihar (AIR 1962 SC 955)
14. R. Anupam Pillai, Behind Bars For Speaking The Truth: Sedition Laws In India,
Sunday, September 9th, 2012 in Society. <youthkiawaaz.com>
15. http://news.oneindia.in/2011/02/10/binayaksens-mother-breaks-down-on-h
earing-hcverdict-aid0126.html
16. http://www.indianexpress.com/news/It-s-the-first-step-towards-justice—say
s-Sen-Release-Committee/776831/
17. http://www.dailypioneer.com/columnists/itemlist/category/536-oped.html
18. Geelani, Arundhati to be booked under sedition charge- The Times of India, 25
October 2010 http"//timesofindia.inindiatimes.com/india/Geelani-Arundhati
-to-be-booked-under-sedition-charge/articleshow/6810983.cms#ixzz1adshttp:
//timesofindia.indiatimes.com/india/Geelani-Arundhati-to-be-booked-under
-sedition-charge-articleshow/6810983.cms.
19. “The Logical Urges Of Sedition,” Vij, Shivam, Kafila.org, 31 December 2010
http://kafila.org/2010/12/31/the-logical-urges-of-sedition/
20. http://www.hindustantimes.com/India-news/NewDelhi/Cartoonist-Aseem-
Trivedi-refuses-to-take-bail-sent-to-judicial-custody-till-Sept-24/Article1-9273
90.aspx
21. Priscilla Jebaraj, “Binayak Sen Among Six People Charged With Sedition in
2010” in The Hindu, 1 January, 2011.
Sedition Law and its Draconian Effects 119
22. “Modi Throttling Freedom of Expression” in DNA India, 7 January 2008.
23. Subash Gatade, Article Writing Equals Sedition (3 Jun., 2008), <http:/
/www.countercurrents.org/gatade030608.htm>
24. m.thehindu.com/opinion/editorial/abuse-of-sedition-lawarticle5761462.ece/
25. Rajindar Sachar (Former chief justice, Delhi and Sikkim High Court), Report on
All India Convention against Sedition and Other Repressive Laws, New Delhi :
Gandhi Peace Foundation, 31 January 2012.
26. Centre for the Study of Social Exclusion and Inclusive Policy, Sedition Laws &
The Death of Free Speech In India, National Law School of India University,
Bangalore & Alternative Law Forum, Bangalore, February 2011, 17. ê
120 Geetika Garg
Article Received on January 16, 2015; Accepted on March 16, 2015
10
Overview of Work Life Balance and
Workers Performance in Bali
Dewi Puri Astiti*
Cultural mores is a form of Balinese characteristic related trust and confidence into the spirit
for every family in Bali. Mores translated into a specific ritual in Banjar or family and village temple.
Community workers in Bali loaded with three aspects of the work that must be balanced against that
is beyond the job to make money, work at home and work-related social customs in Banjar. This
balance is known as work life balance (WLB). Work life balance is a balance between how workers can
work outside the home produces incentives, work at home and extended family as well as the need for
self-indulgence (Schien, 2010). Results of previous studies show that the work life balance will affect
the performance of the resulting worker. Based on the above researchers wanted to see the work life
balance and community workers in Bali and worker performance. In psychological research related to
quality of life and quality of work, while sociologically, high or low level of work life balance affects the
development of Balinese workers and community interaction influence on employee performance
leads to a society of economic sociology . This study uses quantitative and qualitative methods. The
subject was taken private and domestic workers who are Hindus and is a native resident of Bali.
Overview of work life balance of the results of the study found the greatest percentage of low scores in
the categories of work life balance, supported by the results of a qualitative analysis indicates that
respondents felt that the life of work, family and social well-balanced yet. Associated with
performance held by the respondents on average were and qualitative results of a decline in
performance, not the spirit, unproductive feel and feel disturbed when working.
[Keywords : Qual ity of life, Work life bal ance, Per for mance]
1. Background
Until now, people in Bali maintain and uphold the religion, culture and
traditions well. Balinese attachment to their local culture and traditions tend to
CONTEMPORARY SOCIAL SCIENCES, Vol. 24, Number 1 (January-March), 2015
* Department of Psychology, Medicine Faculty, Universitas Udayana (UdayanaUniversity), Denpasar (Indonesia) E-mail: <[email protected]>
clean from outside influences. Religious ceremonies and customary sort of
ngaben (cremation), otonan (anniversary ceremonies themselves based on the
Hindu calendar), temple ceremony (temple anniversary ceremonies every six
months) and metatah (tooth filing ceremony) is a daily activity for Balinese
society.
The concept of the extended family (extended family) adhered to Balinese
influence on the intensity of the rituals and traditions that they carry. Every large
family has a temple in Bali family, that each part of the family are bound to be
present and involved in the ceremony each of its members. In addition to
engagement with a large family, the people of Bali also has ties to the social
environment outside the family. The Balinese also have to follow the rituals and
customs are held in Banjar (traditional village in Bali).
The con cept of ex tended fam ily (big fam ily) adopted by the Ba li nese
in flu ence on the in ten sity of the rit u als and tra di tions that they carry out. Ev ery large
fam ily in Bali has a fam ily tem ple so that ev ery part of the fam ily are bound to be
pres ent and in volved in the cer e mony each of its mem bers. In ad di tion to
en gage ment with a large fam ily, the peo ple of Bali also has ties to the so cial
en vi ron ment out side the fam ily. Ba li nese peo ple also have to fol low the rit u als and
cus toms are held banjo (tra di tional vil lage in Bali).
High intensity Balinese in maintaining and caring for religious rituals and
customs are not without problems. For, as community workers, community
workers in Bali have an attachment with the professionalism of the organization
in the workplace. Therefore, this study was intended to see how WLB (balance
between work outside the home, domestic activities in the family, and the
relationship with the social environment) community workers in Bali and how
the performance of public workers in Bali ?.
This research is important because it can be used to see how the
characteristics of the WLB in society viscous maintain local knowledge and
traditions customs. Therefore, individuals with low WLB potentially cause
conflict of roles in domestic and social life.
Work life balance (WLB) is a picture of the situation of the balance between
work responsibilities with family responsibilities and personal life. Another
definition indicates that work life balance is an overview of the rules of
individuals associated with the need for time and passion in work, family life and
personal life and social life (fisher-McAuley, Stanton, Jolton and Gavin, 2003).
122 Dewi Puri Astiti
Another opinion, work life balance is a balance between how workers can
work outside the home produces incentives, work at home and extended family
as well as the need for self-indulgence (Schien, 2010).
Work life balance refers to the reduction of conflict between work life with
family life be it personal or social. Reduced conflict between work and personal
life, will lead to the satisfaction, comfort and happiness of the individual’s own
career and personal life.
Work life balance is a concept that can support workers to share their time
and passion between work and other important aspects in life.
Work life balance is an attempt to provide time for family, friends, social
community, spirituality, self-development, attention to yourself and other
personal activities so as to increase the satisfaction and happiness in the
workplace (Chandaria, 2013). One way to improve the performance of
individuals within the organization.
Employee performance is a measure of the success of the individual in
carrying out job duties. The task can be solved with good jobs because of factors
associated with knowledge and skills skill, experience, sincerity and time
(Simanjuntak, 2005).
Therefore, the performance is determined by how an individual can
balance the time and energy of work and personal life. The issue of work-life
balance is important to the people of Bali, given the current Balinese women have
the same opportunity to work with men. Family income comes from two sources,
namely the income of husband and wife, as a representation of modern society
seeking stability in family economics and family avoid financial shortfall.
For another, the activity of customs as a spirit that must be guarded and do
in everyday family in Bali. Of course, the activity of financial mores also requires
quite a bit. Associated with work - life balance, working people in Bali loaded
with three aspects of the work that must be balanced against that is beyond the
job to make money, work at home and work -related social customs in Banjar.
Work at home for the people of Bali are loaded with engaging in a large
family (extended family) is not only related to the husband/wife and children
but also related to the family customs. For social life in Banjar, there will
tangguang attachment socially responsible individuals in the community.
Simultaneously, the existence of sanctions in the community if the individual or
family does not run rules Banjar.
Overview of Work Life Balance and Workers Performance in Bali 123
2. Research Methods
This study uses quantitative and qualitative methods. Quantitative
methods of data collection was obtained by using a questionnaire or a
questionnaire to be filled by the respondents, the analysis used is descriptive
analysis using SPSS. Subjects were drawn using random sampling method from
the number of the working population and the Hindu Balinese living in Bali on
public and private companies. Total sample was 200 respondents. The new data
can be analyzed is 63 respondents.
Quantitative data collection tool using a 15 item scale adapted from tools
used Fisher-McAuley et al (2003) which includes the three dimensions of work
interference personal life (WIPL), personal life interference with work (WIPL)
and work/personal life enhancement (WIPL). Measurements were taken of the
performance measurement tool used by each of the companies where the
respondents worked.
Qualitative data were taken by using open ended questionnaires. The same
number of respondents from the quantitative data. The question in qualitative
research is associated with private life, family life, social and work life. Anything
that disturbs, what is felt when disturbed and what will be done to overcome
them.
3. Results
While respondent data were analyzed by the researcher is as much as 63
Respondents, with the minimum score is 21 and the maximum score is 88.
Average score of the respondents was 47.86 with a standard deviation is 12.472.
Furthermore, researchers categorization levels WLB scale to see the respondents
using the formula categorization scores, scores kategorian WLB variables and
their frequency and percentage. Highest per cent age was found in the cat e gory of
low scores, which means that as many as 36.5% of the study are in the low cat e gory
of work life bal ance.
De scrip tive data for the al lo ca tion of time spent for work ing and in per sonal
and so cial ac tiv i ties. Employees showed that most of the time work ing is 8 hours, 6
hours for sleep, whereas time for childcare and mar i tal af fairs as well as your self no
more than time for cus toms af fairs and great fam ily time ex ceeds 3 hours. This
means that cus toms af fairs and ex tended fam ily for the Ba li nese peo ple enough time
for con sum ing.
124 Dewi Puri Astiti
Performance data can be seen the level of per for mance of the re spon dents,
amount ing to 44.4% of re spon dents with mod er ate per for mance level, 23.8% of
re spon dents with a low level of per for mance, 19% of re spon dents with a high
per for mance level, 7.9% of re spon dents with very high lev els of per for mance, and
4.8% of re spon dents with very low lev els of per for mance.
In Personal Life, respondent states that it is his private life that interfere
with matters relating to 1) Economics: cost of living, accounts payable, 2) Family :
wife and child issues, disagreements with his wife, the problems related to
household affairs and health. 3) Problems in the social mores.
Respondents mentioned that it felt when his personal life is interrupted,
are :
1. Psychological disorders : confusion, negative emotions, stress,
uncomfortable, happy, anxious, upset, regret, irritability, difficulty
concentrating worked to depression.
2. Physical disorders : dizziness, sick, tired or exhausted, unable to sleep.
Respondents mentioned that done to take personal time is refreshing as a
walk, especially for women is shopping (shopping), personal care or relaxation,
reading books like philosophy books, doing sports activities, hobbies such as
watching tv conduct, fishing, surf, play games, raising cattle, doing housework,
parenting and rest or sleep.
On work life, respondents mentioned that the thing that bothers her life’s
work is related to the existence of personal problems that brought the current
work, such as personal and family life, personal debt, work is piling or amount of
work that has not been resolved because it is difficult to divide the working time
and family, the atmosphere is not conducive working environment both in terms
of leader/supervisor, from colleagues or from the workplace, the company
targets high that experienced pressure or high-pressure jobs and the rules are
quite strict working hours and health problems.
Respondents mentioned that it is perceived as working life is disrupted :
Decreased performance: not spirit, lazy work, feeling unproductive work time
feel disturbed, psychological disorders : stress, emotional upset, uncomfortable
and ill at ease in working. Physical disorders is physical fatigue, sleepiness, and
sore.
This is done if the respondent is interrupted working lives like refreshing
the streets or relaxation, Looking for a new job, joking with colleagues, Estella
Overview of Work Life Balance and Workers Performance in Bali 125
with family members, pray and invoke the guidance of God, doing a hobby while
working or at recess as listening to music, chatting, playing games.
Family life, respondents mentioned that it is disrupting the lives of his
family is related to economic issues related to the cost of living family, gossip
from neighbors, problems with large families, family member illness, poor
communication in the family, especially the husband-wife.
According to the respondents felt when family life is disrupted for example
Stress, the burden of thinking, fatigue, anxiety, hurt, guilt feelings in the family
(feel uncomfortable with the family).
Work life balance implies the extent to which individuals are equally
involved in and equally satisfied with their work role and family role (Greenhaus
and Singh, 2003). This means that if some one is hav ing stess at work or at home will
show up dis con tent in his per sonal life.
Respondents mentioned that done if family life is disrupted to be ignore
and continue the activity as usual, trying to communicate to find a bright spot or
a good settlement, spending time with the family with the streets or home village,
Trying to be patient and pray, trying to balance the all matters in order to avoid
the intersection. Social Life, respondents mentioned that annoying thing is the
social life of things related to the gossip of neighbors or no neighbors envy, and
lack of time socializing with the environment.
Respondents mentioned that it is perceived as social life is distrupted
feeling uncomfortable, the burden of thinking, Feeling guilty and embarrassed,
denting or confused split time, less confident when dealing with the environment
and Shame because rarely socialize.
Respondents mentioned that done if social life is disrupted as silent and
calm down, move the environment, to apology if trouble with neighbors, pray for
fortitude, Limiting relationships with the community and try to positive
communicate.
Re spon dent‘s life sat is fac tion data showed that 42.9 % of re spon dents do not
feel sat is fied with life now, 33.3% of re spon dents are sat is fied with their lives
now and feel grate ful for what you al ready have, as well as 23.8% of re spon dents
un de cided. Cri te ria life sat is fac tion ac cord ing to the re spon dent, namely liv ing
needs are met, can help oth ers, eco nomic ad e quate, good phys i cal health, have
time for fam ily and work balance and customs.
126 Dewi Puri Astiti
4. Conclusion and Discussion
Picture of work life balance of the results of the study found the highest
percentage of low scoring categories, which means that as many as 40 % of the
study are in the lower category of work life balance, supported by the results of
the qualitative analysis showed that 54.0 % of respondents felt that life work,
family and social well-balanced yet.
Factors influential in determining the low work life balance because of the
division of time between family, social life and customs like mebanjar and another
ritual activity especially personal and unbalanced labor, economic conditions are
less well established manageman followed by poor financial, health-related
physical condition is not good.
Referring to the opinion of Robert Taylor (2007), related to the imbalance
between life and work caused by :
“Over work in our society is seen as a primary cause of growing ill health,
both physical and mental”.
For Balinese respondents were quite bonded with customs activity, lack of
time for socializing and indigenous activism sufficient psychological effect on
the employee, where the employee feels uncomfortable, the burden of thinking,
Feeling guilty and embarrassed, denting or confused split time, lack of
confidence when dealing Shame because the environment and rarely socialize.
This phe nom e non is in line with the re sult of re search of Mc Don ald et al,
(2005), Em ployee work life bal ance pri or i ties are con sid ered to fall within three
gen eral cat e go ries: work ing time ar range ment (to tal work ing hours and
flex i bil ity, and for those with parenting or other care re spon si bil i ties pa ren tal
leave entitlements (ma ter nity, pa ter nity, pa ren tal and carers) and childcare
(subsidies or direct provision).
References
Chandaria, Ishita, Work life Balance : A Study of Dual Career Family in Medical
Sector, Khargar, India : Institute for Technology and Management. 2013.
Fisher-McAuley, G., J. Stanton, J. Jolton and J. Gavin, “Modelling the relationship
between work life balance and organisational outcomes”, Paper presented at the
Annual Conference of the Society for Industrial-Organisational Psychology,
Orlando, April 12, 2003, 1-26.
Overview of Work Life Balance and Workers Performance in Bali 127
Greenhaus J. H and R. Singh, 2003. Work family linkages, A. Sloan work family
encyclopedia entry available online at http: wfnetwork.bc.edu/ 1 oktober 2008.
McDonald, P., K. Brown and L. Bradley, “Explanation for the provision utilization gap
in work life policy”, Woman in Management Review, 2005.
Schein, Edgar, Examination of the Employee Work-Life Balance Within
Healthy Organizational Cultures, Thesis, Faculty in Communication
and Leadership Studies. Gonzaga University. USA, 2010.
Simanjuntak, Payaman, “Managemen Kinerja”, Jurnal Ekonomi Universitas,
Indonesia, Jakarta, 2005.
Robert, Taylor, The Future of Work Life Balance, London : Economic & Social Research
Council (ESRC), 2007. ê
128 Dewi Puri Astiti
Article Received on March 12, 2015; Accepted on March 22, 2015
11
Comparison of E-image and True Image
of Printed Cotton Fabrics
Sarabjeet Kaur* and Surabhi Mahajan**
This paper describes a comparison of the e-image and true image of printed cotton fabrics.
Documentation of different methods of creating e-image for printed cotton fabrics was done by using
the secondary sources and informal interviews with fashion designers, graphic designers and
merchandisers from ten randomly selected apparel industries of Ludhiana. According to their three
popular techniques were selected for the study. These were designing software, Digital camera and
Scanning the fabric. To have more variety and options, three models of each selected technique was
taken on the basis of their usage in various apparel industries and e-images were created. While
taking the printout all variables like background colour, quality of paper, type of printer, ink etc will
be kept as control. A panel of judges was asked to rank the models as I, II and III depending upon
clarity and closeness of e-image created by them with original fabric sample. The most preferred
model for each technique was used for further study. The final data was collected from ninety college
going students and twenty professionals by using an interview schedule. The sample was selected by
using sample random sampling technique. The results revealed that the majority of the student
respondents belonged to the age group of 16-20 years. As far as their education was concerned, it was
found out that 67.77 percent of the respondents were graduate. Ninety three percent of the students
were aware of various e-images as they were computer savvy and used internet quite often. As for as
professionals were concerned the results revealed that the majority of the professional respondents
belonged to the age group of 30-35 years. As far as their education was concerned, it was found out
that 60 percent of the respondents were post graduate. Fifty percent of the respondents were teachers
from department of apparel and textile science PAU, Ludhiana and majority of the respondent had
10-20 years experience. According to the collected data, scanning the fabric samples was considered
CONTEMPORARY SOCIAL SCIENCES, Vol. 24, Number 1 (January-March), 2015
* Student, M. Sc. Fashion Designing, Department of Apparel and Textile Science, Collegeof Home Science, PAU, Ludhiana, Punjab (India) E-mail: <[email protected]>
** Assistant Professor, Department of Apparel and Textile Science, College of HomeScience, Punjab Agricultural University, Ludhiana, Punjab (India) E-mail:<[email protected]>
to be the best technique of creating e-image of printed cotton fabric followed by designing on Adobe
Photoshop and lastly by clicking photographs through digital camera. Both professionals in
designing field and students who are well aware of e-image feel that the e-image created by scanning
the fabric sample was the best method for creating e-image of printed cotton fabrics as far as clarity
and closeness of the image is concerned with respect to the original fabric sample.
[Keywords : E-image, True Image, Cotton fabrics, Computer technology,
Apparel designing]
1. Introduction
Computers are now part of our lives, they play important role in business,
education, health care, fashion etc. Computer technology has become so much a
part of our lives that imagining a day without it has become out of question. It is
there in all spheres of life. Even our enjoyment is being controlled by the
computer technology. It can be regarded as the greatest contribution of science, a
realization of the dream, “global village”. In the high profile world of fashion
design, the emphasis is increasingly placed on selling a dream rather then on
describing the cut and construction of garments. The image of a fashion designer
sitting up all night with a sketch pad and pencil, some fabric, a sewing machine, a
model, and a dream is a romanticized one from past. In today’s fashion world,
CAD has become a major part of the design process. CAD stands for
Computer-Aided Design. The design and production of garments is the work of a
team of individuals, each of whom specializes in a different process. A designer
or design team will first produce sketches of garment to obtain different styles.
The artistic rendering of a garment is there to create a mood and is typically
supplemented with precise line drawings called flats. With more frequent use of
computers, a designer sketches and manipulates the result with image scan or
editing software or draw directly onto computers interface with sensor equipped
pen and special tablet. Since computers can store and project various styles,
fabrics and colours can be interchanged at the click of a button, the design of a
garment can be altered with much ease and comfort. Due to this, even the
product development team and merchandisers also become involved in design
process. Once the styles are determined, the biggest challenge for a designer is to
have an image with fabric, accessories, trims and other detailing so that final look
of garment can be conceived and finalized with the buyer.
There are many methods of creating e-image of the paper designs and their
details. For example, scanning the design and even fabric to be used, taking
130 Sarabjeet Kaur and Surabhi Mahajan
photographs of physical objects and transferring the image on computer or CAD
software for direct drawing (Pascal and Thalmann, 2000).
A photograph or photo is an image created by light falling on a light-
sensitive surface, usually photographic film or an electronic image such as a CCD
or a CMOS chip. Most photographs are created using a camera, which uses a lens
to focus the scene’s visible wavelengths of light into a reproduction of what the
human eye would see. The process and practice of creating photographs is called
photography.
Computer scanners are used to transfer images or text into a computer.
There are special models for scanning fabrics and other three dimensional
objects. In the computer, the signal from the scanner is transferred to a digital
image. This image can then be edited, printed, etc. All scanners have special parts
which are used to take a picture from an object. Charge-coupled device or contact
image sensor parts take the light from the object and change it to a digital signal.
The digital signal is then transferred to the computer memory or is read in
scanner’s processor. With some software it can be changed to compressed digital
image, like JPEG or PNG.
The uses for CAD software are almost endless, to create blueprints for a
building, to design a machine, or to create layouts for a fashion piece. CAD is
most often used in the drafting of architecture and contracting, or technical
designing by engineers. It has just recently been adopted by the fashion industry,
but its popularity is growing. Very fast with CAD software, a designer can not
only see her creations as a digital image, but also create scale on her pieces and
denote dimensions of sleeves and hems. This saves time by limiting the need for
tailoring and other later adjustments. Another benefit of using CAD when
designing clothes is a designer can see her design on a virtual model and then
play with color and fabric choices to perfect that design. Time constraint is very
important in any application which can be effectively achieved by CAD where
less time is required to achieve good quality product as reported by Anbumani et
al (2001).
CAD is used in fashion industry. Although most designers initially sketch
designs by hand, a growing number also translate these hand sketches to the
computer. CAD allows designs of clothing on virtual models and in various
colours and shapes, thus saving time by requiring fewer adjustments of
prototypes and samples later (Anon, 2005).
Comparison of E-image and True Image of Printed Cotton Fabrics 131
Technological advancement has brought automation and computer aided
designing/computer aided manufacturing (CAD/CAM) systems in all the areas
of manufacturing including textile and garment industry. Automation can be
achieved by shortening the process, by using electronics, computer and
innovative techniques and by eliminating the conventional processes Singh
(2002). The simplest and most widely used full-reference quality metric is the
mean squared error (MSE), computed by averaging the squared intensity
differences of distorted and reference image pixels on computer along with the
related quantity of peak signal-to-noise ratio (PSNR). These are appealing
because they are simple to calculate, have clear physical meanings, and are
mathematically convenient in the context of optimization. But they are not very
well matched to perceived visual quality. In the last three decades, a great deal of
effort has gone into the development of quality assessment methods of e-image
that take advantage of known characteristics of the human visual system (HVS)
(Wang et. al., 2004).
Today, IT gives the designer various options without actually wasting
time, money and efforts towards expensive sampling. Value addition can now be
achieved through innovative designs both in the fabric and garment processes to
meet consumer demands which make it imperative for a garment supplier to
invest in garment manufacturing tools. Design software for knits allows the
creation of knit structures, knit design simulations etc. Fabric information on
CAD is then converted into movement of needles; arrangement of feeders etc. IT
plays the role of transmitting this information to the knitting machine and
thereby making the handling of even difficult jacquard easy. Colour Information
Management Systems (CIMS) enable retailers, product developer and designers
to create and electronically communicate precise colours with their suppliers
anywhere in the world (Marwaha, 2002).
Computer is capable of performing many designs related tasks. Designers
now have access to computer networks that connect with large computer
processing systems, making exact amount of information available instantly for
design application (Allen and Stimpeon, 1990).
Computers have also changed the production time and cost of designing.
CAD system permit designers to see a pattern or garment design on computer
screen, print on paper without having to knit a sample. Computerized designs
can be made in few minutes rather than hours Stephens (1999). Designers use
132 Sarabjeet Kaur and Surabhi Mahajan
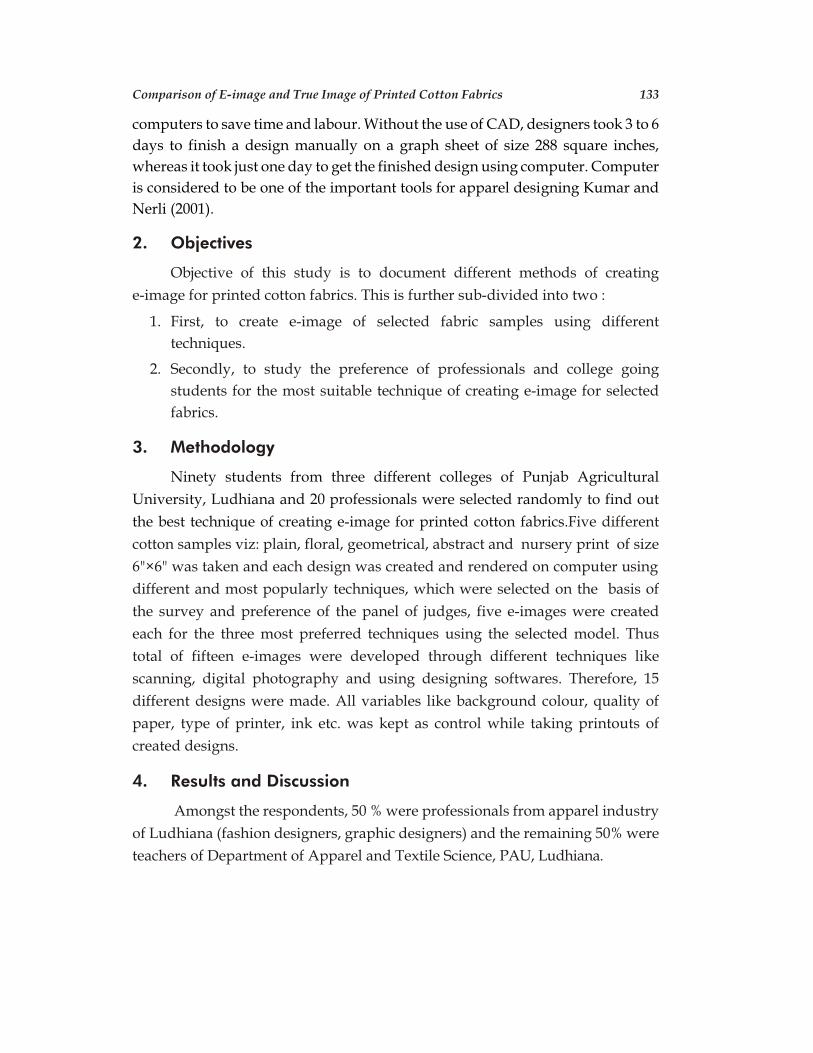
computers to save time and labour. Without the use of CAD, designers took 3 to 6
days to finish a design manually on a graph sheet of size 288 square inches,
whereas it took just one day to get the finished design using computer. Computer
is considered to be one of the important tools for apparel designing Kumar and
Nerli (2001).
2. Objectives
Objective of this study is to document different methods of creating
e-image for printed cotton fabrics. This is further sub-divided into two :
1. First, to create e-image of selected fabric samples using different
techniques.
2. Secondly, to study the preference of professionals and college going
students for the most suitable technique of creating e-image for selected
fabrics.
3. Methodology
Ninety students from three different colleges of Punjab Agricultural
University, Ludhiana and 20 professionals were selected randomly to find out
the best technique of creating e-image for printed cotton fabrics.Five different
cotton samples viz: plain, floral, geometrical, abstract and nursery print of size
6"×6" was taken and each design was created and rendered on computer using
different and most popularly techniques, which were selected on the basis of
the survey and preference of the panel of judges, five e-images were created
each for the three most preferred techniques using the selected model. Thus
total of fifteen e-images were developed through different techniques like
scanning, digital photography and using designing softwares. Therefore, 15
different designs were made. All variables like background colour, quality of
paper, type of printer, ink etc. was kept as control while taking printouts of
created designs.
4. Results and Discussion
Amongst the respondents, 50 % were professionals from apparel industry
of Ludhiana (fashion designers, graphic designers) and the remaining 50% were
teachers of Department of Apparel and Textile Science, PAU, Ludhiana.
Comparison of E-image and True Image of Printed Cotton Fabrics 133
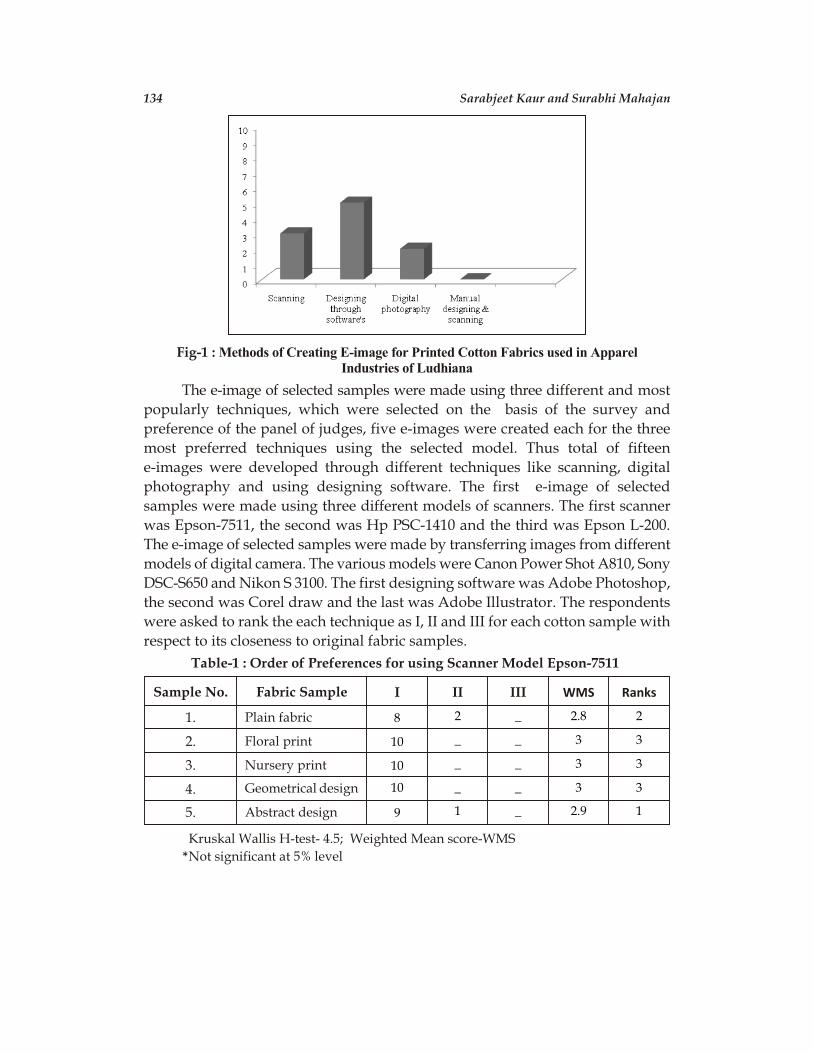
Fig-1 : Methods of Creating E-image for Printed Cotton Fabrics used in ApparelIndustries of Ludhiana
The e-image of selected samples were made using three different and most
popularly techniques, which were selected on the basis of the survey and
preference of the panel of judges, five e-images were created each for the three
most preferred techniques using the selected model. Thus total of fifteen
e-images were developed through different techniques like scanning, digital
photography and using designing software. The first e-image of selected
samples were made using three different models of scanners. The first scanner
was Epson-7511, the second was Hp PSC-1410 and the third was Epson L-200.
The e-image of selected samples were made by transferring images from different
models of digital camera. The various models were Canon Power Shot A810, Sony
DSC-S650 and Nikon S 3100. The first designing software was Adobe Photoshop,
the second was Corel draw and the last was Adobe Illustrator. The respondents
were asked to rank the each technique as I, II and III for each cotton sample with
respect to its closeness to original fabric samples.
Table-1 : Order of Preferences for using Scanner Model Epson-7511
Sample No. Fabric Sample I II III WMS Ranks
1. Plain fabric 8 2 _ 2.8 2
2. Floral print 10 _ _ 3 3
3. Nursery print 10 _ _ 3 3
4. Geometrical design 10 _ _ 3 3
5. Abstract design 9 1 _ 2.9 1
Kruskal Wallis H-test- 4.5; Weighted Mean score-WMS
*Not significant at 5% level
134 Sarabjeet Kaur and Surabhi Mahajan
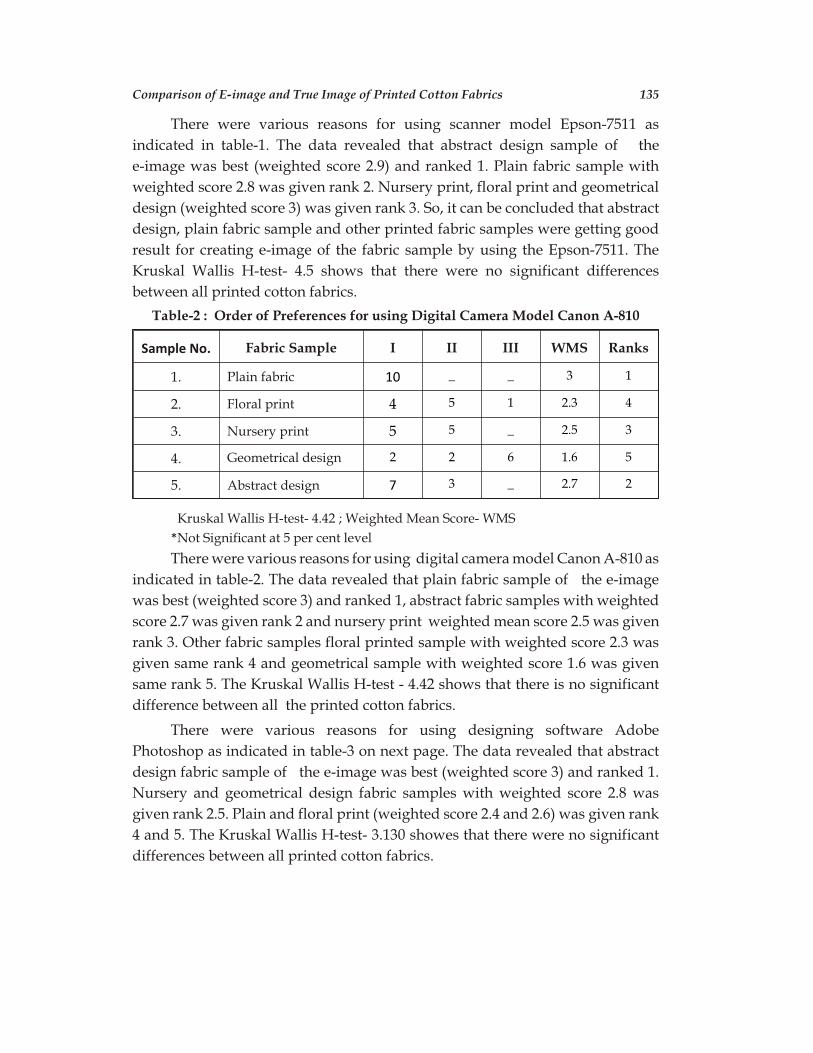
There were various reasons for using scanner model Epson-7511 as
indicated in table-1. The data revealed that abstract design sample of the
e-image was best (weighted score 2.9) and ranked 1. Plain fabric sample with
weighted score 2.8 was given rank 2. Nursery print, floral print and geometrical
design (weighted score 3) was given rank 3. So, it can be concluded that abstract
design, plain fabric sample and other printed fabric samples were getting good
result for creating e-image of the fabric sample by using the Epson-7511. The
Kruskal Wallis H-test- 4.5 shows that there were no significant differences
between all printed cotton fabrics.
Table-2 : Order of Preferences for using Digital Camera Model Canon A-810
Sample No. Fabric Sample I II III WMS Ranks
1. Plain fabric 10 _ _ 3 1
2. Floral print 4 5 1 2.3 4
3. Nursery print 5 5 _ 2.5 3
4. Geometrical design 2 2 6 1.6 5
5. Abstract design 7 3 _ 2.7 2
Kruskal Wallis H-test- 4.42 ; Weighted Mean Score- WMS
*Not Significant at 5 per cent level
There were various reasons for using digital camera model Canon A-810 as
indicated in table-2. The data revealed that plain fabric sample of the e-image
was best (weighted score 3) and ranked 1, abstract fabric samples with weighted
score 2.7 was given rank 2 and nursery print weighted mean score 2.5 was given
rank 3. Other fabric samples floral printed sample with weighted score 2.3 was
given same rank 4 and geometrical sample with weighted score 1.6 was given
same rank 5. The Kruskal Wallis H-test - 4.42 shows that there is no significant
difference between all the printed cotton fabrics.
There were various reasons for using designing software Adobe
Photoshop as indicated in table-3 on next page. The data revealed that abstract
design fabric sample of the e-image was best (weighted score 3) and ranked 1.
Nursery and geometrical design fabric samples with weighted score 2.8 was
given rank 2.5. Plain and floral print (weighted score 2.4 and 2.6) was given rank
4 and 5. The Kruskal Wallis H-test- 3.130 showes that there were no significant
differences between all printed cotton fabrics.
Comparison of E-image and True Image of Printed Cotton Fabrics 135
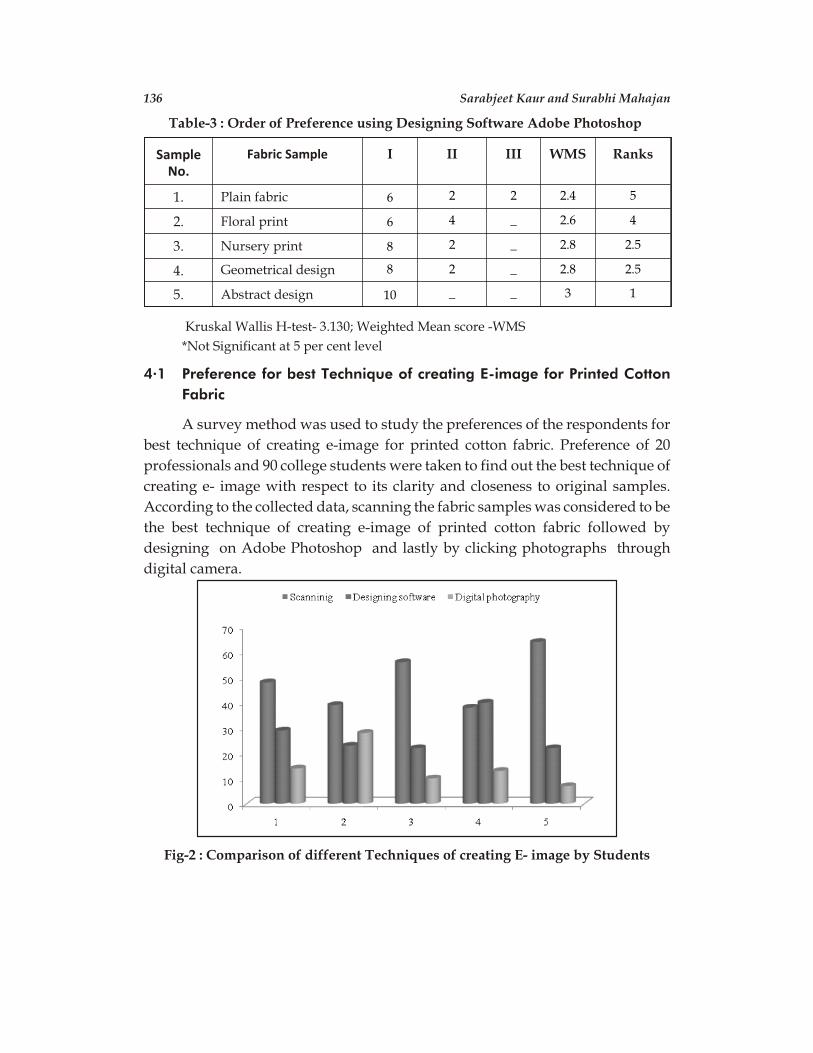
Table-3 : Order of Preference using Designing Software Adobe Photoshop
SampleNo.
Fabric Sample I II III WMS Ranks
1. Plain fabric 6 2 2 2.4 5
2. Floral print 6 4 _ 2.6 4
3. Nursery print 8 2 _ 2.8 2.5
4. Geometrical design 8 2 _ 2.8 2.5
5. Abstract design 10 _ _ 3 1
Kruskal Wallis H-test- 3.130; Weighted Mean score -WMS
*Not Significant at 5 per cent level
4.1 Preference for best Technique of creating E-image for Printed Cotton
Fabric
A survey method was used to study the preferences of the respondents for
best technique of creating e-image for printed cotton fabric. Preference of 20
professionals and 90 college students were taken to find out the best technique of
creating e- image with respect to its clarity and closeness to original samples.
According to the collected data, scanning the fabric samples was considered to be
the best technique of creating e-image of printed cotton fabric followed by
designing on Adobe Photoshop and lastly by clicking photographs through
digital camera.
Fig-2 : Comparison of different Techniques of creating E- image by Students
136 Sarabjeet Kaur and Surabhi Mahajan
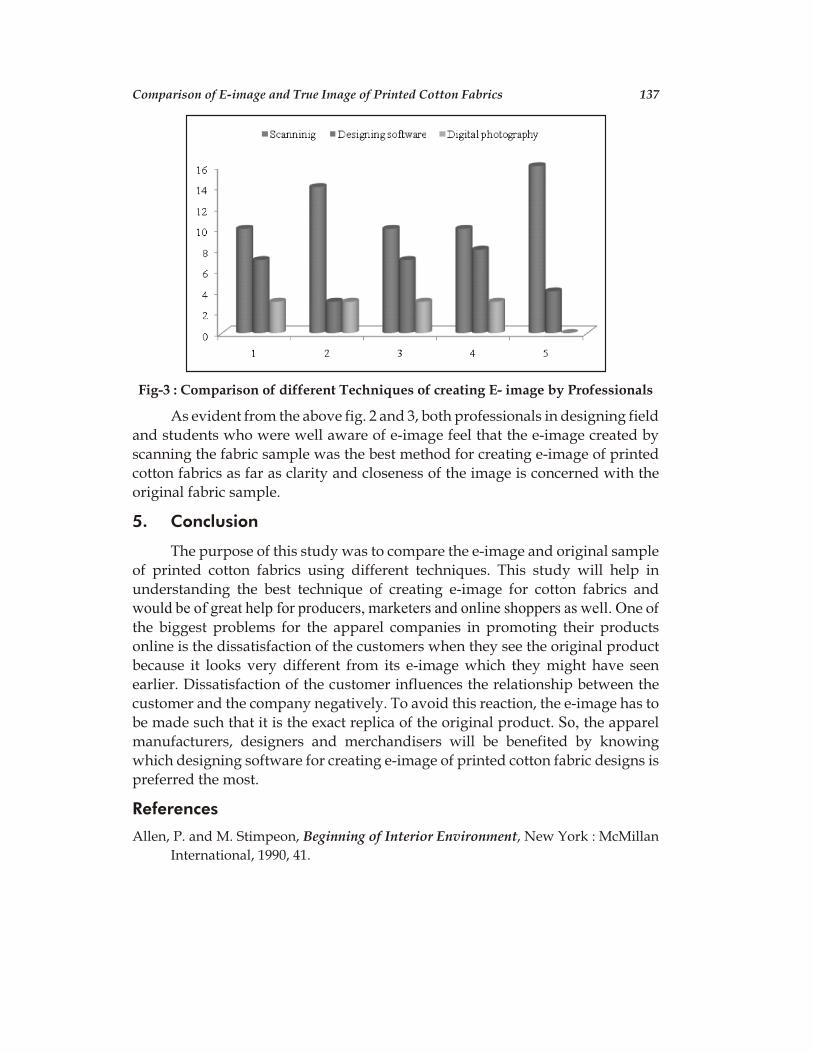
Fig-3 : Comparison of different Techniques of creating E- image by Professionals
As evident from the above fig. 2 and 3, both professionals in designing field
and students who were well aware of e-image feel that the e-image created by
scanning the fabric sample was the best method for creating e-image of printed
cotton fabrics as far as clarity and closeness of the image is concerned with the
original fabric sample.
5. Conclusion
The purpose of this study was to compare the e-image and original sample
of printed cotton fabrics using different techniques. This study will help in
understanding the best technique of creating e-image for cotton fabrics and
would be of great help for pro duc ers, mar ket ers and on line shop pers as well. One of
the big gest prob lems for the ap parel com pa nies in pro mot ing their prod ucts
on line is the dis sat is fac tion of the cus tom ers when they see the orig i nal prod uct
be cause it looks very dif fer ent from its e-im age which they might have seen
ear lier. Dis sat is fac tion of the cus tomer in flu ences the re la tion ship be tween the
cus tomer and the com pany neg a tively. To avoid this re ac tion, the e-im age has to
be made such that it is the ex act rep lica of the orig i nal prod uct. So, the ap parel
man u fac tur ers, de sign ers and mer chan dis ers will be bene fited by know ing
which de sign ing soft ware for cre at ing e-im age of printed cot ton fab ric de signs is
pre ferred the most.
References
Allen, P. and M. Stimpeon, Beginning of Interior Environment, New York : McMillan
International, 1990, 41.
Comparison of E-image and True Image of Printed Cotton Fabrics 137
Anbumani, N., S. Balakumar and P. Kanddharvadivu, “A Review of Circular Knitting
Technology”, Ind Tex J, 112(10), 2001, 141-46.
Kumar, B. R. and S. A. Nerli, “Dharmavaram : Role of a Designer in Silk Industry”,
Indian Silk, 40 (4), 2001, 18-20.
Marwaha, M., “IT and Knitting : The Essential Blend”, Ind Tex J, 112(7), 2002, 69-73.
Mayer, Karl, “New Computer Concept for all Machines (German)”, Melliand 86(5),
2005, L 330 E 70.
Pascal, V. and N. Magnenat Thalmann, Clothing 3D Virtual Humans : Theory and
Practice, Tokyo, New York, Berlin, Heidelberg : Springer Verlag, 2000, 283.
Singh, P., “Automation in spinning”, J Tex Assoc, 63(91), 2002, 9-11.
Stephens G., Apparel Production-Production of Knitwear Fashion-from Concept to
Consumer, USA : Prentice Hall, Inc., 1999, 224-26.
Wang, Z., A. C. Bovik, H. R. Sheikh and E. P. Simoncelli, “Image Quality Assessment :
From Error Visibility to Structural Similarity”, IEEE Transactions on Image
Processing, 13(4), 2004, 600-12. ê
138 Sarabjeet Kaur and Surabhi Mahajan
Article Received on February 13, 2015; Accepted on March 19, 2015
12
Research on Agricultural Products
Trade Current Situation and its
Competitiveness in China
under Financial Crisis
Shasha Li*
This paper analysis the current trade situation of agriculture products in China under
financial crisis from the following three aspects : change of import and export of agricultural
products, trade structure of agricultural products, distribution of trade competition advantage of
major agricultural products varieties. Analysis results show that currently China’s agriculture
products exports expanded faster than imports, there are noticeable trends that agriculture products
self-sufficiency declined and agriculture products foreign trade market multilateral distribution,
agriculture products foreign trade mainly focus on land intensive and labor-intensive agricultural
products, vegetables, tea, coffee hold the absolute advantage in agriculture products foreign trade in
China, however, grain, animal and vegetable oil in the dry tree.
[Keywords : Trade, Advantage, Disadvantage, Import, Export]
1. Introduction
China’s agricultural product trade maintain sustained growth momentum
since entry WTO in 2001, According to the data issue by ministry of agriculture,
agricultural product trade value has raised to $175.7 billions in 2012 from 27.9
$billions in 2001, the average annual growth rate is 12.06%; look from the
absolute number, total value of trade, import value and export value of
agricultural products all showed a trend of increase year by year; however, look
CONTEMPORARY SOCIAL SCIENCES, Vol. 24, Number 1 (January-March), 2015
* Ph. D. Student, Econometrics and Management College of China Agriculture University,Haidian District, Beijing (China) E-mail: <[email protected]>
from the relative quantity, agricultural products export growth is lower than
import, And net exports decline significantly.
The influence of the external environment and domestic agricultural
products markets supply-demand relationship changed since 2004 lead to
China’s agricultural product trade pattern began to change, Agricultural imports
scale larger than exports, China become agricultural product net importer who
used to be trade net importer exporter. meanwhile, Imports scale and trade
deficit are Showing a trend of growing. Affected by the outbreak of the financial
crisis hit in 2007, as a result of the contraction in external agricultural product
demand and rising trade protectionism, China’s agricultural product trade still
faces a grim picture. It is obvious that China’s agricultural trade is facing a series
of risks and challenges currently in the context of the financial crisis, For instance,
the imbalance of population explosion and Soil and water resources shortage has
worsened, upward pressure on the Renminbi, Global climate changes, frequent
natural disasters, Agricultural labor force cost rise, much uncertainty in
International trade environment change and so on. How to take measures to
eliminate adverse effects led by financial crisis, it is urgent for us to think and
solve the problem of the adjustment the foreign trade strategy at present and in
the years to come to Turn challenges into opportunities, promote modern
agriculture process, upgrade Comprehensive agricultural productivity and
agricultural products international market competitiveness.
2. Review of Literature
At present, there are lots of literatures carried out extensive and in-depth
research on agricultural products foreign trade, for example ,Niu baojun(2001)
Analysis of agricultural products foreign trade policy adjustment along with
great change in the international economic situation from both aspects of
Southeast Asian financial crisis and China’s accession to the WTO[7]. Sun
dongsheng, Liu heguang (2011) analyzes structure, characteristics and
comparative advantage of the agricultural products trade between China and
South America, The results show that South America is the main source of
agricultural products trade deficit with China, there are obvious
complementarity characteristics and potential trade expansion between China
and South America countries.[8] Chen longjiang (2012) research on China’s
agricultural products export environment status and change trend under
financial crisis from three aspects : Global economy and the agricultural product
140 Shasha Li
trade development trend, the change trend of trade liberalization, trend of trade
barriers.[9]
Looking from research methods of the agricultural products foreign trade,
Most scholars carry out the research by using the econometric model and the
mathematical functions, for instance, Sheng bin,Liao mingzhong (2004) evaluate
export potential of china to more than 40 major trading partners by using the
gravity model, Inspected decision of Export trade flows of emerging marketing
economy.[2] Gao yin,Tian weiming (2008) carried out quantitative analysis on the
soybean trade influencing factors in our country based on gravity model, the
results prove that soybean import prices, industrial policies of trading partners,
China’s soybean market openness have a significant impact on China’s soybean
trade patterns change;[3] Lin jian,Huo shangyi (2008) establish gravity model for
fruit export trade, analyzes the influence factors of Chinese fruits export trade
empirically, the study shows that the GDP of fruits importer, value of China
agricultural production, The bilateral real exchange rates, whether the two sides
are the Asia-pacific economic cooperation (APEC) member countries, Whether
China’s accession to the WTO have a marked impact on China’s fruit export
trade.[4]Chen longjiang, Huang zuhui (2005) conducted empirical research on
China’s agricultural economy and agricultural products foreign trade growth by
using export expansion type of aggregate production function model,
Conclusion shows that after joining the WTO, agricultural products foreign trade
makes more and more contribution to the agricultural economic growth.[5]Pan
su,Tan yanwen (2011) Has analyzed the relationship between import and export
of agriculture and agricultural economic growth by using Modern economy
economic approach. The results show that our country import and export of
agricultural products and agricultural economic growth have been in virtuous
circle.[6]
With a review of the existing literature at home and abroad and
summarizing, the author found that there are three shortcomings. First of all,
most of the literature only focus on the agricultural products trade between
China and some agricultural products Trading partners, very few paper
combined China with several agricultural products Trading partners to carry out
research at a macro level; Secondly, the existing literature is only consider trade
competitive advantage of major agricultural products variety, rarely considered
distribution of trade competition advantage of china’s major agricultural
products variety; Thirdly, there are few literatures comparing Export trade
competition of the major agricultural products variety in the import and export
Research on Agricultural Products Trade Current Situation and its Competitiveness 141
structure of agricultural products for China and its agricultural products trading
partners.
To make up for a lack of the study, this paper research on current china
agricultural products trade in the context of financial crisis. the author not only
combined china and its major agricultural products trading partners at a macro
level, but also analyzed the export trade competitiveness of the major agriculture
products variety in china from both Agricultural products export structure and
Different agricultural products trade region by using trade comparative index.
3. The Current Trade Situation of China’s Agriculture Productsunder Financial Crisis
China is a big trading nation rather than trading power. look at the value of
agriculture products trade, now China has already become the world’s third
largest agricultural trade big country and the largest trading nation in
developing countries, Agricultural trade is an important part of the whole
foreign trade system in our country. China’s agricultural products trade patterns
are changing in the context of the global financial crisis and Irreversible trend of
economic globalization and trade liberalization. Overall, both Import and export
scale of agricultural products show growth tendency, but the growth rate is
falling, trade deficit trend is obvious (As shown in figure 1). China’s agricultural
products suffer from technical trade barriers, green trade barriers and
anti-dumping investigation in foreign trade among developed countries such as
South Korea, Japan, United States and Russia. Meanwhile, the imbalance
between rigid demand for agriculture products grow with domestic population
surge and agriculture production restrained by resources and environment
resulting in increasing agriculture products external dependency. Agricultural
exports scale reduction and import growth are the overall pattern of China’s
agricultural products trade under current financial crisis, the main characteristics
are as follows :
3.1 Agricultural products trade maintain sustainable growth, Imports grew
faster than exports
Both import and export trade of agricultural products in China continues to
maintain sustainable growth since entry WTO in the year 2001, agricultural
products trade deficit continued to maintain within the scope of $8 billion before
the outbreak of the financial crisis in 2007. As the financial crisis deepened, the
United States faces a fiscal cliff and euro-area suffers from debt crisis, trade
142 Shasha Li
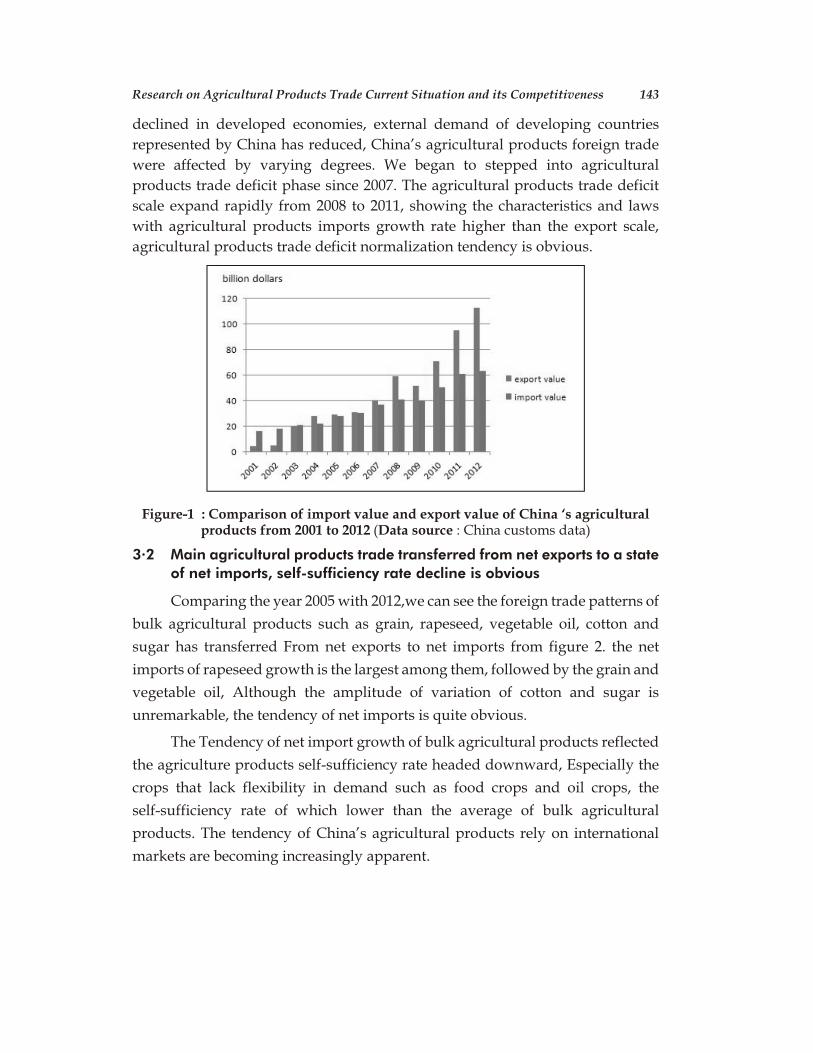
declined in developed economies, external demand of developing countries
represented by China has reduced, China’s agricultural products foreign trade
were affected by varying degrees. We began to stepped into agricultural
products trade deficit phase since 2007. The agricultural products trade deficit
scale expand rapidly from 2008 to 2011, showing the characteristics and laws
with agricultural products imports growth rate higher than the export scale,
agricultural products trade deficit normalization tendency is obvious.
Figure-1 : Comparison of import value and export value of China ‘s agriculturalproducts from 2001 to 2012 (Data source : China customs data)
3.2 Main agricultural products trade transferred from net exports to a state
of net imports, self-sufficiency rate decline is obvious
Comparing the year 2005 with 2012,we can see the foreign trade patterns of
bulk agricultural products such as grain, rapeseed, vegetable oil, cotton and
sugar has transferred From net exports to net imports from figure 2. the net
imports of rapeseed growth is the largest among them, followed by the grain and
vegetable oil, Although the amplitude of variation of cotton and sugar is
unremarkable, the tendency of net imports is quite obvious.
The Tendency of net import growth of bulk agricultural products reflected
the agriculture products self-sufficiency rate headed downward, Especially the
crops that lack flexibility in demand such as food crops and oil crops, the
self-sufficiency rate of which lower than the average of bulk agricultural
products. The tendency of China’s agricultural products rely on international
markets are becoming increasingly apparent.
Research on Agricultural Products Trade Current Situation and its Competitiveness 143
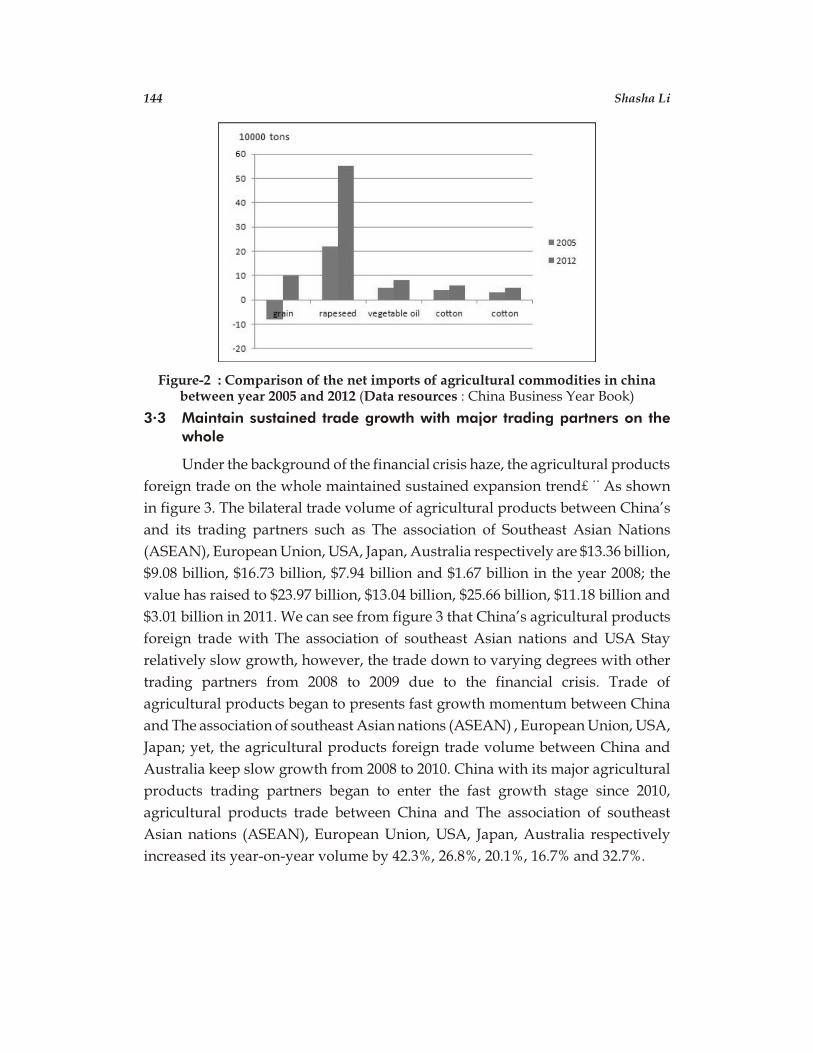
Figure-2 : Comparison of the net imports of agricultural commodities in chinabetween year 2005 and 2012 (Data resources : China Business Year Book)
3.3 Maintain sustained trade growth with major trading partners on the
whole
Under the background of the financial crisis haze, the agricultural products
foreign trade on the whole maintained sustained expansion trend£¨As shown
in figure 3. The bilateral trade volume of agricultural products between China’s
and its trading partners such as The association of Southeast Asian Nations
(ASEAN), European Union, USA, Japan, Australia respectively are $13.36 billion,
$9.08 billion, $16.73 billion, $7.94 billion and $1.67 billion in the year 2008; the
value has raised to $23.97 billion, $13.04 billion, $25.66 billion, $11.18 billion and
$3.01 billion in 2011. We can see from figure 3 that China’s agricultural products
foreign trade with The association of southeast Asian nations and USA Stay
relatively slow growth, however, the trade down to varying degrees with other
trading partners from 2008 to 2009 due to the financial crisis. Trade of
agricultural products began to presents fast growth momentum between China
and The association of southeast Asian nations (ASEAN) , European Union, USA,
Japan; yet, the agricultural products foreign trade volume between China and
Australia keep slow growth from 2008 to 2010. China with its major agricultural
products trading partners began to enter the fast growth stage since 2010,
agricultural products trade between China and The association of southeast
Asian nations (ASEAN), European Union, USA, Japan, Australia respectively
increased its year-on-year volume by 42.3%, 26.8%, 20.1%, 16.7% and 32.7%.
144 Shasha Li
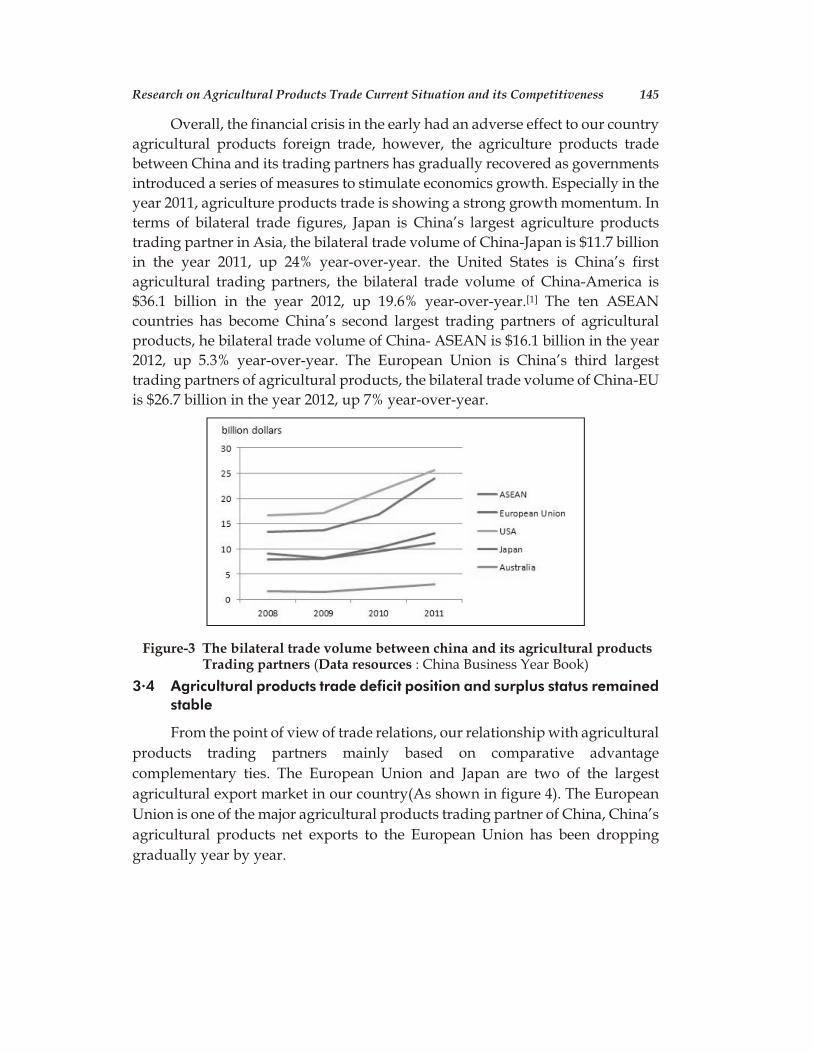
Overall, the financial crisis in the early had an adverse effect to our country
agricultural products foreign trade, however, the agriculture products trade
between China and its trading partners has gradually recovered as governments
introduced a series of measures to stimulate economics growth. Especially in the
year 2011, agriculture products trade is showing a strong growth momentum. In
terms of bilateral trade figures, Japan is China’s largest agriculture products
trading partner in Asia, the bilateral trade volume of China-Japan is $11.7 billion
in the year 2011, up 24% year-over-year. the United States is China’s first
agricultural trading partners, the bilateral trade volume of China-America is
$36.1 billion in the year 2012, up 19.6% year-over-year.[1] The ten ASEAN
countries has become China’s second largest trading partners of agricultural
products, he bilateral trade volume of China- ASEAN is $16.1 billion in the year
2012, up 5.3% year-over-year. The European Union is China’s third largest
trading partners of agricultural products, the bilateral trade volume of China-EU
is $26.7 billion in the year 2012, up 7% year-over-year.
Figure-3 The bilateral trade volume between china and its agricultural productsTrading partners (Data resources : China Business Year Book)
3.4 Agricultural products trade deficit position and surplus status remained
stable
From the point of view of trade relations, our relationship with agricultural
products trading partners mainly based on comparative advantage
complementary ties. The European Union and Japan are two of the largest
agricultural export market in our country(As shown in figure 4). The European
Union is one of the major agricultural products trading partner of China, China’s
agricultural products net exports to the European Union has been dropping
gradually year by year.
Research on Agricultural Products Trade Current Situation and its Competitiveness 145
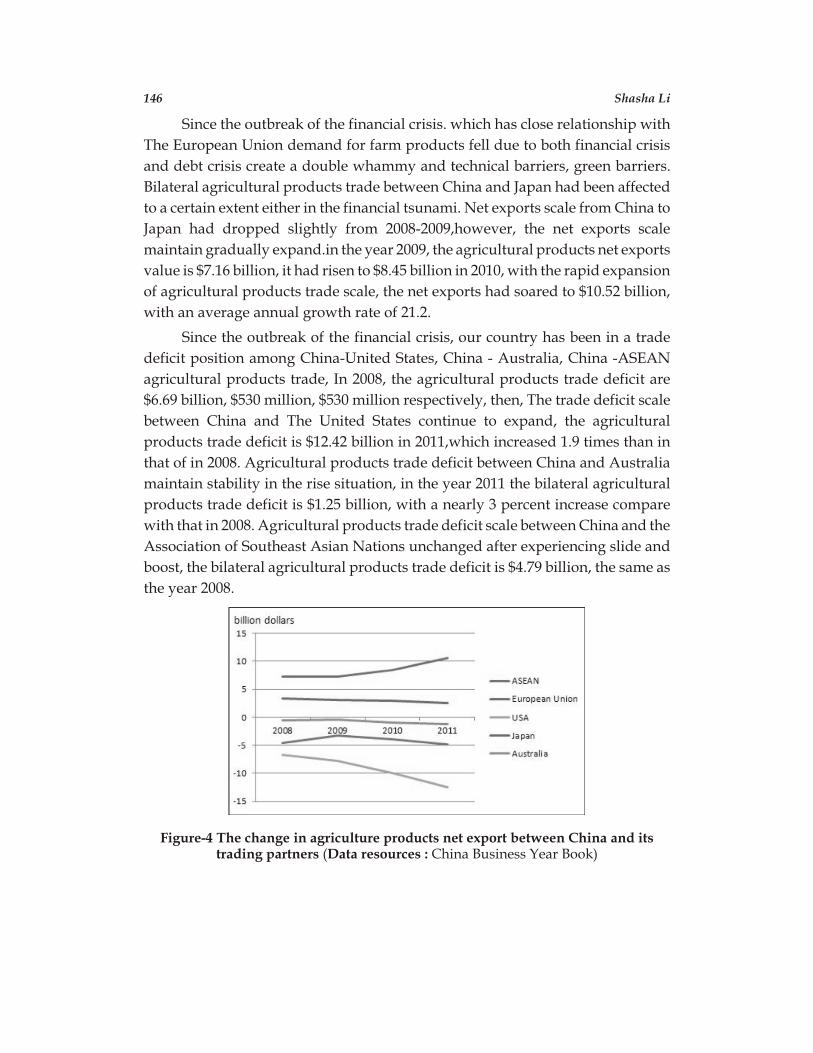
Since the outbreak of the financial crisis. which has close relationship with
The European Union demand for farm products fell due to both financial crisis
and debt crisis create a double whammy and technical barriers, green barriers.
Bilateral agricultural products trade between China and Japan had been affected
to a certain extent either in the financial tsunami. Net exports scale from China to
Japan had dropped slightly from 2008-2009,however, the net exports scale
maintain gradually expand.in the year 2009, the agricultural products net exports
value is $7.16 billion, it had risen to $8.45 billion in 2010, with the rapid expansion
of agricultural products trade scale, the net exports had soared to $10.52 billion,
with an average annual growth rate of 21.2.
Since the outbreak of the financial crisis, our country has been in a trade
deficit position among China-United States, China - Australia, China -ASEAN
agricultural products trade, In 2008, the agricultural products trade deficit are
$6.69 billion, $530 million, $530 million respectively, then, The trade deficit scale
between China and The United States continue to expand, the agricultural
products trade deficit is $12.42 billion in 2011,which increased 1.9 times than in
that of in 2008. Agricultural products trade deficit between China and Australia
maintain stability in the rise situation, in the year 2011 the bilateral agricultural
products trade deficit is $1.25 billion, with a nearly 3 percent increase compare
with that in 2008. Agricultural products trade deficit scale between China and the
Association of Southeast Asian Nations unchanged after experiencing slide and
boost, the bilateral agricultural products trade deficit is $4.79 billion, the same as
the year 2008.
Figure-4 The change in agriculture products net export between China and itstrading partners (Data resources : China Business Year Book)
146 Shasha Li
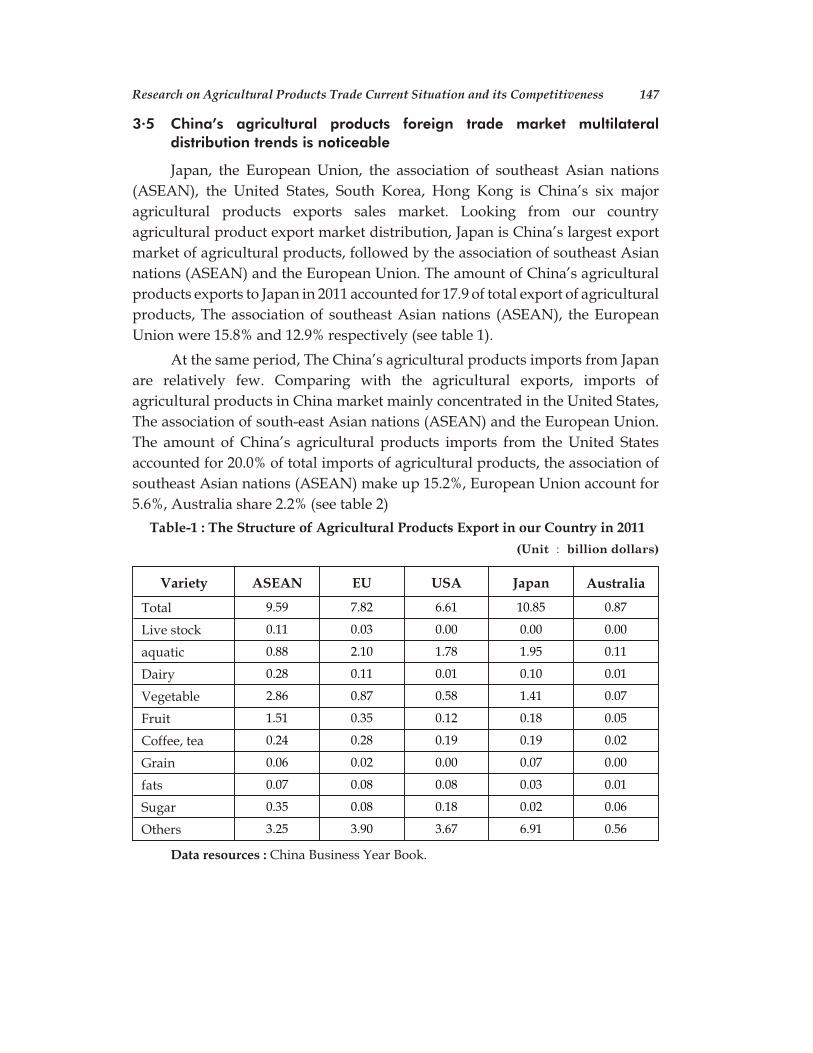
3.5 China’s agricultural products foreign trade market multilateral
distribution trends is noticeable
Japan, the European Union, the association of southeast Asian nations
(ASEAN), the United States, South Korea, Hong Kong is China’s six major
agricultural products exports sales market. Looking from our country
agricultural product export market distribution, Japan is China’s largest export
market of agricultural products, followed by the association of southeast Asian
nations (ASEAN) and the European Union. The amount of China’s agricultural
products exports to Japan in 2011 accounted for 17.9 of total export of agricultural
products, The association of southeast Asian nations (ASEAN), the European
Union were 15.8% and 12.9% respectively (see table 1).
At the same period, The China’s agricultural products imports from Japan
are relatively few. Comparing with the agricultural exports, imports of
agricultural products in China market mainly concentrated in the United States,
The association of south-east Asian nations (ASEAN) and the European Union.
The amount of China’s agricultural products imports from the United States
accounted for 20.0% of total imports of agricultural products, the association of
southeast Asian nations (ASEAN) make up 15.2%, European Union account for
5.6%, Australia share 2.2% (see table 2)
Table-1 : The Structure of Agricultural Products Export in our Country in 2011
(Unit : billion dollars)
Variety ASEAN EU USA Japan Australia
Total 9.59 7.82 6.61 10.85 0.87
Live stock 0.11 0.03 0.00 0.00 0.00
aquatic 0.88 2.10 1.78 1.95 0.11
Dairy 0.28 0.11 0.01 0.10 0.01
Vegetable 2.86 0.87 0.58 1.41 0.07
Fruit 1.51 0.35 0.12 0.18 0.05
Coffee, tea 0.24 0.28 0.19 0.19 0.02
Grain 0.06 0.02 0.00 0.07 0.00
fats 0.07 0.08 0.08 0.03 0.01
Sugar 0.35 0.08 0.18 0.02 0.06
Others 3.25 3.90 3.67 6.91 0.56
Data resources : China Business Year Book.
Research on Agricultural Products Trade Current Situation and its Competitiveness 147
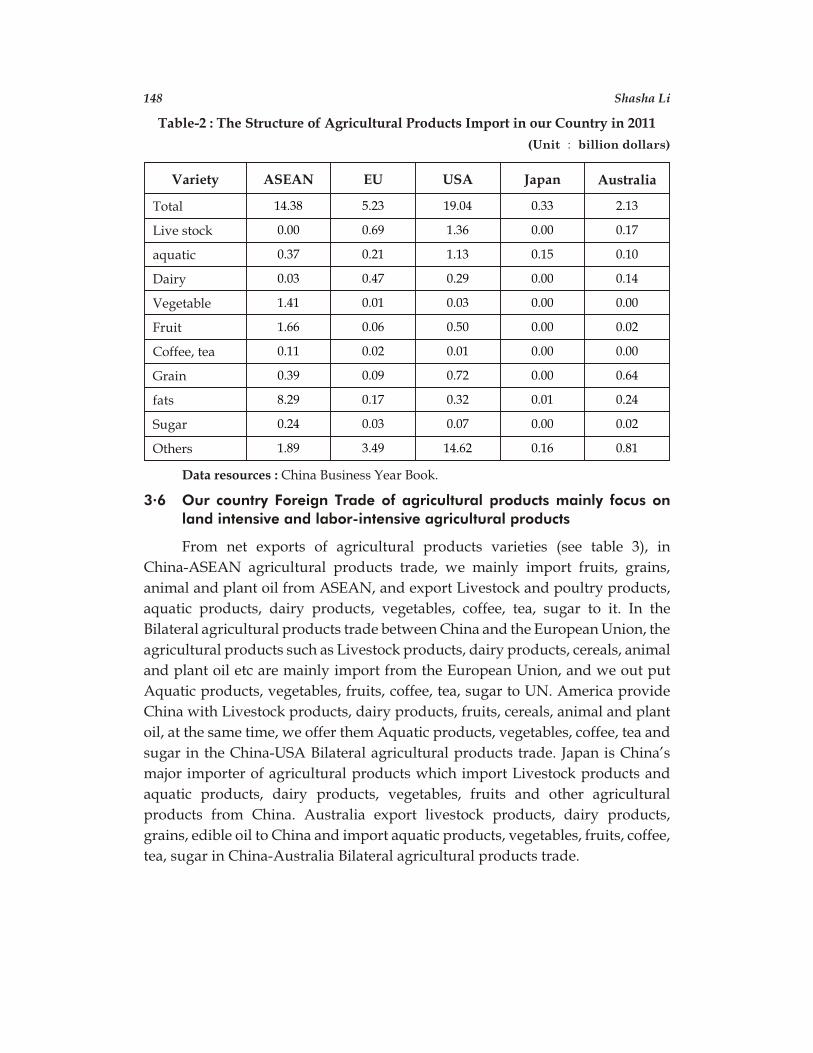
Table-2 : The Structure of Agricultural Products Import in our Country in 2011
(Unit : billion dollars)
Variety ASEAN EU USA Japan Australia
Total 14.38 5.23 19.04 0.33 2.13
Live stock 0.00 0.69 1.36 0.00 0.17
aquatic 0.37 0.21 1.13 0.15 0.10
Dairy 0.03 0.47 0.29 0.00 0.14
Vegetable 1.41 0.01 0.03 0.00 0.00
Fruit 1.66 0.06 0.50 0.00 0.02
Coffee, tea 0.11 0.02 0.01 0.00 0.00
Grain 0.39 0.09 0.72 0.00 0.64
fats 8.29 0.17 0.32 0.01 0.24
Sugar 0.24 0.03 0.07 0.00 0.02
Others 1.89 3.49 14.62 0.16 0.81
Data resources : China Business Year Book.
3.6 Our country Foreign Trade of agricultural products mainly focus on
land intensive and labor-intensive agricultural products
From net exports of agricultural products varieties (see table 3), in
China-ASEAN agricultural products trade, we mainly import fruits, grains,
animal and plant oil from ASEAN, and export Livestock and poultry products,
aquatic products, dairy products, vegetables, coffee, tea, sugar to it. In the
Bilateral agricultural products trade between China and the European Union, the
agricultural products such as Livestock products, dairy products, cereals, animal
and plant oil etc are mainly import from the European Union, and we out put
Aquatic products, vegetables, fruits, coffee, tea, sugar to UN. America provide
China with Livestock products, dairy products, fruits, cereals, animal and plant
oil, at the same time, we offer them Aquatic products, vegetables, coffee, tea and
sugar in the China-USA Bilateral agricultural products trade. Japan is China’s
major importer of agricultural products which import Livestock products and
aquatic products, dairy products, vegetables, fruits and other agricultural
products from China. Australia export livestock products, dairy products,
grains, edible oil to China and import aquatic products, vegetables, fruits, coffee,
tea, sugar in China-Australia Bilateral agricultural products trade.
148 Shasha Li
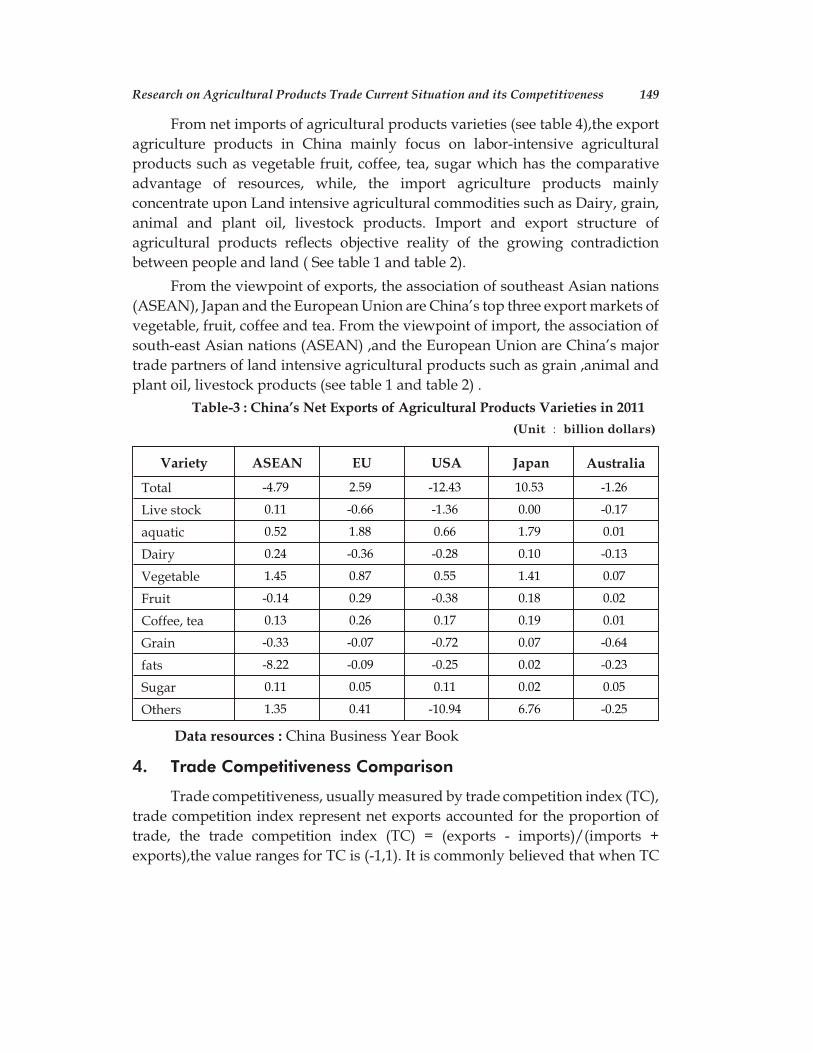
From net imports of agricultural products varieties (see table 4),the export
agriculture products in China mainly focus on labor-intensive agricultural
products such as vegetable fruit, coffee, tea, sugar which has the comparative
advantage of resources, while, the import agriculture products mainly
concentrate upon Land intensive agricultural commodities such as Dairy, grain,
animal and plant oil, livestock products. Import and export structure of
agricultural products reflects objective reality of the growing contradiction
between people and land ( See table 1 and table 2).
From the viewpoint of exports, the association of southeast Asian nations
(ASEAN), Japan and the European Union are China’s top three export markets of
vegetable, fruit, coffee and tea. From the viewpoint of import, the association of
south-east Asian nations (ASEAN) ,and the European Union are China’s major
trade partners of land intensive agricultural products such as grain ,animal and
plant oil, livestock products (see table 1 and table 2) .
Table-3 : China’s Net Exports of Agricultural Products Varieties in 2011
(Unit : billion dollars)
Variety ASEAN EU USA Japan Australia
Total -4.79 2.59 -12.43 10.53 -1.26
Live stock 0.11 -0.66 -1.36 0.00 -0.17
aquatic 0.52 1.88 0.66 1.79 0.01
Dairy 0.24 -0.36 -0.28 0.10 -0.13
Vegetable 1.45 0.87 0.55 1.41 0.07
Fruit -0.14 0.29 -0.38 0.18 0.02
Coffee, tea 0.13 0.26 0.17 0.19 0.01
Grain -0.33 -0.07 -0.72 0.07 -0.64
fats -8.22 -0.09 -0.25 0.02 -0.23
Sugar 0.11 0.05 0.11 0.02 0.05
Others 1.35 0.41 -10.94 6.76 -0.25
Data resources : China Business Year Book
4. Trade Competitiveness Comparison
Trade competitiveness, usually measured by trade competition index (TC),
trade competition index represent net exports accounted for the proportion of
trade, the trade competition index (TC) = (exports - imports)/(imports +
exports),the value ranges for TC is (-1,1). It is commonly believed that when TC
Research on Agricultural Products Trade Current Situation and its Competitiveness 149
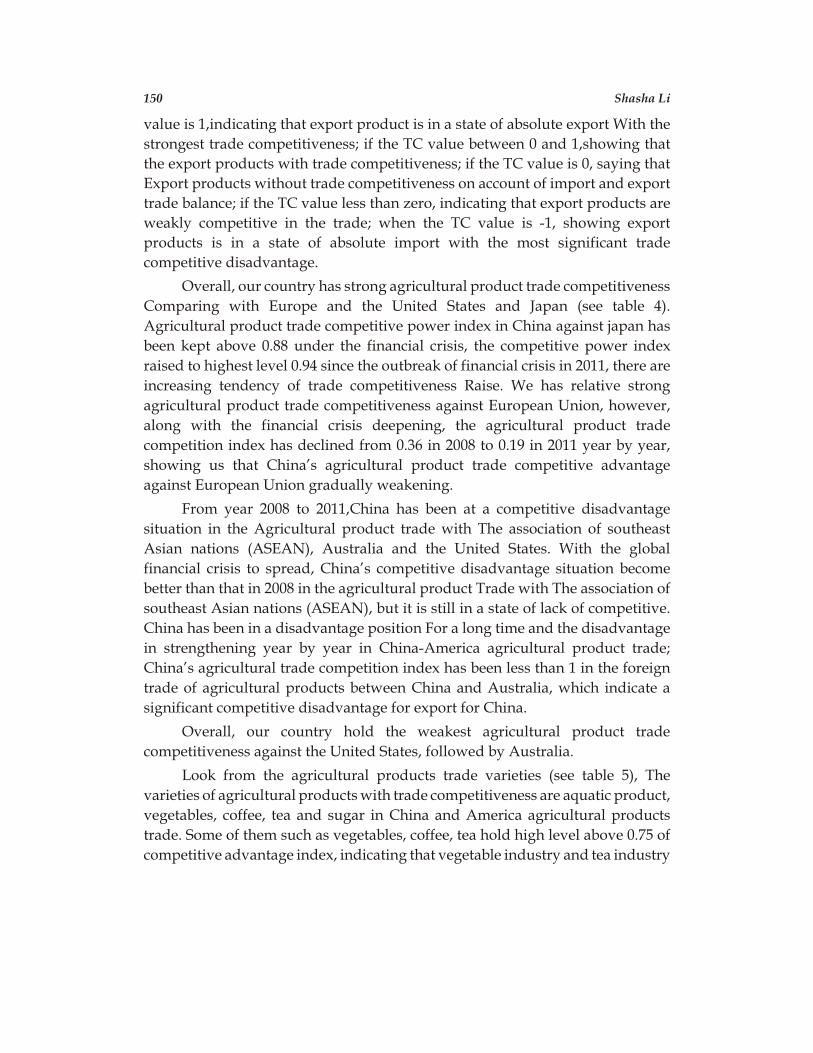
value is 1,indicating that export product is in a state of absolute export With the
strongest trade competitiveness; if the TC value between 0 and 1,showing that
the export products with trade competitiveness; if the TC value is 0, saying that
Export products without trade competitiveness on account of import and export
trade balance; if the TC value less than zero, indicating that export products are
weakly competitive in the trade; when the TC value is -1, showing export
products is in a state of absolute import with the most significant trade
competitive disadvantage.
Overall, our country has strong agricultural product trade competitiveness
Comparing with Europe and the United States and Japan (see table 4).
Agricultural product trade competitive power index in China against japan has
been kept above 0.88 under the financial crisis, the competitive power index
raised to highest level 0.94 since the outbreak of financial crisis in 2011, there are
increasing tendency of trade competitiveness Raise. We has relative strong
agricultural product trade competitiveness against European Union, however,
along with the financial crisis deepening, the agricultural product trade
competition index has declined from 0.36 in 2008 to 0.19 in 2011 year by year,
showing us that China’s agricultural product trade competitive advantage
against European Union gradually weakening.
From year 2008 to 2011,China has been at a competitive disadvantage
situation in the Agricultural product trade with The association of southeast
Asian nations (ASEAN), Australia and the United States. With the global
financial crisis to spread, China’s competitive disadvantage situation become
better than that in 2008 in the agricultural product Trade with The association of
southeast Asian nations (ASEAN), but it is still in a state of lack of competitive.
China has been in a disadvantage position For a long time and the disadvantage
in strengthening year by year in China-America agricultural product trade;
China’s agricultural trade competition index has been less than 1 in the foreign
trade of agricultural products between China and Australia, which indicate a
significant competitive disadvantage for export for China.
Overall, our country hold the weakest agricultural product trade
competitiveness against the United States, followed by Australia.
Look from the agricultural products trade varieties (see table 5), The
varieties of agricultural products with trade competitiveness are aquatic product,
vegetables, coffee, tea and sugar in China and America agricultural products
trade. Some of them such as vegetables, coffee, tea hold high level above 0.75 of
competitive advantage index, indicating that vegetable industry and tea industry
150 Shasha Li
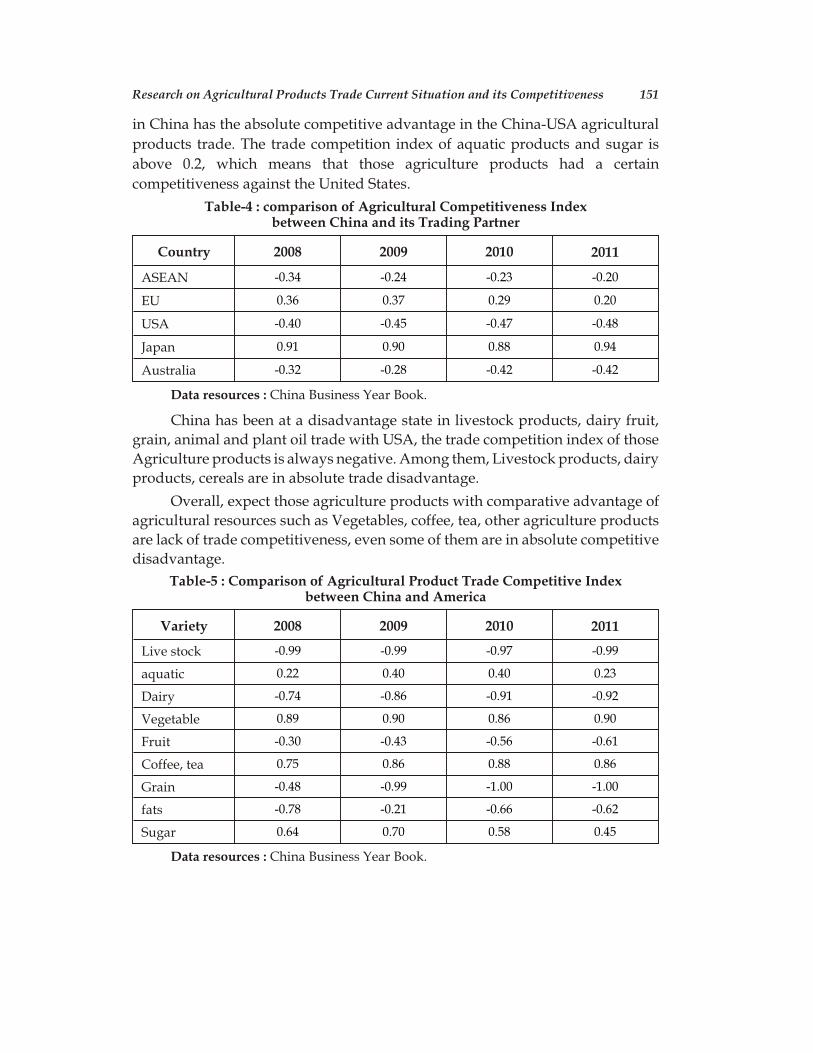
in China has the absolute competitive advantage in the China-USA agricultural
products trade. The trade competition index of aquatic products and sugar is
above 0.2, which means that those agriculture products had a certain
competitiveness against the United States.
Table-4 : comparison of Agricultural Competitiveness Indexbetween China and its Trading Partner
Country 2008 2009 2010 2011
ASEAN -0.34 -0.24 -0.23 -0.20
EU 0.36 0.37 0.29 0.20
USA -0.40 -0.45 -0.47 -0.48
Japan 0.91 0.90 0.88 0.94
Australia -0.32 -0.28 -0.42 -0.42
Data resources : China Business Year Book.
China has been at a disadvantage state in livestock products, dairy fruit,
grain, animal and plant oil trade with USA, the trade competition index of those
Agriculture products is always negative. Among them, Livestock products, dairy
products, cereals are in absolute trade disadvantage.
Overall, expect those agriculture products with comparative advantage of
agricultural resources such as Vegetables, coffee, tea, other agriculture products
are lack of trade competitiveness, even some of them are in absolute competitive
disadvantage.
Table-5 : Comparison of Agricultural Product Trade Competitive Indexbetween China and America
Variety 2008 2009 2010 2011
Live stock -0.99 -0.99 -0.97 -0.99
aquatic 0.22 0.40 0.40 0.23
Dairy -0.74 -0.86 -0.91 -0.92
Vegetable 0.89 0.90 0.86 0.90
Fruit -0.30 -0.43 -0.56 -0.61
Coffee, tea 0.75 0.86 0.88 0.86
Grain -0.48 -0.99 -1.00 -1.00
fats -0.78 -0.21 -0.66 -0.62
Sugar 0.64 0.70 0.58 0.45
Data resources : China Business Year Book.
Research on Agricultural Products Trade Current Situation and its Competitiveness 151
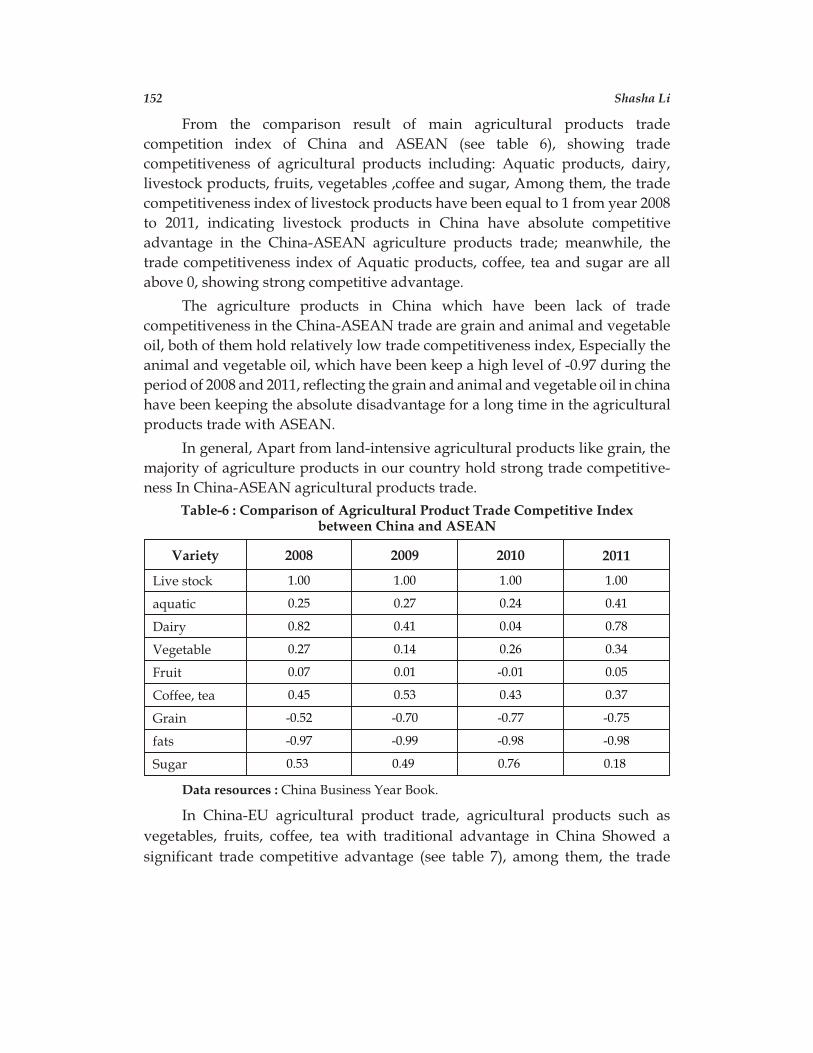
From the comparison result of main agricultural products trade
competition index of China and ASEAN (see table 6), showing trade
competitiveness of agricultural products including: Aquatic products, dairy,
livestock products, fruits, vegetables ,coffee and sugar, Among them, the trade
competitiveness index of livestock products have been equal to 1 from year 2008
to 2011, indicating livestock products in China have absolute competitive
advantage in the China-ASEAN agriculture products trade; meanwhile, the
trade competitiveness index of Aquatic products, coffee, tea and sugar are all
above 0, showing strong competitive advantage.
The agriculture products in China which have been lack of trade
competitiveness in the China-ASEAN trade are grain and animal and vegetable
oil, both of them hold relatively low trade competitiveness index, Especially the
animal and vegetable oil, which have been keep a high level of -0.97 during the
period of 2008 and 2011, reflecting the grain and animal and vegetable oil in china
have been keeping the absolute disadvantage for a long time in the agricultural
products trade with ASEAN.
In general, Apart from land-intensive agricultural products like grain, the
majority of agriculture products in our country hold strong trade competitive-
ness In China-ASEAN agricultural products trade.
Table-6 : Comparison of Agricultural Product Trade Competitive Indexbetween China and ASEAN
Variety 2008 2009 2010 2011
Live stock 1.00 1.00 1.00 1.00
aquatic 0.25 0.27 0.24 0.41
Dairy 0.82 0.41 0.04 0.78
Vegetable 0.27 0.14 0.26 0.34
Fruit 0.07 0.01 -0.01 0.05
Coffee, tea 0.45 0.53 0.43 0.37
Grain -0.52 -0.70 -0.77 -0.75
fats -0.97 -0.99 -0.98 -0.98
Sugar 0.53 0.49 0.76 0.18
Data resources : China Business Year Book.
In China-EU agricultural product trade, agricultural products such as
vegetables, fruits, coffee, tea with traditional advantage in China Showed a
significant trade competitive advantage (see table 7), among them, the trade
152 Shasha Li
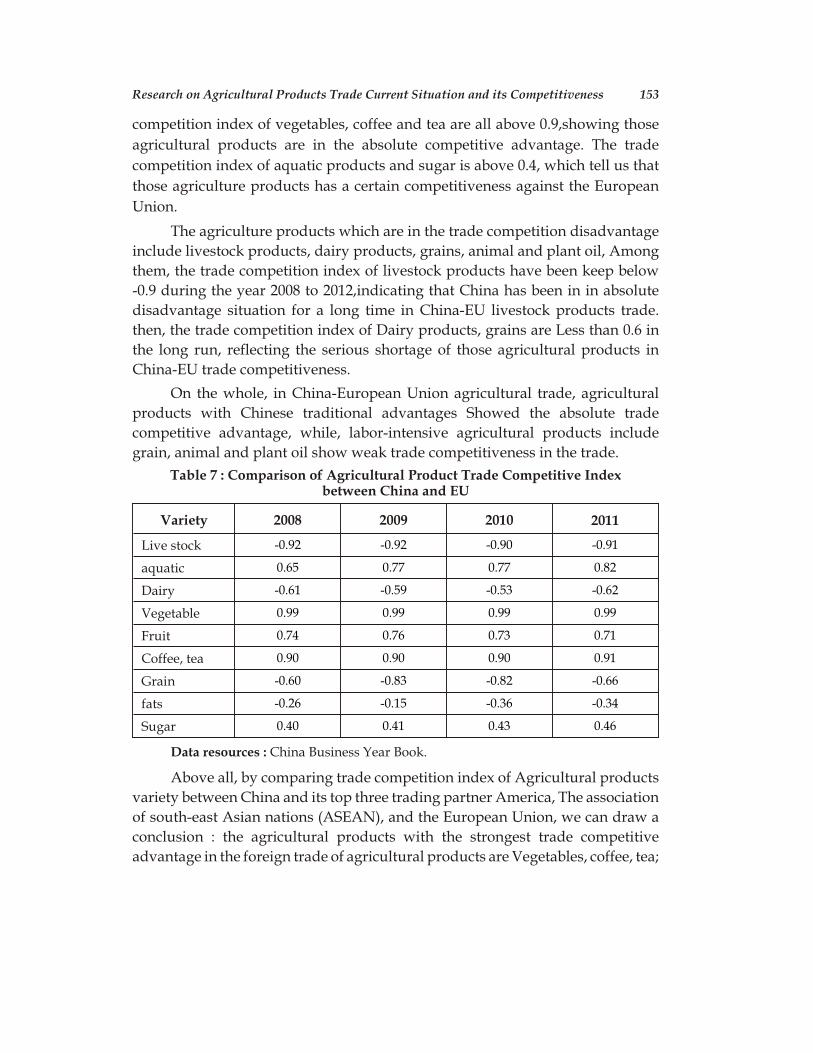
competition index of vegetables, coffee and tea are all above 0.9,showing those
agricultural products are in the absolute competitive advantage. The trade
competition index of aquatic products and sugar is above 0.4, which tell us that
those agriculture products has a certain competitiveness against the European
Union.
The agriculture products which are in the trade competition disadvantage
include livestock products, dairy products, grains, animal and plant oil, Among
them, the trade competition index of livestock products have been keep below
-0.9 during the year 2008 to 2012,indicating that China has been in in absolute
disadvantage situation for a long time in China-EU livestock products trade.
then, the trade competition index of Dairy products, grains are Less than 0.6 in
the long run, reflecting the serious shortage of those agricultural products in
China-EU trade competitiveness.
On the whole, in China-European Union agricultural trade, agricultural
products with Chinese traditional advantages Showed the absolute trade
competitive advantage, while, labor-intensive agricultural products include
grain, animal and plant oil show weak trade competitiveness in the trade.
Table 7 : Comparison of Agricultural Product Trade Competitive Indexbetween China and EU
Variety 2008 2009 2010 2011
Live stock -0.92 -0.92 -0.90 -0.91
aquatic 0.65 0.77 0.77 0.82
Dairy -0.61 -0.59 -0.53 -0.62
Vegetable 0.99 0.99 0.99 0.99
Fruit 0.74 0.76 0.73 0.71
Coffee, tea 0.90 0.90 0.90 0.91
Grain -0.60 -0.83 -0.82 -0.66
fats -0.26 -0.15 -0.36 -0.34
Sugar 0.40 0.41 0.43 0.46
Data resources : China Business Year Book.
Above all, by comparing trade competition index of Agricultural products
variety between China and its top three trading partner America, The association
of south-east Asian nations (ASEAN), and the European Union, we can draw a
conclusion : the agricultural products with the strongest trade competitive
advantage in the foreign trade of agricultural products are Vegetables, coffee, tea;
Research on Agricultural Products Trade Current Situation and its Competitiveness 153
with general trade competitive advantage agricultural products varieties turn to
sugar and aquatic products; the fruit, which Respectively showed weak trade
competitive advantage and strong competitive advantage in China-ASEAN and
China-European Union agricultural products trade, however, it lie in a dis-
advantageous position.
Other agriculture products in China are always at the varying degrees
disadvantageous position in agriculture products foreign trade, among them, the
grain and animal and vegetable oil are in a state of absolute competitive
disadvantage; livestock products, which are in a state of absolute imports in both
China-USA and China-UN agriculture products trade, while ,it is in the absolute
export state in China-ASEAN agriculture products trade.
References
[1] Liu wubin, J., “Overview of agricultural trade in 2012 and Outlook 2013”,
Agricultural Market Weekly,Vol 4, 2013.
[2] Sheng bin,Liao mingzhong, J., “China’s trade flows and export potential: a
gravity model research”, World Economics,Vol 2, 2004.
[3] Gao ying,Tian weiming, J., “China’s soybean trade influence factors analysis
Based on gravity model ”, Journal of Agrotechnical Economics,Vol 1, 2008.
[4] Lin jian,Huo shangyi, J., “Empirical analysis on China’s fruit export trade
influence factors”, Journal of Agrotechnical Economics,Vol 7, 2008.
[5] Chen longjiang, Huang zuhui, J., “China’s agricultural foreign trade’s
contribution to the agricultural economic growth”, Economic Theory and
Business Management,Vol 10, 2005.
[6] Pan su,Tan yanwen, J., ”Empirical research on the relationship between China’s
foreign agricultural products trade and agricultural economic growth”,
Agriculture Economics,Vol 2, 2011.
[7] Niu baojun, J., “Agricultural products foreign trade policy and the adjustment
Under the economic globalization”, Economics Issues,Vol 4,2001.
[8] Sun shengdong, Liu heguang, ”China’s agricultural trade and South America :
structure and comparative advantage”, Issues in Agricultural Economy,Vol 8,
2011.
[9] Chen longjiang, J., “New trend of international trade protection measures and
countermeasures of China under the economic recovery”, Issues in Agricultural
Economy,Vol 7, 2010. ê
154 Shasha Li
Article Received on February 14, 2015; Accepted on March 18, 2015
Guidelines for ContributorsManuscripts for publication (papers, notes, book reviews etc.) in the Contemporary Social
Sciences (CSS) and Journal of National Development (JND) must be in English (in Hindi only for
‘Special Issue of JND in Hindi’). One hard copy of the typewritten manuscript, in double
spacing with a side margin, should be sent for publication to The Managing Editor, JND/CSS,
D-59, Shastri Nagar, Meerut-250 004 (India) and a soft copy should be sent through e-mail at
<[email protected]>. The text of the paper (not exceeding 15 pages in all) should
be accompanied by a list of footnotes and references, tables and figures, if any, separately.
Footnotes should be kept to a minimum, each not exceeding 4 typed lines, References should
contain the name(s) of author(s), complete title of the book (italics), place of publication,
publisher, year of publication and page number(s) of the citations. For example, Dharam Vir,
Education and Polity in Nepal : An Asian Experiment, New Delhi : Northern Book Centre, 1988, p.
158. For articles published in journals, it should contain full name(s) of the author(s), the title of
the article in double quotes followed by a comma, the name of the journal (italics), volume,
number, year of publication and page number(s). For example, Kamlesh Mahajan, “Mass Media
and Women’s Development : The Case of Television in India”, Journal of National Development,
Vol. II, No. 2 (Winter), 1989, 182-197 or for an article in the book like Kamlesh Mahajan,
“Portrayal of Women on Television in India’’, David Sciulli (ed.), Comparative Social Research,
Greenwich, Connecticut, U. S. A. : Jai Press Inc., 1996, 53-67. Book reviews should not contain
footnotes. Reference to other works, if any, should be incorporated in the text itself.
Submission of a paper will be held to imply that it contains original unpublished work and is not
being submitted for publication elsewhere. Authors are solely responsible for obtaining
permission from the owners of the copyright while reproducing any material which has already
been published elsewhere. The Editors don’t accept any responsibility for damage or loss of
papers submitted. Editors reserve the right to publish the articles accepted for publication in the
JND/CSS, in a separate edited book simultaneously or later on.
World Copyrights of articles published in CSS are controlled by Contemporary Social Sciences,
1972 and in JND by Journal of National Development, 1988. No part of the publications may be
reproduced in any form without written permission of the Editor.
Processing Fee
Contributors from foreign countries are entitled to receive a soft copy of the issue free of cost.
However, a nominal processing fee of ` 2000 is charged from Indian contributors and US $ 35
from foreign contributors which entitles them to receive a hard copy. This processing fee
includes postage charges, i.e. SPEED POST for Indians and SPEED POST VIA AIR MAIL for
foreigners.
For any help, please contact :
e-mail: <[email protected]>
Place of Publication : Delhi, India
Periodicity : Quarterly (English)
Printer’s Name : Priyanka Mahajan
Saksham Computers
Nationality : Indian
Address : D-59, Shastri Nagar
Meerut-250 004 (INDIA)
Editor’s Name : Dr. Dharam Vir
Nationality : Indian
Address : D-59, Shastri Nagar
Meerut-250 004 (INDIA)
: Dr. S. S. Shashi
B-4/245, Safdarjung Enclave
New Delhi-110 029
: Dr. Dharam Vir
D-59, Shastri Nagar
Meerut-250 004 (INDIA)
I, Dr. Dharam Vir, hereby declare that the particulars given above are true to
the best of my knowledge and belief.
Dharam Vir
Form 4 (See Rule 8)
Names and addresses of the
individuals who own the
journal and of the partners or
share-holders holdings more
than one per cent of the total
capital


![· RBS FOUNDATION INDIA [formerly ABN AMRO FOUNDATION INDIA] we have audited the attached Balance Sheet of RBS FOUNDATION INDIA [formerly ABN AMRO FOUNDATION INDIA] as at 31st 2009](https://img.pdfslide.us/doc/110x75/5e7c89f5add5276b871d6e73/rbs-foundation-india-formerly-abn-amro-foundation-india-we-have-audited-the-attached.jpg)