Embed Size (px)
Citation preview
Proceedings of the Fifth Annual
Research Exposition
2008
Proceedings of the Fifth
Research Exposition
Research Expo 2008
Fredericton, New Brunswick, Canada
April 10, 2008
Sponsored by the Information Technology Centre (ITC)
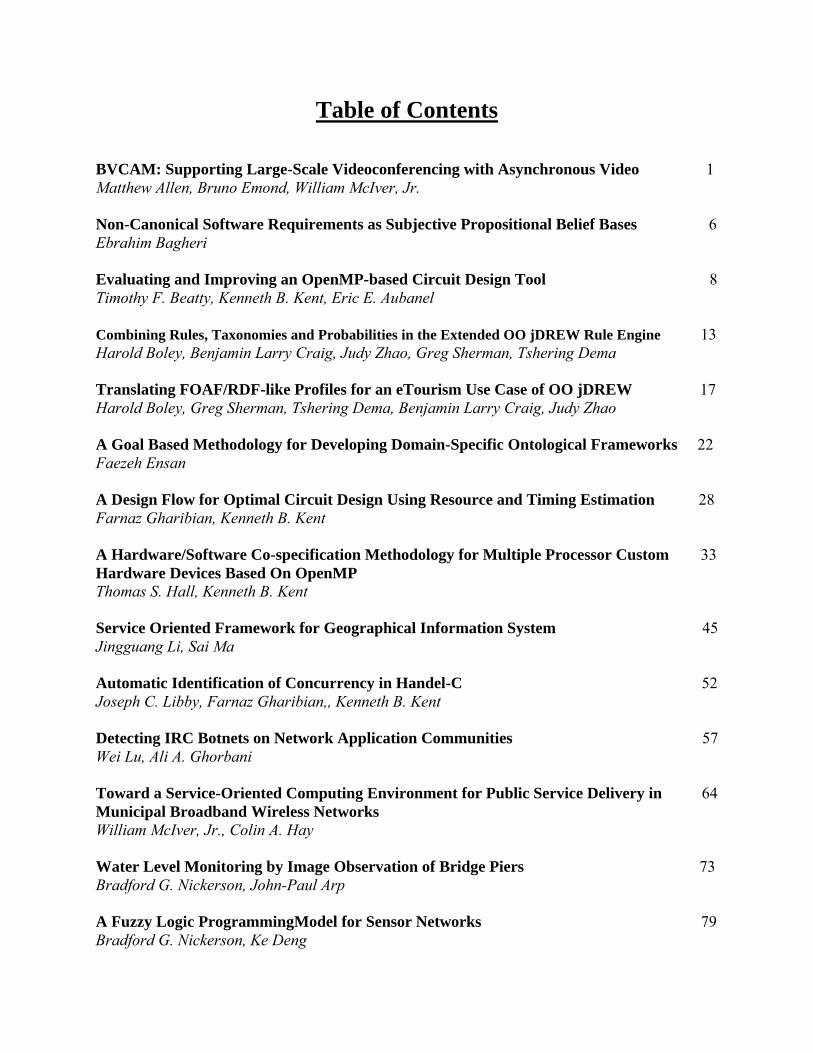
Table of Contents BVCAM: Supporting Large-Scale Videoconferencing with Asynchronous Video 1 Matthew Allen, Bruno Emond, William McIver, Jr. Non-Canonical Software Requirements as Subjective Propositional Belief Bases 6 Ebrahim Bagheri Evaluating and Improving an OpenMP-based Circuit Design Tool 8 Timothy F. Beatty, Kenneth B. Kent, Eric E. Aubanel Combining Rules, Taxonomies and Probabilities in the Extended OO jDREW Rule Engine 13 Harold Boley, Benjamin Larry Craig, Judy Zhao, Greg Sherman, Tshering Dema Translating FOAF/RDF-like Profiles for an eTourism Use Case of OO jDREW 17 Harold Boley, Greg Sherman, Tshering Dema, Benjamin Larry Craig, Judy Zhao A Goal Based Methodology for Developing Domain-Specific Ontological Frameworks 22 Faezeh Ensan A Design Flow for Optimal Circuit Design Using Resource and Timing Estimation 28 Farnaz Gharibian, Kenneth B. Kent A Hardware/Software Co-specification Methodology for Multiple Processor Custom 33 Hardware Devices Based On OpenMP Thomas S. Hall, Kenneth B. Kent Service Oriented Framework for Geographical Information System 45 Jingguang Li, Sai Ma Automatic Identification of Concurrency in Handel-C 52 Joseph C. Libby, Farnaz Gharibian,, Kenneth B. Kent Detecting IRC Botnets on Network Application Communities 57 Wei Lu, Ali A. Ghorbani Toward a Service-Oriented Computing Environment for Public Service Delivery in 64 Municipal Broadband Wireless Networks William McIver, Jr., Colin A. Hay Water Level Monitoring by Image Observation of Bridge Piers 73 Bradford G. Nickerson, John-Paul Arp A Fuzzy Logic ProgrammingModel for Sensor Networks 79 Bradford G. Nickerson, Ke Deng
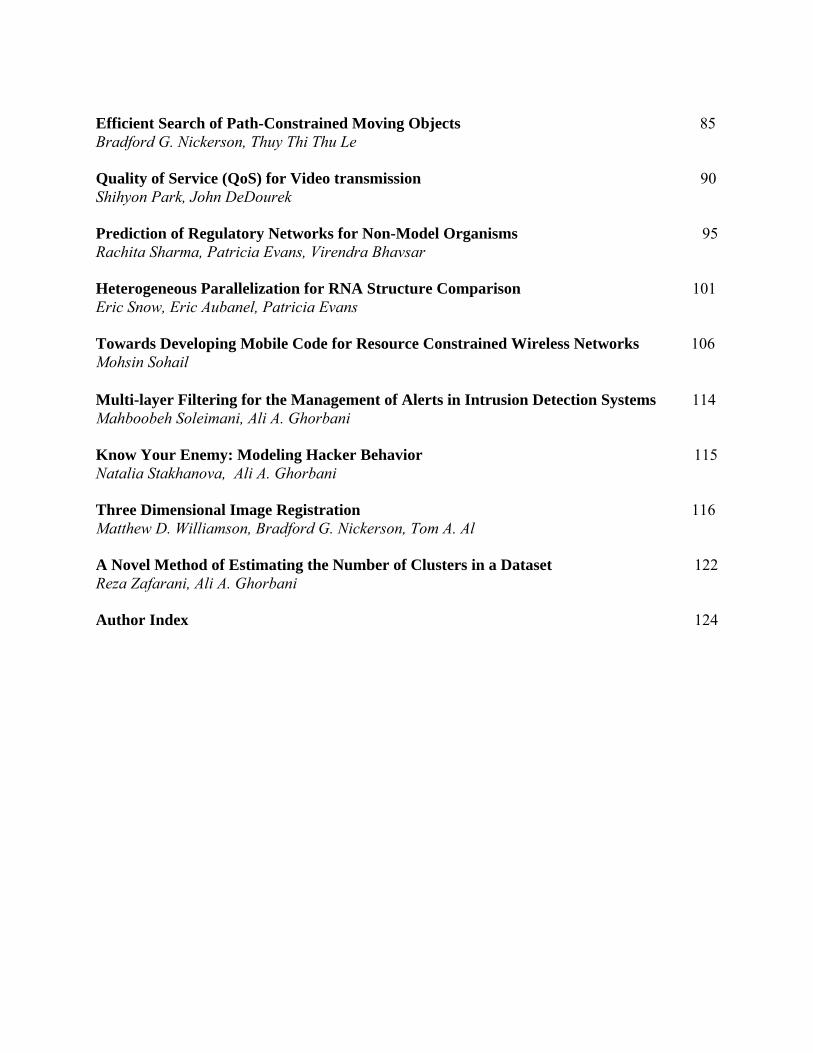
Efficient Search of Path-Constrained Moving Objects 85 Bradford G. Nickerson, Thuy Thi Thu Le Quality of Service (QoS) for Video transmission 90 Shihyon Park, John DeDourek Prediction of Regulatory Networks for Non-Model Organisms 95 Rachita Sharma, Patricia Evans, Virendra Bhavsar Heterogeneous Parallelization for RNA Structure Comparison 101 Eric Snow, Eric Aubanel, Patricia Evans Towards Developing Mobile Code for Resource Constrained Wireless Networks 106 Mohsin Sohail Multi-layer Filtering for the Management of Alerts in Intrusion Detection Systems 114 Mahboobeh Soleimani, Ali A. Ghorbani Know Your Enemy: Modeling Hacker Behavior 115 Natalia Stakhanova, Ali A. Ghorbani Three Dimensional Image Registration 116 Matthew D. Williamson, Bradford G. Nickerson, Tom A. Al A Novel Method of Estimating the Number of Clusters in a Dataset 122 Reza Zafarani, Ali A. Ghorbani Author Index 124
BVCAM: Supporting Large-Scale Videoconferencing With Asynchronous Video
Matthew Allen, Dr. Bruno Emond, Dr. William McIver, Jr. Abstract Videoconferencing is an increasingly popular technology for distance communication, seeing an ever-expanding variety of applications. As such, the ability to use this technology effectively faces an increasing number of social and technical challenges, especially in conferences involving large groups of participants. It is in these types of conferences especially where certain needs and issues become more pronounced. This paper provides background on the issues present in this type of conference, and describes a method and design for complementing the traditional conference setup with an additional, asynchronous mode of communication, in order to increase the effectiveness of videoconferencing as a communications medium for large group settings. It then details the technical implementation of BVCAM, a working prototype of this design, toward improving the effectiveness of a specific high-volume videoconference scenario, with numerous events involving hundreds of students in schools across Canada. Finally, this paper describes the features which make BVCAM a unique technology and how it can be extended to other applications. Introduction The Broadband Visual Communications Strategic Initiative is a research project based in the National Research Council's Institute for Information Technology, which aims to improve the effectiveness of medium- to large-scale videoconferencing sessions as a communications medium. As the number of participants in a videoconferencing session increases, several issues arise that can hinder effective communication. This paper describes the design and implementation of the BVCAM service as a tool for facilitating effective communication in conferences involving large groups. Videoconferencing is distinct from other forms of distance communication due to its visual component, which provides both speakers and listeners with non-verbal cues that can be beneficial for improving understanding and clarifying the organizational structure of conversation [1], if the technology is used effectively. These non-verbal interactions are subtle, yet contribute a great deal to facilitating and understanding the mechanics of conversation [2]. How to effectively make use of videoconferencing as a tool for communication is a much-debated topic itself. Despite the advantages offered by visual communication, many common social and technical shortcomings have been identified that can negate these benefits, or even detract from the overall effectiveness of the session. Many guidelines and good practice recommendations have been suggested to address these issues [3]; however, as the number of participants in the session increases to larger numbers, it becomes increasingly challenging for organizers to apply these recommendations successfully [4]. Such a large-scale videoconference is a form of synchronous communication; each participant must speak in turn, while the others are passive listeners. Asynchronous communication where the sending and receiving of messages are decoupled offers its own set of advantages and disadvantages; while it does not suffer the same constraints on time and space, asynchronous communication alone is not well suited to maintaining a solid, coherent conference where large groups are involved.
1
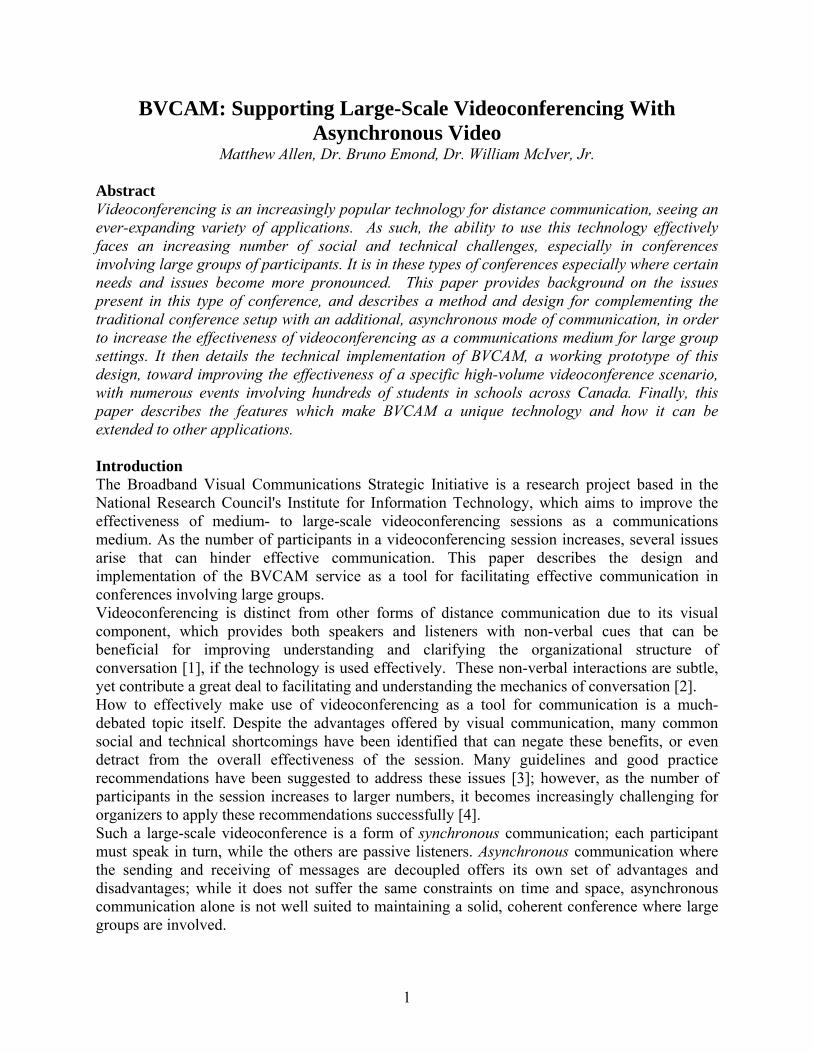
Design Goals The asynchronous model of communication is free of many of the issues that occur in the synchronous model; however, synchronous communication is required to drive the conference and keep it coherent and on-topic. While each model has its own applications and domains, our goal is to make use of the advantages of both models so that they complement one another. In order to implement such a combined model, a method of asynchronous communication that complements the main conference must be designed and integrated into the conference scenario. The main testing grounds for our technology is the Virtual Classroom program, in which hundreds of students from several high schools across Canada meet in large-scale conferences to discuss various current social issues. Our role has been to integrate our asynchronous solution into the conferences to facilitate communication between the students of the various schools. BVCAM: Design and Iplementation BVCAM, the Broadband Virtual CAMera, aims to provide a modular and extensible framework for event-driven asynchronous video communication, by enabling the recording, archiving and presentation of videos over H.323. The H.323 family of protocols is a widely implemented specification for audio and visual communication over a network, defined by the ITU Telecommunications Standardization Sector (ITU-T) [5]. H.323 defines protocols for many types of multimedia exchange and has been widely used in such areas as Voice-over-IP telephone networks and full-featured videoconferencing systems. Peer-Generated Videos are an important concept in asynchronous video communication; they are videos produced for and consumed by a network of peers. In the Virtual Classroom context, providing the means for creating and sharing Peer-Generated Videos provides a channel of asynchronous communication between the students of the various schools.
Figure 1: system overview
VCAM is made up of various modules, which are connected in a web services framework. The
VCAM recording service: service is a clustered server design, fronted by a manager server
Bservice can be extending by creating or replacing modules, which communicate over well-defined interfaces. This allows BVCAM to be tailored to specific applications. BThe core BVCAM recording (Session Manager). The clustered servers, or Drones, each operate as an H.323 endpoint, and are
2
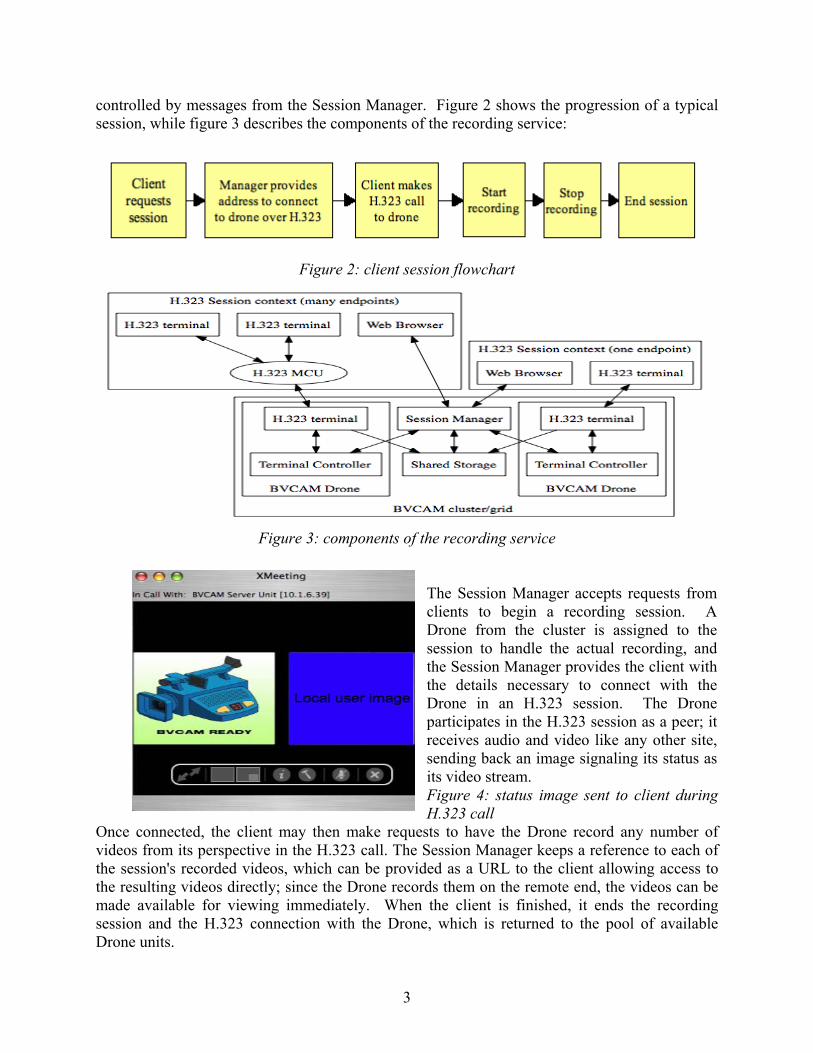
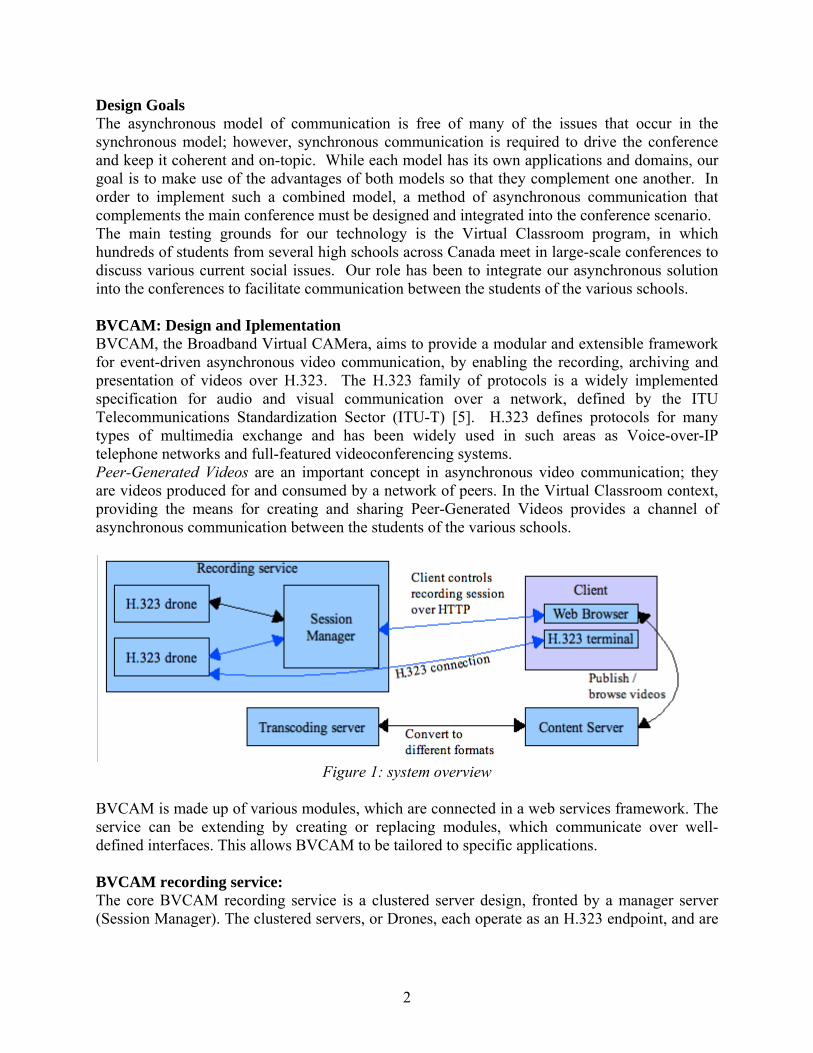
controlled by messages from the Session Manager. Figure 2 shows the progression of a typical session, while figure 3 describes the components of the recording service:
Figure 2: client session flowchart
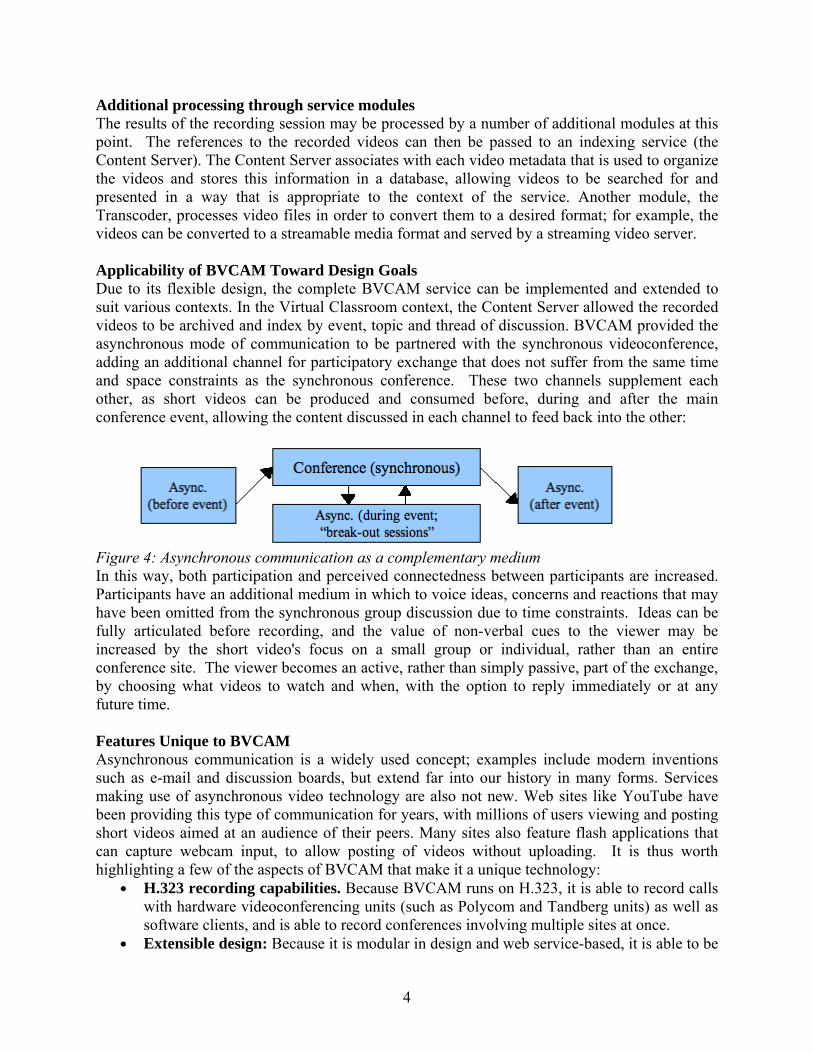
he Session Manager accepts requests from
age sent to client during
Once connected, the client may then make requests to have the Drone record any number of
Drone units.
Figure 3: components of the recording service
Tclients to begin a recording session. A Drone from the cluster is assigned to the session to handle the actual recording, and the Session Manager provides the client with the details necessary to connect with the Drone in an H.323 session. The Drone participates in the H.323 session as a peer; it receives audio and video like any other site, sending back an image signaling its status as its video stream. Figure 4: status imH.323 call
videos from its perspective in the H.323 call. The Session Manager keeps a reference to each of the session's recorded videos, which can be provided as a URL to the client allowing access to the resulting videos directly; since the Drone records them on the remote end, the videos can be made available for viewing immediately. When the client is finished, it ends the recording session and the H.323 connection with the Drone, which is returned to the pool of available
3
Additional processing through service modules The results of the recording session may be processed by a number of additional modules at this
then be passed to an indexing service (the
ue to its flexible design, the complete BVCAM service can be implemented and extended to text, the Content Server allowed the recorded
Figure 4: Asynchronous communication as a complementary medium In this way, both participation and perceived connectedness between participants are increased.
articipants have an additional medium in which to voice ideas, concerns and reactions that may constraints. Ideas can be
s communication is a widely used concept; examples include modern inventions ch as e-mail and discussion boards, but extend far into our history in many forms. Services
deo technology are also not new. Web sites like YouTube have
s at once.
point. The references to the recorded videos canContent Server). The Content Server associates with each video metadata that is used to organize the videos and stores this information in a database, allowing videos to be searched for and presented in a way that is appropriate to the context of the service. Another module, the Transcoder, processes video files in order to convert them to a desired format; for example, the videos can be converted to a streamable media format and served by a streaming video server. Applicability of BVCAM Toward Design Goals Dsuit various contexts. In the Virtual Classroom convideos to be archived and index by event, topic and thread of discussion. BVCAM provided the asynchronous mode of communication to be partnered with the synchronous videoconference, adding an additional channel for participatory exchange that does not suffer from the same time and space constraints as the synchronous conference. These two channels supplement each other, as short videos can be produced and consumed before, during and after the main conference event, allowing the content discussed in each channel to feed back into the other:
Phave been omitted from the synchronous group discussion due to timefully articulated before recording, and the value of non-verbal cues to the viewer may be increased by the short video's focus on a small group or individual, rather than an entire conference site. The viewer becomes an active, rather than simply passive, part of the exchange, by choosing what videos to watch and when, with the option to reply immediately or at any future time. Features Unique to BVCAM Asynchronousumaking use of asynchronous vibeen providing this type of communication for years, with millions of users viewing and posting short videos aimed at an audience of their peers. Many sites also feature flash applications that can capture webcam input, to allow posting of videos without uploading. It is thus worth highlighting a few of the aspects of BVCAM that make it a unique technology:
● H.323 recording capabilities. Because BVCAM runs on H.323, it is able to record calls with hardware videoconferencing units (such as Polycom and Tandberg units) as well as software clients, and is able to record conferences involving multiple site
● Extensible design: Because it is modular in design and web service-based, it is able to be
4
customized for specific applications. Any kind of presentation layer or content management scheme can be designed, and videos produced by BVCAM can be run
●
rietary interface, it can be used alongside any
ConcluBVCAM provides the ability to generate, archive and present Peer-Generated Videos as a omplement to existing H.323 videoconferencing technology. It enables an asynchronous
on channel that addresses deficiencies in the synchronous model and allows
on: A Case Study, Proceedings of the first ACM international conference on Multimedia (Anaheim, California,
), pp. 199-206.
P.K., Challenges in Virtual Collaboration: Videoconferencing,
ations and Reviews, 29 (2), 1999, pp. 169-185.
through a custom transcoder service to produce videos of a desired format. The Drones could even be extended to support other protocols, such as SIP, without breaking compatibility with the rest of the service. Software-based: Unlike hardware-based recording solutions offered by vendors of videoconferencing units, BVCAM does not need to be physically located with other equipment. Because it offers a non-propH.323 hardware or software. Since it is software-based, it is relatively inexpensive to set up.
sion
ccommunicaticonferences to scale to larger groups and multiple sites, while helping to preserve the level of participation, understanding and connectedness found in smaller conferences. References 1. Isaacs, E.A. and Tang, J.C., What Video Can and Can't Do for CollaboratiinU.S.A., 19932. Feyereisen, P. and de Lannoy, J.-D., Gestures and Speech: Psychological Investigations, Cambridge University Press, 1991, pp. 15-19. 3. Wainfan, L. and Davis,Audioconferencing, and Computer-Mediated Communications, RAND CORP (Santa Monica, California, U.S.A., 2004). 4. Marsden, J.R. and Mathiyalakan, S., A multisession comparative study of group size and group performance in an electronic meeting system environment, Systems, Man, and Cybernetics, Part C: Applic6. International Telecommunications Union (ITU), H.323: Packet-based multimedia communications systems (Recommendation), http://www.itu.int/rec/T-REC-H.323/e, 2006.
5
Non-Canonical Software Requirements as Subjective Propositional Belief Bases
Ebrahim Bagheri Abstract Non-canonical requirement specifications refer to a set of software requirements that are either inconsistent, vague or incomplete. In this work, we intend to provide a correspondence between requirement specifications and annotated propositional belief bases widely used in Artificial Intelligence. Through this analogy, we are able to analyze the contents of a given set of requirement collections known as viewpoints and specify whether they are incomplete, incoherent, or inconsistent under a closed-world assumption. Based on the requirements collections’ properties, we will define a viewpoint integration game through which the inconsistencies of the non-canonical requirement specification are resolved. The outcome of this game is a set of inconsistency-free requirement collections that can be easily integrated to form a unique fair representative of the initial requirements collections. 1 Introduction Requirement engineers often struggle to define a set of clear, consistent, coherent and comprehensive requirement expressions for a software entity. In order to reach a satisfying compilation of software requirement specifications, some requirement analysts have become attracted towards the use of information from multiple sources. Here, the sources of information are known as viewpoints. Some of the important issues that need to be addressed in the viewpoint-based requirement engineering models are: 1) The identification of inconsistent, redundant, vague, and incomplete requirement specifications which are gathered from various sources of information. 2) The resolution of discrepancies and redundancies through the degradation of problematic requirement specifications and the fortification of reinforcing and clear requirement statements. 3) The development of an inconsistency-free, meaningful and covering representative requirements model for a given software entity derived from the individual requirement specifications gathered from the viewpoints. There have been various proposals for the management of such non-canonical requirement specifications through their prioritization. In these work, each statement of the requirement specifications is annotated with a value depicting its significance, substance or validity. In this regards, both Sabetzadeh and Easterbrook [8] andMu et al. [6] have proposed the employment of Annotated Predicate 2 Ebrahim Bagheri Calculus (APC), a special form of paraconsistent logics, to represent requirement statements priority information. In APC, the syntax and semantics of the logic correspond with that of classical logic except that the formulae are annotated with values extracted from a belief semi-lattice. Within this framework, the least upper bound operator is employed to reason about the validity of the requirement specifications. In a similar vein, Ghose and Lin propose the employment of ranked structures to represent the preference relationships between the requirement specifications [4]. In their model, inconsistent viewpoints can be handled through an incremental elicitation game of ranked structures.
6
In this work, we intend to formally show that the notion of viewpoints in requirement engineering can be represented by subjective propositional knowledge bases. In our model, the formulae in propositional knowledge bases are annotated with subjective opinions derived from the framework of Subjective logic [5]. Such knowledge bases are called Subjective belief bases and generalize prioritized knowledge bases that employ annotated predicate calculus or possibilistic information [7]. Based on the given definition of viewpoints, we will then be able to formally define several properties of requirements specifications such as inconsistency, completeness, coherence, etc. These properties are later employed in a belief merging game, which symbolizes the integration process of the requirement specifications provided by the viewpoints. The developed belief game produces a set of consistent and representative requirement specifications for the given specifications of the viewpoints. More specifically, this work will provide the following contributions: 1) It will define a formal representation for requirement viewpoints within the context of subjective propositional belief bases. In this formalism, viewpoints are considered as annotated belief bases. 2) It will provide formal definitions for analyzing the properties of requirement specifications from both an individualistic and collective perspectives (essential and contingent properties of software requirements). 3) The manipulation of non-canonical requirement specifications is defined through an iterative belief integration game, as a result of which problematic specifications are resolved and a final unique requirement specification, as a representative of the initial viewpoints, is developed. Up to now, with the kind help of my supervisor, Dr. Ghorbani, I have had some progress towards my intended goals. Some of the results of the work I have done so far have been reported in [2, 3, 1]. References 1. Bagheri, E., and Ghorbani, A. A. On the collaborative development of paraconsistent conceptual models. In The Seventh International Conference on Quality Software (QSIC’07) (2007), IEEE. 2. Bagheri, E., and Ghorbani, A. A. Experiences on the belief-theoretic integration of para-consistent conceptual models. In The Nineteenth IEEE Australian Software Engineering Conference (2008), IEEE. Integrating Subjective Knowledge Bases ... 3 3. Bagheri, E., and Ghorbani, A. A. Towards a belief-theoretic model for collaborative conceptual model development. In The Fourty-first Hawaii International Conference on System Sciences (HICSS’08) (2008), IEEE. 4. Ghose, A., and Lin, Q. Viewpoints merging via incrementally elicited ranked structures. In QSIC (2006), pp. 141–150. 5. Jøsang, A. A logic for uncertain probabilities. Int. J. Uncert. Fuz. Knowl. Sys. 9, 3 (2001), 279–212. 6. Mu, K., Jin, Z., Lu, R., and Peng, Y. Handling non-canonical software requirements based on annotated predicate calculus. Knowl. Inf. Syst. 11, 1 (2007), 85–104. 7. Qi, G., Liu, W., and Bell, D. Combining multiple prioritized knowledge bases by negotiation. Fuzzy Sets and Systems 158, 23 (2007), 2535–2551. 8. Sabetzadeh, M., and Easterbrook, S. View merging in the presence of incompleteness and inconsistency. Requir. Eng. 11, 3 (2006), 174–193.
7
Evaluating and Improving an OpenMP-based Circuit Design Tool Timothy F. Beatty, Kenneth B. Kent, Eric E. Aubanel
Abstract As transistor density grows, increasingly complex hardware designs may be implemented. In order to manage this complexity, hardware design must be performed at a higher level of abstraction. High level synthesis enables the automatic conversion of algorithms into hardware implementations, abstracting away the underlying complexities of hardware from the designer. A number of high level synthesis tools have recently been developed, including an OpenMP to Handel-C translator. Using a set of benchmark tests, the OpenMP to Handel-C translator is evaluated on several criteria, with the goal identifying any performance issues. Improvements to the translator, including a new compiler directive allowing customizable register width, are described. 1 Introduction A custom hardware solution is often required when the performance, physical size, and power consumption needs of an application go beyond the capabilities of a general purpose processor. Custom hardware designs allow for maximal exploitation of parallelism, leading to better performance over general purpose processors. Physical resource requirements are reduced when a circuit is customized to a specific application and leads to reduced physical size and power consumption. Field-programmable gate arrays provide a suitable platform for implementing such custom hardware solutions. A field-programmable gate array (FPGA) is programmable logic device which can be configured to implement any logical function. FPGA technology has been implemented in various data-and computationally-intensive applications including signal processing, facial recognition, cryptography, and bioinformatics. Shorter time-to-market, reduced power consumption, and in-system design verification are among the benefits of FPGAs over traditional application-specific integrated circuit (ASIC) technology. As transistor density grows with Moore’s law, larger and more complex designs can be implemented, increasing the difficulty of FPGA and ASIC design. In order to manage this complexity, hardware design languages must enable design at a higher level of abstraction than traditional hardware design languages provide. Using traditional hardware design languages, design is performed at the register transfer level. At this level, the hardware design is specified in terms signal flow between registers and the logical operations performed on those signals. The design process at this level often requires a time consuming, manual effort. At a higher level of abstraction, the underlying complexity of the hardware may be hidden from the designer, reducing the manual effort required for design entry. High level synthesis, enabling the automatic conversion of algorithms into hardware implementations, has been examined by several authors [1, 2]. A recent study demonstrates the gains in productivity [3]. The remainder of this paper is organized as follows: section 2 discusses the necessary background materials, section 3 describes the project motivation and methodology and section 4 provides some preliminary results.
8
2 Background Ideally, a high level synthesis tool would allow a programmer to design hardware without being subjected to a learning curve. Using a mature, established, general purpose programming language as the basis for such a tool allows this learning curve to be avoided. Several additional benefits may be gained. For example, previously available tools, such as development environments, profilers, and debuggers may be leveraged without modification. Synthesis of hardware from general purpose languages has been examined in several studies [4, 5, 6]. Though a number of challenges have been identified, some progress has been made. Wong et al. have achieved favorable results with a high level synthesis tool that accepts a C program, annotated with OpenMP pragmas, as input and ouputs a synthesizeable Handel-C program [7]. This project will be described in further detail in section 2.3. 2.1 Handel-C Handel-C is a behavioral hardware description language designed by Celoxica [8]. The language contains a subset of C language elements which are suitable to hardware design as well as extensions to support concurrency. Intercommunication between parallel processing elements is provided through a communicating sequential process based model. Signed and unsigned integer datatypes are supported natively and support for fixed and floating point numbers is provided through a set of libraries. Width of variables may be specified at declaration time. 2.2 OpenMP OpenMP provides an application program interface (API) for shared-memory parallel programming in C/C++ and Fortran [9]. The OpenMP API employs a fork-join model of execution by which the programmer can direct the main thread of execution to fork a pool of worker threads for work sharing purposes. When these threads complete their execution, they are joined together, and the main thread of execution resumes. The OpenMP API provides a set of directives and clauses which are realized in C/C++ through pragma directives. Using theses directives, the programmer can specify parallelism within their program. A set of runtime functions is also provided by the OpenMP library for specifying and querying environment settings such as the number of threads. 2.3 OpenMP to Handel-C Translator The OpenMP to Handel-C translator described in [7] is based on a project called C-Breeze. C-Breeze, an infrastructure for building C compilers developed at the University of Texas at Austin [10], parses a C program into an abstract syntax tree. The C-Breeze lexer and parser have been modified to accept OpenMP directives and new abstract syntax tree nodes were added to represent most OpenMP constructs. After a series of preprocessing steps, including a check to ensure OpenMP nesting and binding rules are followed, the abstract syntax tree is translated into a Handel-C program via a set of algorithms described in [11]. 3 Translator Evaluation While the results shown in [11] demonstrate a correct implementation, performance and resource usage statistics are not examined in significant detail. Further benchmarking of the translator is required in order to collect detailed performance and resource usage data. An analysis of these results will allow any inefficiencies in the translation to be identified. Furthermore, a baseline for performance and resource usage can be established which may be used in demonstrating the
9

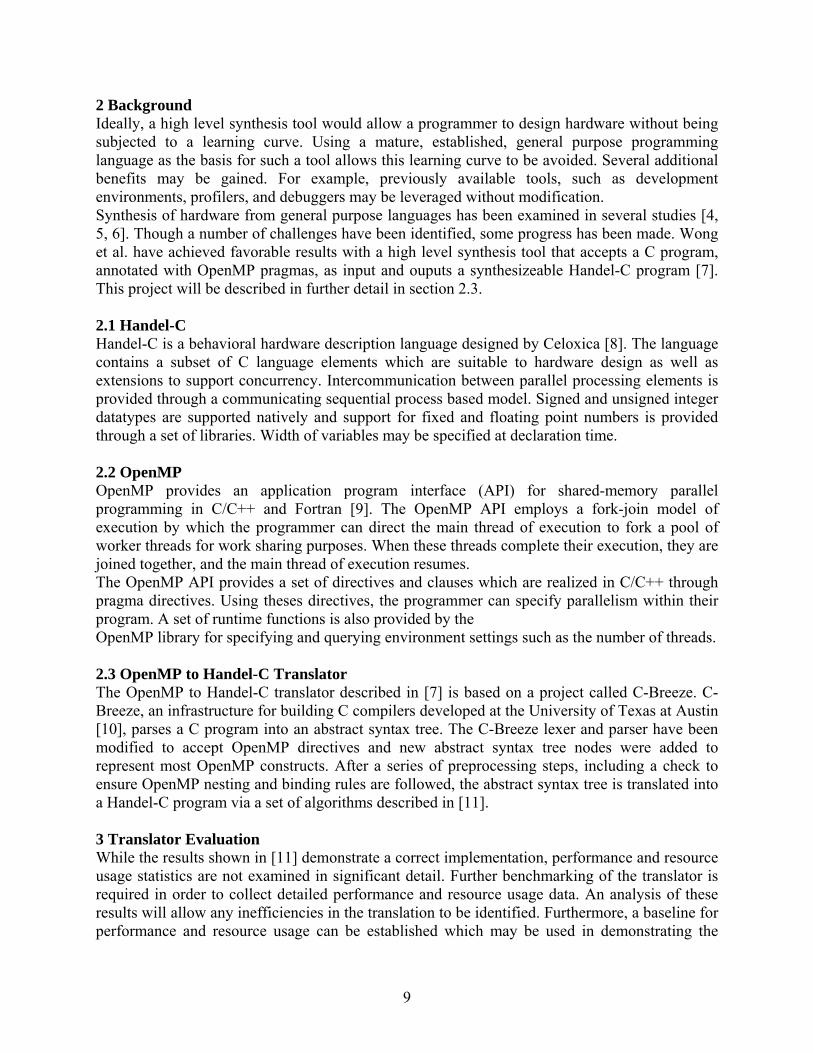
performance gains or resource usage improvements obtained in future improvements to the translator such as those proposed in [12, 13]. Overlooked implementation issues causing incorrect results may also be identified through this process. 3.1 Methodology An initial set of benchmark tests has been selected for obtaining performance and resource usage data. These tests include parallel implementations of a fixed-point Mandelbrot set generator, the Miller-Rabin primality test, and systolic sequence alignment. These algorithms use the majority of the OpenMP directives provided by the translator. Unused OpenMP directives will later be identified for future benchmarking. To obtain benchmark data, the test programs are first translated to Handel-C. Using Celoxica’s DK IDE 5.0 debugger, clock cycles are computed and then recorded. The translated Handel-C program is converted to a hardware-specific VHDL file (in this case for a Xilinx Spartan3 FPGA) and a NAND gate count recorded. Using Xilinx ISE 9.1, logic slice and 4-input look-up table counts are generated and collected from the map report. The post place-and-route timing report provides the minimum clock period and maximum clock frequency. The execution time is given by the number of clock cycles multiplied by the minimum clock period. 4 Preliminary Results Benchmark data has been obtained for the parallel Mandelbrot generator with 1-4 threads and an image size of 640x480 pixels. These results are shown in Figure 1. The remaining benchmarks have been implemented but data has not yet been collected. 5 Proposed Improvements In the translator’s current state, all integers in the source program are translated to 32-bit registers. While this guarantees that hardware and software implementations of an OpenMP program are the same with respect to data storage, it may lead to inefficiency when smaller registers are sufficient. 5.1 Customizable Bit Width Customizable bit width should lead to resource savings and faster clock rates. To maintain consistency with the OpenMP compiler directive scheme, a new pragma directive has been implemented allowing variable and function declarations to be annotated with a desired bit width. Figure 2 shows a code fragment using the bit width directive and the resulting Handel-C output generated by the translator is shown in Figure 3.
10
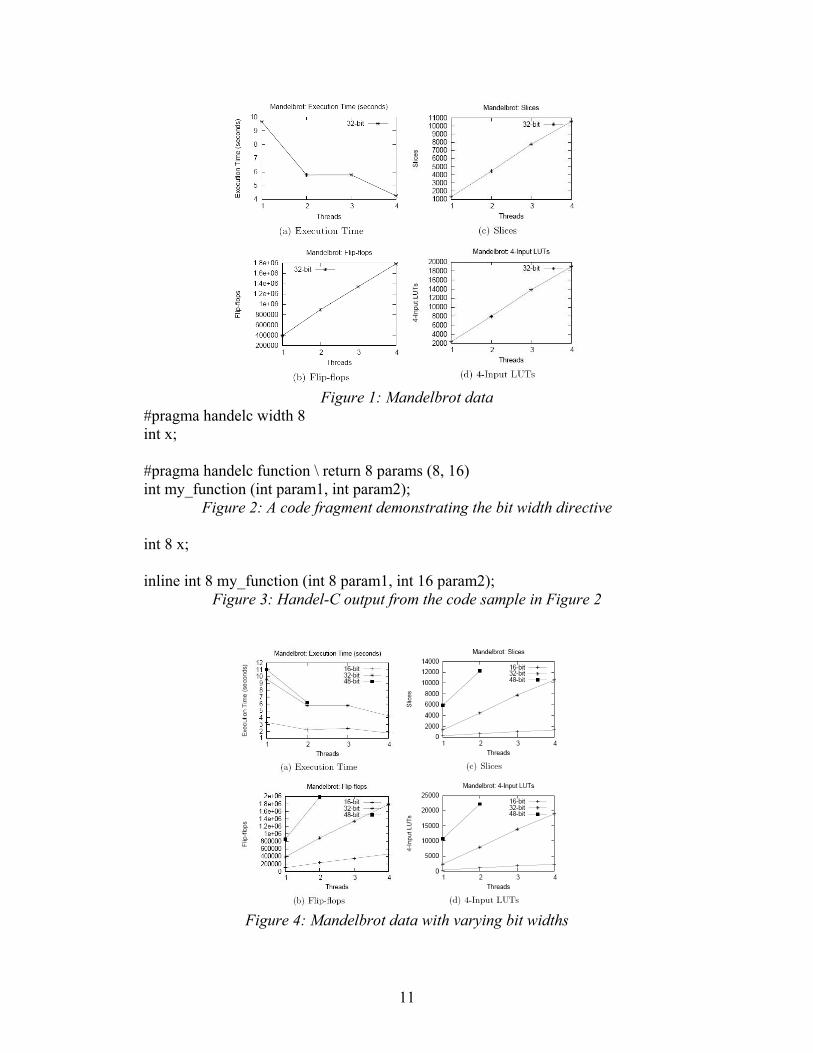
Figure 1: Mandelbrot data
#pragma handelc width 8 int x;
#pragma handelc function \ return 8 params (8, 16) int my_function (int param1, int param2);
Figure 2: A code fragment demonstrating the bit width directive
int 8 x;
inline int 8 my_function (int 8 param1, int 16 param2); Figure 3: Handel-C output from the code sample in Figure 2
Figure 4: Mandelbrot data with varying bit widths
11
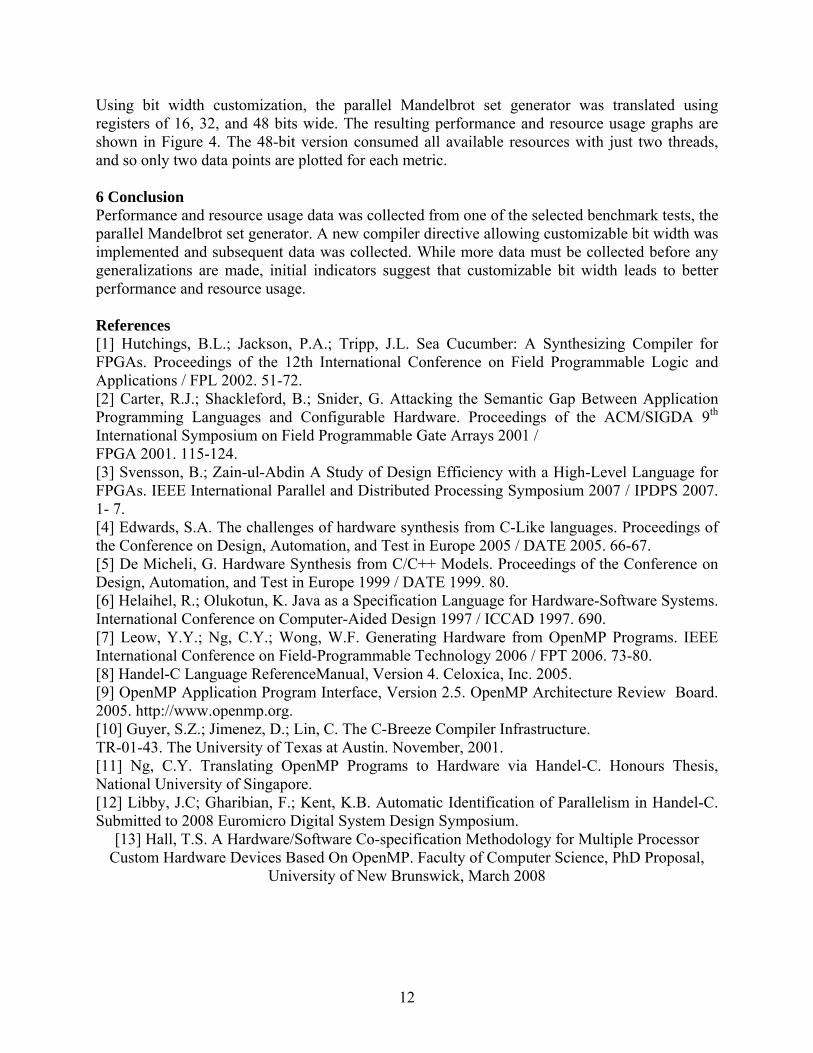
Using bit width customization, the parallel Mandelbrot set generator was translated using registers of 16, 32, and 48 bits wide. The resulting performance and resource usage graphs are shown in Figure 4. The 48-bit version consumed all available resources with just two threads, and so only two data points are plotted for each metric. 6 Conclusion Performance and resource usage data was collected from one of the selected benchmark tests, the parallel Mandelbrot set generator. A new compiler directive allowing customizable bit width was implemented and subsequent data was collected. While more data must be collected before any generalizations are made, initial indicators suggest that customizable bit width leads to better performance and resource usage. References [1] Hutchings, B.L.; Jackson, P.A.; Tripp, J.L. Sea Cucumber: A Synthesizing Compiler for FPGAs. Proceedings of the 12th International Conference on Field Programmable Logic and Applications / FPL 2002. 51-72. [2] Carter, R.J.; Shackleford, B.; Snider, G. Attacking the Semantic Gap Between Application Programming Languages and Configurable Hardware. Proceedings of the ACM/SIGDA 9th International Symposium on Field Programmable Gate Arrays 2001 / FPGA 2001. 115-124. [3] Svensson, B.; Zain-ul-Abdin A Study of Design Efficiency with a High-Level Language for FPGAs. IEEE International Parallel and Distributed Processing Symposium 2007 / IPDPS 2007. 1- 7. [4] Edwards, S.A. The challenges of hardware synthesis from C-Like languages. Proceedings of the Conference on Design, Automation, and Test in Europe 2005 / DATE 2005. 66-67. [5] De Micheli, G. Hardware Synthesis from C/C++ Models. Proceedings of the Conference on Design, Automation, and Test in Europe 1999 / DATE 1999. 80. [6] Helaihel, R.; Olukotun, K. Java as a Specification Language for Hardware-Software Systems. International Conference on Computer-Aided Design 1997 / ICCAD 1997. 690. [7] Leow, Y.Y.; Ng, C.Y.; Wong, W.F. Generating Hardware from OpenMP Programs. IEEE International Conference on Field-Programmable Technology 2006 / FPT 2006. 73-80. [8] Handel-C Language ReferenceManual, Version 4. Celoxica, Inc. 2005. [9] OpenMP Application Program Interface, Version 2.5. OpenMP Architecture Review Board. 2005. http://www.openmp.org. [10] Guyer, S.Z.; Jimenez, D.; Lin, C. The C-Breeze Compiler Infrastructure. TR-01-43. The University of Texas at Austin. November, 2001. [11] Ng, C.Y. Translating OpenMP Programs to Hardware via Handel-C. Honours Thesis, National University of Singapore. [12] Libby, J.C; Gharibian, F.; Kent, K.B. Automatic Identification of Parallelism in Handel-C. Submitted to 2008 Euromicro Digital System Design Symposium.
[13] Hall, T.S. A Hardware/Software Co-specification Methodology for Multiple Processor Custom Hardware Devices Based On OpenMP. Faculty of Computer Science, PhD Proposal,
University of New Brunswick, March 2008
12

Combining Rules, Taxonomies and Probabilities in the Extended OO jDREW Rule Engine
Harold Boley, Benjamin Larry Craig, Judy Zhao, Greg Sherman, Tshering Dema Abstract OO jDREW extensions are discussed for top-down and bottom-up rule execution, a Findall solutions predicate for the top-down engine, dual rule syntax, light-weight rule-ontology combination, and importing knowledge bases from Web sources. A design is presented for introducing uncertainty management to knowledge representation with rules, and exemplified with a Currency Exchange example. 1 Introduction There are two kinds of knowledge bases (KBs) that can be expressed in the RuleML interchange language and its POSL presentation syntax <http://www.ruleml.org> as implemented in OO jDREW <http://www.jdrew.org/oojdrew>: Rule KBs (e.g., in propositional logic, Datalog, and Horn logic with negation as failure) and the subClassOf taxonomy backbone of ontology KBs (e.g., of frame-based languages, RDFS, and description logic). We present OO jDREW extensions including top-down and bottom-up rule execution, a Findall solutions predicate for the top-down engine, dual rule syntax, light-weight rule-ontology combination and importing KBs from Web sources. Extending our efforts to bridge rules and taxonomies use OO jDREW as a reasoning engine for RuleML and POSL, we then present a design to introduce uncertainty management into knowledge representation in both KB categories and work on bridging probabilities, rules and taxonomies, as shown in Fig. 1. As a starting point, we first introduce probabilities to knowledge representation in rules exemplified with a Currency Exchange example. This effort will include the following three main steps:
• Extend POSL to allow additional probabilistic information; • Convert a Bayesian Network into a probabilistic POSL KB that can be read into
probabilistically extended OO jDREW; • Query and reasoning based on the converted Bayesian Network using extended OO
jDREW. 2 Extended OO jDREW Features 2.1 Top-Down and Bottom-up Rule Execution OO jDREW allows support for two di_erent types of reasoning namely bottom up and top down. Bottom-up execution is used to infer all derivable knowledge from a set of clauses and is also known as forward reasoning. Top-down execution is used to solve a query on the KB and is sometimes called backward reasoning. Having both modes of execution is useful depending on what user applications require.
13
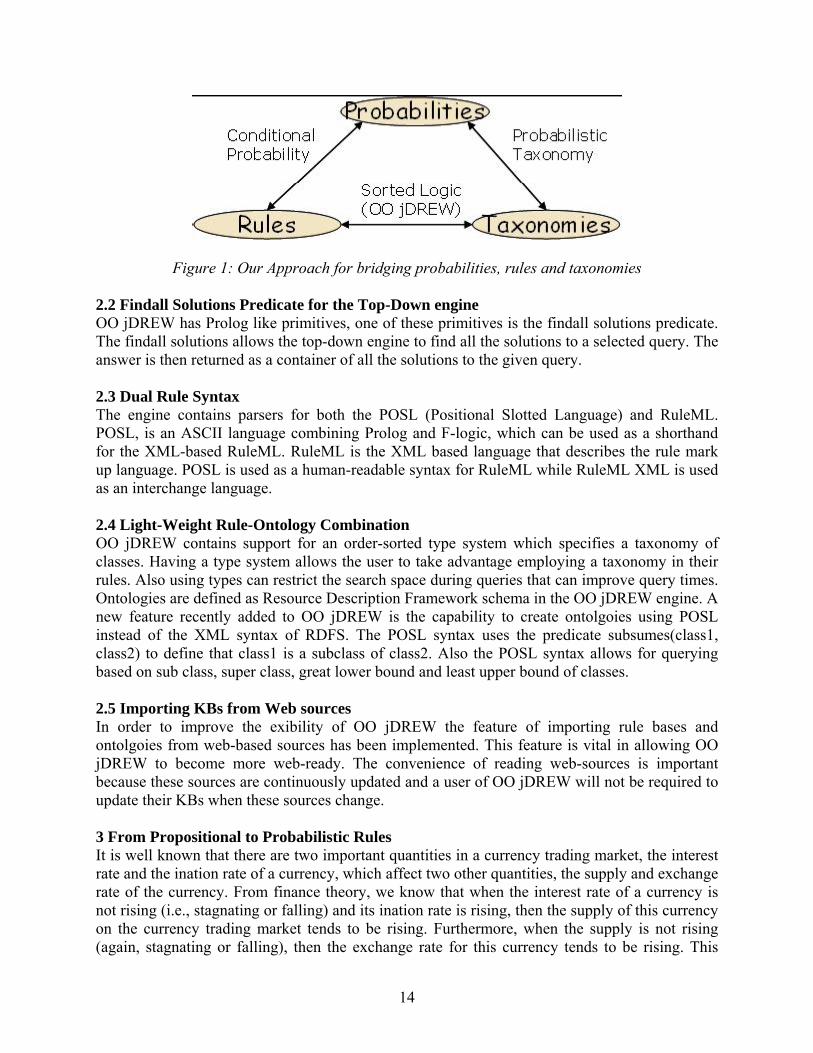
Figure 1: Our Approach for bridging probabilities, rules and taxonomies 2.2 Findall Solutions Predicate for the Top-Down engine OO jDREW has Prolog like primitives, one of these primitives is the findall solutions predicate. The findall solutions allows the top-down engine to find all the solutions to a selected query. The answer is then returned as a container of all the solutions to the given query. 2.3 Dual Rule Syntax The engine contains parsers for both the POSL (Positional Slotted Language) and RuleML. POSL, is an ASCII language combining Prolog and F-logic, which can be used as a shorthand for the XML-based RuleML. RuleML is the XML based language that describes the rule mark up language. POSL is used as a human-readable syntax for RuleML while RuleML XML is used as an interchange language. 2.4 Light-Weight Rule-Ontology Combination OO jDREW contains support for an order-sorted type system which specifies a taxonomy of classes. Having a type system allows the user to take advantage employing a taxonomy in their rules. Also using types can restrict the search space during queries that can improve query times. Ontologies are defined as Resource Description Framework schema in the OO jDREW engine. A new feature recently added to OO jDREW is the capability to create ontolgoies using POSL instead of the XML syntax of RDFS. The POSL syntax uses the predicate subsumes(class1, class2) to define that class1 is a subclass of class2. Also the POSL syntax allows for querying based on sub class, super class, great lower bound and least upper bound of classes. 2.5 Importing KBs from Web sources In order to improve the exibility of OO jDREW the feature of importing rule bases and ontolgoies from web-based sources has been implemented. This feature is vital in allowing OO jDREW to become more web-ready. The convenience of reading web-sources is important because these sources are continuously updated and a user of OO jDREW will not be required to update their KBs when these sources change. 3 From Propositional to Probabilistic Rules It is well known that there are two important quantities in a currency trading market, the interest rate and the ination rate of a currency, which affect two other quantities, the supply and exchange rate of the currency. From finance theory, we know that when the interest rate of a currency is not rising (i.e., stagnating or falling) and its ination rate is rising, then the supply of this currency on the currency trading market tends to be rising. Furthermore, when the supply is not rising (again, stagnating or falling), then the exchange rate for this currency tends to be rising. This
14
knowledge can be roughly formalized in Propositional Logic (with negation as failure: naf) using four nullary predicates expressing the rising of these quantities (Interest: Interest Rate; Ination: Ination Rate; Supply: Supply on Market; Exchange: Currency Exchange rate). In this initial model, there are two facts and rules, which can be written in POSL as follows (the empty parenthesis pairs are usually omitted in Propositional Logic, but prepare the following steps):
Interest(). Inflation(). Supply() :- naf(Interest()), Inflation(). Exchange() :- naf(Supply()).
In a step towards a more realistic model, we introduce two arguments, time and currency, for all four predicates, obtaining a KB in Datalog is shown as follows (parentheses enclose two constants or variables, the latter being prefixed in POSL by a question mark):
Interest("2008-03-17", CAD). Inflation("2008-03-17", CAD). Supply(?T,?C) :- naf(Interest(?T,?C)), Inflation(?T,?C). Exchange(?T,?C) :- naf(Supply(?T,?C)).
Figure 2: Taxonomy of Currency For the next step, suppose we have the taxonomy of currencies shown in Fig. 2. KB in Datalog combined with taxonomy, obtaining a KB in Order-Sorted Datalog, is shown as follows, where the colon infix associates a variable with its type (a class from the taxonomy) and the question mark refers to an anonymous variable:
Inflation("2008-03-17", ?:CAD). Interest("2008-03-17", ?:CAD). Supply(?T, ?C:NorthAmericanCurrency) :-
naf(Interest(?T, ?C:NorthAmericanCurrency)), Inflation(?T, ?C:NorthAmericanCurrency).
Exchange(?T:Date, ?C:NorthAmericanCurrency) :- naf(Supply(?T:Date, ?C:NorthAmericanCurrency)). For the next step, notice that such rules are not always completely true in real situations. For example, we should only state that the conditional probability for a currency exchange rate known to go up if the supply of this currency goes up is p. In traditional probability theory, it has
15
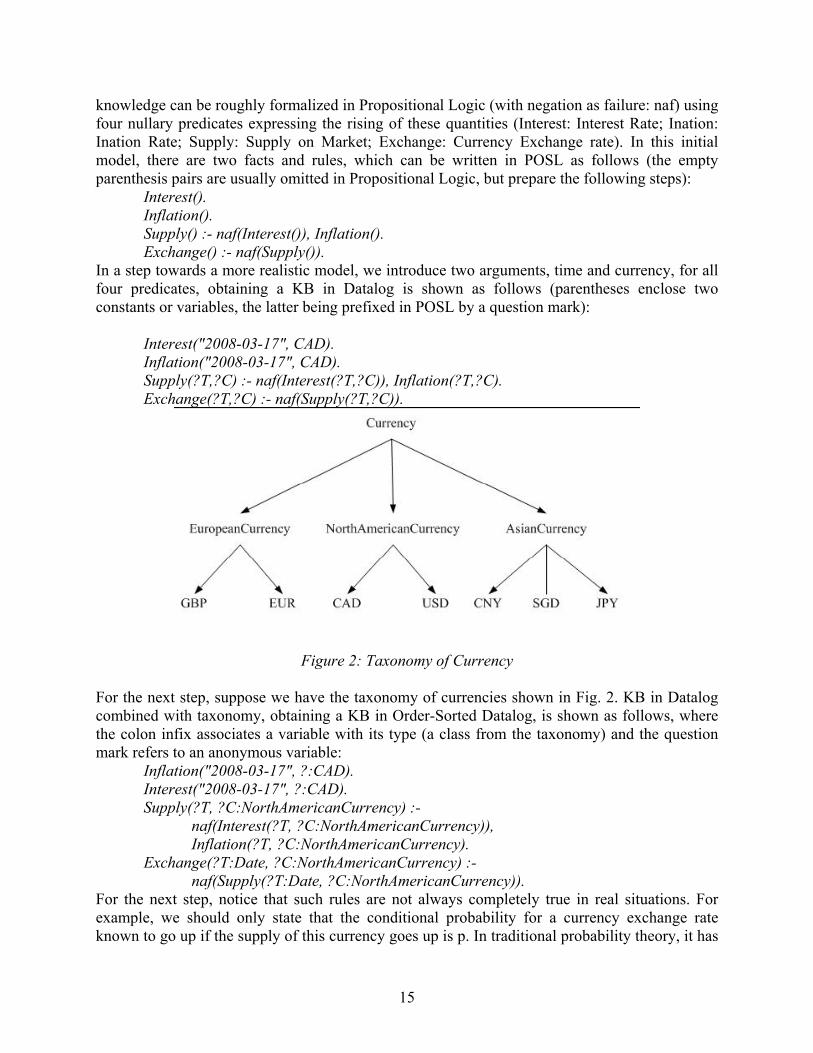
the form prob(Exchange|Supply) = p. Based on the causal relationships between the interest rate, the ination rate, the supply of a currency on an exchange market and the exchange rate, we can construct a Bayesian network as shown in Fig. 3. We regard a conditional probability like prob(Exchange j :Supply) = p as a probabilistic rule Exchange() :- neg(Supply()) / p. The neg represents a classical negation of a logical atom. The Bayesian network then becomes a probabilistic KB with the four rows of the Supply table becoming four rules, and the two rows of the Exchange table becoming two rules (in Probabilistic Propositional Logic):
Figure 3: A Network of Currency Trading Market
Interest() / 0.3. Inflation() / 0.03. Supply() :- Interest(), Inflation() / 0.55. Supply() :- Interest(), neg(Inflation()) / 0.94. Supply() :- neg(Interest()), Inflation() / 0.29. Supply() :- neg(Interest()), neg(Inflation()) / 0.1. Exchange() :- Supply() / 0.1. Exchange() :- neg(Supply()) / 0.3. With such a KB, we will extend OO jDREW to do several kinds of probabilistic querying and reasoning based on the product rule, the theorem of total probability, Bayes' rule and Bayesian Networks. For example, the implementation of independent conjoined probabilities is planned as an extension of the OO jDREW Java iterator for conjunction processing. 4 Conclusion The versions of the Currency Exchange example prior to the introduction of probabilities can already be run in the current OO jDREW, which can be used online with Java Web Start (the OO jDREW sources are freely available under GNU LGPL). The implementation of OO jDREW probability management on the Java level will follow the design presented in this paper. OO jDREW is one of the engines used by the distributed Rule Responder architecture <http://resp onder.ruleml.org>. RuleML and the OO jDREW Open Source Initiative <http://wiki.ruleml.org/OO jDREW> have also been working with OMG's PRR http://www.omg.org/docs/dtc/07-11-04.pdf and W3C's RIF <http://www.w3.org/2005/rules/ wiki/RIF Working Group>. Our companion paper in these proceedings describes the XSLT-based RDF2POSL translator along with the eTourism OO jDREW use case eTour-Plan.
16
Translating FOAF/RDF-like Profiles for an eTourism Use Case of OO jDREW
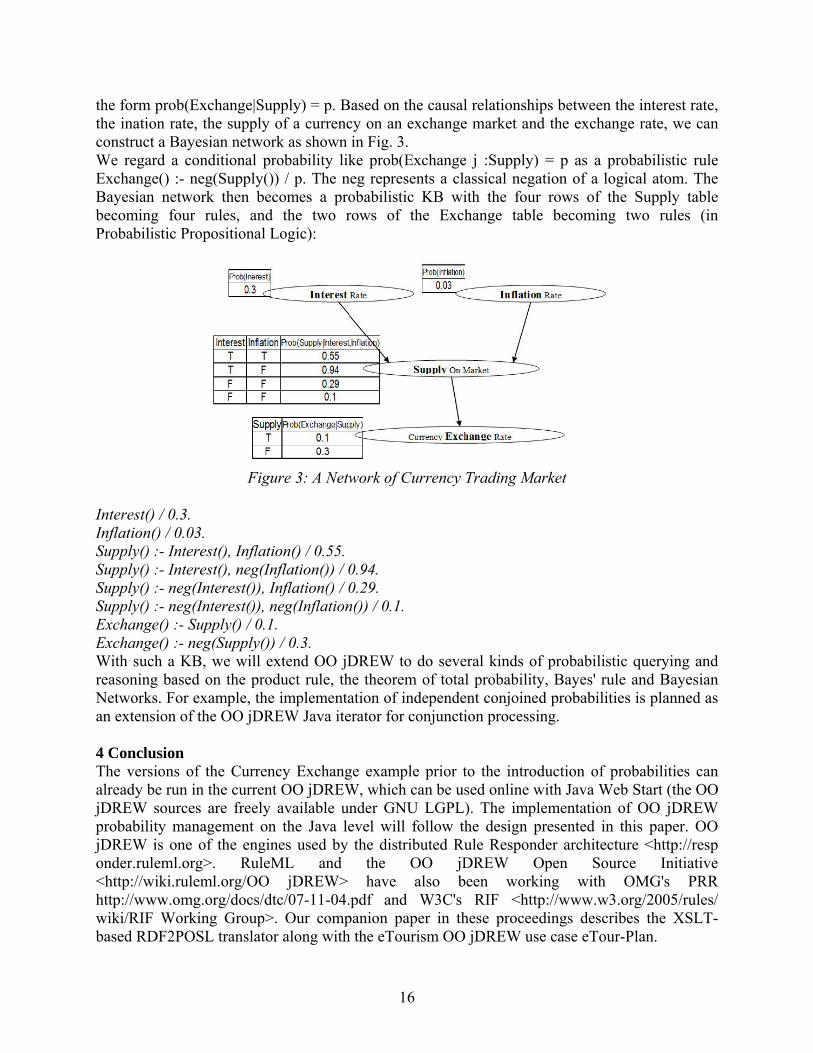
Harold Boley, Greg Sherman, Tshering Dema,Benjamin Larry Craig, Judy Zhao Abstract As a contribution to knowledge interoperation between Semantic Web languages, the XSLT-based translator RDF2POSL from OWL/RDF instances with subClassOf taxonomies to RuleML and POSL with order-sorted types is discussed. The RuleML and OO jDREW use case eTourPlan for FOAF/RDF-based travel recommendations is presented. 1 Introduction Instances in OWL and RDF knowledge bases (KBs) are expressed as object-centric descriptions called slotted facts in the RuleML interchange language and its POSL presentation syntax <http://www.ruleml.org> as implemented in OO jDREW <http://www.jdrew.org/oojdrew>. For providing order-sorted type restrictions to slot fillers, these descriptions are complemented by the subClassOf taxonomy backbone of ontology KBs (e.g., of frame-based languages, RDFS, and description logic), also implemented in OO jDREW. As a contribution to knowledge interoperation between Semantic Web languages, we present an XSLT translator from a subset of OWL/RDF to a subset of RuleML and POSL along with a use case of OO jDREW <http://www.ruleml.org/usecases> in eTourism. 2 XSLT-Translator OWL/RDF to RuleML/RDFS The use of XML-based Semantic Web languages such as W3C's Resource Description Framework (RDF) and Web Ontology Language (OWL) has become widespread for describing real-world knowledge. Users of OO jDREW can take advantage of this abundance of knowledge by utilizing the power of XSLT to translate these languages into OO RuleML (hence into POSL). OWL is often used to model (light-weight) ontologies with a taxonomy backbone that can be automatically extracted into an RDFS subClassOf taxonomy for use by OO jDREW's order-sorted type system. Instance descriptions in OWL/RDF/XML can be similarly translated to slotted facts in RuleML/XML. The RDF graph in Figure 1 shows a partial instance description of a well-known museum in Bhutan for use by eTourPlan (cf. Section 3). This knowledge may have been originally represented in RDF/XML as follows:
<rdf:Description rdf:about="Ta Dzong"> <rdf:type rdf:resource="National_museum">
<url>http://www.nationalmuseum.gov.bt/history-ta-dzong.html </url> <province>Paro</province> ... <theme>historical_cultural</theme>
</rdf:Description>
17
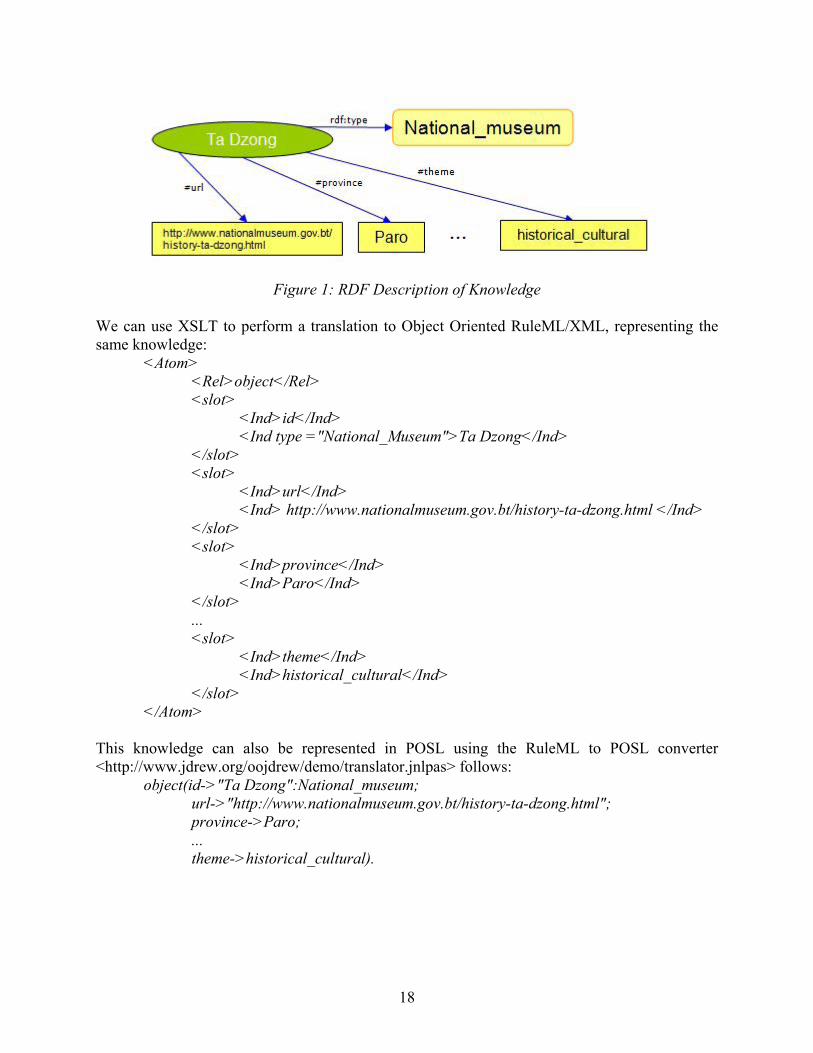
Figure 1: RDF Description of Knowledge
We can use XSLT to perform a translation to Object Oriented RuleML/XML, representing the same knowledge:
<Atom> <Rel>object</Rel> <slot>
<Ind>id</Ind> <Ind type ="National_Museum">Ta Dzong</Ind>
</slot> <slot>
<Ind>url</Ind> <Ind> http://www.nationalmuseum.gov.bt/history-ta-dzong.html </Ind>
</slot> <slot>
<Ind>province</Ind> <Ind>Paro</Ind>
</slot> ... <slot>
<Ind>theme</Ind> <Ind>historical_cultural</Ind>
</slot> </Atom>
This knowledge can also be represented in POSL using the RuleML to POSL converter <http://www.jdrew.org/oojdrew/demo/translator.jnlpas> follows:
object(id->"Ta Dzong":National_museum; url->"http://www.nationalmuseum.gov.bt/history-ta-dzong.html"; province->Paro; ... theme->historical_cultural).
18
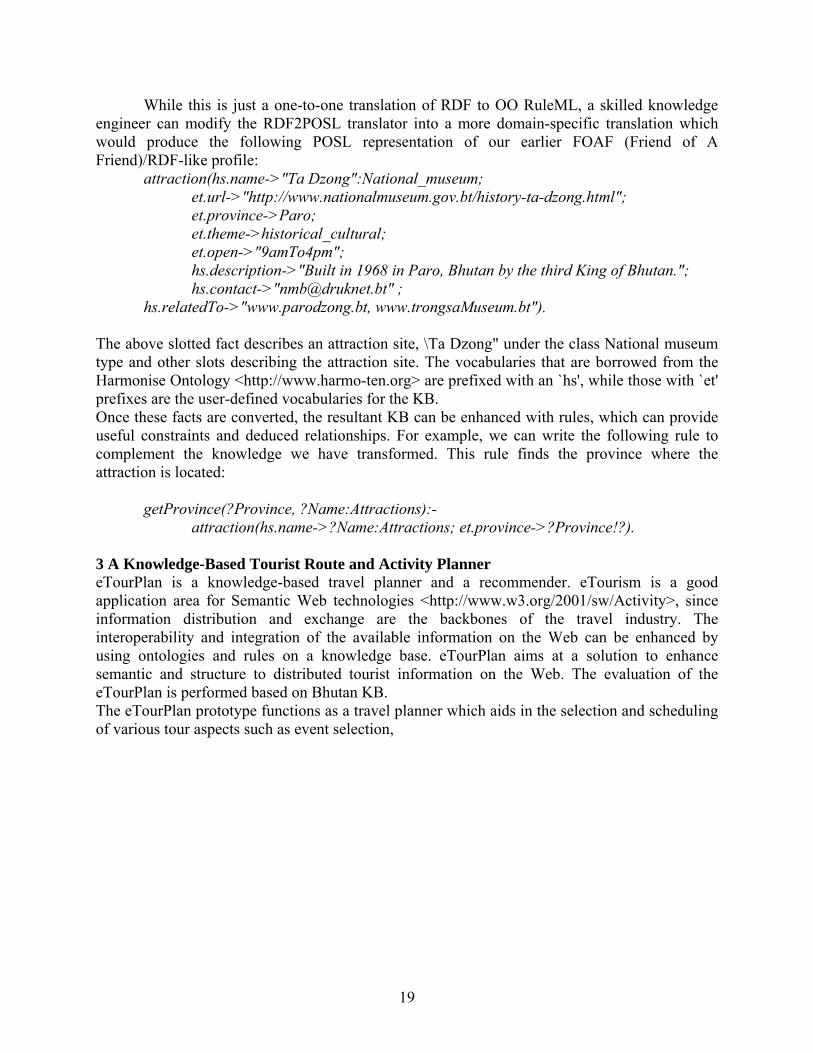
While this is just a one-to-one translation of RDF to OO RuleML, a skilled knowledge engineer can modify the RDF2POSL translator into a more domain-specific translation which would produce the following POSL representation of our earlier FOAF (Friend of A Friend)/RDF-like profile:
attraction(hs.name->"Ta Dzong":National_museum; et.url->"http://www.nationalmuseum.gov.bt/history-ta-dzong.html"; et.province->Paro; et.theme->historical_cultural; et.open->"9amTo4pm"; hs.description->"Built in 1968 in Paro, Bhutan by the third King of Bhutan."; hs.contact->"[email protected]" ;
hs.relatedTo->"www.parodzong.bt, www.trongsaMuseum.bt"). The above slotted fact describes an attraction site, \Ta Dzong" under the class National museum type and other slots describing the attraction site. The vocabularies that are borrowed from the Harmonise Ontology <http://www.harmo-ten.org> are prefixed with an `hs', while those with `et' prefixes are the user-defined vocabularies for the KB. Once these facts are converted, the resultant KB can be enhanced with rules, which can provide useful constraints and deduced relationships. For example, we can write the following rule to complement the knowledge we have transformed. This rule finds the province where the attraction is located:
getProvince(?Province, ?Name:Attractions):- attraction(hs.name->?Name:Attractions; et.province->?Province!?).
3 A Knowledge-Based Tourist Route and Activity Planner eTourPlan is a knowledge-based travel planner and a recommender. eTourism is a good application area for Semantic Web technologies <http://www.w3.org/2001/sw/Activity>, since information distribution and exchange are the backbones of the travel industry. The interoperability and integration of the available information on the Web can be enhanced by using ontologies and rules on a knowledge base. eTourPlan aims at a solution to enhance semantic and structure to distributed tourist information on the Web. The evaluation of the eTourPlan is performed based on Bhutan KB. The eTourPlan prototype functions as a travel planner which aids in the selection and scheduling of various tour aspects such as event selection,
19
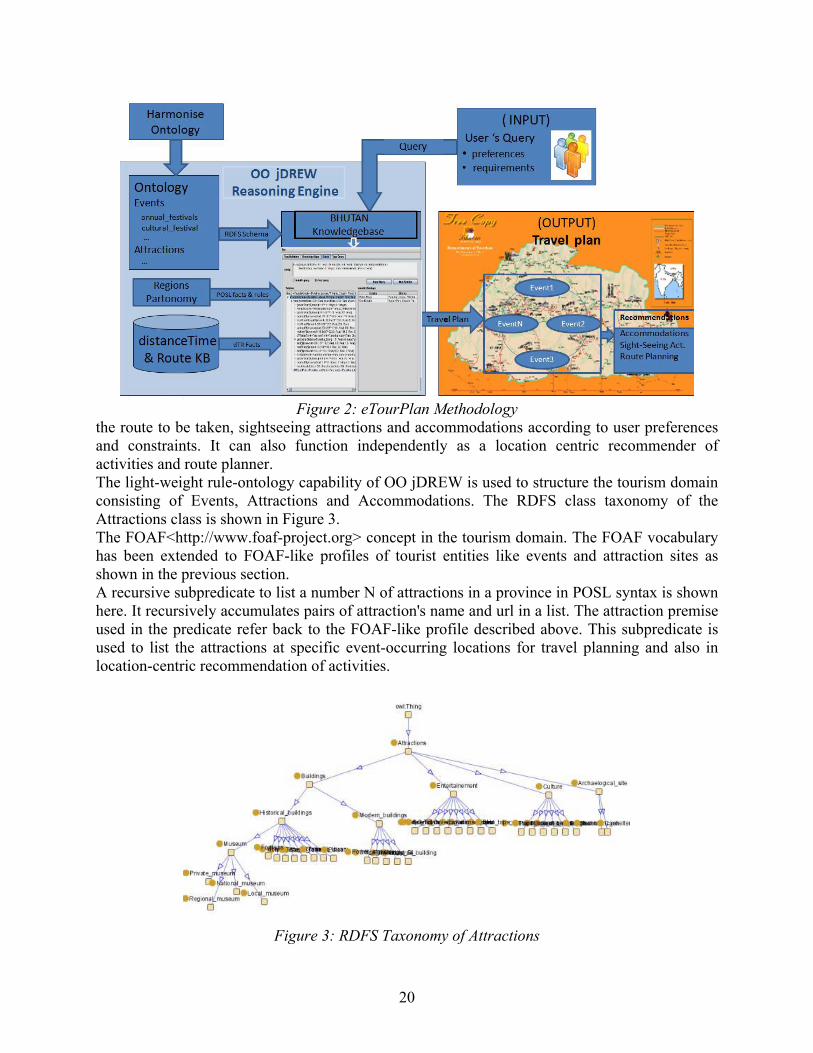
Figure 2: eTourPlan Methodology
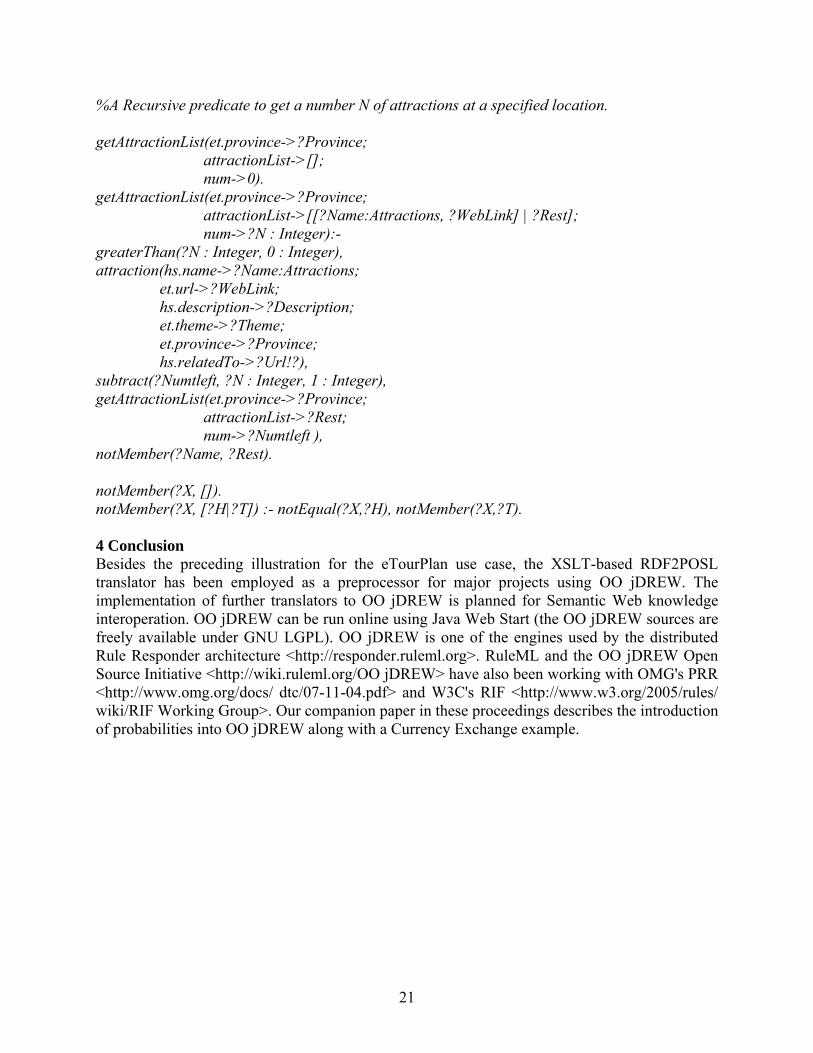
the route to be taken, sightseeing attractions and accommodations according to user preferences and constraints. It can also function independently as a location centric recommender of activities and route planner. The light-weight rule-ontology capability of OO jDREW is used to structure the tourism domain consisting of Events, Attractions and Accommodations. The RDFS class taxonomy of the Attractions class is shown in Figure 3. The FOAF<http://www.foaf-project.org> concept in the tourism domain. The FOAF vocabulary has been extended to FOAF-like profiles of tourist entities like events and attraction sites as shown in the previous section. A recursive subpredicate to list a number N of attractions in a province in POSL syntax is shown here. It recursively accumulates pairs of attraction's name and url in a list. The attraction premise used in the predicate refer back to the FOAF-like profile described above. This subpredicate is used to list the attractions at specific event-occurring locations for travel planning and also in location-centric recommendation of activities.
Figure 3: RDFS Taxonomy of Attractions
20
%A Recursive predicate to get a number N of attractions at a specified location. getAttractionList(et.province->?Province;
attractionList->[]; num->0).
getAttractionList(et.province->?Province; attractionList->[[?Name:Attractions, ?WebLink] | ?Rest]; num->?N : Integer):-
greaterThan(?N : Integer, 0 : Integer), attraction(hs.name->?Name:Attractions;
et.url->?WebLink; hs.description->?Description; et.theme->?Theme; et.province->?Province; hs.relatedTo->?Url!?),
subtract(?Numtleft, ?N : Integer, 1 : Integer), getAttractionList(et.province->?Province;
attractionList->?Rest; num->?Numtleft ),
notMember(?Name, ?Rest). notMember(?X, []). notMember(?X, [?H|?T]) :- notEqual(?X,?H), notMember(?X,?T). 4 Conclusion Besides the preceding illustration for the eTourPlan use case, the XSLT-based RDF2POSL translator has been employed as a preprocessor for major projects using OO jDREW. The implementation of further translators to OO jDREW is planned for Semantic Web knowledge interoperation. OO jDREW can be run online using Java Web Start (the OO jDREW sources are freely available under GNU LGPL). OO jDREW is one of the engines used by the distributed Rule Responder architecture <http://responder.ruleml.org>. RuleML and the OO jDREW Open Source Initiative <http://wiki.ruleml.org/OO jDREW> have also been working with OMG's PRR <http://www.omg.org/docs/ dtc/07-11-04.pdf> and W3C's RIF <http://www.w3.org/2005/rules/ wiki/RIF Working Group>. Our companion paper in these proceedings describes the introduction of probabilities into OO jDREW along with a Currency Exchange example.
21
A Goal Based Methodology for Developing Domain-Specific Ontological Frameworks
Faezeh Ensan Abstract In this paper we propose a high-level scheme that assists ontology engineers develop appropriate ontological frameworks. By ontological frameworks we mean those structures that specify particular phases and also provide implemented components for developing ontologies. Based on the i* conceptual modeling framework, our proposed scheme guides ontology engineers by customizing a suitable ontological framework based on their preferences and their specific domain necessities. In the proposed scheme,We specify the users of an ontological framework, their high-level softgaols as well as the goals that contribute to these softgoals. We exploit business processes and bind them to the goals in order to implement the framework. 1. Introduction The field of ontology engineering has witnessed a wide range of algorithms, tools and methodologies for developing and maintaining different types of ontologies. In [Ensan and Du, 2007] we have classified different ontological frameworks and have analyzed their features from a domain-centric point of view. By ontological frameworks we mean those proposals that specify particular phases and also provide implemented components for developing ontologies. Several frameworks address the issue of constructing and maintaining domain ontologies in the iterature. Maedche et al. [Maedche and Staab, 2001] have designed a framework for ontology learning. Their framework provides ontology engineers with proper tools for modeling and designing domain ontologies. It also offers semi-automatic techniques for extracting ontological concepts from structured and natural language documents. Ontolearn [Navigli and Velardi, 2004] is another framework for learning domain based ontologies from a set of relevant documents. It includes an algorithm for identifying the proper sense (meaning) of each term in a compound phrase using machine learning techniques. The existing models mostly exploit knowledge extraction, integration and maintenance methods to form the best framework for creating suitable domain ontologies. The most important questions that arise are how should a framework employ different components and methods? Which algorithms, techniques and architectures best fulfil the initial necessities of the domain? How can a developer change some parts of a framework based on new requirements and goals? Is a complicated framework always the best choice or an engineer can design a suitable naive version for simple problems and limited budgets? How can domain-specific features influence the framework? Can a general framework be appropriate for all domains or different domains require different operators and evaluation criteria? Our objective in this paper is to define some methods, guidelines and criteria for creating ontological frameworks, while considering the above discussed important points. This proposed high-level scheme assists ontology engineers to specify the goal of an ontological framework and its capabilities, the domain knowledge it intends to exploit, and also to indicate its dependency to a specific domain. We believe this scheme is a high-level technique, because it has been proposed for developing ontological frameworks which themselves can be utilized in order to create and maintain ontologies. With the purpose of specifying and tracking the ‘intentions’ and ‘goals’ of an ontological framework during the analysis and design phases, we utilize the i* [Yu, 1996] model and extend
22
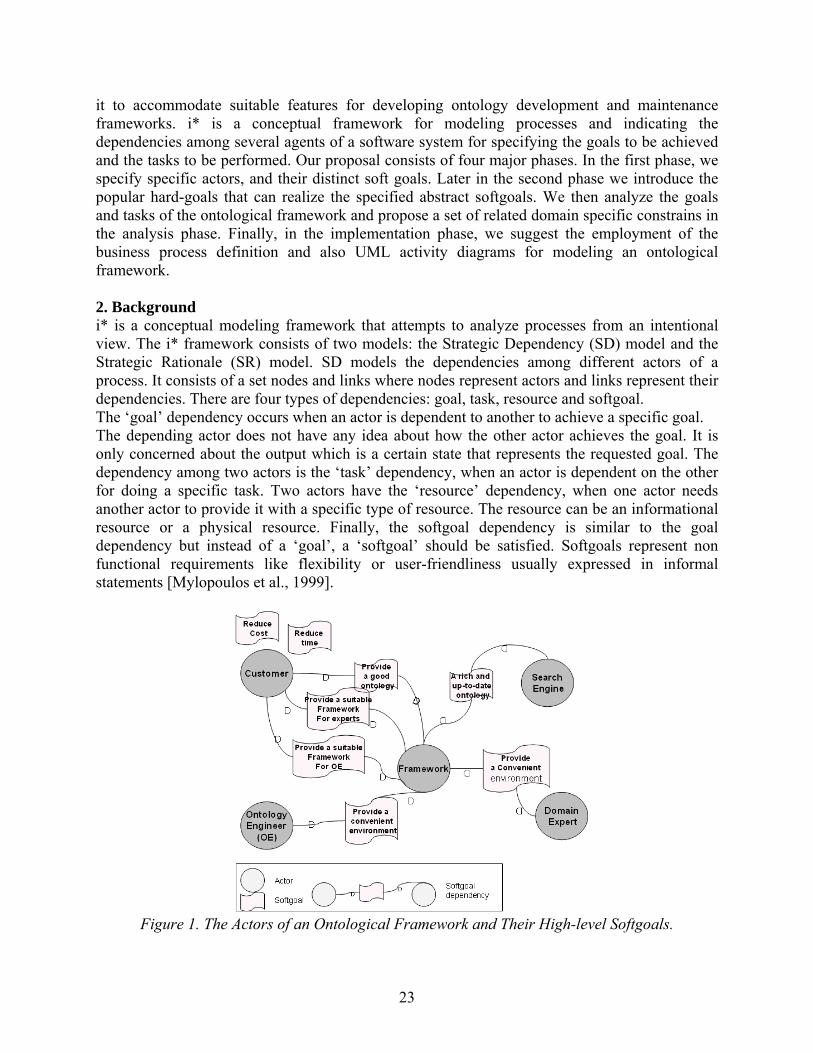
it to accommodate suitable features for developing ontology development and maintenance frameworks. i* is a conceptual framework for modeling processes and indicating the dependencies among several agents of a software system for specifying the goals to be achieved and the tasks to be performed. Our proposal consists of four major phases. In the first phase, we specify specific actors, and their distinct soft goals. Later in the second phase we introduce the popular hard-goals that can realize the specified abstract softgoals. We then analyze the goals and tasks of the ontological framework and propose a set of related domain specific constrains in the analysis phase. Finally, in the implementation phase, we suggest the employment of the business process definition and also UML activity diagrams for modeling an ontological framework. 2. Background i* is a conceptual modeling framework that attempts to analyze processes from an intentional view. The i* framework consists of two models: the Strategic Dependency (SD) model and the Strategic Rationale (SR) model. SD models the dependencies among different actors of a process. It consists of a set nodes and links where nodes represent actors and links represent their dependencies. There are four types of dependencies: goal, task, resource and softgoal. The ‘goal’ dependency occurs when an actor is dependent to another to achieve a specific goal. The depending actor does not have any idea about how the other actor achieves the goal. It is only concerned about the output which is a certain state that represents the requested goal. The dependency among two actors is the ‘task’ dependency, when an actor is dependent on the other for doing a specific task. Two actors have the ‘resource’ dependency, when one actor needs another actor to provide it with a specific type of resource. The resource can be an informational resource or a physical resource. Finally, the softgoal dependency is similar to the goal dependency but instead of a ‘goal’, a ‘softgoal’ should be satisfied. Softgoals represent non functional requirements like flexibility or user-friendliness usually expressed in informal statements [Mylopoulos et al., 1999].
Figure 1. The Actors of an Ontological Framework and Their High-level Softgoals.
23
The strategic rationale model, describes a process in more details. While SD focuses on an external view of dependencies among different actors, SR shows the internal implementation of the demanded tasks and goals of each actor. There are four types of nodes: goals, tasks, resources and softgoals and two types of links: means-end and task decomposition. A meansend relationship indicates that the ‘means’ node is a means for achieving, performing, obtaining or satisfying the end node. A task-decomposition link shows the sub components of a specific task. In Section 3 we will use i* in order to extract a suitable domain specific ontological framework. 3. A Scheme For Creating Domain-Specific Ontological Frameworks As a case study, we consider creating an ontological framework for tourism attractions of Canada. We employ this example to explain the features of the proposed scheme throughout the paper. We fully describe the four phases of our proposed scheme in Sections 3.1 through to 3.4. 3.1. The Actors and their High-Level Softgoals We define five types of actors for a typical ontological framework: the customer or stakeholder that supports and owns the project, the ontology engineer who is familiar with the ontology technologies, tools, algorithms and languages and can develop ontology with existing tools or can easily learn to employ new technologies, the domain expert who is completely familiar with the domain of discourse and can resolve any ambiguity about the domain concepts, the end-user who benefits from the ontology which is developed by the framework and finally the framework itself which should be created using the high-level methodology. Figure 1 shows these actors and their high-level soft goals.
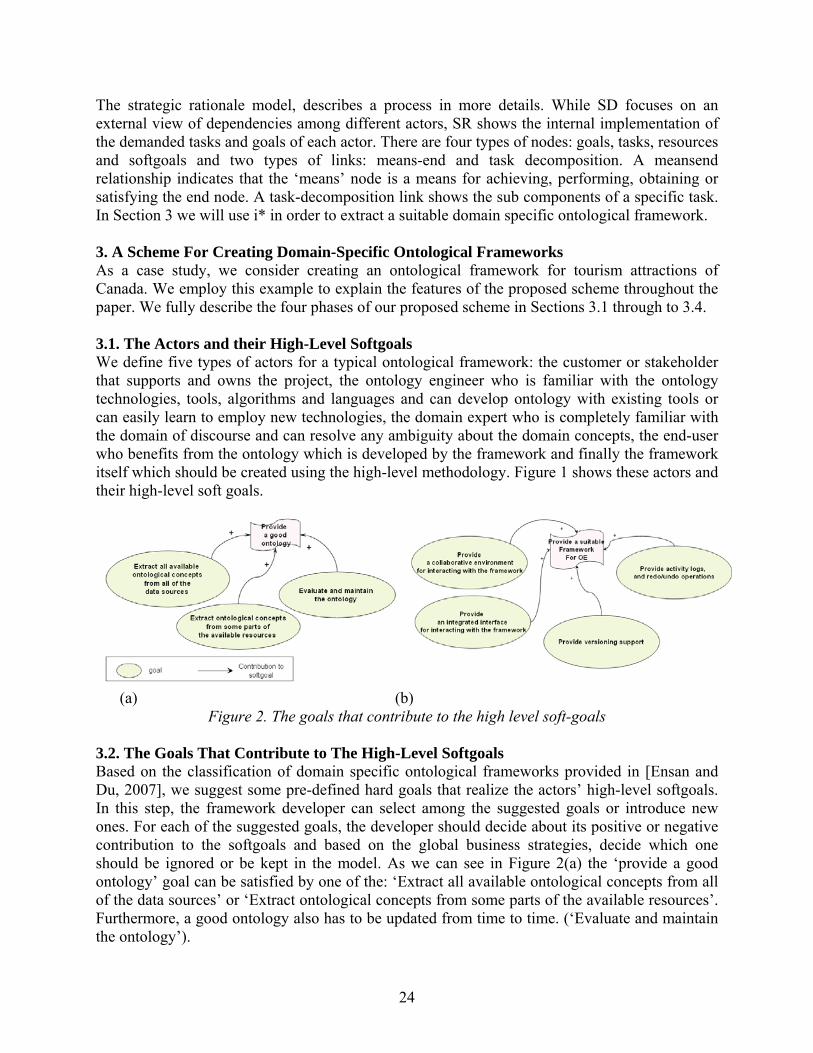
(a) (b) Figure 2. The goals that contribute to the high level soft-goals
3.2. The Goals That Contribute to The High-Level Softgoals Based on the classification of domain specific ontological frameworks provided in [Ensan and Du, 2007], we suggest some pre-defined hard goals that realize the actors’ high-level softgoals. In this step, the framework developer can select among the suggested goals or introduce new ones. For each of the suggested goals, the developer should decide about its positive or negative contribution to the softgoals and based on the global business strategies, decide which one should be ignored or be kept in the model. As we can see in Figure 2(a) the ‘provide a good ontology’ goal can be satisfied by one of the: ‘Extract all available ontological concepts from all of the data sources’ or ‘Extract ontological concepts from some parts of the available resources’. Furthermore, a good ontology also has to be updated from time to time. (‘Evaluate and maintain the ontology’).
24
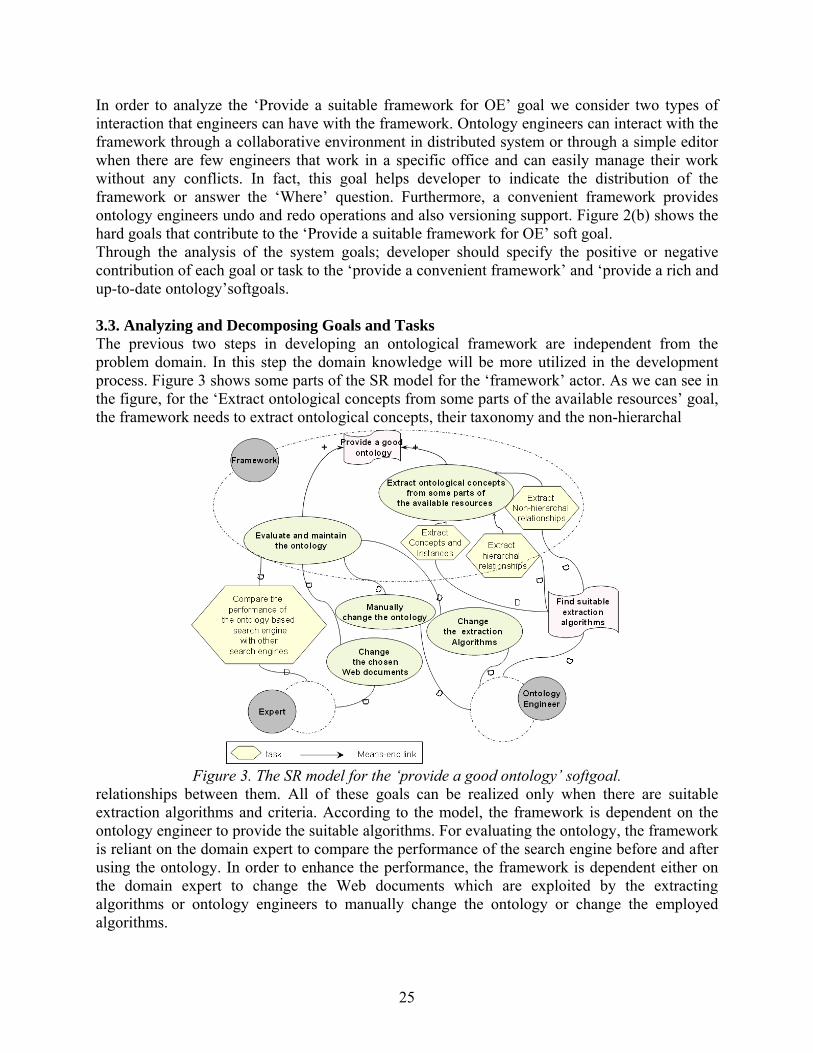
In order to analyze the ‘Provide a suitable framework for OE’ goal we consider two types of interaction that engineers can have with the framework. Ontology engineers can interact with the framework through a collaborative environment in distributed system or through a simple editor when there are few engineers that work in a specific office and can easily manage their work without any conflicts. In fact, this goal helps developer to indicate the distribution of the framework or answer the ‘Where’ question. Furthermore, a convenient framework provides ontology engineers undo and redo operations and also versioning support. Figure 2(b) shows the hard goals that contribute to the ‘Provide a suitable framework for OE’ soft goal. Through the analysis of the system goals; developer should specify the positive or negative contribution of each goal or task to the ‘provide a convenient framework’ and ‘provide a rich and up-to-date ontology’softgoals. 3.3. Analyzing and Decomposing Goals and Tasks The previous two steps in developing an ontological framework are independent from the problem domain. In this step the domain knowledge will be more utilized in the development process. Figure 3 shows some parts of the SR model for the ‘framework’ actor. As we can see in the figure, for the ‘Extract ontological concepts from some parts of the available resources’ goal, the framework needs to extract ontological concepts, their taxonomy and the non-hierarchal
Figure 3. The SR model for the ‘provide a good ontology’ softgoal.
relationships between them. All of these goals can be realized only when there are suitable extraction algorithms and criteria. According to the model, the framework is dependent on the ontology engineer to provide the suitable algorithms. For evaluating the ontology, the framework is reliant on the domain expert to compare the performance of the search engine before and after using the ontology. In order to enhance the performance, the framework is dependent either on the domain expert to change the Web documents which are exploited by the extracting algorithms or ontology engineers to manually change the ontology or change the employed algorithms.
25
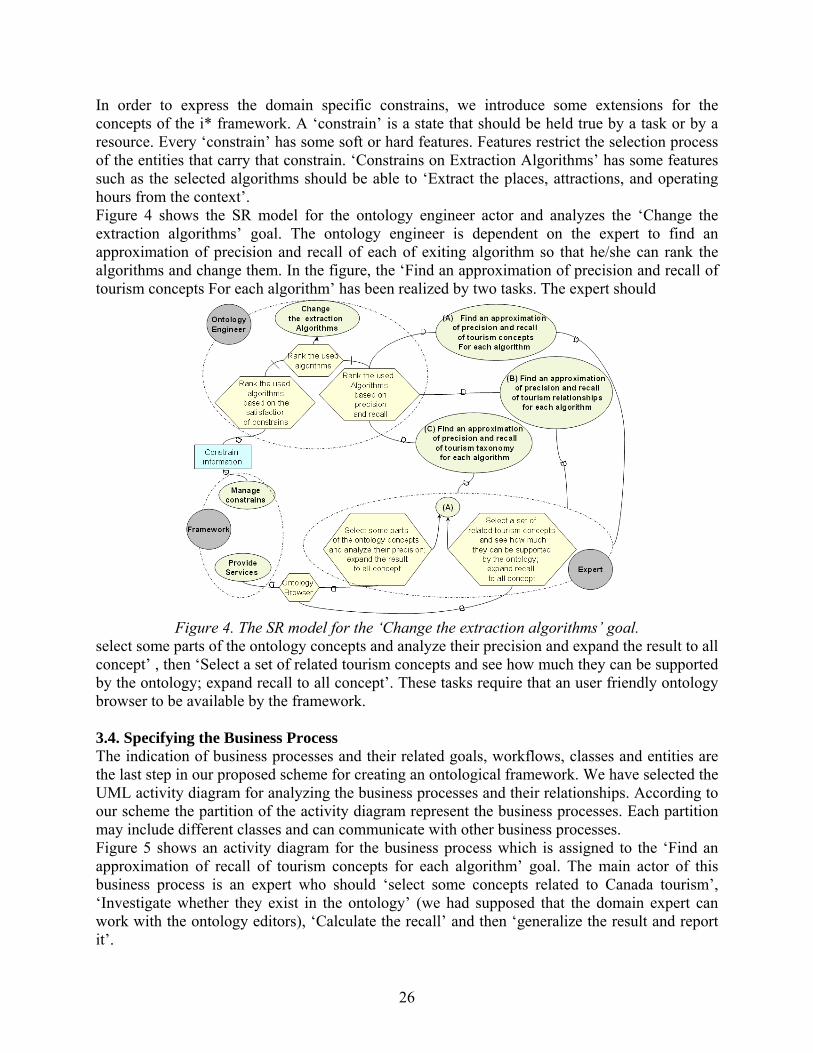
In order to express the domain specific constrains, we introduce some extensions for the concepts of the i* framework. A ‘constrain’ is a state that should be held true by a task or by a resource. Every ‘constrain’ has some soft or hard features. Features restrict the selection process of the entities that carry that constrain. ‘Constrains on Extraction Algorithms’ has some features such as the selected algorithms should be able to ‘Extract the places, attractions, and operating hours from the context’. Figure 4 shows the SR model for the ontology engineer actor and analyzes the ‘Change the extraction algorithms’ goal. The ontology engineer is dependent on the expert to find an approximation of precision and recall of each of exiting algorithm so that he/she can rank the algorithms and change them. In the figure, the ‘Find an approximation of precision and recall of tourism concepts For each algorithm’ has been realized by two tasks. The expert should
Figure 4. The SR model for the ‘Change the extraction algorithms’ goal.
select some parts of the ontology concepts and analyze their precision and expand the result to all concept’ , then ‘Select a set of related tourism concepts and see how much they can be supported by the ontology; expand recall to all concept’. These tasks require that an user friendly ontology browser to be available by the framework. 3.4. Specifying the Business Process The indication of business processes and their related goals, workflows, classes and entities are the last step in our proposed scheme for creating an ontological framework. We have selected the UML activity diagram for analyzing the business processes and their relationships. According to our scheme the partition of the activity diagram represent the business processes. Each partition may include different classes and can communicate with other business processes. Figure 5 shows an activity diagram for the business process which is assigned to the ‘Find an approximation of recall of tourism concepts for each algorithm’ goal. The main actor of this business process is an expert who should ‘select some concepts related to Canada tourism’, ‘Investigate whether they exist in the ontology’ (we had supposed that the domain expert can work with the ontology editors), ‘Calculate the recall’ and then ‘generalize the result and report it’.
26
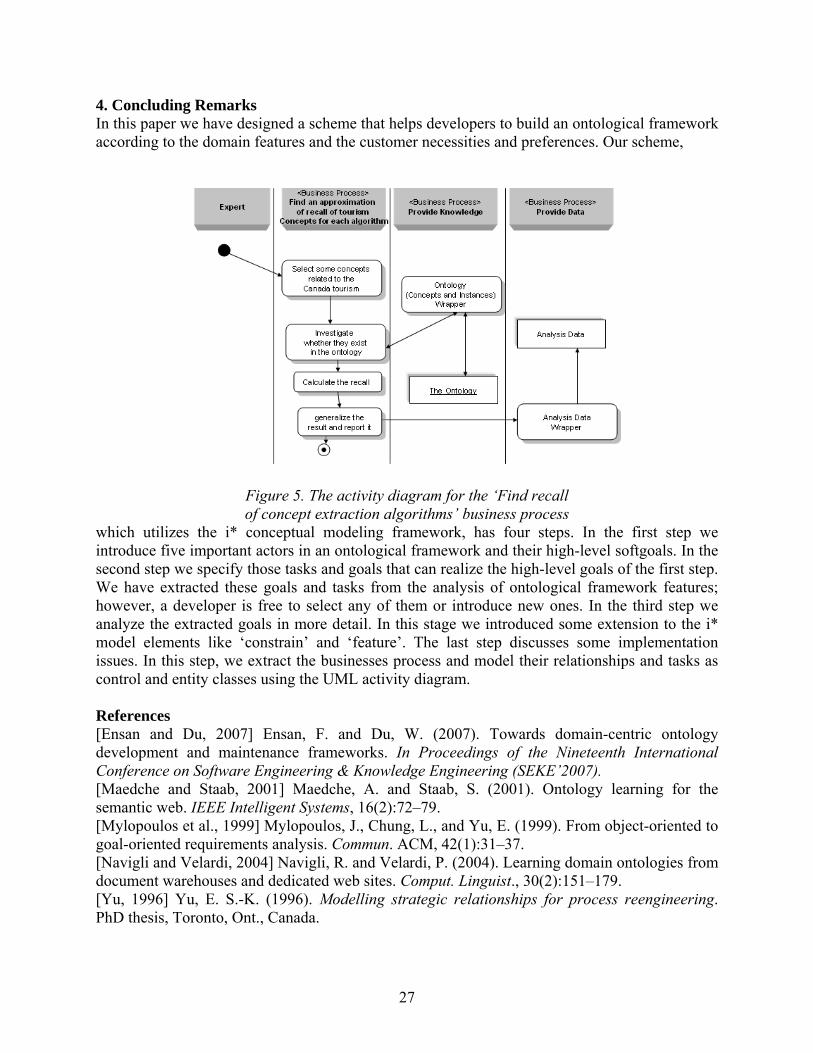
4. Concluding Remarks In this paper we have designed a scheme that helps developers to build an ontological framework according to the domain features and the customer necessities and preferences. Our scheme,
Figure 5. The activity diagram for the ‘Find recall of concept extraction algorithms’ business process
which utilizes the i* conceptual modeling framework, has four steps. In the first step we introduce five important actors in an ontological framework and their high-level softgoals. In the second step we specify those tasks and goals that can realize the high-level goals of the first step. We have extracted these goals and tasks from the analysis of ontological framework features; however, a developer is free to select any of them or introduce new ones. In the third step we analyze the extracted goals in more detail. In this stage we introduced some extension to the i* model elements like ‘constrain’ and ‘feature’. The last step discusses some implementation issues. In this step, we extract the businesses process and model their relationships and tasks as control and entity classes using the UML activity diagram. References [Ensan and Du, 2007] Ensan, F. and Du, W. (2007). Towards domain-centric ontology development and maintenance frameworks. In Proceedings of the Nineteenth International Conference on Software Engineering & Knowledge Engineering (SEKE’2007). [Maedche and Staab, 2001] Maedche, A. and Staab, S. (2001). Ontology learning for the semantic web. IEEE Intelligent Systems, 16(2):72–79. [Mylopoulos et al., 1999] Mylopoulos, J., Chung, L., and Yu, E. (1999). From object-oriented to goal-oriented requirements analysis. Commun. ACM, 42(1):31–37. [Navigli and Velardi, 2004] Navigli, R. and Velardi, P. (2004). Learning domain ontologies from document warehouses and dedicated web sites. Comput. Linguist., 30(2):151–179. [Yu, 1996] Yu, E. S.-K. (1996). Modelling strategic relationships for process reengineering. PhD thesis, Toronto, Ont., Canada.
27
A Design Flow for Optimal Circuit Design Using Resource and Timing Estimation
Farnaz Gharibian and Kenneth B. Kent Abstract In this paper, we study and investigate resource estimation methods that are used in circuit design for Field Programmable Gate Arrays (FPGAs). These methods usually estimate the amount of resources to be consumed by a hardware design before circuit synthesis takes place. The purpose of this study is to analyze the suitability of an estimation method for a design flow. A framework is also proposed to help the optimization process of the design. This framework automatically optimizes the design by finding potential parallelism in the design and applies it while considering the available resource and time constraints. 1. Introduction A Field Programmable Gate Array (FPGA) is a silicon chip containing an array of Configurable Logic Blocks (CLBs). Unlike an Application Specific Integrated Circuit (ASIC), which can be fabricated to perform a specific task for its lifetime, an FPGA can be reprogrammed to perform different tasks. The ability to reprogram FPGAs has led them to be widely used by hardware designers for prototyping circuits. There are two important constraints that should be considered by hardware designers using FPGAs: fitting the design inside the specified FPGAs and meeting the frequency constraints. The hardware designer needs to be aware of the number of resources consumed by the design because the number of logic elements and routing resources may vary across different FPGA devices. FPGA devices usually consist of CLBs and routing resources. Each CLB consists of one or more n-input look-up tables (LUTs), flip-flops and some form of fast carry logic. LUTs are used to implement logical operations and flipflops are used to hold data. Timing is another constraint that should be considered in hardware design. When running an application on an FPGA, it is crucial to do each task in a specific time. The amount of time that the critical path of the design takes is the minimum clock cycle that should be considered for the design. Information about design time and area consumption is not available for the designer until after the synthesis and place and route stages have been completed. This process takes time and as FPGA density increases allowing larger and more complex circuits to be implemented, this time is expected to increase. Hardware designers should get the result of their circuit design constraints quickly to change and improve their designs. Estimation tools are needed to help the designer during the hardware design process. Resource estimation tools estimate the number of FPGA resources consumed by a design. Delay estimation tools estimate the minimum clock period required to execute the application. Although estimation tools help the designers receive faster results regarding their design resource and delay, they still should repeat the process of design optimizations to get the best performance. Our proposed framework, discussed in section 3, automatically finds the potential parallelism in the code and improves the design with respect to the available FPGA resources and timing constraints from estimation tools. Estimation modules are used in this framework to help the optimization process. Several methods have been proposed for estimating area and timing parameters of FPGA designs. The goal is to provide quick and reasonably accurate resource usage estimation to the hardware designer. A fast and accurate estimation of the necessary resources for a hardware
28
design would allow the designer to try different variations of the design to find a fast and efficient design that can fit on an FPGA. In section 2 we discuss important areas where estimation tools in hardware design can be used. Our proposed framework is discussed in section 3. 2. Estimation Tools Area Estimation tools are used in different areas such as hardware/software design for partitioning, high level optimization in hardware, hardware designing by high level languages and IP core generators. The following subsections describe the use of estimation tools in each area. 2.1 Hardware/Software Partitioning Hardware/software partitioning is the key process in a hardware/software co-design methodology. Hardware/software partitioning splits the task onto different hardware/software processors in such a way that constraints such as area and latency are met. Different partitioning models can be investigated during the partitioning process. Estimation tools help the designers create quick estimations of the constraints in different models. 2.2 Generating IP-cores An Intellectual Property core (IP-core) represents a block of logic or data that is used in hardware design for FPGAs to carry out a particular functionality within the system. IP-cores can be reused in different designs so they must be very efficient. A fast estimation of the necessary resources is an important principle when generating optimal IP-cores. 2.3 High Level Languages In the past, most FPGA users would have been hardware designers with a significant amount of knowledge and experience in circuit design. Hardware Description Languages (HDLs) like VHDL or Verilog which focus on describing the structure and behavior of hardware elements rather than expressing algorithmic formulations are not familiar to software application programmers. High level languages are used to overcome these problems. Compiler tools that transform high-level languages into HDLs for mapping onto FPGAs provide a tremendous opportunity for the compiler to perform extensive optimizations that can take advantage of the characteristics of FPGA technology. Optimizations may help to achieve a higher degree of parallelism resulting in better performance. There is a trade-off between optimization and circuit space. In most cases, the programmer continues to apply optimizations as long as the resulting circuit still fits on the FPGA. The programmer must find the best combinations by trial and error. Each iteration of this process can be quite time consuming. The resource and area estimation tools in design time will help the programmer in this process. 3. Proposed Framework Hardware programs should be optimized to take the advantage of parallelism on FPGA boards. A Programmer who uses high level languages to define the design in hardware should consider the potential parallelism in the code. Usually it is a very difficult task for the high level language programmer to figure out the potential parallelism. We have proposed a framework that would help programmers to improve their design performances and to decrease their design development time. We follow two major goals in our design, dynamically identifying and maximizing the parallelism to improve the design while considering the available resources.
29
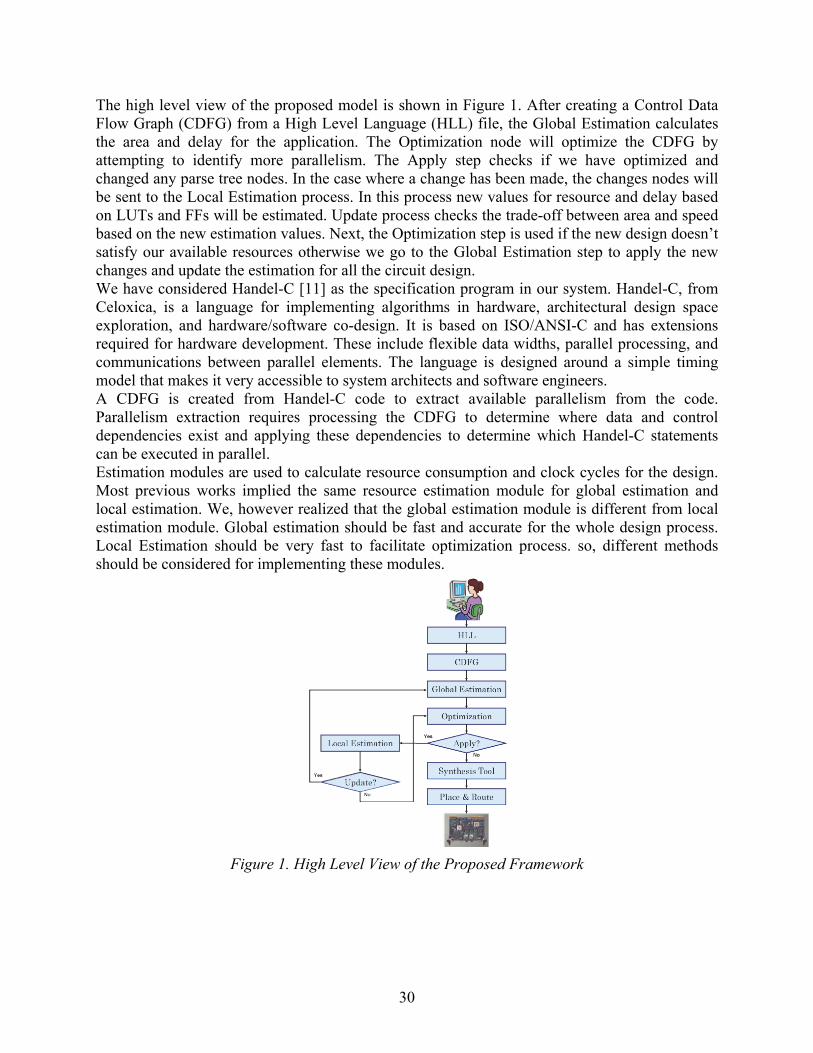
The high level view of the proposed model is shown in Figure 1. After creating a Control Data Flow Graph (CDFG) from a High Level Language (HLL) file, the Global Estimation calculates the area and delay for the application. The Optimization node will optimize the CDFG by attempting to identify more parallelism. The Apply step checks if we have optimized and changed any parse tree nodes. In the case where a change has been made, the changes nodes will be sent to the Local Estimation process. In this process new values for resource and delay based on LUTs and FFs will be estimated. Update process checks the trade-off between area and speed based on the new estimation values. Next, the Optimization step is used if the new design doesn’t satisfy our available resources otherwise we go to the Global Estimation step to apply the new changes and update the estimation for all the circuit design. We have considered Handel-C [11] as the specification program in our system. Handel-C, from Celoxica, is a language for implementing algorithms in hardware, architectural design space exploration, and hardware/software co-design. It is based on ISO/ANSI-C and has extensions required for hardware development. These include flexible data widths, parallel processing, and communications between parallel elements. The language is designed around a simple timing model that makes it very accessible to system architects and software engineers. A CDFG is created from Handel-C code to extract available parallelism from the code. Parallelism extraction requires processing the CDFG to determine where data and control dependencies exist and applying these dependencies to determine which Handel-C statements can be executed in parallel. Estimation modules are used to calculate resource consumption and clock cycles for the design. Most previous works implied the same resource estimation module for global estimation and local estimation. We, however realized that the global estimation module is different from local estimation module. Global estimation should be fast and accurate for the whole design process. Local Estimation should be very fast to facilitate optimization process. so, different methods should be considered for implementing these modules.
Figure 1. High Level View of the Proposed Framework
30
4. Concluding Remarks Resource estimation methods are used in the hardware design process to facilitate decision making by hardware designers based on the available resources in the target FPGA. In this paper, different approaches of estimation methods are categorized. Benchmark methods [13, 8] are efficient for big applications and projects, however these methods need suitable benchmarks. Equation-based [9, 10, 7] and Operational Block [4, 2, 1, 5] methods are suitable approach if a data flow graph can be drawn from the design. Therefore, they would be good candidates for high level language and hardware/software partitioning areas. Neural network methods [14] are useful for the applications that get lots of parameters in the design such as IP-core generation areas. Analytical methods [15, 3] are good candidates when more accurate and low level estimations are considered. Architecture methods [6, 12, 16, 17] fit better in the designs that consider a specific architecture. We have designed a hybrid model for our proposed estimation tool. The estimation tool consists of two models: Global Estimation and Local Estimation. Global Estimation gets a CDFG that is created from the Handel-C language and calculates the area and delay for the desired application. Local Estimation is used during the optimization process. It gives the area and delay for the optimized part of the program to the designer. Different estimation methods are used for each estimation module in our proposed tool. Global estimation should be accurate for the whole design process. We have considered Operational Blocks and Analytical methods for this module. Operational block method provides accurate and fast estimation about different functional units but not accurate estimation of the resource about the design control path. Analytical method is used to add the information about control path to functional units to have more accurate estimation for the whole design. We are using both methods in this module to provide an accurate estimation for the whole design. Local Estimation should be very fast to facilitate optimization process. Equation-based method is used in this module. In this method, functional units are categorized in different groups and a formula for each group is created. Each node in the graph is assigned to one of these categories. We can get a quick estimation for the changed nodes in the optimization process that helps to have fast optimization steps. We are developing a high performance decryption/decompression (DecRO) engine in Handel-C code. AES and LZ77 are considered as decryption and decompression algorithms that will be implemented in the DecRO engine. The performance of the engine will be increased by using parallelism and pipelining in the implementation of the algorithms. However, full pipelining and parallelism needs lots of resources. Therefore, there is a trade off between achieving higher performance and using fewer amounts of resources. There are lots of challenges in designing the engine and improving it by adding parallelism while considering the available resources that makes it a suitable benchmark for evaluating our system. References [1] S. Bilavarn, G. Gogniat, J.-L. Philippe, and L. Bossuet. Design space pruning through early estimationsof area/delay tradeoffs for fpga implementations. IEEE Transactions on Computer-Aided Design of Integrated Circuits and Systems, 25(10):1950–1968, Oct. 2006. [2] Per Bjur´eus, Mikael Millberg, and Axel Jantsch. Fpga resource and timing estimation from matlab execution traces. In CODES ’02: Proceedings of the tenth international symposium on Hardware/software codesign, pages 31–36, 2002.
31
[3] C. Brandolese,W. Fornaciari, and F. Salice. An area estimation methodology for fpga based designs at systemc-level. In 41st Proceedings of Design Automation Conference, pages 129–132, 2004. [4] Joao M. P. Cardoso. On estimations for compiling software to fpga-based systems. In ASAP ’05: Proceedings of the 2005 IEEE International Conference on Application-Specific Systems, Architecture Processors (ASAP’05), pages 225–230, Washington, DC, USA, 2005. [5] Rolf Enzler, Tobias Jeger, Didier Cottet, and Gerhard Tr¨oster. High-level area and performance estimation of hardware building blocks on fpgas. In FPL ’00: Proceedings of the The Roadmap to Reconfigurable Computing, 10th International Workshop on Field-Programmable Logic and Applications, pages 525–534, 2000. [6] Reiner Hartenstein. A decade of reconfigurable computing: a visionary retrospective. In DATE ’01: Proceedings of the conference on Design, automation and test in Europe, pages 642–649, 2001. [7] Tianyi Jiang, Xiaoyong Tang, and Prith Banerjee. Macro-models for high level area and power estimation on fpgas. International Journal of Simulation and Process Modelling, 2(1/2):12–19, 2006. [8] Stephen Kliman. Prep benchmarks reveal performance and capacity tradeoffs of programmable logic devices. In Proceedings of the IEEE International ASIC Conference and Exhibit (ASIC’94), pages 376–382, 1994. [9] D. Kulkarni, W.A. Najjar, R. Rinker, and F.J. Kurdahi. Fast area estimation to support compiler optimizations in fpga-based reconfigurable systems. In Proc. IEEE Symp. Field-Programmable Custom Computing Machines (FCCM 2002), pages 239– 247, 2002. [10] Dhananjay Kulkarni, Walid A. Najjar, Robert Rinker, and Fadi J. Kurdahi. Compile-time area estimation for lut-based fpgas. ACM Transactions on Design Automation of Electronic Systems, 11(1):104–122, January 2006. [11] Celoxica Ltd. Handel-C for hardware design: The value of software design and debug methods to designers addressing reconfigurable logic. http://www.celoxica.com/techlib/, August 2002. [12] B. Mei, S. Vernalde, D. Verkest, and R. Lauwereins. Design methodology for a tightly coupled vliw/reconfigurable matrix architecture: A case study. In DATE ’04: Proceedings of the conference on Design, automation and test in Europe, volume 2, pages 1224–1229, 2004. [13] W. Miller and K. Owyang. Designing a high performance fpga using the prep benchmarks. In Proceedings of WESCON93 Conference, pages 234–239, 1993. [14] Adam Monostori, Hans Holm Frhauf, and Gabriella Kokai. Quick estimation of resources of fpgas and asics using neural networks. In LWA, pages 210–215, 2005. [15] A. Nayak, M. Haldar, A. Choudhary, and P. Banerjee. Accurate area and delay estimators for fpgas. In DATE ’02: Proceedings of the conference on Design, automation and test in Europe, 2002. [16] Hartej Singh, Ming-Hau Lee, Guangming Lu, Fadi J. Kurdahi, Nader Bagherzadeh, and Eliseu M. Chaves Filho. Morphosys: An integrated reconfigurable system for data-parallel and computation-intensive applications. IEEE Transactions on Computers, 49(5):465–481, May 2000. [17] L. Yan, T. Srikanthan, and N. Gang. Area and delay estimation for fpga implementation of coarsegrained reconfigurable architectures. Proceedings of the 2006 LCTES Conference, 41(7):182–188, 2006.
32
A Hardware/Software Co-specification Methodology for Multiple Processor Custom Hardware Devices Based On OpenMP
Thomas S. Hall and Kenneth B. Kent Abstract This paper presents a research proposal for the development of a hardware/software co-specification methodology based on the OpenMP parallel programming specification and API. The target platforms are MPSoC and FPGA devices with embedded processors and custom hardware circuitry. The methodology is supported by a tool set that provides analysis utilities to aid in the design of a system. 1. Introduction This document presents an overview of research work to be performed to develop a methodology for the co-specification of hardware/software systems for use on multiple processor custom hardware devices such as MPSoCs and FPGAs. This methodology utilizes an extended version of OpenMP. OpenMP is used because it provides a well defined parallel programming framework upon which the inherent parallelism within hardware/software systems can be modeled. The development of this co-specification methodology will produce:
• A step-by-step approach to create system designs suitable for deployment as either software-only applications or combined hardware and software systems. This methodology includes techniques for analyzing the system to be co-specified, partitioning the system into hardware and software components, and generating output suitable for hardware synthesis and software compilation.
• A tool suite to aid in the design of systems with the methodology, including design structure and data item usage analyzers, and hardware and software output source code generators.
While the proposed co-specification methodology is generally applicable to all hardware/software systems, its use will be demonstrated on real-world applications in engineering and statistics. Co-specification is defined to mean the design, modeling and implementation of a hardware/software co-designed system using a single, well-defined methodology and language. Ideally, the hardware and software parts of the system are indistinguishable within the source code of the system except for markers that indicate the portions of the design that are suitable for hardware synthesis. A co-specification implicitly includes a definition of the communications interface between the hardware and software partitions. Section 2 provides background information for the proposed research. A discussion of issues that require consideration when using software development languages to specify custom hardware design is found in Section 3. Section 4 contains a statement of the problem to be investigated. Section 5 provides an outline of the proposed solution that will result from this research. 2. Background This section outlines some of the research and existing tools for co-specification, parallel programming and both MPSoC and FPGA devices that are related to the research to be performed.
33
2.1. Co-design and Co-specification Hardware/software co-design is the process of designing the hardware and software partitions of a system concurrently through the use of combined hardware and software engineering techniques [1]. The major advantage of co-design is that it requires the hardware and software design teams to work together throughout a project. This teamwork improves the chances of successfully completing the project. A major issue faced by teams using co-design techniques is the choice of development language. The software part of the team use software development languages such as C [2, 3] or C++ [4], while the hardware designers use hardware description languages such as VHDL [5, 6] or Verilog [7]. In an effort to get the two groups of developers to use a common language, researchers created a number of languages derived from C and C++, such as SpecC [8,9] and SystemC [10,11]. While the use of a common software language improves the ability of the development team to work as a coherent group, it introduces a new set of problems as described in Section 3. As well as software development languages, some hardware description languages have been used for co-designed systems. Two of these are SystemVerilog, an extension of Verilog [12,13], and Handel-C, a hardware specific variant of the C programming language [3, 14]. The choice of a hardware description language as a co-design language eliminates the issues described in Section 3 as these languages contain all the necessary support for the hardware partition of the design. However, the design of the software partition becomes limited by the available programming features of the chosen language. 2.2. Parallel Languages and Tool Sets Software programming languages have been developed that directly support parallel programming. Examples of languages include Occam, Ada, and Message Passing Interface (MPI) [15{19]. OpenMP is another popular parallel programming tool [19, 20]. It is an open standard specifically aimed at the creation of parallel programs for use on shared memory, multi-processor systems. The standard includes provisions for the use of the C, C++ and FORTRAN programming languages [2{4, 21]. Implementations of OpenMP consist of two parts; a small library of utility functions, and a set of compiler directives (e.g. the C #pragma directive) for use with compilers that support OpenMP. OpenMP programs do not require the programmer to explicitly define parallel operations; instead, the programmer simply marks the areas that are to be executed in parallel with the appropriate compiler directives and the compiler generates the proper code for that section of the program. Options can be specified for directives to provide limited control of the generated code when necessary. OpenMP has been used in the development of hardware and embedded software systems (see Section 2.4). 2.3. FPGA and MPSoC Devices Two custom hardware technologies are suitable for implementing systems designed with the proposed methodology. These are the Field Programmable Gate Array (FPGA) [22] and Multi-Processor System-on-Chip (MPSoC) [23, 24] devices. The FPGA is a general purpose logic device that contains many small logic blocks that can be reconfigured as necessary. This allows the device to be used for different tasks by simply reconfiguring the interconnections between the logic blocks [22]. These are highly flexible devices that are used for both design prototyping and production systems. FPGA logic blocks
34
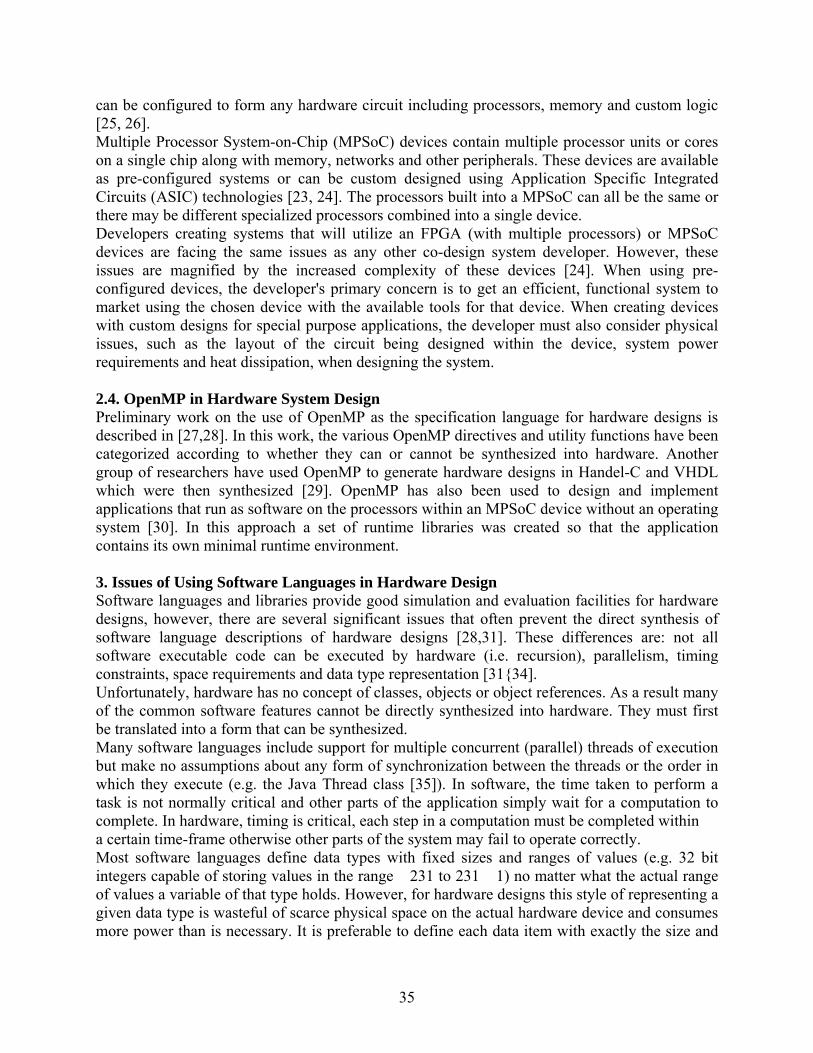
can be configured to form any hardware circuit including processors, memory and custom logic [25, 26]. Multiple Processor System-on-Chip (MPSoC) devices contain multiple processor units or cores on a single chip along with memory, networks and other peripherals. These devices are available as pre-configured systems or can be custom designed using Application Specific Integrated Circuits (ASIC) technologies [23, 24]. The processors built into a MPSoC can all be the same or there may be different specialized processors combined into a single device. Developers creating systems that will utilize an FPGA (with multiple processors) or MPSoC devices are facing the same issues as any other co-design system developer. However, these issues are magnified by the increased complexity of these devices [24]. When using pre-configured devices, the developer's primary concern is to get an efficient, functional system to market using the chosen device with the available tools for that device. When creating devices with custom designs for special purpose applications, the developer must also consider physical issues, such as the layout of the circuit being designed within the device, system power requirements and heat dissipation, when designing the system. 2.4. OpenMP in Hardware System Design Preliminary work on the use of OpenMP as the specification language for hardware designs is described in [27,28]. In this work, the various OpenMP directives and utility functions have been categorized according to whether they can or cannot be synthesized into hardware. Another group of researchers have used OpenMP to generate hardware designs in Handel-C and VHDL which were then synthesized [29]. OpenMP has also been used to design and implement applications that run as software on the processors within an MPSoC device without an operating system [30]. In this approach a set of runtime libraries was created so that the application contains its own minimal runtime environment. 3. Issues of Using Software Languages in Hardware Design Software languages and libraries provide good simulation and evaluation facilities for hardware designs, however, there are several significant issues that often prevent the direct synthesis of software language descriptions of hardware designs [28,31]. These differences are: not all software executable code can be executed by hardware (i.e. recursion), parallelism, timing constraints, space requirements and data type representation [31{34]. Unfortunately, hardware has no concept of classes, objects or object references. As a result many of the common software features cannot be directly synthesized into hardware. They must first be translated into a form that can be synthesized. Many software languages include support for multiple concurrent (parallel) threads of execution but make no assumptions about any form of synchronization between the threads or the order in which they execute (e.g. the Java Thread class [35]). In software, the time taken to perform a task is not normally critical and other parts of the application simply wait for a computation to complete. In hardware, timing is critical, each step in a computation must be completed within a certain time-frame otherwise other parts of the system may fail to operate correctly. Most software languages define data types with fixed sizes and ranges of values (e.g. 32 bit integers capable of storing values in the range �231 to 231 �1) no matter what the actual range of values a variable of that type holds. However, for hardware designs this style of representing a given data type is wasteful of scarce physical space on the actual hardware device and consumes more power than is necessary. It is preferable to define each data item with exactly the size and
35
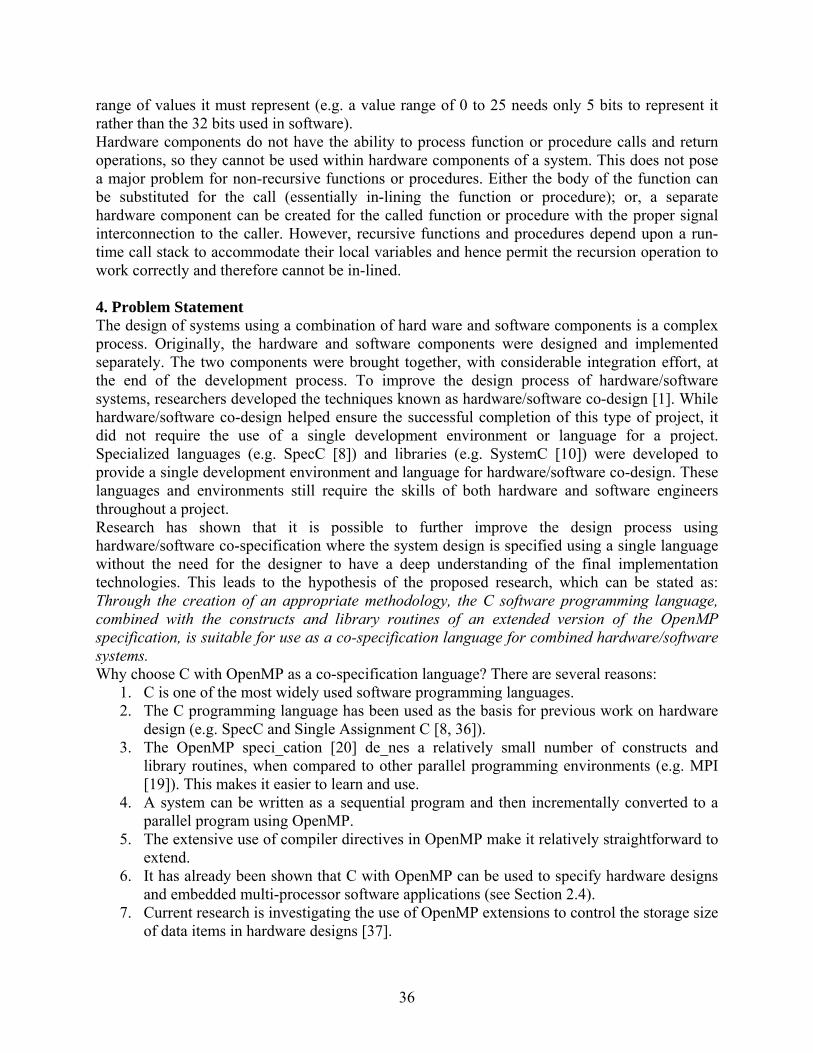
range of values it must represent (e.g. a value range of 0 to 25 needs only 5 bits to represent it rather than the 32 bits used in software). Hardware components do not have the ability to process function or procedure calls and return operations, so they cannot be used within hardware components of a system. This does not pose a major problem for non-recursive functions or procedures. Either the body of the function can be substituted for the call (essentially in-lining the function or procedure); or, a separate hardware component can be created for the called function or procedure with the proper signal interconnection to the caller. However, recursive functions and procedures depend upon a run-time call stack to accommodate their local variables and hence permit the recursion operation to work correctly and therefore cannot be in-lined. 4. Problem Statement The design of systems using a combination of hard ware and software components is a complex process. Originally, the hardware and software components were designed and implemented separately. The two components were brought together, with considerable integration effort, at the end of the development process. To improve the design process of hardware/software systems, researchers developed the techniques known as hardware/software co-design [1]. While hardware/software co-design helped ensure the successful completion of this type of project, it did not require the use of a single development environment or language for a project. Specialized languages (e.g. SpecC [8]) and libraries (e.g. SystemC [10]) were developed to provide a single development environment and language for hardware/software co-design. These languages and environments still require the skills of both hardware and software engineers throughout a project. Research has shown that it is possible to further improve the design process using hardware/software co-specification where the system design is specified using a single language without the need for the designer to have a deep understanding of the final implementation technologies. This leads to the hypothesis of the proposed research, which can be stated as: Through the creation of an appropriate methodology, the C software programming language, combined with the constructs and library routines of an extended version of the OpenMP specification, is suitable for use as a co-specification language for combined hardware/software systems. Why choose C with OpenMP as a co-specification language? There are several reasons:
1. C is one of the most widely used software programming languages. 2. The C programming language has been used as the basis for previous work on hardware
design (e.g. SpecC and Single Assignment C [8, 36]). 3. The OpenMP speci_cation [20] de_nes a relatively small number of constructs and
library routines, when compared to other parallel programming environments (e.g. MPI [19]). This makes it easier to learn and use.
4. A system can be written as a sequential program and then incrementally converted to a parallel program using OpenMP.
5. The extensive use of compiler directives in OpenMP make it relatively straightforward to extend.
6. It has already been shown that C with OpenMP can be used to specify hardware designs and embedded multi-processor software applications (see Section 2.4).
7. Current research is investigating the use of OpenMP extensions to control the storage size of data items in hardware designs [37].
36
5. Proposed Solution Figure 1 shows a Waterfall model of the full hardware/software co-specification process [38]. The first three stages in the model (Requirements Analysis, Application Design and Software-only Implementation) are the same as in any software engineering project (see [38, 39]) and are outside the scope of this research. The fourth stage (Software-only Parallelization) primarily uses standard parallelization techniques (see [19, 40, 41]), however, refinements to the output of this stage may be necessary as work proceeds in the following stage so it is included within the scope of this research where appropriate. The fifth stage of the model (HW/SW Partitioning) is the core of the research to be performed and is described in detail in Section 5.1. The final two stages in the model (SW Compilation & HW Synthesis, and Embedded Integration) are also outside the scope of this research. 5.1. Methodology The co-specification methodology is an iterative one. It accepts a functionally correct C/OpenMP implementation of the system as its input and outputs a fully partitioned co-specification in C and the extended version of OpenMP. The methodology is outlined in Figure 2, and it is explained through a simple matrix multiplication example. The methodology accepts the source code of a functionally correct C program with OpenMP parallelization as its input. The program is then analyzed to extract profiling information such as the value ranges of its data items, the number of read and write operations for each data item and the number of times each function in the program is called along with the parameter and return value information for the calls. For example, consider the simple matrix multiplication program in Figure 3. An analysis of the example in Figure 3 shows that there are two functions used, main and m_mult. Function main is the software entry point. In this instance it takes no parameters and returns an integer (default 0). The function m_mult is called only once and takes three integers as parameters. The invocation of function m_mult within function main has a value of constant 3 for each of its parameters. Table 1(a) shows the function analysis results for the program in Figure 3. For this simple example, visually inspecting the source code is sufficient for function call analysis, but in systems of even minor complexity, analysis tools become necessary. See Section 5.2 for information on a proposed function call analysis tool suitable for use with this methodology. Table 1(b) shows analysis results for the data items used in the matrix multiplication program. As with the function call analysis, visual inspection of the source code is sufficient to obtain all of the analysis information except the maximum values for the elements of array c. Visual inspection is not suitable in any but the simplest of programs so a tool will be created as part of this research to gather the data and assist with its analysis as described in Section 5.2. Having completed the analysis of the co-specification, it is now time to begin breaking the system into its hardware and software partitions. First, the invocation of the function main is considered for hardware implementation; however, as this is the software entry point it cannot be moved into hardware. An examination of the invocation and body of function m_mult reveals that it can be moved into the hardware partition either entirely or in part. The entire function can be moved to hardware since all of the operations performed within the function body can be directly supported in hardware. Figure 4 shows the source code for the example system after
37
moving the entire m_mult function to the hardware partition. The declaration of the m_mult function is preceded by the 'hw component' directive indicating that the
Figure 2. A high-level overview of the hardware/software co-specification methodology.
Figure 1. Waterfall model showing the entire hardware/software co-specification process.
38
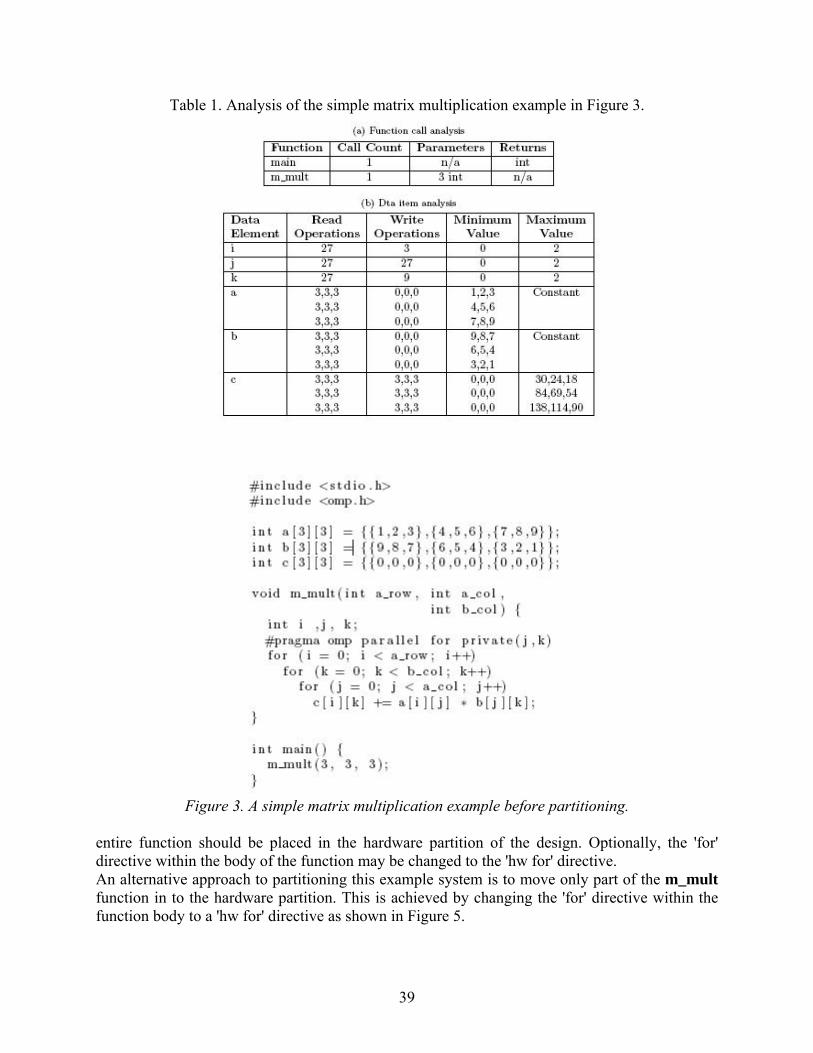
Table 1. Analysis of the simple matrix multiplication example in Figure 3.
Figure 3. A simple matrix multiplication example before partitioning.
entire function should be placed in the hardware partition of the design. Optionally, the 'for' directive within the body of the function may be changed to the 'hw for' directive. An alternative approach to partitioning this example system is to move only part of the m_mult function in to the hardware partition. This is achieved by changing the 'for' directive within the function body to a 'hw for' directive as shown in Figure 5.
39
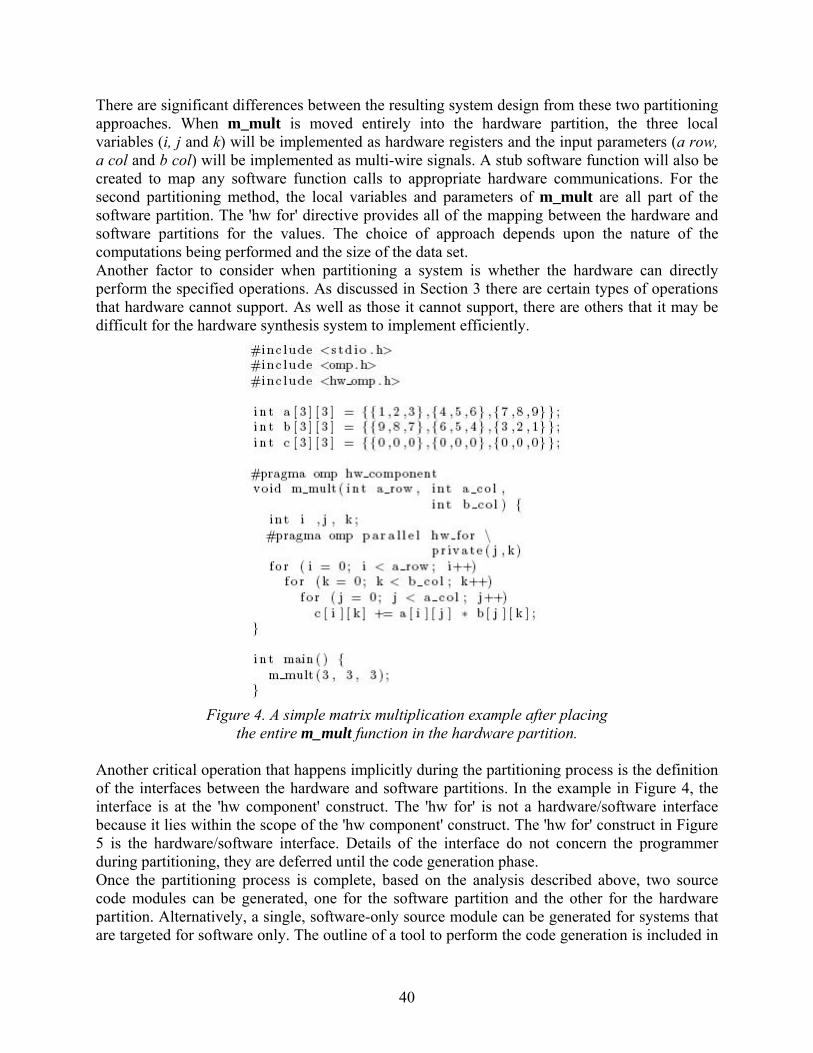
There are significant differences between the resulting system design from these two partitioning approaches. When m_mult is moved entirely into the hardware partition, the three local variables (i, j and k) will be implemented as hardware registers and the input parameters (a row, a col and b col) will be implemented as multi-wire signals. A stub software function will also be created to map any software function calls to appropriate hardware communications. For the second partitioning method, the local variables and parameters of m_mult are all part of the software partition. The 'hw for' directive provides all of the mapping between the hardware and software partitions for the values. The choice of approach depends upon the nature of the computations being performed and the size of the data set. Another factor to consider when partitioning a system is whether the hardware can directly perform the specified operations. As discussed in Section 3 there are certain types of operations that hardware cannot support. As well as those it cannot support, there are others that it may be difficult for the hardware synthesis system to implement efficiently.
Figure 4. A simple matrix multiplication example after placing
the entire m_mult function in the hardware partition. Another critical operation that happens implicitly during the partitioning process is the definition of the interfaces between the hardware and software partitions. In the example in Figure 4, the interface is at the 'hw component' construct. The 'hw for' is not a hardware/software interface because it lies within the scope of the 'hw component' construct. The 'hw for' construct in Figure 5 is the hardware/software interface. Details of the interface do not concern the programmer during partitioning, they are deferred until the code generation phase. Once the partitioning process is complete, based on the analysis described above, two source code modules can be generated, one for the software partition and the other for the hardware partition. Alternatively, a single, software-only source module can be generated for systems that are targeted for software only. The outline of a tool to perform the code generation is included in
40
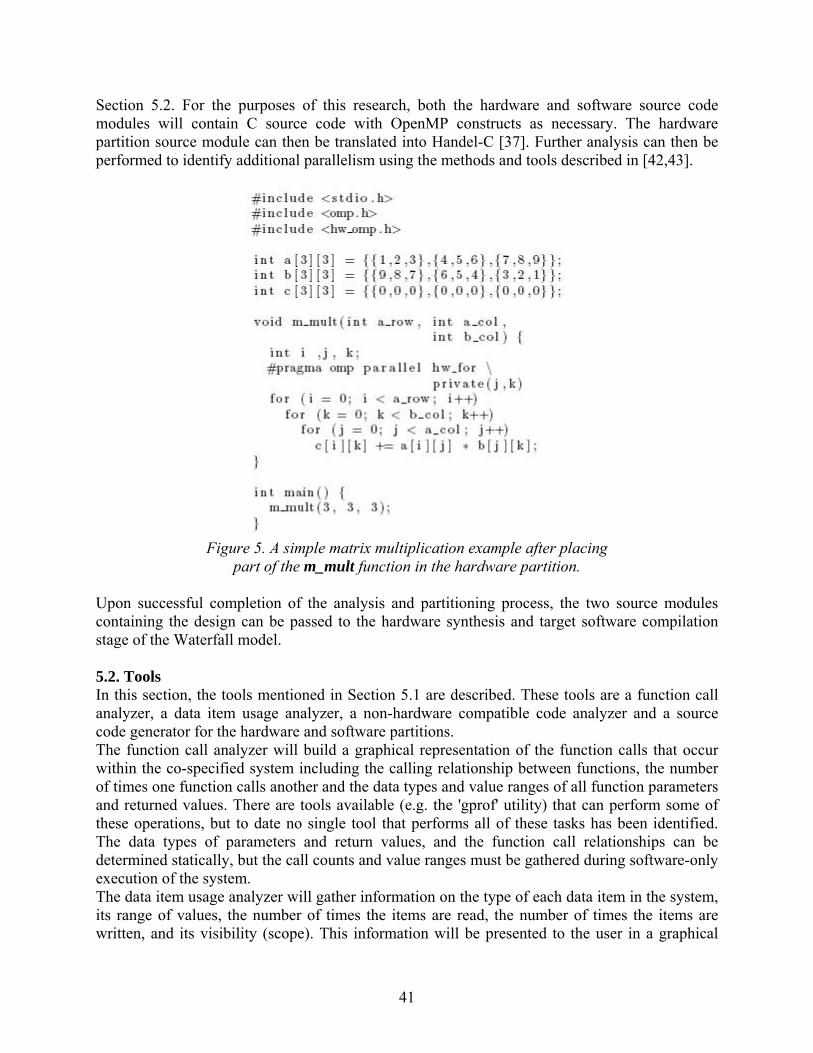
Section 5.2. For the purposes of this research, both the hardware and software source code modules will contain C source code with OpenMP constructs as necessary. The hardware partition source module can then be translated into Handel-C [37]. Further analysis can then be performed to identify additional parallelism using the methods and tools described in [42,43].
Figure 5. A simple matrix multiplication example after placing
part of the m_mult function in the hardware partition. Upon successful completion of the analysis and partitioning process, the two source modules containing the design can be passed to the hardware synthesis and target software compilation stage of the Waterfall model. 5.2. Tools In this section, the tools mentioned in Section 5.1 are described. These tools are a function call analyzer, a data item usage analyzer, a non-hardware compatible code analyzer and a source code generator for the hardware and software partitions. The function call analyzer will build a graphical representation of the function calls that occur within the co-specified system including the calling relationship between functions, the number of times one function calls another and the data types and value ranges of all function parameters and returned values. There are tools available (e.g. the 'gprof' utility) that can perform some of these operations, but to date no single tool that performs all of these tasks has been identified. The data types of parameters and return values, and the function call relationships can be determined statically, but the call counts and value ranges must be gathered during software-only execution of the system. The data item usage analyzer will gather information on the type of each data item in the system, its range of values, the number of times the items are read, the number of times the items are written, and its visibility (scope). This information will be presented to the user in a graphical
41
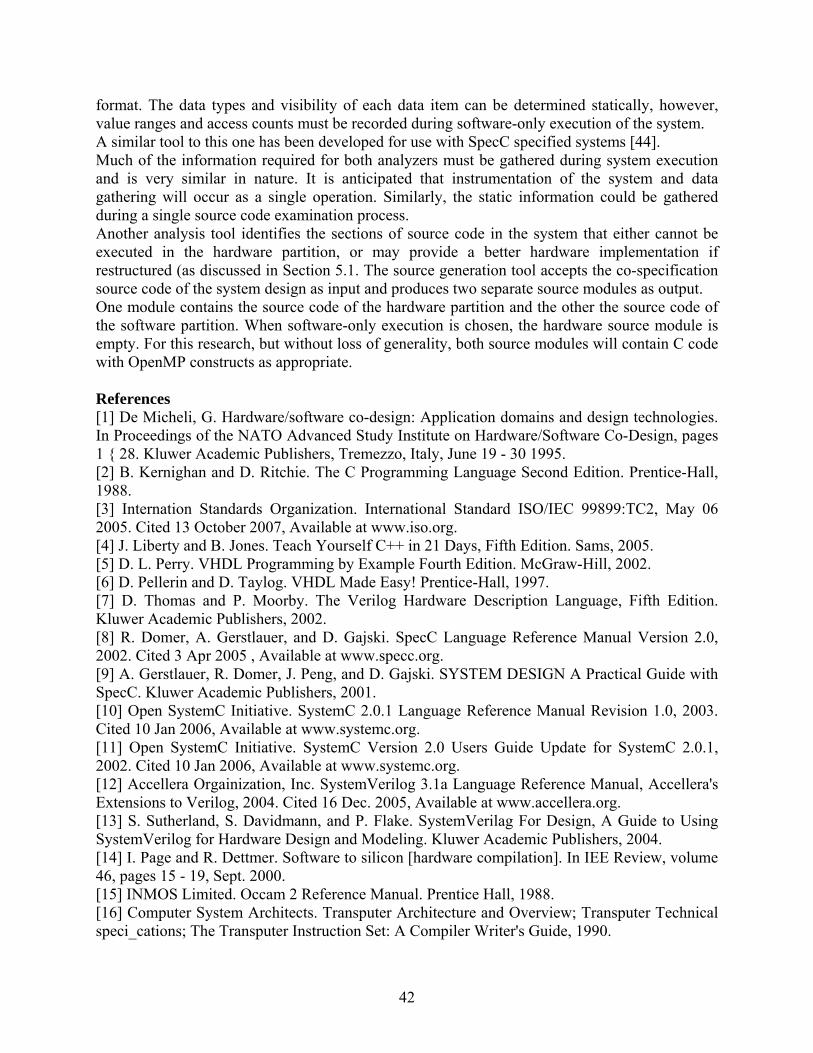
format. The data types and visibility of each data item can be determined statically, however, value ranges and access counts must be recorded during software-only execution of the system. A similar tool to this one has been developed for use with SpecC specified systems [44]. Much of the information required for both analyzers must be gathered during system execution and is very similar in nature. It is anticipated that instrumentation of the system and data gathering will occur as a single operation. Similarly, the static information could be gathered during a single source code examination process. Another analysis tool identifies the sections of source code in the system that either cannot be executed in the hardware partition, or may provide a better hardware implementation if restructured (as discussed in Section 5.1. The source generation tool accepts the co-specification source code of the system design as input and produces two separate source modules as output. One module contains the source code of the hardware partition and the other the source code of the software partition. When software-only execution is chosen, the hardware source module is empty. For this research, but without loss of generality, both source modules will contain C code with OpenMP constructs as appropriate. References [1] De Micheli, G. Hardware/software co-design: Application domains and design technologies. In Proceedings of the NATO Advanced Study Institute on Hardware/Software Co-Design, pages 1 { 28. Kluwer Academic Publishers, Tremezzo, Italy, June 19 - 30 1995. [2] B. Kernighan and D. Ritchie. The C Programming Language Second Edition. Prentice-Hall, 1988. [3] Internation Standards Organization. International Standard ISO/IEC 99899:TC2, May 06 2005. Cited 13 October 2007, Available at www.iso.org. [4] J. Liberty and B. Jones. Teach Yourself C++ in 21 Days, Fifth Edition. Sams, 2005. [5] D. L. Perry. VHDL Programming by Example Fourth Edition. McGraw-Hill, 2002. [6] D. Pellerin and D. Taylog. VHDL Made Easy! Prentice-Hall, 1997. [7] D. Thomas and P. Moorby. The Verilog Hardware Description Language, Fifth Edition. Kluwer Academic Publishers, 2002. [8] R. Domer, A. Gerstlauer, and D. Gajski. SpecC Language Reference Manual Version 2.0, 2002. Cited 3 Apr 2005 , Available at www.specc.org. [9] A. Gerstlauer, R. Domer, J. Peng, and D. Gajski. SYSTEM DESIGN A Practical Guide with SpecC. Kluwer Academic Publishers, 2001. [10] Open SystemC Initiative. SystemC 2.0.1 Language Reference Manual Revision 1.0, 2003. Cited 10 Jan 2006, Available at www.systemc.org. [11] Open SystemC Initiative. SystemC Version 2.0 Users Guide Update for SystemC 2.0.1, 2002. Cited 10 Jan 2006, Available at www.systemc.org. [12] Accellera Orgainization, Inc. SystemVerilog 3.1a Language Reference Manual, Accellera's Extensions to Verilog, 2004. Cited 16 Dec. 2005, Available at www.accellera.org. [13] S. Sutherland, S. Davidmann, and P. Flake. SystemVerilag For Design, A Guide to Using SystemVerilog for Hardware Design and Modeling. Kluwer Academic Publishers, 2004. [14] I. Page and R. Dettmer. Software to silicon [hardware compilation]. In IEE Review, volume 46, pages 15 - 19, Sept. 2000. [15] INMOS Limited. Occam 2 Reference Manual. Prentice Hall, 1988. [16] Computer System Architects. Transputer Architecture and Overview; Transputer Technical speci_cations; The Transputer Instruction Set: A Compiler Writer's Guide, 1990.
42
[17] T. Elbert. Embedded Programming in Ada. Van Nostrand Reinhold Company, 1986. [18] U. S. D. of Defense. Reference Manual for the Ada Programming Language, ANSI/MIL-STD-1815A- 1983, 1983. [19] M. M. Quinn. Parallel Programming in C with MPI and OpenMP. McGraw-Hill Higher Education, 2004. [20] OpenMP Architecture Review Board. OpenMP Application Program Interface Version 2.5, May 2005. available at www.openmp.org. [21] J. M. Ortega. An Introduction to Fortran 90 for Scientific Computing. Saunders College Publishing, 1994. [22] Y. Behz, J. Rose, and A. Marquardt. Architecture and CAD for Deep-Submicron FPGAs. Kluwer Academic Publishers, 1999. [23] A. Alimonda, S. Carta, A. Acquaviva, and A. Pisano. Non-linear feedback control for energy e_cient on-chip streaming computation. In International Symposium on Industrial Embedded Systems, 2006. IES '06, Oct. 2006. [24] G. Martin. Overview of the mpsoc design challenge. In Proceedings of the 43rd annual conference on Design automation, pages 274-279, 2006. [25] X. Inc. Virtex-5 family overview lx, lxt, and sxt platforms, ds100 (v3.1), May 23 2007. Cited 19 June 2007, available at www.xilinx.com. [26] Altera Corporation. Nios Development Board, Cycle II Deition Reference Manual, 2005. distributed in electronic form with the DE2 development board. [27] P. Dziurzanski, W. Bielecki, K. Trifunovic, and M. Kleszczonek. A system for transforming an ansi c code with openmp directives into a systemc description. In Design and Diagnostics of Electronic Circuits and systems, 2006 IEEE, pages 151-152, 2006. [28] P. Dziurzanski and V. Beletskyy. Defining synthesizable openmp directives and clauses. Lecture Notes in Computer Science, Workshop onOpenMP for Large Scale Applications, 3038/2004:398-407, 2004. [29] Y. Leow, C. Ng, and W. Wong. Generating hardware from openmp programs. In IEEE International Conference on Field Programmable Technology, 2006, pages 73 - 80, Dec. 2006. [30] W. Jeun and S. Ha. E_ective openmp implementation and translation for multiprocessor system-on-chip without using os. In Asia and South Pacific Design Automation Conference, 2007. ASP-DAC '07, pages 44 - 49, Jan. 2007. [31] S. Edwards. The challenges of hardware synthesis from c-like languages. In Proceedings, Design, Automation and Test in Europe, 2005, volume 1, pages 66-67, 2005. [32] S. Antoniazzi, A. Balboni, W. Fornaciari, and D. Sciuto. Hw/sw codesign for embedded telecom systems. In Proceedings., IEEE International Conference on Computer Design: VLSI in Computers and Processors, 1994, pages 278 - 281, Oct. 10-12 1994. [33] S. Antoniazzi, A. Balboni, W. Fornaciari, and D. Sciuto. A methodology for control-dominated systems co-design. In Proceedings of the Third International Workshop on Hardware/Software Codesign, 1994, pages 2 - 9, Sept. 22-24 1994. [34] W. Ecker. Using vhdl for hw/sw co-speci_cation. In Proceedings EURO-DAC '93. European Design Automation Conference, 1993, with EURO-VHDL '93, pages 500 - 505, Sept. 20-24 1993. [35] J. Gosling, B. Joy, G. Steele, and G. Bracha. Java Language Specification, Second Edition. Addison-Wesley, 2000.
43
[36] J. Hammes, B. Rinker, W. Bohm, W. Najjar, B. Draper, and R. Beveridge. Cameron: high level language compilation for recon_gurable systems. In Proceedings. 1999 International Conference on Architectures and Compilation Techniques, pages 236-244, Oct. 12 - 16 1999. Cited 15 September 2003, Available at www.ieee.org. [37] T. Beatty. Improving circuit design with an openmp to handel-c translator, 2007. Master of Computer Science Thesis Proposal, University of New Brunswick. [38] I. Somerville. Software Engineering, seventh Edition. Addison-Wesley, 2004. [39] R. Pressman. Software Engineering, A Practitioner's Approach, Third Edition. McGraw-Hill, 1992. [40] G. S. Almasi and A. Gottlieb. Highly Parallel Computing, Second Edition. The Benjamin/Cummings Publishing Company Inc., 1994. [41] N. Carriero and D. Gelernter. How to Write Parallel Programs, A First Course. The MIT Press, 1990. [42] J. C. Libby, F. Gharibian, and K. B. Kent. Automatic identification of parallelism in handel-c, 2008. submitted to 2008 Euromicro Digital System Design Symposium. [43] F. Gharibian. High level resource estimation for maximizing circuit performance, 2007. Master of Computer Science Thesis Proposal, University of New Brunswick. [44] L. Cai, A. Gerstlauer, and D. Gajski. Retargetable profiling for rapid, early system-level design space exploration. In Proceedings of the 41st annual conference on Design automation, pages 281 - 286, 2004.
44
Service Oriented Framework for Geographical Information System Jingguang Li Sai Ma
1 Web Processing Service (WPS) 1.1 WPS overview WPS is a technology created by the Open Geospatial Consortium (OGC). The OGC is an international voluntary consensus standards organization. More than 330 commercial, governmental, non-profit, and research organizations worldwide collaborate in an open consensus process working on the standards for geospatial content and services, GIS data processing and exchange. The most important OGC specifications include the OGC Reference Model, the Web Map Service (WMS), the Web Feature Service (WFS), the Web Coverage Service (WCS), the Web Processing Service (WPS), the Web Catalog Service (CAT), the Simple Features (SFS), and the Geography Markup Language (GML). “WPS is a web service that provides client access to pre-programmed calculations and/or computation models that operate on spatially referenced data” [1]. The data used for service computation may come from other servers. WPS supports machine to machine interaction over a network. The WPS output data may be in image data formats or in data exchange standards, such as gif, jpeg, GML, and the Geolinked Data Access Service (GDAS). The WPS server implements HTTP GET transfer of operations’ requests, using KVP encoding. The WPS server also implements the HTTP POST transfer of operation response. Both inputs and outputs can be web accessible. WPS version 0.4.0 was released as an OGC Request for Public Comment in 2005. Version 1.0.0 was approved as an official OGC specification in August, 2007. 1.2 WPS Operations WPS specifies three operations: GetCapabilities, DescribeProcess, and Execute. GetCapabilities: GetCapabilities returns service-level metadata. The response to a GetCapabilities request shall be an XML document containing service metadata about the server. The metadata content includes basic information about the service, such as service title, service type, and service version. It also contains keywords, access constraints, operation name, the service access URL of each operation, and basic information about each process.
45
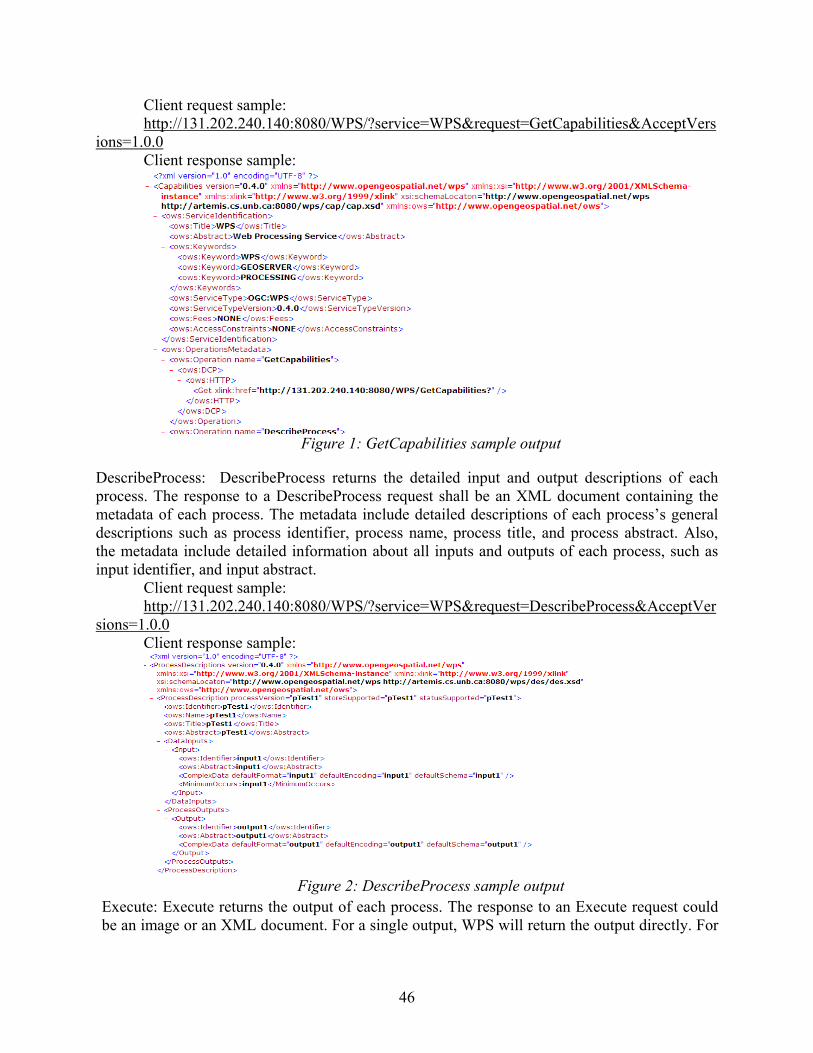
Client request sample: http://131.202.240.140:8080/WPS/?service=WPS&request=GetCapabilities&AcceptVers
ions=1.0.0Client response sample:
Figure 1: GetCapabilities sample output
DescribeProcess: DescribeProcess returns the detailed input and output descriptions of each process. The response to a DescribeProcess request shall be an XML document containing the metadata of each process. The metadata include detailed descriptions of each process’s general descriptions such as process identifier, process name, process title, and process abstract. Also, the metadata include detailed information about all inputs and outputs of each process, such as input identifier, and input abstract.
Client request sample: http://131.202.240.140:8080/WPS/?service=WPS&request=DescribeProcess&AcceptVer
sions=1.0.0Client response sample:
Figure 2: DescribeProcess sample output
Execute: Execute returns the output of each process. The response to an Execute request could be an image or an XML document. For a single output, WPS will return the output directly. For
46
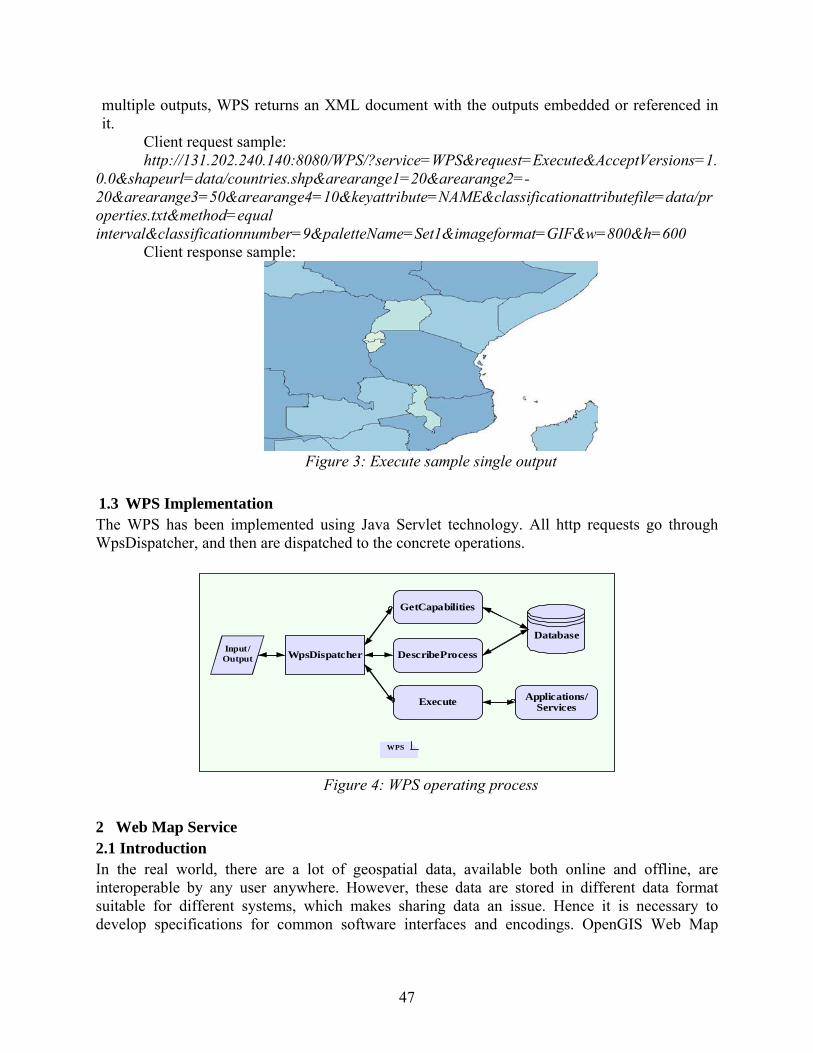
multiple outputs, WPS returns an XML document with the outputs embedded or referenced in it.
Client request sample: http://131.202.240.140:8080/WPS/?service=WPS&request=Execute&AcceptVersions=1.
0.0&shapeurl=data/countries.shp&arearange1=20&arearange2=-20&arearange3=50&arearange4=10&keyattribute=NAME&classificationattributefile=data/properties.txt&method=equal interval&classificationnumber=9&paletteName=Set1&imageformat=GIF&w=800&h=600
Client response sample:
Figure 3: Execute sample single output
1.3 WPS Implementation The WPS has been implemented using Java Servlet technology. All http requests go through WpsDispatcher, and then are dispatched to the concrete operations.
WpsDispatcher
GetCapabilities
Execute
DescribeProcess
Database
Applications/Services
Input/Output
WPS
Figure 4: WPS operating process
2 Web Map Service 2.1 Introduction In the real world, there are a lot of geospatial data, available both online and offline, are interoperable by any user anywhere. However, these data are stored in different data format suitable for different systems, which makes sharing data an issue. Hence it is necessary to develop specifications for common software interfaces and encodings. OpenGIS Web Map
47
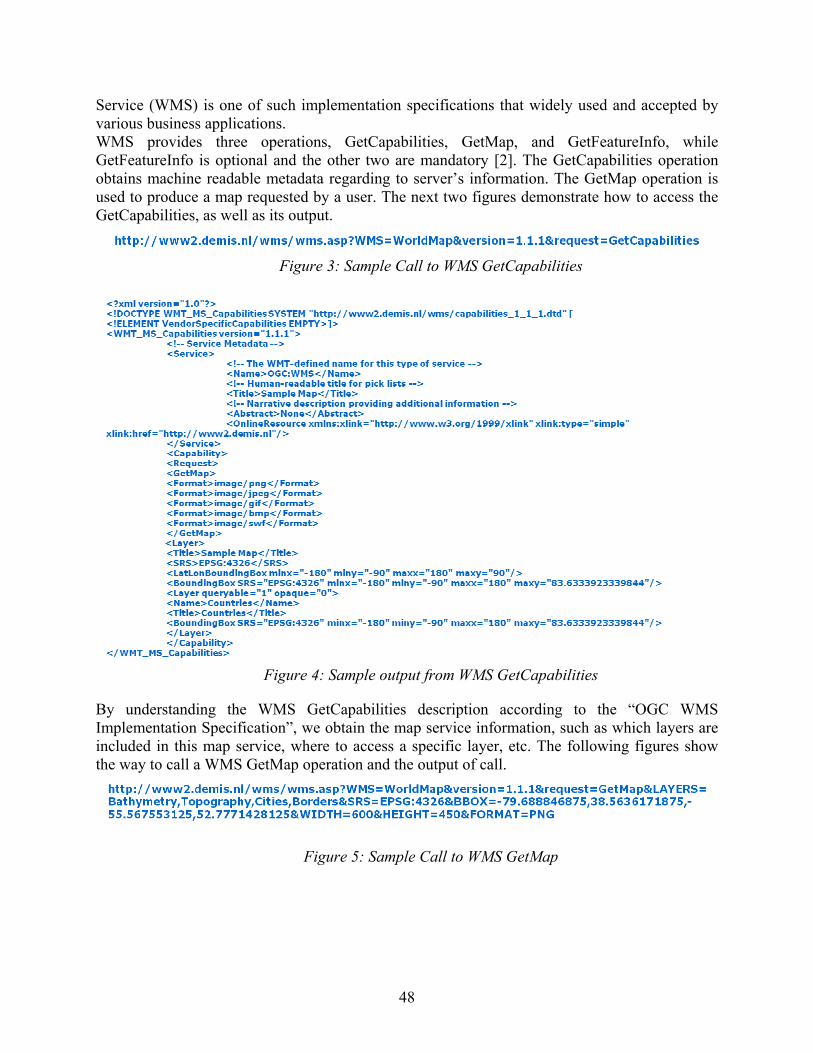
Service (WMS) is one of such implementation specifications that widely used and accepted by various business applications. WMS provides three operations, GetCapabilities, GetMap, and GetFeatureInfo, while GetFeatureInfo is optional and the other two are mandatory [2]. The GetCapabilities operation obtains machine readable metadata regarding to server’s information. The GetMap operation is used to produce a map requested by a user. The next two figures demonstrate how to access the GetCapabilities, as well as its output.
Figure 3: Sample Call to WMS GetCapabilities
Figure 4: Sample output from WMS GetCapabilities
By understanding the WMS GetCapabilities description according to the “OGC WMS Implementation Specification”, we obtain the map service information, such as which layers are included in this map service, where to access a specific layer, etc. The following figures show the way to call a WMS GetMap operation and the output of call.
Figure 5: Sample Call to WMS GetMap
48
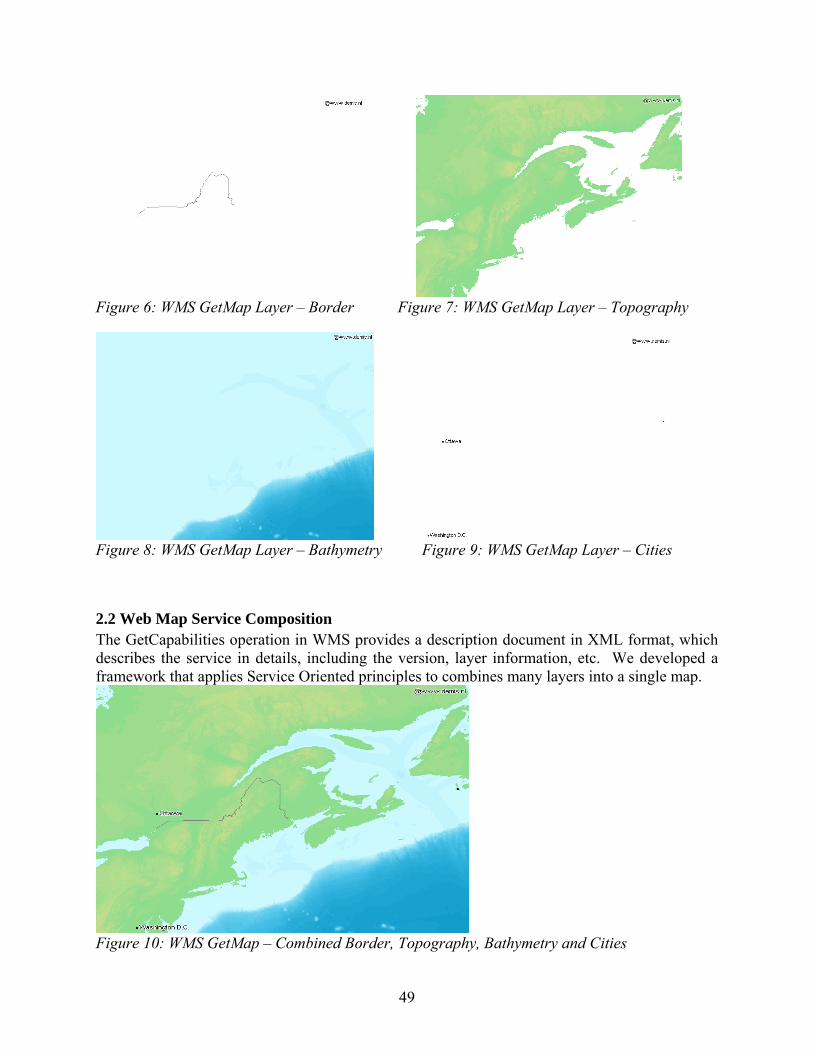
Figure 6: WMS GetMap Layer – Border Figure 7: WMS GetMap Layer – Topography
Figure 8: WMS GetMap Layer – Bathymetry Figure 9: WMS GetMap Layer – Cities
2.2 Web Map Service Composition The GetCapabilities operation in WMS provides a description document in XML format, which describes the service in details, including the version, layer information, etc. We developed a framework that applies Service Oriented principles to combines many layers into a single map.
Figure 10: WMS GetMap – Combined Border, Topography, Bathymetry and Cities
49
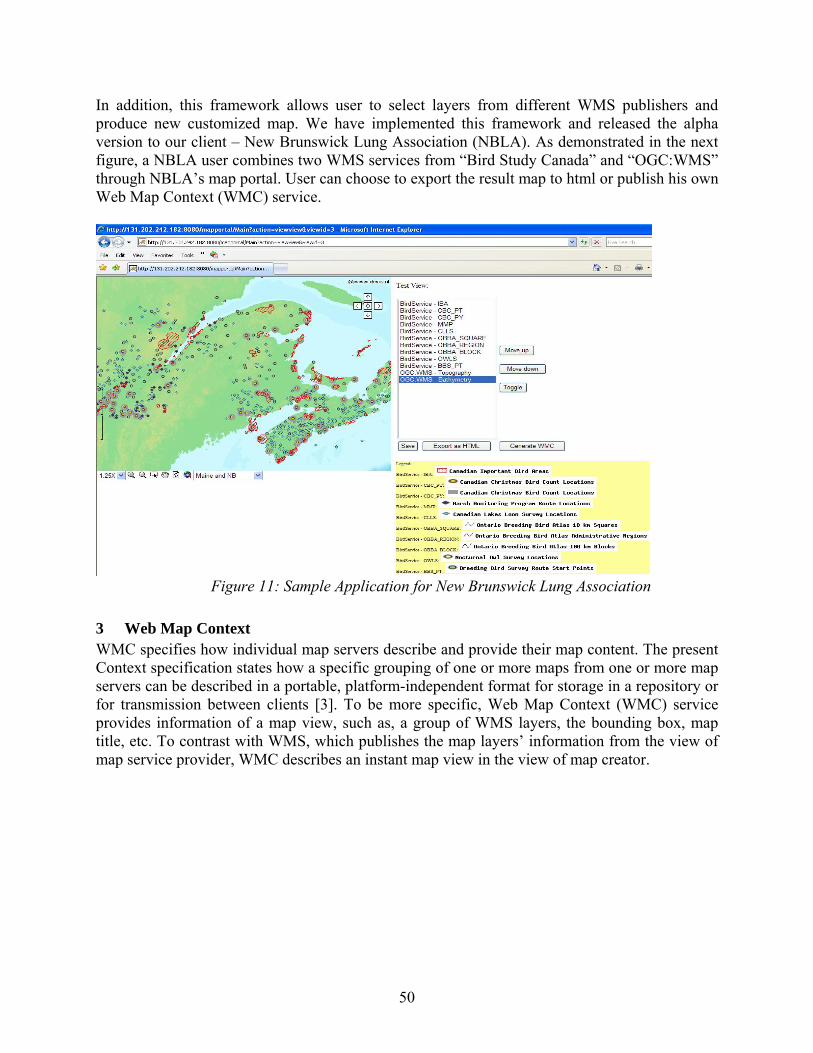
In addition, this framework allows user to select layers from different WMS publishers and produce new customized map. We have implemented this framework and released the alpha version to our client – New Brunswick Lung Association (NBLA). As demonstrated in the next figure, a NBLA user combines two WMS services from “Bird Study Canada” and “OGC:WMS” through NBLA’s map portal. User can choose to export the result map to html or publish his own Web Map Context (WMC) service.
Figure 11: Sample Application for New Brunswick Lung Association
3 Web Map Context WMC specifies how individual map servers describe and provide their map content. The present Context specification states how a specific grouping of one or more maps from one or more map servers can be described in a portable, platform-independent format for storage in a repository or for transmission between clients [3]. To be more specific, Web Map Context (WMC) service provides information of a map view, such as, a group of WMS layers, the bounding box, map title, etc. To contrast with WMS, which publishes the map layers’ information from the view of map service provider, WMC describes an instant map view in the view of map creator.
50
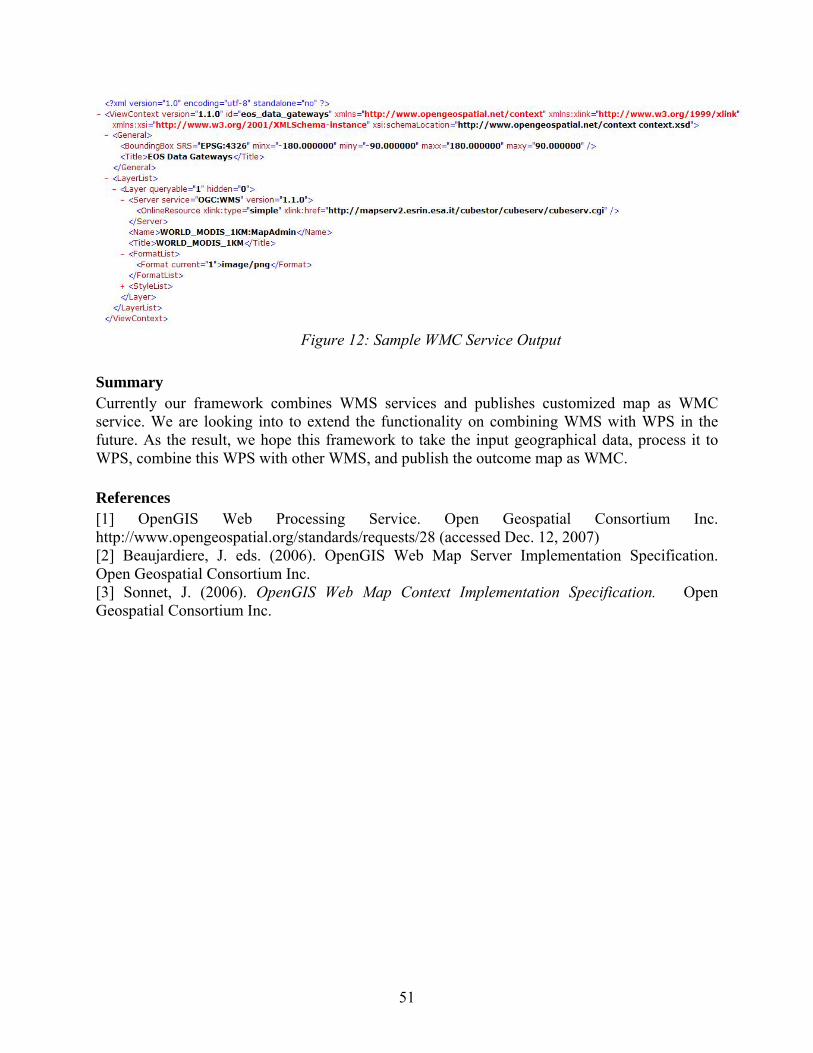
Figure 12: Sample WMC Service Output
Summary Currently our framework combines WMS services and publishes customized map as WMC service. We are looking into to extend the functionality on combining WMS with WPS in the future. As the result, we hope this framework to take the input geographical data, process it to WPS, combine this WPS with other WMS, and publish the outcome map as WMC. References [1] OpenGIS Web Processing Service. Open Geospatial Consortium Inc. http://www.opengeospatial.org/standards/requests/28 (accessed Dec. 12, 2007) [2] Beaujardiere, J. eds. (2006). OpenGIS Web Map Server Implementation Specification. Open Geospatial Consortium Inc. [3] Sonnet, J. (2006). OpenGIS Web Map Context Implementation Specification. Open Geospatial Consortium Inc.
51
Automatic Identification of Concurrency in Handel-C Joseph C. Libby, Farnaz Gharibian, and Kenneth B. Kent
Abstract High level hardware design languages are making it possible for people with little background in hardware design to begin creating their own custom hardware. This allows software designers to begin looking beyond general purpose computing into the realm of customized hardware environments in order to increase the performance of their applications. The ease with which hardware can be developed using hardware description languages does not come without a cost. Developers accustomed to working in software environments may have issues dealing with some of the more complex facets of hardware design, such as exploiting concurrency. This work aims to alleviate some of the frustration that may occur when attempting to identify and exploit concurrency in a hardware design by providing a set of tools that can automatically identify concurrency in Handel-C hardware designs. The tool will suggest possible changes to the developer that may increase the performance of their design. This allows the designer to maintain total control over their design and over time may lead to more easily identifying concurrency without the use of automated tools. Introduction High level hardware description languages, such as Handel-C, are making it easier for software developers to participate in hardware design. These software developers may have little or no training in formal hardware design which can cause problems when faced with the task of creating optimized hardware systems. One of the more difficult concepts that must be applied to hardware systems is the notion of concurrency. Although development of concurrent computer applications is beginning to come into focus along with the introduction of desktop multi-core processors, many software developers have little or no experience with identifying and exploiting concurrency in their software. This lack of experience in creating concurrent software applications carries over into hardware design, where exploiting concurrency is one of the key methods for increasing the overall performance of the system. In order to ease the transition from sequential software programs to concurrent hardware design, an automated tool capable of identifying blocks of hardware description language, in this case Handel-C, that can be used concurrently. This tool will serve the purpose of helping inexperienced designers improve the performance of their designs as well as provide training that will help designers learn how to exploit concurrency without the aid of automated tools. The tool, however, will not completely automate the task of exploiting concurrency, but will show designers where potential concurrency exists and allow them to make the necessary changes to their design to take advantage of the concurrency. This paper is broken into several sections beginning with a background section. The background section discusses Handel C as well as dependence analysis techniques. The next section discusses the work that was completed for this project, detailing specifics of the operation of the tool that was created. Following this is a discussion of testing and testing results, and finally a section dedicated to the future of this project.
52

Background This section will discuss some of the background material that is required to understand this project. Included is a discussion as to why Handel-C was chosen as the target hardware description language for this project. Handel-C Handel-C [1] is a high level hardware description language that is an intersection of ANSI-C. Handel-C allows software designers to easily convert their algorithms into a hardware implementation and also allows hardware designers the freedom to easily write functional descriptions of hardware systems. While Handel-C implements only a subset of the ANSI-C standard, it also includes a number of hardware specific constructs to ease development of hardware. While Handel-C automates much of the task of designing and implementing functional descriptions of hardware, it does not optimize the functional description of the hardware. This means that the design that is synthesized may contain inefficient code that will not be optimized in order to adhere to the functional description given by the designer. This is especially apparent when Handel-C code that is easily made concurrent by a piece of automated software will not be exploited by the synthesis tools. Handel-C does, however, provide a set of constructs for designers to represent concurrency in their hardware designs. Writing Concurrent Code in Handel-C Handel-C code can be easily made concurrent by using the par{} construct. The par{} construct is an explicit command to the synthesis tools that all program statements within the par{} block may be performed concurrently. The example shows how code can made concurrent using the par{} statement which executes A = A+B and C = C+D concurrently.
int A,B,C,D; A = 1; B = 2; C = 3; D = 4; par { A = A+B; C = C+D; }
Automated Identification of Concurrency The purpose of this work was to implement an application that was capable of analyzing a Handel-C functional hardware specification and producing a report for the user that displays sections of code that potentially concurrent. Work on this project began with a survey of frameworks that might be suitable for such an application. One of the first packages that was surveyed was the Gnu Compiler Collection (GCC) [3]. While the GCC includes many robust and thoroughly tested tools for optimizing software code the amount of customization necessary for this project, coupled with the complexity of the GCC tools would have created a situation where testing would be difficult. Another major hurdle to overcome for this project would be the closed nature of the Handel-C language. While the language specification for Handel-C is readily available, low level technical details such as the language grammar are not available to the public. This created a problem
53
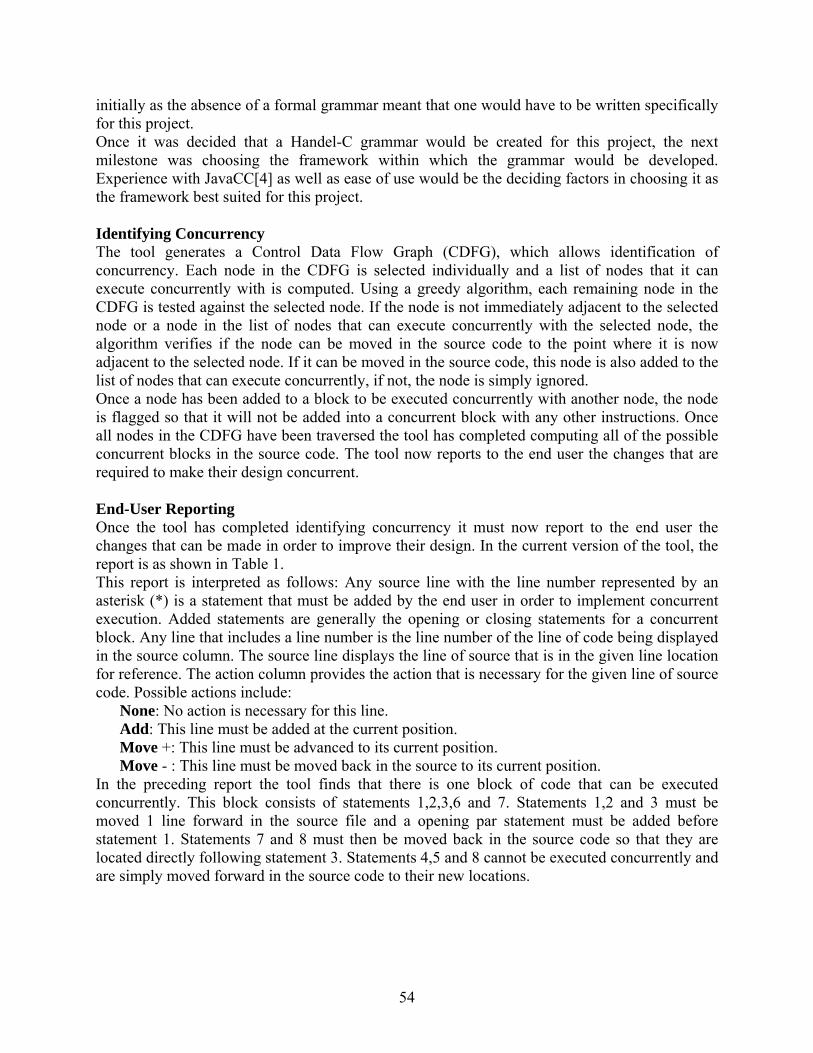
initially as the absence of a formal grammar meant that one would have to be written specifically for this project. Once it was decided that a Handel-C grammar would be created for this project, the next milestone was choosing the framework within which the grammar would be developed. Experience with JavaCC[4] as well as ease of use would be the deciding factors in choosing it as the framework best suited for this project. Identifying Concurrency The tool generates a Control Data Flow Graph (CDFG), which allows identification of concurrency. Each node in the CDFG is selected individually and a list of nodes that it can execute concurrently with is computed. Using a greedy algorithm, each remaining node in the CDFG is tested against the selected node. If the node is not immediately adjacent to the selected node or a node in the list of nodes that can execute concurrently with the selected node, the algorithm verifies if the node can be moved in the source code to the point where it is now adjacent to the selected node. If it can be moved in the source code, this node is also added to the list of nodes that can execute concurrently, if not, the node is simply ignored. Once a node has been added to a block to be executed concurrently with another node, the node is flagged so that it will not be added into a concurrent block with any other instructions. Once all nodes in the CDFG have been traversed the tool has completed computing all of the possible concurrent blocks in the source code. The tool now reports to the end user the changes that are required to make their design concurrent. End-User Reporting Once the tool has completed identifying concurrency it must now report to the end user the changes that can be made in order to improve their design. In the current version of the tool, the report is as shown in Table 1. This report is interpreted as follows: Any source line with the line number represented by an asterisk (*) is a statement that must be added by the end user in order to implement concurrent execution. Added statements are generally the opening or closing statements for a concurrent block. Any line that includes a line number is the line number of the line of code being displayed in the source column. The source line displays the line of source that is in the given line location for reference. The action column provides the action that is necessary for the given line of source code. Possible actions include:
None: No action is necessary for this line. Add: This line must be added at the current position. Move +: This line must be advanced to its current position. Move - : This line must be moved back in the source to its current position.
In the preceding report the tool finds that there is one block of code that can be executed concurrently. This block consists of statements 1,2,3,6 and 7. Statements 1,2 and 3 must be moved 1 line forward in the source file and a opening par statement must be added before statement 1. Statements 7 and 8 must then be moved back in the source code so that they are located directly following statement 3. Statements 4,5 and 8 cannot be executed concurrently and are simply moved forward in the source code to their new locations.
54
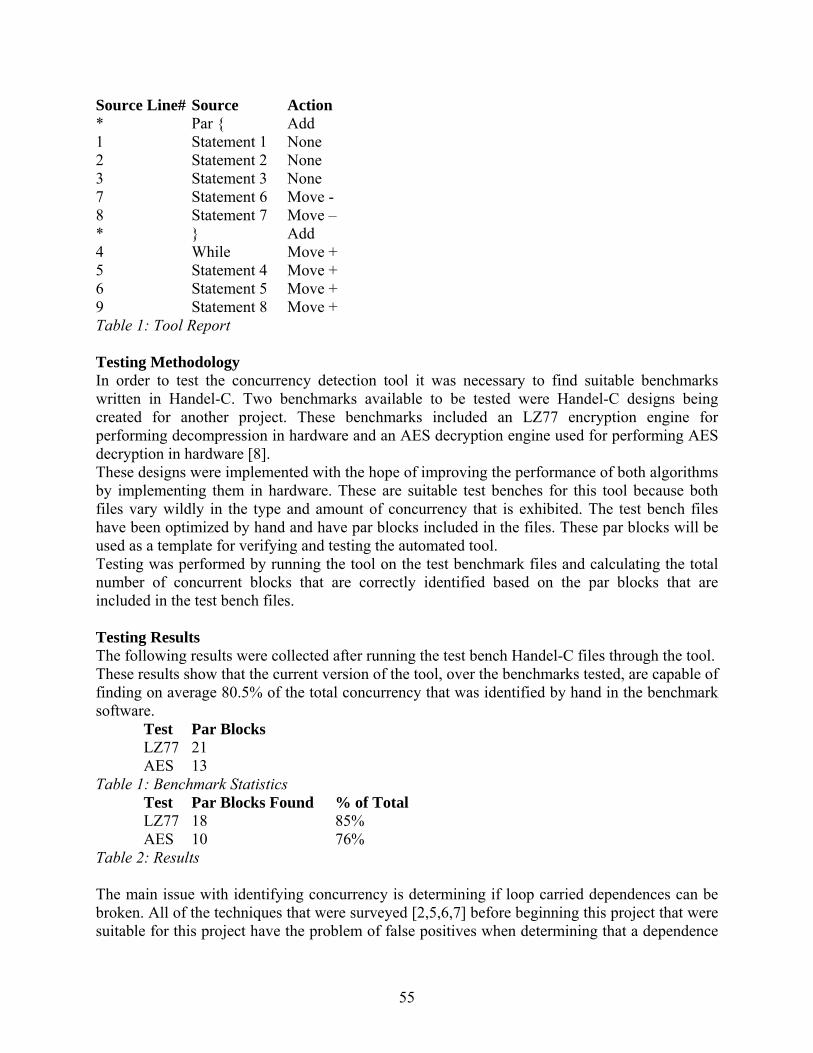
Source Line# Source Action * Par { Add 1 Statement 1 None 2 Statement 2 None 3 Statement 3 None 7 Statement 6 Move - 8 Statement 7 Move – * } Add 4 While Move + 5 Statement 4 Move + 6 Statement 5 Move + 9 Statement 8 Move + Table 1: Tool Report Testing Methodology In order to test the concurrency detection tool it was necessary to find suitable benchmarks written in Handel-C. Two benchmarks available to be tested were Handel-C designs being created for another project. These benchmarks included an LZ77 encryption engine for performing decompression in hardware and an AES decryption engine used for performing AES decryption in hardware [8]. These designs were implemented with the hope of improving the performance of both algorithms by implementing them in hardware. These are suitable test benches for this tool because both files vary wildly in the type and amount of concurrency that is exhibited. The test bench files have been optimized by hand and have par blocks included in the files. These par blocks will be used as a template for verifying and testing the automated tool. Testing was performed by running the tool on the test benchmark files and calculating the total number of concurrent blocks that are correctly identified based on the par blocks that are included in the test bench files. Testing Results The following results were collected after running the test bench Handel-C files through the tool. These results show that the current version of the tool, over the benchmarks tested, are capable of finding on average 80.5% of the total concurrency that was identified by hand in the benchmark software.
Test Par Blocks LZ77 21 AES 13
Table 1: Benchmark Statistics Test Par Blocks Found % of Total LZ77 18 85% AES 10 76%
Table 2: Results The main issue with identifying concurrency is determining if loop carried dependences can be broken. All of the techniques that were surveyed [2,5,6,7] before beginning this project that were suitable for this project have the problem of false positives when determining that a dependence
55

exists between two loop iterations even when no dependence actually exists between two statements. Conclusion Based on the results gathered from running the tool on the benchmark applications it can be said that the tool performs well. The tool is capable of automatically identifying a large portion of available concurrency in a given Handel-C file, which was the initial goal of the project. The tool provides valuable feedback for designers that are not well versed in creating Handel-C designs that exploit concurrency and may possibly become a valuable tool in a learning setting. The tool could be used to facilitate teaching how to best design hardware by exploiting concurrency that is inherent in the design. Future Work While the goals of the project were met, there is still much work that must be done to see the tool through to completion. More dependency checking algorithms must be implemented in order to improve the accuracy of the tool. Adding several different algorithms to the tool will allow the tool to either apply multiple algorithms to a single source file, or choose which algorithm best suits the type of program being analyzed. Another class of dependence testing algorithms, integer based algorithms, may also be added in order to further improve the accuracy of the tool. Integer based algorithms, such as the GCD test [11], were not chosen for the initial version of this tool due to their complexity and high runtime requirements but may be a useful addition to a more robust version due to their higher accuracy when determining dependence. References [1] Handel C Language Reference Manual, Agility, Website: www.agilityds.com, Accessed: March 2008. [2] G. Goff, K. Kennedy, C. Tseng, Practical Dependence Testing, Proceedings of the ACM SIGPLAN '91 Conference on Programming Language Design and Implementation, June 26-28, 1991. [3] GNU Compiler Collection (GCC) http://gcc.gnu.org/, Accessed on January 21, 2008. [4] JavaCC, https://javacc.dev.java.net, Accessed on January 21, 2008. [5] P.M. Petersen, D.A. Padua, Static and Dynamic Evaluation of Data Dependence Analysis Techniques, ICS93, 1993. [6] U. Banerjee, Dependence Analysis for Supercomputing, Kluwer Academic Publishers, 1988. [7] D. Wallace, Dependence of Multi-dimensional Array References, Proceedings of the Second International Conferences on Supercomputing, July 1988. [8] Farnaz Gharibani and Kenneth B. Kent, A Configurable DecRyption/ DecOmpression (DecRo) Engine, Euromicro Conference on Software Engineering and Advanced Applications (SEAA) Work-In-Progress Session (2 pages), 2007. [9] Jacob Ziv and Abraham Lempel. A Universal Algorithm for Sequential Data Compression. IEEE Transactions on Information Theory, 23(3):337–343, 1977. [10] Joan Daemen and Vincent Rijmen. AES Proposal: Rijndael. Proton World Intl., Erewhon, NC, March 9, 1999. [11] M.J. Wolfe, Optimizing Supercompilers for Supercomputers, PhD thesis, Dept. of Computer Science, University of Illinois at Urbana-Champaigne, October, 1982.
56
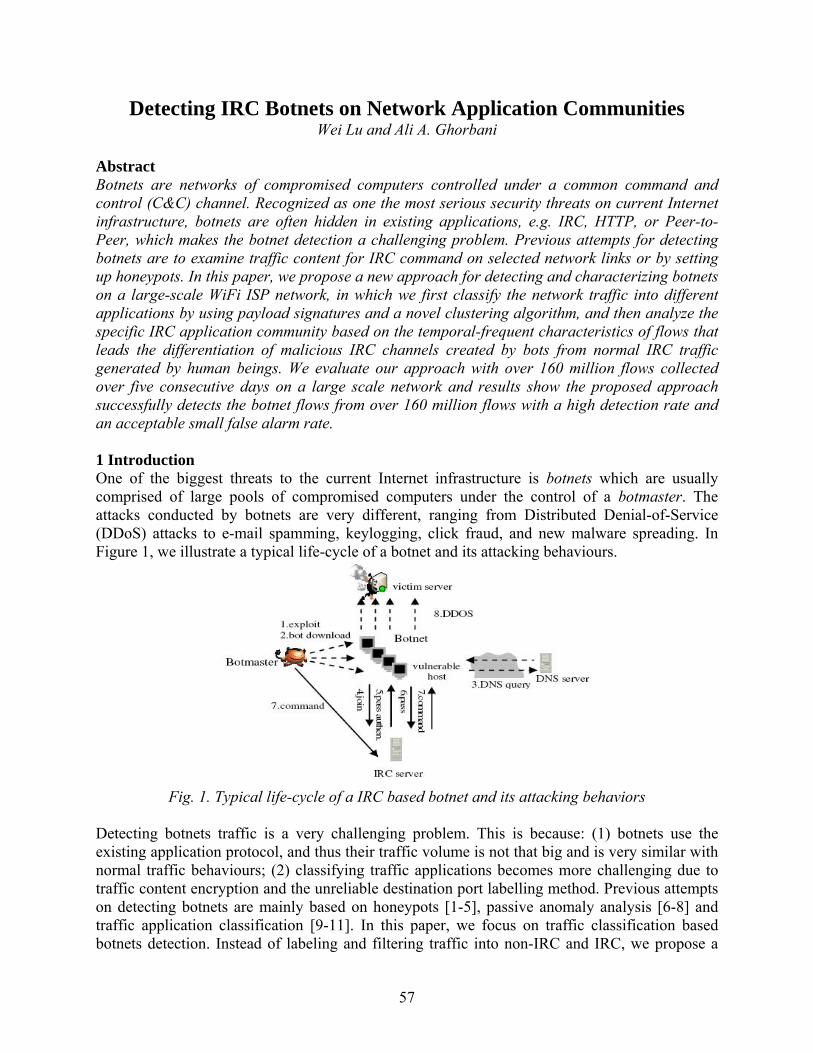
Detecting IRC Botnets on Network Application Communities Wei Lu and Ali A. Ghorbani
Abstract Botnets are networks of compromised computers controlled under a common command and control (C&C) channel. Recognized as one the most serious security threats on current Internet infrastructure, botnets are often hidden in existing applications, e.g. IRC, HTTP, or Peer-to-Peer, which makes the botnet detection a challenging problem. Previous attempts for detecting botnets are to examine traffic content for IRC command on selected network links or by setting up honeypots. In this paper, we propose a new approach for detecting and characterizing botnets on a large-scale WiFi ISP network, in which we first classify the network traffic into different applications by using payload signatures and a novel clustering algorithm, and then analyze the specific IRC application community based on the temporal-frequent characteristics of flows that leads the differentiation of malicious IRC channels created by bots from normal IRC traffic generated by human beings. We evaluate our approach with over 160 million flows collected over five consecutive days on a large scale network and results show the proposed approach successfully detects the botnet flows from over 160 million flows with a high detection rate and an acceptable small false alarm rate. 1 Introduction One of the biggest threats to the current Internet infrastructure is botnets which are usually comprised of large pools of compromised computers under the control of a botmaster. The attacks conducted by botnets are very different, ranging from Distributed Denial-of-Service (DDoS) attacks to e-mail spamming, keylogging, click fraud, and new malware spreading. In Figure 1, we illustrate a typical life-cycle of a botnet and its attacking behaviours.
Fig. 1. Typical life-cycle of a IRC based botnet and its attacking behaviors
Detecting botnets traffic is a very challenging problem. This is because: (1) botnets use the existing application protocol, and thus their traffic volume is not that big and is very similar with normal traffic behaviours; (2) classifying traffic applications becomes more challenging due to traffic content encryption and the unreliable destination port labelling method. Previous attempts on detecting botnets are mainly based on honeypots [1-5], passive anomaly analysis [6-8] and traffic application classification [9-11]. In this paper, we focus on traffic classification based botnets detection. Instead of labeling and filtering traffic into non-IRC and IRC, we propose a
57
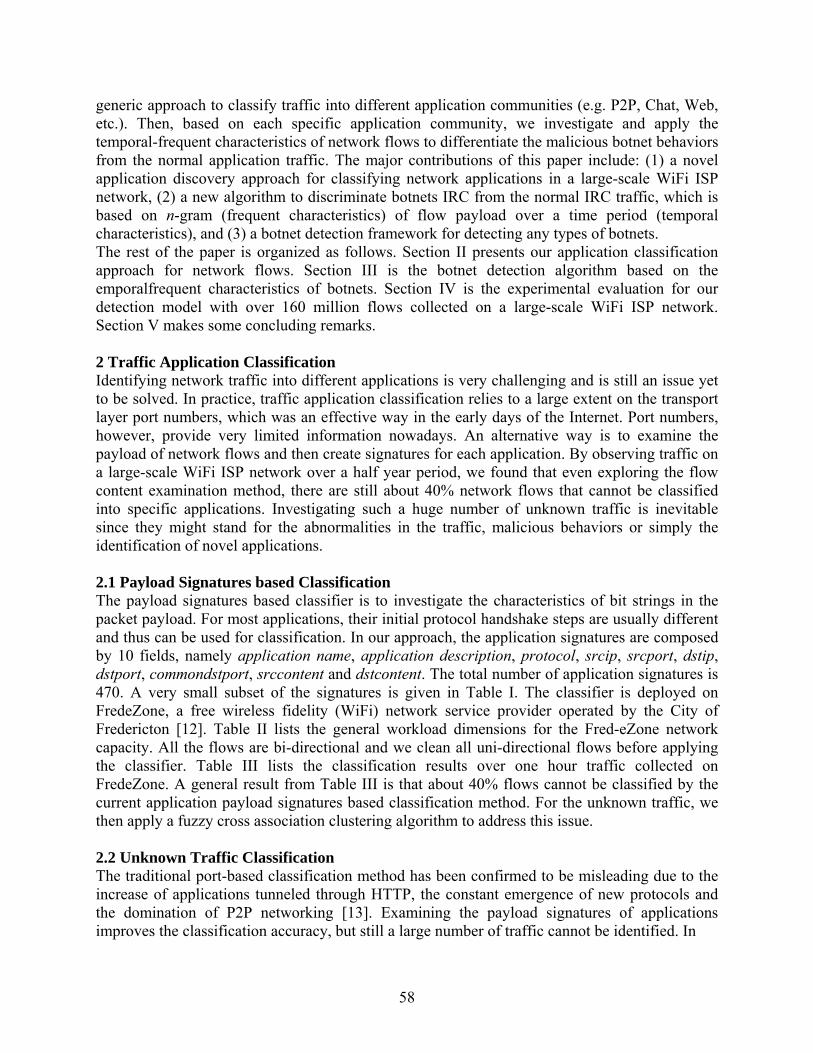
generic approach to classify traffic into different application communities (e.g. P2P, Chat, Web, etc.). Then, based on each specific application community, we investigate and apply the temporal-frequent characteristics of network flows to differentiate the malicious botnet behaviors from the normal application traffic. The major contributions of this paper include: (1) a novel application discovery approach for classifying network applications in a large-scale WiFi ISP network, (2) a new algorithm to discriminate botnets IRC from the normal IRC traffic, which is based on n-gram (frequent characteristics) of flow payload over a time period (temporal characteristics), and (3) a botnet detection framework for detecting any types of botnets. The rest of the paper is organized as follows. Section II presents our application classification approach for network flows. Section III is the botnet detection algorithm based on the emporalfrequent characteristics of botnets. Section IV is the experimental evaluation for our detection model with over 160 million flows collected on a large-scale WiFi ISP network. Section V makes some concluding remarks. 2 Traffic Application Classification Identifying network traffic into different applications is very challenging and is still an issue yet to be solved. In practice, traffic application classification relies to a large extent on the transport layer port numbers, which was an effective way in the early days of the Internet. Port numbers, however, provide very limited information nowadays. An alternative way is to examine the payload of network flows and then create signatures for each application. By observing traffic on a large-scale WiFi ISP network over a half year period, we found that even exploring the flow content examination method, there are still about 40% network flows that cannot be classified into specific applications. Investigating such a huge number of unknown traffic is inevitable since they might stand for the abnormalities in the traffic, malicious behaviors or simply the identification of novel applications. 2.1 Payload Signatures based Classification The payload signatures based classifier is to investigate the characteristics of bit strings in the packet payload. For most applications, their initial protocol handshake steps are usually different and thus can be used for classification. In our approach, the application signatures are composed by 10 fields, namely application name, application description, protocol, srcip, srcport, dstip, dstport, commondstport, srccontent and dstcontent. The total number of application signatures is 470. A very small subset of the signatures is given in Table I. The classifier is deployed on FredeZone, a free wireless fidelity (WiFi) network service provider operated by the City of Fredericton [12]. Table II lists the general workload dimensions for the Fred-eZone network capacity. All the flows are bi-directional and we clean all uni-directional flows before applying the classifier. Table III lists the classification results over one hour traffic collected on FredeZone. A general result from Table III is that about 40% flows cannot be classified by the current application payload signatures based classification method. For the unknown traffic, we then apply a fuzzy cross association clustering algorithm to address this issue. 2.2 Unknown Traffic Classification The traditional port-based classification method has been confirmed to be misleading due to the increase of applications tunneled through HTTP, the constant emergence of new protocols and the domination of P2P networking [13]. Examining the payload signatures of applications improves the classification accuracy, but still a large number of traffic cannot be identified. In
58
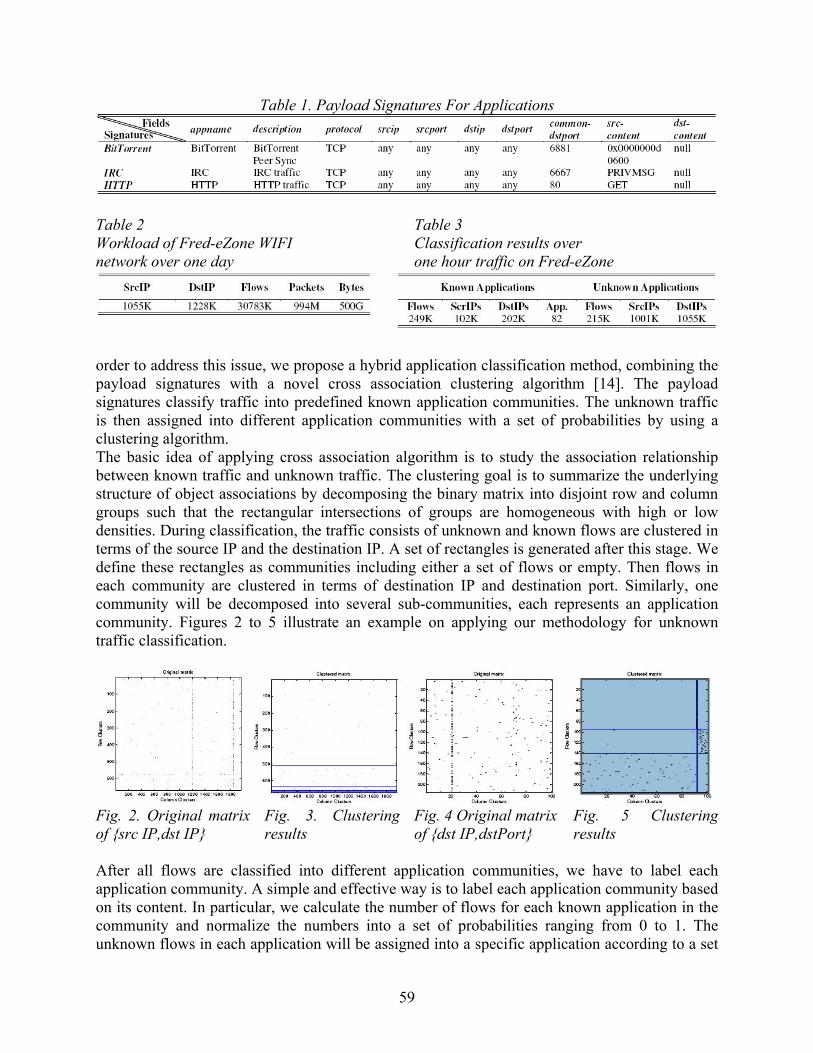
Table 1. Payload Signatures For Applications
Table 2 Workload of Fred-eZone WIFI network over one day
Table 3 Classification results over one hour traffic on Fred-eZone
order to address this issue, we propose a hybrid application classification method, combining the payload signatures with a novel cross association clustering algorithm [14]. The payload signatures classify traffic into predefined known application communities. The unknown traffic is then assigned into different application communities with a set of probabilities by using a clustering algorithm. The basic idea of applying cross association algorithm is to study the association relationship between known traffic and unknown traffic. The clustering goal is to summarize the underlying structure of object associations by decomposing the binary matrix into disjoint row and column groups such that the rectangular intersections of groups are homogeneous with high or low densities. During classification, the traffic consists of unknown and known flows are clustered in terms of the source IP and the destination IP. A set of rectangles is generated after this stage. We define these rectangles as communities including either a set of flows or empty. Then flows in each community are clustered in terms of destination IP and destination port. Similarly, one community will be decomposed into several sub-communities, each represents an application community. Figures 2 to 5 illustrate an example on applying our methodology for unknown traffic classification.
Fig. 2. Original matrix of {src IP,dst IP}
Fig. 3. Clustering results
Fig. 4 Original matrix of {dst IP,dstPort}
Fig. 5 Clustering results
After all flows are classified into different application communities, we have to label each application community. A simple and effective way is to label each application community based on its content. In particular, we calculate the number of flows for each known application in the community and normalize the numbers into a set of probabilities ranging from 0 to 1. The unknown flows in each application will be assigned into a specific application according to a set
59
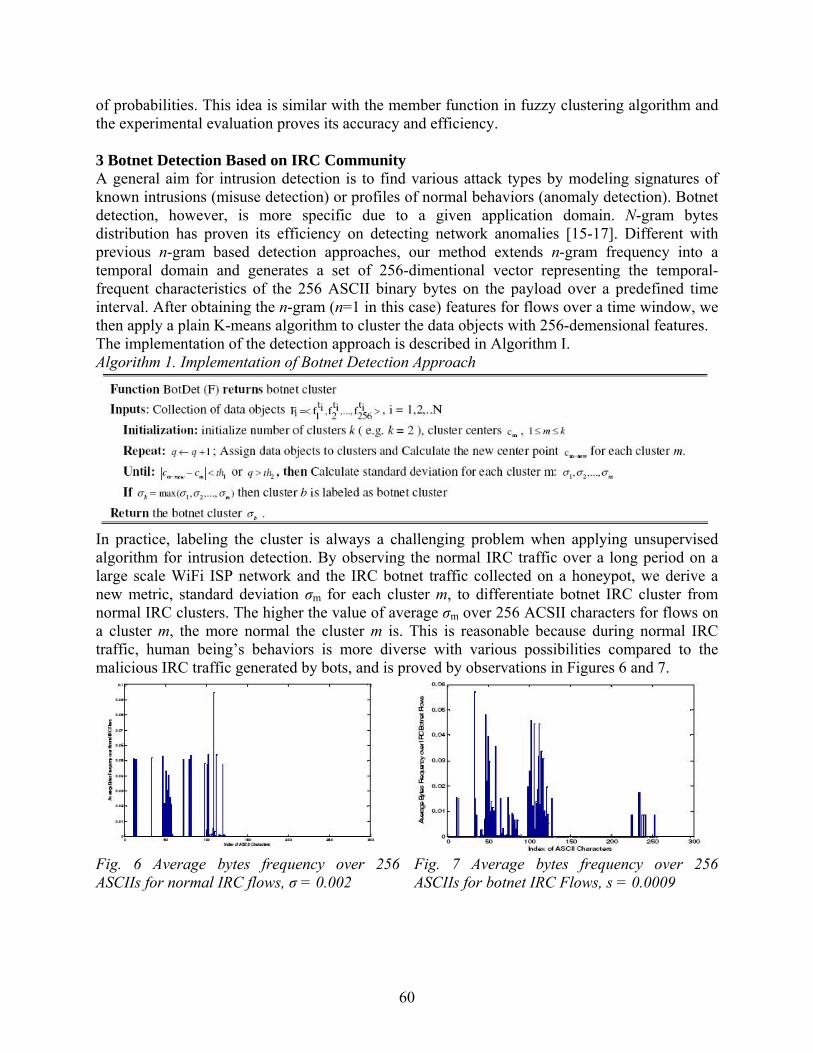
of probabilities. This idea is similar with the member function in fuzzy clustering algorithm and the experimental evaluation proves its accuracy and efficiency. 3 Botnet Detection Based on IRC Community A general aim for intrusion detection is to find various attack types by modeling signatures of known intrusions (misuse detection) or profiles of normal behaviors (anomaly detection). Botnet detection, however, is more specific due to a given application domain. N-gram bytes distribution has proven its efficiency on detecting network anomalies [15-17]. Different with previous n-gram based detection approaches, our method extends n-gram frequency into a temporal domain and generates a set of 256-dimentional vector representing the temporal-frequent characteristics of the 256 ASCII binary bytes on the payload over a predefined time interval. After obtaining the n-gram (n=1 in this case) features for flows over a time window, we then apply a plain K-means algorithm to cluster the data objects with 256-demensional features. The implementation of the detection approach is described in Algorithm I. Algorithm 1. Implementation of Botnet Detection Approach
In practice, labeling the cluster is always a challenging problem when applying unsupervised algorithm for intrusion detection. By observing the normal IRC traffic over a long period on a large scale WiFi ISP network and the IRC botnet traffic collected on a honeypot, we derive a new metric, standard deviation σm for each cluster m, to differentiate botnet IRC cluster from normal IRC clusters. The higher the value of average σm over 256 ACSII characters for flows on a cluster m, the more normal the cluster m is. This is reasonable because during normal IRC traffic, human being’s behaviors is more diverse with various possibilities compared to the malicious IRC traffic generated by bots, and is proved by observations in Figures 6 and 7.
Fig. 6 Average bytes frequency over 256 ASCIIs for normal IRC flows, σ = 0.002
Fig. 7 Average bytes frequency over 256 ASCIIs for botnet IRC Flows, s = 0.0009
60
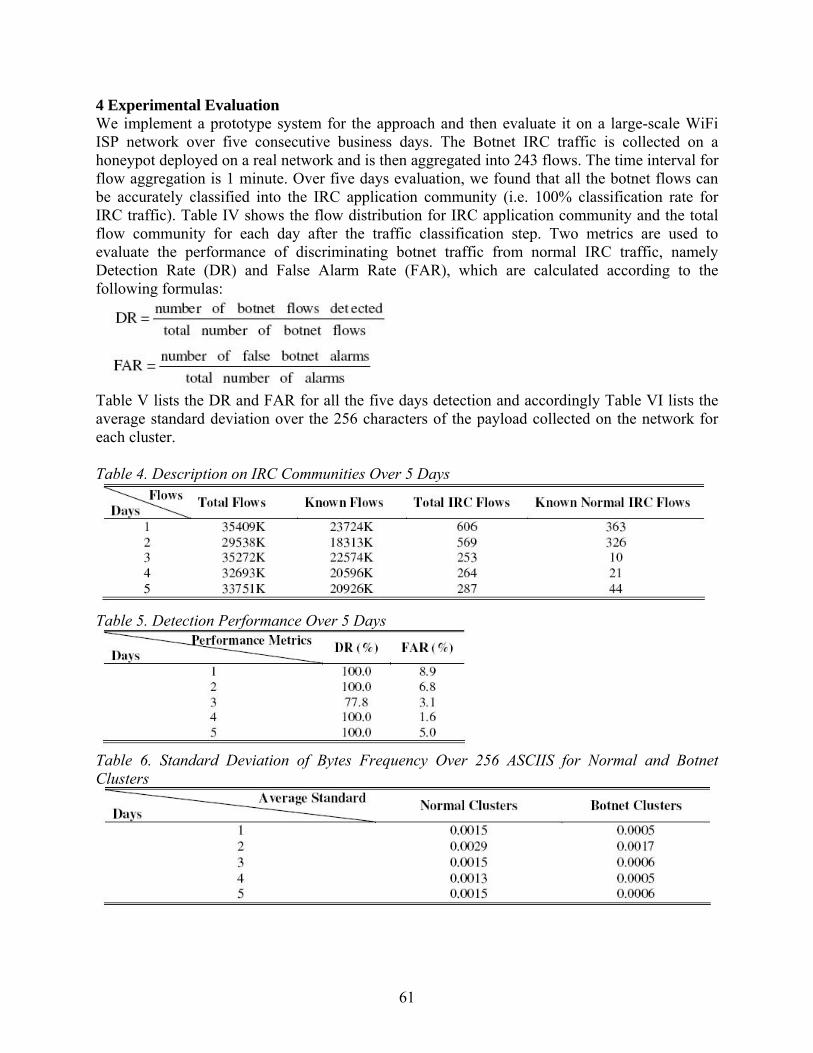
4 Experimental Evaluation We implement a prototype system for the approach and then evaluate it on a large-scale WiFi ISP network over five consecutive business days. The Botnet IRC traffic is collected on a honeypot deployed on a real network and is then aggregated into 243 flows. The time interval for flow aggregation is 1 minute. Over five days evaluation, we found that all the botnet flows can be accurately classified into the IRC application community (i.e. 100% classification rate for IRC traffic). Table IV shows the flow distribution for IRC application community and the total flow community for each day after the traffic classification step. Two metrics are used to evaluate the performance of discriminating botnet traffic from normal IRC traffic, namely Detection Rate (DR) and False Alarm Rate (FAR), which are calculated according to the following formulas:
Table V lists the DR and FAR for all the five days detection and accordingly Table VI lists the average standard deviation over the 256 characters of the payload collected on the network for each cluster. Table 4. Description on IRC Communities Over 5 Days
Table 5. Detection Performance Over 5 Days
Table 6. Standard Deviation of Bytes Frequency Over 256 ASCIIS for Normal and Botnet Clusters
61
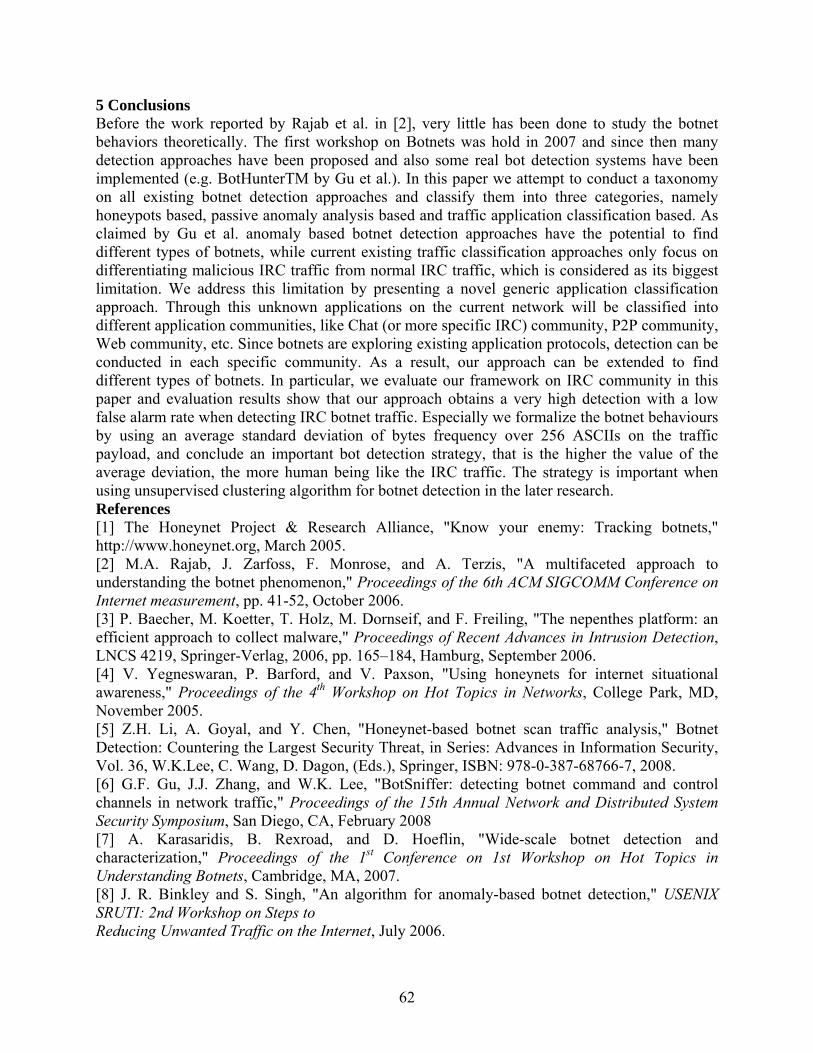
5 Conclusions Before the work reported by Rajab et al. in [2], very little has been done to study the botnet behaviors theoretically. The first workshop on Botnets was hold in 2007 and since then many detection approaches have been proposed and also some real bot detection systems have been implemented (e.g. BotHunterTM by Gu et al.). In this paper we attempt to conduct a taxonomy on all existing botnet detection approaches and classify them into three categories, namely honeypots based, passive anomaly analysis based and traffic application classification based. As claimed by Gu et al. anomaly based botnet detection approaches have the potential to find different types of botnets, while current existing traffic classification approaches only focus on differentiating malicious IRC traffic from normal IRC traffic, which is considered as its biggest limitation. We address this limitation by presenting a novel generic application classification approach. Through this unknown applications on the current network will be classified into different application communities, like Chat (or more specific IRC) community, P2P community, Web community, etc. Since botnets are exploring existing application protocols, detection can be conducted in each specific community. As a result, our approach can be extended to find different types of botnets. In particular, we evaluate our framework on IRC community in this paper and evaluation results show that our approach obtains a very high detection with a low false alarm rate when detecting IRC botnet traffic. Especially we formalize the botnet behaviours by using an average standard deviation of bytes frequency over 256 ASCIIs on the traffic payload, and conclude an important bot detection strategy, that is the higher the value of the average deviation, the more human being like the IRC traffic. The strategy is important when using unsupervised clustering algorithm for botnet detection in the later research. References [1] The Honeynet Project & Research Alliance, "Know your enemy: Tracking botnets," http://www.honeynet.org, March 2005. [2] M.A. Rajab, J. Zarfoss, F. Monrose, and A. Terzis, "A multifaceted approach to understanding the botnet phenomenon," Proceedings of the 6th ACM SIGCOMM Conference on Internet measurement, pp. 41-52, October 2006. [3] P. Baecher, M. Koetter, T. Holz, M. Dornseif, and F. Freiling, "The nepenthes platform: an efficient approach to collect malware," Proceedings of Recent Advances in Intrusion Detection, LNCS 4219, Springer-Verlag, 2006, pp. 165–184, Hamburg, September 2006. [4] V. Yegneswaran, P. Barford, and V. Paxson, "Using honeynets for internet situational awareness," Proceedings of the 4th Workshop on Hot Topics in Networks, College Park, MD, November 2005. [5] Z.H. Li, A. Goyal, and Y. Chen, "Honeynet-based botnet scan traffic analysis," Botnet Detection: Countering the Largest Security Threat, in Series: Advances in Information Security, Vol. 36, W.K.Lee, C. Wang, D. Dagon, (Eds.), Springer, ISBN: 978-0-387-68766-7, 2008. [6] G.F. Gu, J.J. Zhang, and W.K. Lee, "BotSniffer: detecting botnet command and control channels in network traffic," Proceedings of the 15th Annual Network and Distributed System Security Symposium, San Diego, CA, February 2008 [7] A. Karasaridis, B. Rexroad, and D. Hoeflin, "Wide-scale botnet detection and characterization," Proceedings of the 1st Conference on 1st Workshop on Hot Topics in Understanding Botnets, Cambridge, MA, 2007. [8] J. R. Binkley and S. Singh, "An algorithm for anomaly-based botnet detection," USENIX SRUTI: 2nd Workshop on Steps to Reducing Unwanted Traffic on the Internet, July 2006.
62
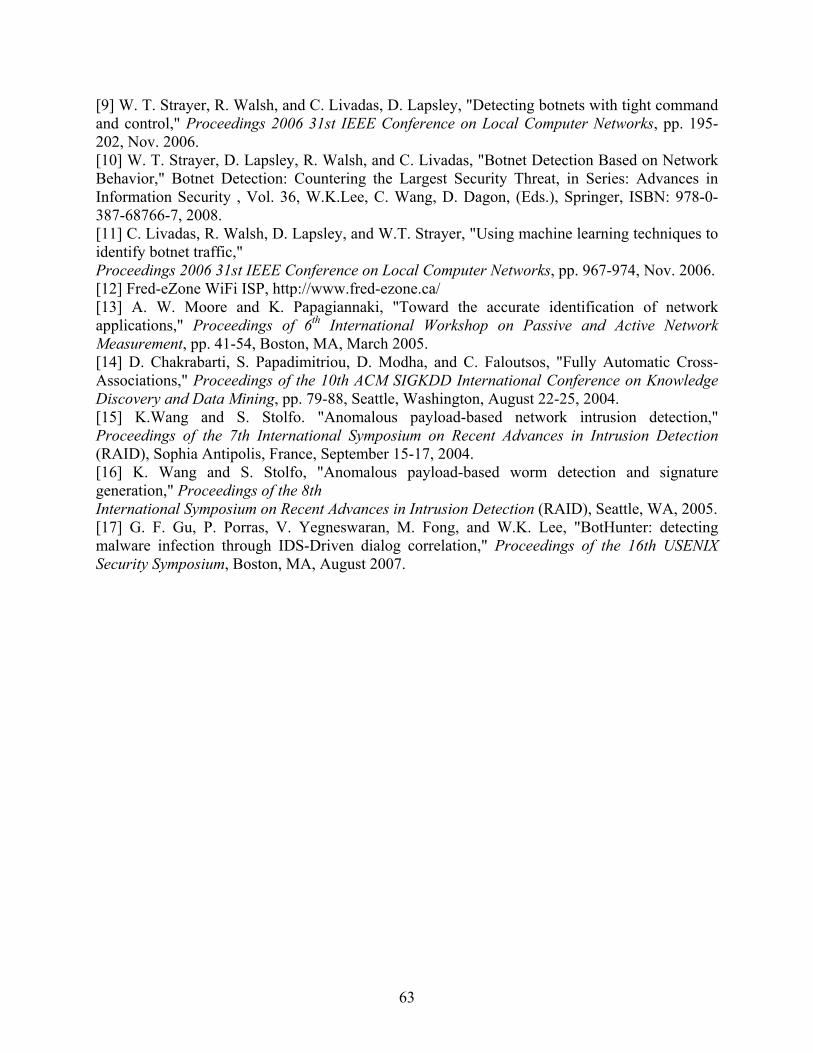
[9] W. T. Strayer, R. Walsh, and C. Livadas, D. Lapsley, "Detecting botnets with tight command and control," Proceedings 2006 31st IEEE Conference on Local Computer Networks, pp. 195-202, Nov. 2006. [10] W. T. Strayer, D. Lapsley, R. Walsh, and C. Livadas, "Botnet Detection Based on Network Behavior," Botnet Detection: Countering the Largest Security Threat, in Series: Advances in Information Security , Vol. 36, W.K.Lee, C. Wang, D. Dagon, (Eds.), Springer, ISBN: 978-0-387-68766-7, 2008. [11] C. Livadas, R. Walsh, D. Lapsley, and W.T. Strayer, "Using machine learning techniques to identify botnet traffic," Proceedings 2006 31st IEEE Conference on Local Computer Networks, pp. 967-974, Nov. 2006. [12] Fred-eZone WiFi ISP, http://www.fred-ezone.ca/ [13] A. W. Moore and K. Papagiannaki, "Toward the accurate identification of network applications," Proceedings of 6th International Workshop on Passive and Active Network Measurement, pp. 41-54, Boston, MA, March 2005. [14] D. Chakrabarti, S. Papadimitriou, D. Modha, and C. Faloutsos, "Fully Automatic Cross-Associations," Proceedings of the 10th ACM SIGKDD International Conference on Knowledge Discovery and Data Mining, pp. 79-88, Seattle, Washington, August 22-25, 2004. [15] K.Wang and S. Stolfo. "Anomalous payload-based network intrusion detection," Proceedings of the 7th International Symposium on Recent Advances in Intrusion Detection (RAID), Sophia Antipolis, France, September 15-17, 2004. [16] K. Wang and S. Stolfo, "Anomalous payload-based worm detection and signature generation," Proceedings of the 8th International Symposium on Recent Advances in Intrusion Detection (RAID), Seattle, WA, 2005. [17] G. F. Gu, P. Porras, V. Yegneswaran, M. Fong, and W.K. Lee, "BotHunter: detecting malware infection through IDS-Driven dialog correlation," Proceedings of the 16th USENIX Security Symposium, Boston, MA, August 2007.
63
Toward a Service-Oriented Computing Environment for Public Service Delivery in Municipal Broadband Wireless Networks
William McIver, Jr. and Colin A. Hay Abstract This is paper provides an overview of a new investigation of serviced-oriented computing for the delivery of public services within municipal broadband wireless networks (MBWN). This research is part of a broad program to identify ways in which information and communication technologies (ICT) can contribute to the fostering of communities which are: healthy, safe, collaborative, learning, and sustainable. 1 Introduction Service-oriented computing (SOC) is defined as “a paradigm for organizing and utilizing distributed capabilities that may be under the control of different ownership domains” which “provides a uniform means to offer, discover, interact with and use capabilities to produce desired effects consistent with measurable preconditions and expectations” (OASIS, 2006:8, 29). Papazoglou et al. define SOC as an approach to software development that “utilizes services as the constructs to support the development of rapid, low-cost and easy composition of distributed applications” (Papazoglou12006:2). MBWNs are defined here as wireless networks that are freely-accessible to the public. A variety of protocols are recognized here including, but not limited to: IEEE 802.11a, b, g, and n; 802.11s (mesh networking); and 802.16 d and 802.16 e (WiMax wide area networking). It appears likely that the architectures of most MBWNs will evolve into hybrids comprised of these different types of protocols. 2 Research Objectives 2.1 Theoretical / conceptual aspects of service-oriented computing: A theoretical/conceptual framework for the SOCE is in development, which includes: an object model, service interaction and service coordination models. Experimental aspects of service-oriented computing: of computational performance, usability, and social organization issues raised by the prototypes of public services are being produced. 2.2 Design heuristics for service-oriented computing: The theoretical, empirical, and experiential outputs of this research are yielding a set of design heuristics for the development of public services for MBWNs within a SOCE framework. 3 Key Research Areas and Background Service taxonomy: This effort involves classification of the basic service classes that are desirable within a MBWN. One starting point here is the taxonomy of e-Government service types defined in (McIver2002:7-9). More recent efforts have begun to look specifically at e-Government services within a SOC context (Rogger2006). The taxonomy being developed in this investigation is integrating facets of SOC particular to the delivery of public services within a MBWN. These include: mobility, context awareness, resource discovery, location awareness, and communication volatility. Specific service categories under investigation at this time are: (1) gps-based, locationaware services, (2) marker-based, location-aware services, and (3) distributed collaboration technologies.
64
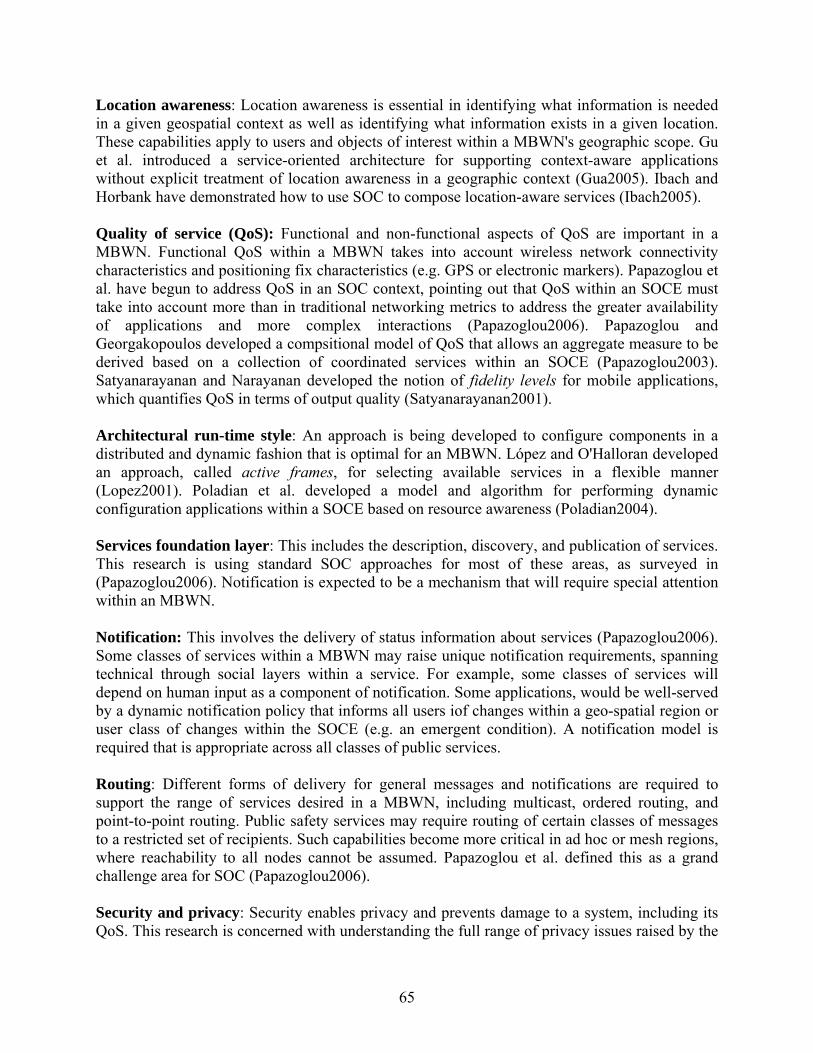
Location awareness: Location awareness is essential in identifying what information is needed in a given geospatial context as well as identifying what information exists in a given location. These capabilities apply to users and objects of interest within a MBWN's geographic scope. Gu et al. introduced a service-oriented architecture for supporting context-aware applications without explicit treatment of location awareness in a geographic context (Gua2005). Ibach and Horbank have demonstrated how to use SOC to compose location-aware services (Ibach2005). Quality of service (QoS): Functional and non-functional aspects of QoS are important in a MBWN. Functional QoS within a MBWN takes into account wireless network connectivity characteristics and positioning fix characteristics (e.g. GPS or electronic markers). Papazoglou et al. have begun to address QoS in an SOC context, pointing out that QoS within an SOCE must take into account more than in traditional networking metrics to address the greater availability of applications and more complex interactions (Papazoglou2006). Papazoglou and Georgakopoulos developed a compsitional model of QoS that allows an aggregate measure to be derived based on a collection of coordinated services within an SOCE (Papazoglou2003). Satyanarayanan and Narayanan developed the notion of fidelity levels for mobile applications, which quantifies QoS in terms of output quality (Satyanarayanan2001). Architectural run-time style: An approach is being developed to configure components in a distributed and dynamic fashion that is optimal for an MBWN. López and O'Halloran developed an approach, called active frames, for selecting available services in a flexible manner (Lopez2001). Poladian et al. developed a model and algorithm for performing dynamic configuration applications within a SOCE based on resource awareness (Poladian2004). Services foundation layer: This includes the description, discovery, and publication of services. This research is using standard SOC approaches for most of these areas, as surveyed in (Papazoglou2006). Notification is expected to be a mechanism that will require special attention within an MBWN. Notification: This involves the delivery of status information about services (Papazoglou2006). Some classes of services within a MBWN may raise unique notification requirements, spanning technical through social layers within a service. For example, some classes of services will depend on human input as a component of notification. Some applications, would be well-served by a dynamic notification policy that informs all users iof changes within a geo-spatial region or user class of changes within the SOCE (e.g. an emergent condition). A notification model is required that is appropriate across all classes of public services. Routing: Different forms of delivery for general messages and notifications are required to support the range of services desired in a MBWN, including multicast, ordered routing, and point-to-point routing. Public safety services may require routing of certain classes of messages to a restricted set of recipients. Such capabilities become more critical in ad hoc or mesh regions, where reachability to all nodes cannot be assumed. Papazoglou et al. defined this as a grand challenge area for SOC (Papazoglou2006). Security and privacy: Security enables privacy and prevents damage to a system, including its QoS. This research is concerned with understanding the full range of privacy issues raised by the
65
delivery of public services within a MBWN and providing end-to-end security that is sufficient for addressing these privacy issues. Skogsrud et al. developed Trust-serv, an approach to negotiating trust within SOCEs (Skogsrud2004). IBM proposed a comprehensive model for providing security within an SOCE (IBM2002). Application and data integration: This is a core objective of the SOC paradigm. This research is identifying approaches that satisfy constraints that are unique to a MBWN. Representational State Transfer (REST) approach (Fielding2000) is currently being used in this research to implement service APIs and data transfer. This is currently being done using the Ruby on Rails web application framework along with JSON. This line of inquiry is giving special attention to Web 2.0 development approaches and business models which facilitate integration of third party applications with local applications and data (cf. O'Reilly2005). For example, the service prototype described below has been developed as a mash-up of a Google Maps service and data supplied by location-aware agents developed for the SOCE. Service and resource discovery: Development of mechanisms that support automatic discovery of services and other resources within a MBWN is a long-term goal. Wang and Stroulia developed a collection of algorithms for performing service discovery using similarity tests between Web-Service Description Language specifications (Wang2003). Sahin et al. developed resource discovery algorithms specifically for peer-to-peer environments (Sahin2005). The latter approach may be particularly useful within ad hoc networking regions of a MBWN. Space syntax: Many message routing approaches in mobile ad hoc networking (MANET) assume random spatial movement potentials for mobile network nodes carried by people. Dalton and Dalton showed the importance of modeling the natural movement of people to achieving optimal routing in MANET (Dalton2007). This work applies space syntax (Hillier1976) to model and measure how people move in urban environments. This investigation expects to extend space syntax to account for non-MANET as well as vehicular ad hoc networks (VANET) network topographies within MBWNs along with the unique combination of constrained and open movement potentials that exist in urban environments. For example, in modeling movement potentials for public transit systems, routes constrain not only the movement potentials for passengers aboard transit vehicles, but also pedestrians and potential passengers. Internationalization and cultural adaptation: Delivery of public services within a MBWN must be adaptive to linguistic and cultural constraints of users. MBWNs are increasingly likely to be situated within multi-lingual environments. This investigation is developing architectural elements of the SOCE to support multi-lingual content delivery. A fairly mature area of research can be leveraged here (cf. W3C). Human factors: This is orthogonal to all aspects of this research. This research is seeking to develop transcendant principles within the SOCE model that identify key human factors issues; however, human factors issues must still be identified for each service to be developed. McIver has surveyed many of these issues in the context of design for communities within developing countries (McIver2003).
66
Wireless protocol selection heuristics: Most municipalities are evolving MBWNs that contain a mix of protocols, including Wi-Fi, mesh, and WiMax. Cities need to understand the appropriateness of each technology. This area of inquiry is developing heuristics for protocols selection. At minimum, protocol selection must take into account service class, QoS requirements, and geo-spatial features within the SOCE, but may include many other inputs. Location awareness technology selection heuristics: GPS as well as optical and electronic markers are classes of technologies of interest here. Optical markers include technologies such as ARTag (Fiala2004). Electronic markers include Bluetooth and RFID. This line of inquiry will seek to develop heuristics for selecting from among these classes of technologies based on environmental conditions, QoS constraints, and other factors to be identified. The opportunity exists to use platforms that are capable of simultaneous use of multiple location awareness technologies. Service development heuristics for MBWNs: A life-cycle approach to public service development in an SOCE is being established. This effort is being informed by all other lines of inquiry in this project. 4 Preliminary Research Results: Bus Locator -- A Wi-Fi-based Location Service for Public Transit Service description: The Intelligent City Bus Locator system will allow people to observe the position of buses traveling within a Wi-Fi service area in real-time. Research problem: Cities are seeking ways to encourage “greener” methods of commuting. Public transit and active transit are key elements. What solutions can information and communication technologies contribute? Hypotheses: (1) Increasing the availability of real-time, location-based information about a public transit system will greatly improve ridership, particularly for ad hoc trip planning. (2) A MBWN can provide reliable QoS for such information services. Opportunity: Cities are modeling their transit routes within Google Transit, a variant of Google's interactive Map facility that provides search-based trip planning specific to a participant city's routes. The opportunity for SOC in this context begins with the development of value-added services to Google Transit through Google's open API. These are commonly referred to as “mash-ups.” The co-existence of low cost (or “free”) MBWN, such as Wi-Fi access along transit routes, brings the potential for these value-added services to provide real-time, location-based information. The city of Fredericton, New Brunswick is a participant in Google Transit and has deployed a public Wi-Fi infrastructure across parts of its public transit area. Architecture: The architecture is depicted in Figure 1. Waypoint Server stores and retrieves GPS and other types of waypoints. It provides a RESTful API and implements the GPS Exchange Format (GPX) schema. Waypoint Reporter continually monitors its location using global positioning and reports to the Waypoint Server. Transit Monitor is an application that integrates Google Transit functionality with real-time information from the Waypoint Server to provide a dynamic location monitor.
67
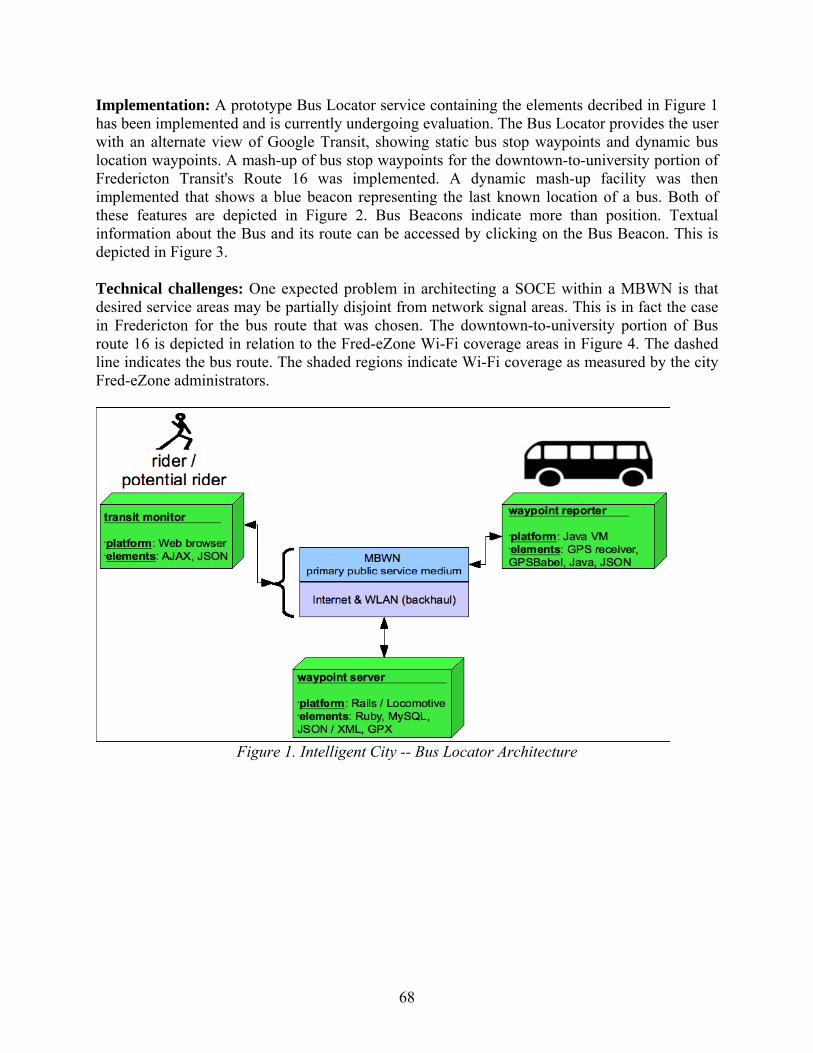
Implementation: A prototype Bus Locator service containing the elements decribed in Figure 1 has been implemented and is currently undergoing evaluation. The Bus Locator provides the user with an alternate view of Google Transit, showing static bus stop waypoints and dynamic bus location waypoints. A mash-up of bus stop waypoints for the downtown-to-university portion of Fredericton Transit's Route 16 was implemented. A dynamic mash-up facility was then implemented that shows a blue beacon representing the last known location of a bus. Both of these features are depicted in Figure 2. Bus Beacons indicate more than position. Textual information about the Bus and its route can be accessed by clicking on the Bus Beacon. This is depicted in Figure 3. Technical challenges: One expected problem in architecting a SOCE within a MBWN is that desired service areas may be partially disjoint from network signal areas. This is in fact the case in Fredericton for the bus route that was chosen. The downtown-to-university portion of Bus route 16 is depicted in relation to the Fred-eZone Wi-Fi coverage areas in Figure 4. The dashed line indicates the bus route. The shaded regions indicate Wi-Fi coverage as measured by the city Fred-eZone administrators.
Figure 1. Intelligent City -- Bus Locator Architecture
68
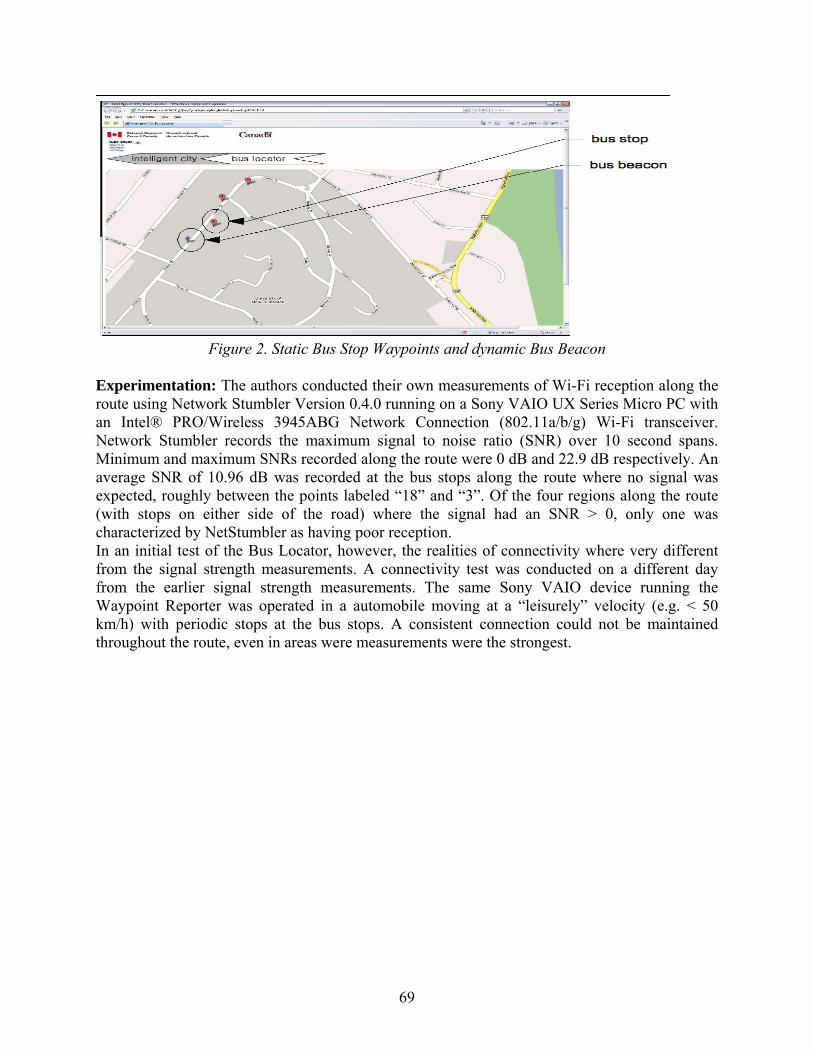
Figure 2. Static Bus Stop Waypoints and dynamic Bus Beacon
Experimentation: The authors conducted their own measurements of Wi-Fi reception along the route using Network Stumbler Version 0.4.0 running on a Sony VAIO UX Series Micro PC with an Intel® PRO/Wireless 3945ABG Network Connection (802.11a/b/g) Wi-Fi transceiver. Network Stumbler records the maximum signal to noise ratio (SNR) over 10 second spans. Minimum and maximum SNRs recorded along the route were 0 dB and 22.9 dB respectively. An average SNR of 10.96 dB was recorded at the bus stops along the route where no signal was expected, roughly between the points labeled “18” and “3”. Of the four regions along the route (with stops on either side of the road) where the signal had an SNR > 0, only one was characterized by NetStumbler as having poor reception. In an initial test of the Bus Locator, however, the realities of connectivity where very different from the signal strength measurements. A connectivity test was conducted on a different day from the earlier signal strength measurements. The same Sony VAIO device running the Waypoint Reporter was operated in a automobile moving at a “leisurely” velocity (e.g. < 50 km/h) with periodic stops at the bus stops. A consistent connection could not be maintained throughout the route, even in areas were measurements were the strongest.
69
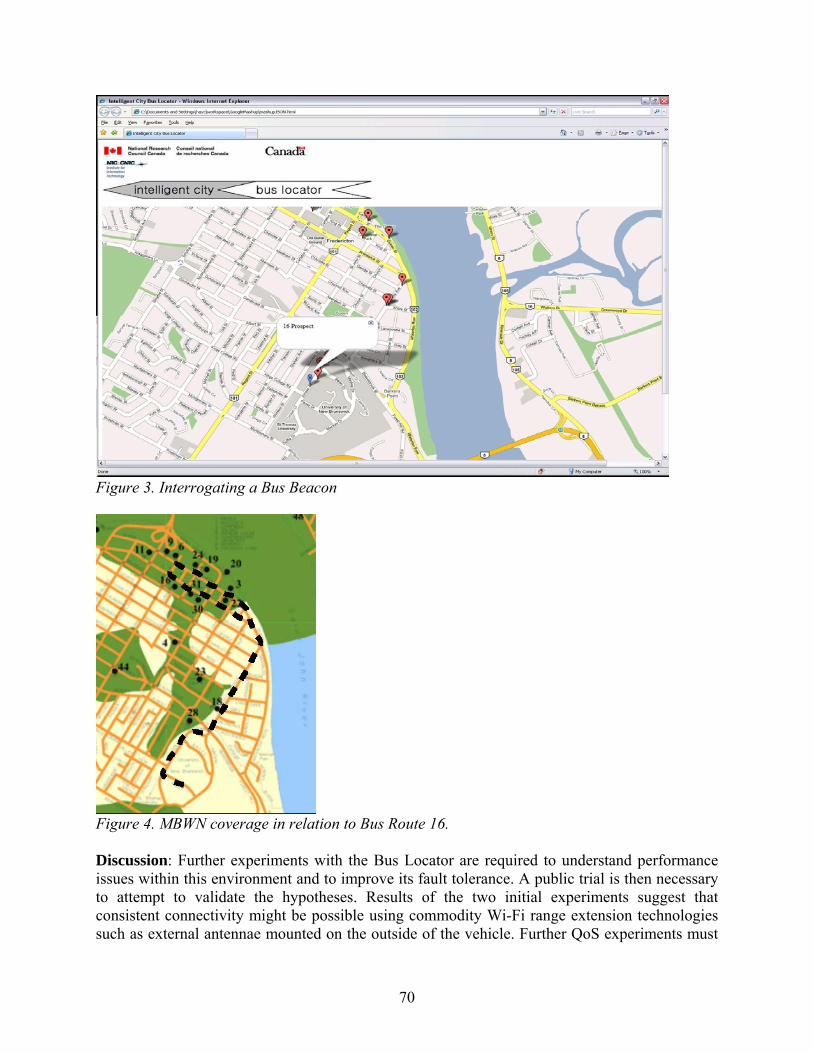
Figure 3. Interrogating a Bus Beacon
Figure 4. MBWN coverage in relation to Bus Route 16. Discussion: Further experiments with the Bus Locator are required to understand performance issues within this environment and to improve its fault tolerance. A public trial is then necessary to attempt to validate the hypotheses. Results of the two initial experiments suggest that consistent connectivity might be possible using commodity Wi-Fi range extension technologies such as external antennae mounted on the outside of the vehicle. Further QoS experiments must
70
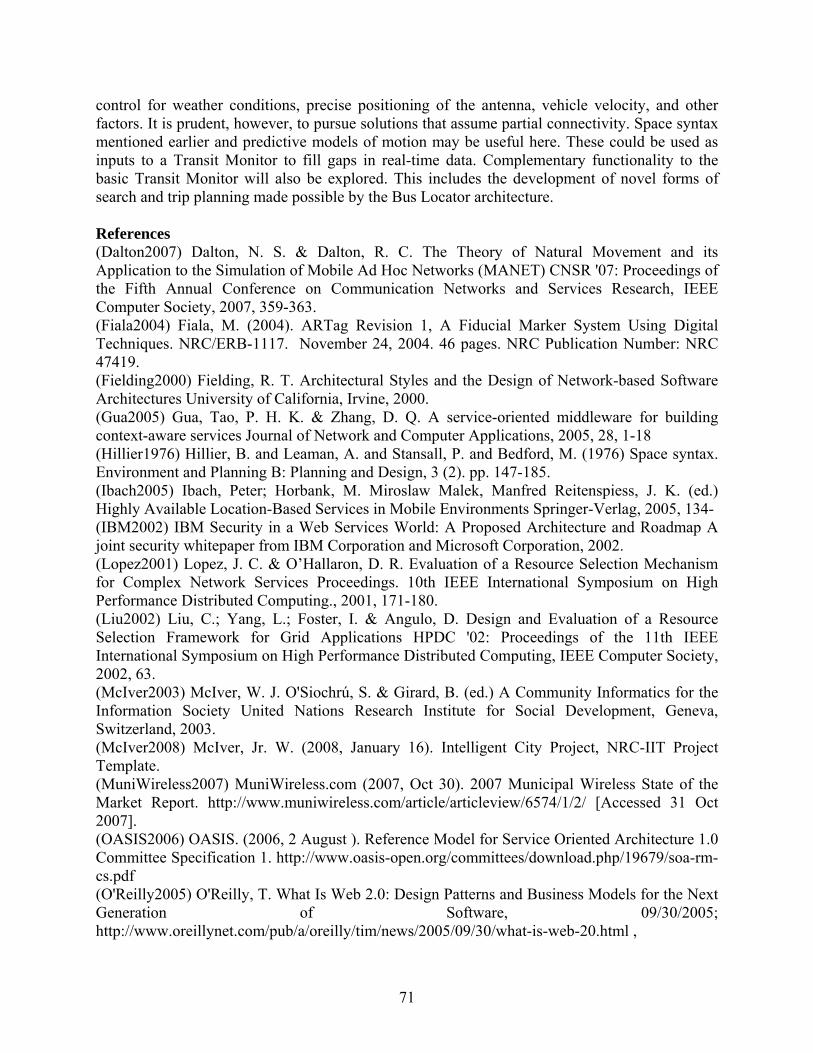
control for weather conditions, precise positioning of the antenna, vehicle velocity, and other factors. It is prudent, however, to pursue solutions that assume partial connectivity. Space syntax mentioned earlier and predictive models of motion may be useful here. These could be used as inputs to a Transit Monitor to fill gaps in real-time data. Complementary functionality to the basic Transit Monitor will also be explored. This includes the development of novel forms of search and trip planning made possible by the Bus Locator architecture. References (Dalton2007) Dalton, N. S. & Dalton, R. C. The Theory of Natural Movement and its Application to the Simulation of Mobile Ad Hoc Networks (MANET) CNSR '07: Proceedings of the Fifth Annual Conference on Communication Networks and Services Research, IEEE Computer Society, 2007, 359-363. (Fiala2004) Fiala, M. (2004). ARTag Revision 1, A Fiducial Marker System Using Digital Techniques. NRC/ERB-1117. November 24, 2004. 46 pages. NRC Publication Number: NRC 47419. (Fielding2000) Fielding, R. T. Architectural Styles and the Design of Network-based Software Architectures University of California, Irvine, 2000. (Gua2005) Gua, Tao, P. H. K. & Zhang, D. Q. A service-oriented middleware for building context-aware services Journal of Network and Computer Applications, 2005, 28, 1-18 (Hillier1976) Hillier, B. and Leaman, A. and Stansall, P. and Bedford, M. (1976) Space syntax. Environment and Planning B: Planning and Design, 3 (2). pp. 147-185. (Ibach2005) Ibach, Peter; Horbank, M. Miroslaw Malek, Manfred Reitenspiess, J. K. (ed.) Highly Available Location-Based Services in Mobile Environments Springer-Verlag, 2005, 134- (IBM2002) IBM Security in a Web Services World: A Proposed Architecture and Roadmap A joint security whitepaper from IBM Corporation and Microsoft Corporation, 2002. (Lopez2001) Lopez, J. C. & O’Hallaron, D. R. Evaluation of a Resource Selection Mechanism for Complex Network Services Proceedings. 10th IEEE International Symposium on High Performance Distributed Computing., 2001, 171-180. (Liu2002) Liu, C.; Yang, L.; Foster, I. & Angulo, D. Design and Evaluation of a Resource Selection Framework for Grid Applications HPDC '02: Proceedings of the 11th IEEE International Symposium on High Performance Distributed Computing, IEEE Computer Society, 2002, 63. (McIver2003) McIver, W. J. O'Siochrú, S. & Girard, B. (ed.) A Community Informatics for the Information Society United Nations Research Institute for Social Development, Geneva, Switzerland, 2003. (McIver2008) McIver, Jr. W. (2008, January 16). Intelligent City Project, NRC-IIT Project Template. (MuniWireless2007) MuniWireless.com (2007, Oct 30). 2007 Municipal Wireless State of the Market Report. http://www.muniwireless.com/article/articleview/6574/1/2/ [Accessed 31 Oct 2007]. (OASIS2006) OASIS. (2006, 2 August ). Reference Model for Service Oriented Architecture 1.0 Committee Specification 1. http://www.oasis-open.org/committees/download.php/19679/soa-rm-cs.pdf (O'Reilly2005) O'Reilly, T. What Is Web 2.0: Design Patterns and Business Models for the Next Generation of Software, 09/30/2005; http://www.oreillynet.com/pub/a/oreilly/tim/news/2005/09/30/what-is-web-20.html ,
71
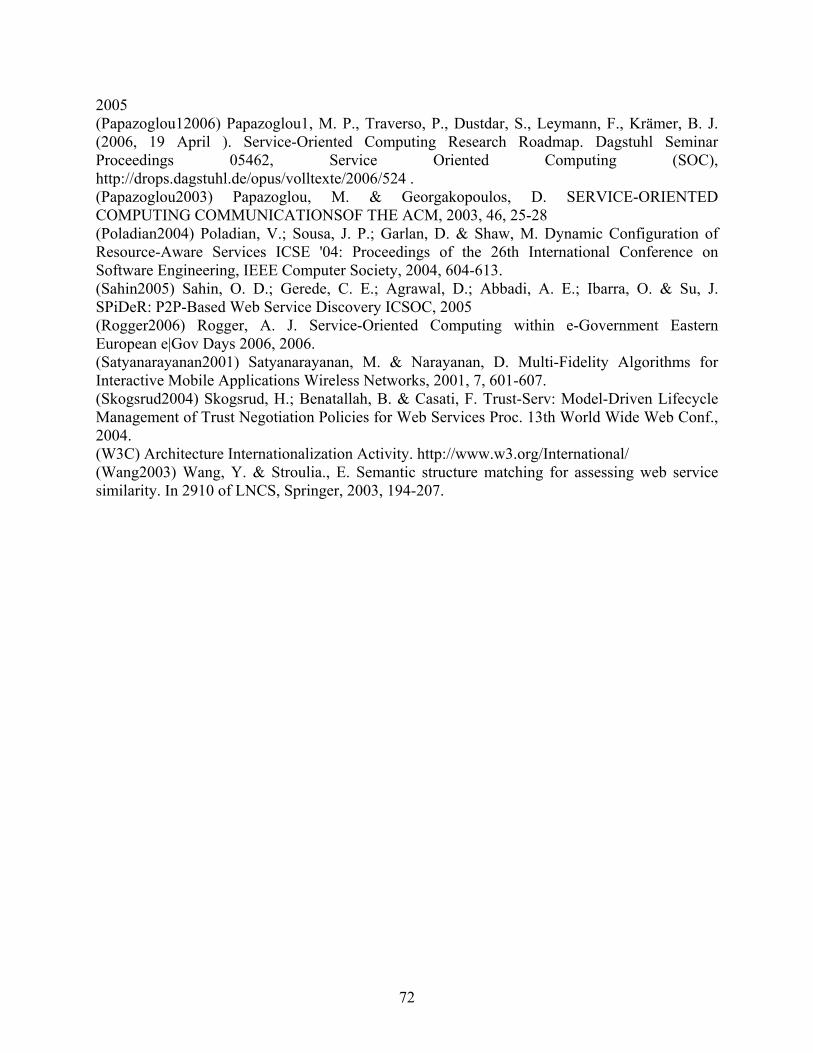
2005 (Papazoglou12006) Papazoglou1, M. P., Traverso, P., Dustdar, S., Leymann, F., Krämer, B. J. (2006, 19 April ). Service-Oriented Computing Research Roadmap. Dagstuhl Seminar Proceedings 05462, Service Oriented Computing (SOC), http://drops.dagstuhl.de/opus/volltexte/2006/524 . (Papazoglou2003) Papazoglou, M. & Georgakopoulos, D. SERVICE-ORIENTED COMPUTING COMMUNICATIONSOF THE ACM, 2003, 46, 25-28 (Poladian2004) Poladian, V.; Sousa, J. P.; Garlan, D. & Shaw, M. Dynamic Configuration of Resource-Aware Services ICSE '04: Proceedings of the 26th International Conference on Software Engineering, IEEE Computer Society, 2004, 604-613. (Sahin2005) Sahin, O. D.; Gerede, C. E.; Agrawal, D.; Abbadi, A. E.; Ibarra, O. & Su, J. SPiDeR: P2P-Based Web Service Discovery ICSOC, 2005 (Rogger2006) Rogger, A. J. Service-Oriented Computing within e-Government Eastern European e|Gov Days 2006, 2006. (Satyanarayanan2001) Satyanarayanan, M. & Narayanan, D. Multi-Fidelity Algorithms for Interactive Mobile Applications Wireless Networks, 2001, 7, 601-607. (Skogsrud2004) Skogsrud, H.; Benatallah, B. & Casati, F. Trust-Serv: Model-Driven Lifecycle Management of Trust Negotiation Policies for Web Services Proc. 13th World Wide Web Conf., 2004. (W3C) Architecture Internationalization Activity. http://www.w3.org/International/ (Wang2003) Wang, Y. & Stroulia., E. Semantic structure matching for assessing web service similarity. In 2910 of LNCS, Springer, 2003, 194-207.
72
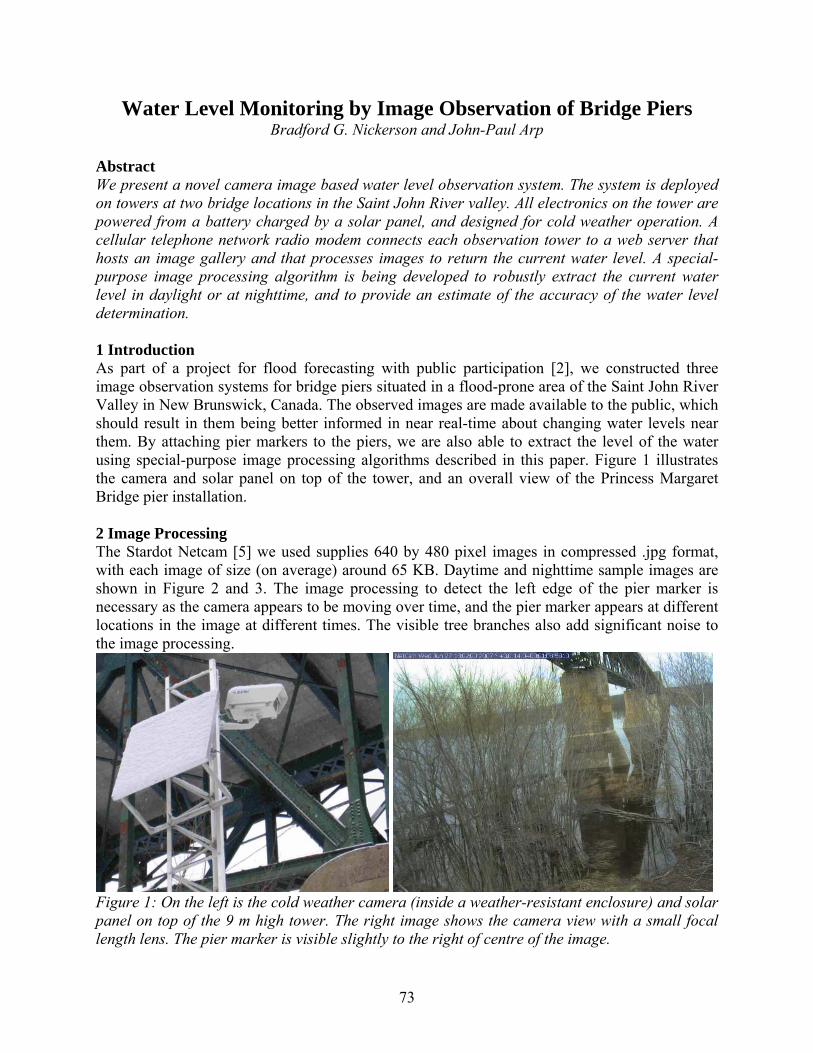
Water Level Monitoring by Image Observation of Bridge Piers Bradford G. Nickerson and John-Paul Arp
Abstract We present a novel camera image based water level observation system. The system is deployed on towers at two bridge locations in the Saint John River valley. All electronics on the tower are powered from a battery charged by a solar panel, and designed for cold weather operation. A cellular telephone network radio modem connects each observation tower to a web server that hosts an image gallery and that processes images to return the current water level. A special-purpose image processing algorithm is being developed to robustly extract the current water level in daylight or at nighttime, and to provide an estimate of the accuracy of the water level determination. 1 Introduction As part of a project for flood forecasting with public participation [2], we constructed three image observation systems for bridge piers situated in a flood-prone area of the Saint John River Valley in New Brunswick, Canada. The observed images are made available to the public, which should result in them being better informed in near real-time about changing water levels near them. By attaching pier markers to the piers, we are also able to extract the level of the water using special-purpose image processing algorithms described in this paper. Figure 1 illustrates the camera and solar panel on top of the tower, and an overall view of the Princess Margaret Bridge pier installation. 2 Image Processing The Stardot Netcam [5] we used supplies 640 by 480 pixel images in compressed .jpg format, with each image of size (on average) around 65 KB. Daytime and nighttime sample images are shown in Figure 2 and 3. The image processing to detect the left edge of the pier marker is necessary as the camera appears to be moving over time, and the pier marker appears at different locations in the image at different times. The visible tree branches also add significant noise to the image processing.
Figure 1: On the left is the cold weather camera (inside a weather-resistant enclosure) and solar panel on top of the 9 m high tower. The right image shows the camera view with a small focal length lens. The pier marker is visible slightly to the right of centre of the image.
73
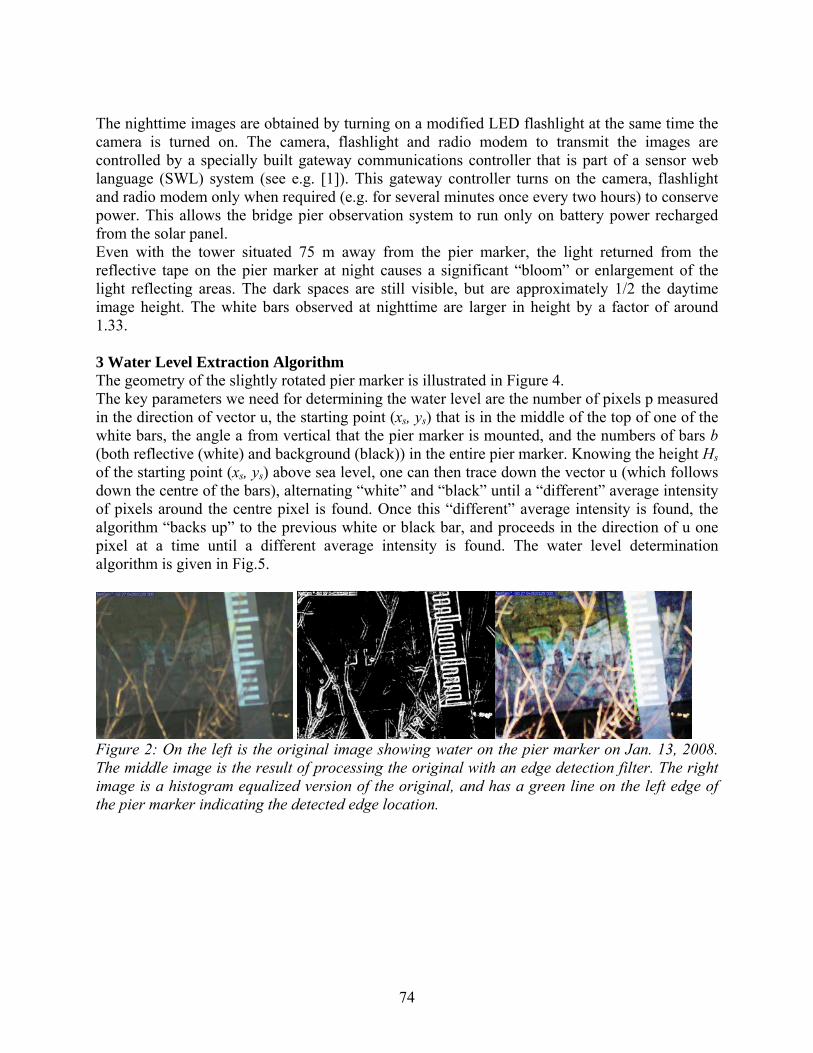
The nighttime images are obtained by turning on a modified LED flashlight at the same time the camera is turned on. The camera, flashlight and radio modem to transmit the images are controlled by a specially built gateway communications controller that is part of a sensor web language (SWL) system (see e.g. [1]). This gateway controller turns on the camera, flashlight and radio modem only when required (e.g. for several minutes once every two hours) to conserve power. This allows the bridge pier observation system to run only on battery power recharged from the solar panel. Even with the tower situated 75 m away from the pier marker, the light returned from the reflective tape on the pier marker at night causes a significant “bloom” or enlargement of the light reflecting areas. The dark spaces are still visible, but are approximately 1/2 the daytime image height. The white bars observed at nighttime are larger in height by a factor of around 1.33. 3 Water Level Extraction Algorithm The geometry of the slightly rotated pier marker is illustrated in Figure 4. The key parameters we need for determining the water level are the number of pixels p measured in the direction of vector u, the starting point (xs, ys) that is in the middle of the top of one of the white bars, the angle a from vertical that the pier marker is mounted, and the numbers of bars b (both reflective (white) and background (black)) in the entire pier marker. Knowing the height Hs of the starting point (xs, ys) above sea level, one can then trace down the vector u (which follows down the centre of the bars), alternating “white” and “black” until a “different” average intensity of pixels around the centre pixel is found. Once this “different” average intensity is found, the algorithm “backs up” to the previous white or black bar, and proceeds in the direction of u one pixel at a time until a different average intensity is found. The water level determination algorithm is given in Fig.5.
Figure 2: On the left is the original image showing water on the pier marker on Jan. 13, 2008. The middle image is the result of processing the original with an edge detection filter. The right image is a histogram equalized version of the original, and has a green line on the left edge of the pier marker indicating the detected edge location.
74

Figure 3: Nighttime images. On the left is the original image showing water on the pier marker early in the morning (shortly after midnight) of Jan. 14, 2008. The middle and right images are processed in the same way as the daytime images. In Figure 5, the factor f used to scale the final boundary location where the water intersects the pier marker is based on the average intensities It = target (water body), Ic = last determined after crossing the boundary, Ip = that one pixel before Ic in the direction of u. Factor f is computed as
where the assumption is made that It is the lowest intensity. The four cases that can arise are shown in Figure 6.
Figure 4: The geometry of the bridge pier marker image for water level extraction. p is the number of pixels in 10 cm, where 10 cm is the height of one pier marker “tooth” (which we call a “bar”), a is the angle from vertical (positive counterclockwise) that the bridge pier marker appears in the image, u is the vector running down the center of the pier marker “teeth” and v is the vector perpendicular to u.
75

4 Experimental Results So far we have been able to use the edge detection software to reliably determine where the edge of the pier marker is. This is accomplished using the Java Advanced Imaging (JAI) packages to do the basic image manipulation (see e.g. [3]). Manual observations indicate that a = 7 degrees, and p = 14.25. With p this large, k can be chosen as 25. We are continuing to work on implementing and refining the algorithm in Figure 5. We expect that with tuning, we can get the standard deviation of the height determination to be around 2 pixels. For p = 14.25 pixels per 10 cm, this would be equivalent to a standard deviation of 1.4 cm. If the pier marker appears smaller in the image (due to a different tower location or a different lens), p will also be smaller, resulting in a proportionally larger standard deviation. 5 Conclusions With help from many sources, we have designed and built a bridge pier observation system from which we can extract water level readings. The system has the added advantage of making the continuously updated images available on a web server so that the general public can see how water is rising or falling, even at night. This additional visual feedback improves on standard water level gauges that work on pressure transducers (see e.g. [4]), and will hopefully lead to improved flood event response by the public. 6 Acknowledgements This research is supported, in part, by GeoConnections, the New Brunswick Emergency Measures Organization (EMO), the UNB Faculty of Computer Science, the New Brunswick Innovation Foundation (NBIF), the Harrison McCain Foundation and MADALGO - Center for Massive Data Algorithmics
76

Figure 5: Algorithm for determining water level L from an image of a bridge pier marker. Hs is the orthometric height (m above mean sea level) of (xs, ys) and b is the number of “bars” (of black and white) in the entire pier marker. k is the number of pixels surrounding the pixel that (xs, ys) falls in, including the centre pixel containing (xs, ys). k can be 25 for bars with p ≥ 5, or 9 if p < 5. Function same(white, I, Ib, Iw) determines if the average pixel intensity I changes from its current bar average value (Ib or Iw depending on the boolean variable white.)
77
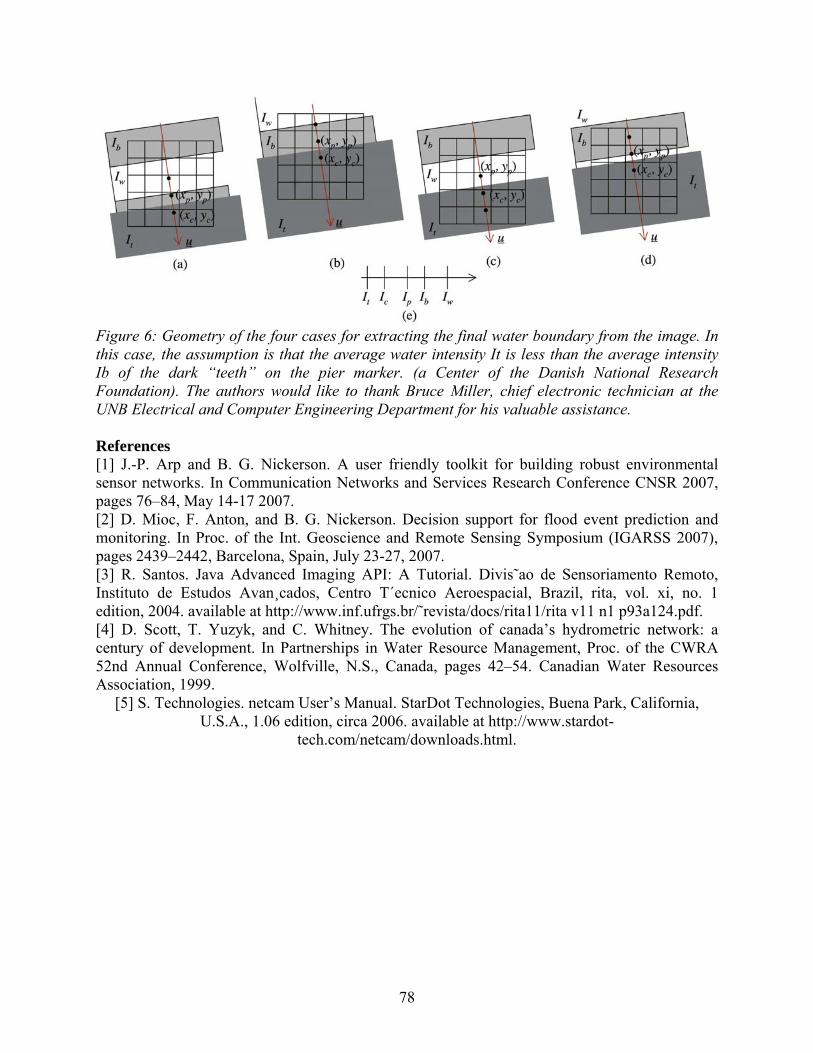
Figure 6: Geometry of the four cases for extracting the final water boundary from the image. In this case, the assumption is that the average water intensity It is less than the average intensity Ib of the dark “teeth” on the pier marker. (a Center of the Danish National Research Foundation). The authors would like to thank Bruce Miller, chief electronic technician at the UNB Electrical and Computer Engineering Department for his valuable assistance. References [1] J.-P. Arp and B. G. Nickerson. A user friendly toolkit for building robust environmental sensor networks. In Communication Networks and Services Research Conference CNSR 2007, pages 76–84, May 14-17 2007. [2] D. Mioc, F. Anton, and B. G. Nickerson. Decision support for flood event prediction and monitoring. In Proc. of the Int. Geoscience and Remote Sensing Symposium (IGARSS 2007), pages 2439–2442, Barcelona, Spain, July 23-27, 2007. [3] R. Santos. Java Advanced Imaging API: A Tutorial. Divis˜ao de Sensoriamento Remoto, Instituto de Estudos Avan¸cados, Centro T´ecnico Aeroespacial, Brazil, rita, vol. xi, no. 1 edition, 2004. available at http://www.inf.ufrgs.br/˜revista/docs/rita11/rita v11 n1 p93a124.pdf. [4] D. Scott, T. Yuzyk, and C. Whitney. The evolution of canada’s hydrometric network: a century of development. In Partnerships in Water Resource Management, Proc. of the CWRA 52nd Annual Conference, Wolfville, N.S., Canada, pages 42–54. Canadian Water Resources Association, 1999.
[5] S. Technologies. netcam User’s Manual. StarDot Technologies, Buena Park, California, U.S.A., 1.06 edition, circa 2006. available at http://www.stardot-
tech.com/netcam/downloads.html.
78
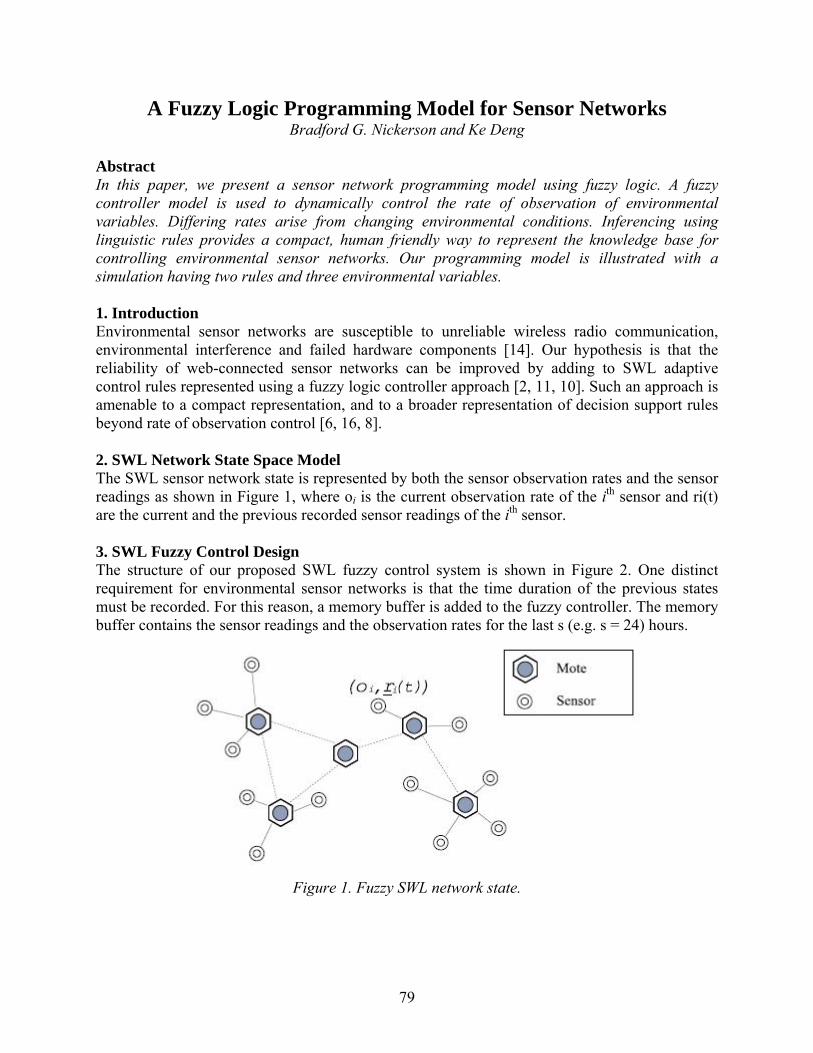
A Fuzzy Logic Programming Model for Sensor Networks Bradford G. Nickerson and Ke Deng
Abstract In this paper, we present a sensor network programming model using fuzzy logic. A fuzzy controller model is used to dynamically control the rate of observation of environmental variables. Differing rates arise from changing environmental conditions. Inferencing using linguistic rules provides a compact, human friendly way to represent the knowledge base for controlling environmental sensor networks. Our programming model is illustrated with a simulation having two rules and three environmental variables. 1. Introduction Environmental sensor networks are susceptible to unreliable wireless radio communication, environmental interference and failed hardware components [14]. Our hypothesis is that the reliability of web-connected sensor networks can be improved by adding to SWL adaptive control rules represented using a fuzzy logic controller approach [2, 11, 10]. Such an approach is amenable to a compact representation, and to a broader representation of decision support rules beyond rate of observation control [6, 16, 8]. 2. SWL Network State Space Model The SWL sensor network state is represented by both the sensor observation rates and the sensor readings as shown in Figure 1, where oi is the current observation rate of the ith sensor and ri(t) are the current and the previous recorded sensor readings of the ith sensor. 3. SWL Fuzzy Control Design The structure of our proposed SWL fuzzy control system is shown in Figure 2. One distinct requirement for environmental sensor networks is that the time duration of the previous states must be recorded. For this reason, a memory buffer is added to the fuzzy controller. The memory buffer contains the sensor readings and the observation rates for the last s (e.g. s = 24) hours.
Figure 1. Fuzzy SWL network state.
79
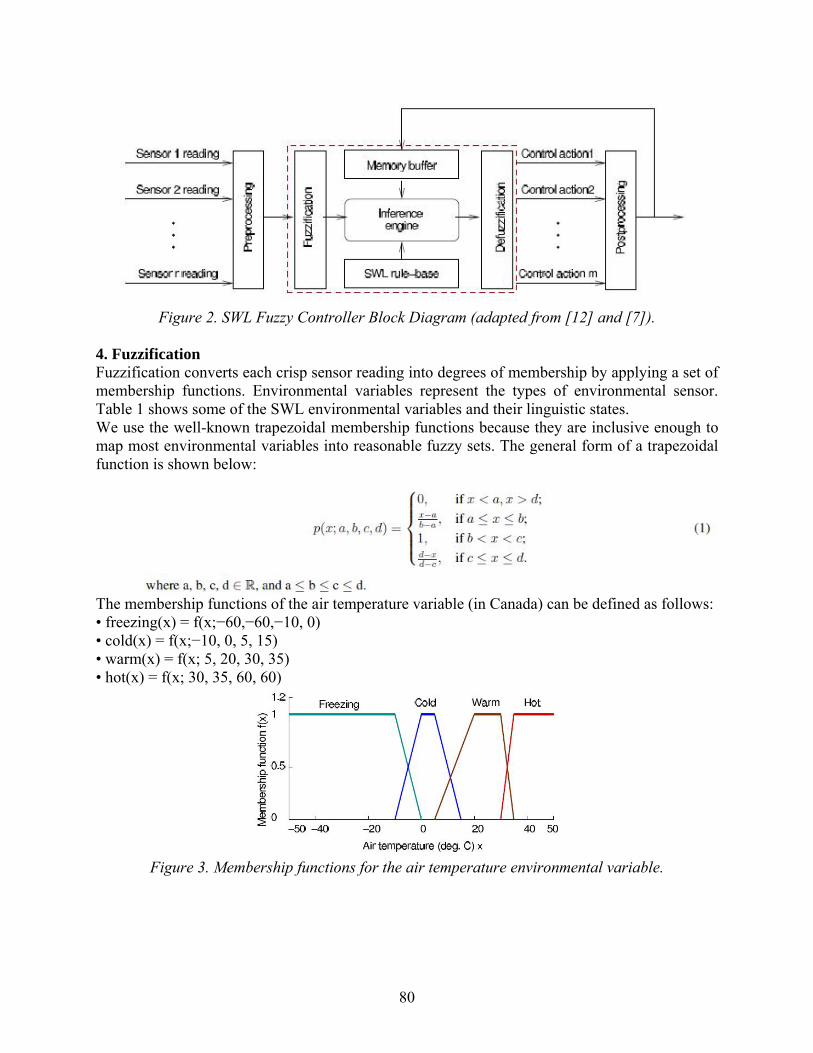
Figure 2. SWL Fuzzy Controller Block Diagram (adapted from [12] and [7]).
4. Fuzzification Fuzzification converts each crisp sensor reading into degrees of membership by applying a set of membership functions. Environmental variables represent the types of environmental sensor. Table 1 shows some of the SWL environmental variables and their linguistic states. We use the well-known trapezoidal membership functions because they are inclusive enough to map most environmental variables into reasonable fuzzy sets. The general form of a trapezoidal function is shown below:
The membership functions of the air temperature variable (in Canada) can be defined as follows: • freezing(x) = f(x;−60,−60,−10, 0) • cold(x) = f(x;−10, 0, 5, 15) • warm(x) = f(x; 5, 20, 30, 35) • hot(x) = f(x; 30, 35, 60, 60)
Figure 3. Membership functions for the air temperature environmental variable.
80
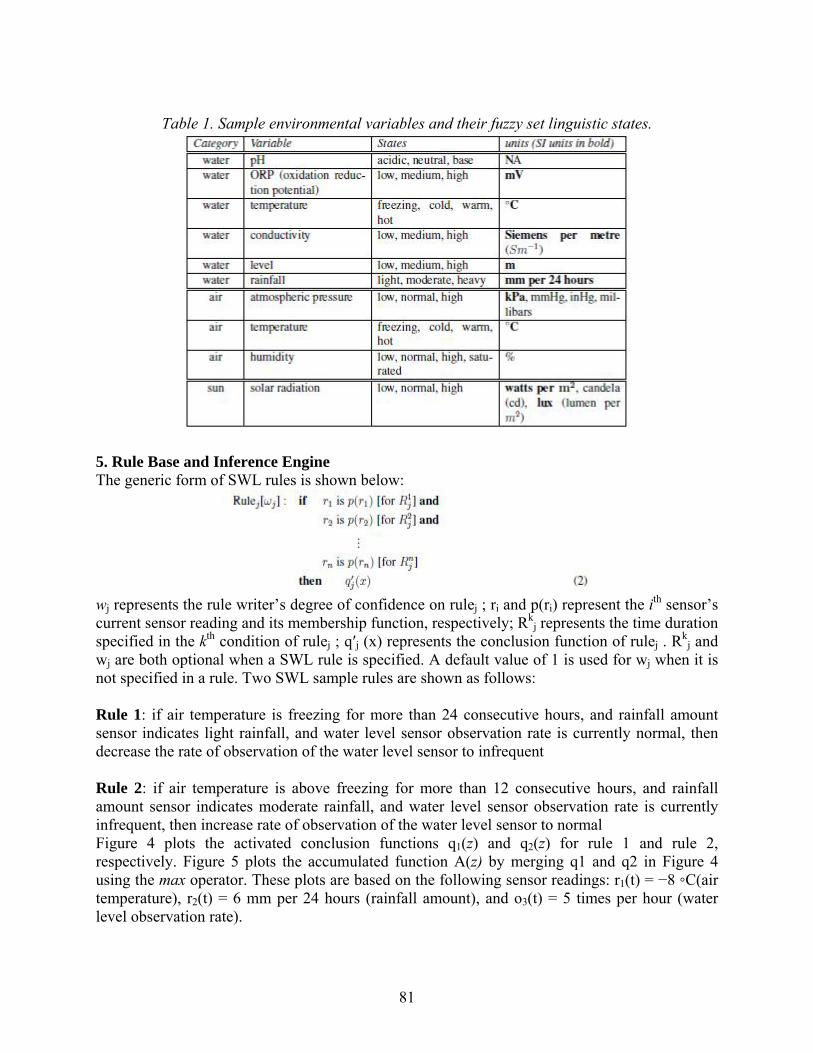
Table 1. Sample environmental variables and their fuzzy set linguistic states.
5. Rule Base and Inference Engine The generic form of SWL rules is shown below:
wj represents the rule writer’s degree of confidence on rulej ; ri and p(ri) represent the ith sensor’s current sensor reading and its membership function, respectively; Rk
j represents the time duration specified in the kth condition of rulej ; q′j (x) represents the conclusion function of rulej . Rk
j and wj are both optional when a SWL rule is specified. A default value of 1 is used for wj when it is not specified in a rule. Two SWL sample rules are shown as follows: Rule 1: if air temperature is freezing for more than 24 consecutive hours, and rainfall amount sensor indicates light rainfall, and water level sensor observation rate is currently normal, then decrease the rate of observation of the water level sensor to infrequent Rule 2: if air temperature is above freezing for more than 12 consecutive hours, and rainfall amount sensor indicates moderate rainfall, and water level sensor observation rate is currently infrequent, then increase rate of observation of the water level sensor to normal Figure 4 plots the activated conclusion functions q1(z) and q2(z) for rule 1 and rule 2, respectively. Figure 5 plots the accumulated function A(z) by merging q1 and q2 in Figure 4 using the max operator. These plots are based on the following sensor readings: r1(t) = −8 ◦C(air temperature), r2(t) = 6 mm per 24 hours (rainfall amount), and o3(t) = 5 times per hour (water level observation rate).
81
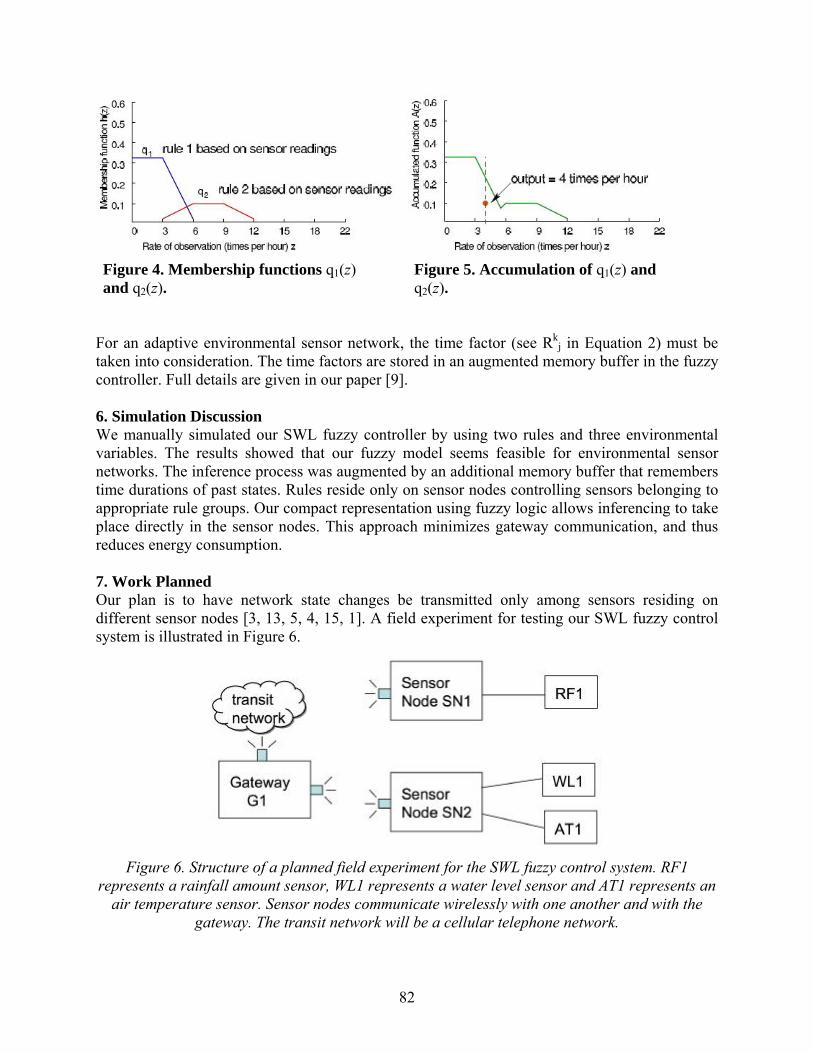
Figure 4. Membership functions q1(z) and q2(z).
Figure 5. Accumulation of q1(z) and q2(z).
For an adaptive environmental sensor network, the time factor (see Rk
j in Equation 2) must be taken into consideration. The time factors are stored in an augmented memory buffer in the fuzzy controller. Full details are given in our paper [9]. 6. Simulation Discussion We manually simulated our SWL fuzzy controller by using two rules and three environmental variables. The results showed that our fuzzy model seems feasible for environmental sensor networks. The inference process was augmented by an additional memory buffer that remembers time durations of past states. Rules reside only on sensor nodes controlling sensors belonging to appropriate rule groups. Our compact representation using fuzzy logic allows inferencing to take place directly in the sensor nodes. This approach minimizes gateway communication, and thus reduces energy consumption. 7. Work Planned Our plan is to have network state changes be transmitted only among sensors residing on different sensor nodes [3, 13, 5, 4, 15, 1]. A field experiment for testing our SWL fuzzy control system is illustrated in Figure 6.
Figure 6. Structure of a planned field experiment for the SWL fuzzy control system. RF1
represents a rainfall amount sensor, WL1 represents a water level sensor and AT1 represents an air temperature sensor. Sensor nodes communicate wirelessly with one another and with the
gateway. The transit network will be a cellular telephone network.
82
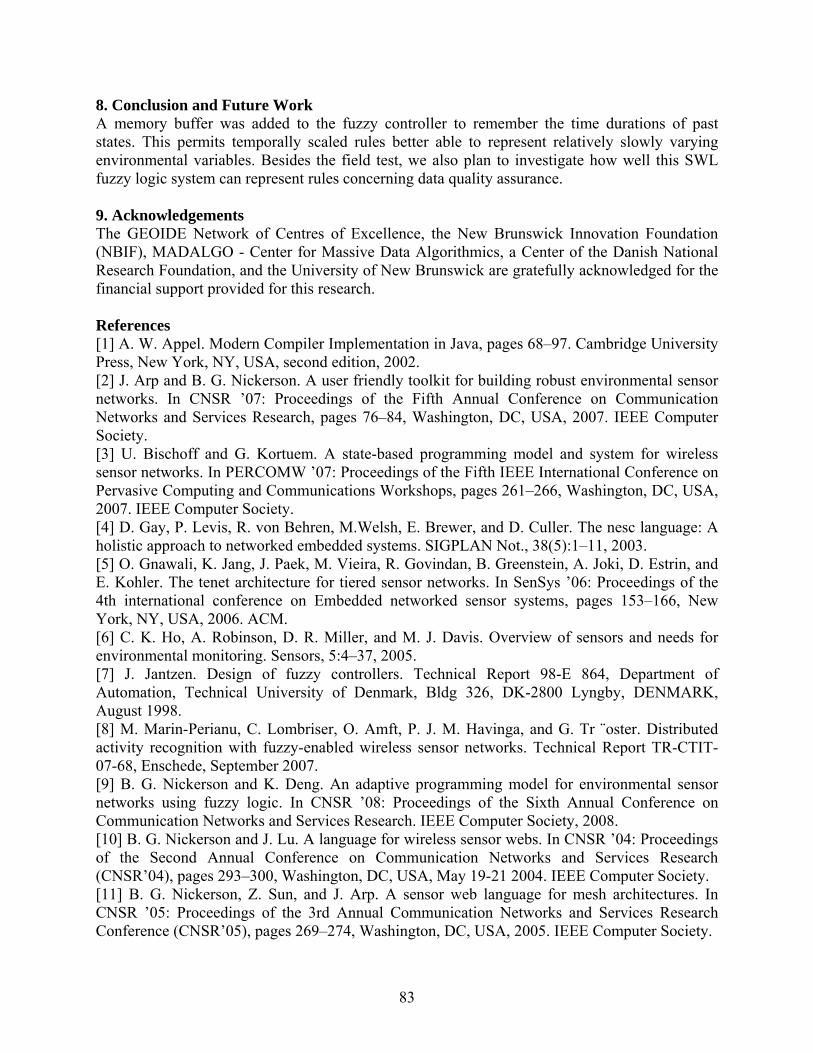
8. Conclusion and Future Work A memory buffer was added to the fuzzy controller to remember the time durations of past states. This permits temporally scaled rules better able to represent relatively slowly varying environmental variables. Besides the field test, we also plan to investigate how well this SWL fuzzy logic system can represent rules concerning data quality assurance. 9. Acknowledgements The GEOIDE Network of Centres of Excellence, the New Brunswick Innovation Foundation (NBIF), MADALGO - Center for Massive Data Algorithmics, a Center of the Danish National Research Foundation, and the University of New Brunswick are gratefully acknowledged for the financial support provided for this research. References [1] A. W. Appel. Modern Compiler Implementation in Java, pages 68–97. Cambridge University Press, New York, NY, USA, second edition, 2002. [2] J. Arp and B. G. Nickerson. A user friendly toolkit for building robust environmental sensor networks. In CNSR ’07: Proceedings of the Fifth Annual Conference on Communication Networks and Services Research, pages 76–84, Washington, DC, USA, 2007. IEEE Computer Society. [3] U. Bischoff and G. Kortuem. A state-based programming model and system for wireless sensor networks. In PERCOMW ’07: Proceedings of the Fifth IEEE International Conference on Pervasive Computing and Communications Workshops, pages 261–266, Washington, DC, USA, 2007. IEEE Computer Society. [4] D. Gay, P. Levis, R. von Behren, M.Welsh, E. Brewer, and D. Culler. The nesc language: A holistic approach to networked embedded systems. SIGPLAN Not., 38(5):1–11, 2003. [5] O. Gnawali, K. Jang, J. Paek, M. Vieira, R. Govindan, B. Greenstein, A. Joki, D. Estrin, and E. Kohler. The tenet architecture for tiered sensor networks. In SenSys ’06: Proceedings of the 4th international conference on Embedded networked sensor systems, pages 153–166, New York, NY, USA, 2006. ACM. [6] C. K. Ho, A. Robinson, D. R. Miller, and M. J. Davis. Overview of sensors and needs for environmental monitoring. Sensors, 5:4–37, 2005. [7] J. Jantzen. Design of fuzzy controllers. Technical Report 98-E 864, Department of Automation, Technical University of Denmark, Bldg 326, DK-2800 Lyngby, DENMARK, August 1998. [8] M. Marin-Perianu, C. Lombriser, O. Amft, P. J. M. Havinga, and G. Tr ¨oster. Distributed activity recognition with fuzzy-enabled wireless sensor networks. Technical Report TR-CTIT-07-68, Enschede, September 2007. [9] B. G. Nickerson and K. Deng. An adaptive programming model for environmental sensor networks using fuzzy logic. In CNSR ’08: Proceedings of the Sixth Annual Conference on Communication Networks and Services Research. IEEE Computer Society, 2008. [10] B. G. Nickerson and J. Lu. A language for wireless sensor webs. In CNSR ’04: Proceedings of the Second Annual Conference on Communication Networks and Services Research (CNSR’04), pages 293–300, Washington, DC, USA, May 19-21 2004. IEEE Computer Society. [11] B. G. Nickerson, Z. Sun, and J. Arp. A sensor web language for mesh architectures. In CNSR ’05: Proceedings of the 3rd Annual Communication Networks and Services Research Conference (CNSR’05), pages 269–274, Washington, DC, USA, 2005. IEEE Computer Society.
83
[12] K. M. Passino and S. Yurkovich. Fuzzy Control. Addison-Wesley, Menlo Park, CA, USA, 1998. [13] R. Razavi, K. Mechitov, S. Sundresh, G. Agha, and J. Perrot. Ambiance: adaptive object model-based platform for macroprogramming sensor networks. In OOPSLA ’06: Companion to the 21st ACM SIGPLAN conference on Object-oriented programming systems, languages, and applications, pages 663–664, New York, NY, USA, 2006. ACM. [14] L. Reznik and V. Kreinovich. Fuzzy and probabilistic models of association information in sensor networks. In IEEE International Conference on Fuzzy Systems (FUZZ-IEEE), volume 1, pages 185–189, Budapest, Hungary, July 25-29 2004. [15] R. W. Sebesta. Concept of Programming Languages. Addison-Wesley Longman Inc., Feburary 1999. [16] L. A. Zadeh. Fuzzy sets. Information and Control, 8:338–353, 1965.
84

Efficient Search of Path-Constrained Moving Objects Bradford G. Nickerson and Thuy Thi Thu Le
Abstract We present a spatio-temporal data structure, called the Graph Strip Tree (GStree) for indexing moving objects constrained to move on a planar graph. The GStree is designed to efficiently answer range queries about the current or past positions of moving objects. 1 Introduction One of the biggest challenges in spatial and spatio-temporal databases is how to improve the response time for query processing of moving objects, called continuous query processing (e.g. [5], [4]). Saltenis et al [6] divide the problem of indexing the positions of continuously moving objects into two categories. Queries about the current and anticipated future positions of moving objects define one category. Such queries are likely to be used in real-time and near real-time systems. Applications such as traffic control, emergency response and navigation while driving fall into this category. The second category focuses on the history of the positions of moving objects. Queries on historical data are likely to be used in applications such as planning, event reconstruction and training. Our research addresses the latter category. We assume there are m+1 positions for each moving object defined on m equally spaced time intervals in the time domain [0, T]. In addition, we assume that the object positions are restricted to move on a planar graph (possibly disconnected) defined by its edges E and vertices V. Figure 1 shows a small part of a test road network. We support two types of queries; stabbing queries defined as Q1 = (R, tq) to find the K moving objects intersecting rectangle R at time tq, and rectangle queries defined as Q2 = (R, [t1, t2]) to find the K moving objects intersecting rectangle R at any time during time interval [t1, t2]. Both query types can be counting queries (report only K) or reporting queries (report the identity of the K moving objects satisfying the query). Recently, one approach to indexing the history of the positions of moving objects is MON-tree [2]. The MON-tree data structure consists of two R-trees and a hash table. 2 The Primary Data Structure We assume that N objects are constrained to move on a planar graph G with E edges and V vertices. The graph can be disconnected, corresponding, for example, to disconnected road networks in a jurisdiction with islands or remote areas (as in Figure 1). The primary data structure used for indexing the planar graph is called the graph strip tree, or GStree for short. The GStree is based on the strip tree [1], but it is generalized to allow for indexing collections of strip trees representing a planar graph. Figure 2 illustrates a planar graph with V = E = 4. Figure 3 illustrates the corresponding GStree arising from the planar graph in Figure 2.
85
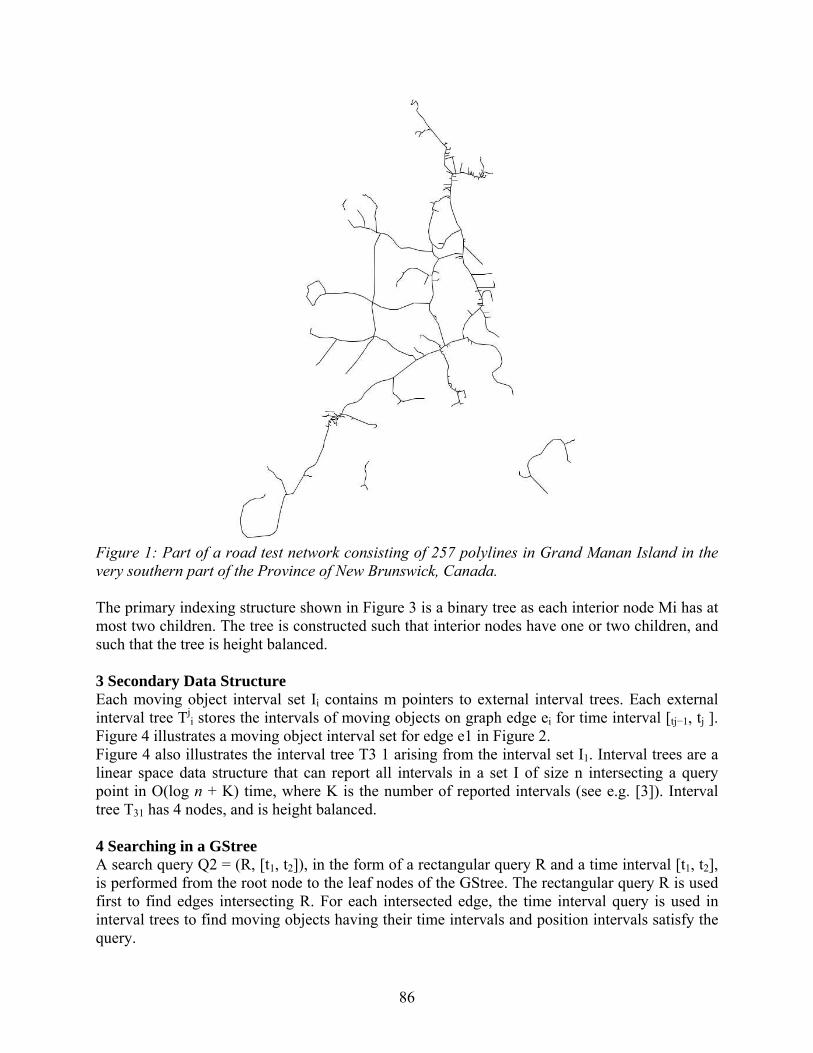
Figure 1: Part of a road test network consisting of 257 polylines in Grand Manan Island in the very southern part of the Province of New Brunswick, Canada. The primary indexing structure shown in Figure 3 is a binary tree as each interior node Mi has at most two children. The tree is constructed such that interior nodes have one or two children, and such that the tree is height balanced. 3 Secondary Data Structure Each moving object interval set Ii contains m pointers to external interval trees. Each external interval tree Tj
i stores the intervals of moving objects on graph edge ei for time interval [tj−1, tj ]. Figure 4 illustrates a moving object interval set for edge e1 in Figure 2. Figure 4 also illustrates the interval tree T3 1 arising from the interval set I1. Interval trees are a linear space data structure that can report all intervals in a set I of size n intersecting a query point in O(log n + K) time, where K is the number of reported intervals (see e.g. [3]). Interval tree T31 has 4 nodes, and is height balanced. 4 Searching in a GStree A search query Q2 = (R, [t1, t2]), in the form of a rectangular query R and a time interval [t1, t2], is performed from the root node to the leaf nodes of the GStree. The rectangular query R is used first to find edges intersecting R. For each intersected edge, the time interval query is used in interval trees to find moving objects having their time intervals and position intervals satisfy the query.
86
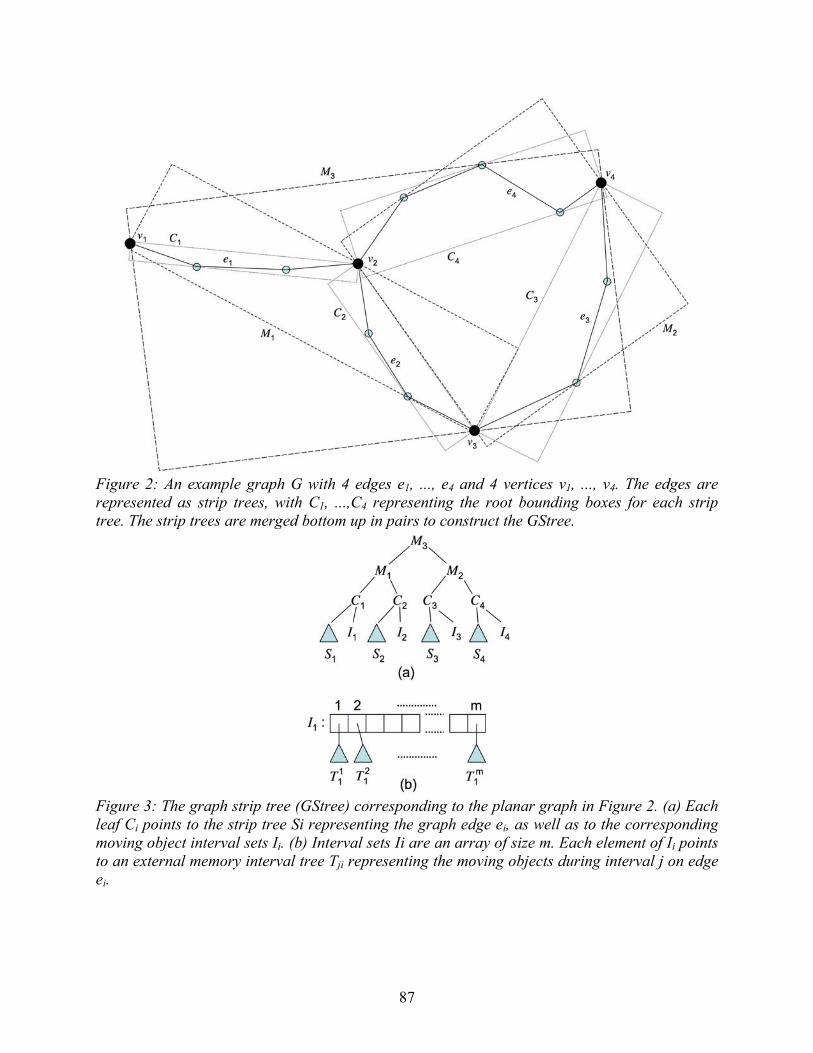
Figure 2: An example graph G with 4 edges e1, ..., e4 and 4 vertices v1, ..., v4. The edges are represented as strip trees, with C1, ...,C4 representing the root bounding boxes for each strip tree. The strip trees are merged bottom up in pairs to construct the GStree.
Figure 3: The graph strip tree (GStree) corresponding to the planar graph in Figure 2. (a) Each leaf Ci points to the strip tree Si representing the graph edge ei, as well as to the corresponding moving object interval sets Ii. (b) Interval sets Ii are an array of size m. Each element of Ii points to an external memory interval tree Tji representing the moving objects during interval j on edge ei.
87
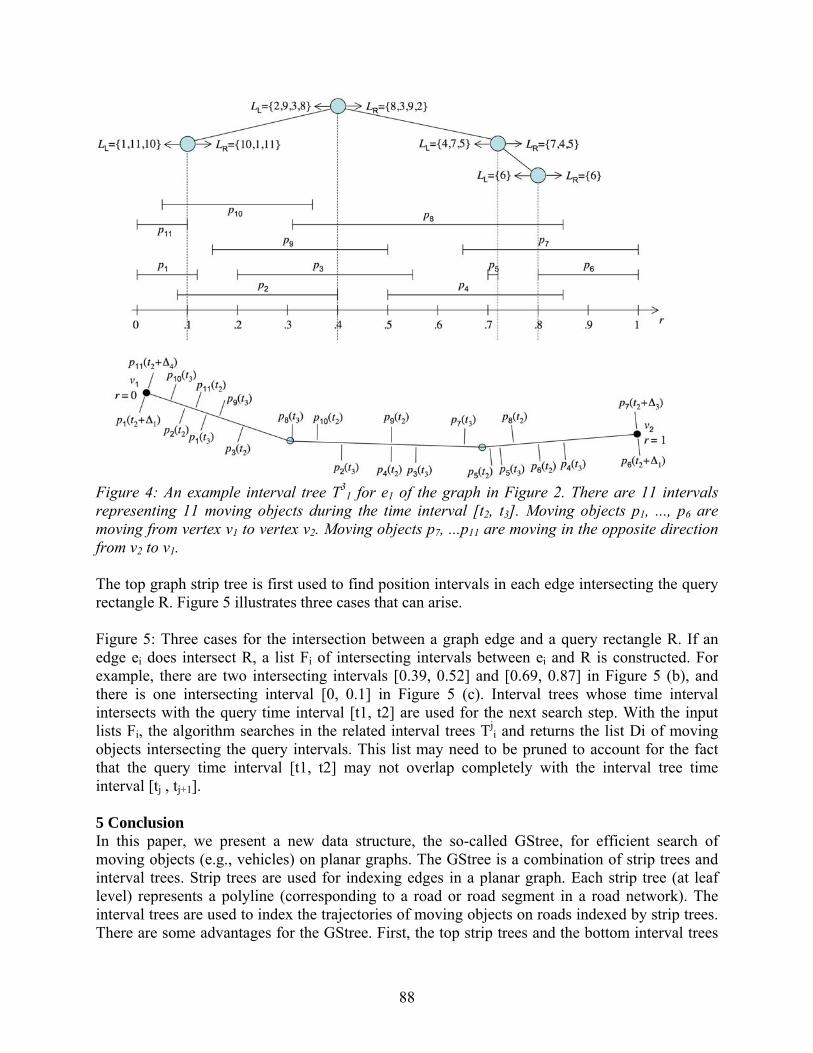
Figure 4: An example interval tree T3
1 for e1 of the graph in Figure 2. There are 11 intervals representing 11 moving objects during the time interval [t2, t3]. Moving objects p1, ..., p6 are moving from vertex v1 to vertex v2. Moving objects p7, ...p11 are moving in the opposite direction from v2 to v1. The top graph strip tree is first used to find position intervals in each edge intersecting the query rectangle R. Figure 5 illustrates three cases that can arise. Figure 5: Three cases for the intersection between a graph edge and a query rectangle R. If an edge ei does intersect R, a list Fi of intersecting intervals between ei and R is constructed. For example, there are two intersecting intervals [0.39, 0.52] and [0.69, 0.87] in Figure 5 (b), and there is one intersecting interval [0, 0.1] in Figure 5 (c). Interval trees whose time interval intersects with the query time interval [t1, t2] are used for the next search step. With the input lists Fi, the algorithm searches in the related interval trees Tj
i and returns the list Di of moving objects intersecting the query intervals. This list may need to be pruned to account for the fact that the query time interval [t1, t2] may not overlap completely with the interval tree time interval [tj , tj+1]. 5 Conclusion In this paper, we present a new data structure, the so-called GStree, for efficient search of moving objects (e.g., vehicles) on planar graphs. The GStree is a combination of strip trees and interval trees. Strip trees are used for indexing edges in a planar graph. Each strip tree (at leaf level) represents a polyline (corresponding to a road or road segment in a road network). The interval trees are used to index the trajectories of moving objects on roads indexed by strip trees. There are some advantages for the GStree. First, the top strip trees and the bottom interval trees
88
are independent; thus, we can update one of them without affecting the others. For example, one can update interval trees without changing the strip tree indexing for edges, or update a strip tree when an edge changes, without affecting other strip trees (at leaf level). Second, since moving objects on a graph edge belong to a strip tree, we can easily answer queries which count moving objects on a specific edge; for example, how many vehicles move on a specific road. 6 Acknowledgements This research is supported, in part, by the Natural Sciences and Engineering Research Council (NSERC) of Canada, the UNB Faculty of Computer Science, the Harrison McCain Foundation, MADALGO - Center for Massive Data Algorithmics (a Center of the Danish National Research Foundation) and the government of Vietnam. References [1] D. H. Ballard. Strip trees: a hierarchical representation for curves. Communications of ACM, 24(5):310–321, 1981. [2] V. T. de Almeida and R. H. G¨uting. Indexing the trajectories of moving objects in networks. GeoInformatica, 9(1):33–60, 2005. [3] M. de Berg, M. van Kreveld, M. Overmars, and O. Schwarzkopf. Computational Geometry Algorithms and Applications. Springer-Verlag, 2000. [4] J. Ni and C. V. Ravishankar. Indexing spatio-temporal trajectories with efficient polynomial approximations. IEEE Transactions on Knowledge and Data Engineering, 19(5):663–678, May 2007. [5] J. F. Roddick, M. J. Egenhofer, E. G. Hoel, D. Papadias, and B. Salzberg. Spatial, temporal and spatio-temporal databases - hot issues and directions for PhD research. SIGMOD Record, 33(2):126–131, June, 2004. [6] S. Saltenis, C. S. Jensen, S. T. Leutenegger, and M. A. Lopez. Indexing the positions of continuously moving objects. In SIGMOD Conference, pages 331–342, Dallas, Texas, United States, May 15 - 18, 2000.
89
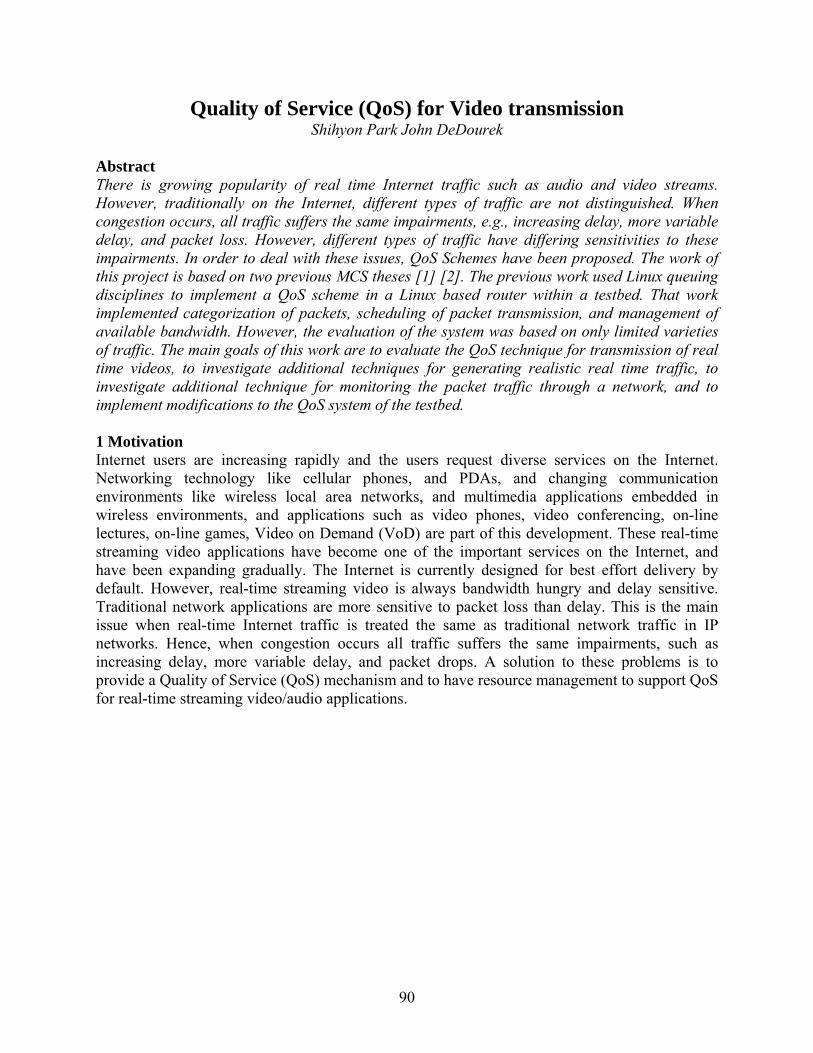
Quality of Service (QoS) for Video transmission Shihyon Park John DeDourek
Abstract There is growing popularity of real time Internet traffic such as audio and video streams. However, traditionally on the Internet, different types of traffic are not distinguished. When congestion occurs, all traffic suffers the same impairments, e.g., increasing delay, more variable delay, and packet loss. However, different types of traffic have differing sensitivities to these impairments. In order to deal with these issues, QoS Schemes have been proposed. The work of this project is based on two previous MCS theses [1] [2]. The previous work used Linux queuing disciplines to implement a QoS scheme in a Linux based router within a testbed. That work implemented categorization of packets, scheduling of packet transmission, and management of available bandwidth. However, the evaluation of the system was based on only limited varieties of traffic. The main goals of this work are to evaluate the QoS technique for transmission of real time videos, to investigate additional techniques for generating realistic real time traffic, to investigate additional technique for monitoring the packet traffic through a network, and to implement modifications to the QoS system of the testbed. 1 Motivation Internet users are increasing rapidly and the users request diverse services on the Internet. Networking technology like cellular phones, and PDAs, and changing communication environments like wireless local area networks, and multimedia applications embedded in wireless environments, and applications such as video phones, video conferencing, on-line lectures, on-line games, Video on Demand (VoD) are part of this development. These real-time streaming video applications have become one of the important services on the Internet, and have been expanding gradually. The Internet is currently designed for best effort delivery by default. However, real-time streaming video is always bandwidth hungry and delay sensitive. Traditional network applications are more sensitive to packet loss than delay. This is the main issue when real-time Internet traffic is treated the same as traditional network traffic in IP networks. Hence, when congestion occurs all traffic suffers the same impairments, such as increasing delay, more variable delay, and packet drops. A solution to these problems is to provide a Quality of Service (QoS) mechanism and to have resource management to support QoS for real-time streaming video/audio applications.
90
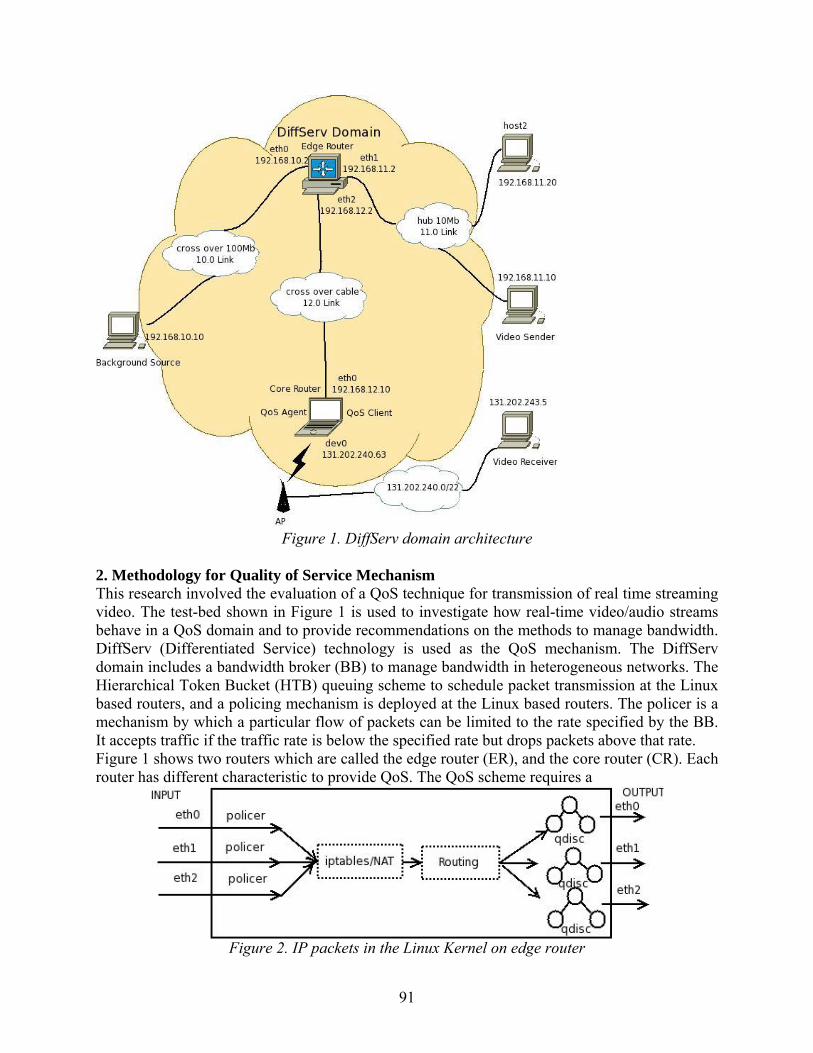
Figure 1. DiffServ domain architecture
2. Methodology for Quality of Service Mechanism This research involved the evaluation of a QoS technique for transmission of real time streaming video. The test-bed shown in Figure 1 is used to investigate how real-time video/audio streams behave in a QoS domain and to provide recommendations on the methods to manage bandwidth. DiffServ (Differentiated Service) technology is used as the QoS mechanism. The DiffServ domain includes a bandwidth broker (BB) to manage bandwidth in heterogeneous networks. The Hierarchical Token Bucket (HTB) queuing scheme to schedule packet transmission at the Linux based routers, and a policing mechanism is deployed at the Linux based routers. The policer is a mechanism by which a particular flow of packets can be limited to the rate specified by the BB. It accepts traffic if the traffic rate is below the specified rate but drops packets above that rate. Figure 1 shows two routers which are called the edge router (ER), and the core router (CR). Each router has different characteristic to provide QoS. The QoS scheme requires a
Figure 2. IP packets in the Linux Kernel on edge router
91
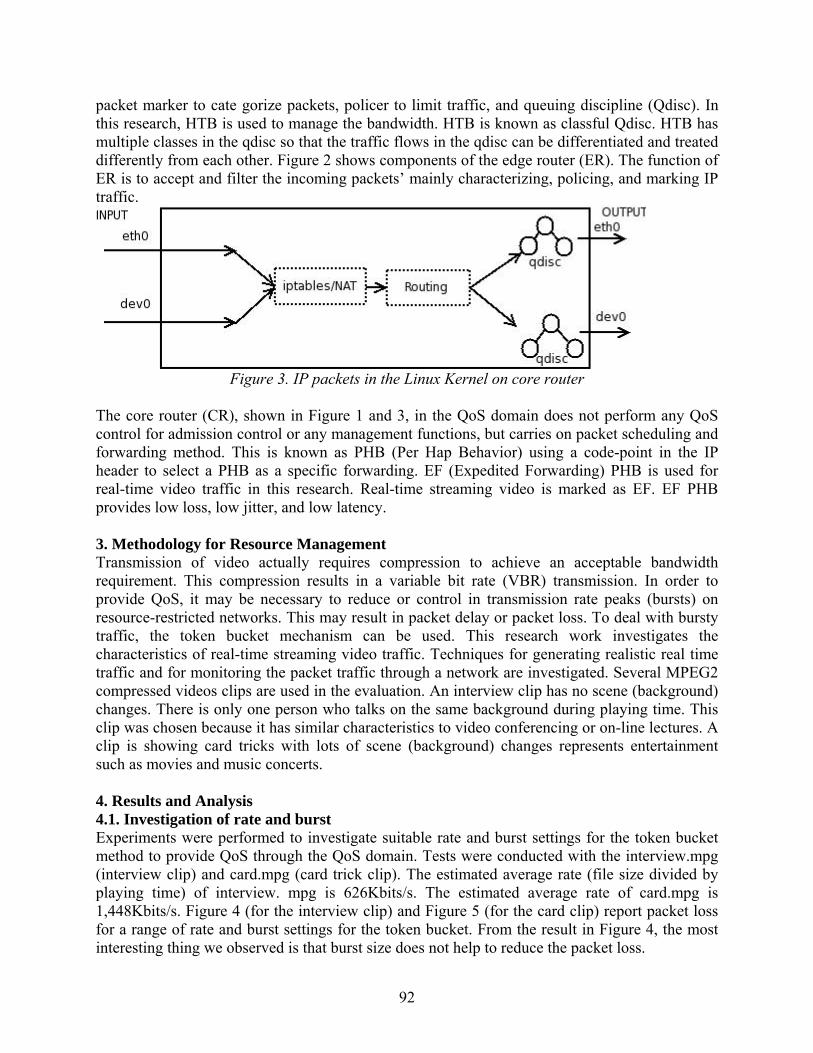
packet marker to cate gorize packets, policer to limit traffic, and queuing discipline (Qdisc). In this research, HTB is used to manage the bandwidth. HTB is known as classful Qdisc. HTB has multiple classes in the qdisc so that the traffic flows in the qdisc can be differentiated and treated differently from each other. Figure 2 shows components of the edge router (ER). The function of ER is to accept and filter the incoming packets’ mainly characterizing, policing, and marking IP traffic.
Figure 3. IP packets in the Linux Kernel on core router
The core router (CR), shown in Figure 1 and 3, in the QoS domain does not perform any QoS control for admission control or any management functions, but carries on packet scheduling and forwarding method. This is known as PHB (Per Hap Behavior) using a code-point in the IP header to select a PHB as a specific forwarding. EF (Expedited Forwarding) PHB is used for real-time video traffic in this research. Real-time streaming video is marked as EF. EF PHB provides low loss, low jitter, and low latency. 3. Methodology for Resource Management Transmission of video actually requires compression to achieve an acceptable bandwidth requirement. This compression results in a variable bit rate (VBR) transmission. In order to provide QoS, it may be necessary to reduce or control in transmission rate peaks (bursts) on resource-restricted networks. This may result in packet delay or packet loss. To deal with bursty traffic, the token bucket mechanism can be used. This research work investigates the characteristics of real-time streaming video traffic. Techniques for generating realistic real time traffic and for monitoring the packet traffic through a network are investigated. Several MPEG2 compressed videos clips are used in the evaluation. An interview clip has no scene (background) changes. There is only one person who talks on the same background during playing time. This clip was chosen because it has similar characteristics to video conferencing or on-line lectures. A clip is showing card tricks with lots of scene (background) changes represents entertainment such as movies and music concerts. 4. Results and Analysis 4.1. Investigation of rate and burst Experiments were performed to investigate suitable rate and burst settings for the token bucket method to provide QoS through the QoS domain. Tests were conducted with the interview.mpg (interview clip) and card.mpg (card trick clip). The estimated average rate (file size divided by playing time) of interview. mpg is 626Kbits/s. The estimated average rate of card.mpg is 1,448Kbits/s. Figure 4 (for the interview clip) and Figure 5 (for the card clip) report packet loss for a range of rate and burst settings for the token bucket. From the result in Figure 4, the most interesting thing we observed is that burst size does not help to reduce the packet loss.
92
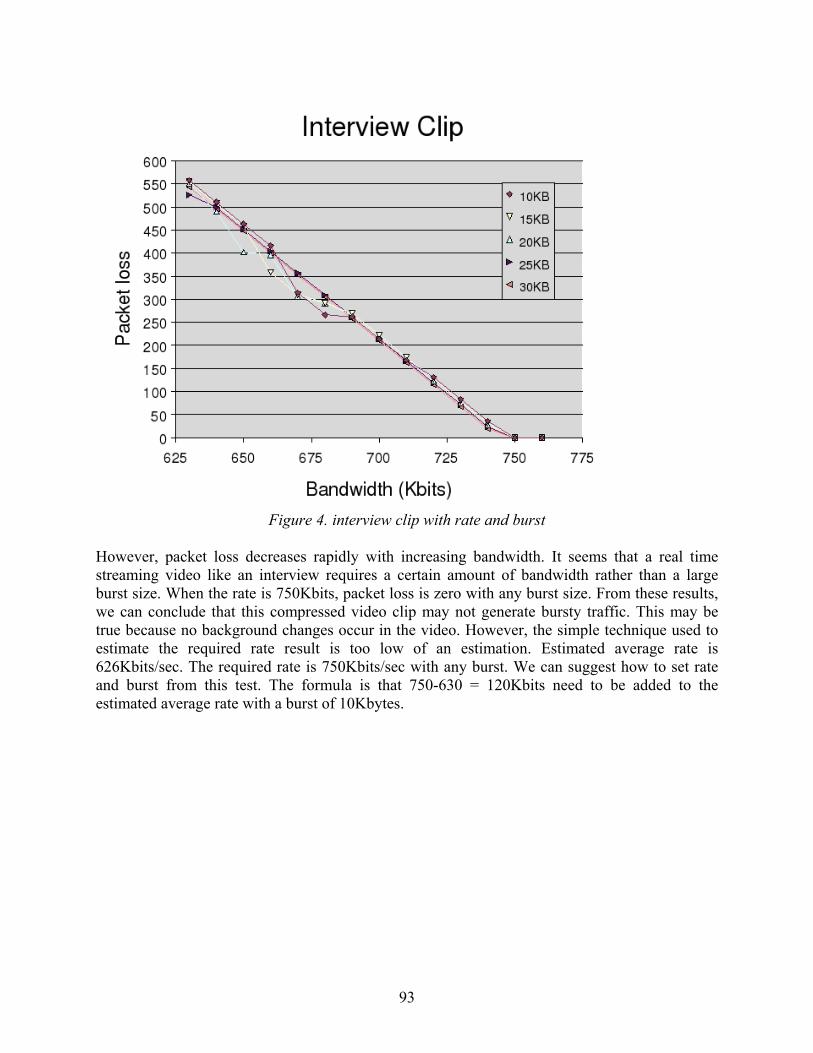
Figure 4. interview clip with rate and burst
However, packet loss decreases rapidly with increasing bandwidth. It seems that a real time streaming video like an interview requires a certain amount of bandwidth rather than a large burst size. When the rate is 750Kbits, packet loss is zero with any burst size. From these results, we can conclude that this compressed video clip may not generate bursty traffic. This may be true because no background changes occur in the video. However, the simple technique used to estimate the required rate result is too low of an estimation. Estimated average rate is 626Kbits/sec. The required rate is 750Kbits/sec with any burst. We can suggest how to set rate and burst from this test. The formula is that 750-630 = 120Kbits need to be added to the estimated average rate with a burst of 10Kbytes.
93
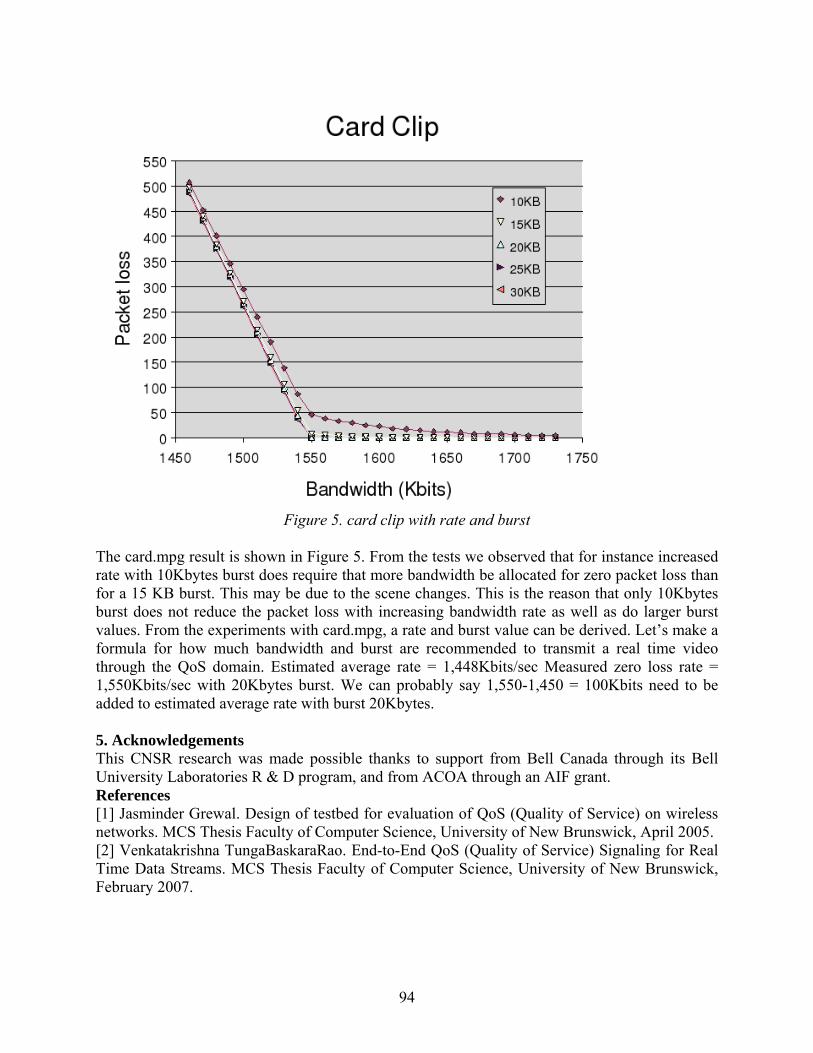
Figure 5. card clip with rate and burst
The card.mpg result is shown in Figure 5. From the tests we observed that for instance increased rate with 10Kbytes burst does require that more bandwidth be allocated for zero packet loss than for a 15 KB burst. This may be due to the scene changes. This is the reason that only 10Kbytes burst does not reduce the packet loss with increasing bandwidth rate as well as do larger burst values. From the experiments with card.mpg, a rate and burst value can be derived. Let’s make a formula for how much bandwidth and burst are recommended to transmit a real time video through the QoS domain. Estimated average rate = 1,448Kbits/sec Measured zero loss rate = 1,550Kbits/sec with 20Kbytes burst. We can probably say 1,550-1,450 = 100Kbits need to be added to estimated average rate with burst 20Kbytes. 5. Acknowledgements This CNSR research was made possible thanks to support from Bell Canada through its Bell University Laboratories R & D program, and from ACOA through an AIF grant. References [1] Jasminder Grewal. Design of testbed for evaluation of QoS (Quality of Service) on wireless networks. MCS Thesis Faculty of Computer Science, University of New Brunswick, April 2005. [2] Venkatakrishna TungaBaskaraRao. End-to-End QoS (Quality of Service) Signaling for Real Time Data Streams. MCS Thesis Faculty of Computer Science, University of New Brunswick, February 2007.
94
Prediction of Regulatory Networks for Non-Model Organisms Rachita Sharma, Patricia Evans, Virendra Bhavsar
Abstract A regulatory network of an organism is represented by a set of genes and their regulatory relationships, which indicate how genes affect production of other gene products. We are developing a system to predict the regulatory relationships of a non-model organism, about which less information is known, using information about the regulatory relationships of a more thoroughly investigated model organism. Different sets of genes, specifically transcription factors and target genes, that act as regulatory elements are identified in this research for the non-model organism using three and four methods, respectively, based on different tools and databases used. We devised a method to predict a regulatory network for the target genome using these set of genes and available regulatory network of the source genome. Various experiments are conducted to test and analyze the methods used for identification of regulatory elements for the target genome. Yeast and Arabidopsis thaliana are used as the source and target genome, respectively, in these experiments. For the mapped transcription factors, the results are analyzed by confirming if the predicted transcription factors are actually annotated transcription factors for the target genome and are mapped as the correct type of transcription factors from the source genome. The results indicate that the method for mapping transcription factors using similar protein domain families has better performance over the other two methods using sequence similarity and similar protein domain sub-families, and that the predicted transcription factors determined are mapped with correct type from the source genome. 1 Motivation The determination of regulatory pathways from available data is one of the major challenges in bioinformatics research. The function of a gene in any genome is regulated (inhibited or activated) by another gene or a combination of other genes [6]. These regulatory relationships between genes and the complete regulatory network for a genome are of great interest to biologists. A large amount of experimental data is required to infer regulatory pathways, and similarity in regulatory relationships between related organisms can be useful. A number of methods have been used to construct gene regulatory pathways, including Boolean networks [1], Bayesian networks [3], hybrid Petri nets [7], and differential equation models [4]. The advantage of using Boolean networks [1] is that they are rulebased and computationally simple, but it is unable to represent some known behaviors like negative feedback loops and other rules that can be represented by continuous models. The methods using Bayesian networks may work well for small size networks not for the actual large regulatory networks [3]. Bayesian networks have many parameters, require huge amounts of data for reliable network inference and cannot represent the existence of loops. A large amount of data is required for accurate network prediction. All of the previously mentioned methods use only gene expression data, consisting of expression levels of thousands of genes in different experiments. This data is affected by noise and experimental errors, which makes it difficult to determine the actual regulatory relationships, and they do not work well for large actual regulatory networks. The direction of inhibition/activation between the co-regulated genes is also difficult to decide using only gene expression data. Other available related biological data, such as protein-protein interaction data, promoter and binding site data, can be used as well to determine more accurate regulatory relationships. Some of the recent methods [5] have used combinations of these types of data but
95
have not used all of them together, and many of the methods used work well for small example networks but not for larger actual regulatory networks. Some organisms, such as yeast, Arabidopsis thaliana and fruit fly, are being investigated thoroughly by the biologists as model organisms. There is a large amount of biological data available for model organisms, making it easier to construct regulatory networks using one of the available methods mentioned above, but that is not the case for non-model organisms. As there is not much data available for non-model organisms, transferring some biological knowledge (genes and their regulatory relationships) from the regulatory network of a closely related organism can be very useful. A system thus needs to be developed to use the biological knowledge of the two organisms from various available databases. The system should be able to deal with huge amounts of different types of data with noise, and should be practically applicable for the construction of large regulatory networks. In this context, the main objective of this work is to use existing pathways of model organisms, together with diverse biological data for both organisms, to construct partial or complete regulatory networks for a non-model organism. This paper investigates how accurately regulatory relationships can be mapped between organisms. 2 Methodology Mapping a regulatory network from the source genome to the target genome involves identifying similar regulatory relationships in the target genome. The first step in this research is to identify similar regulatory elements in the target genome that are involved in transcription regulation. These regulatory elements consist of transcription factors and target genes that are represented as nodes in a regulatory network. A regulatory relationship is a link in the regulatory network between a transcription factor and a target gene representing the type of regulation. In this research, we base similarity between two regulatory relationships on many criteria. These criteria include functional similarity of transcription factors and similar active binding site regions in the target genes to which these transcription factors bind. The transcription factors in a pair of similar regulatory relationships should be functionally similar so they regulate and bind to similar binding site regions. The target genes in a pair of similar regulatory relationships should have similar binding site regions so that the genes can be regulated and bound by similar transcription factors and have the same type of regulation. The tools and databases used in this research to map regulatory elements consist of the sequence similarity search tool BLAST [8], the protein domains identifier tool InterProScan [9], the Nucleosomes Position Prediction tool [2]. the transcription factor database, regulatory network data and transcription factor binding site motif data of the source genome, and the nucleotide sequence data, protein sequence data and promoter sequence data of the target genome. We devised a method for mapping the regulatory network based on different databases used. The databases used to map regulatory relationships in this research consists of: the regulatory network of the source genome; the transcription factor and target gene data identified for the target genome; the transcription factor binding site motif data of the source genome; the nucleotide sequences of the source and target genome; and the gene expression data of the target genome. The BLAST tool [8] is used to find similar nucleotide or protein sequences that possibly may have similar function. The InterProScan tool [9] is used to find protein domains in the protein sequences and groups them into similar families and sub-families. The Nucleosomes Position Prediction tool [2] is used to predict the position of the nucleosomes that tends to control transcription based on their position in the nucleotide sequences.
96
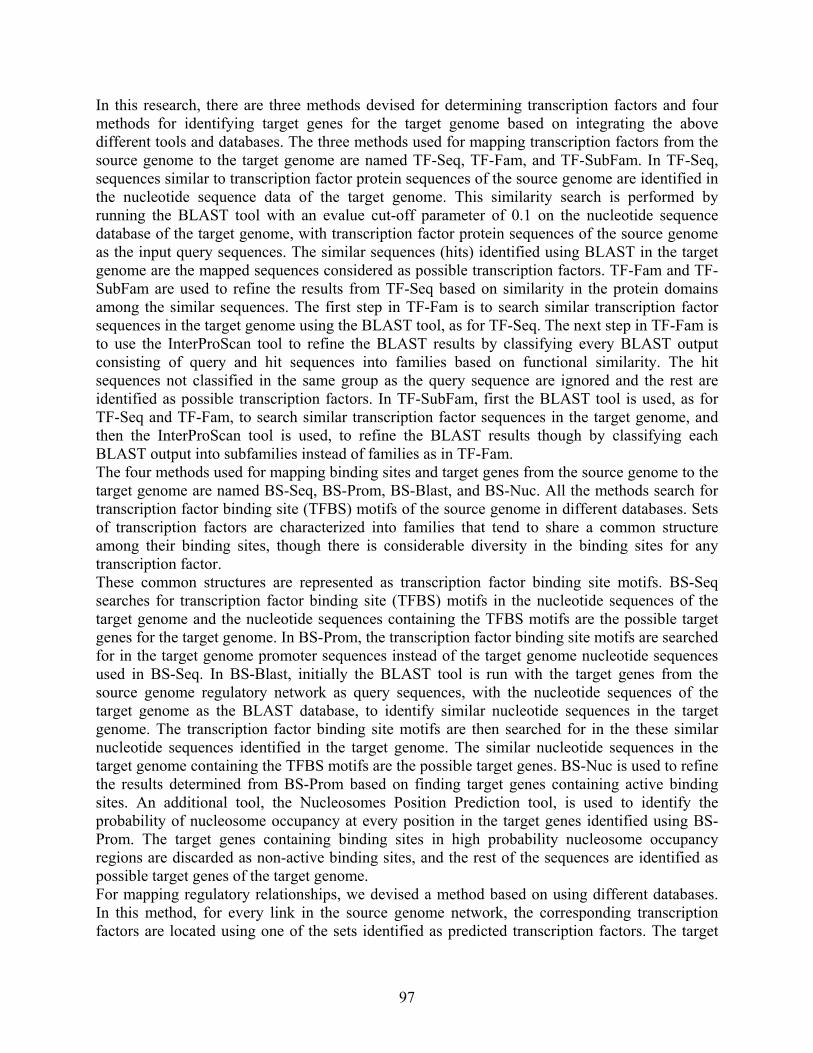
In this research, there are three methods devised for determining transcription factors and four methods for identifying target genes for the target genome based on integrating the above different tools and databases. The three methods used for mapping transcription factors from the source genome to the target genome are named TF-Seq, TF-Fam, and TF-SubFam. In TF-Seq, sequences similar to transcription factor protein sequences of the source genome are identified in the nucleotide sequence data of the target genome. This similarity search is performed by running the BLAST tool with an evalue cut-off parameter of 0.1 on the nucleotide sequence database of the target genome, with transcription factor protein sequences of the source genome as the input query sequences. The similar sequences (hits) identified using BLAST in the target genome are the mapped sequences considered as possible transcription factors. TF-Fam and TF-SubFam are used to refine the results from TF-Seq based on similarity in the protein domains among the similar sequences. The first step in TF-Fam is to search similar transcription factor sequences in the target genome using the BLAST tool, as for TF-Seq. The next step in TF-Fam is to use the InterProScan tool to refine the BLAST results by classifying every BLAST output consisting of query and hit sequences into families based on functional similarity. The hit sequences not classified in the same group as the query sequence are ignored and the rest are identified as possible transcription factors. In TF-SubFam, first the BLAST tool is used, as for TF-Seq and TF-Fam, to search similar transcription factor sequences in the target genome, and then the InterProScan tool is used, to refine the BLAST results though by classifying each BLAST output into subfamilies instead of families as in TF-Fam. The four methods used for mapping binding sites and target genes from the source genome to the target genome are named BS-Seq, BS-Prom, BS-Blast, and BS-Nuc. All the methods search for transcription factor binding site (TFBS) motifs of the source genome in different databases. Sets of transcription factors are characterized into families that tend to share a common structure among their binding sites, though there is considerable diversity in the binding sites for any transcription factor. These common structures are represented as transcription factor binding site motifs. BS-Seq searches for transcription factor binding site (TFBS) motifs in the nucleotide sequences of the target genome and the nucleotide sequences containing the TFBS motifs are the possible target genes for the target genome. In BS-Prom, the transcription factor binding site motifs are searched for in the target genome promoter sequences instead of the target genome nucleotide sequences used in BS-Seq. In BS-Blast, initially the BLAST tool is run with the target genes from the source genome regulatory network as query sequences, with the nucleotide sequences of the target genome as the BLAST database, to identify similar nucleotide sequences in the target genome. The transcription factor binding site motifs are then searched for in the these similar nucleotide sequences identified in the target genome. The similar nucleotide sequences in the target genome containing the TFBS motifs are the possible target genes. BS-Nuc is used to refine the results determined from BS-Prom based on finding target genes containing active binding sites. An additional tool, the Nucleosomes Position Prediction tool, is used to identify the probability of nucleosome occupancy at every position in the target genes identified using BS-Prom. The target genes containing binding sites in high probability nucleosome occupancy regions are discarded as non-active binding sites, and the rest of the sequences are identified as possible target genes of the target genome. For mapping regulatory relationships, we devised a method based on using different databases. In this method, for every link in the source genome network, the corresponding transcription factors are located using one of the sets identified as predicted transcription factors. The target
97
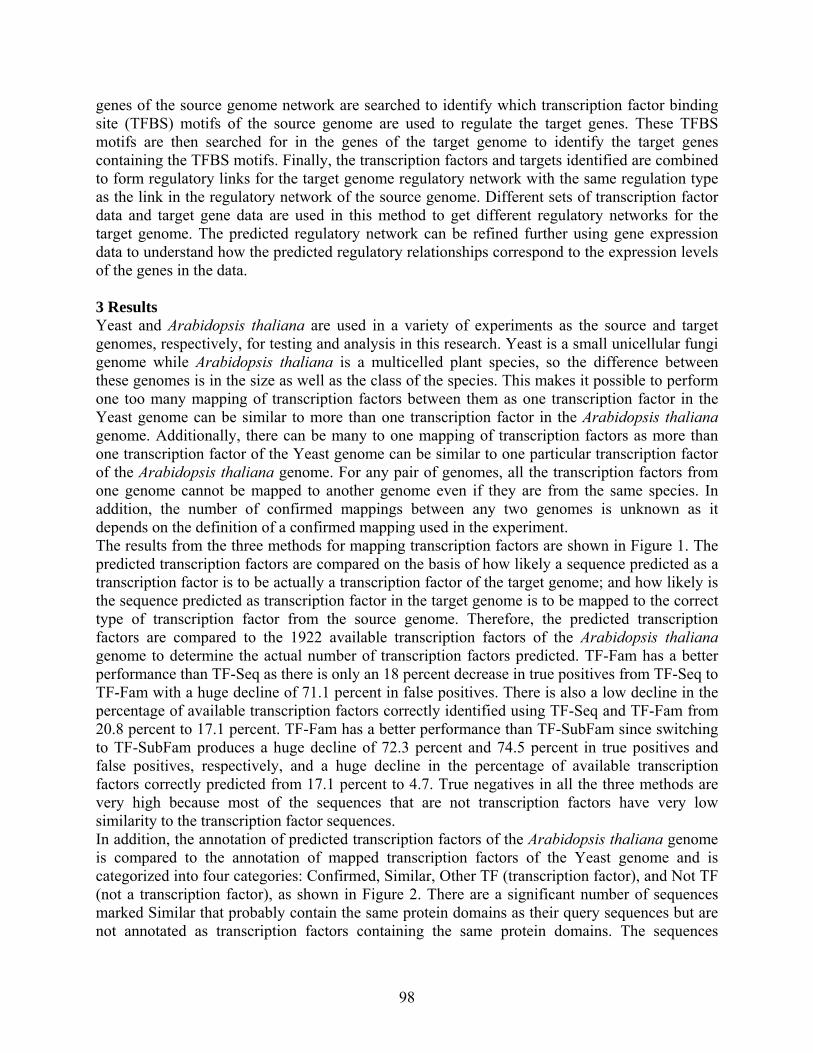
genes of the source genome network are searched to identify which transcription factor binding site (TFBS) motifs of the source genome are used to regulate the target genes. These TFBS motifs are then searched for in the genes of the target genome to identify the target genes containing the TFBS motifs. Finally, the transcription factors and targets identified are combined to form regulatory links for the target genome regulatory network with the same regulation type as the link in the regulatory network of the source genome. Different sets of transcription factor data and target gene data are used in this method to get different regulatory networks for the target genome. The predicted regulatory network can be refined further using gene expression data to understand how the predicted regulatory relationships correspond to the expression levels of the genes in the data. 3 Results Yeast and Arabidopsis thaliana are used in a variety of experiments as the source and target genomes, respectively, for testing and analysis in this research. Yeast is a small unicellular fungi genome while Arabidopsis thaliana is a multicelled plant species, so the difference between these genomes is in the size as well as the class of the species. This makes it possible to perform one too many mapping of transcription factors between them as one transcription factor in the Yeast genome can be similar to more than one transcription factor in the Arabidopsis thaliana genome. Additionally, there can be many to one mapping of transcription factors as more than one transcription factor of the Yeast genome can be similar to one particular transcription factor of the Arabidopsis thaliana genome. For any pair of genomes, all the transcription factors from one genome cannot be mapped to another genome even if they are from the same species. In addition, the number of confirmed mappings between any two genomes is unknown as it depends on the definition of a confirmed mapping used in the experiment. The results from the three methods for mapping transcription factors are shown in Figure 1. The predicted transcription factors are compared on the basis of how likely a sequence predicted as a transcription factor is to be actually a transcription factor of the target genome; and how likely is the sequence predicted as transcription factor in the target genome is to be mapped to the correct type of transcription factor from the source genome. Therefore, the predicted transcription factors are compared to the 1922 available transcription factors of the Arabidopsis thaliana genome to determine the actual number of transcription factors predicted. TF-Fam has a better performance than TF-Seq as there is only an 18 percent decrease in true positives from TF-Seq to TF-Fam with a huge decline of 71.1 percent in false positives. There is also a low decline in the percentage of available transcription factors correctly identified using TF-Seq and TF-Fam from 20.8 percent to 17.1 percent. TF-Fam has a better performance than TF-SubFam since switching to TF-SubFam produces a huge decline of 72.3 percent and 74.5 percent in true positives and false positives, respectively, and a huge decline in the percentage of available transcription factors correctly predicted from 17.1 percent to 4.7. True negatives in all the three methods are very high because most of the sequences that are not transcription factors have very low similarity to the transcription factor sequences. In addition, the annotation of predicted transcription factors of the Arabidopsis thaliana genome is compared to the annotation of mapped transcription factors of the Yeast genome and is categorized into four categories: Confirmed, Similar, Other TF (transcription factor), and Not TF (not a transcription factor), as shown in Figure 2. There are a significant number of sequences marked Similar that probably contain the same protein domains as their query sequences but are not annotated as transcription factors containing the same protein domains. The sequences
98
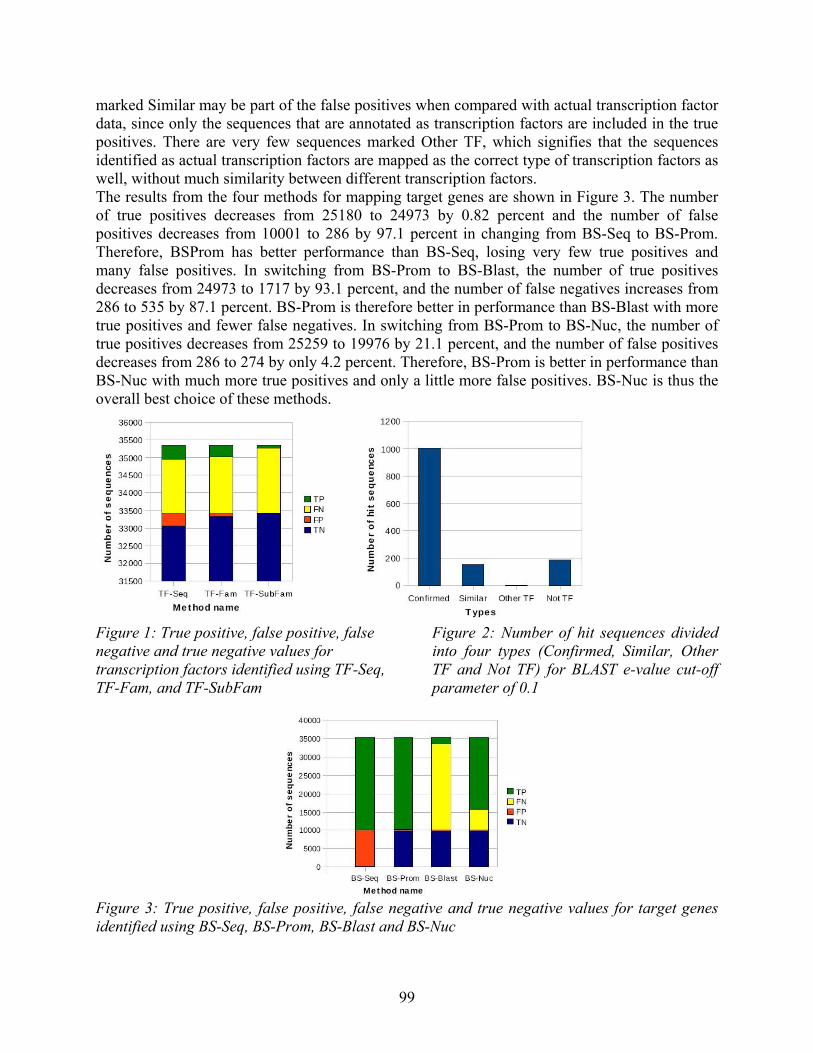
marked Similar may be part of the false positives when compared with actual transcription factor data, since only the sequences that are annotated as transcription factors are included in the true positives. There are very few sequences marked Other TF, which signifies that the sequences identified as actual transcription factors are mapped as the correct type of transcription factors as well, without much similarity between different transcription factors. The results from the four methods for mapping target genes are shown in Figure 3. The number of true positives decreases from 25180 to 24973 by 0.82 percent and the number of false positives decreases from 10001 to 286 by 97.1 percent in changing from BS-Seq to BS-Prom. Therefore, BSProm has better performance than BS-Seq, losing very few true positives and many false positives. In switching from BS-Prom to BS-Blast, the number of true positives decreases from 24973 to 1717 by 93.1 percent, and the number of false negatives increases from 286 to 535 by 87.1 percent. BS-Prom is therefore better in performance than BS-Blast with more true positives and fewer false negatives. In switching from BS-Prom to BS-Nuc, the number of true positives decreases from 25259 to 19976 by 21.1 percent, and the number of false positives decreases from 286 to 274 by only 4.2 percent. Therefore, BS-Prom is better in performance than BS-Nuc with much more true positives and only a little more false positives. BS-Nuc is thus the overall best choice of these methods.
Figure 1: True positive, false positive, false negative and true negative values for transcription factors identified using TF-Seq, TF-Fam, and TF-SubFam
Figure 2: Number of hit sequences divided into four types (Confirmed, Similar, Other TF and Not TF) for BLAST e-value cut-off parameter of 0.1
Figure 3: True positive, false positive, false negative and true negative values for target genes identified using BS-Seq, BS-Prom, BS-Blast and BS-Nuc
99
Transcription factor mapping based on similar protein domain family has better performance over the other two methods based on sequence similarity and similar protein domain sub-family. Also, the transcription factors predicted are of the correct type. Target gene mapping by finding TFBS motifs in promoters has better performance than the other methods. Using sequence similarity in BS-Blast is not useful for mapping target genes as the target genes containing similar binding sites do not need to have high sequence similarity. Also, using BS-Nuc to refine the results of BS-Prom using the Nucleosomes Position Prediction tool does not improve the performance of the results, as nucleosomes do not always have a fixed position to prevent transcription. References 1. T. Akutsu, S. Kuhara, S. Miyano. Identification of genetic networks from a small number of gene expression patterns under the boolean network model. Proceedings of the 4th Pacific Symposium on Biocomputing (1999), pp. 17–28. 2. L. Chen A. Thastrom Y. Field I. K. Moore J. Z. Wang J. Widom E. Segal, Y. Fondufe-Mittendorf. A genomic code for nucleosome positioning. Nature 442 (2006), no. 7104, 772–8. 3. A.J. Hartemink, T.S. Jaakkola, R.A. Young, D.K. Gifford. Bayesian methods for elucidating genetic regulatory networks. IEEE Intelligent Systems and Their Applications 17 (2002), no. 2, pp. 37–43. 4. M.J.L. de Hoon, S. Miyano, S. Imoto. Inferring gene regulatory networks from time-ordered gene expression data using differential equations. Proceedings of the 5th International Conference on Discovery Science (2002), pp. 267–274. 5. T. Higuchi, T. Goto, K. Tashiro, S. Kuhara, S. Miyano, S. Imoto. Combining microarrays and biological knowledge for estimating gene networks via bayesian networks. Proceedings of the Computational Systems Bioinformatics Conference (2003), pp. 183–188. 6. B. Lewin. Genes vii. New York: Oxford University Press Inc., 2000. 7. H. Matsuno, M. Nagasaki, S. Miyano, A. Doi. Hybrid petri net representation of gene regulatory network. Proceeding of the 5th Pacific Symposium on Biocomputing (2000), pp. 338–349. 8. S.F. Altschul, W. Gish, W. Miller, E.W. Myers, D.J. Lipman. Basic local alignment search tool. J. Mol. Biol. 215 (1990), pp. 403-410. 9. Teresa K. Attwood et al. New developments in the interpro database. Nucleic Acids Research 35 (2007), pp. D224–D228. BS-Seq BS-Prom BS-Blast BS-Nuc
100
Heterogeneous Parallelization for RNA Structure Comparison Eric Snow, Eric Aubanel, and Patricia Evans
Abstract Parallel and grid computing have had a significant impact on the feasibility of running many time- and space-intensive applications. However, the additional computing power supplied is not without additional costs; development of algorithms and applications that run efficiently in parallel is generally more complex than traditional sequential development. In particular, consideration of the underlying heterogeneity of the computing platform can be very difficult when using multicomputers or grid computing, but can lead to significantly more efficient parallel applications. In this paper, we analyze a sequential dynamic programming algorithm for the comparison of RNA structures including those with pseudoknots, and come up with a corresponding parallel design. Particular attention is paid to the fact that the underlying platform which will be used to test the algorithm will be heterogeneous. 1 Introduction Dynamic programming algorithms, a type known for both their high complexity and high computational demands, have the potential to benefit greatly from the increase in resources available from parallel computers. However, a considerable amount of thought must be given to the design of their parallel versions, as communication overhead caused by unusual dependencies can often result is designs that cannot run well in practice [1, 2]. Heterogeneous computing environments, such as multicomputers and computational grids add another layer of complexity to parallel algorithm design as well, due to the fact that the speed of network connections between processors, and the speed/availability of processors themselves can vary a great deal. Designing algorithms to take full advantage of the massive computational resources available in these environments is an emerging area of study, with the potential to make problems that were previously too time- or memory-intensive feasible [3]. In this paper, we discuss one such sequential algorithm, perform an analysis to find possible areas of parallelism, and come up with a parallel design. 2 Finding Common RNA Pseudoknot Structures The sequential algorithm to be parallelized falls under the RNA structure analysis umbrella of bioinformatics, concerned with the structures that are formed by the bonds between bases in RNA chains. The purpose of the algorithm is to find the maximum common ordered substructure of two RNA chains, such that the order of the bonds in each structure is preserved [4]. The generic form of the maximum common ordered substructure problem is known to be NPcomplete [5], but by adding restrictions to the problem that only allow structures consistent with those found in actual RNA, an algorithm was able to be designed that has worst case time and space complexities of O(n10) and O(n8) respectively [4]. The algorithm is designed and implemented as a recursive dynamic programming algorithm using memorization, with two tables to store partial results, one 4-dimensional and one 8-dimensional. Due to the extreme time and space requirements of calculating all points in the 8-dimensional table for even small-sized input structures, a selective allocation/calculation approach is used. This approach exploits the fact that many of the partial results calculated in the table are not actually consistent with the input data, and are thus unnecessary calculations. By
101
allowing the input data to drive the computation, the algorithm only allocates hyperplanes in the tables and performs calculations when they are valid cases. Using this technique, the original algorithm uses an average of only 10-14 of the worst-case space, and the implementation supports input structures of up to 400 bonds in 4Gb of memory [4]. The motivation behind the parallelization of this algorithm is twofold; first, it is desirable for the algorithm to be able to work on larger and more complex RNA structures, which is simply not possible on traditional sequential computers due to the potentially drastic increase in memory usage that can occur as n increases. In addition, the algorithm has several characteristics that make it a particularly challenging parallelization problem, which we discuss in the next section. 3 Analysis of the Sequential Algorithm When performing analysis of dynamic programming algorithms prior to parallelization, there are 3 especially useful criteria that should be used to classify the problem. The first of these criteria is whether the problem is monadic or polyadic, based on the number of recursive calls needed to calculate a partial result in the dynamic programming table. The sequential version of the algorithm is classified as polyadic, since each result in the tables relies on at least 2 calls. The second of the criteria is based on the recursive graph generated by the problem. If each recursive call made in finding a partial result depends on a value that is one level away in the graph, then the problem is classified as serial. The sequential version of the algorithm is classified as non-serial, since a partial result can potentially depend on any previous level in the recursive graph. The final criteria used for classification is based on whether the number of recursive calls needed to calculate a partial result is static. If the number of calls is static, the problem is said to have a regular dependency [6]. However, the sequential algorithm we dealt with was found to have an irregular dependency, with locations in the 4-dimensional table requiring between 2 and 4 calls to calculate, and locations in the 8-dimensional table requiring between 4 and 13 calls. Based on the above criteria, we can say that the algorithm we are dealing with is a non-serial polyadic algorithm with irregular dependency. This is the most difficult type to parallelize, as the unpredictable nature of the recursion (with respect to which locations in the table must be checked, how far they are from the current level, and how many checks must be performed), means that decomposition of the problem in a manner that easily minimizes communication is extremely difficult. The majority of the difficulty with this parallelization, including the irregular dependency criteria above, stems from the use of selective allocation/calculation in the sequential version of the algorithm. This technique was invaluable in shaving off massive amounts of unnecessary calculations and unnecessary space allocation, and as such must be kept in the parallel version of the algorithm as well. However, the use of the technique also turned what would have been a straightforward data-decomposition into a problem with far less inherent parallelism. In particular, the selective allocation/calculation places an order on the calculations that would not have been in the problem otherwise. The partial results are calculated in order to ensure that only valid results are calculated, but this means that there is only one obvious starting point for the problem. It is immediately obvious that this limits the effectiveness of a parallel implementation, as finding a starting point for each processor is not a simple task. The data structures of significant concern with respect to parallelization are the 4- and 8-dimensional dynamic programming tables used to hold partial results. These tables can be extremely large, and due to the dynamic selective allocation process, extremely unpredictable in
102
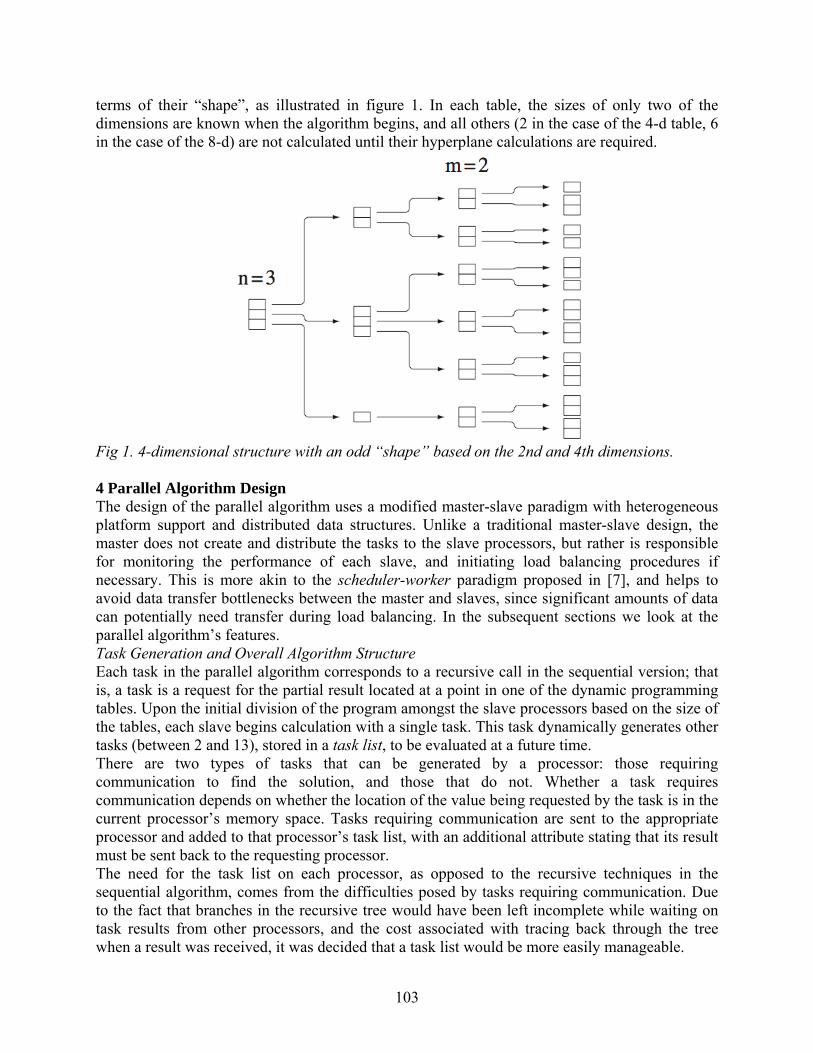
terms of their “shape”, as illustrated in figure 1. In each table, the sizes of only two of the dimensions are known when the algorithm begins, and all others (2 in the case of the 4-d table, 6 in the case of the 8-d) are not calculated until their hyperplane calculations are required.
Fig 1. 4-dimensional structure with an odd “shape” based on the 2nd and 4th dimensions. 4 Parallel Algorithm Design The design of the parallel algorithm uses a modified master-slave paradigm with heterogeneous platform support and distributed data structures. Unlike a traditional master-slave design, the master does not create and distribute the tasks to the slave processors, but rather is responsible for monitoring the performance of each slave, and initiating load balancing procedures if necessary. This is more akin to the scheduler-worker paradigm proposed in [7], and helps to avoid data transfer bottlenecks between the master and slaves, since significant amounts of data can potentially need transfer during load balancing. In the subsequent sections we look at the parallel algorithm’s features. Task Generation and Overall Algorithm Structure Each task in the parallel algorithm corresponds to a recursive call in the sequential version; that is, a task is a request for the partial result located at a point in one of the dynamic programming tables. Upon the initial division of the program amongst the slave processors based on the size of the tables, each slave begins calculation with a single task. This task dynamically generates other tasks (between 2 and 13), stored in a task list, to be evaluated at a future time. There are two types of tasks that can be generated by a processor: those requiring communication to find the solution, and those that do not. Whether a task requires communication depends on whether the location of the value being requested by the task is in the current processor’s memory space. Tasks requiring communication are sent to the appropriate processor and added to that processor’s task list, with an additional attribute stating that its result must be sent back to the requesting processor. The need for the task list on each processor, as opposed to the recursive techniques in the sequential algorithm, comes from the difficulties posed by tasks requiring communication. Due to the fact that branches in the recursive tree would have been left incomplete while waiting on task results from other processors, and the cost associated with tracing back through the tree when a result was received, it was decided that a task list would be more easily manageable.
103
Data Structures The driving force behind the parallelization of this algorithm for heterogeneous structures was the idea of distributing the extremely large dynamic programming tables amongst the slave processors’ memory, allowing for larger input structures. Ideally, the structure should be divided in a manner such that each processor gets a portion of the tables directly proportionate to its computing capabilities. However, because the shape and size of the tables cannot be determined prior to division, a “best guess” initial division of the tables must be used, which can then be improved during execution by using dynamic load balancing. The initial division of the tables takes place along the first dimension. This is really the only decent option for division, as the number of elements in the first dimension of each table will always be n, whereas subsequent dimensions’ sizes are determined dynamically as tasks request them. Division along this index also makes load balancing of the data structures as simple as possible, allowing the master processor to keep a 1-dimensional array representing which indices are mapped to each processor. If a portion of a table located on one processor must be moved to another processor, it is easy to select a “chunk” and update the array accordingly. Load Balancing Due to the highly dynamic nature of task and data structure generation, dynamic load balancing techniques must be used to ensure that no slave processor becomes overtaxed. Load balancing takes place on two fronts, with respect to both computation and space. The first, with respect to computation, takes place if one slave’s task list has become extremely long compared to another. Similarly, if one processor’s portion of the table has become excessively large compared to another, load balancing procedures will take place. In either case, the result of load balancing is the same. Sections from the tables are taken from the overloaded slave and moved to another slave, along with the tasks that correspond to that section. Decisions about when to perform load balancing procedures are the responsibility of the master node, which considers both the current load on the slaves along with their computational capabilities. Periodic updates from all slave processors ensure that the master will always be “well-informed” with regards to the current load situation, and can therefore make informed decisions about where to shift the load of a processor. The support for heterogeneous underlying platforms is mainly encapsulated in the load balancing techniques, as the master node must also be aware of the underlying platform, including which nodes have a slower network connecting them and which nodes have less available memory. This can influence whether or not it is acceptable to shift a large piece of the data structure from one slave to another, as having to pass large amounts of data over a slow network can drastically reduce the program’s efficiency. In such a case, the master may decide to shift the work to a slave whose network connection to the overloaded slave is faster. Communication There are two main types of message passing that take place, master/slave and slave/slave. Master/slave messages occur both during the initial mapping of tasks to processors, and when load balancing information is exchanged. Master/slave messages are kept very small and infrequent to avoid a bottleneck, exchanging only information about the current status of each slave’s data structures and task list. Load balancing messages must be passed in a synchronous fashion, due to the fact that if one slave has incorrect (out-of-date) load balancing information, it could send a task request to a slave that cannot find the solution to the task. Slave/slave communication can take place on two fronts. The first type involves requesting task evaluation(s) from another slave. These messages are generally quite short, and can be sent in an
104
asynchronous manner since the receiving processor may be working on another task, and not yet be ready to receive the message. Alternatively, slave/slave communication during load balancing can involve large portions of the tables being shifted between processors, though it should occur very infrequently compared to task requests. This type of message passing must take place in a synchronous manner, to ensure that the processor receiving the portion of the table does not attempt to access any values in the new section of the table before they have been initialized. 5 Conclusions and Remaining Work In this paper we have described the design of a parallel version of a dynamic programming algorithm used to find the maximum common ordered substructure of two RNA chains. This algorithm was designed with particular attention paid to load balancing to allow for use on heterogeneous computing platforms. Remaining work involves the completion of the implementation, along with performance testing of the algorithm on large and complex input structures, likely using the heterogeneous platforms available at ACEnet [8]. References 1. A. Grama, A. Gupta et al. Introduction to Parallel Computing, Second Edition. Addison-Wesley, 2003. 2. M. Quinn. Parallel Programming in C with MPI and OpenMP. McGraw- Hill, 2004. 3. E. Talbi, A. Zomaya. Grids in Bioinformatics and Computational Biology. Journal of Parallel and Distributed Computing. Vol. 66, no. 12. December 2006, p. 1481. 4. P. Evans. Finding Common RNA Pseudoknot Structures in Polynomial Time. Combinatorial Pattern Matching, Lecture Notes in Computer Science. 2006, pp. 223-232. 5. K. Zhang. Computing similarity between RNA secondary structures. Proceedings of IEEE International Joint Symposia on Intelligence and Systems. 1998, pp. 126-132. 6. W. Liu, B. Schmidt. Parallel Design Pattern for Computational Biology and Scientific Computing Applications. IEEE International Conference on Cluster Computing, Proceedings. 2003, pp. 456-459. 7. C. Chen, B. Schmidt. An adaptive grid implementation of DNA sequence alignment. Future Generation Computer Systems. Vol. 21, no. 7. 2005, pp. 988-1003. 8. ACEnet: Atlantic Computational Excellence Network: www.ace-net.ca
105
Towards Developing Mobile Code for Resource Constrained Wireless Networks
Mohsin Sohail
1Abstract This work aims to introduce a novel robust paradigm for mobile communication and network management for resource constrained communication networks. The paradigm introduced in this paper is based on the innovative idea of Mobile Code which has been implemented on a testbed at the Adaptive Risk Management (ARM) Laboratory at the University of New Brunswick (UNB) [1]. Networks based on Information and Communication Technology (ICT) are revolutionizing the world and their perpetuation is leading to the dependence of critical infrastructures on the reliability of these networks, the integrity of the information flowing and stored on these networks, and on the availability of these information networks through the Internet[2]. In order to deal with this the idea of Mobile Code is introduced in this paper as the new concept of real-time in-Network programming that occurs when certain conditions are met. Through the application of the Mobile Code approach networks of networks [3] can achieve an increase in resilience from failure due to attacks and furthermore, attain self-management capabilities which is a much needed characteristic in today’s Networks Systems and protocols. 1. Motivation In 1991, Mark Wieser put forward his vision of ubiquitous computing [4] in which he projected that computers will soon interweave themselves in the everyday environment of human beings. They will evolve from the interfering reactive devices of the present to unobtrusive devices of the future. They would become invisible and un-noticeable just like electricity is today. In 1999 motivated by this vision, the European union’s Information Societies Technologies Programs Advisory Group (ISTAG) used the term Ambient Intelligence (AmI) in a similar fashion to describe a vision where “people will be surrounded by intelligent and intuitive interfaces embedded in everyday objects around us and an environment recognizing and responding to the presence of individuals in an invisible way” [5]. In 2006-2007 the vision for the new architecture was coined as the “Internet of the Future” in Europe under the Future and Emerging Technologies (FET) sub-group of the IST [10]. At the same time the NSF started working on a testbed on a global scale on which the new architecture for the Future Internet could be tested out (Fig. 1)[9]. Currently, accompanying the Future internet, comes the new concept of Cyber-Physical Systems [11] in which the new Internet is envisioned as the “Internet of Things” [12]. This means that the internet will have end-points\clients largely composed of extremely small devices such as Motes[6,7,8]. We can see this transition right now in sheer numbers when we see how small mobile devices such as cell phones have overtaken the desktops and laptops. Several researchers project that cell phones will take over the internet [13-15]. In order to accommodate this explosion of clients, mobility and constrained resources of the devices requires a lot of change in current internet architecture. The self-management, self-programmability and flexible integration of resource constrained networks are the main topic of this research work. The objective is to take the latest innovations from computing, namely Wireless Sensor Networks(WSN), and the networking domain, namely
1This is a revised version of a paper that has been submitted to IEEE INCC 2008 and awaiting approval.
106
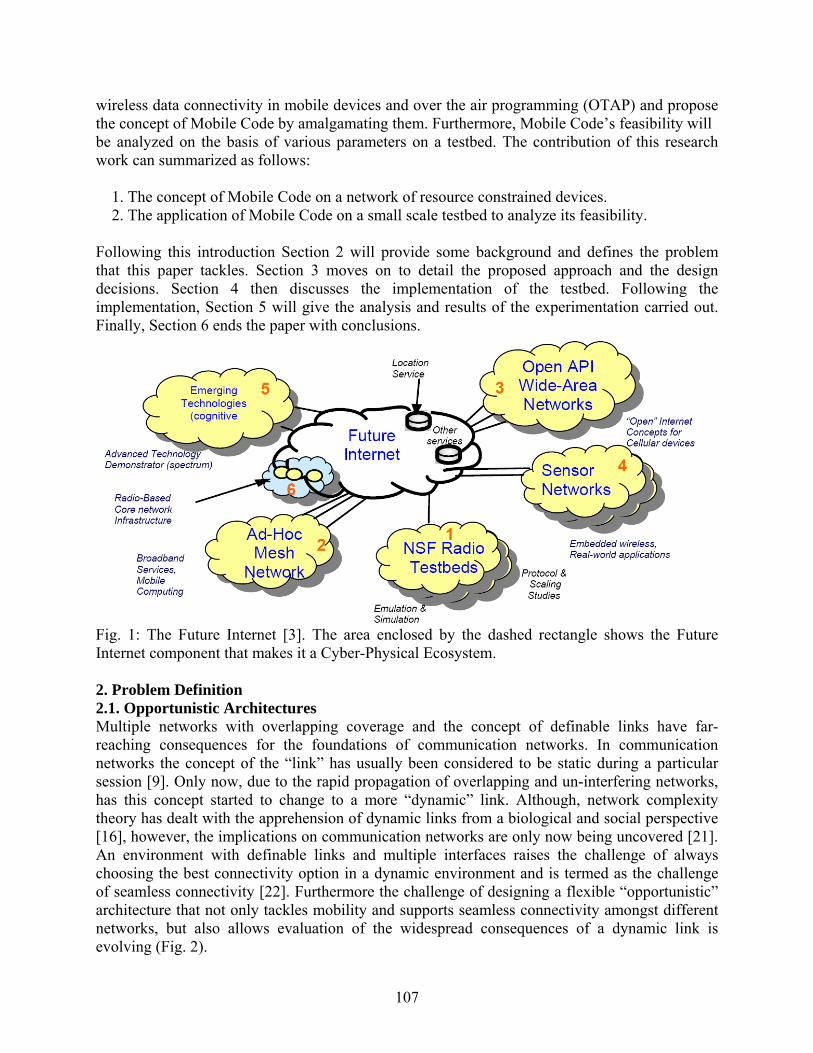
wireless data connectivity in mobile devices and over the air programming (OTAP) and propose the concept of Mobile Code by amalgamating them. Furthermore, Mobile Code’s feasibility will be analyzed on the basis of various parameters on a testbed. The contribution of this research work can summarized as follows:
1. The concept of Mobile Code on a network of resource constrained devices. 2. The application of Mobile Code on a small scale testbed to analyze its feasibility.
Following this introduction Section 2 will provide some background and defines the problem that this paper tackles. Section 3 moves on to detail the proposed approach and the design decisions. Section 4 then discusses the implementation of the testbed. Following the implementation, Section 5 will give the analysis and results of the experimentation carried out. Finally, Section 6 ends the paper with conclusions.
Fig. 1: The Future Internet [3]. The area enclosed by the dashed rectangle shows the Future Internet component that makes it a Cyber-Physical Ecosystem. 2. Problem Definition 2.1. Opportunistic Architectures Multiple networks with overlapping coverage and the concept of definable links have far-reaching consequences for the foundations of communication networks. In communication networks the concept of the “link” has usually been considered to be static during a particular session [9]. Only now, due to the rapid propagation of overlapping and un-interfering networks, has this concept started to change to a more “dynamic” link. Although, network complexity theory has dealt with the apprehension of dynamic links from a biological and social perspective [16], however, the implications on communication networks are only now being uncovered [21]. An environment with definable links and multiple interfaces raises the challenge of always choosing the best connectivity option in a dynamic environment and is termed as the challenge of seamless connectivity [22]. Furthermore the challenge of designing a flexible “opportunistic” architecture that not only tackles mobility and supports seamless connectivity amongst different networks, but also allows evaluation of the widespread consequences of a dynamic link is evolving (Fig. 2).
107
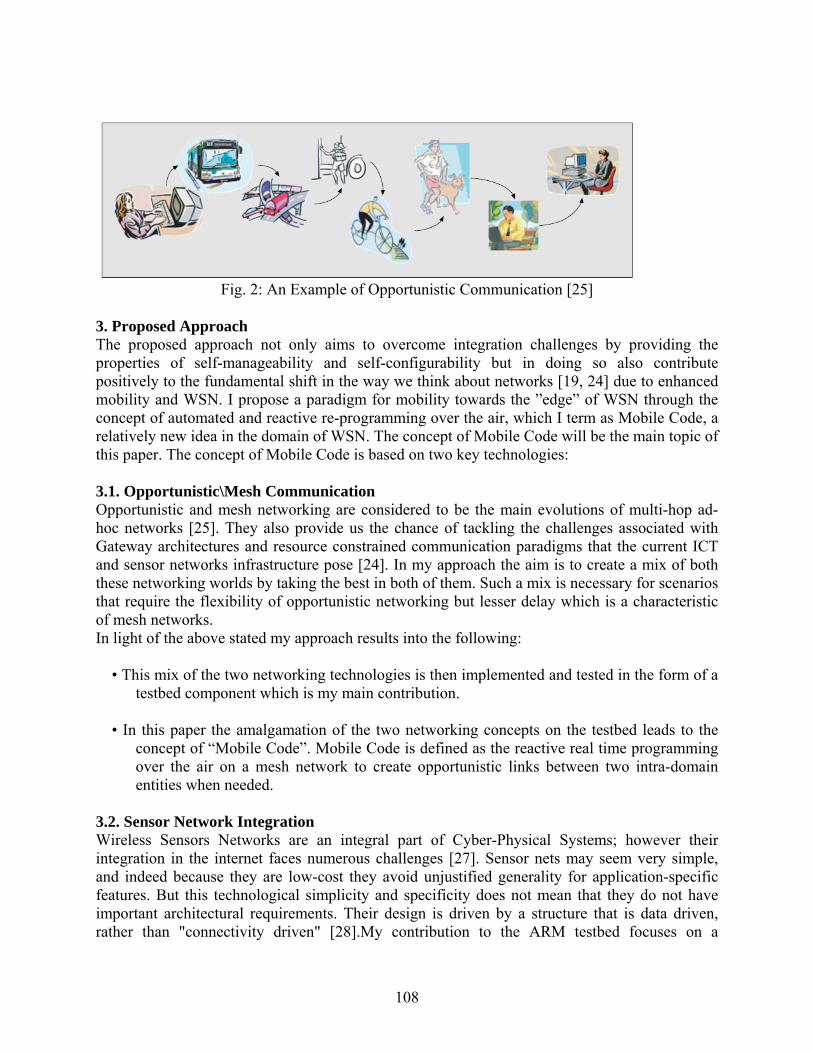
Fig. 2: An Example of Opportunistic Communication [25]
3. Proposed Approach The proposed approach not only aims to overcome integration challenges by providing the properties of self-manageability and self-configurability but in doing so also contribute positively to the fundamental shift in the way we think about networks [19, 24] due to enhanced mobility and WSN. I propose a paradigm for mobility towards the ”edge” of WSN through the concept of automated and reactive re-programming over the air, which I term as Mobile Code, a relatively new idea in the domain of WSN. The concept of Mobile Code will be the main topic of this paper. The concept of Mobile Code is based on two key technologies: 3.1. Opportunistic\Mesh Communication Opportunistic and mesh networking are considered to be the main evolutions of multi-hop ad-hoc networks [25]. They also provide us the chance of tackling the challenges associated with Gateway architectures and resource constrained communication paradigms that the current ICT and sensor networks infrastructure pose [24]. In my approach the aim is to create a mix of both these networking worlds by taking the best in both of them. Such a mix is necessary for scenarios that require the flexibility of opportunistic networking but lesser delay which is a characteristic of mesh networks. In light of the above stated my approach results into the following:
• This mix of the two networking technologies is then implemented and tested in the form of a testbed component which is my main contribution.
• In this paper the amalgamation of the two networking concepts on the testbed leads to the
concept of “Mobile Code”. Mobile Code is defined as the reactive real time programming over the air on a mesh network to create opportunistic links between two intra-domain entities when needed.
3.2. Sensor Network Integration Wireless Sensors Networks are an integral part of Cyber-Physical Systems; however their integration in the internet faces numerous challenges [27]. Sensor nets may seem very simple, and indeed because they are low-cost they avoid unjustified generality for application-specific features. But this technological simplicity and specificity does not mean that they do not have important architectural requirements. Their design is driven by a structure that is data driven, rather than "connectivity driven" [28].My contribution to the ARM testbed focuses on a
108
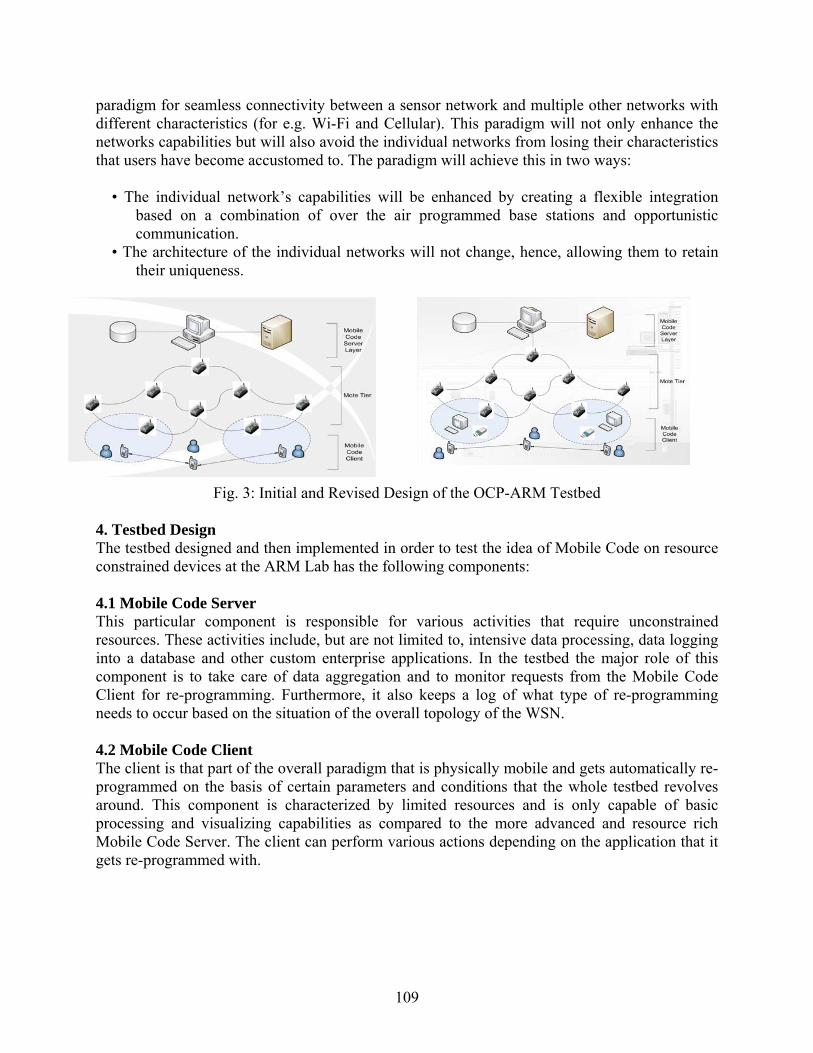
paradigm for seamless connectivity between a sensor network and multiple other networks with different characteristics (for e.g. Wi-Fi and Cellular). This paradigm will not only enhance the networks capabilities but will also avoid the individual networks from losing their characteristics that users have become accustomed to. The paradigm will achieve this in two ways:
• The individual network’s capabilities will be enhanced by creating a flexible integration based on a combination of over the air programmed base stations and opportunistic communication.
• The architecture of the individual networks will not change, hence, allowing them to retain their uniqueness.
Fig. 3: Initial and Revised Design of the OCP-ARM Testbed
4. Testbed Design The testbed designed and then implemented in order to test the idea of Mobile Code on resource constrained devices at the ARM Lab has the following components: 4.1 Mobile Code Server This particular component is responsible for various activities that require unconstrained resources. These activities include, but are not limited to, intensive data processing, data logging into a database and other custom enterprise applications. In the testbed the major role of this component is to take care of data aggregation and to monitor requests from the Mobile Code Client for re-programming. Furthermore, it also keeps a log of what type of re-programming needs to occur based on the situation of the overall topology of the WSN. 4.2 Mobile Code Client The client is that part of the overall paradigm that is physically mobile and gets automatically re-programmed on the basis of certain parameters and conditions that the whole testbed revolves around. This component is characterized by limited resources and is only capable of basic processing and visualizing capabilities as compared to the more advanced and resource rich Mobile Code Server. The client can perform various actions depending on the application that it gets re-programmed with.
109

4.3 Mote Tier The mote tier is composed of WSN nodes which are distributed over a target environment that needs to be monitored. These nodes are extremely resource constrained and form a multi-hop network amongst them and possess the properties of self-healing and self-organization. 4.4 Initial & Revised Design Initially, the design of the testbed had included the direct connection between the Client Layer and the Mote Tier (Fig. 3). This, as it turned out, was too difficult to achieve due to the lack of means to directly communicate with the Mote tier. Although, not impossible, however this would have required the cumbersome process of dismantling the mobile device of the Client Layer and using the ModBus Architecture[29] which is usually used internally for communication. In order to implement the concept of Mobile Code on WSN and overcoming the difficulty of direct access to the Mote Tier a prototype gateway was devised in the revised design which is encircled in the following diagram (Fig. 3). Additionally, this prototype gateway gave the flexibility of measuring the opportunistic paradigm on the WSN with greater precision. 5. Results This section evaluates the concept of Mobile Code in light of the results that were gathered on the testbed described in the previous section. The data gathered is relative to a specific metric that is also explained in this section 5.1 Performance Metric In the testbed the specific condition which triggers the Mobile Code to take in effect is the presence of a Mobile Client in the vicinity of an entity that is capable of servicing it. For the purpose of this research paper this service takes the form of a base station in the overall testbed that aggregates data on behalf of the Mobile Client. Keeping this formulation in mind the following metric is only considered for the evaluation: 5.1.1 Response Size (P): Response size is the amount of code packets that are sent over the air to the Mote nearest to the Mobile Client for re-programming. Although, the size of these packets is 29 bytes each, however, 10 of these bytes are part of the header and the rest of the 19 bytes are the payload carrying the code. 5.2 Experimental Framework A typical experiment would include the complete setup of the testbed with all its components as outlined in the previous section. Following the successful self-organization of the mesh for the Mote Tier the Mobile Client (MC) is brought close to or turned on near a Mote (which will be targeted for re-programming and from henceforth called the gateway). From this point onward re-programming occurs. During this phase the gateway is re-programmed with Base code (PXOCPBase) which has a size of 139,559 bytes. After a successful session was established between the Mote Tier and the MC through the gateway I would then disconnect the MC and the OTAP would re-occur. During this re-programming phase the gateway receives the Node code which has a size of 139,473 bytes (PXOCPNode), Following this phase the Mote would take a certain amount of time to re-join the Mote Tier.
110
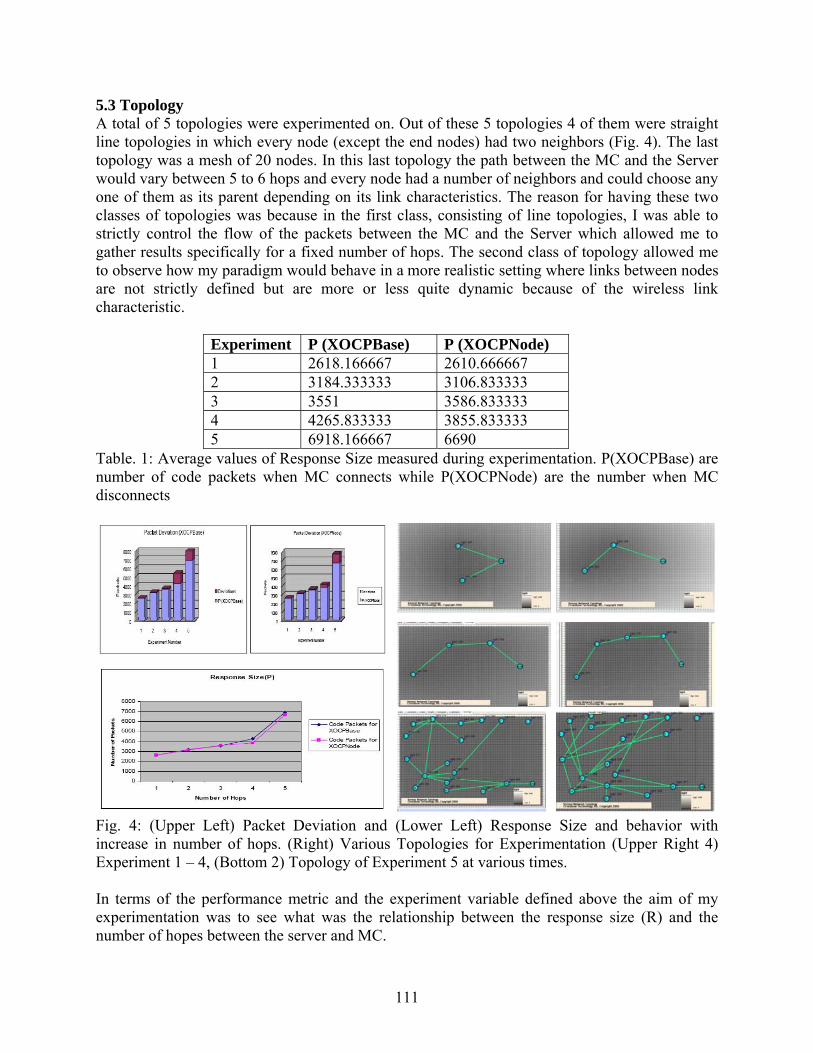
5.3 Topology A total of 5 topologies were experimented on. Out of these 5 topologies 4 of them were straight line topologies in which every node (except the end nodes) had two neighbors (Fig. 4). The last topology was a mesh of 20 nodes. In this last topology the path between the MC and the Server would vary between 5 to 6 hops and every node had a number of neighbors and could choose any one of them as its parent depending on its link characteristics. The reason for having these two classes of topologies was because in the first class, consisting of line topologies, I was able to strictly control the flow of the packets between the MC and the Server which allowed me to gather results specifically for a fixed number of hops. The second class of topology allowed me to observe how my paradigm would behave in a more realistic setting where links between nodes are not strictly defined but are more or less quite dynamic because of the wireless link characteristic.
Experiment P (XOCPBase) P (XOCPNode) 1 2618.166667 2610.666667 2 3184.333333 3106.833333 3 3551 3586.833333 4 4265.833333 3855.833333 5 6918.166667 6690
Table. 1: Average values of Response Size measured during experimentation. P(XOCPBase) are number of code packets when MC connects while P(XOCPNode) are the number when MC disconnects
Fig. 4: (Upper Left) Packet Deviation and (Lower Left) Response Size and behavior with increase in number of hops. (Right) Various Topologies for Experimentation (Upper Right 4) Experiment 1 – 4, (Bottom 2) Topology of Experiment 5 at various times. In terms of the performance metric and the experiment variable defined above the aim of my experimentation was to see what was the relationship between the response size (R) and the number of hopes between the server and MC.
111
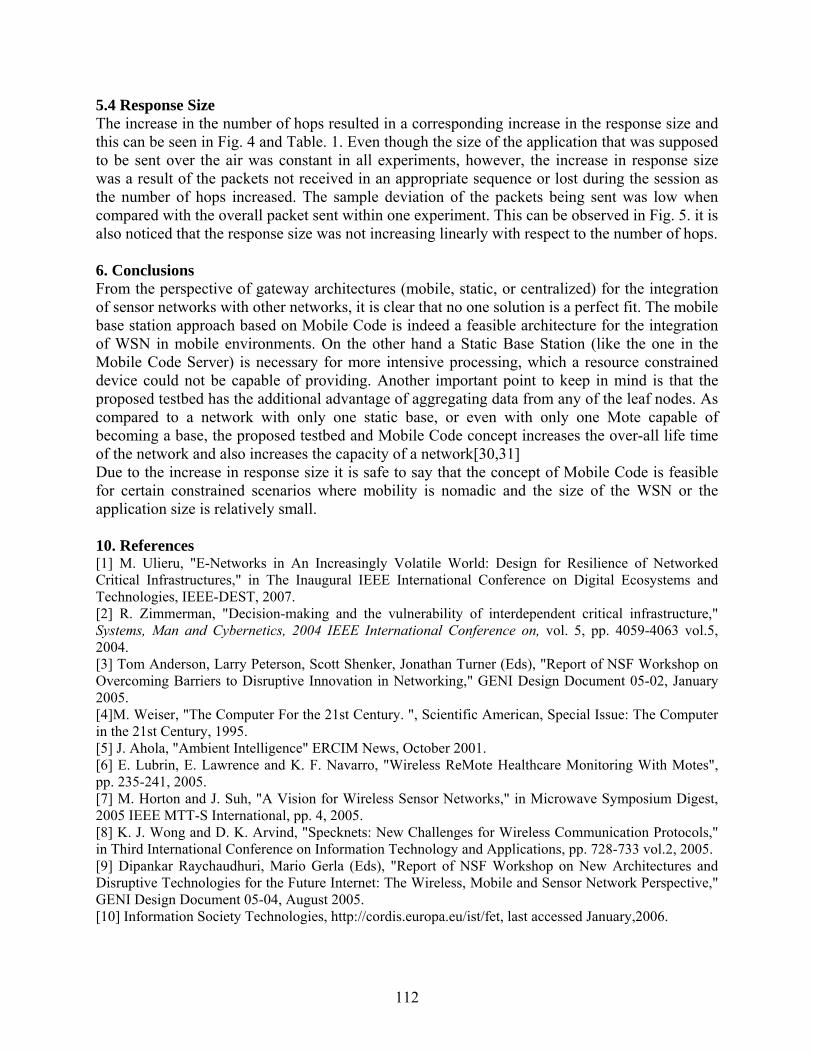
5.4 Response Size The increase in the number of hops resulted in a corresponding increase in the response size and this can be seen in Fig. 4 and Table. 1. Even though the size of the application that was supposed to be sent over the air was constant in all experiments, however, the increase in response size was a result of the packets not received in an appropriate sequence or lost during the session as the number of hops increased. The sample deviation of the packets being sent was low when compared with the overall packet sent within one experiment. This can be observed in Fig. 5. it is also noticed that the response size was not increasing linearly with respect to the number of hops. 6. Conclusions From the perspective of gateway architectures (mobile, static, or centralized) for the integration of sensor networks with other networks, it is clear that no one solution is a perfect fit. The mobile base station approach based on Mobile Code is indeed a feasible architecture for the integration of WSN in mobile environments. On the other hand a Static Base Station (like the one in the Mobile Code Server) is necessary for more intensive processing, which a resource constrained device could not be capable of providing. Another important point to keep in mind is that the proposed testbed has the additional advantage of aggregating data from any of the leaf nodes. As compared to a network with only one static base, or even with only one Mote capable of becoming a base, the proposed testbed and Mobile Code concept increases the over-all life time of the network and also increases the capacity of a network[30,31] Due to the increase in response size it is safe to say that the concept of Mobile Code is feasible for certain constrained scenarios where mobility is nomadic and the size of the WSN or the application size is relatively small. 10. References [1] M. Ulieru, "E-Networks in An Increasingly Volatile World: Design for Resilience of Networked Critical Infrastructures," in The Inaugural IEEE International Conference on Digital Ecosystems and Technologies, IEEE-DEST, 2007. [2] R. Zimmerman, "Decision-making and the vulnerability of interdependent critical infrastructure," Systems, Man and Cybernetics, 2004 IEEE International Conference on, vol. 5, pp. 4059-4063 vol.5, 2004. [3] Tom Anderson, Larry Peterson, Scott Shenker, Jonathan Turner (Eds), "Report of NSF Workshop on Overcoming Barriers to Disruptive Innovation in Networking," GENI Design Document 05-02, January 2005. [4]M. Weiser, "The Computer For the 21st Century. ", Scientific American, Special Issue: The Computer in the 21st Century, 1995. [5] J. Ahola, "Ambient Intelligence" ERCIM News, October 2001. [6] E. Lubrin, E. Lawrence and K. F. Navarro, "Wireless ReMote Healthcare Monitoring With Motes", pp. 235-241, 2005. [7] M. Horton and J. Suh, "A Vision for Wireless Sensor Networks," in Microwave Symposium Digest, 2005 IEEE MTT-S International, pp. 4, 2005. [8] K. J. Wong and D. K. Arvind, "Specknets: New Challenges for Wireless Communication Protocols," in Third International Conference on Information Technology and Applications, pp. 728-733 vol.2, 2005. [9] Dipankar Raychaudhuri, Mario Gerla (Eds), "Report of NSF Workshop on New Architectures and Disruptive Technologies for the Future Internet: The Wireless, Mobile and Sensor Network Perspective," GENI Design Document 05-04, August 2005. [10] Information Society Technologies, http://cordis.europa.eu/ist/fet, last accessed January,2006.
112
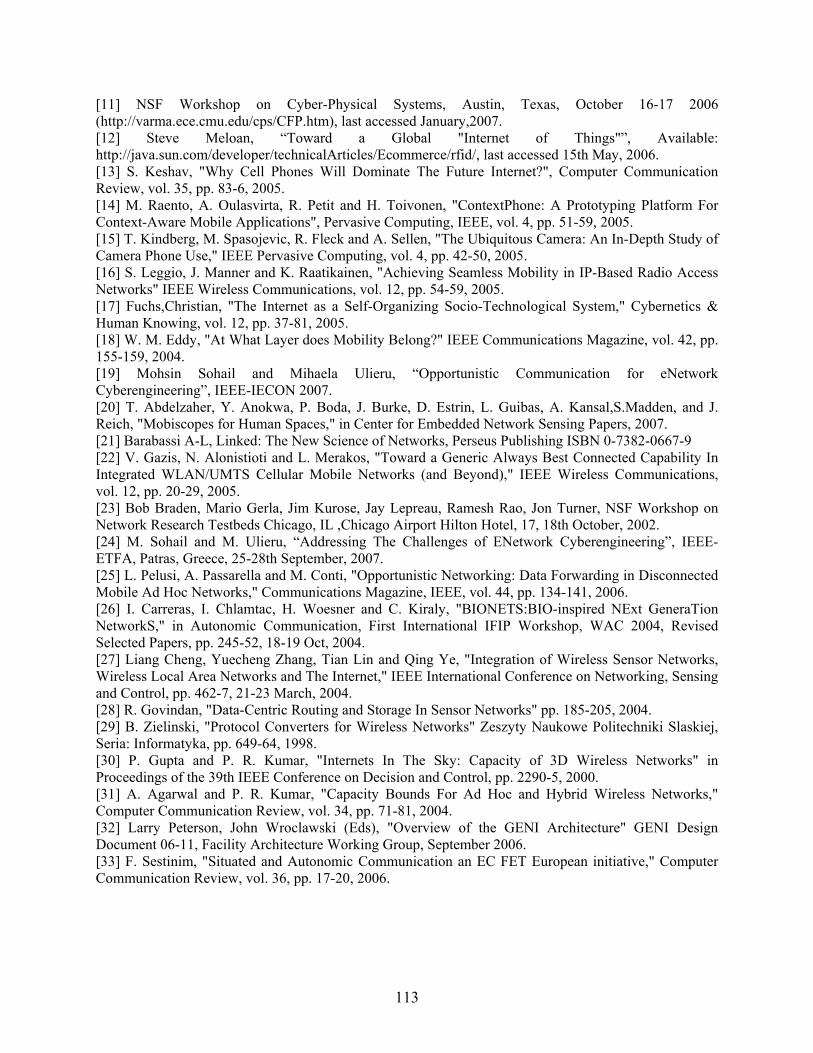
[11] NSF Workshop on Cyber-Physical Systems, Austin, Texas, October 16-17 2006 (http://varma.ece.cmu.edu/cps/CFP.htm), last accessed January,2007. [12] Steve Meloan, “Toward a Global "Internet of Things"”, Available: http://java.sun.com/developer/technicalArticles/Ecommerce/rfid/, last accessed 15th May, 2006. [13] S. Keshav, "Why Cell Phones Will Dominate The Future Internet?", Computer Communication Review, vol. 35, pp. 83-6, 2005. [14] M. Raento, A. Oulasvirta, R. Petit and H. Toivonen, "ContextPhone: A Prototyping Platform For Context-Aware Mobile Applications", Pervasive Computing, IEEE, vol. 4, pp. 51-59, 2005. [15] T. Kindberg, M. Spasojevic, R. Fleck and A. Sellen, "The Ubiquitous Camera: An In-Depth Study of Camera Phone Use," IEEE Pervasive Computing, vol. 4, pp. 42-50, 2005. [16] S. Leggio, J. Manner and K. Raatikainen, "Achieving Seamless Mobility in IP-Based Radio Access Networks" IEEE Wireless Communications, vol. 12, pp. 54-59, 2005. [17] Fuchs,Christian, "The Internet as a Self-Organizing Socio-Technological System," Cybernetics & Human Knowing, vol. 12, pp. 37-81, 2005. [18] W. M. Eddy, "At What Layer does Mobility Belong?" IEEE Communications Magazine, vol. 42, pp. 155-159, 2004. [19] Mohsin Sohail and Mihaela Ulieru, “Opportunistic Communication for eNetwork Cyberengineering”, IEEE-IECON 2007. [20] T. Abdelzaher, Y. Anokwa, P. Boda, J. Burke, D. Estrin, L. Guibas, A. Kansal,S.Madden, and J. Reich, "Mobiscopes for Human Spaces," in Center for Embedded Network Sensing Papers, 2007. [21] Barabassi A-L, Linked: The New Science of Networks, Perseus Publishing ISBN 0-7382-0667-9 [22] V. Gazis, N. Alonistioti and L. Merakos, "Toward a Generic Always Best Connected Capability In Integrated WLAN/UMTS Cellular Mobile Networks (and Beyond)," IEEE Wireless Communications, vol. 12, pp. 20-29, 2005. [23] Bob Braden, Mario Gerla, Jim Kurose, Jay Lepreau, Ramesh Rao, Jon Turner, NSF Workshop on Network Research Testbeds Chicago, IL ,Chicago Airport Hilton Hotel, 17, 18th October, 2002. [24] M. Sohail and M. Ulieru, “Addressing The Challenges of ENetwork Cyberengineering”, IEEE-ETFA, Patras, Greece, 25-28th September, 2007. [25] L. Pelusi, A. Passarella and M. Conti, "Opportunistic Networking: Data Forwarding in Disconnected Mobile Ad Hoc Networks," Communications Magazine, IEEE, vol. 44, pp. 134-141, 2006. [26] I. Carreras, I. Chlamtac, H. Woesner and C. Kiraly, "BIONETS:BIO-inspired NExt GeneraTion NetworkS," in Autonomic Communication, First International IFIP Workshop, WAC 2004, Revised Selected Papers, pp. 245-52, 18-19 Oct, 2004. [27] Liang Cheng, Yuecheng Zhang, Tian Lin and Qing Ye, "Integration of Wireless Sensor Networks, Wireless Local Area Networks and The Internet," IEEE International Conference on Networking, Sensing and Control, pp. 462-7, 21-23 March, 2004. [28] R. Govindan, "Data-Centric Routing and Storage In Sensor Networks" pp. 185-205, 2004. [29] B. Zielinski, "Protocol Converters for Wireless Networks" Zeszyty Naukowe Politechniki Slaskiej, Seria: Informatyka, pp. 649-64, 1998. [30] P. Gupta and P. R. Kumar, "Internets In The Sky: Capacity of 3D Wireless Networks" in Proceedings of the 39th IEEE Conference on Decision and Control, pp. 2290-5, 2000. [31] A. Agarwal and P. R. Kumar, "Capacity Bounds For Ad Hoc and Hybrid Wireless Networks," Computer Communication Review, vol. 34, pp. 71-81, 2004. [32] Larry Peterson, John Wroclawski (Eds), "Overview of the GENI Architecture" GENI Design Document 06-11, Facility Architecture Working Group, September 2006. [33] F. Sestinim, "Situated and Autonomic Communication an EC FET European initiative," Computer Communication Review, vol. 36, pp. 17-20, 2006.
113
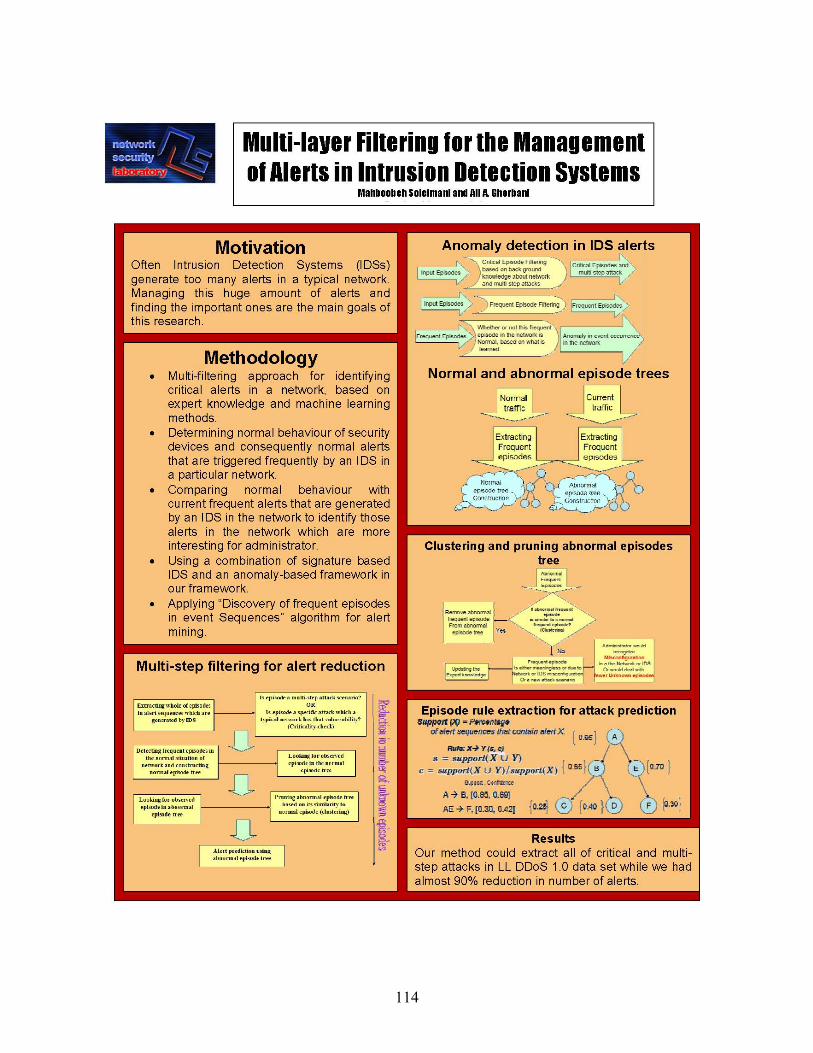
114
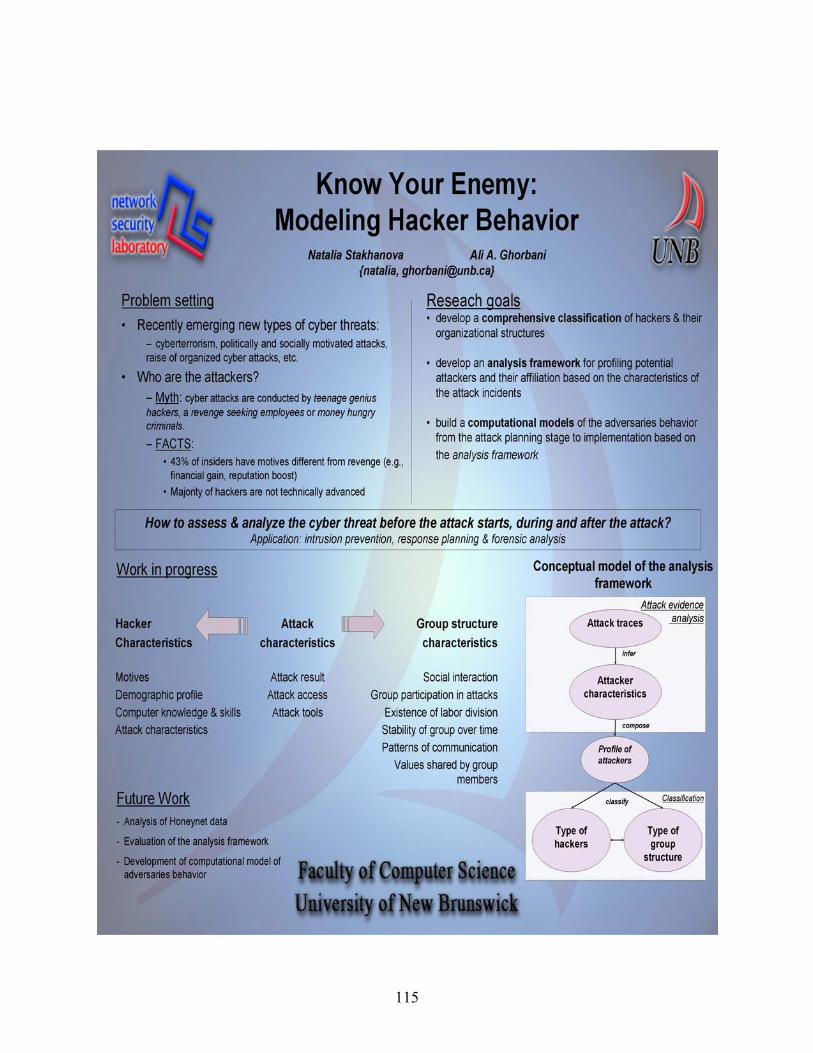
115

Three Dimensional Image Registration Matthew D. Williamson, Bradford G. Nickerson and Tom A. Al
Abstract Computed Tomography (CT) scans of rock samples yield high resolution three dimensional (3D) images. One property of rock that is particularly interesting to Geologists is its diffusion coefficient, which is proportional to the porosity, or “ratio of the volume of pore space to the bulk volume [of the rock]” [4]. Measurements of porosity and ultimately the diffusion coefficient of a specific rock sample can be obtained by observing the propagation of an iodide solution throughout that sample over time. Since the diffusion coefficient of a sample has been found “to [not only] depend on the magnitude of the porosity but also on its spatial distribution” [5], using X-ray imaging in determining spatially varying diffusion characteristics is a useful way to observe such properties of rock. Repeated CT imaging of the rock sample (for example at 1, 4, 8, and 24 hours) shows how the iodide solution has moved throughout the sample over time, and collectively allows us to observe and understand the behavior of the iodide solution within the rock without having to disturb the sample. This paper discusses one approach for registering mulitple 3D images images using the natural features of the rock samples. 1 Introduction The images in this case are grey scale 16-bit images, with 65536 possible values at each voxel (see figures 1 and 2). Each 3D image contains 1024 “slices” of 1024 by 1024 2D images, where each slice shows one cross-section of the rock sample. Thus, one 3D image requires at least 2× 109 bytes (2 GB) to store. Assuming the images are properly registered, we can calculate changes in x-ray intensity due to the iodide by linearizing using log transformations [5] [3]. These calculations depend on the images being accurately registered. We present an efficient algorithm to register any two CT images of rock samples using properties that are extracted directly from the sample in an automated approach. 2 Methodology Figure 3 illustrates the overall view of the image registration and resampling process. 2.1 Feature Extraction 3D images (1024 image slices) are traversed in such a way that only voxels within a circular radius r are visited due to the noise introduced by the epoxy coating on the outside of the sample. High intensity voxels are filtered and remembered in a linked list of “seed” voxels. This list is then traversed, and regions are “grown” around the seed voxels, as illustrated in Figure 4. The region growing process is adaptive, and relies on threshold parameters to ensure that regions have relatively homogeneous intensities and are of a reasonable size to compute meaningful spatial properties. The region growing algorithm is illustrated in Figure 5.
116
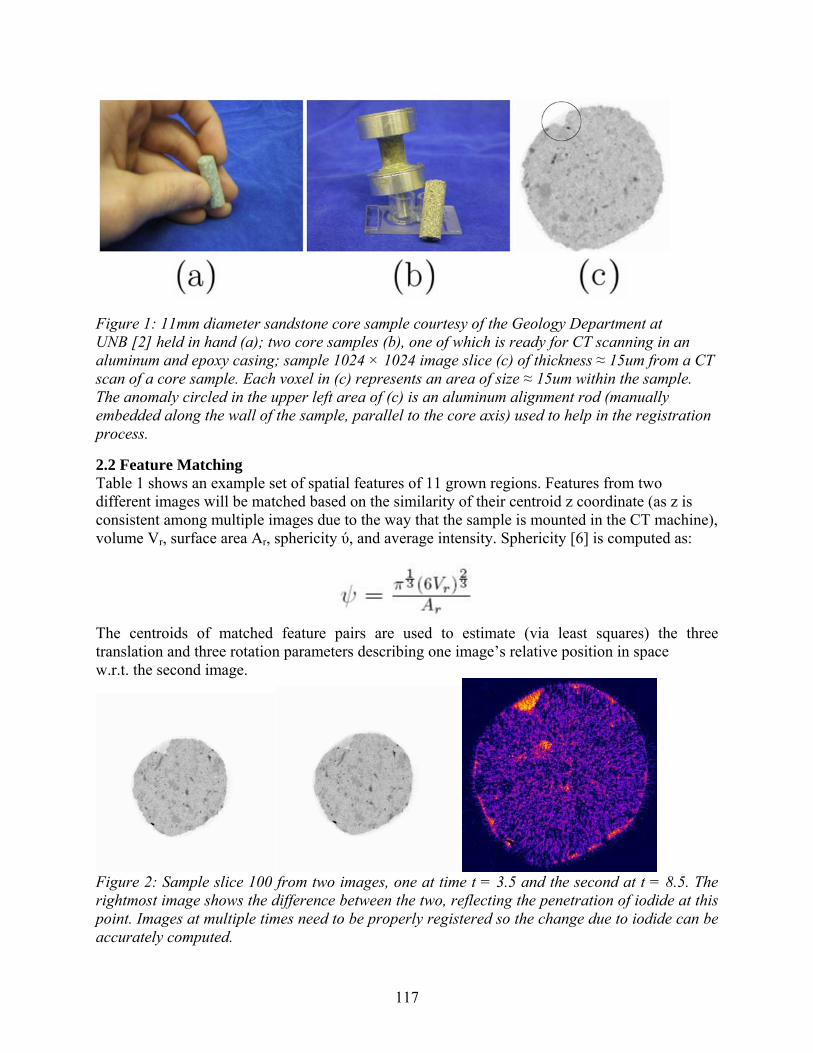
Figure 1: 11mm diameter sandstone core sample courtesy of the Geology Department at UNB [2] held in hand (a); two core samples (b), one of which is ready for CT scanning in an aluminum and epoxy casing; sample 1024 × 1024 image slice (c) of thickness ≈ 15um from a CT scan of a core sample. Each voxel in (c) represents an area of size ≈ 15um within the sample. The anomaly circled in the upper left area of (c) is an aluminum alignment rod (manually embedded along the wall of the sample, parallel to the core axis) used to help in the registration process.
2.2 Feature Matching Table 1 shows an example set of spatial features of 11 grown regions. Features from two different images will be matched based on the similarity of their centroid z coordinate (as z is consistent among multiple images due to the way that the sample is mounted in the CT machine), volume Vr, surface area Ar, sphericity ύ, and average intensity. Sphericity [6] is computed as:
The centroids of matched feature pairs are used to estimate (via least squares) the three translation and three rotation parameters describing one image’s relative position in space w.r.t. the second image.
Figure 2: Sample slice 100 from two images, one at time t = 3.5 and the second at t = 8.5. The rightmost image shows the difference between the two, reflecting the penetration of iodide at this point. Images at multiple times need to be properly registered so the change due to iodide can be accurately computed.
117
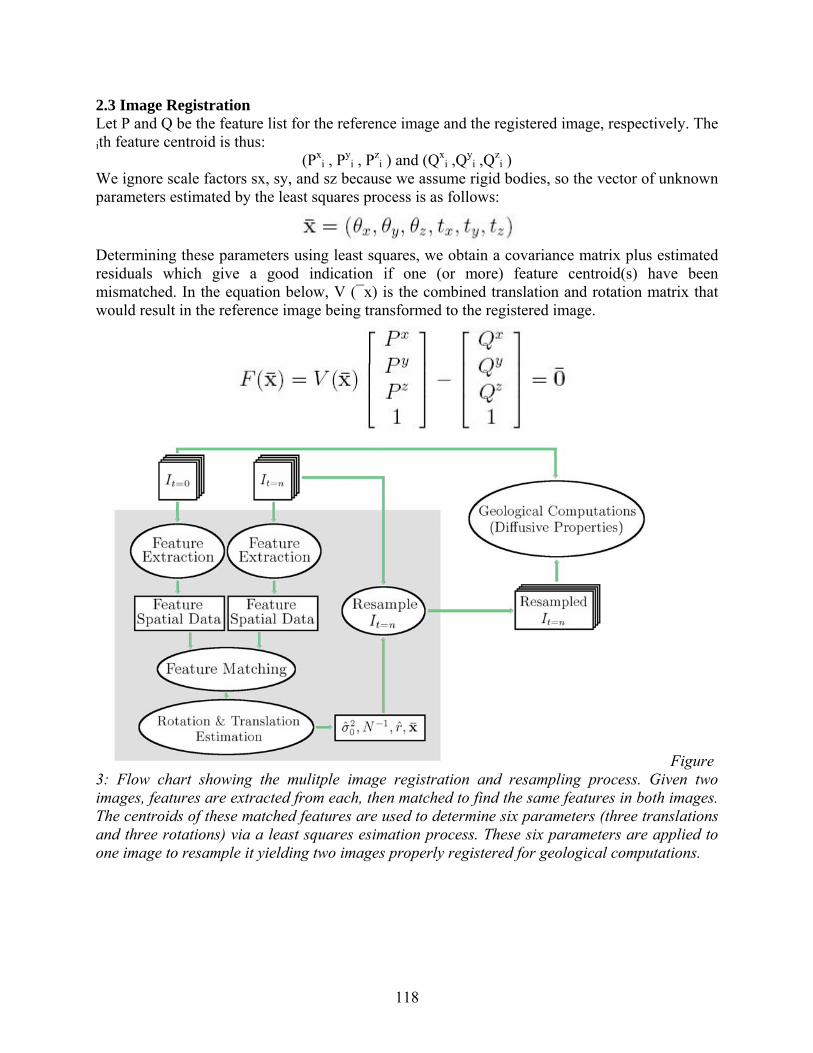
2.3 Image Registration Let P and Q be the feature list for the reference image and the registered image, respectively. The ith feature centroid is thus:
(Pxi , Py
i , Pzi ) and (Qx
i ,Qyi ,Qz
i ) We ignore scale factors sx, sy, and sz because we assume rigid bodies, so the vector of unknown parameters estimated by the least squares process is as follows:
Determining these parameters using least squares, we obtain a covariance matrix plus estimated residuals which give a good indication if one (or more) feature centroid(s) have been mismatched. In the equation below, V (¯x) is the combined translation and rotation matrix that would result in the reference image being transformed to the registered image.
Figure 3: Flow chart showing the mulitple image registration and resampling process. Given two images, features are extracted from each, then matched to find the same features in both images. The centroids of these matched features are used to determine six parameters (three translations and three rotations) via a least squares esimation process. These six parameters are applied to one image to resample it yielding two images properly registered for geological computations.
118
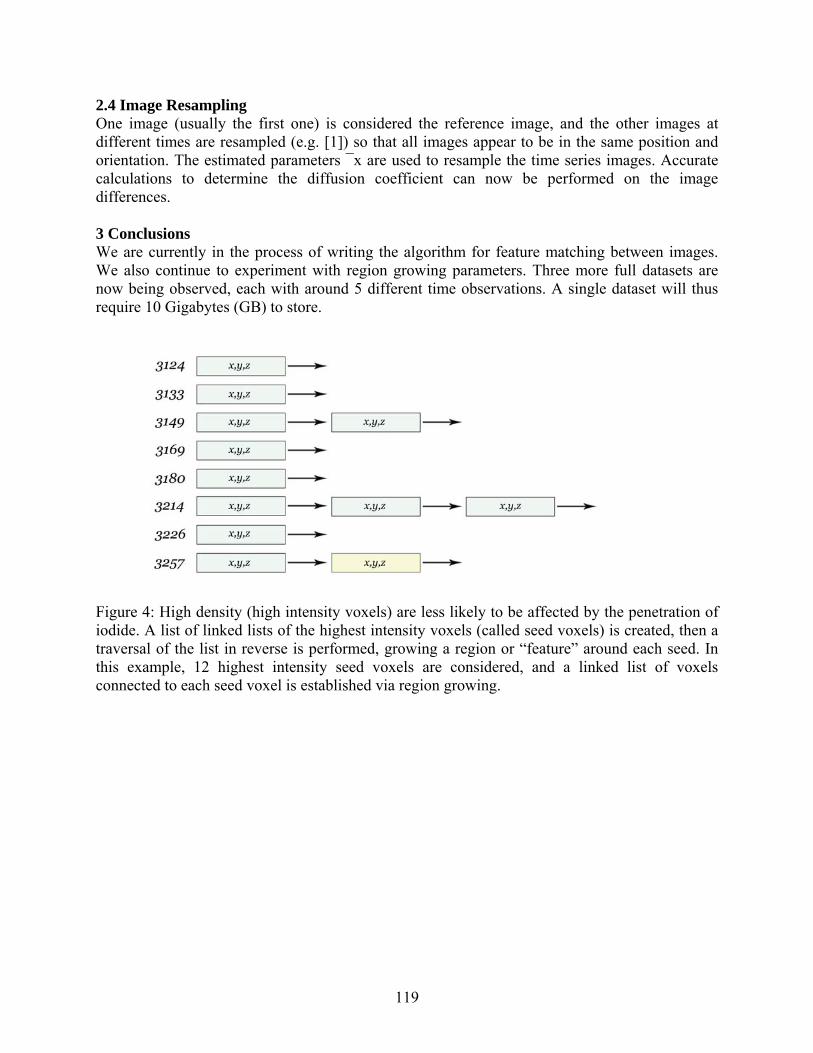
2.4 Image Resampling One image (usually the first one) is considered the reference image, and the other images at different times are resampled (e.g. [1]) so that all images appear to be in the same position and orientation. The estimated parameters ¯x are used to resample the time series images. Accurate calculations to determine the diffusion coefficient can now be performed on the image differences. 3 Conclusions We are currently in the process of writing the algorithm for feature matching between images. We also continue to experiment with region growing parameters. Three more full datasets are now being observed, each with around 5 different time observations. A single dataset will thus require 10 Gigabytes (GB) to store.
Figure 4: High density (high intensity voxels) are less likely to be affected by the penetration of iodide. A list of linked lists of the highest intensity voxels (called seed voxels) is created, then a traversal of the list in reverse is performed, growing a region or “feature” around each seed. In this example, 12 highest intensity seed voxels are considered, and a linked list of voxels connected to each seed voxel is established via region growing.
119
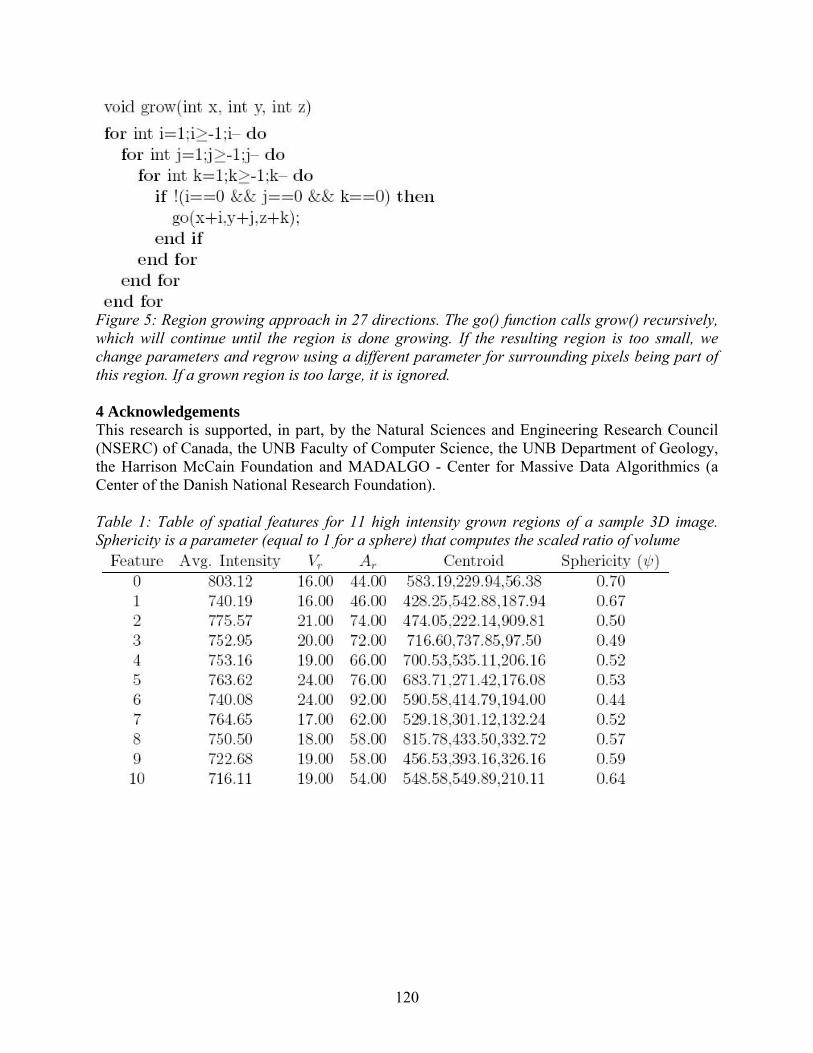
Figure 5: Region growing approach in 27 directions. The go() function calls grow() recursively, which will continue until the region is done growing. If the resulting region is too small, we change parameters and regrow using a different parameter for surrounding pixels being part of this region. If a grown region is too large, it is ignored. 4 Acknowledgements This research is supported, in part, by the Natural Sciences and Engineering Research Council (NSERC) of Canada, the UNB Faculty of Computer Science, the UNB Department of Geology, the Harrison McCain Foundation and MADALGO - Center for Massive Data Algorithmics (a Center of the Danish National Research Foundation). Table 1: Table of spatial features for 11 high intensity grown regions of a sample 3D image. Sphericity is a parameter (equal to 1 for a sphere) that computes the scaled ratio of volume
120
References [1] Li Aili, Klaus Mueller, and Thomas Ernst. Methods for efficient, high quality volume resampling in the frequency domain. IEEE Visualization, Oct. 2004. [2] Tom Al. 3d ct scan datatset of core sandstone. 10243 voxel 3D image. Received Jan. 23, 2007. [3] Tom Al. Technical documentation on ct data and current methods used to calculate diffusion properties. Received Jan. 23, 2007. [4] F. Marica, Q. Chen, A. Hamilton, C. Hall, T. Al, and B.J. Balcom. Spatially resolved measurement of rock core porosity. Journal of Magnetic Resonance, 178:136–141, 2006. [5] Vincent C. Tidwell, Lucy C. Meigs, Tracy Christian-Frear, and Craig M. Boney. Effects of spatially heterogeneous porosity on matrix diffusion as investigated by x-ray absorption imaging. Journal of Contaminant Hydrology, 42:285–302, 2000. [6] Hakon Wadell. Volume, shape and roundness of quartz particles. Journal of Geology, 43:250–280, 1935.
121

A Novel Method of Estimating the Number of Clusters in a Dataset Reza Zafarani and Ali A. Ghorbani
Abstract An important part of ongoing research in the area of clustering is dedicated to the problem of dynamism. Dynamism deals with the fact that the number of clusters of a set of data points are usually unknown. As of now, most of the clustering algorithms preset this value or accept this value as the algorithm's input. Dynamic clustering algorithms attempt to find the optimal value for the number of clusters that best fits the data points. In this paper the blueprints of a novel approach which deals with the same problem is proposed. 1 Introduction Most previous contributions in the area of clustering consider the number of clusters as an input parameter. Early literature in the area of dynamic clustering have attempted to solve this by running algorithms for several Ks (number of clusters) and selecting the best K [1, 2] among them based on some coefficients or statistics [3]. For example, the distance between two cluster centroids normalized by cluster's standard deviation could be used as a coefficient [4]. Another famous coefficient is the Silhouette coefficient, which compares the average distance value between points in the same cluster and the average distance value between points in different clusters. These coefficients are plotted as a function of K (number of clusters) and the best K is selected. Another avenue of research in the area of dynamism is directed toward probabilistic measures of the best fit model in mixture models. In this area, an optimal K corresponds to the best fitting model. Some famous criteria in this area are BIC, MDL, and MML. 2 The Oracle of Clustering and the Number of Clusters This research takes the assumption of the existence of a function, called the Oracle, that can predict whether two random data points belong to the same cluster or not. The Oracle function can be represented using the following formula:
2.1 How to Approximate the Oracle? A simple yet effective approach to predict the Oracle is to use thresholding on the similarity function between the data; therefore, equation 1 is rewritten in the following form:
A justifiable threshold could be a linear combination of the mean and standard deviation of the similarities between the data. A more involved way to approximate the Oracle is to use methods based on ensemble clustering. To put it in a nutshell, two points are considered to be in the same cluster if a majority of different clustering algorithms consider them to be in the same cluster. However, this method can be computationally inefficient.
122

2.2 How to Predict the Number of Clusters Using the Oracle This research's early studies have revealed that given this Oracle function and using Monte Carlo sampling (controlled by chernoff bounds) of this Oracle function, the probability of random points being in the same cluster can be estimated. This probability can be used to predict the number of clusters. This probability is in fact:
Where ai, m, and n are the size cluster of cluster i, the number of clusters, and the dataset size, respectively. This formula links this problem to the research avenues in Partition Theory, and more specifically, variations of Kloosterman sums and summand distributions in integer partitions [5]. A reasonable way to predict the number of clusters (m) from these probabilities is to use methods in Partition Theory along with the methods in Convex Optimization [6]. References 1. Milligan, G., Cooper, M.: An examination of procedures for determining the number of clusters in a data set. Psychometrika 50(2) (1985) 159-179 2. Pelleg, D., Moore, A.: X-means: Extending K-means with efficient estimation of the number of clusters. Proceedings of the 17th International Conf. on Machine Learning (2000) 727-734 3. Tibshirani, R., Walther, G., Hastie, T.: Estimating the number of clusters in a data set via the gap statistic. Journal of the Royal Statistical Society. Series B (Statistical Methodology) 63(2) (2001) 411-423 4. Guan, Y., Ghorbani, A., Belacel, N.: Y-means: A clustering method for intrusion detection. Proceedings of Canadian Conference on Electrical and Computer Engineering (2003) 4-7
�5. Erd os, P., Lehner, J.: The distribution of the number of summands in the partitions of a positive integer. Duke Math. J 8(2) (1941) 335-345 6. Boyd, S., Vandenberghe, L.: Convex Optimization. Cambridge University Press (2004)
123

Author Index Al, Tom 116Allen, Matthew 1Arp, John-Paul 78Aubanel, Eric 73, 101Bagheri, Ebrahim 6Beatty, Timothy 8Bhavsar, Virendra 95Boley, Harold 13, 17Craig, Benjamin 13, 17DeDourek, John 90Dema, Tshering 13, 21Deng, Ke 79Emond, Bruno 1Ensan, Faezeh 22Evans, Patricia 95, 101Gharibian, Farnaz 28, 52Ghorbani, Ali 57, 114, 115, 122Hall, Thomas 33Hay, Colin 64Kent, Kenneth 8, 28, 33, 52Le, Thuy Thi Thu 85Li, Jingguang 45Libby, Joseph 52Lu, Wei 57Ma, Sai 45McIver, William 1, 64Nickerson, Bradford 73, 79, 85, 116Park, Shihyon 90Sharma, Rachita 95Sherman, Greg 13, 17Snow, Eric 101Sohail, Mohsin 106Soleimani, Mahboobeh 114Stakhanova, Natalia 115Williamson, Matthew 116Zafarani, Reza 122Zhao, Judy 13, 17
124