Embed Size (px)
Citation preview
Tat Chee Avenue, Kowloon, Hong Kong, China. Tel: (852) 2788 7359Email: [email protected] http://www.cityu.edu.hk/gcacic/
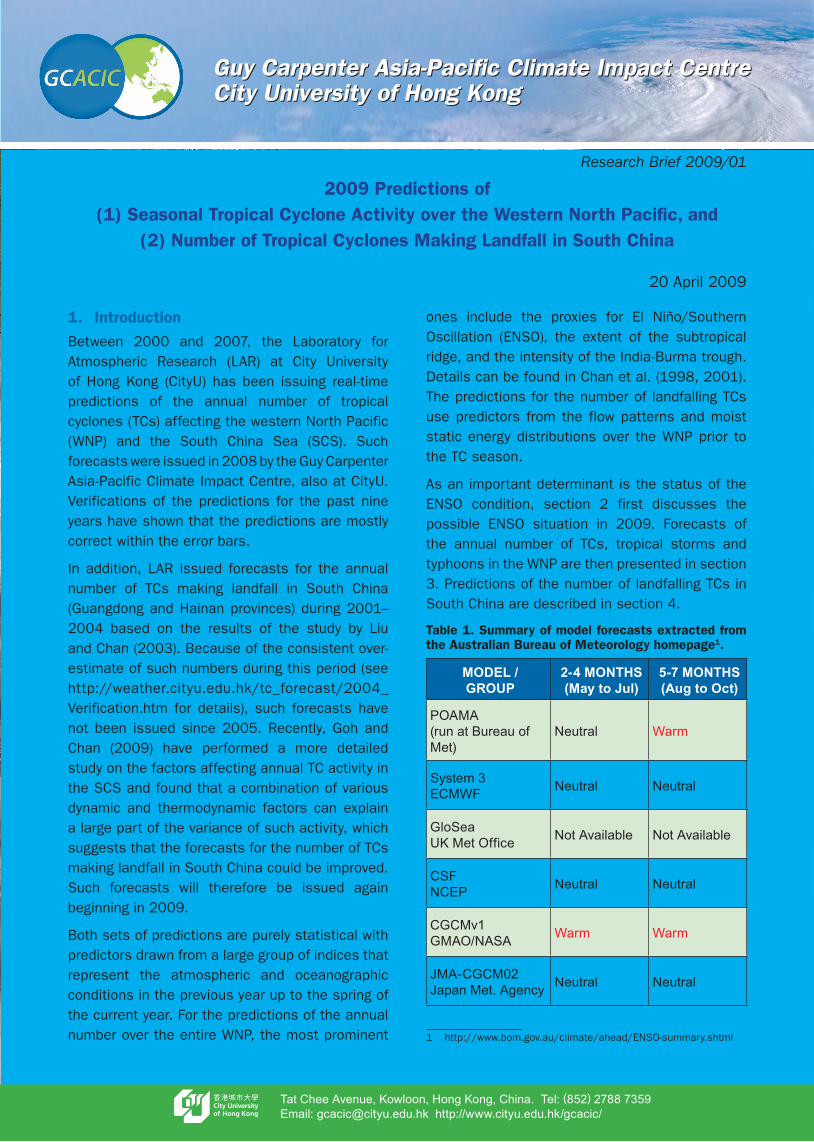
Research Brief 2009/01
2009 Predictions of(1) Seasonal Tropical Cyclone Activity over the Western North Pacific, and
(2) Number of Tropical Cyclones Making Landfall in South China
20 April 2009
1. Introduction
Between 2000 and 2007, the Laboratory for Atmospheric Research (LAR) at City University of Hong Kong (CityU) has been issuing real-time predictions of the annual number of tropical cyclones (TCs) affecting the western North Pacific (WNP) and the South China Sea (SCS). Such forecasts were issued in 2008 by the Guy Carpenter Asia-Pacific Climate Impact Centre, also at CityU. Verifications of the predictions for the past nine years have shown that the predictions are mostly correct within the error bars.
In addition, LAR issued forecasts for the annual number of TCs making landfall in South China (Guangdong and Hainan provinces) during 2001–2004 based on the results of the study by Liu and Chan (2003). Because of the consistent over-estimate of such numbers during this period (see http://weather.cityu.edu.hk/tc_forecast/2004_Verification.htm for details), such forecasts have not been issued since 2005. Recently, Goh and Chan (2009) have performed a more detailed study on the factors affecting annual TC activity in the SCS and found that a combination of various dynamic and thermodynamic factors can explain a large part of the variance of such activity, which suggests that the forecasts for the number of TCs making landfall in South China could be improved. Such forecasts will therefore be issued again beginning in 2009.
Both sets of predictions are purely statistical with predictors drawn from a large group of indices that represent the atmospheric and oceanographic conditions in the previous year up to the spring of the current year. For the predictions of the annual number over the entire WNP, the most prominent
ones include the proxies for El Niño/Southern Oscillation (ENSO), the extent of the subtropical ridge, and the intensity of the India-Burma trough. Details can be found in Chan et al. (1998, 2001). The predictions for the number of landfalling TCs use predictors from the flow patterns and moist static energy distributions over the WNP prior to the TC season.
As an important determinant is the status of the ENSO condition, section 2 first discusses the possible ENSO situation in 2009. Forecasts of the annual number of TCs, tropical storms and typhoons in the WNP are then presented in section 3. Predictions of the number of landfalling TCs in South China are described in section 4.
Table 1. Summary of model forecasts extracted from the Australian Bureau of Meteorology homepage1.
MODEL / GROUP
2-4 MONTHS (May to Jul)
5-7 MONTHS (Aug to Oct)
POAMA (run at Bureau of Met)
Neutral Warm
System 3 ECMWF Neutral Neutral
GloSea UK Met Office Not Available Not Available
CSF NCEP Neutral Neutral
CGCMv1 GMAO/NASA Warm Warm
JMA-CGCM02 Japan Met. Agency Neutral Neutral
1 http://www.bom.gov.au/climate/ahead/ENSO-summary.shtml

2. ENSO conditions in 2009
The oceanic and atmospheric conditions in the Pacific suggested a possible La Niña situation since December 2008. However, this situation may be ending as the Niño3.4 and Niño4 indices in March are respectively only -0.55 and -0.37. At the same time, warming of the central and east equatorial Pacific is observed and may continue in the summer. A summary of the various ENSO model forecasts from different climate centres suggests that most of them predict a neutral or warm condition in 5 to 7 months time (Table. 1). Out of the 6 forecasts, 3 suggest that the ENSO will return to its neutral condition during the summer and 2 show the possible development of a weak El Niño event. It therefore appears that for the rest of 2009, a redevelopment of La Niña conditions is not likely, but El Niño conditions remain possible. In other words, 2009 will likely be an ENSO-neutral year with the possibility of a development of a weak warm event.
3. Predictions for the WNP
The ENSO predictor (NINO4 index) suggests a slightly above-normal overall TC activity while the other predictors give a near-normal activity (Table 2). The final forecast is therefore for a normal overall TC activity.
For the number of tropical storms and typhoons, all the predictors give a consistent forecast of normal activity (ranging from 26 to 27) so that a normal TC activity (27 tropical storms and typhoons) is expected for this category.
A slight difference in the forecasts from non-ENSO and ENSO predictors for the number of typhoons exists. The ENSO predictors (NINO3.4 index and equatorial SOI index) suggest a slightly above-normal TC activity (predicted numbers being 20 and 19 respectively) while the other predictors forecast a near-normal to slightly above-normal TC activity, with predicted numbers ranging from 16 to 19. A weighted forecast based on the correlations gives a final forecast of 18 typhoons, which is near the normal number.
Thus, it is expected that the overall TC activity, the number of tropical storms and typhoons as well
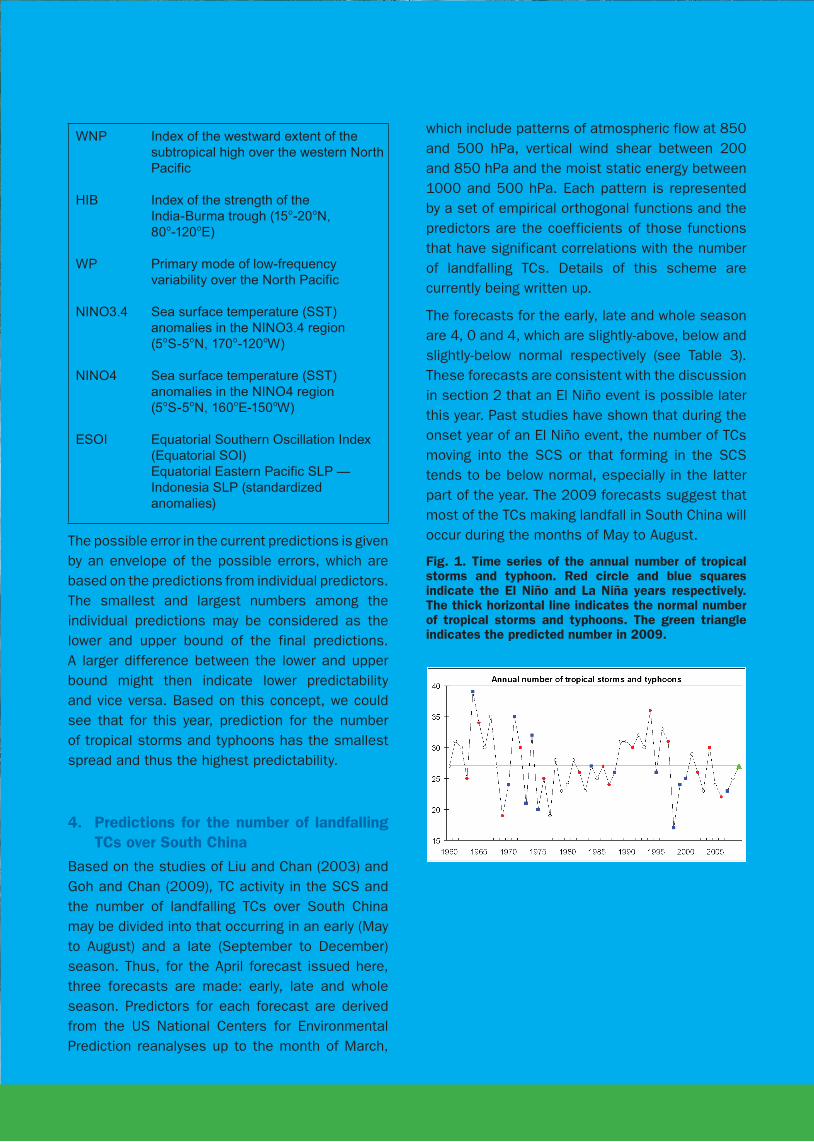
as the number of typhoons are likely to be near-normal. The quantitative predictions are given in Table 2. The predicted number of tropical storms and typhoons is also shown in Fig.1 for comparison with the previous years.
The low-level easterly wind anomalies have persisted over the western and central tropical Pacific Ocean since 2008 (Fig. 2), which has been suggested as one of the factors responsible for the below-normal TC activity in the 2008 TC season. Such anomalies are still observed in March 2009. However, a weakening of the easterly winds is observed recently and anomalous westerly winds have occurred in the central equatorial Pacific in the first week of April. If this trend continues, the atmospheric condition will become more favorable for TC formation. This is consistent with the predicted more active TC season in 2009 as compared with the 2008 TC season.
Table 2. Forecasts of the annual TC activity in the WNP from various predictors and the weighted average of the forecasts.
All TC
PredictorHWNPHIBNINO4
Prediction303033
Weight0.660.660.70
Final forecastNormal
3131
Tropical storms and typhoons
PredictorHWNPHIBWPNINO3.4
Prediction27262627
Weight0.680.670.620.67
Final forecastNormal
2727
Typhoons
PredictorHWNPHIBWPNINO3.4ESOI
Prediction1617192019
Weight0.570.590.520.730.64
Final forecastNormal
1817
WNP
HIB
WP
NINO3.4
NINO4
ESOI
Index of the westward extent of the subtropical high over the western North Pacific
Index of the strength of the India-Burma trough (15o-20oN, 80o-120oE)
Primary mode of low-frequency variability over the North Pacific
Sea surface temperature (SST) anomalies in the NINO3.4 region (5oS-5oN, 170o-120oW)
Sea surface temperature (SST) anomalies in the NINO4 region (5oS-5oN, 160oE-150oW)
Equatorial Southern Oscillation Index (Equatorial SOI)Equatorial Eastern Pacific SLP — Indonesia SLP (standardized anomalies)
The possible error in the current predictions is given by an envelope of the possible errors, which are based on the predictions from individual predictors. The smallest and largest numbers among the individual predictions may be considered as the lower and upper bound of the final predictions. A larger difference between the lower and upper bound might then indicate lower predictability and vice versa. Based on this concept, we could see that for this year, prediction for the number of tropical storms and typhoons has the smallest spread and thus the highest predictability.
4. Predictions for the number of landfalling TCs over South China
Based on the studies of Liu and Chan (2003) and Goh and Chan (2009), TC activity in the SCS and the number of landfalling TCs over South China may be divided into that occurring in an early (May to August) and a late (September to December) season. Thus, for the April forecast issued here, three forecasts are made: early, late and whole season. Predictors for each forecast are derived from the US National Centers for Environmental Prediction reanalyses up to the month of March,
which include patterns of atmospheric flow at 850 and 500 hPa, vertical wind shear between 200 and 850 hPa and the moist static energy between 1000 and 500 hPa. Each pattern is represented by a set of empirical orthogonal functions and the predictors are the coefficients of those functions that have significant correlations with the number of landfalling TCs. Details of this scheme are currently being written up.
The forecasts for the early, late and whole season are 4, 0 and 4, which are slightly-above, below and slightly-below normal respectively (see Table 3). These forecasts are consistent with the discussion in section 2 that an El Niño event is possible later this year. Past studies have shown that during the onset year of an El Niño event, the number of TCs moving into the SCS or that forming in the SCS tends to be below normal, especially in the latter part of the year. The 2009 forecasts suggest that most of the TCs making landfall in South China will occur during the months of May to August.
Fig. 1. Time series of the annual number of tropical storms and typhoon. Red circle and blue squares indicate the El Niño and La Niña years respectively. The thick horizontal line indicates the normal number of tropical storms and typhoons. The green triangle indicates the predicted number in 2009.
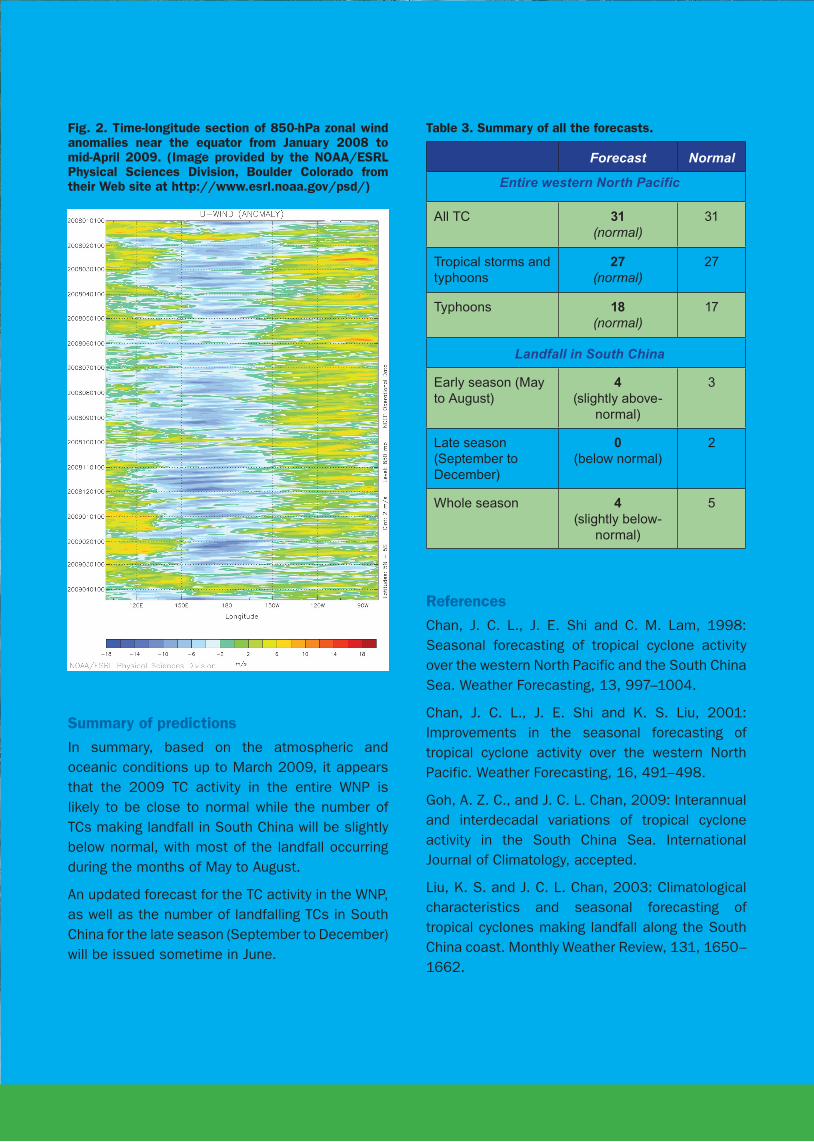
Fig. 2. Time-longitude section of 850-hPa zonal wind anomalies near the equator from January 2008 to mid-April 2009. (Image provided by the NOAA/ESRL Physical Sciences Division, Boulder Colorado from their Web site at http://www.esrl.noaa.gov/psd/)
Summary of predictions
In summary, based on the atmospheric and oceanic conditions up to March 2009, it appears that the 2009 TC activity in the entire WNP is likely to be close to normal while the number of TCs making landfall in South China will be slightly below normal, with most of the landfall occurring during the months of May to August.
An updated forecast for the TC activity in the WNP, as well as the number of landfalling TCs in South China for the late season (September to December) will be issued sometime in June.
Table 3. Summary of all the forecasts.
Forecast Normal
Entire western North Pacific
All TC 31 (normal)
31
Tropical storms and typhoons
27 (normal)
27
Typhoons 18 (normal)
17
Landfall in South China
Early season (May to August)
4 (slightly above-
normal)
3
Late season (September to December)
0 (below normal)
2
Whole season 4 (slightly below-
normal)
5
References
Chan, J. C. L., J. E. Shi and C. M. Lam, 1998: Seasonal forecasting of tropical cyclone activity over the western North Pacific and the South China Sea. Weather Forecasting, 13, 997–1004.
Chan, J. C. L., J. E. Shi and K. S. Liu, 2001: Improvements in the seasonal forecasting of tropical cyclone activity over the western North Pacific. Weather Forecasting, 16, 491–498.
Goh, A. Z. C., and J. C. L. Chan, 2009: Interannual and interdecadal variations of tropical cyclone activity in the South China Sea. International Journal of Climatology, accepted.
Liu, K. S. and J. C. L. Chan, 2003: Climatological characteristics and seasonal forecasting of tropical cyclones making landfall along the South China coast. Monthly Weather Review, 131, 1650–1662.