Embed Size (px)
Citation preview
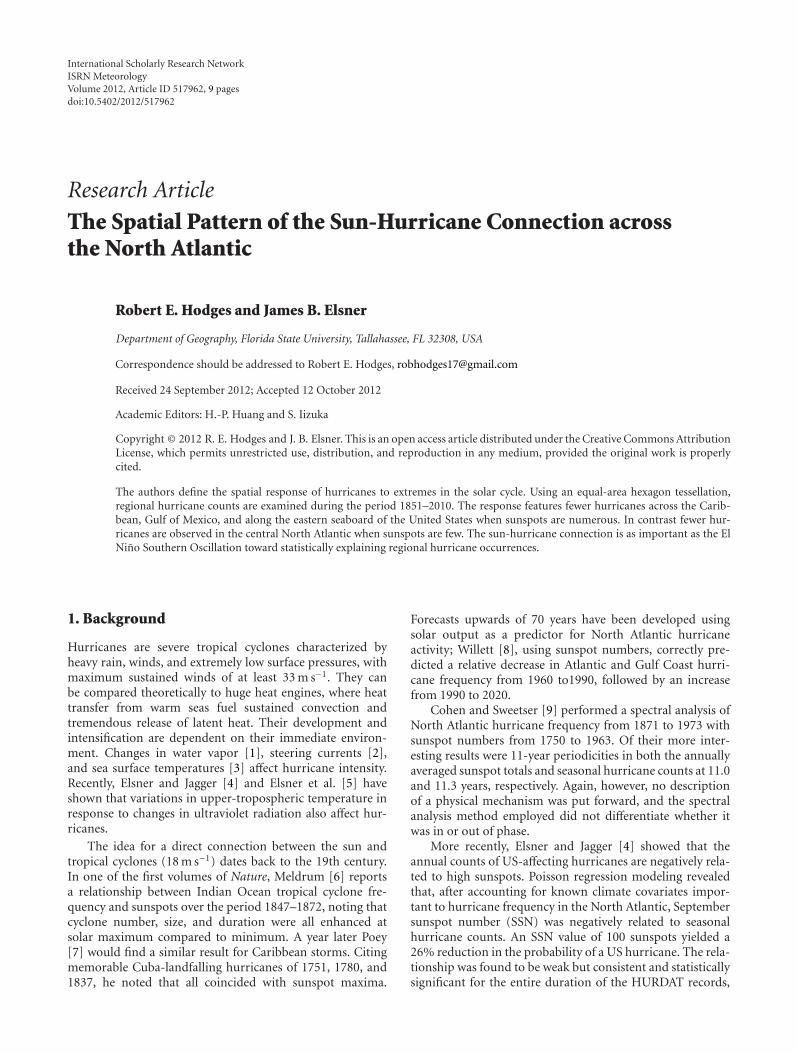
International Scholarly Research NetworkISRN MeteorologyVolume 2012, Article ID 517962, 9 pagesdoi:10.5402/2012/517962
Research Article
The Spatial Pattern of the Sun-Hurricane Connection acrossthe North Atlantic
Robert E. Hodges and James B. Elsner
Department of Geography, Florida State University, Tallahassee, FL 32308, USA
Correspondence should be addressed to Robert E. Hodges, [email protected]
Received 24 September 2012; Accepted 12 October 2012
Academic Editors: H.-P. Huang and S. Iizuka
Copyright © 2012 R. E. Hodges and J. B. Elsner. This is an open access article distributed under the Creative Commons AttributionLicense, which permits unrestricted use, distribution, and reproduction in any medium, provided the original work is properlycited.
The authors define the spatial response of hurricanes to extremes in the solar cycle. Using an equal-area hexagon tessellation,regional hurricane counts are examined during the period 1851–2010. The response features fewer hurricanes across the Carib-bean, Gulf of Mexico, and along the eastern seaboard of the United States when sunspots are numerous. In contrast fewer hur-ricanes are observed in the central North Atlantic when sunspots are few. The sun-hurricane connection is as important as the ElNino Southern Oscillation toward statistically explaining regional hurricane occurrences.
1. Background
Hurricanes are severe tropical cyclones characterized byheavy rain, winds, and extremely low surface pressures, withmaximum sustained winds of at least 33 m s−1. They canbe compared theoretically to huge heat engines, where heattransfer from warm seas fuel sustained convection andtremendous release of latent heat. Their development andintensification are dependent on their immediate environ-ment. Changes in water vapor [1], steering currents [2],and sea surface temperatures [3] affect hurricane intensity.Recently, Elsner and Jagger [4] and Elsner et al. [5] haveshown that variations in upper-tropospheric temperature inresponse to changes in ultraviolet radiation also affect hur-ricanes.
The idea for a direct connection between the sun andtropical cyclones (18 m s−1) dates back to the 19th century.In one of the first volumes of Nature, Meldrum [6] reportsa relationship between Indian Ocean tropical cyclone fre-quency and sunspots over the period 1847–1872, noting thatcyclone number, size, and duration were all enhanced atsolar maximum compared to minimum. A year later Poey[7] would find a similar result for Caribbean storms. Citingmemorable Cuba-landfalling hurricanes of 1751, 1780, and1837, he noted that all coincided with sunspot maxima.
Forecasts upwards of 70 years have been developed usingsolar output as a predictor for North Atlantic hurricaneactivity; Willett [8], using sunspot numbers, correctly pre-dicted a relative decrease in Atlantic and Gulf Coast hurri-cane frequency from 1960 to1990, followed by an increasefrom 1990 to 2020.
Cohen and Sweetser [9] performed a spectral analysis ofNorth Atlantic hurricane frequency from 1871 to 1973 withsunspot numbers from 1750 to 1963. Of their more inter-esting results were 11-year periodicities in both the annuallyaveraged sunspot totals and seasonal hurricane counts at 11.0and 11.3 years, respectively. Again, however, no descriptionof a physical mechanism was put forward, and the spectralanalysis method employed did not differentiate whether itwas in or out of phase.
More recently, Elsner and Jagger [4] showed that theannual counts of US-affecting hurricanes are negatively rela-ted to high sunspots. Poisson regression modeling revealedthat, after accounting for known climate covariates impor-tant to hurricane frequency in the North Atlantic, Septembersunspot number (SSN) was negatively related to seasonalhurricane counts. An SSN value of 100 sunspots yielded a26% reduction in the probability of a US hurricane. The rela-tionship was found to be weak but consistent and statisticallysignificant for the entire duration of the HURDAT records,
2 ISRN Meteorology
reaching back into the mid-19th century. For instance, 1886and 2001 are seasons featuring a low SSN (21.4 sunspots)and a high SSN (150.7 sunspots), respectively, and their cor-responding seasonal US-affecting hurricanes total 7 and 0.
The sun-hurricane connection (hereafter, SHC) pre-sented in Elsner and Jagger [4] indicates fewer intense hurri-canes over the Caribbean and Gulf of Mexico when sunspotswere high. The finding is in accordance with the heat-enginetheory of hurricanes [10], which predicts a reduction in themaximum potential intensity in response to warming in theatmospheric layer near the top of the hurricane. An activesun warms the lower stratosphere and upper tropospherethrough ozone absorption of additional ultraviolet radiation.All else being equal, changes in surface or outflow tempera-ture should produce a change in tropical cyclone maximumwinds: colder (warmer) surface and warmer (colder) outflowtemperatures correspond to a decrease (increase) in tropicalcyclone winds and, by extension, the number of tropicalcyclones reaching hurricane intensity.
The SHC has even been found to be relevant at thedaily timescale [5]. Quantile regression revealed that highsolar activity over the western Caribbean leads to a −4.3 ±1.86 m s−1 mean reduction in daily maximum wind speedand a 90th percentile storm wind reduction from 65.9 to48.1 m s−1, or 27%.
Of interest to the present work, Elsner and Jagger [4]note that high numbers of sunspots correspond with higherintensities in the eastern tropical Atlantic. The geographicdifference, the authors contend, is the result in limitingfactors for cyclone intensity. The western tropical Atlanticfeatures high oceanic heat content compared to the easterntropical Atlantic, rendering the upper-tropospheric warmingfrom increased solar activity the limiting factor in the west.The east, where oceanic heat content is limited, showsincreased sea-surface temperatures when the sun is active[11, 12]. This indicates a spatially heterogeneous responsein hurricane intensity and frequency from solar activity. TheSHC may be prevalent elsewhere over the North Atlanticocean basin. Needed is a more spatially explicit assessmentof the SHC over the North Atlantic basin.
In this paper we define the regional responses in hurri-cane frequency to changes in solar activity. We use a hexagongrid tessellation [13] of the North Atlantic basin and countthe number of hurricanes in each region conditional onSeptember sunspot number. The data used in this study areintroduced in Section 2. In Section 3, we show the procedurefor counting the number of hurricanes passing through eachregion. In Section 4, we condition these seasonal counts onhighs and lows of the solar cycle. In Section 5, we com-pare earlier to later portions of the hurricane records todemonstrate coherency in the overall pattern. In Section 6,we examine the influence of geographic scale on the sun-hurricane connection. In Section 7, we apply the samplingapproach and mapping method used in Section 4 but, for ElNino/La Nina seasons, showing a signal similar in magnitudeto that observed with solar activity. A summary and conclu-sions are presented in Section 8.
2. Data
The best-track dataset contains the six-hourly center loca-tions and intensities of all known tropical cyclones acrossthe North Atlantic basin, including the Gulf of Mexico andCaribbean Sea. The dataset is called HURDAT (HURricaneDATa). It is maintained by the US National Oceanic andAtmospheric Administration at the National Hurricane Cen-ter. Tropical cyclone center locations are given in geographiccoordinates (in tenths of degrees). The intensities, repre-senting the one-minute near-surface (∼10 m) wind speeds,are given in knots (1 kt = 0.5144 m s−1). The minimumcentral pressures are given in millibars (1 mb = 1 hPa).The data are provided in six-hourly intervals starting at 00UTC (Universal Time Coordinate). The version of HURDATused here contains cyclones over the period 1851–2010.Updated information is available online via http://www.nhc.noaa.gov/pastall.shtml#hurdat. Information on the historyand origin of these data is found in Jarvinen et al. [14]. Forthis study, HURDAT is limited to observations of hurricane-force intensity (≥64 knots). Qualifying extratropical andsubtropical storm observations are excluded.
For each cyclone, the HURDAT observations are sixhours apart. For spatial analysis and modeling, this can betoo coarse, as the average forward motion of hurricanes is6 m s−1 (12 kt). Therefore, the data is imputed using inter-polation to one hour. Wind speeds are smoothed using athird-degree polynomial, capturing most of the fluctuationin cyclone intensity without overfitting to the random varia-tions and consistent with the 5 kt precision of the raw windspeed [15].
Solar activity is described via monthly mean internationalsunspot numbers as made available by the National Geo-graphic Data Center (ftp://ftp.ngdc.noaa.gov/STP/SOLARDATA/SUNSPOT NUMBERS/INTERNATIONAL/monthly/MONTHLY). It was originally constructed by Solar Influ-ences Data Analysis Center, World Data Center at the RoyalObservatory of Belgium. Reliable monthly observationsextend back to 1749. Swiss astronomer Johann Rudolph Wolfintroduced a daily measurement technique that accounts fortotal spots observed and the quantity of their clusterings.The dataset addresses observational error by incorporating aweighted average of cooperating observations.
The El Nino Southern Oscillation (ENSO) is a coupledocean-atmospheric phenomenon whose impact on hurri-canes is well established. The Southern Oscillation Index(SOI) anomalies represent the normalized air pressure diffe-rence between Darwin and Tahiti. The change in equatorialPacific SST leads to an atmospheric pressure imbalancewhose far-reaching effects produce wind shear in the NorthAtlantic Main Development Region (MDR) during El Ninophases. Monthly values of the SOI are obtained from theUK Climatic Research Unit (http://www.cru.uea.ac.uk/cru/data/soi/). For technical descriptions of the SOI anomaliesdata, see Allan et al. [16] Konnen et al. [17] Ropelewski andJones [18]. SOI data begin January 1866.
ISRN Meteorology 3
1 2
Hurricane counts
(a)
1 40 80 120 160 200
Hurricane counts
(b)
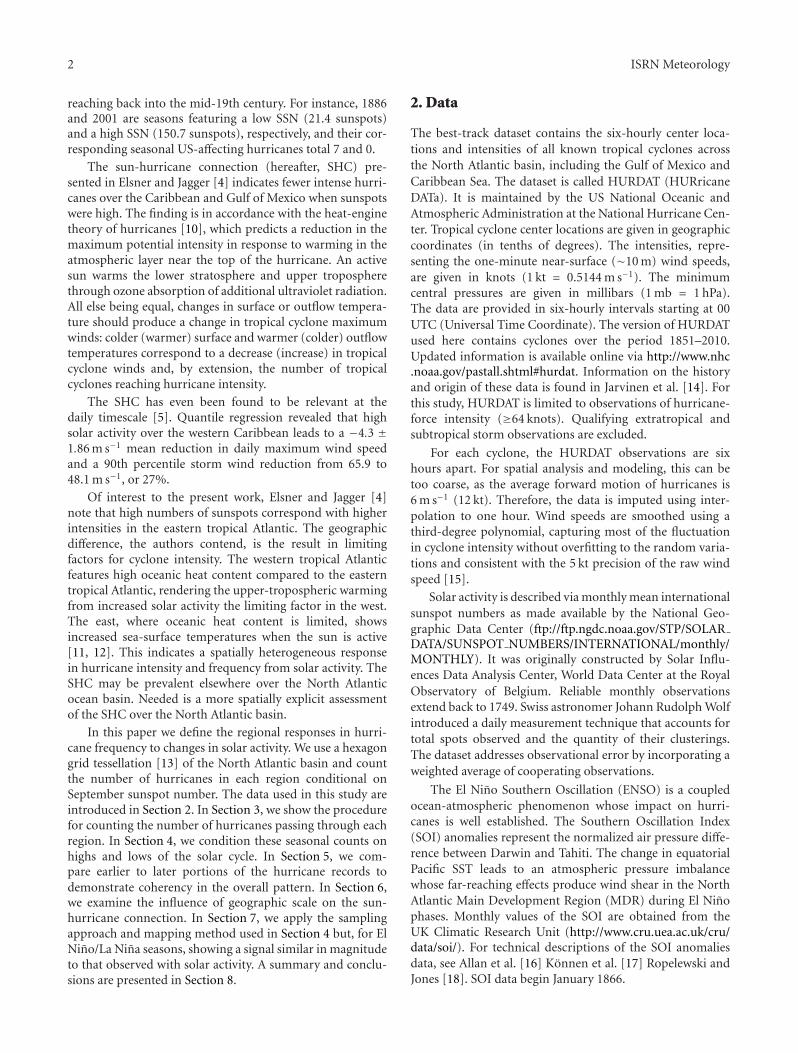
Figure 1: North Atlantic hurricane counts. (a) Hourly interpolated tropical cyclone positions for Florida-landfalling Wilma and open-oceanIrene from the 2005 season. Points in gray (black) indicate a wind speed below (at or above) minimum hurricane intensity (i.e., 64 knots).For each region, the number of hurricanes that pass through it is recorded. A hurricane gets counts once regardless of how long it remainsinside the region. (b) Regional hurricane counts for the study period 1851–2010.
3. Tracks to Grids
We first grid the tropical cyclone track data. We use theprocedure detailed in Elsner et al. [13], creating a hexagontessellation over the North Atlantic. While rectangular gridscan also be used for this study, hexagons more efficiently packthe domain and better capture the directional variability ofhurricane tracks.
For each region, the number of hurricanes that passthrough it is recorded. Figure 1(a) shows hourly track pointsfor two hurricanes and the set of hexagon regions affected bythem. A hurricane gets counted once regardless of how longit remains inside the region.
Figure 1(b) shows hurricane counts over the entire studyperiod (1851–2010) using the counting method illustratedin Figure 1(a). Highest counts occur off the US East Coast,southeast of the Outer Banks of North Carolina, with a maxi-mum of 200 hurricanes over the 160-year period in thatregion.
4. High versus Low Solar Activity: 1851–2010
Having constructed a spatial framework, we next examinehurricanes by region based on solar activity. We use sunspotnumbers for the month of September (hereafter, SSN) asan indicator of solar activity during the peak of the NorthAtlantic hurricane season. This is reasonable as monthly sun-spot numbers do not vary much from one month to thenext. The temporal autocorrelation of all monthly sunspotnumbers from January 1851 through December 2010 at alag of one month is r = +0.93. Eighty-seven percent of thevariance in monthly sunspot numbers is explained by thenumber in the previous month. The high value tells us thata high sunspot number observed in one month is very likely
Year
Sept
embe
r su
nsp
ots
(SSN
)
0
50
100
150
200
1850 1900 1950 2000
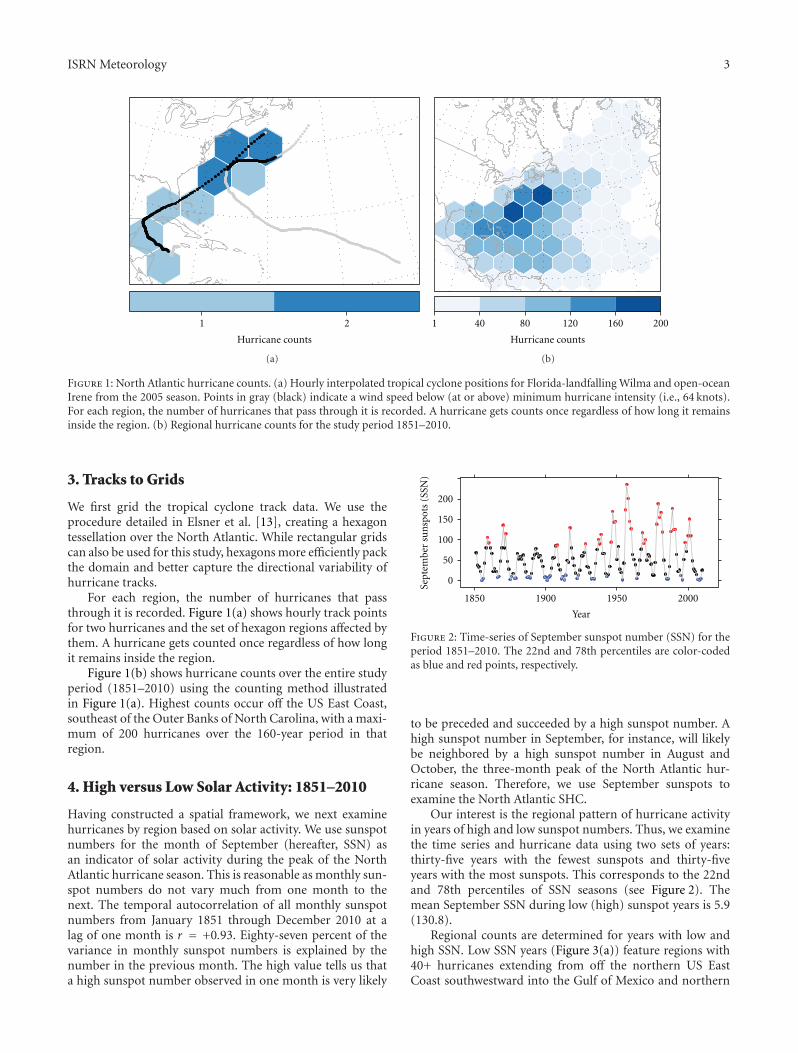
Figure 2: Time-series of September sunspot number (SSN) for theperiod 1851–2010. The 22nd and 78th percentiles are color-codedas blue and red points, respectively.
to be preceded and succeeded by a high sunspot number. Ahigh sunspot number in September, for instance, will likelybe neighbored by a high sunspot number in August andOctober, the three-month peak of the North Atlantic hur-ricane season. Therefore, we use September sunspots toexamine the North Atlantic SHC.
Our interest is the regional pattern of hurricane activityin years of high and low sunspot numbers. Thus, we examinethe time series and hurricane data using two sets of years:thirty-five years with the fewest sunspots and thirty-fiveyears with the most sunspots. This corresponds to the 22ndand 78th percentiles of SSN seasons (see Figure 2). Themean September SSN during low (high) sunspot years is 5.9(130.8).
Regional counts are determined for years with low andhigh SSN. Low SSN years (Figure 3(a)) feature regions with40+ hurricanes extending from off the northern US EastCoast southwestward into the Gulf of Mexico and northern
4 ISRN Meteorology
0 10 20 30 40 50 60
Hurricane counts
(a)
0 10 20 30 40 50 60
Hurricane counts
(b)
Difference in hurricane counts
−20 −15 −10 −5 0 5 10 15 20
(c)
Difference in hurricane counts
−20 −15 −10 −5 0 5 10 15 20
(d)
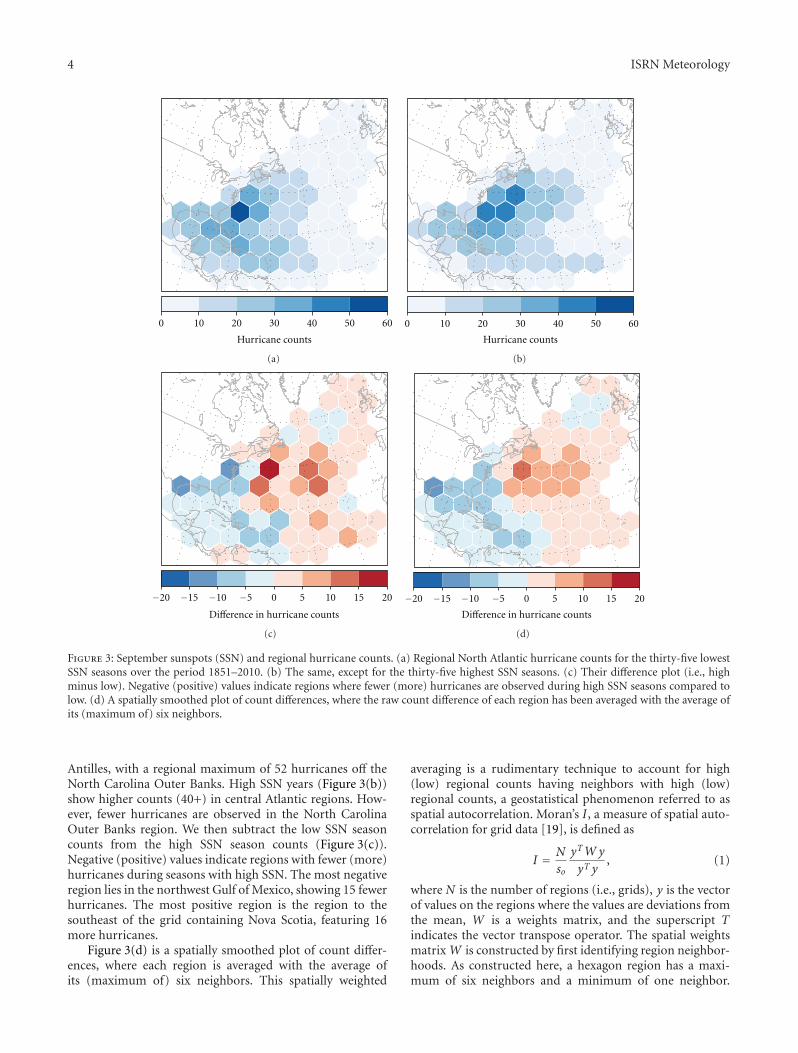
Figure 3: September sunspots (SSN) and regional hurricane counts. (a) Regional North Atlantic hurricane counts for the thirty-five lowestSSN seasons over the period 1851–2010. (b) The same, except for the thirty-five highest SSN seasons. (c) Their difference plot (i.e., highminus low). Negative (positive) values indicate regions where fewer (more) hurricanes are observed during high SSN seasons compared tolow. (d) A spatially smoothed plot of count differences, where the raw count difference of each region has been averaged with the average ofits (maximum of) six neighbors.
Antilles, with a regional maximum of 52 hurricanes off theNorth Carolina Outer Banks. High SSN years (Figure 3(b))show higher counts (40+) in central Atlantic regions. How-ever, fewer hurricanes are observed in the North CarolinaOuter Banks region. We then subtract the low SSN seasoncounts from the high SSN season counts (Figure 3(c)).Negative (positive) values indicate regions with fewer (more)hurricanes during seasons with high SSN. The most negativeregion lies in the northwest Gulf of Mexico, showing 15 fewerhurricanes. The most positive region is the region to thesoutheast of the grid containing Nova Scotia, featuring 16more hurricanes.
Figure 3(d) is a spatially smoothed plot of count differ-ences, where each region is averaged with the average ofits (maximum of) six neighbors. This spatially weighted
averaging is a rudimentary technique to account for high(low) regional counts having neighbors with high (low)regional counts, a geostatistical phenomenon referred to asspatial autocorrelation. Moran’s I , a measure of spatial auto-correlation for grid data [19], is defined as
I = N
so
yTWy
yT y, (1)
where N is the number of regions (i.e., grids), y is the vectorof values on the regions where the values are deviations fromthe mean, W is a weights matrix, and the superscript Tindicates the vector transpose operator. The spatial weightsmatrix W is constructed by first identifying region neighbor-hoods. As constructed here, a hexagon region has a maxi-mum of six neighbors and a minimum of one neighbor.
ISRN Meteorology 5
Neighbors are identified using contiguity. Regions that sharea common border are neighbors. Moran’s I here is theleast-squares linear slope between neighborhood averagesof regional raw count differences upon regional raw countdifferences. The slope can range from −1 to +1; the formerindicates absolute dispersion (e.g., a checker-board pattern),and the latter indicates absolute correlation. The computedslope coefficient is +0.51 (P < 0.01), indicating a fairly largeand significant amount of spatial autocorrelation.
Returning to Figure 3(c), the regional hurricane countdifferences between low and high SSN seasons range in mag-nitude from −15 to +16 hurricanes, for a spread of 31 hur-ricanes. The hurricane count increase (decrease) in the east-ern (western) tropical Atlantic corroborates previous find-ings by Elsner and Jagge [4]. However, a central Atlantic andsoutheast US East Coast signal is also prevalent. The bound-ing box used in Elsner and Jagge [4] had a northward maxi-mum extent of 30◦N. Based on the spatially averaged result inFigure 3(d) which highlights groups of like count differenceregions, the pattern extends just south of Nova Scotia around40◦N. The East Coast decrease in counts during high SSNseasons is similar in magnitude to the Caribbean and Gulfpatterns.
The regional nature of the SHC into the central Atlanticand US East Coast is a new finding. However, a statisticalmodel for US-affecting hurricane counts employed in Elsnerand Jagger [4] does use SSN as a predictor. The coefficienton the statistically significant predictor is negative, indicatingthat the probability of a US-affecting hurricane decreases asSSN increases. Fewer East Coast hurricanes during high solaractivity found here further explain their finding.
5. High versus Low Solar Activity: Early andLate Records
There is an amplitude modulation in SSN, with the morerecent decades featuring more sunspot peaks (Figure 2).Some of the highest September peaks within the 1851–2010study period have occurred since 1947, recording a SSN of169.4 sunspots. As a result, the median year for the highSSN seasons sample is 1959, while the mean year for lowSSN seasons is 1912. Hurricane positions, intensities, andoccurrences are reasonably more reliable as technology hasimproved, so it is possible that the spatial signal we show inSection 4 is a consequence of the difference in years sampled.To check the robustness of the pattern shown in Figure 3, weexamine the modern portions of the respective high and lowSSN seasons within the thirty-five season sample.
In the thirty-five season sample from the previous sec-tion, there are seven low (1985, 1986, 1995, 1996, 2007, 2008,2009) and seven high (1989, 1990, 1991, 1998, 2000, 2001,2002) SSN seasons whose median years are 1996 and 1998,respectively. The previous twenty-eight season sets hadmedian years of 1902 and 1953, respectively. We thereforecompare the seven most recent season sets of high and lowSSN to see if the SHC pattern is consistent over time.
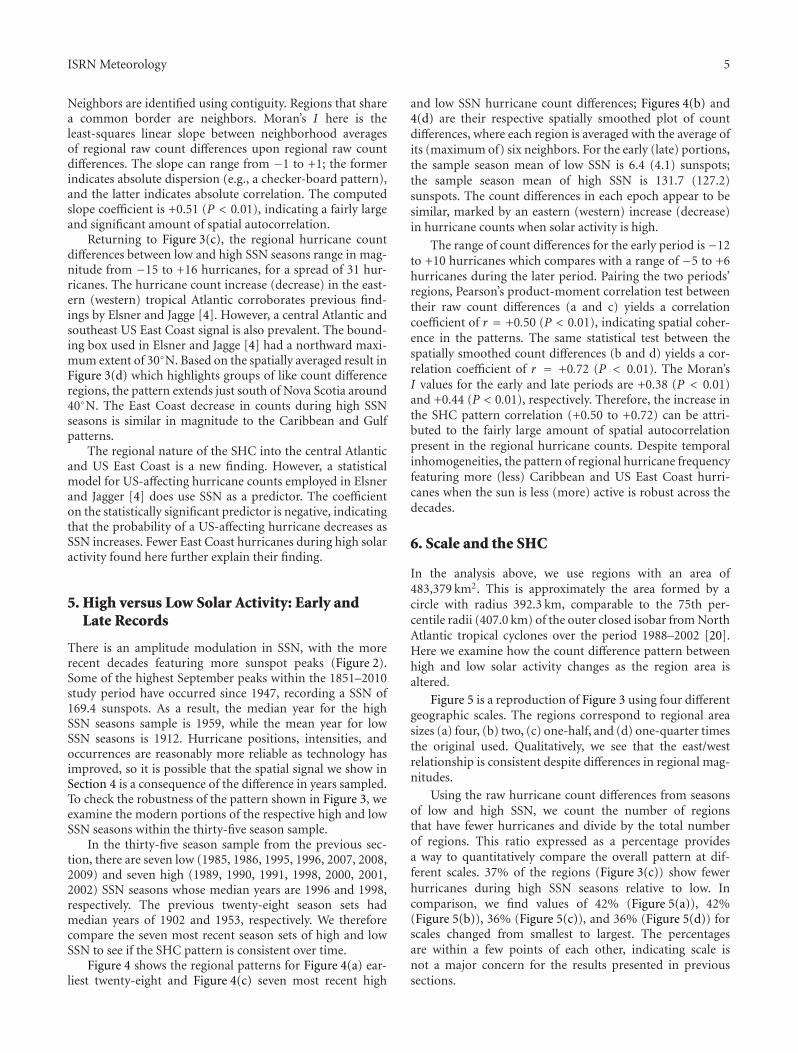
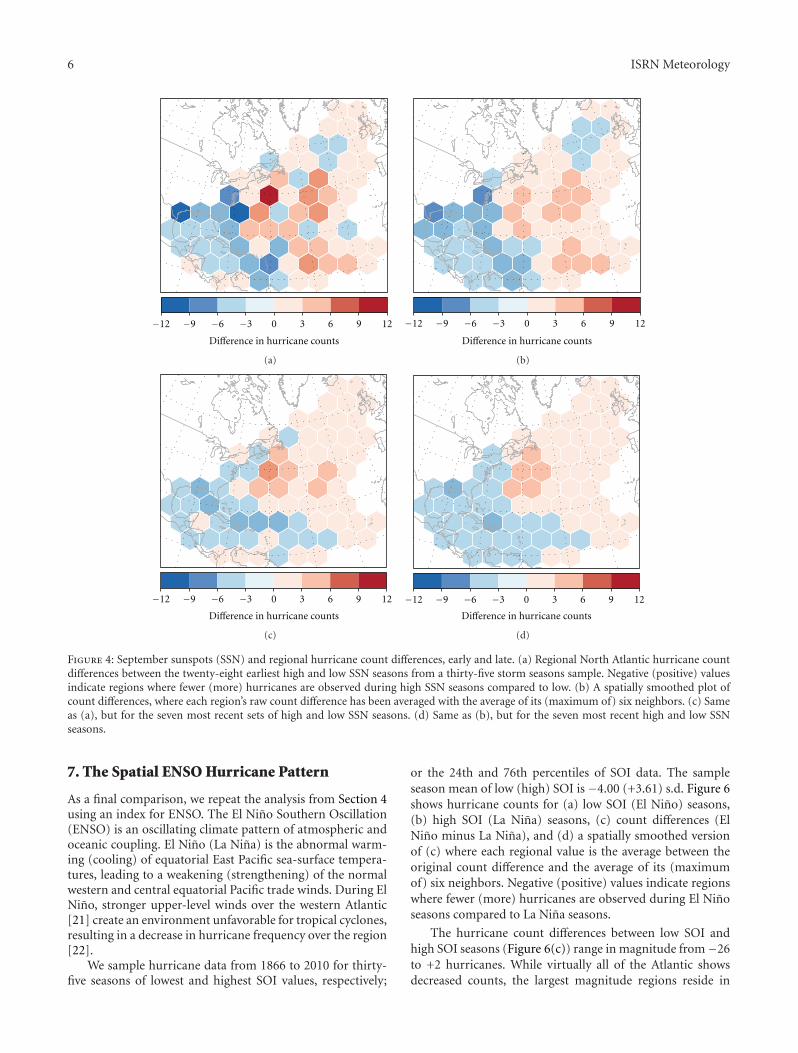
Figure 4 shows the regional patterns for Figure 4(a) ear-liest twenty-eight and Figure 4(c) seven most recent high
and low SSN hurricane count differences; Figures 4(b) and4(d) are their respective spatially smoothed plot of countdifferences, where each region is averaged with the average ofits (maximum of) six neighbors. For the early (late) portions,the sample season mean of low SSN is 6.4 (4.1) sunspots;the sample season mean of high SSN is 131.7 (127.2)sunspots. The count differences in each epoch appear to besimilar, marked by an eastern (western) increase (decrease)in hurricane counts when solar activity is high.
The range of count differences for the early period is−12to +10 hurricanes which compares with a range of −5 to +6hurricanes during the later period. Pairing the two periods’regions, Pearson’s product-moment correlation test betweentheir raw count differences (a and c) yields a correlationcoefficient of r = +0.50 (P < 0.01), indicating spatial coher-ence in the patterns. The same statistical test between thespatially smoothed count differences (b and d) yields a cor-relation coefficient of r = +0.72 (P < 0.01). The Moran’sI values for the early and late periods are +0.38 (P < 0.01)and +0.44 (P < 0.01), respectively. Therefore, the increase inthe SHC pattern correlation (+0.50 to +0.72) can be attri-buted to the fairly large amount of spatial autocorrelationpresent in the regional hurricane counts. Despite temporalinhomogeneities, the pattern of regional hurricane frequencyfeaturing more (less) Caribbean and US East Coast hurri-canes when the sun is less (more) active is robust across thedecades.
6. Scale and the SHC
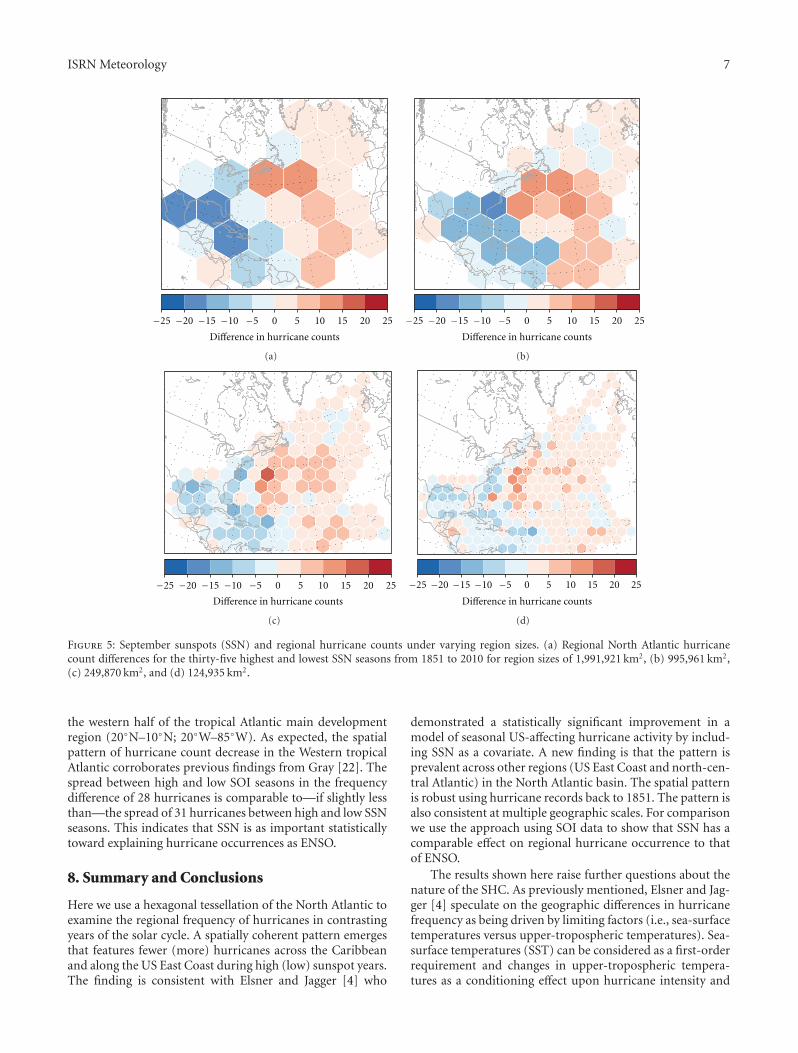
In the analysis above, we use regions with an area of483,379 km2. This is approximately the area formed by acircle with radius 392.3 km, comparable to the 75th per-centile radii (407.0 km) of the outer closed isobar from NorthAtlantic tropical cyclones over the period 1988–2002 [20].Here we examine how the count difference pattern betweenhigh and low solar activity changes as the region area isaltered.
Figure 5 is a reproduction of Figure 3 using four differentgeographic scales. The regions correspond to regional areasizes (a) four, (b) two, (c) one-half, and (d) one-quarter timesthe original used. Qualitatively, we see that the east/westrelationship is consistent despite differences in regional mag-nitudes.
Using the raw hurricane count differences from seasonsof low and high SSN, we count the number of regionsthat have fewer hurricanes and divide by the total numberof regions. This ratio expressed as a percentage providesa way to quantitatively compare the overall pattern at dif-ferent scales. 37% of the regions (Figure 3(c)) show fewerhurricanes during high SSN seasons relative to low. Incomparison, we find values of 42% (Figure 5(a)), 42%(Figure 5(b)), 36% (Figure 5(c)), and 36% (Figure 5(d)) forscales changed from smallest to largest. The percentagesare within a few points of each other, indicating scale isnot a major concern for the results presented in previoussections.
6 ISRN Meteorology
Difference in hurricane counts
−12 −9 −6 −3 0 3 6 9 12
(a)
Difference in hurricane counts
−12 −9 −6 −3 0 3 6 9 12
(b)
Difference in hurricane counts
−12 −9 −6 −3 0 3 6 9 12
(c)
Difference in hurricane counts
−12 −9 −6 −3 0 3 6 9 12
(d)
Figure 4: September sunspots (SSN) and regional hurricane count differences, early and late. (a) Regional North Atlantic hurricane countdifferences between the twenty-eight earliest high and low SSN seasons from a thirty-five storm seasons sample. Negative (positive) valuesindicate regions where fewer (more) hurricanes are observed during high SSN seasons compared to low. (b) A spatially smoothed plot ofcount differences, where each region’s raw count difference has been averaged with the average of its (maximum of) six neighbors. (c) Sameas (a), but for the seven most recent sets of high and low SSN seasons. (d) Same as (b), but for the seven most recent high and low SSNseasons.
7. The Spatial ENSO Hurricane Pattern
As a final comparison, we repeat the analysis from Section 4using an index for ENSO. The El Nino Southern Oscillation(ENSO) is an oscillating climate pattern of atmospheric andoceanic coupling. El Nino (La Nina) is the abnormal warm-ing (cooling) of equatorial East Pacific sea-surface tempera-tures, leading to a weakening (strengthening) of the normalwestern and central equatorial Pacific trade winds. During ElNino, stronger upper-level winds over the western Atlantic[21] create an environment unfavorable for tropical cyclones,resulting in a decrease in hurricane frequency over the region[22].
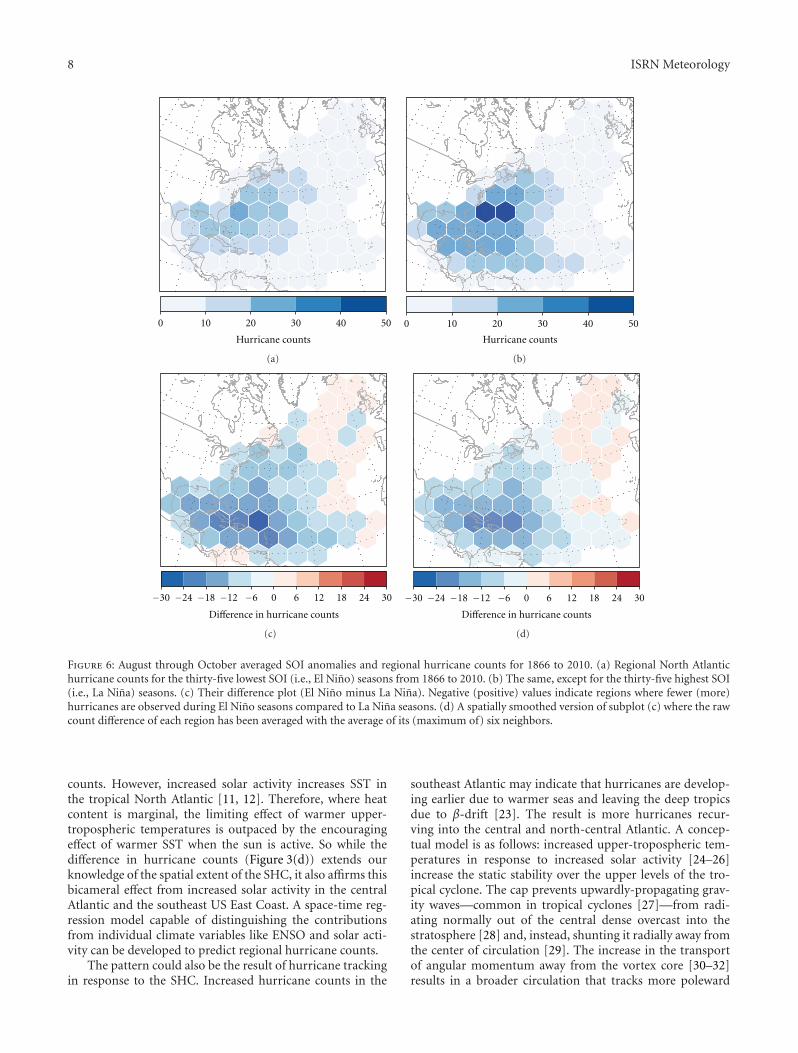
We sample hurricane data from 1866 to 2010 for thirty-five seasons of lowest and highest SOI values, respectively;
or the 24th and 76th percentiles of SOI data. The sampleseason mean of low (high) SOI is −4.00 (+3.61) s.d. Figure 6shows hurricane counts for (a) low SOI (El Nino) seasons,(b) high SOI (La Nina) seasons, (c) count differences (ElNino minus La Nina), and (d) a spatially smoothed versionof (c) where each regional value is the average between theoriginal count difference and the average of its (maximumof) six neighbors. Negative (positive) values indicate regionswhere fewer (more) hurricanes are observed during El Ninoseasons compared to La Nina seasons.
The hurricane count differences between low SOI andhigh SOI seasons (Figure 6(c)) range in magnitude from−26to +2 hurricanes. While virtually all of the Atlantic showsdecreased counts, the largest magnitude regions reside in
ISRN Meteorology 7
Difference in hurricane counts
−25 −20 −15 −10 −5 0 5 10 15 20 25
(a)
Difference in hurricane counts
−25 −20 −15 −10 −5 0 5 10 15 20 25
(b)
Difference in hurricane counts
−25 −20 −15 −10 −5 0 5 10 15 20 25
(c)
Difference in hurricane counts
−25 −20 −15 −10 −5 0 5 10 15 20 25
(d)
Figure 5: September sunspots (SSN) and regional hurricane counts under varying region sizes. (a) Regional North Atlantic hurricanecount differences for the thirty-five highest and lowest SSN seasons from 1851 to 2010 for region sizes of 1,991,921 km2, (b) 995,961 km2,(c) 249,870 km2, and (d) 124,935 km2.
the western half of the tropical Atlantic main developmentregion (20◦N–10◦N; 20◦W–85◦W). As expected, the spatialpattern of hurricane count decrease in the Western tropicalAtlantic corroborates previous findings from Gray [22]. Thespread between high and low SOI seasons in the frequencydifference of 28 hurricanes is comparable to—if slightly lessthan—the spread of 31 hurricanes between high and low SSNseasons. This indicates that SSN is as important statisticallytoward explaining hurricane occurrences as ENSO.
8. Summary and Conclusions
Here we use a hexagonal tessellation of the North Atlantic toexamine the regional frequency of hurricanes in contrastingyears of the solar cycle. A spatially coherent pattern emergesthat features fewer (more) hurricanes across the Caribbeanand along the US East Coast during high (low) sunspot years.The finding is consistent with Elsner and Jagger [4] who
demonstrated a statistically significant improvement in amodel of seasonal US-affecting hurricane activity by includ-ing SSN as a covariate. A new finding is that the pattern isprevalent across other regions (US East Coast and north-cen-tral Atlantic) in the North Atlantic basin. The spatial patternis robust using hurricane records back to 1851. The pattern isalso consistent at multiple geographic scales. For comparisonwe use the approach using SOI data to show that SSN has acomparable effect on regional hurricane occurrence to thatof ENSO.
The results shown here raise further questions about thenature of the SHC. As previously mentioned, Elsner and Jag-ger [4] speculate on the geographic differences in hurricanefrequency as being driven by limiting factors (i.e., sea-surfacetemperatures versus upper-tropospheric temperatures). Sea-surface temperatures (SST) can be considered as a first-orderrequirement and changes in upper-tropospheric tempera-tures as a conditioning effect upon hurricane intensity and
8 ISRN Meteorology
Hurricane counts
0 10 20 30 40 50
(a)
Hurricane counts
0 10 20 30 40 50
(b)
−30 −24 −18 −12 −6 0 6 12 18 24 30
Difference in hurricane counts
(c)
−30 −24 −18 −12 −6 0 6 12 18 24 30
Difference in hurricane counts
(d)
Figure 6: August through October averaged SOI anomalies and regional hurricane counts for 1866 to 2010. (a) Regional North Atlantichurricane counts for the thirty-five lowest SOI (i.e., El Nino) seasons from 1866 to 2010. (b) The same, except for the thirty-five highest SOI(i.e., La Nina) seasons. (c) Their difference plot (El Nino minus La Nina). Negative (positive) values indicate regions where fewer (more)hurricanes are observed during El Nino seasons compared to La Nina seasons. (d) A spatially smoothed version of subplot (c) where the rawcount difference of each region has been averaged with the average of its (maximum of) six neighbors.
counts. However, increased solar activity increases SST inthe tropical North Atlantic [11, 12]. Therefore, where heatcontent is marginal, the limiting effect of warmer upper-tropospheric temperatures is outpaced by the encouragingeffect of warmer SST when the sun is active. So while thedifference in hurricane counts (Figure 3(d)) extends ourknowledge of the spatial extent of the SHC, it also affirms thisbicameral effect from increased solar activity in the centralAtlantic and the southeast US East Coast. A space-time reg-ression model capable of distinguishing the contributionsfrom individual climate variables like ENSO and solar acti-vity can be developed to predict regional hurricane counts.
The pattern could also be the result of hurricane trackingin response to the SHC. Increased hurricane counts in the
southeast Atlantic may indicate that hurricanes are develop-ing earlier due to warmer seas and leaving the deep tropicsdue to β-drift [23]. The result is more hurricanes recur-ving into the central and north-central Atlantic. A concep-tual model is as follows: increased upper-tropospheric tem-peratures in response to increased solar activity [24–26]increase the static stability over the upper levels of the tro-pical cyclone. The cap prevents upwardly-propagating grav-ity waves—common in tropical cyclones [27]—from radi-ating normally out of the central dense overcast into thestratosphere [28] and, instead, shunting it radially away fromthe center of circulation [29]. The increase in the transportof angular momentum away from the vortex core [30–32]results in a broader circulation that tracks more poleward
ISRN Meteorology 9
due to increased β-drift. In order to investigate this possi-bility, it will be necessary to develop a model that can be usedto describe and predict hurricane tracks.
References
[1] K. A. Emanuel, “The theory of hurricanes,” Annual Review ofFluid Mechanics, vol. 23, no. 1, pp. 179–196, 1991.
[2] K. Dong and C. J. Neumann, “The relationship between trop-ical cyclone motion and environmental geostrophic flows,”Monthly Weather Review, vol. 114, no. 1, pp. 115–122, 1986.
[3] G. J. Holland, “The maximum potential intensity of tropicalcyclones,” Journal of the Atmospheric Sciences, vol. 54, no. 21,pp. 2519–2541, 1997.
[4] J. B. Elsner and T. H. Jagger, “United States and Caribbeantropical cyclone activity related to the solar cycle,” GeophysicalResearch Letters, vol. 35, no. 18, Article ID L18705, 5 pages,2008.
[5] J. B. Elsner, T. H. Jagger, and R. E. Hodges, “Daily tropicalcyclone intensity response to solar ultraviolet radiation,” Geo-physical Research Letters, vol. 37, no. 9, Article ID L09701, 5pages, 2010.
[6] C. Meldrum, “On a periodicity in the frequency of cyclonesin the Indian Ocean South of the Equator,” Nature, vol. 6, pp.357–358, 1872.
[7] A. Poey, “Sur les rapports entre les taches solaires et les ouragesdes Antilles de l’Atlantique-nord et de l’Ocean Indien sud,”Comptes Rendus, vol. 77, pp. 1223–1226, 1873.
[8] H. Willett, “Extrapolation of sunspot-climate relationships,”Journal of Atmospheric Sciences, vol. 8, no. 1, pp. 1–6, 1951.
[9] T. J. Cohen and E. I. Sweetser, “The ‘spectra’ of the solar cycleand of data for Atlantic tropical cyclones,” Nature, vol. 256, no.5515, pp. 295–296, 1975.
[10] K. A. Emanuel, “The dependence of hurricane intensity onclimate,” Nature, vol. 326, no. 6112, pp. 483–485, 1987.
[11] W. B. White, J. Lean, D. Cayan et al., “Response of global upperocean temperature to changing solar irradiance,” Journal ofGeophysical Research C, vol. 102, no. 2, pp. 3255–3266, 1997.
[12] J. B. Elsner, T. H. Jagger, M. Dickinson, and D. Rowe, “Improv-ing multiseason forecasts of North Atlantic hurricane activity,”Journal of Climate, vol. 21, no. 6, pp. 1209–1219, 2008.
[13] J. B. Elsner, R. E. Hodges, and T. H. Jagger, “Spatial grids forhurricane climate research,” Climate Dynamics, vol. 39, no. 1-2, pp. 21–36, 2011.
[14] B. Jarvinen, C. Neumann, and M. Davis, “A tropical cyclonedata tape for the North Atlantic basin, 1886–1983: contents,limitations, and uses,” Tech. Memo 22, NOAA/NWS/NCEP/National Hurricane Center, Washington, DC, USA, 1984.
[15] T. H. Jagger and J. B. Elsner, “Climatology models for extremehurricane winds near the United States,” Journal of Climate,vol. 19, no. 13, pp. 3220–3236, 2006.
[16] R. Allan, N. Nicholls, P. Jones, and I. Butterworth, “A furtherextension of the Tahiti-Darwin SOI, early SOI results andDarwin pressure,” Journal of Climate, vol. 4, no. 7, pp. 743–749, 1991.
[17] G. P. Konnen, P. D. Jones, M. H. Kaltofen, and R. J. Allan, “Pre-1866 extensions of the Southern Oscillation index using earlyIndonesian and Tahitian meteorological readings,” Journal ofClimate, vol. 11, no. 9, pp. 2325–2339, 1998.
[18] C. Ropelewski and P. Jones, “An extension of the Tahiti-Dar-win Southern Oscillation index,” Monthly Weather Review, vol.115, no. 9, pp. 2161–2165, 1987.
[19] P. A. Moran, “Notes on continuous stochastic phenomena,”Biometrika, vol. 37, no. 1-2, pp. 17–23, 1950.
[20] S. Kimball and M. Mulekar, “A 15-year climatology of NorthAtlantic tropical cyclones. Part I: size parameters,” Journal ofClimate, vol. 17, no. 18, pp. 3555–3575, 2006.
[21] P. A. Arkin, “The relationship between interannual variabilityin the 200 mb tropical wind field and the Southern Oscilla-tion,” Monthly Weather Review, vol. 110, no. 10, pp. 1393–1404, 1982.
[22] W. M. Gray, “Atlantic seasonal hurricane frequency, partI: El Nino and 30 mb quasi-biennial oscillation influences,”Monthly Weather Review, vol. 112, no. 9, pp. 1649–1668, 1984.
[23] G. J. Holland, “Tropical cyclone motion: a comparison of the-ory and observation,” Journal of the Atmospheric Sciences, vol.41, no. 1, pp. 68–75, 1984.
[24] H. van Loon and D. J. Shea, “The global 11-year solar signal inJuly-August,” Geophysical Research Letters, vol. 27, no. 18, pp.2965–2968, 2000.
[25] C. S. Zerefos, K. Tourpali, I. S. A. Isaksen, and C. J. E. Schu-urmans, “Long term solar induced variations in total ozone,stratospheric temperatures and the tropopause,” Advances inSpace Research, vol. 27, no. 12, pp. 1943–1948, 2001.
[26] H. van Loon and K. Labitzke, “The influence of the 11-yearsolar cycle on the stratosphere below 30 km: a review,” SpaceScience Reviews, vol. 94, no. 1-2, pp. 259–278, 2000.
[27] K. Niranjan Kumar, T. K. Ramkumar, and M. Krishnaiah,“MST radar observation of inertia-gravity waves generatedfrom tropical cyclones,” Journal of Atmospheric and Solar-Ter-restrial Physics, vol. 73, no. 13, pp. 1890–1906, 2011.
[28] G. J. Tripoli and W. R. Cotton, “Numerical study of anobserved orogenic mesoscale convective system. Part 1: sim-ulated genesis and comparison with observations,” MonthlyWeather Review, vol. 117, no. 2, pp. 273–304, 1989.
[29] C. Liu and M. W. Moncrieff, “A numerical study of thediurnal cycle of tropical oceanic convection,” Journal of theAtmospheric Sciences, vol. 55, no. 13, pp. 2329–2344, 1998.
[30] G. Chimonas and H. M. Hauser, “The transfer of angularmomentum from vortices to gravity swirl waves,” Journal ofthe Atmospheric Sciences, vol. 54, no. 13, pp. 1701–1711, 1997.
[31] K. Chow and K. Chan, “Angular momentum transports bymoving spiral waves,” Journal of the Atmospheric Sciences, vol.60, no. 16, pp. 2004–2009, 2003.
[32] Y. Moon and D. S. Nolan, “Do gravity waves transport angularmomentum away from tropical cyclones?” Journal of the Atmo-spheric Sciences, vol. 67, no. 1, pp. 117–135, 2010.