Embed Size (px)
Citation preview
Research ArticleThe Observation Report of Red Blood Cell Morphology inThailand Teenager by Using Data Mining Technique
Sarawut Saichanma, Sucha Chulsomlee, Nonthaya Thangrua,Pornsuri Pongsuchart, and Duangmanee Sanmun
Division of Clinical Microscopy, Faculty of Medical Technology, Huachiew Chalermprakiet University,Samut Prakan 10540, Thailand
Correspondence should be addressed to Sarawut Saichanma; [email protected]
Received 18 October 2013; Revised 10 December 2013; Accepted 30 December 2013
Academic Editor: Elvira Grandone
Copyright © 2014 Sarawut Saichanma et al. This is an open access article distributed under the Creative Commons AttributionLicense, which permits unrestricted use, distribution, and reproduction in any medium, provided the original work is properlycited.
It is undeniable that laboratory information is important in healthcare in many ways such as management, planning, and qualityimprovement. Laboratory diagnosis and laboratory results from each patient are organized from every treatment. These data areuseful for retrospective study exploring a relationship between laboratory results and diseases. By doing so, it increases efficiencyin diagnosis and quality in laboratory report. Our study will utilize J48 algorithm, a data mining technique to predict abnormalityin peripheral blood smear from 1,362 students by using 13 data set of hematological parameters gathered from automated bloodcell counter. We found that the decision tree which is created from the algorithm can be used as a practical guideline for RBCmorphology prediction by using 4 hematological parameters (MCV, MCH, Hct, and RBC). The average prediction of RBCmorphology has true positive, false positive, precision, recall, and accuracy of 0.940, 0.050, 0.945, 0.940, and 0.943, respectively.A newly found paradigm in managing medical laboratory information will be helpful in organizing, researching, and assistingcorrelation in multiple disciplinary other than medical science which will eventually lead to an improvement in quality of testresults and more accurate diagnosis.
1. Introduction
Data mining technique is a process of discovering patternof data. The patterns discovered must be meaningful in thatthey lead to some advantage. The overall goal of the datamining process is to extract information from a data setand transform it into an understandable data in order toaid user decision making. It utilizes methods such as sta-tistics and mathematics to explore a relationship of dataset or suitable conditions of those data, which leads to theextract of needed information or knowledge of relations.Thedecision tree is a supported modeling that represents theclassification process of input data as a tree-like graph. It isbased on Divide and Conquer concept, which is formed bymany rules that branched out from the tree until the decisionis made. There are many methods of decision tree algorithmsuch as AD-Tree, C4.5 decision (J48), or Random-Tree.
The J48 algorithm is an open source JAVA implementingC4.5in WEKA (Waikato Environment for Knowledge Analysis)software. The tree is constructed from gain ratio, the elementwith a highest gain ratio assigned as the root and uses gainratio as the splitting branch of the tree [1].
The datamining has been used widely inmany fields suchas marketing, public relations, prediction of economy, andweather forecast. In hematology laboratory, it has become apowerful tool in managing uncountable laboratory informa-tion in order to seek knowledge that is underlying or withinany given information. Many applications of data miningin hematology were proposed such as evaluated risk factorsand relationship with life-threatening infection in childrenwith febrile neutrophilia [2], created diagnosis approachedto polycythemia vera [3], and proposed an original methodto identify the immunophenotypic signature of chroniclymphocytic leukemia [4].
Hindawi Publishing CorporationAdvances in HematologyVolume 2014, Article ID 493706, 5 pageshttp://dx.doi.org/10.1155/2014/493706
2 Advances in Hematology
Table 1: The data set in this study.
Number Code Description Domain1 Sex Sex Male, female2 WBC White blood cell count (cell/uL) Integer3 RBC Red blood cell count Integer4 Hb Hemoglobin (g/dL) Integer5 Hct Hematocrit (%) Integer6 MCV Mean corpuscular volume (fL) Integer7 MCH Mean corpuscular hemoglobin (pg) Integer8 MCHC Mean corpuscular hemoglobin concentration (g/dL) Integer9 PLT Platelet count (cell/uL) Integer10 NEU Neutrophil count (%) Integer11 LYMP Lymphocyte count (%) Integer12 MONO Monocyte count (%) Integer13 EO Eosinophil count (%) Integer14 BASO Basophil count (%) Integer15 RBC morphology Red blood cell morphology Normal, abnormal
The authors applied datamining technique to dismiss biasfrom individual skill which makes the report very subjec-tive. The relationships between red blood cell morphologyreporting and hematological parameters (WBC, RBC, Hb,Hct,MCV,MCH,MCHC, PLT,NEU, LYMP,MONO, EO, andBASO) from blood cell analyzer were investigated.This studyshows that by applying data mining, using hematologicalparameters from automated blood cell analyzer can helppredicting the abnormality of RBC morphology as good asthe RBC morphology which reported by individual skill. Inthe future, this guideline can be used as tools for laboratoryimprovement.
2. Material and Method
2.1. Sample and Data Set. The retrospective study used 1362results from teenagers (17–19 years old) first-year undergrad-uate student checkup at Huachiew Chalermprakiet Univer-sity in 2011. The data set included sex, hematological param-eters, and RBC morphology. The hematological parametersfrom automated blood cell analyzer are composed of WBC,RBC, Hb, Hct, MCV, MCH, MCHC, PLT, NEU, LYMP,MONO, EO, and BASO (SysMex XT1800i, Sysmex corpora-tion, Kobe, Japan). The peripheral blood smear was preparedand stained by ICSH standard protocol [5]; RBCmorphologywas manually evaluated by medical technologist who has alicense certification from the medical technology council ofThailand. Collected data are assigned to two groups: normalRBC morphology and abnormal RBC morphology. Theperipheral blood smears that are reported as normochromicand normocytic are categorized as normal RBC morphologywhile others fall into abnormal RBC morphology category(more details about data set are shown in Table 1).
2.2. Data Analysis by Data Mining Technique. The data min-ing analysis was analyzed by usingWEKAversion 3.6.9whichthe collection ofmachine learning algorithms for datamining
tasks [1]. The J48 which ones of decision tree of data miningtechnique was approached to this study. The evaluation ofall the classifiers accuracy used a ten-fold cross-validation.The performance evaluation was averaged from all of tenseparated evaluations. True positive (TP) was the numberof abnormal RBC morphology predicted to be abnormalRBC morphology. False negative (FN) was the numberof abnormal RBC morphologies predicted to be normalRBC morphology. True negative (TN) was the number ofnormal RBC morphologies predicted to be normal RBCmorphology. False positive (FP) was the number of normalRBC morphologies predicted to be abnormal morphology.The validation measurements were investigated by accuracy,sensitivity, and specificity of result when compared with RBCmorphology report. We focus on the following validationmeasures:
Precision = TP/(TP + FN),Specificity = TN/(TN + FP),Recall = TP / (TP + TN),Accuracy = (TP + TN)/(TP + TN + FN +FP),F-measure = 2 ∗ Precision ∗ Specificity/(Precision +Specificity).
2.3. Statistics. All data were presented as themean± standarddeviation (SD). The significant evaluation between differentcategories was performed with the independent t-test. The Pvalue less than 0.05 was considered as statistically significant.
3. Results
The hematological parameters from blood cell analyzer andRBC morphology report of 1362 cases were evaluated. Thereare 260 male cases (19.1%) and 1102 female cases (80.9%).The1362 cases of RBC morphology were evaluated. AbnormalRBC morphology was found in 354 cases (25.99%) which
Advances in Hematology 3
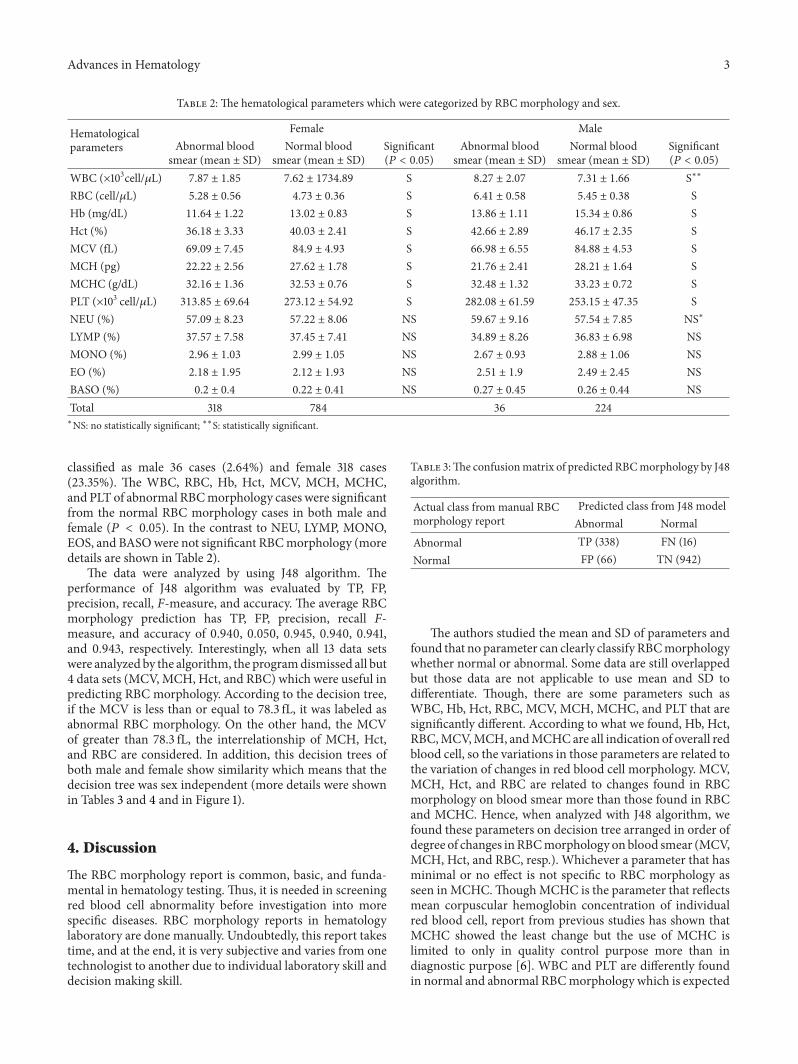
Table 2: The hematological parameters which were categorized by RBC morphology and sex.
Hematologicalparameters
Female MaleAbnormal blood
smear (mean ± SD)Normal blood
smear (mean ± SD)Significant(𝑃 < 0.05)
Abnormal bloodsmear (mean ± SD)
Normal bloodsmear (mean ± SD)
Significant(𝑃 < 0.05)
WBC (×103cell/𝜇L) 7.87 ± 1.85 7.62 ± 1734.89 S 8.27 ± 2.07 7.31 ± 1.66 S∗∗
RBC (cell/𝜇L) 5.28 ± 0.56 4.73 ± 0.36 S 6.41 ± 0.58 5.45 ± 0.38 SHb (mg/dL) 11.64 ± 1.22 13.02 ± 0.83 S 13.86 ± 1.11 15.34 ± 0.86 SHct (%) 36.18 ± 3.33 40.03 ± 2.41 S 42.66 ± 2.89 46.17 ± 2.35 SMCV (fL) 69.09 ± 7.45 84.9 ± 4.93 S 66.98 ± 6.55 84.88 ± 4.53 SMCH (pg) 22.22 ± 2.56 27.62 ± 1.78 S 21.76 ± 2.41 28.21 ± 1.64 SMCHC (g/dL) 32.16 ± 1.36 32.53 ± 0.76 S 32.48 ± 1.32 33.23 ± 0.72 SPLT (×103 cell/𝜇L) 313.85 ± 69.64 273.12 ± 54.92 S 282.08 ± 61.59 253.15 ± 47.35 SNEU (%) 57.09 ± 8.23 57.22 ± 8.06 NS 59.67 ± 9.16 57.54 ± 7.85 NS∗
LYMP (%) 37.57 ± 7.58 37.45 ± 7.41 NS 34.89 ± 8.26 36.83 ± 6.98 NSMONO (%) 2.96 ± 1.03 2.99 ± 1.05 NS 2.67 ± 0.93 2.88 ± 1.06 NSEO (%) 2.18 ± 1.95 2.12 ± 1.93 NS 2.51 ± 1.9 2.49 ± 2.45 NSBASO (%) 0.2 ± 0.4 0.22 ± 0.41 NS 0.27 ± 0.45 0.26 ± 0.44 NSTotal 318 784 36 224∗NS: no statistically significant; ∗∗S: statistically significant.
classified as male 36 cases (2.64%) and female 318 cases(23.35%). The WBC, RBC, Hb, Hct, MCV, MCH, MCHC,and PLT of abnormal RBCmorphology cases were significantfrom the normal RBC morphology cases in both male andfemale (𝑃 < 0.05). In the contrast to NEU, LYMP, MONO,EOS, and BASOwere not significant RBCmorphology (moredetails are shown in Table 2).
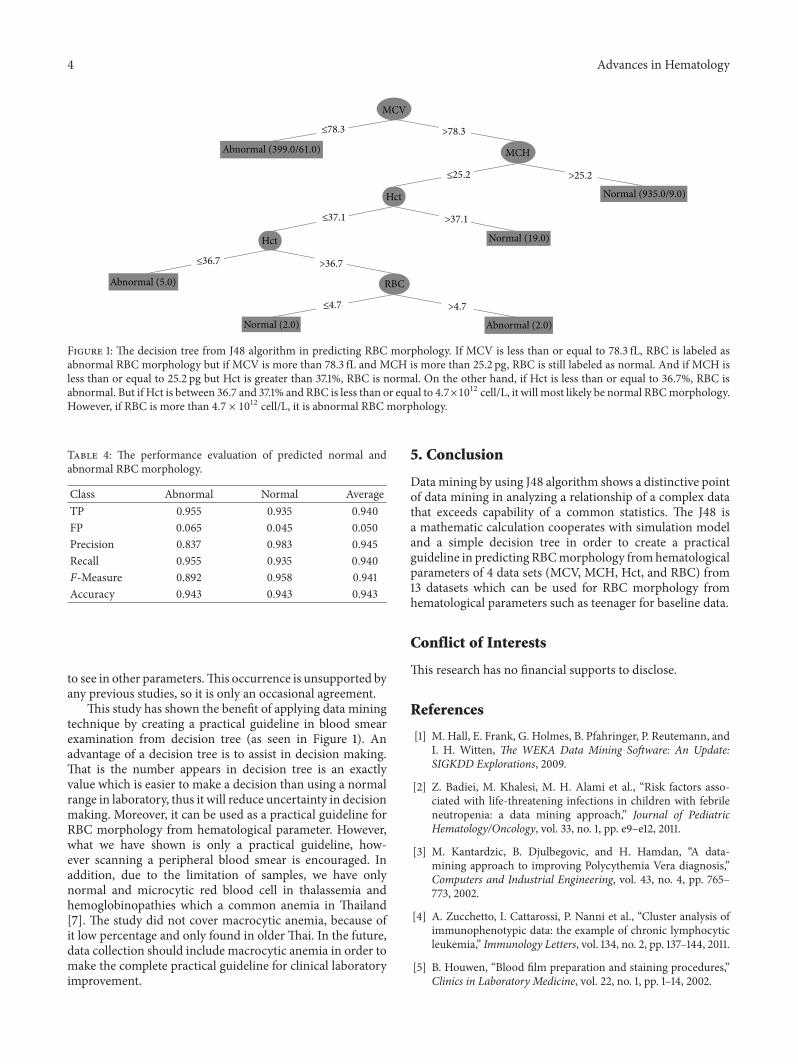
The data were analyzed by using J48 algorithm. Theperformance of J48 algorithm was evaluated by TP, FP,precision, recall, F-measure, and accuracy. The average RBCmorphology prediction has TP, FP, precision, recall F-measure, and accuracy of 0.940, 0.050, 0.945, 0.940, 0.941,and 0.943, respectively. Interestingly, when all 13 data setswere analyzed by the algorithm, the programdismissed all but4 data sets (MCV,MCH, Hct, and RBC) which were useful inpredicting RBC morphology. According to the decision tree,if the MCV is less than or equal to 78.3 fL, it was labeled asabnormal RBC morphology. On the other hand, the MCVof greater than 78.3 fL, the interrelationship of MCH, Hct,and RBC are considered. In addition, this decision trees ofboth male and female show similarity which means that thedecision tree was sex independent (more details were shownin Tables 3 and 4 and in Figure 1).
4. Discussion
The RBC morphology report is common, basic, and funda-mental in hematology testing. Thus, it is needed in screeningred blood cell abnormality before investigation into morespecific diseases. RBC morphology reports in hematologylaboratory are done manually. Undoubtedly, this report takestime, and at the end, it is very subjective and varies from onetechnologist to another due to individual laboratory skill anddecision making skill.
Table 3:The confusionmatrix of predicted RBCmorphology by J48algorithm.
Actual class from manual RBCmorphology report
Predicted class from J48 modelAbnormal Normal
Abnormal TP (338) FN (16)Normal FP (66) TN (942)
The authors studied the mean and SD of parameters andfound that no parameter can clearly classify RBCmorphologywhether normal or abnormal. Some data are still overlappedbut those data are not applicable to use mean and SD todifferentiate. Though, there are some parameters such asWBC, Hb, Hct, RBC, MCV, MCH, MCHC, and PLT that aresignificantly different. According to what we found, Hb, Hct,RBC,MCV,MCH, andMCHCare all indication of overall redblood cell, so the variations in those parameters are related tothe variation of changes in red blood cell morphology. MCV,MCH, Hct, and RBC are related to changes found in RBCmorphology on blood smear more than those found in RBCand MCHC. Hence, when analyzed with J48 algorithm, wefound these parameters on decision tree arranged in order ofdegree of changes inRBCmorphology onblood smear (MCV,MCH, Hct, and RBC, resp.). Whichever a parameter that hasminimal or no effect is not specific to RBC morphology asseen in MCHC.ThoughMCHC is the parameter that reflectsmean corpuscular hemoglobin concentration of individualred blood cell, report from previous studies has shown thatMCHC showed the least change but the use of MCHC islimited to only in quality control purpose more than indiagnostic purpose [6]. WBC and PLT are differently foundin normal and abnormal RBCmorphology which is expected
4 Advances in Hematology
MCV
MCH
Hct
Hct
RBC
Abnormal (399.0/61.0)
Normal (935.0/9.0)
Normal (19.0)
Normal (2.0)
Abnormal (5.0)
Abnormal (2.0)
≤78.3
≤25.2
≤37.1
≤36.7
≤4.7
>78.3
>25.2
>37.1
>36.7
>4.7
Figure 1: The decision tree from J48 algorithm in predicting RBC morphology. If MCV is less than or equal to 78.3 fL, RBC is labeled asabnormal RBC morphology but if MCV is more than 78.3 fL and MCH is more than 25.2 pg, RBC is still labeled as normal. And if MCH isless than or equal to 25.2 pg but Hct is greater than 37.1%, RBC is normal. On the other hand, if Hct is less than or equal to 36.7%, RBC isabnormal. But if Hct is between 36.7 and 37.1% and RBC is less than or equal to 4.7×10¹² cell/L, it will most likely be normal RBCmorphology.However, if RBC is more than 4.7 × 10¹² cell/L, it is abnormal RBC morphology.
Table 4: The performance evaluation of predicted normal andabnormal RBC morphology.
Class Abnormal Normal AverageTP 0.955 0.935 0.940FP 0.065 0.045 0.050Precision 0.837 0.983 0.945Recall 0.955 0.935 0.940𝐹-Measure 0.892 0.958 0.941Accuracy 0.943 0.943 0.943
to see in other parameters.This occurrence is unsupported byany previous studies, so it is only an occasional agreement.
This study has shown the benefit of applying data miningtechnique by creating a practical guideline in blood smearexamination from decision tree (as seen in Figure 1). Anadvantage of a decision tree is to assist in decision making.That is the number appears in decision tree is an exactlyvalue which is easier to make a decision than using a normalrange in laboratory, thus it will reduce uncertainty in decisionmaking. Moreover, it can be used as a practical guideline forRBC morphology from hematological parameter. However,what we have shown is only a practical guideline, how-ever scanning a peripheral blood smear is encouraged. Inaddition, due to the limitation of samples, we have onlynormal and microcytic red blood cell in thalassemia andhemoglobinopathies which a common anemia in Thailand[7]. The study did not cover macrocytic anemia, because ofit low percentage and only found in older Thai. In the future,data collection should include macrocytic anemia in order tomake the complete practical guideline for clinical laboratoryimprovement.
5. Conclusion
Data mining by using J48 algorithm shows a distinctive pointof data mining in analyzing a relationship of a complex datathat exceeds capability of a common statistics. The J48 isa mathematic calculation cooperates with simulation modeland a simple decision tree in order to create a practicalguideline in predicting RBCmorphology fromhematologicalparameters of 4 data sets (MCV, MCH, Hct, and RBC) from13 datasets which can be used for RBC morphology fromhematological parameters such as teenager for baseline data.
Conflict of Interests
This research has no financial supports to disclose.
References
[1] M. Hall, E. Frank, G. Holmes, B. Pfahringer, P. Reutemann, andI. H. Witten, The WEKA Data Mining Software: An Update:SIGKDD Explorations, 2009.
[2] Z. Badiei, M. Khalesi, M. H. Alami et al., “Risk factors asso-ciated with life-threatening infections in children with febrileneutropenia: a data mining approach,” Journal of PediatricHematology/Oncology, vol. 33, no. 1, pp. e9–e12, 2011.
[3] M. Kantardzic, B. Djulbegovic, and H. Hamdan, “A data-mining approach to improving Polycythemia Vera diagnosis,”Computers and Industrial Engineering, vol. 43, no. 4, pp. 765–773, 2002.
[4] A. Zucchetto, I. Cattarossi, P. Nanni et al., “Cluster analysis ofimmunophenotypic data: the example of chronic lymphocyticleukemia,” Immunology Letters, vol. 134, no. 2, pp. 137–144, 2011.
[5] B. Houwen, “Blood film preparation and staining procedures,”Clinics in Laboratory Medicine, vol. 22, no. 1, pp. 1–14, 2002.

Advances in Hematology 5
[6] B. S. Bull, R. Aller, and B. Houwen, “MCHC—red cell indexor quality control parameter?” in Proceedings of the 16th WorldCongress of the International Society of Haematology, pp. 25–29,Singapore, August 1996.
[7] K. Sanchaisuriya, S. Fucharoen, T. Ratanasiri et al., “Tha-lassemia and hemoglobinopathies rather than iron deficiencyare major causes of pregnancy-related anemia in northeastThailand,” Blood Cells, Molecules, and Diseases, vol. 37, no. 1, pp.8–11, 2006.

Submit your manuscripts athttp://www.hindawi.com
Stem CellsInternational
Hindawi Publishing Corporationhttp://www.hindawi.com Volume 2014
Hindawi Publishing Corporationhttp://www.hindawi.com Volume 2014
MEDIATORSINFLAMMATION
of
Hindawi Publishing Corporationhttp://www.hindawi.com Volume 2014
Behavioural Neurology
EndocrinologyInternational Journal of
Hindawi Publishing Corporationhttp://www.hindawi.com Volume 2014
Hindawi Publishing Corporationhttp://www.hindawi.com Volume 2014
Disease Markers
Hindawi Publishing Corporationhttp://www.hindawi.com Volume 2014
BioMed Research International
OncologyJournal of
Hindawi Publishing Corporationhttp://www.hindawi.com Volume 2014
Hindawi Publishing Corporationhttp://www.hindawi.com Volume 2014
Oxidative Medicine and Cellular Longevity
Hindawi Publishing Corporationhttp://www.hindawi.com Volume 2014
PPAR Research
The Scientific World JournalHindawi Publishing Corporation http://www.hindawi.com Volume 2014
Immunology ResearchHindawi Publishing Corporationhttp://www.hindawi.com Volume 2014
Journal of
ObesityJournal of
Hindawi Publishing Corporationhttp://www.hindawi.com Volume 2014
Hindawi Publishing Corporationhttp://www.hindawi.com Volume 2014
Computational and Mathematical Methods in Medicine
OphthalmologyJournal of
Hindawi Publishing Corporationhttp://www.hindawi.com Volume 2014
Diabetes ResearchJournal of
Hindawi Publishing Corporationhttp://www.hindawi.com Volume 2014
Hindawi Publishing Corporationhttp://www.hindawi.com Volume 2014
Research and TreatmentAIDS
Hindawi Publishing Corporationhttp://www.hindawi.com Volume 2014
Gastroenterology Research and Practice
Hindawi Publishing Corporationhttp://www.hindawi.com Volume 2014
Parkinson’s Disease
Evidence-Based Complementary and Alternative Medicine
Volume 2014Hindawi Publishing Corporationhttp://www.hindawi.com