Embed Size (px)
Citation preview
Hindawi Publishing CorporationJournal of SpectroscopyVolume 2013, Article ID 364750, 5 pageshttp://dx.doi.org/10.1155/2013/364750
Research ArticleSimultaneous Estimation of Ibuprofen and PhenylephrineHydrochloride in Bulk and Combined Dosage Form by FirstDerivative UV Spectrophotometry Method
Mehul Patel, Bhavna Patel, and Shraddha Parmar
P.G. Department of Pharmaceutical Sciences, Sardar Patel University, Vallabh Vidyanagar, Gujarat 388120, India
Correspondence should be addressed to Mehul Patel; [email protected]
Received 29 May 2013; Accepted 24 June 2013
Academic Editor: Damien Boyer
Copyright © 2013 Mehul Patel et al. This is an open access article distributed under the Creative Commons Attribution License,which permits unrestricted use, distribution, and reproduction in any medium, provided the original work is properly cited.
A simple, precise, rapid, and economicmethod was developed for the simultaneous determination of Ibuprofen and PhenylephrineHCl in bulk and combined dosage form. This method involves first-order derivative spectroscopy using 248 nm and 237 nm aszero crossing points for Ibuprofen and Phenylephrine HCl, respectively. For spectrophotometric method 0.1 N NaOH was usedas a solvent. The linearity was established over the concentration range of 12–72𝜇g/mL and 1.5–22 𝜇g/mL for Ibuprofen andPhenylephrine HCl with correlation coefficient (r2) of 0.9972 and 0.9981, respectively. The mean % recoveries were found to bein the range of 98.88% and 98.54% for Ibuprofen and Phenylephrine HCl, respectively. Interday and intraday studies showedrepeatability of themethod.Themethodwas found to be specific and robust.Themethodwas successfully applied to pharmaceuticalformulation, with no interference from excipients as indicated by the recovery study. Results of analysis were validated statisticallyand by recovery studies.
1. Introduction
The 2-arylpropionic acid derivative, Ibuprofen [RS-2-(4-isobutyl-phenyl) propionic acid], is one of the most potentorally active antipyretic, analgesic, and nonsteroidal anti-inflammatory drugs (NSAID)s used extensively in the treat-ment of acute and chronic pain, osteoarthritis, rheumatoidarthritis, and related conditions. This compound is charac-terized by a better tolerability compared with other NSAIDs[1]. Ibuprofen contains a chiral carbon atom on the propionicacid side-chain; therefore it exists as two enantiomers. Itis usually marketed as a 50 : 50 mixture of the S- and R-enantiomers, even if it is known that the pharmacologi-cal activity is due almost exclusively to the S-enantiomer[2].
Phenylephrine Hydrochloride is [(R)-2-methylamino-1-(3-hydroxyphenyl) ethanol hydrochloride] and used asalpha-adrenergic, sympathomimetic agent as well as vaso-constrictor with little effect on themyocardium or the centralnervous system. The literature survey revealed that spec-trophotometry [1], RP-HPLC [2], electrophoresis [3], andliquid chromatography [4] methods have been reported for
the estimation of phenylephrine hydrochloride in pharma-ceutical formulations. The combination of Ibuprofen (IBU)and Phenylephrine HCl (PHE) is available as a tablet formu-lation in the ratio 200 : 10mg IBU : PHE.
RP-HPLC, HPTLC, and spectrophotometric methods forestimation of Ibuprofen (IBU) in combination with otherdrugs are reported [5–10]. The literature survey also revealedthe report of RP-HPLC, HPTLC, and spectrophotometricmethods for estimation of Phenylephrine HCl (PHE) incombination with other drugs [11–15]. As, no UV Spec-trophotometric method was developed for the simultaneousestimation of Ibuprofen and Phenylephrine Hydrochloride,so the aim of the study was to develop and validate first-orderderivative UV spectrophotometric method for simultaneousestimation of Ibuprofen and PhenylephrineHydrochloride inbulk and combined dosage form. Chemical structures of IBUand PHE are included in Figure 1.
2. Materials and Methods
2.1. Reagents and Chemicals. Analytically pure Ibuprofenand Phenylephrine Hydrochloride were used. Tablets of
2 Journal of Spectroscopy
CH3
CH3
H3C
COOH
Ibuprofen
(a)
OH
OH
CH3
NH
Phenylephrine HCl
∙ HCl
(b)
Figure 1: Chemical structure of (a) IBU and (b) PHE.
Ibuprofen and Phenylephrine Hydrochloride in combinedosage form with 200mg IBU and 10mg PHE label claimwere procured.
2.2. Instrument. The spectrophotometer used for study isShimadzuUV/Vis 1800 double beam spectrophotometerwithwavelength accuracy (±0.3 nm), 1 cm matched quartz cells,and UV probe 2.35 software was used for all the spectralmeasurements. Calibrated analytical balance Denver SI234,Germany, was used for weighing purpose. All statisticalcalculations were carried out using Microsoft excel 2010analytical tool.
2.3. Materials. Standard sample of Ibuprofen and Phenyle-phrine HCl was provided by college. Tablets of Ibuprofen andPhenylephrineHydrochloride in combined dosage formwith200mg IBU and 10mg PHE label claim was procured.
2.4. Solvent. An amount of 0.1 N NaOH was used as solvent.AR grade NaOH was used.
2.5. Preparation of Standard Stock Solution. Accuratelyweighed quantity of IBU and PHE 10mg was transferredinto 10mL volumetric flask, dissolved, and diluted up tomark with 0.1 N NaOH. Standard stock solutions of IBU(1000𝜇g/mL) and PHE (1000 𝜇g/mL) were obtained whichwere used for the analysis.
3. Procedure
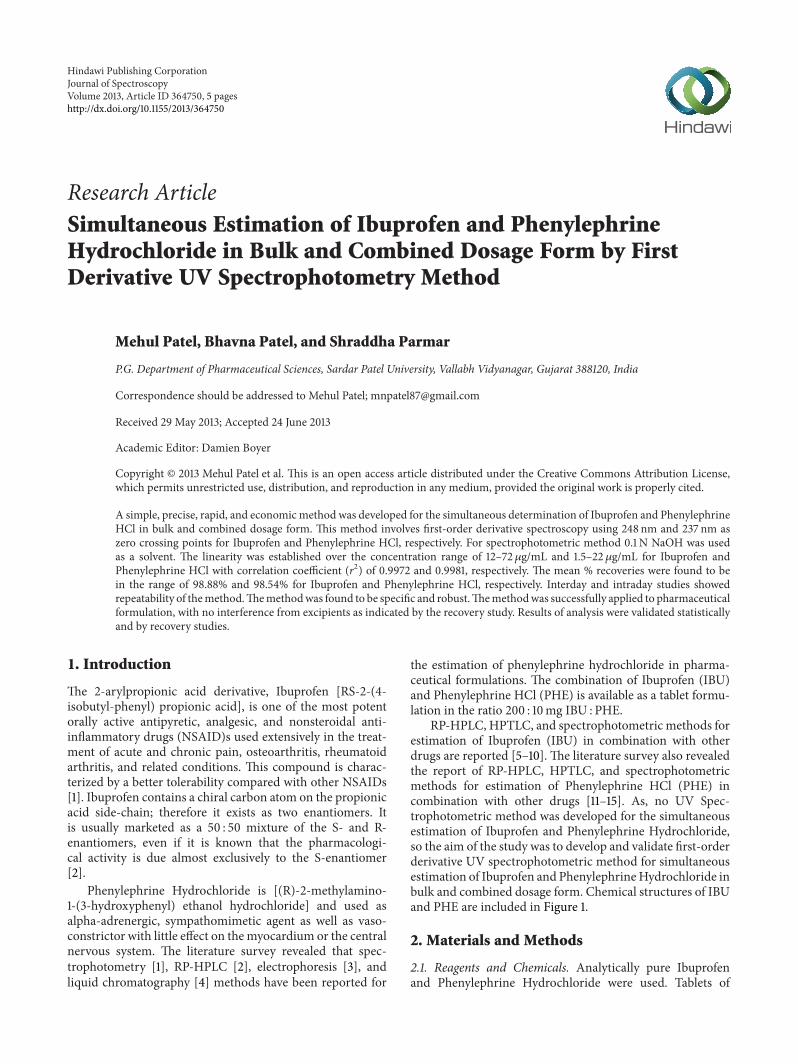
3.1. First-Order Derivative Spectroscopy. In this method solu-tions of IBU and PHE were prepared separately by appro-priate dilution of standard stock solution and scanned inthe spectrum mode from 400 nm to 200 nm. The absorp-tion spectra thus obtained were derivatized to first order.From the spectra of both drugs IBU and PHE (Figure 2),wavelengths were selected for quantitation, 237 nm for IBU(zero cross for PHE) and 248 nm for PHE (zero cross forIBU). The calibration curves for IBU and PHE were plottedin the concentration range of 12–72𝜇g/mL and 1.5–22𝜇g/mL,respectively.The concentration of the individual drug presentin the mixture was determined against the calibration curvein quantitation mode.
0.20861
0.10000
0.00000
−0.10000
−0.21212
Abso
rban
ce
207.61 250.00 311.22(nm)
237nm (ZCP of PHE)
248nm (ZCP of IBU)
Figure 2: Overlain D1 spectrum of IBU (12–72 ppm) and PHE (1.5–22 ppm) in 0.1 N NaOH.
3.2. Analysis of Tablet Formulation. Twenty tablets wereweighed and average weight was calculated. The tablets weretriturated to obtain fine powder. Tablet powder equivalentto 30mg of IBU and 1.5mg PHE was transferred to 50.0mLvolumetric flask, 30mL 0.1 N NaOH solution was added,ultrasonicated for 10minutes, and volumewasmade up to themark with the same. From this target concentration preparedwas 30 ppm and 1.5 ppm.The concentrations of both IBU andPHE were determined by measuring the absorbance of thesample at 237 nm and 248 nm in first-order spectrum mode,respectively. The results of the tablet analysis were calculatedagainst the calibration curve in quantitation mode.
4. Validation
Method validation parameters like linearity, intraday andinterday precision, limit of detection, limit of quantification,accuracy, specificity, and robustness were performed as perICH guidelines.
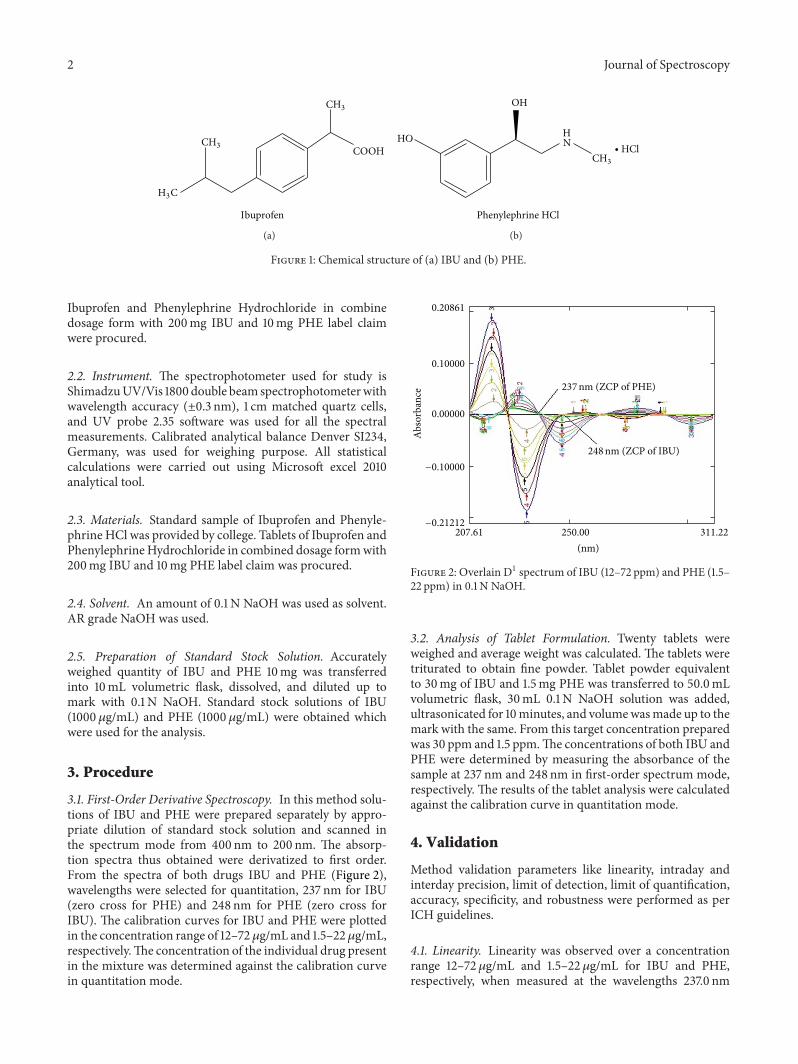
4.1. Linearity. Linearity was observed over a concentrationrange 12–72𝜇g/mL and 1.5–22𝜇g/mL for IBU and PHE,respectively, when measured at the wavelengths 237.0 nm
Journal of Spectroscopy 3
Table 1: Results of analysis of tablet formulation.
Drugs Label claim (mg) Amount of drugestimated (mg/tab) % Label claim (%) ± S.D. % Recovery∗
IBU 200 198.45 99.22 ± 0.0009107 98.88%PHE 10 09.82 98.20 ± 0.0007371 98.54%∗Average of 3 determination.
0
0.02
0.04
0.06
0.08
0.1
0.12
0.14
0 20 40 60 80
Abso
rban
ce
Concentration
Calibration curve of Ibuprofen
y = 0.0016x − 0.0035
R2 = 0.9972
Figure 3: Calibration curve of Ibuprofen.
(ZCP of PHE) and 248 nm (ZCP of IBU). Calibration curveswere constructed for IBU and PHE by plotting absorbanceversus concentrations at both wavelengths. Each reading wasaverage of three determinations.
4.2. Accuracy (% Recovery). Accuracy of the developedmethod was confirmed by recovery study as per ICH guide-lines at three different concentration levels of 80%, 100%, and120% by replicate analysis (𝑛 = 3). Here to a preanalysedsample solution, standard drug solutions were added andthen percentage drug content was calculated. The recoverystudy indicates that the method is accurate for quantitativeestimation of Ibuprofen and Phenylephrine HCl in tabletdosage form as the statistical results are within the acceptancerange (S.D.< 2.0).
4.3. Precision. The intraday and interday precision studyof IBU and PHE was carried out by estimating differentconcentrations of IBU (24, 36, and, 48𝜇g/mL) and PHE (6,10, and, 14 𝜇g/mL), three times on the same day and on threedifferent days, and the results are reported in terms of % RSD.
4.4. Limit of Detection and Limit of Quantification. The limitof detection (LOD) and the limit of quantification (LOQ) ofthe drug were derived from the calibration curves by usingthe following equations as per International Conference onHarmonization (ICH) guidelines:
LOD = 3.3 × 𝜎𝑆,
LOQ = 10 × 𝜎𝑆,
(1)
0
0.01
0.02
0.03
0.04
0.05
0.06
0 5 10 15 20 25Ab
sorb
ance
Concentration
Calibration curve of Phenylephrine HCl
y = 0.0025x + 0.0004
R2 = 0.9981
Figure 4: Calibration curve of Phenylephrine HCL.
where 𝜎 is the standard deviation of the response, and 𝑆 isSlope of calibration curve.
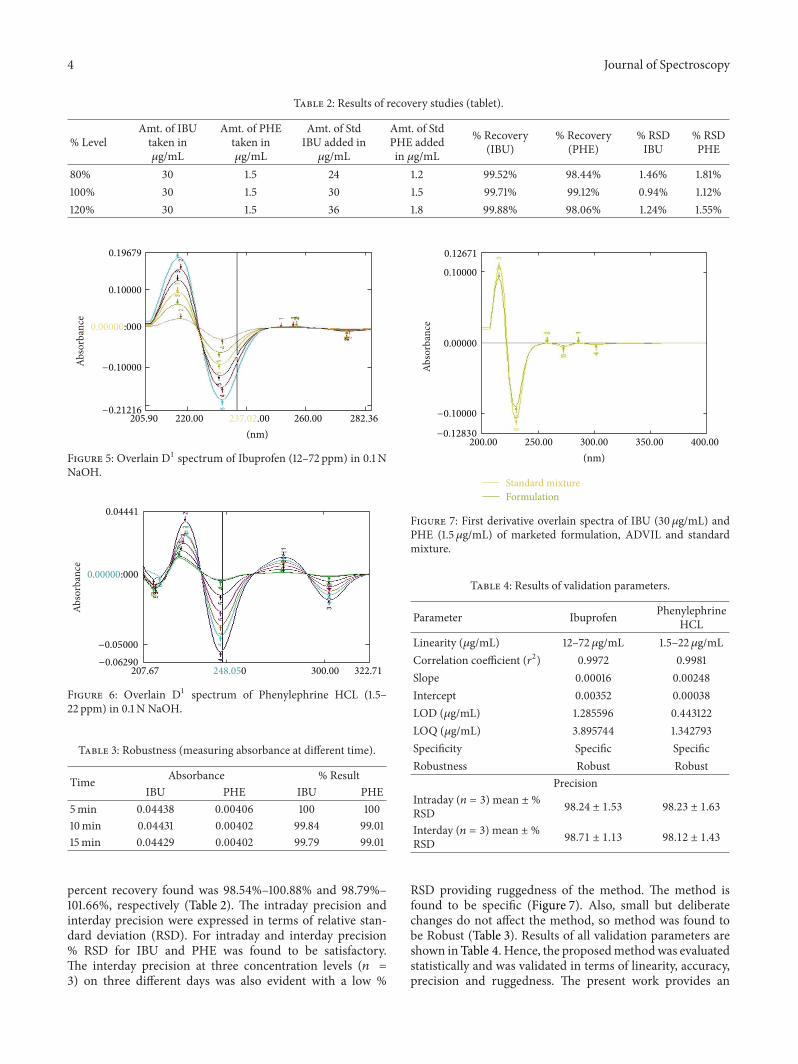
4.5. Specificity. The specificity of an analytical method isability to measure accurately an analyte in presence ofinterferences like synthetic precursor, excipients, degradants,or matrix component. Comparison of first derivative UVspectrum of standard mixture and formulation shows speci-ficity of method. The derivative spectrophotometric methodis able to access the analyte in presence of excipients, and,hence, it can be considered specific.
4.6. Robustness. The robustness of an analytical method isa measure of its capacity to remain unaffected by small butdeliberate variations in method parameters and provides anindication of its reliability during normal usage.
5. Results and Discussion
For this method, 237.0 nm (zero crossing point of PHE) and248 nm (zero crossing point of IBU) of first-order derivativespectra were selected for the analysis. Linear relationship wasobtained over the range of 12–72𝜇g/mL and 1.5–22𝜇g/mLfor Ibuprofen and Phenylephrine HCl, respectively (Figures3 and 4). The correlation coefficients (𝑟2) for IBU and PHEwere found to be 0.9972 and 0.9981, respectively.
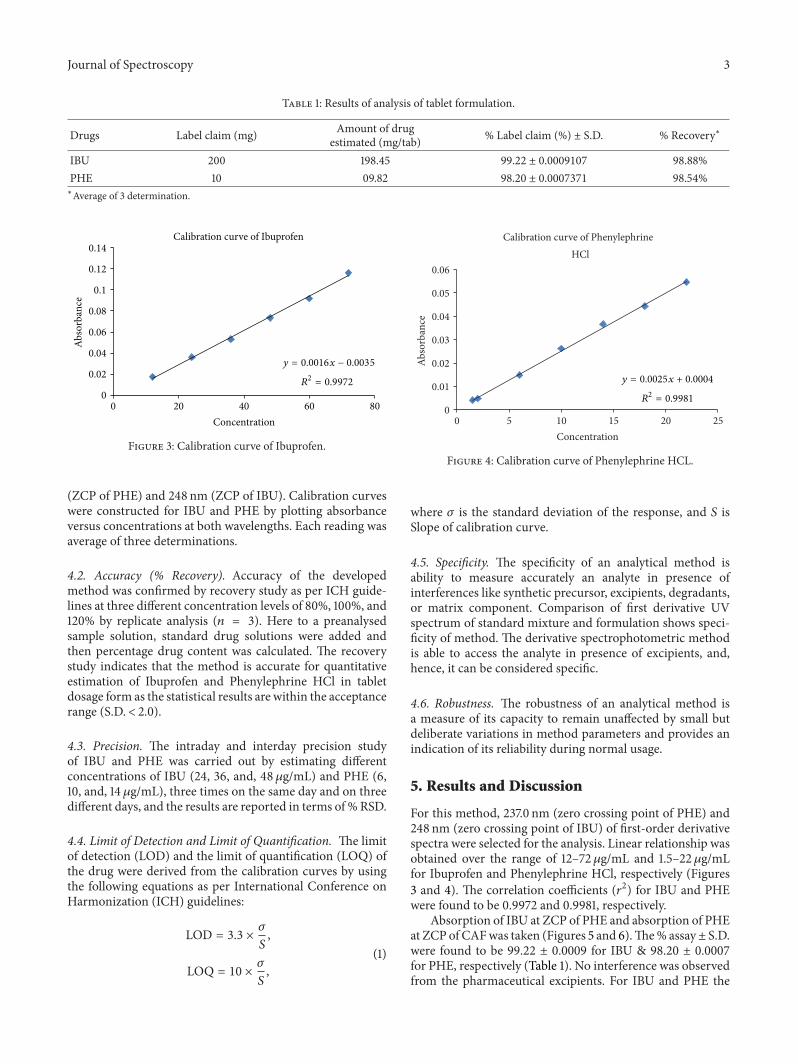
Absorption of IBU at ZCP of PHE and absorption of PHEat ZCP of CAFwas taken (Figures 5 and 6).The% assay± S.D.were found to be 99.22 ± 0.0009 for IBU & 98.20 ± 0.0007for PHE, respectively (Table 1). No interference was observedfrom the pharmaceutical excipients. For IBU and PHE the
4 Journal of Spectroscopy
Table 2: Results of recovery studies (tablet).
% LevelAmt. of IBUtaken in𝜇g/mL
Amt. of PHEtaken in𝜇g/mL
Amt. of StdIBU added in𝜇g/mL
Amt. of StdPHE addedin 𝜇g/mL
% Recovery(IBU)
% Recovery(PHE)
% RSDIBU
% RSDPHE
80% 30 1.5 24 1.2 99.52% 98.44% 1.46% 1.81%100% 30 1.5 30 1.5 99.71% 99.12% 0.94% 1.12%120% 30 1.5 36 1.8 99.88% 98.06% 1.24% 1.55%
0.19679
0.10000
0.00000:000
−0.10000
−0.21216205.90 220.00 237.02.00 260.00 282.36
(nm)
Absorbance
Figure 5: Overlain D1 spectrum of Ibuprofen (12–72 ppm) in 0.1 NNaOH.
0.04441
0.00000:000
−0.05000
−0.06290207.67 248.050 300.00 322.71
Abso
rban
ce
Figure 6: Overlain D1 spectrum of Phenylephrine HCL (1.5–22 ppm) in 0.1 N NaOH.
Table 3: Robustness (measuring absorbance at different time).
Time Absorbance % ResultIBU PHE IBU PHE
5min 0.04438 0.00406 100 10010min 0.04431 0.00402 99.84 99.0115min 0.04429 0.00402 99.79 99.01
percent recovery found was 98.54%–100.88% and 98.79%–101.66%, respectively (Table 2). The intraday precision andinterday precision were expressed in terms of relative stan-dard deviation (RSD). For intraday and interday precision% RSD for IBU and PHE was found to be satisfactory.The interday precision at three concentration levels (𝑛 =3) on three different days was also evident with a low %
0.12671
0.10000
0.00000
−0.10000
−0.12830200.00 250.00 300.00 350.00 400.00
Standard mixtureFormulation
(nm)
Abso
rban
ce
Figure 7: First derivative overlain spectra of IBU (30𝜇g/mL) andPHE (1.5𝜇g/mL) of marketed formulation, ADVIL and standardmixture.
Table 4: Results of validation parameters.
Parameter Ibuprofen PhenylephrineHCL
Linearity (𝜇g/mL) 12–72 𝜇g/mL 1.5–22𝜇g/mLCorrelation coefficient (𝑟2) 0.9972 0.9981Slope 0.00016 0.00248Intercept 0.00352 0.00038LOD (𝜇g/mL) 1.285596 0.443122LOQ (𝜇g/mL) 3.895744 1.342793Specificity Specific SpecificRobustness Robust Robust
PrecisionIntraday (𝑛 = 3) mean ± %RSD 98.24 ± 1.53 98.23 ± 1.63
Interday (𝑛 = 3) mean ± %RSD 98.71 ± 1.13 98.12 ± 1.43
RSD providing ruggedness of the method. The method isfound to be specific (Figure 7). Also, small but deliberatechanges do not affect the method, so method was found tobe Robust (Table 3). Results of all validation parameters areshown in Table 4. Hence, the proposedmethodwas evaluatedstatistically and was validated in terms of linearity, accuracy,precision and ruggedness. The present work provides an
Journal of Spectroscopy 5
accurate and sensitive method for the analysis of IBU andPHE in bulk and tablet formulation.
6. Conclusion
Based on the results obtained, it was found that the proposedmethod is accurate, reproducible, and economical and canbe employed for routine quality control of Ibuprofen andPhenylephrine HCl in bulk and its dosage form.
Acknowledgment
The authors are heartily thankful to P.G. Department ofPharmaceutical Sciences, Sardar Patel University (VallabhVidyanagar, Gujarat, India), for funding entire project andproviding the necessary facilities for research work.
References
[1] Martindale, The Complete Drug Reference, PharmaceuticalPress, London, UK, 33rd edition, 2002.
[2] V. E. Haikala, I. K. Heimonen, and H. J. Vuorela, “Deter-mination of ibuprofen in ointments by reversed-phase liquidchromatography,” Journal of Pharmaceutical Sciences, vol. 80,no. 5, pp. 456–458, 1991.
[3] I. Savic, G. Nikolic, and V. Bankovic, “Development andvalidation of spectrophotometric method for phenylephrinehydrochloride estimation in nasal drops formulations,” Mace-donian Journal of Chemistry and Chemical Engineering, vol. 27,no. 2, pp. 149–156, 2008.
[4] G. W. Schieffer and D. E. Hughes, “Simultaneous stability-indicating determination of phenylephrine hydrochloride,phenylpropanolamine hydrochloride, and guaifenesin indosage forms by reversed-phase paired-ion high-performanceliquid chromatography,” Journal of Pharmaceutical Sciences,vol. 72, no. 1, pp. 55–59, 1983.
[5] R. Gondalia, R.Mashru, and P. Savaliya, “Development and val-idation of spectrophotometric methods for simultaneous esti-mation of IBUPROFEN and PARACETAMOL in soft gelatincapsule by simultaneous equation method,” International Jour-nal of ChemTech Research, vol. 2, no. 4, pp. 1881–1885, 2010.
[6] D. A. Shah, D. J. Suthar, S. L. Baldania, U. K. Chhalotiya, andK. K. Bhatt, “Development and validation of liquid chromato-graphic method for estimation of ibuprofen and famotidine incombined dosage form,” ISRN Analytical Chemistry, vol. 2012,Article ID 674392, 5 pages, 2012.
[7] B. Tsvetkova, I. P. Pencheva, A. B. Zlatkov, and P. T. Peikov,“Development and validation of RP-HPLC method for simul-taneous determination of paracetamol and ibuprofen in fixeddose combinations,” International Journal of PharmaceuticalSciences Review and Research, vol. 16, no. 1, pp. 13–16, 2012.
[8] S. S. Chitlange, D. M. Sakarkar, S. B. Wankhede, and S. G.Wadodkar, “High performance thin layer chromatographicmethod for simultaneous estimation of ibuprofen and pseudoe-phedrine hydrochloride,” International Journal of PharmTechResearch, vol. 4, no. 4, pp. 1575–1580, 2012.
[9] W. D. Sam Solomon, R. A. Kumar, P. R. Vijai Anand, R. Sivaku-mar, and R. Venkatnarayanan, “Derivatized HPTLC methodfor simultaneous estimation of glucosamine and ibuprofen intablets,” Journal of Pharmaceutical Research and Health Care,vol. 2, no. 2, pp. 156–162, 2010.
[10] M. Maithani, R. Raturi, V. Gautam et al., “Development andvalidation of a RP-HPLC method for the determination ofchlorpheniramine maleate and phenylephrine in pharmaceu-tical dosage form,” International Journal of ComprehensivePharmacy , vol. 1, no. 5, pp. 1–4, 2010.
[11] A. Marın, E. Garcıa, A. Garcıa, and C. Barbas, “Validation ofa HPLC quantification of acetaminophen, phenylephrine andchlorpheniramine in pharmaceutical formulations: capsulesand sachets,” Journal of Pharmaceutical andBiomedical Analysis,vol. 29, no. 4, pp. 701–714, 2002.
[12] I. Muszalska, M. Zajac, G.Wrobel, andM. Nogowska, “UV/VISspectrophotometric methods for determination of caffeineand phenylephrine hydrochloride in complex pharmaceuticalpreparations validation of themethods,”Acta Poloniae Pharma-ceutica, vol. 57, no. 4, pp. 247–252, 2000.
[13] S. Sheikh and S. A. Patni, “A validated, specific stabilityindicating reverse phase liquid chromatographicmethod for thesimultaneous estimation of phenylephrine HCL, betametha-sone valerate & lignocaine HCL in pharmaceutical ointment,”International Journal of Scientific and Research Publications, vol.2, no. 12, 2012.
[14] P. V. Devarajan, M. H. Adani, and A. S. Gandhi, “Simultaneousdetermination of lignocaine hydrochloride and phenylephrinehydrochloride by HPTLC,” Journal of Pharmaceutical andBiomedical Analysis, vol. 22, no. 4, pp. 685–690, 2000.
[15] S. Wankhede, K. Lad, and S. Chitlange, “Development andvalidation of UV-spectrophotometric methods for simultane-ous estimation of cetirizine hydrochloride and phenylephrinehydrochloride in tablets,” International Journal of Pharmaceuti-cal Sciences and Drug Research, vol. 4, no. 3, pp. 222–226, 2012.

Submit your manuscripts athttp://www.hindawi.com
Hindawi Publishing Corporationhttp://www.hindawi.com Volume 2014
Inorganic ChemistryInternational Journal of
Hindawi Publishing Corporation http://www.hindawi.com Volume 2014
International Journal ofPhotoenergy
Hindawi Publishing Corporationhttp://www.hindawi.com Volume 2014
Carbohydrate Chemistry
International Journal of
Hindawi Publishing Corporationhttp://www.hindawi.com Volume 2014
Journal of
Chemistry
Hindawi Publishing Corporationhttp://www.hindawi.com Volume 2014
Advances in
Physical Chemistry
Hindawi Publishing Corporationhttp://www.hindawi.com
Analytical Methods in Chemistry
Journal of
Volume 2014
Bioinorganic Chemistry and ApplicationsHindawi Publishing Corporationhttp://www.hindawi.com Volume 2014
SpectroscopyInternational Journal of
Hindawi Publishing Corporationhttp://www.hindawi.com Volume 2014
The Scientific World JournalHindawi Publishing Corporation http://www.hindawi.com Volume 2014
Medicinal ChemistryInternational Journal of
Hindawi Publishing Corporationhttp://www.hindawi.com Volume 2014
Chromatography Research International
Hindawi Publishing Corporationhttp://www.hindawi.com Volume 2014
Applied ChemistryJournal of
Hindawi Publishing Corporationhttp://www.hindawi.com Volume 2014
Hindawi Publishing Corporationhttp://www.hindawi.com Volume 2014
Theoretical ChemistryJournal of
Hindawi Publishing Corporationhttp://www.hindawi.com Volume 2014
Journal of
Spectroscopy
Analytical ChemistryInternational Journal of
Hindawi Publishing Corporationhttp://www.hindawi.com Volume 2014
Journal of
Hindawi Publishing Corporationhttp://www.hindawi.com Volume 2014
Quantum Chemistry
Hindawi Publishing Corporationhttp://www.hindawi.com Volume 2014
Organic Chemistry International
ElectrochemistryInternational Journal of
Hindawi Publishing Corporation http://www.hindawi.com Volume 2014
Hindawi Publishing Corporationhttp://www.hindawi.com Volume 2014
CatalystsJournal of