Embed Size (px)
Citation preview

Research ArticleSeismic Strengthening Effects Based on PseudodynamicTesting of a Reinforced Concrete Building Retrofitted witha Wire-Woven Bulk Kagome Truss Damper
Jae-Sung Hwang and Kang Seok Lee
School of Architecture, Chonnam National University, Gwangju 500-757, Republic of Korea
Correspondence should be addressed to Kang Seok Lee; [email protected]
Received 21 April 2016; Accepted 27 June 2016
Academic Editor: Vadim V. Silberschmidt
Copyright © 2016 J.-S. Hwang and K. S. Lee. This is an open access article distributed under the Creative Commons AttributionLicense, which permits unrestricted use, distribution, and reproduction in any medium, provided the original work is properlycited.
A passive damper with a wire-woven bulk Kagome truss design was recently developed; its applicability as a passive damper toimprove the seismic performance of building systems, including shear hysteresis behavior, energy dissipation capacity, and fatigue,was confirmed by material tests. The Kagome truss, a periodic cellular metal type, is composed of evenly distributed helical wireswith a constant pitch and helical radius in six directions.The purpose of this study was to develop a new passive damper system forseismic strengthening of existing reinforced concrete (RC) frames. The proposed external connection methodology uses a wire-woven bulk Kagome truss (i.e., a Kagome damper external connection (KDEC) system), to dissipate earthquake energy using thedynamic interaction among an existing building, a support structure, and the Kagome damper installed between them. Four testspecimens were designed and then strengthened with the KDEC system. Cyclic loading and pseudodynamic tests were conducted;lateral load-carrying capacity, deformation, and hysteresis characteristics were investigated, as well as the maximum responsestrength, response ductility, and earthquake damage degree, and compared to a control sample. Test results revealed that the KDECsystem effectively dissipated the earthquake energy, showing considerable resilience under large-scale earthquake conditions.
1. Introduction
It has been widely recognized that the earthquake loadis the most important factor in the structural design ofbuilding systems. The correlations between the degree ofdamage and the seismic resistance mechanism of structuresin an earthquake have been investigated theoretically andexperimentally in many studies. Calculation procedures forshear forces and dynamic responses based on those researchresults have been developed and adopted in seismic designcodes and standards over recent decades, including ASCE 7-10 [1], AIJ 2010 [2], ACI 318-14, and ACI 318R-14 [3].
Thus, progress in the art of seismic design has resultedin new buildings with improved prospects of satisfactorybehavior during an earthquake.At the same time, innovationsin seismic design methodologies have created some doubtsas to the adequacy of the seismic behavior of existing build-ings, as revealed by recently occurring strong earthquakes,including the 1995 Kobe Earthquake in Japan, the 1999
Chi-Chi Earthquake in Taiwan, the 2008 Sichuan Earthquakein China, the 2010 Chile Earthquake, the 2011 ChristchurchEarthquake in New Zealand, the 2012 Great East JapanEarthquake, and the 2013 Lushan Earthquake in China.
Over the last three decades, rehabilitation procedureshave been promoted, and many seismic strengtheningtechniques have been developed to improve the seismicperformance of existing buildings. Conventional seismicretrofitting techniques to increase the ultimate strengthinclude infilling new shear walls in existing frames, addingsteel braces in existing frames, adding side walls (wing walls)to existing columns, and adding buttresses to the exteriorframes of a building. Techniques to improve the deformationcapacity of existing structural members include jacketingwith steel plates, jacketing with steel bands, and jacketingwith welded wire fabric and covering concrete. However,these conventional methods have several disadvantages, suchas an increase in mass, the requirement for precise con-struction, and foundation reinforcement problems. Other
Hindawi Publishing CorporationShock and VibrationVolume 2016, Article ID 3956126, 17 pageshttp://dx.doi.org/10.1155/2016/3956126

2 Shock and Vibration
(a) (b)
Figure 1: Configuration of the Kagome truss: (a) wire-woven bulk Kagome fabricated by a three-dimensional assembly of wires and (b) awire-woven bulk Kagome damper [5].
methods, such as fiber-reinforced polymer (FRP) sheetsfor seismic strengthening of concrete columns using newlightweight composite materials, such as carbon fiber orglass fiber, have excellent durability and performance andhave been applied to overcome the shortcomings of conven-tional seismic strengtheningmethods. Nevertheless, the FRP-sheet reinforcement method still has drawbacks, such as therequirement for prior surface treatment, problems at joints,fire-resistance problems, and relatively expensive materialcosts.
Over the past couple of decades, new technologies usingvibration control devices have been introduced to strengthenexisting structural systems, as well as design new structuresto keep a building structure undamaged in an earthquake.These are currently regarded as the most promising earth-quake protection systems. Structural design procedures forvibration control devices specified in ASCE 7-10 [1] areclassified as damping systems for existing structures andearthquake-resistant systems for seismic design; these areapplied separately. Vibration control techniques ensure theseismic safety of the entire structural system, as well as eachmember, by absorbing the earthquake loads using controldevices or members, which have a high energy dissipationcapacity, while a conventional structural system could resistearthquake loads via each member element in the structuralsystem.
These devices are classified as passive, active, and semi-active control systems according to the supply system ofexternal energy. Passive control systems have been usedwidely for seismic strengthening and seismic design of thestructures because it is virtually impossible to supply externalenergy when an earthquake occurs. Passive control devicesare categorized into metallic yielding dampers, frictiondampers, viscoelastic dampers, and fluid viscous dampers,in accordance with their material properties and energy-absorbing mechanisms [4].
In massive structures such as building systems, the sizeand capacity of passive control devices should be proportion-ally large to ensure an enhancement effect of seismic controlcapacity in terms of a specific level of desired structuralperformance for the given earthquake demand. Becausemostinstallation spaces for control devices inside structures are,however, narrow and limited, a high-performance devicemust be used rather than simply a large one. Addition-ally, the passive control devices require miniaturization and
weight lightening in limited spaces to enhance the seismicdeformation capability, which depends on the intensity ofthe earthquake ground motion, durability against dynamicfatigue, and age deterioration.
A new passive damper designed using a wire-wovenbulk Kagome truss structure, as shown in Figure 1, wasdeveloped by Hwang et al. [5]; its applicability as a passivedamping material to improve the seismic performance ofbuilding systems, including shear hysteresis behavior, energydissipation capacity, and fatigue, was confirmed based onmaterial tests. The Kagome truss, a periodic cellular metalstructure, was first introduced by Wadley et al. [6]. It iscomposed of helically formed wires with a constant pitch andhelical radius in six directions, evenly distributed in space.TheKagome truss is known to have equivalent or even higherstrength than an octet truss of the same material and density.Recently, Lee et al. [7] developed a practical fabricationprocess for the wire-woven bulk Kagome, fabricated using athree-dimensional assembly of wires for mass production.
The main purpose of this study was to develop a newpassive damper system for seismic strengthening of existingreinforced concrete (RC) framing systems. The proposedtechnique is an external connection methodology that usesa wire-woven bulk Kagome truss (referred to as a Kagomedamper external connection system or KDEC system). Fig-ure 2 shows a conceptual illustration of the KDEC sys-tem proposed here, which consists of an existing buildingstructure, a Kagome damper, and support structure. TheKDEC system dissipates the earthquake energy using thedynamic interaction among the existing building structure,the support structure, and the Kagome damper installedbetween them. Thus, optimal structural properties of thesupporting structures and damper, in connection with theexisting building structure, are required for effective earth-quake energy absorption.
An existing RC frame building, designed by the KoreaLand & Housing Corporation [8], was selected to assess theseismic strengthening effect of the KDEC system proposedhere.This study, first, involved preliminary dynamic analysesof the KDEC system, assessing the Kagome damper size,height of support, and ratio of the elastic modulus betweenthe support and existing RC structure as analysis variables todetermine the optimum structural properties of the supportand damper for the KDEC system. Test specimens strength-ened with the KDEC system were designed and fabricated on

Shock and Vibration 3
Supportstructure
Existing building
Kagomedamper
Seismic load
Figure 2: Concept of the external connection methodology using awire-woven bulk Kagome truss.
the basis of the optimum properties derived from the resultsof the preliminary analyses.
A pseudodynamic test was carried out to verify theseismic strengthening effects of the proposed KDEC system;the test results were compared to the original control RCframe, in terms of maximum response strength, responseductility, and earthquake damage degree under a level ofearthquake specified by the seismic design code in Korea[9]. Before the pseudodynamic test, a cyclic loading testwas also carried out to estimate the ultimate and yieldshear load-carrying capacity and deformation, as well as thehysteresis in the lateral load-drift relationships of the RCframe strengthened with the KDEC system, together with anonstrengthened frame.The hysteresis properties are neededto determine the test variables for the pseudodynamic test.Four test specimens were designed and fabricated: two for thepseudodynamic test and two for the cyclic loading test.
2. Preliminary Dynamic Analyses ofthe KDEC System
2.1. Overview and Assumptions in the Analysis. The KDECsystem used to strengthen the existing RC frame building,designed by the Korea Land&Housing Corporation [8], con-sists of the existing building structure, the Kagome damper,and a support structure (Figure 2); the seismic performanceof the system depends on the dynamic interaction amongthem based on their structural properties. As previouslystated, the Kagome truss damper is a control device thatabsorbs earthquake energy by relative displacement at bothends [5–7]. Thus, the relative displacement between theexisting RC building and the support structure must be largeto effectively dissipate the energy; additionally, the optimalstructural properties (i.e., stiffness, height, and size) of thesupport andKagome damper should be determined to ensurelarge displacement.
A frame selected for test specimens
Kagome truss damperSupport structure
Figure 3:The considered existing reinforced concrete (RC) buildingand installation positions of the support and damper.
In a preliminary analysis, the stiffness and height of thesupport structure and the size of Kagome damper were setas variables and the boundary nonlinear dynamic analysistechnique was used to determine the optimal properties.A boundary analysis assumes that the investigated framebuilding and support structure behave as linear bodies, andthe nonlinearity of the control device is considered [12]. Theminimum stiffness ratio and capacity of the support anddamper derived from the preliminary analyses were used todesign the structural test specimens strengthened using theKDEC system.
Figure 3 shows an isometric perspective of the existingRCframe building considered in this study. The frame building,designed by the Korea Land & Housing Corporation [8], is a20-story RC frame building located in Seoul; the building hasa response modification factor of 𝑅 = 5. The cross sections ofthe columns in the building are all 500 × 800mm, and thestory heights are all 3100mm. For the analysis, the heightsof the support structures were set as three- and five-story-scaled structures with the same story height (3100mm) as theoriginal frame building, and their stiffness was selected frommultiples in terms of the ratio of the elastic modulus of theoriginal column to that of the support; the ratios used wereas follows: 1 : 1, 1 : 3, 1 : 5, 1 : 10, 1 : 50, and 1 : 100. The materialproperties of the Kagome truss damper installed betweenthe existing building and support are listed in Table 1. Therestoring force 𝐹(𝑡) of the damper is based on the Bouc-Wenhysteresis model [13], expressed in the following equations:
𝐹 (𝑡) = 𝑟𝐾𝑢 (𝑡) + (1 − 𝑟) 𝐹𝑦𝑧 (𝑡) , (1)
where 𝑟 is the ratio of the postyield stiffness to preyieldstiffness 𝐾(= 𝐹𝑦/𝑢𝑦), 𝐹𝑦 is the yield force, 𝑢𝑦 is the yield

4 Shock and Vibration
Table 1: Material properties of the Kagome truss damper.
Material properties Height(mm)
Yieldingstrain (%) Ultimate strain (%) Yielding stress (MPa) Ultimate stress (MPa)
Values 200 0.23 15 0.79 1.31
0 5 10 15 20−0.2
−0.1
0.0
0.1
0.2
Art
ifici
al g
roun
d m
otio
n (g
)
Time (sec)
Figure 4: Artificial groundmotions used in the boundary nonlinearanalysis.
displacement, and 𝑧(𝑡) is a nonobservable dimensionless hys-teresis variable that obeys the following nonlinear differentialequation with zero initial condition (𝑧(0) = 0):
�̇� (𝑡) =𝐾
𝐹𝑦
{1 − |𝑧 (𝑡)|𝑛𝛼 ⋅ sign (�̇� (𝑡) 𝑧 (𝑡)) + 𝛽} �̇� (𝑡) , (2)
where the coefficient 𝑛 is the yielding exponent that controlsthe behavior of the model and sign(⋅) is the signum function.𝛼, 𝛼 > 0, is a dimensionless quantity controlling theenergy dissipation effect, 𝛽 is also a dimensionless parameterrepresenting the shape of nonlinear stiffness of hysteresisloop, and |𝛼| + |𝛽| = 1.
By multiplying the material properties shown in Table 1by the size of the damper, set as a variable, the yieldingand ultimate strengths and deformations can be calculatedreadily. The cross sections (size) of the dampers used in theanalysis ranged from 100× 100 to 800× 800mm (eight types).
The support structures were installed at the four edgesof the building plane, as illustrated in Figure 3, in whichthe number of dampers is dependent on the height (story)of the support. Figure 3 shows an example of a five-storysupport structure having in total 20 dampers. Additionally,the artificial ground motions shown in Figure 4 were used asthe ground motion acceleration for the boundary nonlinearanalysis, generated by the methodology specified in theseismic design code in Korea [9], based on a seismic factorof Zone-1 and condition of Sd soil. In total, 97 analysis caseswere carried out to calculate the base shear strength anddisplacement at the top level of the frame building: therewere two support heights, eight damper sizes, and six elasticmodulus ratios, including an existing frame building as acontrol.
2.2. Results of the Analysis. The results of the preliminaryanalysis, conducted to identify the optimum structuralproperties for the KDEC system for seismic strengthening,
indicated that the reduction effect in terms of the responsebase shear force, compared with the original building as acontrol, increased in proportion to the higher stiffness ofthe support and larger cross-sectional area of the Kagomedamper. The presumption is that, due to the higher stiffnessof the support, the displacement of the support becomessmaller, resulting in larger relative displacement between theinvestigated existing building and the support. The Kagomedamper is capable of absorbing the earthquake energy using alow range of displacement due to its mechanical characteris-tics [5].Thus, if the cross-sectional area of the damper is large,the energy dissipation capability increases proportionally,resulting in a greater reduction in the response base shearforce.
Considering the limitations of the support’s stiffness andthe damper’s size and from the relationship regarding theresponse reduction between them, in the KDEC system, theratio of the elasticmodulus of EM= 1 : 10 between the originalcolumn and the support is the most practical result (Table 2).In the table, the shear force ratio is defined as the maximumresponse base shear force of the building strengthened usingthe KDEC system divided by that of the control buildingwithout the KDEC system. In the case of the support, scaledusing a three-story structure having EM = 1 : 10, the crosssections (size) of the damper of 700 × 700mm and 800 ×
800mm showed reductions of ∼20% in the base shear force.For the cross sections (size) of the damper of 400 × 400mmthrough 800 × 800mm, the base shear force decreased by∼18% in the case of a five-story-scaled support having EM =
1 : 10.The larger size of the damper shows the smaller relative
displacement between the structure and the support, aspreviously stated. This results in a reduction of the energydissipation of the damper. On the other hand, the smallersized damper has a limitation in energy dissipation byitself. By the trade-off, the best size of damper should bedetermined. A smaller damper cross section is advantageousfrom a practical point of view if the reduction effect on baseshear force is similar. As a result, a support scaled using afive-story structure having EM = 1 : 10 and a damper of crosssection 400 × 400mm is the “best” result for strengtheningthe existing RC frame using the KDEC system proposed inthis study.
3. Structure Tests
3.1. Specimen Design, Fabrication, and Variables. As previ-ously stated, the building considered in this study is a 20-story RC frame structural system located in Seoul, designedaccording to the seismic design code in Korea [9] usinga response modification factor of 𝑅 = 5 and the soilcondition of Sd. The cross-sectional areas of the columnsare all 500 × 800mm, and the story height is 3100mm. For

Shock and Vibration 5
Table 2: Results of the preliminary analysis and the reduction effect of base shear force by the KDEC system.
Supportstructure
Ratio of elasticmodulus (EM)
Damper size(mm2)
Maximum responsedisplacement at thetop level of thebuilding (mm)
Maximumresponse baseshear force Maximum
responsedisplacement ofdamper (mm)
Shearforce(kN)
Shearforceratio∗2(%)
— Control∗1 — 429.1 18790 — —
3F 10
100 × 100 428.6 18666.2 0.7 28.57200 × 200 427.3 18323.4 2.5 26.64300 × 300 425.1 18163.2 3.3 24.67400 × 400 421.6 17171.2 8.6 22.24500 × 500 416.6 16532.2 12.0 19.83600 × 600 410.8 15762.4 16.1 17.53700 × 700 405.1 15058.6 19.9 15.43800 × 800 400.0 14725.6 21.6 13.59
5F 10
100 × 100 425.9 17185.8 8.5 62.69200 × 200 417.8 16569.6 11.8 49.21300 × 300 406.9 15945.4 15.1 36.41400 × 400 397.6 15519.8 17.4 26.87500 × 500 390.8 15321.8 18.5 20.32600 × 600 385.8 15270.0 18.7 15.80700 × 700 382.1 15290.4 18.6 12.63800 × 800 379.6 15360.8 18.3 10.33
∗1Control shows the control building without the damper.∗2The shear force ratio is defined as the maximum response base shear force of the building strengthened using the KDEC system divided by that of the controlbuilding without the KDEC system, which indicates the reduction effect in terms of the response base shear force compared with the control building.
structural tests (i.e., cyclic loading and pseudodynamic tests),the first story of an external frame (Figure 3) was selected.Table 3 represents comparisons of the dimensions betweenthe existing original frame and the scaled-down specimenfor structural tests. The ratio of the dimension reduction is∼50% (Table 3), when the size of the structural laboratoryfacility, actuator equipment, and the capacity of the overheadtravelling crane were considered. The configuration of thescaled-down specimens, including the column and the wallsupport, was designed and fabricated based on the results ofthe preliminary analyses in Section 2.2: the support structure(wall) was scaled using a five-story structure having EM =
1 : 10, and the cross section of the damper was 400 × 400mm,the “best” result for strengthening the existing RC frameusing the KDEC system.
Figures 5 and 6 show the configurations and details ofthe scaled-down specimens and the Kagome damper for thestructural tests, respectively. The purpose of these tests wasto verify the seismic strengthening effects, that is, the max-imum response strength, response ductility, and earthquakedamage degree, as well as hysteresis in the lateral load-driftrelationship of the specimen strengthened with the KDECsystem, compared to the control specimen. The columnspecimens and the wall supports were designed accordingto the guidelines for load-carrying capacity specified bythe Japan Building Disaster Prevention Association (JBDPA)[14].
Table 4 gives the specific details of each specimen tested.In total, four test specimens were prepared. They consistedof a control test specimen (nonstrengthened, CL-F) and atest specimen strengthened with the KDEC system (CL-FK)for the cyclic loading test, as well as a control test specimen(nonstrengthened, PD-F) and a test specimen strengthenedwith the KDEC system (PD-FK) for the pseudodynamic test.All specimens had identical dimensions and rebar arrange-ments. The cross section of the columns was 250 × 400mm,and the ratio of column clear height to depth (ho/𝐷) was 3.13.The wall supports had a thickness of 25mm and a length of110mm, and the Kagome damper had a cross-sectional areaof 33,000mm2 (150 × 220mm). Each column was preparedwith a 10-D16-type SD400 main rebar, reinforced with shearreinforcement D10 steel bars at 100mm intervals. The wallsupport was used with D19-type SD400 for vertical rebarand D10-type SD400 for horizontal rebar. A stub, with highstiffness, was installed at the top of each specimen to provideconfinement of the columns. The average vertical load oneach column was 210 kN, which is 10% of the nominalcompressive strength of the concrete.
The ground motion acceleration for the pseudodynamictest was the north-south (NS) ground motion recorded at ElCentro, as shown inTable 4.The groundmotionwas recordedduring the 1940 Imperial Valley earthquake, which has beenwidely used to verify the seismic performance of variousbuilding systems. The magnitude of the ground motion was

6 Shock and Vibration
Table 3: Comparison of dimensions between the existing original frame and scaled-down specimen for structural tests.
Object of comparison Dimensions (mm)Original frame Specimen (scale is ∼50% down)
Cross section of columns 500 × 800 250 × 400Height of columns 3,000 1,500Thickness of walls (support) 500 250Length of walls (support) 2,200 1,100Span 10,000 1,500Cross section of Kagome damper 400 × 400 150 × 220Height of Kagome damper 200 200
Table 4: Summary of the test conditions for the cyclic loading and pseudodynamic tests.
Specimens Test methods Strengthening types Clear span of columns (mm) Earthquake levels forpseudodynamic test (gal)
CL-F Cyclic loading — 1250 —CL-FK Cyclic loading Kagome damper 1250 —PD-F Pseudodynamic — 1250 El Centro (NS): 200, 300PD-FK Pseudodynamic Kagome damper 1250 El Centro (NS): 200, 300CL-F: nonstrengthened control specimen for the cyclic loading test; CL-FK: specimen strengthened with the KDEC system for the cyclic loading test; PD-F:nonstrengthened control specimen for the pseudodynamic test; PD-FK: specimen strengthened with the KDEC system for the pseudodynamic test.
normalized to acceleration values of 200 gal and 300 gal; theground motion acceleration of 200 gal corresponds to theseismic design load in Zone-1 with the Sd-soil conditions,which shows a two-thirds level of the earthquake groundmotion having 2% probability of exceedance in 50 years(2,500-year return period), as specified in the seismic designcode in Korea [9]. A ground motion of 300 gal was addition-ally set to compare the seismic strengthening effect of theKDEC system in a very strong earthquake; this represents themaximum considered earthquake ground motion with 2%probability of exceedance in 50 years.
3.2. Material Properties. The listed compressive strength ofthe concrete was 𝑓𝑐 = 21MPa; cylindrical compression testsresulted in a figure of 21.7 ± 1.1MPa. The tensile strengthof the steel reinforcing bar (rebar) was 400MPa. Two rebardiameters were used: D10 for shear reinforcement and D16for themain rebar of the specimens (see Section 3.1 for furtherdetails).The wall support used D19 for vertical rebar and D10for horizontal rebar. The uniform building code [15] pertainsto RC design in earthquake zones and specifies that the ratioof the tensile stress to the yield stress of the rebar should notbe less than 1.25, to ensure adequate ductility under simulatedearthquake loading. In our tensile testing of the rebar, thisratio was 1.45 for the D10 rebar and 1.35 for the D16 rebar.The tensile strength of the steel rebar was measured usinga universal testing machine (UTM); we obtained 472.0 ±
1.31MPa for D10 rebar, 518.0 ± 1.87MPa for D16 rebar, and522.1±2.27MPa for D19 rebar; the error margins correspondto the standard deviation of the measurement results.
4. Pseudodynamic Testing Procedures
4.1. Outline of Pseudodynamic Testing. The most realisticmethodology to evaluate the nonlinear response character-istics of a test structure, for example, a building subjected to
earthquake ground motions, would be a full-scale structuraltest on a shaking table. Generally, this is not possible withcurrent experimental facilities, nor will it ever be practicalfor most large structures. Several alternative approaches havebeen developed, in which shaking table tests of reduced-scale structural models can be used. The drawbacks of suchreduced-scale tests are obvious; it is sufficient to point outthat many structures cannot be adequately represented byreduced-scale structural models.
The pseudodynamic test method has been developed tocarry out realistic experimental tests on full-scale structuressubjected to earthquake groundmotions [16].The pseudody-namic test method uses an online computer and associatedtest instrumentation to monitor and control the structureso that the structural displacement closely resembles whatwould occur if the structure was subjected to a seismicexcitation. The procedure is a self-determined experimentaltechnique. The method is as realistic as shake-table testing,where discretization of the model is feasible. Furthermore,it provides various advantages over shake tables, such as(a) versatility, because it allows for detailed observation ofthe specimen during the test, (b) the possibility of testingfull- and large-scale models, thus eliminating the problemsinvolved with dynamic similitude, (c) no need for actualmasses to be provided because the method uses a numer-ical model, (d) much lower equipment, installation, andoperation costs, (e) elimination of problems arising fromshake-table interaction with heavy specimens, (f) the factthat physical limitations of the instrumentation make itnecessary to carry out the test on a step-by-step basis (i.e.,pseudodynamically) although, in principle, the test could becarried out in real time, and (g) improved actuator controland data acquisition reliability due to the relatively slow

Shock and Vibration 7
Support(wall)
Beam
(a)
ColumnKagomedamper
Beam
(b)
Kagomedamper
ColumnBeam
(c)
D10@130
D16@130
D10@100
D10@70
8-D22
8-D224-D22
10-D16
13-D22
13-D228-D22
D16@130
(d)
8-D22
4-D22
8-D22
13-D22
8-D22
13-D22
500100 300 100
2-D164-D16
1,300150 1,000 150
500
250
1,25
050
0
2,50
0
500100 300100
1,300
500
250
1,25
050
0
2,50
0
150 1,000 150
275 250 300 250 225
125 250 125
(e)
Figure 5: Configuration and details of test specimens: (a) rear view, (b) front view, and (c) inside view of specimen strengthened with aKagome damper. (d) Details of control specimen and (e) specimen strengthened with a Kagome damper.

8 Shock and Vibration
Upper steel plate (10t)for connecting the damper
Lower steel plate (10t) for connecting the damper
Welding
Welding
300
22 256
40 220
22
1095
55
9010
77
7
Welding
(a) (b)
Upper steel plate (10t)for connecting the damper
Lower steel plate (10t) for connecting the damper
Welding
WeldingWelding
Welding
250
30 60 70 60 30
50 150 50
1095
55
9010
77
7
(c) (d)
Figure 6: Configuration and details of the Kagome damper: (a) front view, (b) isometric view, and (c) side view. (d) Fabrication of the Kagomedamper.
rate of loading. However, shake-table testing may be favoredin cases where strain-rate effects are significant and/or indistributed parameter systems.
Experimental measurements are used to determine thestructural restoring forces during the test. These measuredforces are then used by the computer, together with a set ofmathematical equations for the inertial response character-istics, to determine changes in the structural displacementthat would occur as a consequence of the given groundacceleration.The procedure is superior to quasi-static testingbecause the nonlinear structural characteristics are based oninstantaneous experimental feedback rather than on hypo-thetical mathematical models. Pseudodynamic testing differsfrom classical computer-based structural dynamic simula-tions, which depend on experimentally measured structuralrestoring forces rather than on structural restoring forcescomputed from a mathematical model.
4.2. Description of Pseudodynamic Testing System Used inThis Study. A simplified schematic diagram of the pseudody-namic testing system used in this study is shown in Figure 7.
The system can be expressed as a single degree-of-freedom(SDF) structure. During the test, the computed displacementresponse is imposed on the specimen by hydraulic actuators.The actual restoring forces are physically measured fromthe test. This feedback value of restoring force is used bythe control computer to calculate the displacement for thefollowing time increment. Transformation of data is achievedusing an analog-to-digital and digital-to-analog converter(DA-16A, Tokyo Soki Kenkyujo Company) [17]. Filteringand amplification are performed on all operations to ensurereliable results and accurate closed-loop control.
In this test, the Pseudodynamic Testing Program pro-vided byMTS Systems Corporation [18] was used to calculatethe displacement from the equation of motion of the SDFstructural system, as given in (3), by the control computer:
𝑚�̈� (𝑡) + 𝑐�̇� (𝑡) + 𝑟 (𝑡) = −𝑚�̈�, (3)
where 𝑦 is the relative displacement of the mass with respectto its base, 𝑐 is the damping coefficient, 𝑟 is the hysteresisrestoring force, and �̈� is the base acceleration.

Shock and Vibration 9
For axial load
Axial load applicationIteration
Numerical calculation
LVDT
(Amp: DA-16A)(Data logger)
Computerfor control
For axial load
For lateralload
Lateral load application
Axial load applicationConstant
Computer formeasurement
Iteration
Iteration
(2) Input of earthquake wave(3) Calculation of response displacement(4) Calculation of response velocity
and acceleration
Displacementapplied to specimen
Measurement of restoring forceof specimen
Loading for test
(Hydraulic pumps)(Controller)
(1) Step i = i + 1
Figure 7: Simplified schematic diagram of the pseudodynamic testing system.
The time integration scheme adopted for solving theequation of motion was an adaptive time stepping algorithmdeveloped by Shing et al. [19], based on the 𝛼-methodby Hilber et al. [20]. The algorithm to perform numericalintegration of the pseudodynamic testing can be expressedin the following form:
𝑚𝑎𝑖+1 + (1 + 𝛼) 𝑐V𝑖+1 − 𝛼𝑐V𝑖 + (1 + 𝛼) 𝑟𝑖+1 − 𝛼𝑟𝑖
= (1 + 𝛼) 𝑓𝑖+1 − 𝛼𝑓𝑖
(4)
with
𝑦𝑖+1 = 𝑦𝑖 + Δ𝑡V𝑖 + Δ𝑡2[(
1
2− 𝛽) 𝑎𝑖 + 𝛽𝑎𝑖+1] ,
V𝑖+1 = V𝑖 + Δ𝑡 [(1 − 𝛾) 𝑎𝑖 + 𝛾𝑎𝑖+1] ,
(5)
where 𝑦𝑖, V𝑖, and 𝑎𝑖 are the mass displacement, velocity,and acceleration at time equal to 𝑖Δ𝑡, respectively, Δ𝑡 isthe integration time step, 𝑟𝑖 is the restoring force, and 𝑓𝑖
is the external force excitation (i.e., −𝑚�̈�𝑖). For a linearlyelastic structure, 𝑟𝑖 = 𝑘𝑦𝑖, in which 𝑘 is the elastic stiffnessof the structure. 𝛼, 𝛽, and 𝛾 are parameters that governthe numerical properties of the algorithm. The algorithm isunconditionally stable when −0.5 ≤ 𝛼 ≤ 0, 𝛽 = (1 − 𝛼)
2/4,
and 𝛾 = 1/2 − 𝛼.Response displacement of the next time step was cal-
culated using (3)–(5), based on the stiffness (𝑘), mass (𝑚),and the stiffness proportional damping coefficient (𝑐 =
2𝜉√𝑘 ⋅ 𝑚), in which the damping ratio 𝜉 was assumedto be 0.03 (i.e., 3% of the critical damping value). Here,the initial stiffness (elastic stiffness) for the input data
of the Pseudodynamic Testing Program was derived fromthe result of the cyclic loading test, as described later. A2,000 kN hydraulic actuator was used to apply the lateralload. The horizontal displacement for calculating responsewas measured with a 300mm LVDT (Linear Variable Dif-ferential Transformer). Two columns were subjected to aconstant vertical load of 210 kN, which is 10% of the nominalcompressive strength of the concrete, using two 1,000 kNoil jacks. The ground motion acceleration for the pseu-dodynamic test was the north-south (NS) ground motionrecorded at El Centro during the 1940 Imperial Valley earth-quake. As stated previously, the magnitude of the groundmotion was normalized to acceleration values of 200 galand 300 gal, based on the seismic design code in Korea[9].
Before the pseudodynamic test, a cyclic loading testwas carried out to estimate the ultimate and yield shearload-carrying capacity and deformation, as well as hystere-sis in the lateral load-drift relationship of an RC framestrengthened with the KDEC system (CL-FK specimen),together with nonstrengthened frame (CL-F specimen). Acyclic loading scheme with predetermined displacementwas used. The load cycles were designed to have anti-symmetric moments in the lateral direction. The loadingcycles were repeated three times at lateral drift angles(𝑅, %) of 0.1% (1.25mm), 0.2% (2.5mm), 0.4% (5mm),0.5% (6.25mm), 0.67% (8.33mm), 1% (12.5mm), 1.33%(16.67mm), 2% (25mm), 2.67% (33.33mm), 4% (50mm),and 5.68% (71.02mm). Figure 8 shows the experimentalconfiguration for the pseudodynamic and cyclic loadingtests.

10 Shock and Vibration
Figure 8: Test configuration.
5. Crack and Failure Patterns
The crack and failure patterns that appeared in the non-strengthened control specimen (PD-F) and specimen rein-forced with the KDEC system (PD-FK) during the pseu-dodynamic testing were investigated, as well as the CL-Fand CL-FK specimens during the cyclic loading test. Bothspecimens following the pseudodynamic and cyclic loadingtests failed in response to flexural strain. However, the failurepattern at the final stage of the control (PD-F and CL-F) and reinforced specimen (PD-FK and CL-FK) differedsignificantly. In the following discussion, we focus on thecrack and failure patterns in terms of the lateral displacement.
5.1. Nonstrengthened Control Specimen (CL-F) for CyclicLoading Test. The control specimen was designed based onthe seismic design code in Korea so that it would exhibitflexural failure, as stated earlier. Figure 9 shows the crackpatterns that were observed on the CL-F specimen followingthe final stages of the cyclic loading test. The first observedcrack occurred at a positive load of 156 kN; a slight flexuralcrack appeared in both the bottom and the upper columnfaces after the fourth cycles at the second loading step (𝑅 =
0.2%, 2.5mm). Cracking, however, was not observed in thecenter of either column. Flexural cracks extended into themiddle of the column after step two. Following the ninth cycleat the third loading step (𝑅 = 0.4%, 5mm), with a load of bothpositive 303 kN and negative 293 kN, diagonal shear crackswere observed at the top and bottom faces of the columns,including the middle faces.
When the applied load reached 399 kN, at the fifthpositive loading step (𝑅 = 0.67%, 8.33mm), larger shearcracks appeared at the middle of the columns, with increasedwidths. After step five, many diagonal shear and flexuralcracks withmore increased widths, some of which weremorethan 5mm, were observed in all column faces. Following the24th positive loading cycle (the eighth loading step, 𝑅 = 2%,25mm), we observed peeling failure due to shear forces fromthe concrete cover at the top faces of the columns. Flexuralcollapse occurred at the top of both columns following theapplication of a negative load of 318 kN, with a lateral driftof 50mm (𝑅 = 4%). The maximum load capacity of thenonstrengthened control CL-K specimen was a positive loadof 530 kN, with a lateral drift of 25mm (𝑅 = 2%).
Figure 9: Cracks that appeared in the CL-F specimen during cyclicloading.
Figure 10: Cracks that appeared in the CL-FK specimen duringcyclic loading.
5.2. Specimen Strengthened with KDEC System (CL-FK) forCyclic Loading Test. Figure 10 shows a photograph of the CL-FK specimen following the cyclic loading test. The CL-FKspecimen featured the original RC frame strengthened bythe external connection methodology using the wire-wovenbulk Kagome truss, as shown in Figure 5. The first crack wasobserved with a positive load of 133 kN and with a lateral driftof 1.25mm. This was a slight flexural crack, which appearedon the top of the column faces after three cycles of thefirst loading step (𝑅 = 0.1%). Flexural cracks also appearedfollowing the second and third loading steps, and diagonalshear cracks appeared following the third loading step (𝑅 =
0.4%, 5mm) with a positive load of 320 kN. The shear cracksincreased in number and extended into the middle of bothcolumns at the 15th cycle of the fourth loading step (𝑅 =
0.5%, 6.25mm). Compared with the control CL-F specimen,however, therewere a small number of cracks, whichwere lesswide.
Following the 22nd positive loading cycle (8th loadingstep, 𝑅 = 2%, 25mm), the strength capacity did not increase,and a maximum load was reached. The maximum loadcapacity of the CL-FK specimenwas a positive load of 575 kN.When the applied displacement reached the 25th cycle (𝑅 =
2.67%, 33.33mm), the lateral load was gradually reduced,and flexural failure occurred at the top and bottom of bothcolumns under a negative load of 477 kN, with a lateral driftof 50mm (𝑅 = 4%, 50mm).

Shock and Vibration 11
(a) (b)
(c) (d)
Figure 11: Cracks that appeared in the PD-F specimen during pseudodynamic testing: (a) 2.7 s with lateral displacement of 12mm in 200 gal,(b) the final stage (4 s) in 200 gal, (c) 2.12 s with lateral displacement of −28.7mm in 300 gal, and (d) the final stage (4 s) in 300 gal.
5.3. Nonstrengthened Control Specimen (PD-F) for Pseudo-dynamic Test. Figure 11 shows the crack pattern that wasobserved in the PD-F specimen during the pseudodynamictesting, performed by applying moderate and severe earth-quake groundmotions of 200 gal and 300 gal (El Centro, NS),as well as in the final stages. The first crack was observedwith a positive load of 159 kN and with a lateral drift of2.6mm in ∼1.5 s in the case of an earthquake ground motionof 200 gal. This was a slight flexural crack, which appearedin both the bottom and the upper column faces. Flexuralcracks extended into the middle of the column after 1.8 s,and, following 2.17 s, with a negative load of 397 kN havinglateral displacement of 9.5mm, diagonal shear cracks wereobserved at the top and bottom faces of the columns. Theshear cracks increased in number and extended into themiddle of both columns after 2.3 s.Themaximum earthquakeresponse of the PD-F control specimen tested using anearthquake ground motion of 200 gal was observed at 2.7 swith a positive load of 447 kN, with lateral displacement of12mm.
In the case of severe earthquake ground motion of300 gal, after ∼1.53 s with a negative load of 414 kN havinglateral displacement of 11.5mm, large visible shear crackswere observed on all faces of the columns. The shear cracksincreased in number and extended in width after 1.83 s withlateral displacement of 19.3mm. Following 2.12 s with lateraldisplacement of 28.7mm, we observed peeling failure due toearthquake shear forces from the concrete cover at the topfaces of the columns. Flexural collapse occurred at the top of
both columns in 2.2 s, following the application of a negativeload of 506 kN, with lateral displacement of 40.3mm.
5.4. Specimen Strengthened with KDEC System (PD-FK) forPseudodynamic Test. The PD-FK specimen featured the RCframe strengthened by the external connection methodologyusing the wire-woven bulk Kagome truss (Figure 5). Figure 12shows the crack sequence that was observed in the PD-FKspecimen during the pseudodynamic testing, using normal-ized acceleration values of 200 gal and 300 gal, based on thenorth-south (NS) ground motion recorded at El Centro. Inthe case of an earthquake ground motion of 200 gal, a slightflexural crackwas first observed in the upper faces of columnswith a negative load of 105 kN and with lateral displacementof 1.7mm in ∼1.5 s. Flexural cracks extended into the middleof the column after 2.2 s with lateral negative displacementof 5.6mm. However, the flexural crack was still slight andno shear crack was observed; only a slight flexural crackwasmaintained at themaximum earthquake response, whichoccurred at 2.65 s with a positive load of 406 kN and lateraldisplacement of 7.5mm.The PD-FK specimen sustained lightdamage with a slight flexural crack, whereas the PD-F controlspecimen showed moderate damage with larger flexural andshear cracks. Thus, the external connection methodologyusing the wire-woven bulk Kagome truss proposed in thisstudy showed a good reinforcement effect in terms of degreeof damage.
When an earthquake ground motion of 300 gal was used,after 1.8 s, with a positive load of 536 kN, having lateral

12 Shock and Vibration
Table 5: Results of mechanical characterizations of test specimens following the cyclic loading test.
Specimen Load directionYield shearstrength𝑉𝑦(kN)
Maximum shearstrength𝑉max (kN)
Displacement atthe yield point
Δ𝑦(mm)
Displacement atthe maximum
pointΔmax (mm)
Failure mode
CL-F Positive 468 530 12.5 25 Flexural failureNegative −462 −531 −12.3 −24.5
CL-FK Positive 486 575 12.5 25.2 FlexureNegative −485 −570 12.1 24.3
(a) (b)
(c) (d)
Figure 12: Cracks that appeared in the PD-FK specimen during pseudodynamic testing: (a) 2.7 s with lateral displacement of 7.5mm in200 gal, (b) the final stage (4 s) in 200 gal, (c) 2.7 s with lateral displacement of −25mm in 300 gal, and (d) the final stage (4 s) in 300 gal.
displacement of 16mm, diagonal shear cracks were observedat the top and bottom faces of the columns. The shearcracks increased in number and extended into the middleof both columns after 2.1 s. Compared with the control PD-F specimen, however, there were a smaller number of cracksthat were not as wide. The maximum earthquake response ofthe PD-FK specimen occurred at 2.17 s, but no peeling failureof the concrete cover was observed. As a result, the reinforcedPD-FK specimen showed moderate damage with flexuraland shear cracks at a severe earthquake level of 300 gal;the strengthening effects were verified in a comparison witha nonstrengthened control PD-F specimen in which heavyearthquake damage with flexural failure at the upper columnswas observed.
6. Load-Displacement Relationships andEarthquake Damage Degree Estimates
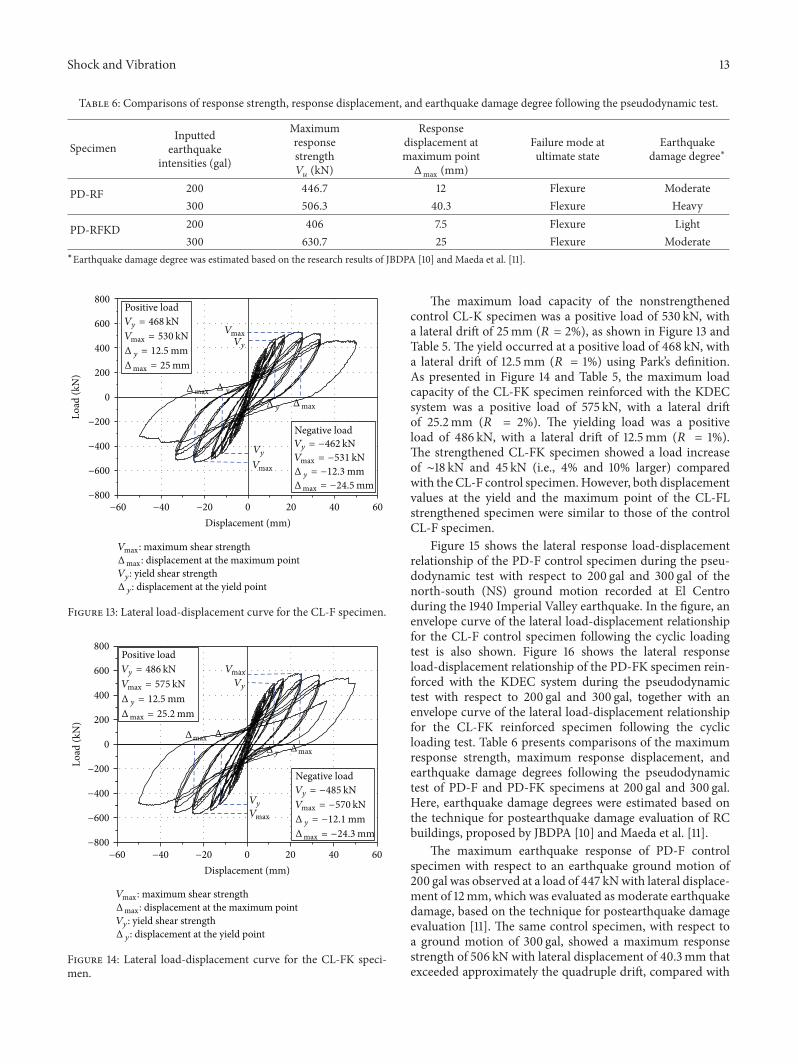
Figures 13 and 14 represent the load-displacement curves thatwere measured on the CL-F control and the strengthenedCL-FK specimens during the cyclic loading test, respectively.Table 5 lists the results of mechanical characteristics interms of shear strengths and displacement with positive andnegative loads for both specimens. The yield strengths anddisplacement of the specimens were described using Park’sdefinition, which is the most realistic definition availablefor the yield displacement for RC structures [21]. The yielddisplacement of the equivalent elastoplastic system withreduced stiffness is given by the secant stiffness at 75% of theultimate lateral load of the system.
Shock and Vibration 13
Table 6: Comparisons of response strength, response displacement, and earthquake damage degree following the pseudodynamic test.
SpecimenInputted
earthquakeintensities (gal)
Maximumresponsestrength𝑉𝑢(kN)
Responsedisplacement atmaximum point
Δmax (mm)
Failure mode atultimate state
Earthquakedamage degree∗
PD-RF 200 446.7 12 Flexure Moderate300 506.3 40.3 Flexure Heavy
PD-RFKD 200 406 7.5 Flexure Light300 630.7 25 Flexure Moderate
∗Earthquake damage degree was estimated based on the research results of JBDPA [10] and Maeda et al. [11].
−60 −40 −20 0 20 40 60−800
−600
−400
−200
0
200
400
600
800
Load
(kN
)
Displacement (mm)
Positive loadVy = 468 kNVmax = 530 kNΔy = 12.5 mmΔmax = 25 mm
Negative loadVy = −462 kNVmax = −531 kNΔy = −12.3 mmΔmax = −24.5 mm
Vy
Vy
Vmax
Vmax
Δy
Δy
Δmax
Δmax
Vmax : maximum shear strengthΔmax : displacement at the maximum pointVy : yield shear strengthΔy : displacement at the yield point
Figure 13: Lateral load-displacement curve for the CL-F specimen.
−60 −40 −20 0 20 40 60−800
−600
−400
−200
0
200
400
600
800
Load
(kN
)
Displacement (mm)
Positive loadVy = 486 kNVmax = 575 kNΔy = 12.5 mmΔmax = 25.2 mm
Negative loadVy = −485 kNVmax = −570 kNΔy = −12.1 mmΔmax = −24.3 mm
Vy
Vy
Vmax
Vmax
Δy
Δy
Δmax
Δmax
Vmax : maximum shear strengthΔmax : displacement at the maximum pointVy : yield shear strengthΔy : displacement at the yield point
Figure 14: Lateral load-displacement curve for the CL-FK speci-men.
The maximum load capacity of the nonstrengthenedcontrol CL-K specimen was a positive load of 530 kN, witha lateral drift of 25mm (𝑅 = 2%), as shown in Figure 13 andTable 5. The yield occurred at a positive load of 468 kN, witha lateral drift of 12.5mm (𝑅 = 1%) using Park’s definition.As presented in Figure 14 and Table 5, the maximum loadcapacity of the CL-FK specimen reinforced with the KDECsystem was a positive load of 575 kN, with a lateral driftof 25.2mm (𝑅 = 2%). The yielding load was a positiveload of 486 kN, with a lateral drift of 12.5mm (𝑅 = 1%).The strengthened CL-FK specimen showed a load increaseof ∼18 kN and 45 kN (i.e., 4% and 10% larger) comparedwith theCL-F control specimen.However, both displacementvalues at the yield and the maximum point of the CL-FLstrengthened specimen were similar to those of the controlCL-F specimen.
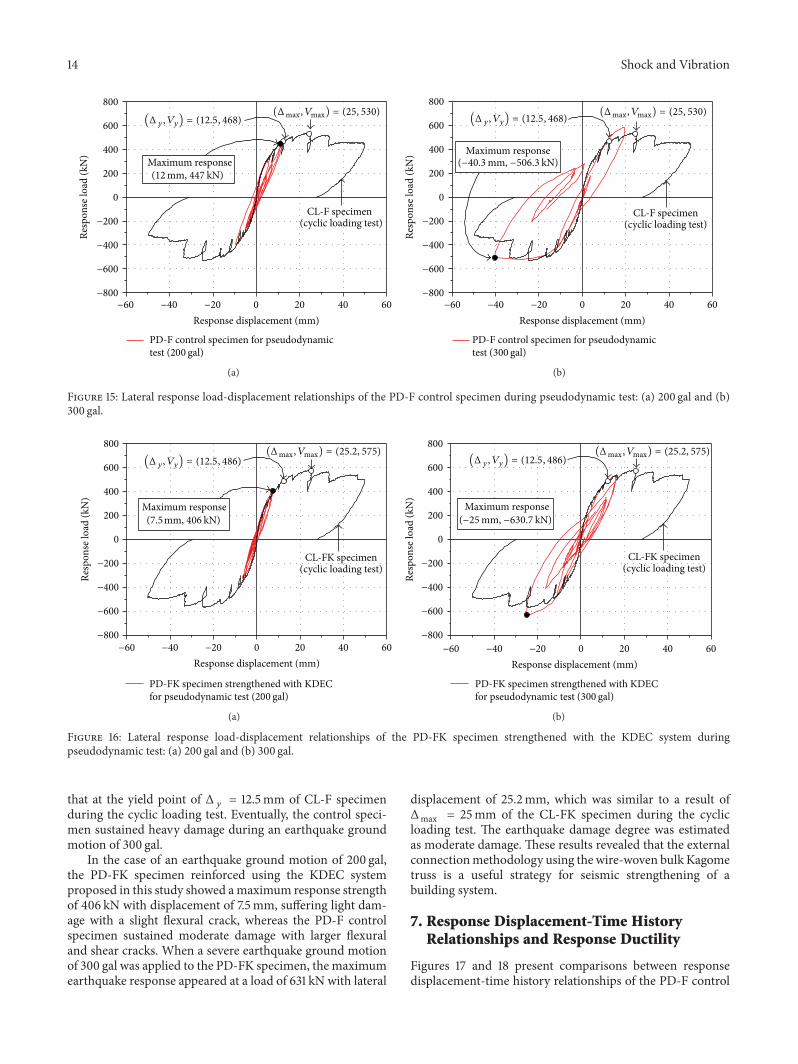
Figure 15 shows the lateral response load-displacementrelationship of the PD-F control specimen during the pseu-dodynamic test with respect to 200 gal and 300 gal of thenorth-south (NS) ground motion recorded at El Centroduring the 1940 Imperial Valley earthquake. In the figure, anenvelope curve of the lateral load-displacement relationshipfor the CL-F control specimen following the cyclic loadingtest is also shown. Figure 16 shows the lateral responseload-displacement relationship of the PD-FK specimen rein-forced with the KDEC system during the pseudodynamictest with respect to 200 gal and 300 gal, together with anenvelope curve of the lateral load-displacement relationshipfor the CL-FK reinforced specimen following the cyclicloading test. Table 6 presents comparisons of the maximumresponse strength, maximum response displacement, andearthquake damage degrees following the pseudodynamictest of PD-F and PD-FK specimens at 200 gal and 300 gal.Here, earthquake damage degrees were estimated based onthe technique for postearthquake damage evaluation of RCbuildings, proposed by JBDPA [10] and Maeda et al. [11].
The maximum earthquake response of PD-F controlspecimen with respect to an earthquake ground motion of200 gal was observed at a load of 447 kNwith lateral displace-ment of 12mm, which was evaluated as moderate earthquakedamage, based on the technique for postearthquake damageevaluation [11]. The same control specimen, with respect toa ground motion of 300 gal, showed a maximum responsestrength of 506 kN with lateral displacement of 40.3mm thatexceeded approximately the quadruple drift, compared with
14 Shock and Vibration
−60 −40 −20 0 20 40 60−800
−600
−400
−200
0
200
400
600
800
CL-F specimen(cyclic loading test)
Resp
onse
load
(kN
)
Response displacement (mm)
Maximum response
(Δy, Vy) = (12.5, 468)(Δmax, Vmax) = (25, 530)
(12 mm, 447 kN)
PD-F control specimen for pseudodynamictest (200 gal)
(a)
Resp
onse
load
(kN
)
−60 −40 −20 0 20 40 60−800
−600
−400
−200
0
200
400
600
800
Response displacement (mm)
CL-F specimen(cyclic loading test)
Maximum response
(Δy, Vy) = (12.5, 468)(Δmax, Vmax) = (25, 530)
(−40.3 mm, −506.3 kN)
PD-F control specimen for pseudodynamictest (300 gal)
(b)
Figure 15: Lateral response load-displacement relationships of the PD-F control specimen during pseudodynamic test: (a) 200 gal and (b)300 gal.
Resp
onse
load
(kN
)
−60 −40 −20 0 20 40 60−800
−600
−400
−200
0
200
400
600
800
CL-FK specimen(cyclic loading test)
Response displacement (mm)
(Δy, Vy) = (12.5, 486)(Δmax, Vmax) = (25.2, 575)
Maximum response(7.5mm, 406 kN)
PD-FK specimen strengthened with KDEC for pseudodynamic test (200 gal)
(a)
Resp
onse
load
(kN
)
−60 −40 −20 0 20 40 60−800
−600
−400
−200
0
200
400
600
800
Response displacement (mm)
CL-FK specimen(cyclic loading test)
(Δy, Vy) = (12.5, 486)(Δmax, Vmax) = (25.2, 575)
Maximum response(−25 mm, −630.7 kN)
PD-FK specimen strengthened with KDEC for pseudodynamic test (300 gal)
(b)
Figure 16: Lateral response load-displacement relationships of the PD-FK specimen strengthened with the KDEC system duringpseudodynamic test: (a) 200 gal and (b) 300 gal.
that at the yield point of Δ 𝑦 = 12.5mm of CL-F specimenduring the cyclic loading test. Eventually, the control speci-men sustained heavy damage during an earthquake groundmotion of 300 gal.
In the case of an earthquake ground motion of 200 gal,the PD-FK specimen reinforced using the KDEC systemproposed in this study showed amaximum response strengthof 406 kN with displacement of 7.5mm, suffering light dam-age with a slight flexural crack, whereas the PD-F controlspecimen sustained moderate damage with larger flexuraland shear cracks. When a severe earthquake ground motionof 300 gal was applied to the PD-FK specimen, the maximumearthquake response appeared at a load of 631 kN with lateral
displacement of 25.2mm, which was similar to a result ofΔmax = 25mm of the CL-FK specimen during the cyclicloading test. The earthquake damage degree was estimatedas moderate damage. These results revealed that the externalconnectionmethodology using the wire-woven bulk Kagometruss is a useful strategy for seismic strengthening of abuilding system.
7. Response Displacement-Time HistoryRelationships and Response Ductility
Figures 17 and 18 present comparisons between responsedisplacement-time history relationships of the PD-F control

Shock and Vibration 15
0.0 0.5 1.0 1.5 2.0 2.5 3.0 3.5 4.0−15
−10
−5
0
5
10
15 Maximum responseMaximum response
Resp
onse
disp
lace
men
t (m
m)
Time (sec)
PD-F (200 gal)PD-FK (200 gal)
(2.65 sec, 7.46mm)(2.7 sec, 12 mm)
Figure 17: Comparisons between response displacement-time his-tory relationships of the PDF and PD-FK specimens during pseudo-dynamic tests for 200 gal.
Resp
onse
disp
lace
men
t (m
m)
0.0 0.5 1.0 1.5 2.0 2.5 3.0 3.5 4.0−50−40−30−20−10
0102030
Maximum response
Maximum response
Time (sec)
PD-F (300 gal)PD-FK (300 gal)
(2.2 sec, −40.3 mm)
(2.17 sec, −25 mm)
Figure 18: Comparisons between response displacement-time his-tory relationships of the PDF and PD-FK specimens during pseudo-dynamic tests for 300 gal.
and the PD-FK reinforcement specimens during the pseu-dodynamic test with respect to earthquake ground motionsof 200 gal and 300 gal, respectively. When an earthquakeground motion of 200 gal was used, the maximum responsedisplacement of the PD-F specimen was observed at 2.7 s,with a lateral drift of 12mm, whereas that of the PD-FKreinforcement specimen occurred at 2.65 s with a drift of7.5mm. In the case of the severe earthquake level, 300 gal, forthe PD-F control specimen, themaximum response occurredfollowing ∼2.2 s with lateral displacement of 40.3mm, whichresulted in the flexural collapse of both columns. Thestrengthened PD-FK specimen, however, suffered moderatedamage, showingmaximumresponse displacement of 25mmat 2.17 s.
The earthquake response quantity of primary interestis the ductility ratio, 𝜇, defined as the ratio of maximumresponse displacement (Δmax) to the yield displacement point(Δ 𝑦). The ductility ratio, 𝜇, can be expressed as
𝜇 =ΔmaxΔ 𝑦
. (6)
Table 7: Comparison of response ductility.
Earthquakeintensities (gal)
Ductility responses of pseudodynamictesting (𝜇)∗1
PD-F PD-FK200 gal 0.96 (12)∗2 0.6 (7.5)∗2
300 gal 3.3 (40.3)∗2 2 (25)∗2∗1Ductility is defined as the ratio of the maximum response displacement(Δmax) of the PD-F and PD-FK specimens shown in Figures 17 and 18 to theyield displacement (Δ𝑦) of CL-F and CL-FK specimens, following the cyclicloading test, presented in Figures 13 and 14: that is, 𝜇 = Δmax/Δ𝑦.∗2Values in parentheses indicate the maximum response displacement(mm).
Table 7 shows comparisons of response ductility (𝜇)between the PD-F control and the PDFK reinforced speci-mens with respect to ground acceleration values of 200 galand 300 gal. The ductility ratio, represented in the table, wascalculated based on (6) as follows: Δmax = the maximumresponse displacement of the PD-F and PD-FK specimensshown in Figures 17 and 18 and Δ 𝑦 = the yield displacementof CL-F and CL-FK specimens following the cyclic loadingtest, depicted in Figures 13 and 14, respectively.
As shown in Table 7, the PD-F control specimen had aductility ratio of𝜇 = 0.96 in the case of the 200 gal earthquake.When the earthquake ground motion of 300 gal was usedfor the PD-F specimen, the ductility ratio was calculated as𝜇 = 3.3, which corresponds to heavy damage. The PD-FKstrengthened with the KDEC system showed a ductility ratioof 𝜇 = 0.6 with respect to 200 gal. In the case of 300 gal,the reinforced specimen showed 𝜇 = 2.0, which correspondsto moderate earthquake damage. When the same levelsof earthquake ground motions were used, the Kagome-reinforced specimen reduced the ductility response by 40%,compared with the nonstrengthened control specimen.
8. Concluding Remarks
We have described a new seismic retrofitting approach,which is an external connection methodology using a wire-woven bulk Kagome truss (KDEC system) that dissipatesearthquake energy by a dynamic interaction among anexisting building structure, a support structure, and a wire-woven bulk Kagome damper installed between them. Anexisting RC frame building was selected to assess the seismicstrengthening effect of the KDEC system proposed in thisstudy. First, a preliminary dynamic analysis was carried out todetermine the optimum structural properties of the supportand damper for the KDEC system, where the size of theKagome damper, the height of support, and the ratio of theelastic modulus between the existing building and supportwere set as analysis variables. Test specimens strengthenedwith the KDEC system were designed and fabricated basedon the results of the preliminary analysis.
Pseudodynamic and cyclic loading tests were carried outto verify the seismic strengthening effects of the proposedKDEC method compared to the original control frame interms of the lateral load-displacement capacities, maximum

16 Shock and Vibration
response strength, response ductility, and earthquake damagedegree under the levels of earthquake specified by the seismicdesign code in Korea. Test results revealed that the proposedKagome damper system externally installed in the RC frameeffectively dissipated the earthquake energy and was capableof marked resistance under a large-scale earthquake. Themajor results of this work can be summarized as follows.
(a) The preliminary dynamic analysis showed that thesupport scaled using a five-story structure with a ratioof elastic modulus of EM = 1 : 10 and a cross section ofthe damper of 400 × 400mm was the “best” result forstrengthening the existing RC frame using the KDEC systemproposed in this study.
(b) The lateral load-displacement relationships followingthe cyclic loading test revealed that the strengthened CL-FKspecimenhad amaximum load of 575 kNwith a lateral drift of25mm (𝑅 = 2%), representing a load increase of ∼10% largerthan the CL-F control specimen that showed 530 kN with alateral drift of 25mm (𝑅 = 2%); however, the displacementcapacities of both specimens were similar.
(c) The results of the pseudodynamic test with respectto an earthquake ground motion of 200 gal showed that themaximum earthquake response of the PD-F control speci-men was seen at a load of 447 kN with lateral displacementof 12mm, corresponding to moderate earthquake damage. Inthe case of a groundmotion of 300 gal, the same control spec-imen showed a maximum response strength of 506 kN withlateral displacement of 40.3mm that exceeded approximatelyquadruple drift, compared with the displacement at the yieldpoint of Δ 𝑦 = 12.5mm of CL-F specimen during the cyclicloading test. The control specimen sustained heavy damageduring the earthquake ground motion of 300 gal.
(d) In the case of an earthquake ground motion of200 gal, the PD-FK specimen reinforced using the KDECsystem showed amaximum response strength of 406 kNwithdisplacement of 7.5mm, suffering light damagewith the slightflexural cracks, whereas the PD-F control specimen sustainedmoderate damagewith larger flexural and shear cracks.Whena severe earthquake ground motion of 300 gal was used withthe PD-FK specimen, the maximum earthquake responseappeared at a load of 631 kN with lateral displacement of25.2mm, which was similar to the result of Δmax = 25mmof the CL-FK specimen during the cyclic loading test. Theearthquake damage degree was estimated as moderate.
(e) The ductility ratio (𝜇), defined as the ratio of maxi-mum response displacement during the pseudodynamic testto the yield displacement following the cyclic loading test,of the PD-F control specimen was calculated as 𝜇 = 0.96(moderate damage) and 𝜇 = 3.3 (heavy damage) with respectto the 200 gal and 300 gal earthquake levels, respectively. ThePD-FK strengthenedwith the KDEC system showed ductilityratios of 𝜇 = 0.6 (slight damage) and 𝜇 = 2.0 (mediumdamage)with respect to 200 gal and 300 gal earthquake levels,respectively. With the same earthquake ground motions, theKagome-reinforced specimen reduced the ductility responseby 40%, compared with the nonstrengthened control speci-men.
(f) These results showed that the external connectionmethodology using the wire-woven bulk Kagome truss
proposed in this study as a passive damper systemwas capableof effectively absorbing earthquake energy applied to thebuilding structures. This research, however, was focused onan experimental investigation to study the applicability ofa new type of external connection methodology using theKagome passive damper to strengthen an existing buildingsystem. As a recommendation for future work, additionaltheoretical studies, including a nonlinear dynamic analysismethodology for buildings being designed using the Kagomedamper external connection system, are needed to justify theseismic strengthening design of existing structural systems,as well as design new structures.
Competing Interests
The authors declare no competing interests.
Acknowledgments
This work was supported by a grant (15CTAP-C097490-01)from the Technology Advancement Research Program and agrant (14RERP-B082884-01) from the Housing EnvironmentResearch Project, funded by theMinistry of Land, Infrastruc-ture, and Transport Affairs of the Korean government.
References
[1] ASCE, “Minimum design loads for buildings and other struc-tures,” ASCE 7-10, American Society of Civil Engineers, 2010.
[2] AIJ, Standard for Structural Calculation of Reinforced ConcreteStructures, Architectural Institute of Japan, 2010.
[3] ACI 318-14 and ACI 318R-14, Building Code Requirements forStructural Concrete and Commentary on Building Code Require-ments for Structural Concrete, American Concrete Institute,2014.
[4] J. Marko, D. Thambiratnam, and N. Perera, “Influence ofdamping systems on building structures subject to seismiceffects,” Engineering Structures, vol. 26, no. 13, pp. 1939–1956,2004.
[5] J. S. Hwang, S. C. Park, and K. J. Kang, “A study on the hysteresisproperties and mathematical model of Kagome truss damper,”Journal of Architectural Institute of Korea, vol. 29, no. 9, pp. 21–29, 2013.
[6] H. N. G. Wadley, N. A. Fleck, and A. G. Evans, “Fabricationand structural performance of periodic cellular metal sandwichstructures,” Composites Science and Technology, vol. 63, no. 16,pp. 2331–2343, 2003.
[7] Y.-H. Lee, B.-K. Lee, I. S. Jeon, and K.-J. Kang, “Wire-wovenbulk Kagome truss cores,” Acta Materialia, vol. 55, no. 18, pp.6084–6094, 2007.
[8] Korea Land &Housing Corporation, Jinju, South Korea, http://www.lh.or.kr/.
[9] KBC-2009, Korea Building Code, Ministry of Land, Infrastruc-ture and Transport, 2009.
[10] JBDPA, Standard for Damage Level Classification, Japan Build-ing Disaster Prevention Association, Tokyo, Japan, 2001.
[11] M. Maeda, Y. Nakano, and K. S. Lee, “Post-earthquake damageevaluation for R/Cbuildings based on residual seismic capacity,”in Proceedings of the 13th World Conference on EarthquakeEngineering, vol. 1179, Vancouver, Canada, 2004.

Shock and Vibration 17
[12] J. W. Park, J. Y. Park, D. J. Kim, Y. H. Lee, and H. C. Kim,“Boundary nonlinear time history analysis of low-rise RC struc-ture using the rubber 9 laminated lead damper,” in Proceedingsof the Computational Structural Engineering Institute of Korea,vol. 27, no. 1, pp. 193–195, Seoul, South Korea, 2014.
[13] Y. K.Wen, “Method for random vibration of hysteretic systems,”Journal of the EngineeringMechanics Division, vol. 102, no. 2, pp.249–263, 1976.
[14] JBDPA, Standard for Evaluation of Seismic Capacity of ExistingReinforced Concrete Buildings, Japan Building Disaster Preven-tion Association, Tokyo, Japan, 2003.
[15] Uniform Building Code (UBC), “Structural engineering designprovision,” in Proceedings of the International Conference ofBuilding Officials, Whittier, Calif, USA, 1997.
[16] K. Takanashi, K. Udagawa, and H. Tanaka, “Pseudo-dynamictests on a 2-storey steel frame by a computer-load test apparatushybrid system,” in Proceedings of the 7th World Conference onEarthquake Engineering, vol. 7, pp. 225–232, Istanbul, Turkey,1980.
[17] Tokyo Soki Kenkyujo Company, Tokyo, Japan, http://www.tml.jp/e/.
[18] MTS, Pseudodynamic Testing For 793 Controllers, MTS SystemsCorporation, Eden Prairie, Minn, USA, 1999.
[19] P. S. B. Shing, M. Nakashima, and O. S. Bursi, “Application ofpseudodynamic testmethod to structural research,” EarthquakeSpectra, vol. 12, no. 1, pp. 29–56, 1996.
[20] H. M. Hilber, T. J. Hughes, and R. L. Taylor, “Improved numer-ical dissipation for time integration algorithms in structuraldynamics,” Earthquake Engineering & Structural Dynamics, vol.5, no. 3, pp. 283–292, 1977.
[21] R. Park, “Ductility evaluation from laboratory and analyticaltesting,” in Proceedings of the Proceedings of 9th World Con-ference on Earthquake Engineering, vol. 8, pp. 605–616, Tokyo,Japan, 1988.

International Journal of
AerospaceEngineeringHindawi Publishing Corporationhttp://www.hindawi.com Volume 2014
RoboticsJournal of
Hindawi Publishing Corporationhttp://www.hindawi.com Volume 2014
Hindawi Publishing Corporationhttp://www.hindawi.com Volume 2014
Active and Passive Electronic Components
Control Scienceand Engineering
Journal of
Hindawi Publishing Corporationhttp://www.hindawi.com Volume 2014
International Journal of
RotatingMachinery
Hindawi Publishing Corporationhttp://www.hindawi.com Volume 2014
Hindawi Publishing Corporation http://www.hindawi.com
Journal ofEngineeringVolume 2014
Submit your manuscripts athttp://www.hindawi.com
VLSI Design
Hindawi Publishing Corporationhttp://www.hindawi.com Volume 2014
Hindawi Publishing Corporationhttp://www.hindawi.com Volume 2014
Shock and Vibration
Hindawi Publishing Corporationhttp://www.hindawi.com Volume 2014
Civil EngineeringAdvances in
Acoustics and VibrationAdvances in
Hindawi Publishing Corporationhttp://www.hindawi.com Volume 2014
Hindawi Publishing Corporationhttp://www.hindawi.com Volume 2014
Electrical and Computer Engineering
Journal of
Advances inOptoElectronics
Hindawi Publishing Corporation http://www.hindawi.com
Volume 2014
The Scientific World JournalHindawi Publishing Corporation http://www.hindawi.com Volume 2014
SensorsJournal of
Hindawi Publishing Corporationhttp://www.hindawi.com Volume 2014
Modelling & Simulation in EngineeringHindawi Publishing Corporation http://www.hindawi.com Volume 2014
Hindawi Publishing Corporationhttp://www.hindawi.com Volume 2014
Chemical EngineeringInternational Journal of Antennas and
Propagation
International Journal of
Hindawi Publishing Corporationhttp://www.hindawi.com Volume 2014
Hindawi Publishing Corporationhttp://www.hindawi.com Volume 2014
Navigation and Observation
International Journal of
Hindawi Publishing Corporationhttp://www.hindawi.com Volume 2014
DistributedSensor Networks
International Journal of