Embed Size (px)
Citation preview

Eyankware et al.Hydrogeochemical Evaluation and Suitability study of Groundwater for Domestic and Irrigation Purpose. A Case Study of Eruemukohwarien Community, Niger Delta Region, Nigeria,Science & Technology, 2017, 3(10), 91-108,www.discoveryjournals.com © 2017 Discovery Publication. All Rights Reserved
Page91
RESEARCH ARTICLE
Eyankware MO1☼, Selemo AOI2, Omo-Irabor OO3
1. Department of Geology, Faculty of Sciences, Ebonyi State University, Abakaliki, Ebonyi State, Nigeria.2. Department of Geosciences, Federal University of Technology Owerri, Nigeria3. Department of Earth Science, Federal University of Petroleum Resources, Effurn Delta State. Nigeria; Email:
Publication HistoryReceived: 10 January 2017Accepted: 15 February 2017Published: April - June 2017
CitationEyankware MO, Selemo AOI, Omo-Irabor OO. Hydrogeochemical Evaluation and Suitability study of Groundwater for Domestic andIrrigation Purpose. A Case Study of Eruemukohwarien Community, Niger Delta Region, Nigeria. Science & Technology, 2017, 3(10),91-108
Publication License
This work is licensed under a Creative Commons Attribution 4.0 International License.
General Note
Article is recommended to print in recycled paper.
ABSTRACTThis study examined the quality of groundwater in Eruemukohwarien community for domestic and irrigation purpose. The followingparameters were tested: PH, Turbidity, Electrical Conductivity, Total Dissolved Solid (TDS), magnesium, potassium, sodium,bicarbonate, calcium, nitrate, sulphate and chloride using American Public Health Association (APHA, 1992). The concentrations ofthe parameters analyzed were below (WHO, 2011) maximum permissible limit except magnesium and nitrate that were slightly
Science & Technology, Vol. 3, No. 10, April-June, 2017 RESEARCH
Science & Technology
Hydrogeochemical Evaluation and Suitability study of Groundwater forDomestic and Irrigation Purpose. A Case Study of EruemukohwarienCommunity, Niger Delta Region, Nigeria
ISSN2394–3750
EISSN2394–3769
An International Journal

Eyankware et al.Hydrogeochemical Evaluation and Suitability study of Groundwater for Domestic and Irrigation Purpose. A Case Study of Eruemukohwarien Community, Niger Delta Region, Nigeria,Science & Technology, 2017, 3(10), 91-108,www.discoveryjournals.com © 2017 Discovery Publication. All Rights Reserved
Page92
RESEARCH ARTICLE
above WHO maximum permissible limit. The dominance of alkali bicarbonate water type could be attributed to the infiltration ofcarbon dioxide rich rainwater derived from the atmosphere and input of alkali salts from anthropogenic sources. The dominat ionicspecies in the study area are Ca-Mg- Cl from the Piper Trilinear plot. As for irrigation parameters analyzed SAR, KR, MAR, PI, NA%,TDS, EC and SSP their value were below the set standard for irrigation.
Key Words: Domestic, Irrigation, Niger Delta, Groundwater and Niger Delta.
1. INTRODUCTION
In recent times, Eruemukohwarien community has experienced intense expansion due to increased in cost of living and renting of
apartment in Ughelli urban most civil servant and other artisan worker has decided to relocate to this neighboring community toreduce the cost of living. This increase in migration has necessitated increase in demand for potable water for both domesticpurposes (Eyankware, 2014a; Eyankware, et al., 2014b). Despite the fact that the study area is naturally endowed with naturalresources, especially fresh water and oil, the activities of oil bunkers has greatly affected the quality of water resources and survivalof aquatic organism in the region (Niger Delta). This environmental problem in the region poses more threats to human thanpoverty. Currently, records has shown that water available for inhabitant of the area has declined from 18.9l in 1986 to less than 10per day among 50% of the urban population (Ekong, et al., 2012). The chemical composition of groundwater is controlled by manyfactors, including the geological structure, mineralogy, composition of the precipitation, aquifers, and external pollution agencieslike effluents from agricultural return flow, industrial and domestic activities (Boobalan, et al., 2015; Eyankware, et al., 2016a).Although various research has been carried out within Niger Delta Formation on assessment of water quality. Akpoborie, et al.,(2000) stated that the quality of groundwater from dug wells in Ughelli, Warri, and Okurekpo all in Delta State has pH value and highamount of coliform bacterial in groundwater. Okereke, (2001) found groundwater with total dissolved solids (TDS) concentrations upto 1250mg L-1 in the coastal part of the Niger Delta. Efe, (2000) did an appraisal of rain and groundwater resources in Warri andfound that groundwater has higher values of EC, pH, TDS, Ca2+, Mg2+, HCO3
- and Cl- while rain water is higher in Pb2+, SO42- and
NO3-. Ogunkoya and Efi, (2003) examined rainfall quality and sources of rainwater acidity in Warri area of the Niger Delta and
reported that the enormous gas flared into the atmosphere by the oil industries precipitate acid rain in the area. Omo-Irabor, et al.,(2008) have also stressed the influence of human activities in the determination of water chemistry in the Niger Delta region.Eyankware, et al., (2015) stated that physical parameters like PH, electrical conductivity and chemical parameters such magnesium,chloride, nitrate, sodium, calcium, phosphate and sulphate were below WHO, (2011) permissible limit while microbial assessmentreveals the presence of coliform and E.coli in two hand-dug well and attributed it to human activities (septic tanks, latrines,dumpsites) in Ughelli. Although research has been carried out on regional scale within the Niger Delta but detailed research onwater analysis has not been carried on water for domestic and irrigation purpose. This research work therefore aimed at assessingthe quality and hydrochemical characteristics of water for domestic and irrigation purposes.
1.1. Description of the study areaEruemukohwarien community is located in Ughelli north local government area of Delta State, Nigeria. It is close to Ughelli maintown. Geographically, the area is located between latitude 5° 27'N - 5° 34'N and longitude 5°52'E - 5°59' E. It is within the oil richprovince of Nigeria, some 50km away from the shores of the Atlantic Ocean.
1.2. Geology of the study areaThe study area is underlain by Niger Delta Formations. The formations from the top to the base are Somebreiro-Warri Deltaic Plainsands (Fig.1). The Benin Formation, Agbada Formation and the Akata Formation have been described in details by (Allen, 1965;Reyment, 1965; Short and Stauble, 1967; Weber and Daukuro, 1975) (Fig. 1). According to Wigwe (1975), the Somebreiro-WarriDeltaic Plain sand is about 120m thick and it is Quaternary to Recent. Texturally, the unconsolidated sediments range from fineplastic clay through medium to coarsed grained sands and rarely gravelly. The Benin Formation consists predominantly ofunconsolidated sand, gravel and occasionally intercalation of shales. It is of Oligocene to Pleistocene in age and it is about 2000mthick. The Agbada Formation is the oil bearing formation of the Niger Delta sedimentary basin. It is of Eocene to Oligocene in age. Itconsists of shale and alternate sand sequence and about 3000m thick. The Akata Formation is the basal units of the Niger Delta

Eyankware et al.Hydrogeochemical Evaluation and Suitability study of Groundwater for Domestic and Irrigation Purpose. A Case Study of Eruemukohwarien Community, Niger Delta Region, Nigeria,Science & Technology, 2017, 3(10), 91-108,www.discoveryjournals.com © 2017 Discovery Publication. All Rights Reserved
Page93
RESEARCH ARTICLE
sedimentary basin and overlies the basement complex, it is made up of open marine facies and highly pressure with 1000kmthickness and of the Ecocene to Oligocene in age.
Figure 1 Geological map of parts of the western Niger Delta (NGSA, 2006). Modified after Akpoborie, et al., (2015)
1.3. Hydrogeology of the study areaHydrogeology of the area is controlled by geology and climate. This is because geological formations underlying an area and thestructure contained in them determine the types of aquifer to be encountered and how the aquifers are recharged, while the climatedetermines the amount and the rate of recharge the aquifer receives (Ariyo and Adeyemi, 2005). Local hydrogeological settingindicates that the study area is underlain by the Somebreiro-Warri Plain Sands aquifer which consists of fine to medium and coarsegrained and unconsolidated sands. The aquifer in most cases unconfined, has thickness that ranges from 60 to 95m and hydraulicconductivity that varies from 8.82 x 10⁻³ to 9.0 x 10⁻²cm/s. Specific capacities recorded from different locations outside Warri citywhere the unit has been penetrated vary from 6700 lit/hr/m to 13500 lit/hr/m, (Ofodile, 2002).
2. METHODOLOGY2.1. Laboratory AnalysisTotal of fifteen (15) waters sample were collected within the study area (Table 1). Precautionary measure was taken by washing thebottles with clean water and cleaning reagents and thoroughly rinsed with distilled, deionised water prior to collection of watersample from site. After the Electrical Conductivity (EC), pH and Total Dissolved Solids (TDS) were measured at point of collection,samples were sealed and stored in ice chests and eventually transported to the laboratory within the hour of collection. ElectricalConductivity and Total Dissolved Solids were measured in situ using the HACH Conductivity/TDS meters respectively. The pH wasmeasured using pH meter and the HACH Spectrophotometer was employed in determining the NO3
- ion using the cadmiumreduction method. Potassium (K) and Sodium (Na) ion concentrations were obtained with a Jenway Clinical flame photometer.Bicarbonate (HCO3), Calcium (Ca), Magnesium (Mg), and Chloride (Cl) with appropriate titrimetric methods as described by APHA(1992), and sulphate content was determined by turbidimetry.

Eyankware et al.Hydrogeochemical Evaluation and Suitability study of Groundwater for Domestic and Irrigation Purpose. A Case Study of Eruemukohwarien Community, Niger Delta Region, Nigeria,Science & Technology, 2017, 3(10), 91-108,www.discoveryjournals.com © 2017 Discovery Publication. All Rights Reserved
Page94
RESEARCH ARTICLE
2.2. Statistical analysesThe results from laboratory were subjected to relevant descriptive statistical analyses to establish relationship (SPSS software).
Table 1 Water Sample Collection Site.
Sample Code Location Water Source
EK/01 Close Adagwe Grammar School Groundwater (PHDW)
EK/02 Close to Izomo Primary School Groundwater (PHDW)
EK/03 Uwhe Street Groundwater (PHDW)
EK/04 Egheruaye Street Groundwater (PHDW)
EK/ 05 Ukophre Street Groundwater (PBH)
EK/06 Aka Street Groundwater (PHDW)
EK/07 Ekrokro Street Groundwater (PBH)
EK/08 Ihwerhe Street Groundwater (PHDW)
EK/09 Ogbe Egu street Groundwater (PHDW)
EK/10 Close to Adagwe Secondary school Groundwater (PHDW)
EK/11 Close to Ubor Hotel Groundwater (PBH)
EK/12 Uloho Street Groundwater (PHDW)
EK/13 Igu Street Groundwater (PHDW)
EK/14 Close to Community Town Hall Groundwater (PBH)
EK/15 Close to the Community Junction Groundwater (PHDW)
(PHDW) – Private Hand-dug Well and (PBH) - Private Borehole.
3. RESULT AND DICUSSION3.1. Physical ParametersThe results of the physical parameters of the water quality are shown in Table 5.
3.2. PHIt is the measures the hydrogen-ion content in the water and also determine the acidity or alkalinity of the water. The value of PH ofthe study area ranges from 5.30 to 6.80 as shown in Fig 3 and Table 5. At location EK/01, EK/02, EK/06. EK/09 and EK/10 theconcentration of PH ranges from 5.24 to 5.80. It means that the water is acidic, and has the capability of rendering the water to be oflow quality (Efe and Mogborukor , 2012). Alakpodia (2000) and Efe (2006) attributed the major cause of acid rain in the region to gasflaring that precipitates acid rain. Eyankware, et al., (2015); Asadu, (2016); Ushurhe, et al., (2013) stated that the PH concentration ofwater within the Ughelli and Agbraho were below WHO permissible limit. The mean value of PH is 6.07 as shown in Table 6.

Eyankware et al.Hydrogeochemical Evaluation and Suitability study of Groundwater for Domestic and Irrigation Purpose. A Case Study of Eruemukohwarien Community, Niger Delta Region, Nigeria,Science & Technology, 2017, 3(10), 91-108,www.discoveryjournals.com © 2017 Discovery Publication. All Rights Reserved
Page95
RESEARCH ARTICLE
3.3. TurbidityTurbidity in some groundwater sources is a consequence of inert clay or chalk particles or the precipitation of non soluble reducediron and other oxides when water is pumped from anaerobic waters (WHO, 2011). The value of turbidity ranges from 0.40 to 2.58NTU as shown in Fig. 2 and Table 5 with mean value of turbidity is 1.42 NTU as shown in Table. 6.
Figure 2 Concentration of PH and Turbidity presented as a line plot against WHO, (2011).
3.4. Electrical Conductivity (EC)Electrical Conductivity (EC) in natural waters is the normalized measure of the water’s ability to conduct electric current. The primaryeffect of high EC water on crop productivity is the inability of the plant to compete with ions in the soil solution for water(physiological drought). The higher the EC, the less water is available to plants, even though the soil may appear wet. Because plantscan only transpire pure water, usable plant water in the soil solution decreases dramatically as EC increases (Dhirendra, et al., 2009).Water with EC less than 250µS/cm is considered well and EC more than 750 µS/cm is unsuitable for irrigation (Bhat, et al., 2016). Thevalue of EC ranges from 68 to 240 µS/cm (Table 5 and Fig.3) with mean value of 133.53 µS/cm (Table 6). Based on this the water isconsidered fit for irrigation.
3.5. Total Dissolved Solids (TDS)It is measure of the amount of dissolved material in the water sample. This parameter arises from the dissolved substances fromorganic compounds as well as decomposition of inorganic substances such as nitrate and carbonate. The mean value of TDS is 77.06(Table 6). While TDS value ranges from 13.58 to 314.53 mg/L (Fig. 3 and Table 5). The water is considered as fresh water based onCarol, (1962) water quality classification (Table 4). According to WHO, (1996) any TDS value less than 300 signify that the TDSconcentration is classified as excellent as shown in Table 2. Based on Davis and De Wiest (TDS) rating the value is fit for irrigationpurpose (Table 3).
Table 2 Showing Total Dissolved Solid (TDS) rating according to WHO, (1996) in mg/L
Level of TDS (mg/L) Rating Number of Sample Remarks
>300 Excellent 15 All samples >
>300
300 – 600 Good 15 NVR
600 – 900 Fair 15 NVR
05
101520253035
Eyankware et al.Hydrogeochemical Evaluation and Suitability study of Groundwater for Domestic and Irrigation Purpose. A Case Study of Eruemukohwarien Community, Niger Delta Region, Nigeria,Science & Technology, 2017, 3(10), 91-108,www.discoveryjournals.com © 2017 Discovery Publication. All Rights Reserved
Page95
RESEARCH ARTICLE
3.3. TurbidityTurbidity in some groundwater sources is a consequence of inert clay or chalk particles or the precipitation of non soluble reducediron and other oxides when water is pumped from anaerobic waters (WHO, 2011). The value of turbidity ranges from 0.40 to 2.58NTU as shown in Fig. 2 and Table 5 with mean value of turbidity is 1.42 NTU as shown in Table. 6.
Figure 2 Concentration of PH and Turbidity presented as a line plot against WHO, (2011).
3.4. Electrical Conductivity (EC)Electrical Conductivity (EC) in natural waters is the normalized measure of the water’s ability to conduct electric current. The primaryeffect of high EC water on crop productivity is the inability of the plant to compete with ions in the soil solution for water(physiological drought). The higher the EC, the less water is available to plants, even though the soil may appear wet. Because plantscan only transpire pure water, usable plant water in the soil solution decreases dramatically as EC increases (Dhirendra, et al., 2009).Water with EC less than 250µS/cm is considered well and EC more than 750 µS/cm is unsuitable for irrigation (Bhat, et al., 2016). Thevalue of EC ranges from 68 to 240 µS/cm (Table 5 and Fig.3) with mean value of 133.53 µS/cm (Table 6). Based on this the water isconsidered fit for irrigation.
3.5. Total Dissolved Solids (TDS)It is measure of the amount of dissolved material in the water sample. This parameter arises from the dissolved substances fromorganic compounds as well as decomposition of inorganic substances such as nitrate and carbonate. The mean value of TDS is 77.06(Table 6). While TDS value ranges from 13.58 to 314.53 mg/L (Fig. 3 and Table 5). The water is considered as fresh water based onCarol, (1962) water quality classification (Table 4). According to WHO, (1996) any TDS value less than 300 signify that the TDSconcentration is classified as excellent as shown in Table 2. Based on Davis and De Wiest (TDS) rating the value is fit for irrigationpurpose (Table 3).
Table 2 Showing Total Dissolved Solid (TDS) rating according to WHO, (1996) in mg/L
Level of TDS (mg/L) Rating Number of Sample Remarks
>300 Excellent 15 All samples >
>300
300 – 600 Good 15 NVR
600 – 900 Fair 15 NVR
Temp
Turbidity (NTU)

Eyankware et al.Hydrogeochemical Evaluation and Suitability study of Groundwater for Domestic and Irrigation Purpose. A Case Study of Eruemukohwarien Community, Niger Delta Region, Nigeria,Science & Technology, 2017, 3(10), 91-108,www.discoveryjournals.com © 2017 Discovery Publication. All Rights Reserved
Page96
RESEARCH ARTICLE
900 – 1000 Poor 15 NVR
Above 1000 Unacceptable 15 NVR
Source: Taste of Water with Different TDS Concentrations;www.who.int/water_sanitation_health/dwq/chemicals/tds.pdNVR: No Value Range.
Table 3 Water quality for drinking and agricultural purposes (after Davis and De Wiest in mg/L)
TDS (mg L-1) Remark and Quality No of Samples % of Sample
Up to 500 Desirable for Drinking 15 100
500 – 1000 Permissible for Drinking
Up to 3000 Useful for Agriculture
>3000 Unfit for Drinking and Irrigation
Figure 3 Concentration of total dissolved solid and electrical conductivity presented as a line plot against WHO, (2011).
3.6. Major CationsSodium (Na+)Sodium is generally highly soluble in water and is leached from the terrestrial environment to groundwater (WHO, 1996). The valueof sodium ranges from 1.05 to 7.36 mg/L with mean value of 7.36 mg/L (Fig. 4 and Table 5 and 6). The concentrations of sodiumwere below WHO, (2011) permissible limit.
Potassium (K+)Potassium is essential for both human and plants. WHO, (2011) stated that very high concentration of potassium can be dangerousto human to digestive and human nervous. The value of potassium ranges from 0.06 to 1.47 mg/L with mean value 0.73 mg/L (Fig. 4and Table 5 and 6). The concentrations of potassium were below WHO, (2011) maximum permissible limit.
0100200300400500600
Eyankware et al.Hydrogeochemical Evaluation and Suitability study of Groundwater for Domestic and Irrigation Purpose. A Case Study of Eruemukohwarien Community, Niger Delta Region, Nigeria,Science & Technology, 2017, 3(10), 91-108,www.discoveryjournals.com © 2017 Discovery Publication. All Rights Reserved
Page96
RESEARCH ARTICLE
900 – 1000 Poor 15 NVR
Above 1000 Unacceptable 15 NVR
Source: Taste of Water with Different TDS Concentrations;www.who.int/water_sanitation_health/dwq/chemicals/tds.pdNVR: No Value Range.
Table 3 Water quality for drinking and agricultural purposes (after Davis and De Wiest in mg/L)
TDS (mg L-1) Remark and Quality No of Samples % of Sample
Up to 500 Desirable for Drinking 15 100
500 – 1000 Permissible for Drinking
Up to 3000 Useful for Agriculture
>3000 Unfit for Drinking and Irrigation
Figure 3 Concentration of total dissolved solid and electrical conductivity presented as a line plot against WHO, (2011).
3.6. Major CationsSodium (Na+)Sodium is generally highly soluble in water and is leached from the terrestrial environment to groundwater (WHO, 1996). The valueof sodium ranges from 1.05 to 7.36 mg/L with mean value of 7.36 mg/L (Fig. 4 and Table 5 and 6). The concentrations of sodiumwere below WHO, (2011) permissible limit.
Potassium (K+)Potassium is essential for both human and plants. WHO, (2011) stated that very high concentration of potassium can be dangerousto human to digestive and human nervous. The value of potassium ranges from 0.06 to 1.47 mg/L with mean value 0.73 mg/L (Fig. 4and Table 5 and 6). The concentrations of potassium were below WHO, (2011) maximum permissible limit.
TDS(mg /L)
EC (µS/cm)

Eyankware et al.Hydrogeochemical Evaluation and Suitability study of Groundwater for Domestic and Irrigation Purpose. A Case Study of Eruemukohwarien Community, Niger Delta Region, Nigeria,Science & Technology, 2017, 3(10), 91-108,www.discoveryjournals.com © 2017 Discovery Publication. All Rights Reserved
Page97
RESEARCH ARTICLE
Magnesium (Mg2+)Ezeh, et al., (2016) stated that magnesium can penetrate into the environment from discharge and emissions from industries that useor manufacture magnesium. Rainwater falling on rocks can also increase the levels of magnesium in river and sea water. The value ofmagnesium ranges from 1.43 to 9.17 mg/L with mean value 5.62 mg/L (Fig. 4 and Table 5 and 6). The concentrations of magnesiumwere above WHO, (2011) maximum permissible limit.
Calcium (Ca2+)Calcium (Ca2+) is an element that is found naturally and in abundance in the earth crust, it is present in groundwater due to its easysolubility and abundance in most rock types (Ezeh, et al., 2016). The value for calcium ranges from 2.30 to 14.57 mg/L with meanvalue of 9.14 mg/L (Fig. 4 and Table 5 and 6). The concentrations of calcium were below WHO, (2011) maximum permissible limit.
Figure 4 Concentration of Sodium, Potassium, Magnesium and Calcium presented as a line plot against WHO, (2011) in mg/L.
3.7. Major AnionsChloride (Cl-)Chlorides in water are more of a taste than a health concern, although high concentrations may be harmful to people with heart orkidney problems (Weiner, 2000). The value for chloride ranges from 9.48 to 68.93 mg /L with mean value 19.86 mg L-1 (Fig.5 andTable 5 and 6). Chloride in drinking water originates from natural sources, sewage, industrial effluents, and urban runoff that containsaline intrusion by WHO, (2004).
Bicarbonate (HCO3-)
The value of bicarbonate ranges from 7.41 to 16.90 mg/L with mean value 11.08 (Fig.5 and Table 5 and 6).
Nitrate (NO3-)
The value of nitrate ranges from 2.24 to 8.32 mg/L with mean value 4.65 mg/L (Fig.5 and Table 5 and 6). The value of nitrate wereabove (WHO, 2011) permissible limit at EK/01 , 02, 04, 05, 06, 09, 10, 11, 13 and 14. One of the major source of nitrate ingroundwater as a result of agricultural activity (including excess application of inorganic nitrogenous fertilizers and manures), fromwastewater treatment and from oxidation of nitrogenous waste products in human and animal excreta, including septic tanks (WHO,1996).
Sulphate (SO42-)
Sulphate (SO42-) is widely distributed in nature, and the sulphate anion (SO4
2-) is a common constituent of unpolluted water.Sulphate may be leached from most sedimentary rocks, with appreciable contributions from such sulphate deposits as gypsum(Obasi, et al., 2015). Sulphate may also occur as leachates from their ores and other minerals. Sulphate is commonly less than300mg/l in natural waters except in well influenced by acid mines (Todd, 1980) The value for sulphate ranges from 1.14 to 4.53 mg L-
050
100150200250
Con
cent
rati
on (
mg/
L)
Eyankware et al.Hydrogeochemical Evaluation and Suitability study of Groundwater for Domestic and Irrigation Purpose. A Case Study of Eruemukohwarien Community, Niger Delta Region, Nigeria,Science & Technology, 2017, 3(10), 91-108,www.discoveryjournals.com © 2017 Discovery Publication. All Rights Reserved
Page97
RESEARCH ARTICLE
Magnesium (Mg2+)Ezeh, et al., (2016) stated that magnesium can penetrate into the environment from discharge and emissions from industries that useor manufacture magnesium. Rainwater falling on rocks can also increase the levels of magnesium in river and sea water. The value ofmagnesium ranges from 1.43 to 9.17 mg/L with mean value 5.62 mg/L (Fig. 4 and Table 5 and 6). The concentrations of magnesiumwere above WHO, (2011) maximum permissible limit.
Calcium (Ca2+)Calcium (Ca2+) is an element that is found naturally and in abundance in the earth crust, it is present in groundwater due to its easysolubility and abundance in most rock types (Ezeh, et al., 2016). The value for calcium ranges from 2.30 to 14.57 mg/L with meanvalue of 9.14 mg/L (Fig. 4 and Table 5 and 6). The concentrations of calcium were below WHO, (2011) maximum permissible limit.
Figure 4 Concentration of Sodium, Potassium, Magnesium and Calcium presented as a line plot against WHO, (2011) in mg/L.
3.7. Major AnionsChloride (Cl-)Chlorides in water are more of a taste than a health concern, although high concentrations may be harmful to people with heart orkidney problems (Weiner, 2000). The value for chloride ranges from 9.48 to 68.93 mg /L with mean value 19.86 mg L-1 (Fig.5 andTable 5 and 6). Chloride in drinking water originates from natural sources, sewage, industrial effluents, and urban runoff that containsaline intrusion by WHO, (2004).
Bicarbonate (HCO3-)
The value of bicarbonate ranges from 7.41 to 16.90 mg/L with mean value 11.08 (Fig.5 and Table 5 and 6).
Nitrate (NO3-)
The value of nitrate ranges from 2.24 to 8.32 mg/L with mean value 4.65 mg/L (Fig.5 and Table 5 and 6). The value of nitrate wereabove (WHO, 2011) permissible limit at EK/01 , 02, 04, 05, 06, 09, 10, 11, 13 and 14. One of the major source of nitrate ingroundwater as a result of agricultural activity (including excess application of inorganic nitrogenous fertilizers and manures), fromwastewater treatment and from oxidation of nitrogenous waste products in human and animal excreta, including septic tanks (WHO,1996).
Sulphate (SO42-)
Sulphate (SO42-) is widely distributed in nature, and the sulphate anion (SO4
2-) is a common constituent of unpolluted water.Sulphate may be leached from most sedimentary rocks, with appreciable contributions from such sulphate deposits as gypsum(Obasi, et al., 2015). Sulphate may also occur as leachates from their ores and other minerals. Sulphate is commonly less than300mg/l in natural waters except in well influenced by acid mines (Todd, 1980) The value for sulphate ranges from 1.14 to 4.53 mg L-
Sodium
Potasssium
Magnesium
Calcium
Eyankware et al.Hydrogeochemical Evaluation and Suitability study of Groundwater for Domestic and Irrigation Purpose. A Case Study of Eruemukohwarien Community, Niger Delta Region, Nigeria,Science & Technology, 2017, 3(10), 91-108,www.discoveryjournals.com © 2017 Discovery Publication. All Rights Reserved
Page98
RESEARCH ARTICLE
1 with mean value 2.99 mg L-1 (Fig.5 and Table 5 and 6). The low value signifies that the study area is free from solid waste dumpwhich could have it way into groundwater through leaching (Moses, et al., 2016). The result were below (WHO, 2011) permissiblelimit.
Figure 5 Concentration of Chloride, Nitrate, Bicarbonate and Sulphate presented as a line plot against WHO, (2011) in mg/L.
Table 4 Water quality classification based on TDS (after Carol, 1962) in mg/L
CATEGORY TDS mg L-1
Fresh water 0 - 1000
Brackish water 1,000 - 10,000
Saline water 10,000 - 100,000
Brine water 100,000
3.8. Hydrogeochemical faciesHydrogeochemical facies interpretation is a useful tool for determining the flow pattern and origin of chemical histories ofgroundwater, and it is used to express similarity and dissimilarity in the chemistry of groundwater samples based on the dominantcations and anions
050
100150200250300
EK
/1
EK
/2
EK
/3
EK
/4
EK
/5
Con
cent
rati
on (m
g /L
)
Eyankware et al.Hydrogeochemical Evaluation and Suitability study of Groundwater for Domestic and Irrigation Purpose. A Case Study of Eruemukohwarien Community, Niger Delta Region, Nigeria,Science & Technology, 2017, 3(10), 91-108,www.discoveryjournals.com © 2017 Discovery Publication. All Rights Reserved
Page98
RESEARCH ARTICLE
1 with mean value 2.99 mg L-1 (Fig.5 and Table 5 and 6). The low value signifies that the study area is free from solid waste dumpwhich could have it way into groundwater through leaching (Moses, et al., 2016). The result were below (WHO, 2011) permissiblelimit.
Figure 5 Concentration of Chloride, Nitrate, Bicarbonate and Sulphate presented as a line plot against WHO, (2011) in mg/L.
Table 4 Water quality classification based on TDS (after Carol, 1962) in mg/L
CATEGORY TDS mg L-1
Fresh water 0 - 1000
Brackish water 1,000 - 10,000
Saline water 10,000 - 100,000
Brine water 100,000
3.8. Hydrogeochemical faciesHydrogeochemical facies interpretation is a useful tool for determining the flow pattern and origin of chemical histories ofgroundwater, and it is used to express similarity and dissimilarity in the chemistry of groundwater samples based on the dominantcations and anions
EK
/5
EK
/6
EK
/7
EK
/8
EK
/9
EK
/10
EK
/11
EK
/12
EK
/13
EK
/14
EK
/15
WH
O. (
2011
)
Chloride
Nitrate
Bicarbonate
Sulphate
Eyankware et al.Hydrogeochemical Evaluation and Suitability study of Groundwater for Domestic and Irrigation Purpose. A Case Study of Eruemukohwarien Community, Niger Delta Region, Nigeria,Science & Technology, 2017, 3(10), 91-108,www.discoveryjournals.com © 2017 Discovery Publication. All Rights Reserved
Page98
RESEARCH ARTICLE
1 with mean value 2.99 mg L-1 (Fig.5 and Table 5 and 6). The low value signifies that the study area is free from solid waste dumpwhich could have it way into groundwater through leaching (Moses, et al., 2016). The result were below (WHO, 2011) permissiblelimit.
Figure 5 Concentration of Chloride, Nitrate, Bicarbonate and Sulphate presented as a line plot against WHO, (2011) in mg/L.
Table 4 Water quality classification based on TDS (after Carol, 1962) in mg/L
CATEGORY TDS mg L-1
Fresh water 0 - 1000
Brackish water 1,000 - 10,000
Saline water 10,000 - 100,000
Brine water 100,000
3.8. Hydrogeochemical faciesHydrogeochemical facies interpretation is a useful tool for determining the flow pattern and origin of chemical histories ofgroundwater, and it is used to express similarity and dissimilarity in the chemistry of groundwater samples based on the dominantcations and anions
Chloride
Nitrate
Bicarbonate
Sulphate

Eyankware et al.Hydrogeochemical Evaluation and Suitability study of Groundwater for Domestic and Irrigation Purpose. A Case Study of Eruemukohwarien Community, Niger Delta Region, Nigeria,Science & Technology, 2017, 3(10), 91-108,www.discoveryjournals.com © 2017 Discovery Publication. All Rights Reserved
Page99
RESEARCH ARTICLE
Figure 6a Piper Trilinear diagram for water characterization of the study Area
From the Piper diagram (Fig.6a) and Schoeller diagrams (Fig.6b) it reveals that sample EK/1 is of Ca-Mg- Cl -NO3- HCO3 watertype, samples EK/2 is of Ca-Mg- Cl -NO3, sample EK/3 is of Mg- Ca –Na-Cl-HCO3 water type, samples EK/4, EK/9 and EK/12 are ofCa-Mg- Cl, sample EK/5 is of Mg-Ca-Cl- NO3water type, while samples EK/6 and EK/7 are of Mg- Na-Cl-NO3, sample EK/8 is of Ca-Mg water type, sample EK/10 is of Mg-Ca-Na-HCO3-Cl,sample EK/11 is of Ca-Mg- Cl- HCO3, samples EK/13 and EK/15 are of Mg-Ca-Cl water type while sample EK/14 is of Mg- Ca-NO3- HCO3 water type. The dominat ionic species in the study area are Ca-Mg-Cl from the Piper Trilinear plot.
3.9. Irrigation Quality ParametersIrrigated agriculture is dependent on an adequate water supply of usable quality. In irrigation water evaluation, emphasis is placedon the chemical and physical parameters of the water and only rarely is any other factors considered important (Eyankware, et al.2016b; Eyankware, 2016c; Eyankware, et al. 2016d Eyankware, 2017). The quality characteristics studied in the present investigationswere as follows: Soluble Sodium Percentage (SSP), Magnesium Absorption Ratio (MAR), Sodium Percentage (Na%), SodiumAdsorption Ratio (SAR), Kelly Ratio (KR), Pollution Index (PI) and Electrical Conductivity (EC).
3.9.1. Soluble sodium percentage (SSP)The values of SSP less than 50 indicates good quality of water and higher values shows that the unacceptable quality of water forirrigation (USDA, 1954). SSP value ranges from 6.1 to 36.2% with mean value of 17.94% (Table 7). The water samples are suitable forirrigation purpose because SSP value is less than 50.
SSP calculated by using Todd, (1980).
SSP = Na+ × 100 (eqn 1)Ca2+ + Mg2+ + Na+
Where all ionic concentration are expressed in meq/l.

Eyankware et al.Hydrogeochemical Evaluation and Suitability study of Groundwater for Domestic and Irrigation Purpose. A Case Study of Eruemukohwarien Community, Niger Delta Region, Nigeria,Science & Technology, 2017, 3(10), 91-108,www.discoveryjournals.com © 2017 Discovery Publication. All Rights Reserved
Page100
RESEARCH ARTICLE
Figure 6b Schoeller, (1967) diagram showing the hydrogeochemical attribute
3.9.2. Sodium Percentage (SP)Sodium concentration is an important criterion for defining the type of irrigation. The value of Na% ranges from 4.83 to 41.93% withmean value of 41.93%. The values of Na% is fit for irrigation purpose see (Table 7). The sodium percentage was calculated by using(Doneen, 1964) formula:
Na % = Na+ × 100 (eqn 2)Ca2+ + Mg2+
Where all ionic concentration are expressed in meq/L.
The Wilcox, (1955) diagram relating sodium percentage and electrical conductivity shows that 100% of the groundwater samplesfall within excellent to good (Fig. 7a). This implies that groundwater samples within the study area are fit for irrigation.

Eyankware et al.Hydrogeochemical Evaluation and Suitability study of Groundwater for Domestic and Irrigation Purpose. A Case Study of Eruemukohwarien Community, Niger Delta Region, Nigeria,Science & Technology, 2017, 3(10), 91-108,www.discoveryjournals.com © 2017 Discovery Publication. All Rights Reserved
Page101
RESEARCH ARTICLE
Figure 7a Rating of groundwater samples on the basis of electrical conductivity and percent sodium (after Wilcox, 1955).
3.9.3. Magnesium Absorption Ratio (MAR)Magnesium absorption ratio of water is considered as one of the most important qualitative criteria in determining quality of waterfor irrigation. The value of MAR content ranges from 0.30 to 0.47 with mean value of 0.47. Based on the value of MAR, the water isfit for irrigation purpose (Table 7). More magnesium in water will adversely affect crop yields as the soils become more alkaline.Value of MAR below 50 consider fit for irrigation (Ayers & Westcot, 1994). The Magnesium Adsorption Ratio was calculated usingthe following equation (Raghunath, 1987):
MAR = Mg2+ × 100 (eqn 3)Mg2+ + Ca2+
Where all ionic concentration are expressed in meq/L.
3.9.4. Kelly Ratio (KR)The Kelly’s ratio of equal to or less than 1 is indicative of good quality water for irrigation whereas above1 is suggestive ofunsuitability for agricultural purpose due to alkali hazards (Karanth, 1987). The value of KR ranges from 0.04 to 0.41 with mean valueof 0.16. Based on the value of KR the water is suitable for irrigation purpose (Table 7). This was calculated employing the equation(Kelly, 1963) as:
KR = Na+ (eqn 4).Ca2+ + Mg2+
Where all ionic concentration are expressed in meq/L.Eyankware et al.Hydrogeochemical Evaluation and Suitability study of Groundwater for Domestic and Irrigation Purpose. A Case Study of Eruemukohwarien Community, Niger Delta Region, Nigeria,Science & Technology, 2017, 3(10), 91-108,www.discoveryjournals.com © 2017 Discovery Publication. All Rights Reserved
Page101
RESEARCH ARTICLE
Figure 7a Rating of groundwater samples on the basis of electrical conductivity and percent sodium (after Wilcox, 1955).
3.9.3. Magnesium Absorption Ratio (MAR)Magnesium absorption ratio of water is considered as one of the most important qualitative criteria in determining quality of waterfor irrigation. The value of MAR content ranges from 0.30 to 0.47 with mean value of 0.47. Based on the value of MAR, the water isfit for irrigation purpose (Table 7). More magnesium in water will adversely affect crop yields as the soils become more alkaline.Value of MAR below 50 consider fit for irrigation (Ayers & Westcot, 1994). The Magnesium Adsorption Ratio was calculated usingthe following equation (Raghunath, 1987):
MAR = Mg2+ × 100 (eqn 3)Mg2+ + Ca2+
Where all ionic concentration are expressed in meq/L.
3.9.4. Kelly Ratio (KR)The Kelly’s ratio of equal to or less than 1 is indicative of good quality water for irrigation whereas above1 is suggestive ofunsuitability for agricultural purpose due to alkali hazards (Karanth, 1987). The value of KR ranges from 0.04 to 0.41 with mean valueof 0.16. Based on the value of KR the water is suitable for irrigation purpose (Table 7). This was calculated employing the equation(Kelly, 1963) as:
KR = Na+ (eqn 4).Ca2+ + Mg2+
Where all ionic concentration are expressed in meq/L.
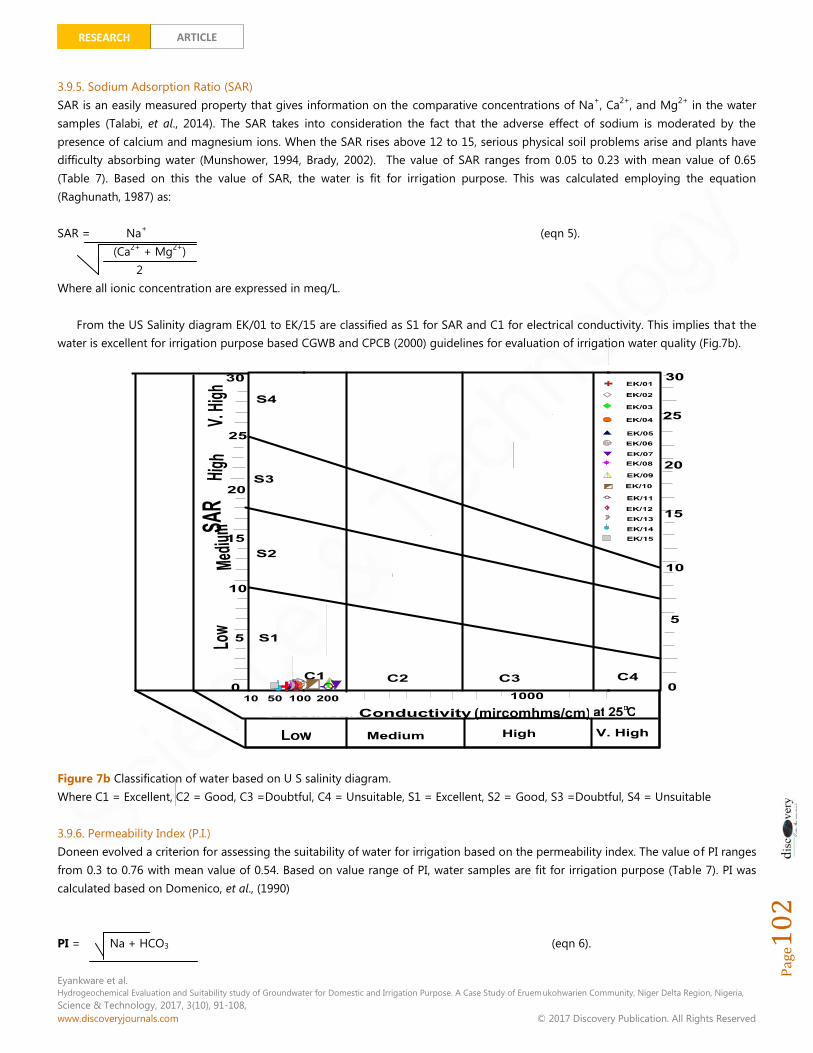
Eyankware et al.Hydrogeochemical Evaluation and Suitability study of Groundwater for Domestic and Irrigation Purpose. A Case Study of Eruemukohwarien Community, Niger Delta Region, Nigeria,Science & Technology, 2017, 3(10), 91-108,www.discoveryjournals.com © 2017 Discovery Publication. All Rights Reserved
Page102
RESEARCH ARTICLE
3.9.5. Sodium Adsorption Ratio (SAR)SAR is an easily measured property that gives information on the comparative concentrations of Na+, Ca2+, and Mg2+ in the watersamples (Talabi, et al., 2014). The SAR takes into consideration the fact that the adverse effect of sodium is moderated by thepresence of calcium and magnesium ions. When the SAR rises above 12 to 15, serious physical soil problems arise and plants havedifficulty absorbing water (Munshower, 1994, Brady, 2002). The value of SAR ranges from 0.05 to 0.23 with mean value of 0.65(Table 7). Based on this the value of SAR, the water is fit for irrigation purpose. This was calculated employing the equation(Raghunath, 1987) as:
SAR = Na+ (eqn 5).(Ca2+ + Mg2+)
2Where all ionic concentration are expressed in meq/L.
From the US Salinity diagram EK/01 to EK/15 are classified as S1 for SAR and C1 for electrical conductivity. This implies that thewater is excellent for irrigation purpose based CGWB and CPCB (2000) guidelines for evaluation of irrigation water quality (Fig.7b).
Figure 7b Classification of water based on U S salinity diagram.Where C1 = Excellent, C2 = Good, C3 =Doubtful, C4 = Unsuitable, S1 = Excellent, S2 = Good, S3 =Doubtful, S4 = Unsuitable
3.9.6. Permeability Index (P.I.)Doneen evolved a criterion for assessing the suitability of water for irrigation based on the permeability index. The value of PI rangesfrom 0.3 to 0.76 with mean value of 0.54. Based on value range of PI, water samples are fit for irrigation purpose (Table 7). PI wascalculated based on Domenico, et al., (1990)
PI = Na + HCO3 (eqn 6).

Eyankware et al.Hydrogeochemical Evaluation and Suitability study of Groundwater for Domestic and Irrigation Purpose. A Case Study of Eruemukohwarien Community, Niger Delta Region, Nigeria,Science & Technology, 2017, 3(10), 91-108,www.discoveryjournals.com © 2017 Discovery Publication. All Rights Reserved
Page103
RESEARCH ARTICLE
Ca + Mg + Na
Where all ionic concentration are expressed in meq/L.
3.9.7. Electrical Conductivity (EC)Electrical conductivity is a good measure of salinity hazard to crops as it reflects the TDS in groundwater (Sawid, et al., 2015). Thevalue of EC ranges from 68 to 232 µS/cm and classified as excellent (Fig. 9). Based on the value of EC the groundwater is fit forirrigation purpose.
Table 5 Result of Analyzed Physical and Chemical Parameters
Parameters EK/01 EK/02 EK/03 EK/04 EK/05 EK/06 EK/07 EK/08 EK/09 EK/10 EK/11 EK/12 EK/13 EK/14 EK/15 WHO,(2011)
PH 5.63 5.24 6.20 6.30 6.14 5.80 6.40 6.20 5.30 5.50 6.31 6.43 6.60 6.80 6.30 6.5 - 8.5Turbidity (NTU) 0.43 0.86 0.48 0.40 0.96 2.58 1.74 2.53 1.20 2.18 1.29 0.78 2.43 1.50 2.01 500EC (µS/cm) 94 121 213 112 108 105 232 95 210 150 240 96 84 75 68 1000(TDS) (mg/L) 63.43 115.2 86.46 314.5 87.26 42.44 75.37 26.00 32.41 13.58 64.31 70.26 96.54 25.26 42.94 500Sodium(mg/L) 2.45 3.03 4.52 5.28 1.48 6.51 2.06 1.05 1.73 7.36 1.45 2.42 1.84 2.69 3.71 200Potassium(mg/L) 0.06 0.14 0.36 0.12 1.53 0.21 1.04 0.54 1.50 0.65 1.28 1.47 0.32 1.37 0.36 200Magnesium(mg/L) 1.43 2.65 5.38 8.74 6.42 9.17 7.37 4.09 5.34 8.16 3.02 4.28 5.32 7.24 5.81 150Chloride(mg/L) 12.35 29.37 16.76 12.52 41.28 17.14 13.37 3.25 68.93 9.48 17.57 15.62 18.73 9.25 12.40 250Bicarbonate(mg/L) 8.07 12.45 15.13 11.43 17.62 9.65 10.45 7.41 8.54 16.90 11.68 9.04 6.54 11.13 9.52 N/ACalcium(mg/L) 5.47 8.86 7.54 14.57 9.43 2.30 5.72 12.06 18.63 10.34 9.93 10.35 8.18 6.34 7.43 100Nitrate(mg/L) 4.52 6.49 2.53 5.40 4.22 7.39 6.31 2.40 4.01 3.12 4.82 2.24 5.48 8.32 2.64 3Sulphate(mg/L) 1.36 2.45 4.52 2.74 3.47 5.23 1.14 3.75 4.53 2.62 3.94 2.43 2.45 2.27 1.95 100
TDS: Total Dissolved Solid, EC: Electrical Conductivity, N/A: Not Available and Underline Values (_) are values above WHO, 2011Permissible limit.
Table 6 Summary of Statistics of Analyzed Physical and Chemical Parameters
Parameters Minimum Maximum Mean Range Standard
Deviation Remarks
PH 5.24 6.8 6.07 1.56 0.47 Satisfactory
Turbidity (NTU) 1.42 0.4 1.42 2.18 0.78 Satisfactory
EC (µS/cm) 133.53 68 240 172 59.86 Satisfactory
TDS (mg/L) 13.58 314.53 77.06 300 71.95 Satisfactory
Sodium(mg/L) 3.17 1.05 7.36 6.31 1.92 Satisfactory
Potassium(mg/L) 0.06 1.53 0.73 1.47 0.56 Satisfactory
Magnesium(mg/L) 1.43 9.17 5.62 7.74 2.27 Not Satisfactory

Eyankware et al.Hydrogeochemical Evaluation and Suitability study of Groundwater for Domestic and Irrigation Purpose. A Case Study of Eruemukohwarien Community, Niger Delta Region, Nigeria,Science & Technology, 2017, 3(10), 91-108,www.discoveryjournals.com © 2017 Discovery Publication. All Rights Reserved
Page104
RESEARCH ARTICLE
Chloride(mg/L) 3.25 68.93 19.86 65.68 16.68 Satisfactory
Bicarbonate(mg/L) 6.54 17.62 11.03 11.08 3.31 No set limit
Calcium(mg/L) 2.30 18.63 9.14 16.33 3.94 Satisfactory
Nitrate(mg/L) 2.24 8.32 4.65 6.08 1.90 Not Satisfactory
Sulphate(mg/L) 1.14 5.23 2.99 4.09 1.20 Satisfactory
All units are shown in mg/L, except PH, turbidity and EC
Table 7 Analytical results of irrigation water quality parameters
SampleCode
SSP Na%
Mgcontent
KR SAR PI%
EK1 26.20 27.39 0.33 0.27 0.24 0.60
EK2 20.83 20.26 0.30 0.20 0.22 0.73
EK3 25.91 24.10 0.54 0.24 0.49 0.68
EK4 18.46 15.90 0.49 0.15 0.26 0.39
EK5 8.54 6.46 0.52 0.06 0.09 0.56
EK6 36.20 32.25 0.86 0.32 0.65 0.58
EK7 17.16 9.98 0.67 0.09 0.13 0.50
EK8 6.10 4.83 0.35 0.04 0.05 0.39
EK9 6.73 5.84 0.32 0.05 0.09 0.30
EK10 28.46 41.93 0.32 0.41 0.51 0.76
EK11 10.06 8.63 0.33 0.08 0.10 0.61
EK12 14.19 12.09 0.40 0.12 0.15 0.48
EK13 11.99 9.46 0.51 0.09 0.12 0.48
EK14 16.53 12.84 0.65 0.12 0.17 0.51
EK15 21.88 19.04 0.56 0.19 0.24 0.55
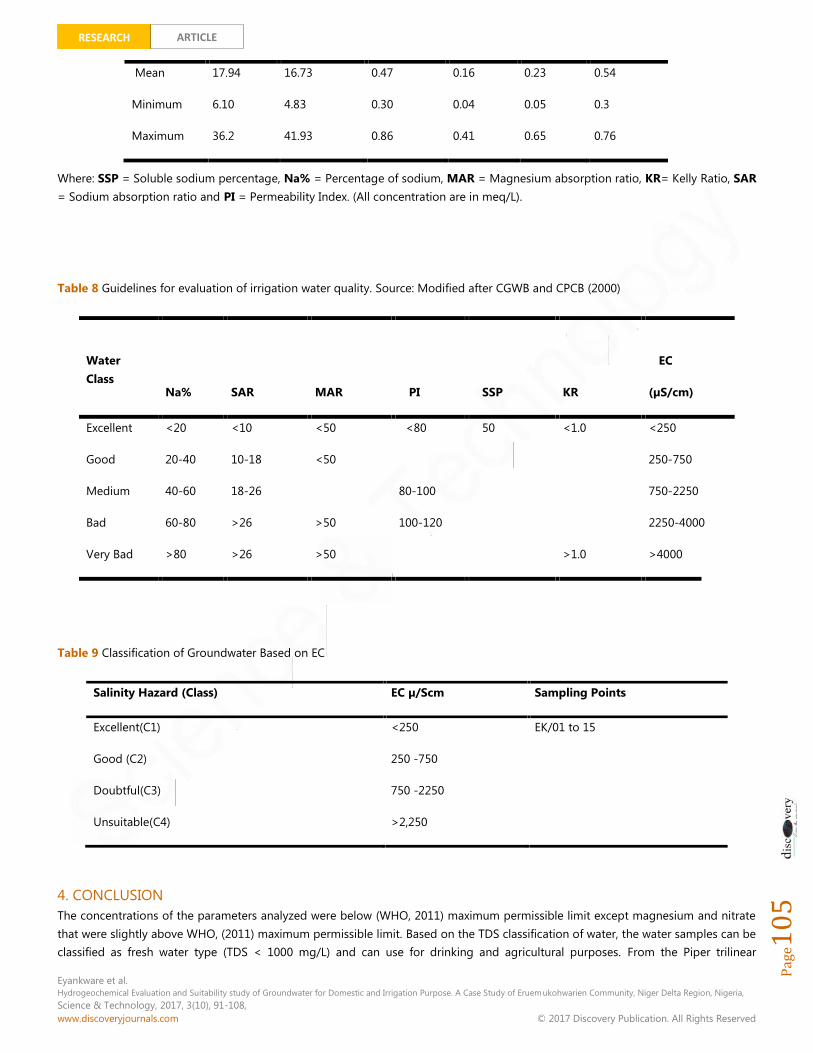
Eyankware et al.Hydrogeochemical Evaluation and Suitability study of Groundwater for Domestic and Irrigation Purpose. A Case Study of Eruemukohwarien Community, Niger Delta Region, Nigeria,Science & Technology, 2017, 3(10), 91-108,www.discoveryjournals.com © 2017 Discovery Publication. All Rights Reserved
Page105
RESEARCH ARTICLE
Where: SSP = Soluble sodium percentage, Na% = Percentage of sodium, MAR = Magnesium absorption ratio, KR= Kelly Ratio, SAR= Sodium absorption ratio and PI = Permeability Index. (All concentration are in meq/L).
Table 8 Guidelines for evaluation of irrigation water quality. Source: Modified after CGWB and CPCB (2000)
WaterClass
Na% SAR MAR PI SSP KR
EC
(µS/cm)
Excellent <20 <10 <50 <80 50 <1.0 <250
Good 20-40 10-18 <50 250-750
Medium 40-60 18-26 80-100 750-2250
Bad 60-80 >26 >50 100-120 2250-4000
Very Bad >80 >26 >50 >1.0 >4000
Table 9 Classification of Groundwater Based on EC
Salinity Hazard (Class) EC µ/Scm Sampling Points
Excellent(C1) <250 EK/01 to 15
Good (C2) 250 -750
Doubtful(C3) 750 -2250
Unsuitable(C4) >2,250
4. CONCLUSIONThe concentrations of the parameters analyzed were below (WHO, 2011) maximum permissible limit except magnesium and nitratethat were slightly above WHO, (2011) maximum permissible limit. Based on the TDS classification of water, the water samples can beclassified as fresh water type (TDS < 1000 mg/L) and can use for drinking and agricultural purposes. From the Piper trilinear
Mean 17.94 16.73 0.47 0.16 0.23 0.54
Minimum 6.10 4.83 0.30 0.04 0.05 0.3
Maximum 36.2 41.93 0.86 0.41 0.65 0.76
Eyankware et al.Hydrogeochemical Evaluation and Suitability study of Groundwater for Domestic and Irrigation Purpose. A Case Study of Eruemukohwarien Community, Niger Delta Region, Nigeria,Science & Technology, 2017, 3(10), 91-108,www.discoveryjournals.com © 2017 Discovery Publication. All Rights Reserved
Page106
RESEARCH ARTICLE
diagrams the dominant water type is alkali bicarbonate water type, with bicarbonate as the predominant ion (Na+ + K+) - HCO3-,
except for samples 5 and 9 which had no dominance and chlorine water types respectively. The dominance of alkali bicarbonatewater type could be attributed to the infiltration of carbon dioxide rich rainwater derived from the atmosphere and input of alkalisalts from anthropogenic sources. The dominat ionic species in the study area are Ca-Mg- Cl from the Piper Trilinear plot. Based onassessment of TDS, EC, SSP, MAR, Na%, SAR, KR and PI stipulate that the water is fit for irrigation purpose.
REFERENCES1. American Public Health Association APHA. (1992). Standard
methods for Examination of water and waste water, 17th
ed; 1268 -1270.
2. Akpoborie, I.A, Ekakite, O.A, Adaikpon, E.O. (2000). The
quality of groundwater from dug wells in parts of western
Niger Delta. Knowledge Review 2(5): 72-79.
3. Akpoborie, I.A., Aweto, K.E and Asuma, O.O. (2015).
Urbanization and Major Ion Hydrogeochemistry of the
Shallow Aquifer at the Effurun - Warri Metropolis, Nigeria.
Environment and Pollution. 4(1):37 -46.
4. Alakpodia, J. I. (2000).The environment of the Niger Delta.
In B.C. Uweru and J.O. Ubrurhe (Eds), Readings in General
Studies, Nigerian People and Culture. (pp190-203) About
Research Pub.
5. Allen, J.R.L. (1965). Late Quaternary Niger Delta and
Adjacent Areas: Sedimentary Environments and Lithofacies.
Bull .AAPG 49, 547-600.
6. Asadu, A.N. (2016). Assessment of Water Quality of Delta
State, Agbarho Area, Nigeria. International Research Journal
of Interdisciplinary & Multidisciplinary Studies. 2(4): 57-65.
7. Ayers, R S., and Westcot, D.W. (1994) Water quality for
agriculture: FAO Irrigation and Drainage Paper 29. Revision.
1. pp. 1-130.
8. Bhat, N. A, Bhat, A. A, Nath, S. Singh, B. P. Guha, D. B.
(2016). Assessment of Drinking and Irrigation Water Quality
of Surface Water Resources of South-West Kashmir, India. J
Civil Environ Eng 6: (2): 2-7.
9. Carol, D. (1962). Rain water as a chemical Agent of Geologic
process. A review US Geological Survey of Water Supply
paper 1535-G, 18.
10. CGWB and CPCB (2000). Status of Ground Water Quality
and Pollution Aspects in NCT-Delhi, India.
11. Brady, N. C, Weil, R. R. (2002). The nature and properties of
soils. New Jersey, Prentice- Hall.
12. Boobalan, C., Gurugnanam, B., and Suresh, M. (2015).
Assessment of Groundwater Quality in Sarabanga Sub-
Basin, Cauvery River, Tamil Nadu, India. International
Journal of Current Advanced Research. 4(11): 504-508.
13. Davis, S.N., and Dewiest, R.J. (1996). Hydrogeology. New
York: Wiley.
14. Dhirendra M. J., Alok K, and Namita A. (2009). Assessment
of the Irrigation Water Quality of River Ganga In Haridwar
District. Rayasan, J. Chem. .2 (2): 285-292.
15. Doneen, L.D. (1964). Water quality for agriculture.
Department of irrigation, University of California. Davis. pp.
48.
16. Domenico, P.A., and Schwartz, F.W. (1990). Physical and
Chemical hydrology, John Wiley and sons, New York, 410.
17. Efe, S. I. (2000). An Appraisal of the Quality of Rain and
Groundwater Resources in Nigerian Cities. The case of
Warri Metropolis. A Ph.D seminar paper presented to the
Dept. of Geography and Regional planning, Delta State
University Abraka.
18. Efe, S.I., and Mogborukor, J. O. A.(2012). Acid Rain in Niger
Delta Region: Implication on Water Resources Quality and
Crisis. An International Journal of Science and Technology
Bahir Dar, Ethiopia.1(1):17-46.
19. Efe, S.I. (2006). Quality of rainwater harvesting for rural
communities of Delta State, Nigeria. Environmentalist 26;
(pp 175-181).
20. Ekong, F., Jacob, A., Ebong, S. (2012). Water resource
management in the Niger Delta region of Nigeria: The role
of physical planning. Int. Rev. Soc. Sci. Human. 3(1):51.

Eyankware et al.Hydrogeochemical Evaluation and Suitability study of Groundwater for Domestic and Irrigation Purpose. A Case Study of Eruemukohwarien Community, Niger Delta Region, Nigeria,Science & Technology, 2017, 3(10), 91-108,www.discoveryjournals.com © 2017 Discovery Publication. All Rights Reserved
Page107
RESEARCH ARTICLE
21. Eyankware, M. O. (2014a). Estimation of Aquifer Parameters
of Ochudo City, Abakaliki, Ebonyi State Southeastern
Nigeria. Unpublished MS.c Dissertation.
22. Eyankware, M. O., and Obasi, P. N. (2014b). Physicochemical
Analysis of Water Resources in Selected Part of Enugu State
South Eastern, Nigeria. International Journal of Innovation
and Scientific Research. (10)1:171-178.
23. Eyankware, M. O., Ufomata, D. O., Effam, C.S., Akakuru, O.C.
(2015). Physicochemial and Bacteriolgical Assessment of
Groundwater Quality in Ughelli and its Environs.
International Journal of Innovational and Scientific Research.
(14)2: 236- 243
24. Ezeh, V.O., Eyankware, M. O., Irabor, O. O., Nnabo, P.N.
(2016). Hydrochemical evaluation of water resources in
Umuoghara and its environs, near Abakaliki, south eastern
Nigeria. International Journal of Science and Healthcare
Research. 1(2): 23-31.
25. Eyankware, M. O., Nnabo, P. N., Omo-Irabor, O. O., Selemo,
O. I. (2016a). Assessment of the Effect of Anthropogenic
Activities on Hydrogeochemical Quality of Water Resources
of Ekaeru Inyimagu and Its Environs, SE. Nigeria. Sky Journal
of Soil Science and Environmental Management. Vol. 5(5):
33 – 43.
26. Eyankware, M.O., Obasi, P.N. Akakuru, O.C. (2016b). Use of
Hydrochemical Approach in Evaluation of Water Quality
around the Vicinity of Mkpuma Ekwaoku Mining District,
Ebonyi State, SE. Nigeria for Irrigation Purpose. Indian
Journal of Science. Vol. 23(88), 881-895.
27. Eyankware, M. O. (2016c). Hydrochemical Appraisal of
Groundwater for Irrigation Purpose: A Case Study of Ekaeru
Inyimagu and its Adjoining Area, Ebonyi State, Nigeria.
Indian Journal of Science. Vol. 23(88), 924-943.
28. Eyankware, M. O., Okoeguale, B. O., Ulkapa. R. O. E. (2016d).
Assessment Of Physico-Chemical Properties Of Surface
Water, Of Oji Town And Its Adjoining Areas, Anambra Basin,
SE. Nigeria For Irrigation Purpose. International Journal of
Applied Sciences and Humanities. Vol. 1(1): 35-49
29. Eyankware, M. O. (2017). Hydrogeochemical Evaluation of
Groundwater for Irrigation Purposes in Mining Areas of
Umuoghara Near, Abakaliki, SE. Nigeria. Science &
Technology, 2017, 3(9), 1-19.
30. Karanth, K.R. (1987), Groundwater assessment,
development and management, Tata-McGraw Hill
Publishing Company Limited, New Delhi.
31. Kelly, W, P. (1963). Use of Saline Irrigation Water. Soil Sci.
95(4):355-39.
32. Moses, O. E., Ruth, O. E. U., Oghenegare, E. E. (2016).
Assessment of Impact of Leachate on Soil Physicochemical
Parameters in the Vicinity of Eliozu Dumpsite, Port
Harcourt, Nigeria. Basic Res. J. of Soil and Environ. Sci., 4(2):
15-25.
33. Munshower, F.F. (1994) Practical Handbook of Disturbed
Land Revegetation. Lewis Publishers, Boca Raton, Florida.
34. Nigeria Geological Survey Agency. (2006). Geological Map
of Nigeria, NGSA, Abuja, Nigeria.
35. Obasi, P. N., Eyankware, M. O., Akudinobi, B. E. and Nweke,
M. O. (2015). Hydrochemical Investigation of Water
Resources around Mkpuma Ekwaoku Mining District,
Ebonyi State Southeastern Nigeria. African Journal of Geo-
Science Research. 3(3): 01-07.
36. Offodile, M. E. (2002). Groundwater supply and
development in Nigeria. 2nd Ed, Mecon Services Ltd Jos,
Nigeria.
37. Ogunkoya,O. O and Efi, E. J.(2003). Rainfall quality and
sources of rainwater acidity in Warri area of the Niger Delta,
Nigeria. Journal of Mining and Geology.39 (2):125-130.
38. Omo-Irabor, O. O., Olobaniyi, S, B., Oduyemi, K., and
Akunna, J. (2008). Surface and groundwater water quality
assessment using multivariate analytical methods: A case
study of the Western Niger Delta, Nigeria. Physics and
Chemistry of the Earth, 33, 666-673.
39. Piper, A. M. (1994). A graphic procedure in the geochemical
interpretation of water analysis. Am Geophys Union Trans
25: 914-923

Eyankware et al.Hydrogeochemical Evaluation and Suitability study of Groundwater for Domestic and Irrigation Purpose. A Case Study of Eruemukohwarien Community, Niger Delta Region, Nigeria,Science & Technology, 2017, 3(10), 91-108,www.discoveryjournals.com © 2017 Discovery Publication. All Rights Reserved
Page108
RESEARCH ARTICLE
40. Raghunath, H. M. (1987). Groundwater, 2nd Ed. Wiley
Eastern Ltd. New Delhi, India, pp. 344-369.
41. Sawid, F. A., and Issa, A. A. (2015). Assessment of
groundwater quality for drinking and irrigation purposes,
Martubah plain, eastern Libya Transactions on Ecology and
The Environment. Vol 196: 311 -325.
42. Schoeller, H. (1967). Geochemistry of groundwater. An
international guide for research and practice. UNESCO,
chap 15, pp 1–18.
43. SPSS (2000). Statistical Package for the Social Sciences 10.0.
Chicago: SPSS Inc
44. Talabi, A. O., Afolagboye, O. L., Tijani, M. N., Aladejana, J. A.
and Ogund. (2014). Hydrogeochemistry of Some Selected
Springs’ Waters in Ekiti Basement Complex Area,
Southwestern Nigeria. 3(2)19-30.
45. Todd, D.K.(2001). Groundwater hydrology. Wiley, Canada,
pp 280 – 281
46. Ushurhe, O., and Origho T. (2013). A Comparative
Assessment of the Quality of Harvested Rainwater,
Underground Water and Surface Water for Domestic
Purposes in Ughelli, Southern Nigeria. Journal of
Environment and Earth Science. 3(12): 11.
47. USDA. (1954), U.S.DA, Salinity Laboratory Staff., U.S.
Department of Agriculture HandBook. 60, US Govt.
Printing Office, Washington D.C.
48. U.S. Salinity Lab (1954) Saline and Alkali Soils – Diagnosis
and Improvement of U.S. Salinity Laboratory. Agriculture
Hand Book No.60, Washington.
49. Weber, K.J., E. Daukoru, (1975). Petroleum geology of the
Niger Delta: 9th World Petroleum Congress Proceedings 2,
209-221.
50. Wigwe, G.A. (1975). The Niger Delta: Physical. In G.E.K.
Ofomata (ed). Nigeria in maps: Eastern States. Pp380 - 400.
Ethiope Publ. House, Benin City.
51. Wilcox, L. V. (1955). Classification and use of irrigation
water,” USDA, Circular, Washington, DC, USA, pp. 969.
52. Weiner, E. R. (2000). Application of Environmental
Chemistry: A Practical Guide for Environmental
Professionals. Lewis Publishers Washington.
53. World Health Organization. WHO. (1996). Guidelines for
drinking-water quality, Health criteria and other supporting
information. World Health Organization, Geneva. 2nd ed.
Vol. 2. Pp 1.
54. World Health Organization, WHO. (2011). Guideline for
Drinking Water Quality Recommendations, World Health
Organization 4th Edition. 1: 225 - 399.