Embed Size (px)
Citation preview

Research ArticleOptical Path Length Calibration A Standard Approach for Usein Absorption Cell-Based IR-Spectrometric Gas Analysis
Javis Anyangwe Nwaboh Oliver Witzel Andrea Pogaacuteny Olav Werhahn and Volker Ebert
Physikalisch-Technische Bundesanstalt Bundesallee 100 38116 Braunschweig Germany
Correspondence should be addressed to Olav Werhahn olavwerhahnptbde
Received 14 March 2014 Accepted 28 May 2014 Published 17 July 2014
Academic Editor Rolf W Berg
Copyright copy 2014 Javis Anyangwe Nwaboh et alThis is an open access article distributed under theCreativeCommonsAttributionLicense which permits unrestricted use distribution and reproduction in anymedium provided the originalwork is properly cited
We employed a comparison method to determine the optical path length of gas cells which can be used in spectroscopic setupbased on laser absorption spectroscopy or FTIRThemethod is based on absorption spectroscopy itself A reference gas cell whoselength is a priori known and desirably traceable to the international system of units (SI) and a gas mixture are used to calibrate thepath length of a cell under test By comparing spectra derived from pressure-dependent measurements on the two cells the pathlength of the gas cell under test is determinedThemethod relies neither on the knowledge of the gas concentration nor on the linestrength parameter of the probed transition which is very rarely traceable to the SI and of which the uncertainty is often relativelylarge The method is flexible such that any infrared light source and infrared active molecule with isolated lines can be used Weelaborate on the method substantiate the method by reporting results of this calibration procedure applied to multipass and singlepass gas cells of lengths from 038m to 21m and compare this to other methods The relative combined uncertainty of the pathlength results determined using the comparison method was found to be in the plusmn04 range
1 Introduction
Many absorption spectroscopy techniques such as tunablediode laser absorption spectroscopy (TDLAS) quantumcascade laser absorption spectroscopy (QCLAS) or Fouriertransform infrared (FTIR) spectroscopy rely on the accurateknowledge of the optical path length of the absorption cellof the spectrometer wherein the gas sample interacts withthe photons [1ndash6] The determination of the optical pathlength of the gas cell prior to any quantitative spectroscopicanalysis is indispensable in applicationswhich aim at absolutemeasurements in this case an incorrect path length of agas cell would automatically lead to an incorrect result Iftraceability should be an issue for the final spectroscopicanalysis result the determination of the optical path lengthalso has to be traceably determined The optical path lengthcalibration (OPC) therefore takes an important position inthe characterization and validation of absolute absorptionspectrometer setup
There are several methods by which an OPC of a gas cellcould be accomplished Typically in laser absorption spectro-scopy the same laser spectrometer setup is used to calibrate
the path length of the cell by means of a gas mixture of pre-viously known concentration as discussed in [7] Assumingthat all other parameters both the spectroscopic and the gascondition ones are exactly known the spectroscopic signalof the spectrometer is taken to match the path length of thegas cell used so that the spectroscopic concentration resultexactly reflects the reference concentration This however isnot independent of the application that is the concentrationmeasurement
The path length of a single pass cell can easily be deter-mined using mechanical measurements However for singlepass cell lengths in the few millimeters range even mechan-ical measurements might be challenging to carry out On theother hand multipass gas cells such as those of the Herriottet al [8] or White [9] type are used in most laboratoriesdealing with spectroscopic analysis in order to increase thespectrometer sensitivity For those multipass gas cells it canbecome even more challenging to determine the path lengthsince multiple reflections are involved and the effective opti-cal length is difficult to assessMechanicalmeasurements canif at all only yield some geometrical base length of which theactual optical path is often supposed to be an integermultiple
Hindawi Publishing CorporationInternational Journal of SpectroscopyVolume 2014 Article ID 132607 9 pageshttpdxdoiorg1011552014132607
2 International Journal of Spectroscopy
Gas flow
p
Valve
21m CUT (White cell)02m reference gas cellLaser
FP etalon
Detector
PC+
DAC
Functiongenerator
Laser driver
TCUTTrefValve
Figure 1 Schematic diagram of the setup used to calibrate the optical path length of a gas cell under test (CUT) with 119871 = 21 m (nominally)The reference cell has a nominal optical path length of 02 m PD photodiode FP Fabry-Perot etalon (removable)
Although the OPC is an essential part of a spectrometercharacterization its realization and interpretation still seemto manifest some issues and difficulties Even in the gasmetrology area the OPC was identified as one of the majorconcerns in the outcome of a recent spectroscopic study [10]
In this paper we promote an accurate easy to use methodto calibrate the optical path length of a gas cell by meansof laser spectroscopy We show that the path length of agas cell under test (CUT) can accurately be determined bya comparison to a reference cell of known path length Thequality of the presented OPC approach is superior to mostsimple mechanical measurements approaches for multipassgas cells which count the number of spots on the cellmirrors or to the use of gas standards Traceability to theSI is possible with the OPC promoted here We support thedescribed implementation of this OPCmethod by presentingresults on calibrating the optical path length of a multipassgas cell and a couple of single pass cells The results arecompared to mechanical path length measurements In sep-arate experiments we validated each derived optical pathlength by measuring amount fractions of gravimetricallyprepared gas mixtures Finally we present and discuss somerecommendations for the proposed method
2 New OPC Method
In laser absorption spectroscopy the Beer Lambert lawdescribes the relationship between the incident and the trans-mitted radiation through a gas cell containing amolecular gassample
Φ (] 119871) = Φ0(]) sdot exp minus119878
119879sdot 119903iso sdot 119892 (] minus ]
0) sdot 119871 sdot 119899 (1)
The quantities Φ0and Φ are the incident and the trans-
mitted radiant powers 119878119879is the molecular transition line
strength of the probed absorption line at gas temperature 119879which is matched to the actually present isotopic abundanceby means of 119903iso which is the ratio of the abundance in thesample compared to the value for which the line strength isreported The function 119892 is the normalized line shape profilecentered at ]
0and 119871 the absorption path length Using the
ideal gas law the number density 119899 of the absorbing speciescan be expressed in terms of the partial pressure 119901partial ofthe absorbing molecules and the gas temperatureThe partialpressure 119901partial can be related to the total pressure 119901total using
the amount of substance fraction of the absorbing species119909species = 119901partial119901total Making use of the area normalizationof 119892 (1) can also be written as
119909species =119896B sdot 119879
119878119879sdot 119903iso sdot 119871 sdot 119901total
int
infin
minusinfin
119860 (]) 119889]
=119896B sdot 119879
119878119879sdot 119903iso sdot 119871 sdot 119901total
sdot 119860 line
(2)
where the quantity 119860(]) = minus ln(Φ(])Φ0(])) is the spec-
tral absorbance (Naperian) in certain cases (see eghttpgoldbookiupacorgA00028html) also called extinc-tion and 119860 line is the spectrally integrated area of the absorp-tion lineUsing (2) the species amount fraction can be derivedfrom spectroscopic measurements as pointed out in previouspublications [12] This relation however can also be exploitedfor the OPC proposed by the present work
Figure 1 depicts the setup used for the path length cali-bration It typically contains an infrared diode laser a Fabry-Perot etalon a photodiode and a pressure and temperaturesensor similar to the setup in [12] The two cells in Figure 1are connected to each other and the same pressure sensor isused to determine the total gas pressure
In Figure 1 the reference gas cell has an optical path lengthof 119871 ref = 020m and the cell under test (CUT) in this casehas a nominal optical path length of 21m We used a serialarrangement in the experiment in order to keep with a singledetector as opposed to a parallel arrangement where twodetectors would have been required
If the CUT is evacuated and the reference cell is filledwitha gas sample its spectrometric amount fraction 119909species can beexpressed by (2) where 119871 is substituted by 119871 ref 119901total by 119901refand 119879 by 119879ref respectively On the other hand if the referencecell is evacuated and the gas cell under test is filled with thesame gas sample its spectrometric amount fraction 119909species isgiven by (2) where 119871 means the length to be calibrated and119901total and 119879 are substituted by 119901CUT and 119879CUT respectively
Since the same gas was used in the reference cell and theCUT and the same transition was probed both sides of (2)can be replaced to then read
119896B sdot 119879ref119878119879refsdot 119903iso sdot 119871 ref sdot 119901ref
sdot 119860 ref =119896B sdot 119879CUT
119878119879CUT
sdot 119903iso sdot 119871 sdot 119901CUTsdot 119860CUT
(3)
International Journal of Spectroscopy 3
Derive the line area
Compare the line areas
Derive the path length L
of the cell under test
Linear regression
ACUT i
Aref j= L middot
STCUT middot Tref
STref middot TCUT middot LrefmiddotpCUT i
pref j
120572ij = L middot 120573ij
( ) = A line = ST middot riso middot g( minus 0) middot L middot xspecies middot ptotal kB middot Tln Φ( L)
Φ0()intinfinminusinfin
minus
Figure 2 Scheme of the OPC procedure
where 119860 ref and 119860CUT denote the line areas of the probedspectral absorption feature in the case of the reference andthe gas cell under test respectively As presented in (3) theexact knowledge of the amount fraction of the gas mixture isnot necessary in the calibration of length 119871 Rearrangementof (3) leads to the model equation of the proposed OPC
120572119894119895= 119871 sdot 120573
119894119895 (4)
where 120572119894119895
= 119860CUT119895119860 ref119894 and 120573119894119895 = (119878119879CUT
sdot 119879ref119878119879ref sdot
119879CUT sdot 119871 ref) sdot (119901CUT119895119901ref119894) and to the premise that the samespectral feature that is the samemolecular absorption line ofthe strength 119878 was probed in both cells The indices 119894 and 119895indicate that multiple cell measurements could be repeatedat variable gas pressures in both or one of the cells thusadding some redundancy to the OPC The gas temperatures119879ref and 119879CUT at the different pressures were recorded Thisredundancy of the OPC can then be used to fit a linear linemodel to the data points (120572
119894119895 120573119894119895) by applying generalized
linear regression (GLR) according to (4) From this linearmodel the slope is identified to deliver the path length119871OPC
In the case that for both cell measurements the same totalgas pressure 119901
119894at the same gas temperature was realized (4)
would reduce to
120572119894=119895sdot 119901119894= 119871 sdot
119901119894
119871 ref (5)
and the linear model would have to consider the regressionon data points (120572
119894=119895sdot 119901119894 119901119894119871 ref) For the simplified condition
expressed in (5) it can be observed that the line area ratio ofthe two cells is just equal to the length ratio The describedOPC procedure would yield a result 119871OPC which is traceableto the SI if all the input quantities 119860 119878
119879 119879 and 119901 used in (4)
were traceableIt should be noted here that if both cell measurements
would have been done at different gas temperatures insteadthe line strengths would not be cancelled out and were to be
matched to the temperatures of the reference and the test cellmeasurements respectively according to
119878119879= 1198780sdot (
1198761198790
119876119879
) sdot expminusℎ sdot 119888 sdot 11986410158401015840
119896Bsdot (1
119879
minus1
1198790
)
sdot
[1 minus exp minusℎ119888 sdot (V0119896B119879)]
[1 minus exp minusℎ119888 sdot (V0119896B1198790)]
(6)
where 1198761198790and 119876
119879are the internal partition functions of the
probedmolecule at the reference temperature1198790= 296K and
119879 respectively 11986410158401015840 is the ground state energy of the probedtransition V
0is the spectral transition wave number ℎ is
the Planck constant and 119888 is the speed of light in vacuumBecause the line strength 119878
0at 1198790is the same for both cells
only the temperature dependence of the line strength wouldhave to be considered in the determination of 119871OPC
Figure 2 depicts a schematic diagram of theOPCmethodThe general idea of the presented OPC procedure is based ona comparison of spectral features measured on the very samegas sample
The feasibility of the method depends on the qualityof the two spectra measured in the two cells that is on119860 ref 119860CUT and their associated uncertainties 119906(119860 ref) and119906(119860CUT) respectively Probing the same spectral line in bothcells a large amplitude difference of the two spectral featuresdue to the different path lengths can be compensated forby means of different gas pressures in both cells Thus theabsorption line in both cell spectra can be balanced so thatthe peak absorbance is still in the linear regime for a large119871OPC and well above the noise level for a much smaller 119871 ref
The usability of the method to calibrate a path length119871 depends on the availability of a suitable reference cellcharacterized by 119871 ref and 119906(119871 ref) and can be expressed by thedynamic range of this OPCmethod defined as the maximumlength ratio 119903
119871max = 119871max119871 ref for which the inferred lengthuncertainty is smaller than the value 119906max(119871OPC) tolerablefor a given experimental task A certain reference cell can beused to calibrate a number of path lengths up to 119871max if itsuncertainty applies to 119906(119871max) le 119906max(119871) The uncertainty119906(119871OPC) of the calibrated optical path length 119871OPC is a
4 International Journal of Spectroscopy
120593maxLaser beam
Lcert
ΔL
dLref
Figure 3 Schematic of a possible laser light path deviation for the reference gas cell (worst case scenario)
function of the uncertainties 119906(119871 ref) 119906(119860 ref) and 119906(119860CUT)and of those of the pressure and temperature measurements119906(119901ref) 119906(119901CUT) 119906(119879ref) and 119906(119879CUT) if pressures and tem-peratures were different in both cells
3 Experimental OPC Results
31 Calibration of the Path length of a Multipass Gas Cell(White Cell) The setup sketched in Figure 1 was used tocalibrate the path length of a White cell of a nominal pathlength of 119871 = 21m by means of a reference gas cell of anoptical path length of 119871 ref = (02003815 plusmn 0000062)m Thisreference cell path length was modeled as 119871 ref = 119871cert +120575119871 where 119871cert = 02003815m is the certified geometricalcell length and 120575119871 is a possible correction due to somepossible deviation 120593 of the actual laser beam path from theoptical axis As sketched in Figure 3 this correction can beexpressed as 120575119871 = 119871cert times (1 cos120593 minus 1) with |120593| le |120593max|and 2 times tan120593max = 119889119871cert when 119889 = 001m is the freeoptical aperture of the cell The combined uncertaintyof the reference gas cell optical path length 119906(119871 ref)was estimated from the geometrical length uncertainty119906(119871cert) = 25 sdot10
minus7m (119896 = 1) taken from the certificate of thegeometrical reference length measured by the CoordinateMetrology Department of PTB employing a coordinatemeasurement machine (CMM Type Leitz PMM866) (httpwwwptbdecmsenfachabteilungenabt5fb-53ag-535html)and an uncertainty contribution 119906(120575119871) While our estimatefor the laser beam path was taken to be 120593 = 0 we calculateda conservative scenario setting the uncertainty to be119906(120575119871) = 120575119871(120593 = 120593max) = 0062mm by overestimatinga rectangular probability distribution that 120593 is within theinterval [minus120593max 120593max] Finally the reference cell path lengthuncertainty was estimated from 119906
2(119871 ref) = 1199062(119871cert) + 119906
2(120575119871)
For this OPC a distributed feedback (DFB) diode laseremitting at 2120583m was used In order to perform the mea-surements the wavelength of the DFB laser was swept bytriangular modulation of the laser current at a frequency of1389Hz For signal detection a photodiode was employedfrom which the signal was digitized by a 16-bit data acqui-sition card (DAC) at a sampling rate of 12MSs
In order to calibrate the path length 119871 of themultipass gascell a gas mixture of CO
2in N2was used The R(12) line of
CO2at 498731 cmminus1 was probed As mentioned before infor-
mation on the exact amount fraction of the target species inthe gas mixture is not required for the OPC data processing
For the OPC both cells were evacuated and backgroundmeasurements showed no CO
2absorption for example
from residual gas in the cell or outside the cell pathlengthThe baseline noise level was determined to be less than
00
02
04
06
08
000
005
010
015
1000 1500 2000 2500 3000
05
06
07
2400 2600
Det
ecto
r sig
nalV
Timesample points
Figure 4 Detector signals with an etalon (top) in the beam pathwith gas in the cell (bottom) and with both of them (inset) asa function of digital sample points Data are on the reference cellcontaining 20mmolmol CO
2in nitrogen gas mixture at 119901ref =
(201 plusmn 02) times 102 Pa (bottom)
1 times 10minus3 based on a 1 minus 120590 standard deviation of the residual
of the absorption line fit Then the reference cell was filledwith the CO
2-containing sample gas mixture Spectroscopic
measurements with the reference cell were carried out fordifferent values of the total gas pressure 119901ref119894 inside thereference cell according to (4) determining the respectiveline areas 119860 ref119894 for each pressure by means of fitting a singleVoigt profile to each nonaveraged absorption profile In thefitting process the Doppler-width was computed using themeasured gas temperature 119879 while the Lorentzian widthand the line area were fitted as well as the line positionSecondly whereas the reference cell was evacuated again themultipass cell under test was filled with the same gas mixtureandmeasurementswere performed for different gas pressures119901CUT119895 according to (4) to determine the respective line areas119860CUT119895 from the multipass cellrsquos absorbance spectra The gaspressure and the gas temperature were each measured witha pressure sensor (MKS Baratron) and a PT100 temperaturesensor respectively After each change of the gas pressure inthe cells data were just monitored for a period of 10 minutesto accommodate thermodynamic equilibration of the gassample prior to real spectra recording Within the recordingduration of all spectra the stability in terms of the standarddeviation of the line area the temperature and the pressureof the gas sample was typically within plusmn025 plusmn007 andplusmn014 respectively
Figure 4 depicts typical data measured on a gas samplein the reference cell (nominally 20mmolmol CO
2) at a total
International Journal of Spectroscopy 5
008
006
004
002
000
00
96 times 10minus3
minus96 times 10minus3
49872 49874
Voigt fit
Wave number (cmminus1)
Abso
rban
ce A line = 000244 plusmn 04
Data reference gas cell
(a)
96 times 10minus3
minus96 times 10minus3
Data CUTVoigt fit
00
00
03
06
09
Abso
rban
ce
498728 498732
Wave number (cmminus1)
(b)
Figure 5 CO2line profile in the 20 cm reference cell at 185 times 102 Pa (a) and the multipass gas cell (nominal length 21m) at 6 times 102 Pa (b)The
optical path length of the multipass cell was to be calibrated
pressure of 119901ref = (201 plusmn 02) times 102 Pa The detector signalin the top panel of Figure 4 is the signal measured when aremovable Fabry-Perot etalon is placed inside the beam pathto the detector (cf Figure 1) when both cells were evacuatedThe etalon signal is used to establish a linear wave numberaxis by means of the sweep rate derived from the fringeseparation as presented in [12ndash16] The detector signal in thebottom panel of Figure 4 measured when the Fabry-Perotetalon was removed shows the used absorption feature ofCO2In Figure 5 line profiles 119860(]) of the reference cell
(Figure 5(a)) and the multipass cell under test (Figure 5(b))respectively are displayed These absorbance data werederived from the measured signal in Figure 4 according to119860(]) = minus ln(Φ(])Φ
0(])) where Φ
0(]) was derived by fitting
a polynomial baseline to the measured signal [13ndash17] for thereference cell and for the CUT accordingly
Voigt profiles were subsequently fitted to the absorbancedata in Figure 5 in order to derive values for the respectiveline areas for the given gas pressures that is119860 ref119895 and119860CUT119894respectively In this fitting process the Doppler-width wascomputed according to the measured gas temperature 119879while the Lorentzian width and the line area as well as theexact line position were fitted As plotted in the examplespectra in Figure 5 the standard deviation of the residuals ofthe 02m reference and the 21m multipass gas cells was 1 times10minus3 and 2 times 10minus3 resulting in signal-to-noise ratios of 50and 494 respectively Unlike the improved residual structurefor the 20 cm gas cell at the lowest pressure of 185 times 102 Pa(see eg Figure 5) the residual structure of the multipassgas cell has a typical ldquowrdquo structure indicating the presence ofcollisional narrowing at the lowest gas pressure of 6 times 102 Pa
Such oscillating structure has been shown to have a marginaleffect on the line area [18] Here for the multipass gas cellthe residual structure area is 0004 of the line area whichwe consider to be negligible The residual structure area wasfound to be lt0004 for all othermeasurements presented inthis paper Hence the ldquow-rdquo shaped residual structure of themultipass gas cell has an insignificant effect on the line areaThe derived line areas and the other input parameters wereused to derive the values of 120572
119894119895and 120573
119894119895and the line strength
was matched to each of the measured gas temperatures 119879ref119895and 119879CUT119894 applying (6)
Figure 6(a) depicts a plot of 120572119894119895
as a function of 120573119894119895
According to (4) the path length of the multipass gascell 119871OPC was determined from the slope parameter of thegeneralized linear regression (GLR) applied to the data points(120572119894119895 120573119894119895) In compliance with the GUM [19] the GLR was
performed by means of the BLeast software [20] which iswell known from ISO 6143 [21] Input uncertainties for thisGLR were taken as reported in Table 2 The path length ofthe CUT resulting from the data in Figure 6(a) was evaluatedto be (2187 plusmn 004)m A combined uncertainty of plusmn004m(plusmn020 relative) was estimated from the approach It shouldbe noted that both the uncertainties of 120572
119894119895and 120573
119894119895were taken
into account applying the GLR
32 Calibration of the Path Length of a Single Pass Gas CellAnother OPC was carried out in a similar manner thistime calibrating the path length of a single pass gas cellof a nominal length of 82 cm For this OPC however adifferent spectrometer setting and a different gas mixture of10mmolmol CH
4in synthetic air were utilized to show the
flexibility of the OPC method In the spectrometer a DFB
6 International Journal of Spectroscopy
Table 1 Comparison of path lengths derived from the presentedOPC (119871OPC) frommechanicalmeasurements (119871mech) and fromgas standard-based retrieval (119871gas) respectively Given are normalized errors 119864
119899referring to 119871OPC
Cell Cell type 119871OPCm 119871mechm |119864119899(mech)| 119871gasm |119864
119899(gas)| Speciesa 120582120583m
A MPlowast 2187 plusmn 0040 mdash mdash 2126 plusmn 031 09 CO2 20B SP HPlowast 0819 plusmn 00029 0822 plusmn 00010 05 0805 plusmn 0041 02 CH4 165C SP BWlowast 0773 plusmn 00020 0774 plusmn 00010 02 0773 plusmn 0038 00 CH4 165C SP BWlowast 0773 plusmn 00020 0774 plusmn 00010 02 0774 plusmn 0012 004 CO2 271D SP HTlowast 0380 plusmn 00012 0380 plusmn 00020 00 0380 plusmn 0019 00 CH4 165aGas standards probed at wavelengths specified in 120582 columnlowastCell characteristics MP multipass White type SP single pass cell HP high pressure cell BW Brewster windows-equipped and HT high temperature cell
Measured dataGLR
14
12
10
8
6
4
2
000 01 02 03 04 05 06
120573mminus1
1205721
(a) 21 m gas cell
Measured dataGLR
2 4 6 8 10
1
2
3
4
5
6
7
8
120573mminus1
1205721
(b) 82 cm gas cell
Figure 6 OPC data 120572119894119895as a function of 120573
119894119895processed to retrieve the optical path lengths of the CUTs A (a) and B (b) of 119871OPC = (2189 plusmn
008)m and 119871OPC = (0819 plusmn 00029)m respectively For (a) a mixture of about 20mmolmol CO2in nitrogen was used whereas for (b) a
mixture of 10mmolmol CH4in nitrogen was probed for the OPC
Table 2 Relative standard uncertainties of themost impacting inputquantities
Quantity p T 119860 line 119871 ref
119906rel 016 008 040 003
diode laser emitting at 165 120583m was used and a CH4line at
604696 cmminus1 was probed modulating the laser current againat 1389Hz Data acquisition now took place at a samplingrate of 600 kSs with the same DACThe fitting procedure forthe CH
4absorbance data was performed in a manner similar
to the data presented in Figure 5 Here it should be notedonce more that the proposed OPC method is independentof the exact amount fraction of the gas mixture the probedmolecule and the IR light source
Figure 6(b) depicts (120572119894119895 120573119894119895) data similar to Figure 6(a)
which were processed by GLR to determine the path lengthof the 82 cm single pass gas cell The slope of the linearmodel fitted to the data resulted in a path length of the single
pass cell of 119871 = 8190 cm Again the BLeast software wasused to perform the GLR The combined uncertainty of thepath length was estimated to be 119906(119871OPC) = plusmn029 cm (plusmn035relative)
4 Discussions
TheOPCmethoddescribedwas employed to calibrate a num-ber of gas cells for their use in different spectroscopic appli-cations For the present paper results on four different cellsare summarized in Table 1 Based on these results the OPCmethod was also brought forward as a standard approach(SA) for OPC in our lab and is about to be established as SAin the EUMETRISPEC joint research project [22]
Table 1 summarizes the OPC results in terms of thederived 119871OPC and 119906(119871OPC) and compares them to respectiveresults on simple mechanical measurements reported as119871mech and 119906(119871mech) respectively where applicable and toresults119871gas and 119906(119871gas)which are based on the use of gas stan-dards of amount fractions 119909 according to the rearrangement
International Journal of Spectroscopy 7
of (2) to yield 119871 as a result The mechanical measurementswere performed using a meter rule and a caliper (resolution0001m) calibrated against length standards
The relative combined uncertainties 119906(119871OPC) of the OPCpath length results in Table 1 are in the 02ndash04 rangeTable 2 holds the standard uncertainties (119896 = 1) of the mostsignificant input quantities in (3) and (4) used to determine119906(119871OPC)
As shown in Table 2 the input quantity with the highestrelative uncertainty is the line area As such it provides themost significant uncertainty contribution to the combineduncertainty of the path length119871OPCThe standard uncertaintyof 119860 line was estimated from fitting a Voigt profile to themeasured absorbance data For this the Origin fitting erroroutput [23] was used derived on the most noisy and leastsignal-to-noise spectra as a conservative estimate (see egFigure 5(a)) It could be noted here that for the OPC methodwe used the same line profile the same spectral window andthe same wave number axis to model the spectra from thetwo cells in a similar manner and since we were dealingwith the ratio of two line areas the uncertainty contributionof the wave number axis to the line area uncertainty waseliminated from our analysis Any uncertainty contributionto the line area as a result of the residual structure wasneglected since the area from the residuals of the multipassgas cell in Figure 5 was negligible (max 0004 of the linearea) for all measurements The uncertainties of the otherinput quantities that is 119901 119879 and 119871 ref were propagated fromrespective calibration certificates The traceability to the SIof the input parameters 119901 and 119879 was reached via respectivestandards
The relative combined uncertainties of 119871mech in Table 1are in the plusmn053 range The combined uncertainties of119871mech were estimated using the resolution of the caliper Thequantity 119864
119899(mech) is the normalized error of the mechanical
length result expressed as
119864119899=
119863
119880 (119863)
(7)
where 119863 = 119871 minus 119871mech and 119880(119863) = 2 times 119906(119863) = 2 times
radic(1199062(119871) + 119906
2(119871mech)) The 119864
119899(mech) are all less than 1
indicating that the results of 119871OPC from theOPC approach forthe different gas cells agreewith the respective values of119871mechThis agreement of 119871OPC and 119871mech validates the presentedOPC method Although it is much more complicated thanmechanical measurements the OPC method presented inthis paper was still being applicable in cases where pathlengths cannot be determined by mechanical measurementsfor example in multipass gas cells and very short lengthsingle pass gas cells For those cells the OPC method isprobably the best candidate to be utilized for optical pathlength determination
Table 1 also shows an agreement between 119871OPC from theOPC and 119871gas as documented by the values of 119864
119899(119909) being
all less than 1 However the uncertainties of 119871gas in Table 1are about 13 times larger (up to 5) than the uncertainties of119871OPC which are found to be in the plusmn04 range instead Also
Table 3 Uncertainty budget of 119871gas for gas cell B (82 cm) derived bymeans of (2) with CH4 being the probed sensormoleculeThe indexcolumn is the relative contribution of the properties variance to thevariance of 119871gas [11]
Inputquantity Value Relative
uncertainty Index
p 244 hPa 016 00
T 2948 K 008 01
119860 line 000402 cmminus1 04 06119909species 001molmol 099 37
1198780
8289 times 10minus22cmminus1(cmminus2sdotmolec) 5 954
119871gas 0805m 5
the uncertainties of 119871gas in Table 1 are 9 times larger than theuncertainties of 119871mech
These large values of the uncertainties of 119871gas are a resultof the uncertainties of the used line strength figures InTable 3 an example uncertainty budget for 119871gas is presentedderived using the GUM Workbench [11] which shows theimpact of the line strength uncertainty on the combineduncertainty of 119871gas As can be seen from Table 3 the indexvalue [11] (relative contribution of the uncertainties of aninput quantity to the combined uncertainty of 119871gas) of theline strength is 991 indicating that the line strengthrsquosuncertainty provides the most significant contribution to119906(119871gas) For spectroscopic data evaluation in applicationssuch as environmental monitoring where uncertainties inthe subpercentage range are often requested these large119906(119871gas) discourage the use of 119871gas
Regarding line strengths the values and their uncertain-ties are usually measured or taken from spectroscopic databases such as HITRAN [24] or GEISA [25] However trace-able line strength values and GUM-compliant uncertaintyfigures are very rarely reported in the literature or data bases[26] Hence it is very likely that path lengths derived as119871gas could be biased The line strength values used for theevaluation of 119871gas in Table 3 were taken from the HITRAN[24] data base except for 119871gas for the multipass gas cell (A)where the line strength was measured by PTB [27 28] Therelative standard uncertainties of the HITRAN line strengthsused here are in the 2ndash5 range [24] On the contrary whileomitting the line strength value smaller uncertainties andtraceability to the SI could be reached by means of the OPCmethod presented here As presented and in addition thefollowing advantages solidify the OPC method
(i) themethod does not depend on a specific analyte anyinfrared active molecule with a sufficiently isolatedline can be used for the OPC method (depending onthe light source)
(ii) knowledge of the exact amount fraction of the probedspecies in the gas sample is not necessary since119909speciesis not used in (4) its uncertainty does not contributeto the uncertainty of 119871OPC
8 International Journal of Spectroscopy
(iii) OPC as presented here in general does not depend onany line strength parameter 119878
0 so that its uncertainty
for example taken from existing data bases does notcontribute to the uncertainty of 119871OPC
(iv) large amplitude differences in the absorption signaldue to large length ratios 119903
119871can be compensated by
appropriate pressure differences between the two cellmeasurements
(v) the quantities contributing to the path length uncer-tainty 119906(119871OPC) can be minimized if pressure andtemperature of both gas cells are always the samein the respective spectroscopic measurements thusreducing the path length uncertainty 119906(119871OPC)
(vi) the method is independent of the actual applicationthat is finally the spectrometerrsquos path length figureis independent of any concentration retrieval per-formed with the spectrometer
If needed and if traceable line strengths data with lowuncertainties were available the OPC procedure could bemade even more flexible on the other side For a givenreference cell of length 119871 ref the dynamic length range 119903
119871maxthat can be covered can be remarkably exceeded if oneprobes two different absorption lines giving rise to themodified expression 120573
119894119895= (119903isoCUT sdot 119878CUT119879CUT119903isoref sdot 119878ref119879ref sdot
119871 ref) sdot (119879ref119879CUT) sdot (119901CUT119894119901ref119895) thus considering differentindividual line strengths 119878CUT119879CUTand 119878ref119879ref for two differentlines of the same gas probed in the two cells Using differentabsorption lines for example fromdifferent bands branchesandor species isotopologues with gradually different linestrengths the dynamic range 119903
119871max can be varied in principleby several orders of magnitude Each of these line strengthshave to bematched to the isotopic abundance actually presentin the gas sample by means of 119903iso This idea however hasthe drawback of introducing additional uncertainty contri-butions regarding the line strengths 119878
0ref and 1198780CUT and theisotopic abundance factors 119903isoref and 119903isoCUT respectivelyThey all individually contribute and thus definitely enlarge119906(119871OPC) compared to the initial concept of probing the verysame transition
5 Conclusion
We presented a spectroscopic method to measure traceableoptical path lengths of an absorption cell We showed that theoptical path length of a gas cell can be accurately calibratedcomparing absorption spectra using the OPC method Forthis paper the OPC method was combined with tunablediode laser absorption spectroscopy The relative uncertain-ties of our OPC results were in the range of 02 to 04This OPCmethod leads to a significant improvement in caseswhere mechanical path length determination is difficult forgas cells because of geometrical or operational reasons It isalso advantageous with respect to the use of gas standards foroptical path length measurements This is because the latterdirectly depends on the exact knowledge of molecular linestrengths whose uncertainties are sometimes comparablylarge Traceability to the SI is also lacking in most cases The
dynamic range and the flexibility of this OPC method arerelated to the availability of a reference cell with path lengthaccuracy that exceeds the desired path length accuracy of thecell under test The OPC method is not limited to TDLASother absorption spectroscopic techniques such as QCLAS orFTIR could be used in a similar manner
Conflict of Interests
The authors declare that there is no conflict of interestsregarding the publication of this paper
Acknowledgments
Parts of this work received funding from EMRP projectsTheauthors acknowledge fruitful collaboration within the EMRPprojects GAS (ENG01) MACPoll (ENV01) METEOMET(ENV07) and EUMETRISPEC (ENV06) The EMRP isjointly funded by the EMRP participating countries withinEURAMET and the European Union The authors are grate-ful to E Gettkandt and K Wendt for the calibration of thereference cell under Reference no 53-2013-014
References
[1] P Ortwein W Woiwode S Fleck et al ldquoAbsolute diodelaser-based in situ detection of HCl in gasification processesrdquoExperiments in Fluids vol 49 no 4 pp 961ndash968 2010
[2] GWysocki MMcCurdy S So et al ldquoPulsed quantum-cascadelaser-based sensor for trace-gas detection of carbonyl sulfiderdquoApplied Optics vol 43 no 32 pp 6040ndash6046 2004
[3] J A Nwaboh O Werhahn and D Schiel ldquoMeasurement ofCO amount fractions using a pulsed quantum-cascade laseroperated in the intrapulse moderdquoApplied Physics B vol 103 no4 pp 947ndash957 2011
[4] V Ebert and J Wolfrum ldquoAbsorption spectroscopyrdquo in Opti-cal Measurements Techniques and Applications pp 227ndash265Springer New York NY USA 2001
[5] G Casa D A Parretta A Castrillo R Wehr and L GianfranildquoHighly accurate determinations of CO
2line strengths using
intensity-stabilized diode laser absorption spectrometryrdquo Jour-nal of Chemical Physics vol 127 no 8 Article ID 084311 2007
[6] C Schulz A Dreizler V Ebert and J Wolfrum ldquoCombus-tion diagnosticsrdquo in Springer Handbook of Experimental FluidDynamics C Tropea J Foss and A Yarin Eds pp 1241ndash13162007
[7] L Mei H Jayaweera P Lundin S Svanberg and G Somes-falean ldquoGas spectroscopy and optical path-length assessmentin scattering media using a frequency-modulated continuous-wave diode laserrdquo Optics Letters vol 36 no 16 pp 3036ndash30382011
[8] D Herriott H Kogelnik and R Kompfner ldquoOff-axis paths inspherical mirror interferometersrdquo Applied Optics vol 3 no 4pp 523ndash526 1964
[9] J UWhite ldquoLong optical paths of large aperturerdquo Journal of theOptical Society of America vol 32 no 5 p 285 1942
[10] E Flores F Idrees P Moussay et al ldquoFinal report of the pilotstudyCCQM-P110-B1 A comparison of nitrogen dioxide (NO
2)
in nitrogen standards at 10 120583molmol by Fourier transform
International Journal of Spectroscopy 9
infrared spectroscopy (FT-IR)rdquo Metrologia vol 49 Article ID08006 2012
[11] GUMWorkbench Professional Version 24 and GUMWorkbenchManual for Version 24 Metrodata GmbH Grenzach-WyhlenGermany httpwwwmetrodatade
[12] J A Nwaboh O Werhahn P Ortwein D Schiel and VEbert ldquoLaser-spectrometric gas analysis CO
2-TDLAS at 2 120583mrdquo
Measurement Science and Technology vol 24 no 1 Article ID015202 2013
[13] B Buchholz N Bose and V Ebert ldquoAbsolute validation of adiode laser hygrometer via intercomparison with the Germannational primary water vapor standardrdquoApplied Physics B 2014
[14] W Gurlit R Zimmermann C Giesemann et al ldquoLightweightdiode laser spectrometerCHILD (compact high-altitude In-situlaser diode) for balloonbornemeasurements of water vapor andmethanerdquo Applied Optics vol 44 no 1 pp 91ndash102 2005
[15] A Pogany O Ott O Werhahn and V Ebert ldquoTowardstraceability in CO
2line strength measurements by TDLAS
at 27 120583mrdquo Journal of Quantitative Spectroscopy and RadiativeTransfer vol 130 pp 147ndash157 2013
[16] O Witzel A Klein S Wagner C Meffert C Schulz andV Ebert ldquoHigh-speed tunable diode laser absorption spec-troscopy for sampling-free in-cylinder water vapor concentra-tion measurements in an optical IC enginerdquo Applied Physics BLasers and Optics vol 109 no 3 pp 521ndash532 2012
[17] S Wagner M Klein T Kathrotia et al ldquoAbsolute spatiallyresolved in situ CO profiles in atmospheric laminar counter-flow diffusion flames using 23120583m TDLASrdquo Applied Physics BLasers and Optics vol 109 no 3 pp 533ndash540 2012
[18] J Henningsen andH Simonsen ldquoThe (2201-000) band of CO2at
6348 cmminus1 linestrengths broadening parameters and pressureshiftsrdquo Journal of Molecular Spectroscopy vol 203 no 1 pp 16ndash27 2000
[19] ISO Guide 98-3 Guide to the Expression of Uncertainty inMeasurement 1 International Organization for StandardizationGeneva Switzerland 2008 httpwwwbipmorgutilscom-mondocumentsjcgmJCGM 100 2008 Epdf
[20] Bundesanstalt fur Materialforschung und- Prufung (BAM)BLeast-software also recommended by ISO 6143 httpwwwbamde
[21] ISO 6143 2001 ldquoGas analysismdashcomparison methods for deter-mining and checking the composition of calibration gas mix-turesrdquo 2001
[22] EMRP-Project ENV06 (EUMETRISPEC) ldquoSpectral referencedata for atmosphericmonitoringrdquo httpwwweumetrispeceu
[23] Origin 75 SR6 OriginLab Cooperation Northampton MassUSA 2006 httpwwwOriginLabcom
[24] L S Rothman I E Gordon A Barbe et al ldquoHITRAN2008rdquoJournal of Quantitative Spectroscopy and Radiative Transfer vol110 pp 533ndash572 2009
[25] N Jacquinet-Husson N A Scott A Chedin et al ldquoThe GEISAspectroscopic database current and future archive for earthand planetary atmosphere studiesrdquo Journal of QuantitativeSpectroscopy and Radiative Transfer vol 109 no 6 pp 1043ndash1059 2008
[26] L S Rothman N Jacquinet-Husson C Boulet and A MPerrin ldquoHistory and future of the molecular spectroscopicdatabasesrdquo Comptes Rendus Physique vol 6 no 8 pp 897ndash9072005
[27] G J Padilla-Vıquez J Koelliker-Delgado O Werhahn KJousten and D Schiel ldquoTraceable CO
2-R(12) line intensity
for laser-spectroscopy-based gas analysis near 2 120583mrdquo IEEETransactions on Instrumentation and Measurement vol 56 no2 pp 529ndash533 2007
[28] G Wubbeler G J Padilla-Viquez K Jousten O Werhahnand C Elster ldquoComparison and assessment of procedures forcalculating the R(12) line strength of the ]
1+2]2+]3band of
CO2rdquo Journal of Chemical Physics vol 135 no 20 Article ID
204304 2011
Submit your manuscripts athttpwwwhindawicom
Hindawi Publishing Corporationhttpwwwhindawicom Volume 2014
Inorganic ChemistryInternational Journal of
Hindawi Publishing Corporation httpwwwhindawicom Volume 2014
International Journal ofPhotoenergy
Hindawi Publishing Corporationhttpwwwhindawicom Volume 2014
Carbohydrate Chemistry
International Journal of
Hindawi Publishing Corporationhttpwwwhindawicom Volume 2014
Journal of
Chemistry
Hindawi Publishing Corporationhttpwwwhindawicom Volume 2014
Advances in
Physical Chemistry
Hindawi Publishing Corporationhttpwwwhindawicom
Analytical Methods in Chemistry
Journal of
Volume 2014
Bioinorganic Chemistry and ApplicationsHindawi Publishing Corporationhttpwwwhindawicom Volume 2014
SpectroscopyInternational Journal of
Hindawi Publishing Corporationhttpwwwhindawicom Volume 2014
The Scientific World JournalHindawi Publishing Corporation httpwwwhindawicom Volume 2014
Medicinal ChemistryInternational Journal of
Hindawi Publishing Corporationhttpwwwhindawicom Volume 2014
Chromatography Research International
Hindawi Publishing Corporationhttpwwwhindawicom Volume 2014
Applied ChemistryJournal of
Hindawi Publishing Corporationhttpwwwhindawicom Volume 2014
Hindawi Publishing Corporationhttpwwwhindawicom Volume 2014
Theoretical ChemistryJournal of
Hindawi Publishing Corporationhttpwwwhindawicom Volume 2014
Journal of
Spectroscopy
Analytical ChemistryInternational Journal of
Hindawi Publishing Corporationhttpwwwhindawicom Volume 2014
Journal of
Hindawi Publishing Corporationhttpwwwhindawicom Volume 2014
Quantum Chemistry
Hindawi Publishing Corporationhttpwwwhindawicom Volume 2014
Organic Chemistry International
ElectrochemistryInternational Journal of
Hindawi Publishing Corporation httpwwwhindawicom Volume 2014
Hindawi Publishing Corporationhttpwwwhindawicom Volume 2014
CatalystsJournal of
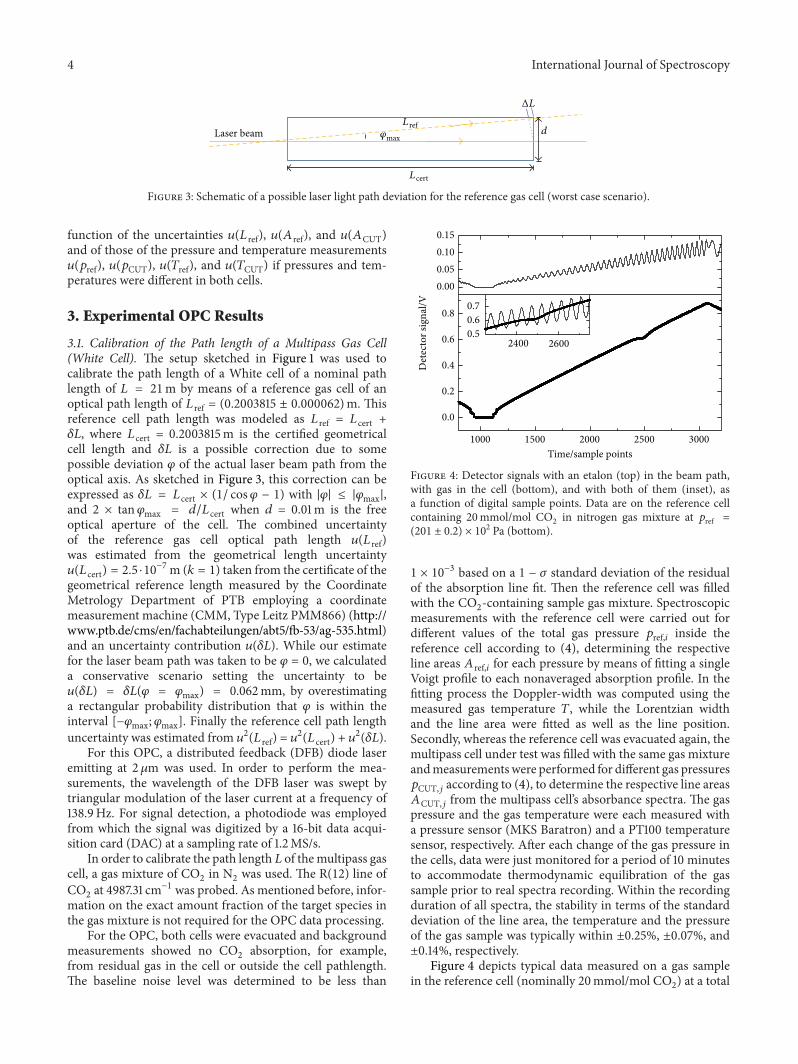
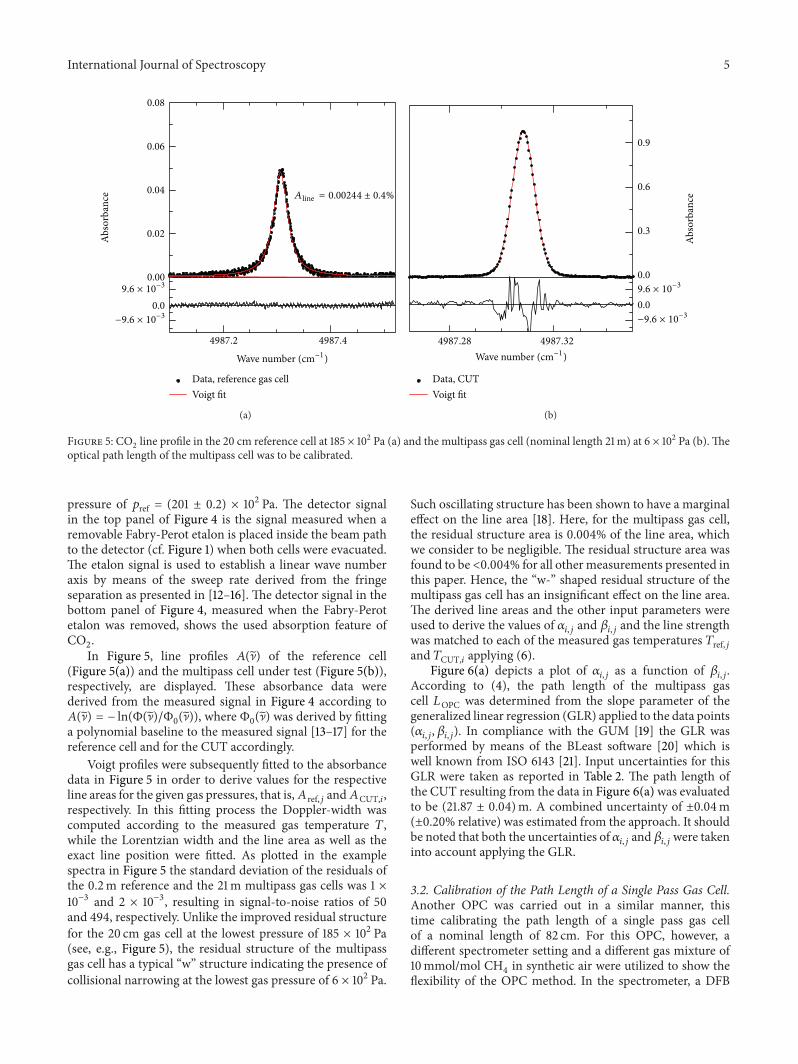