Embed Size (px)
Citation preview
RESEARCH ARTICLE Open Access
Onset of a pandemic: characterizing the initialphase of the swine flu (H1N1) epidemic in IsraelUri Roll1, Rami Yaari2, Guy Katriel1, Oren Barnea1, Lewi Stone1*, Ella Mendelson3,4, Michal Mandelboim5† andAmit Huppert6†
Abstract
Background: The swine influenza H1N1 first identified in Mexico, spread rapidly across the globe and isconsidered the fastest moving pandemic in history. The early phase of an outbreak, in which data is relativelyscarce, presents scientific challenges on key issues such as: scale, severity and immunity which are fundamental forestablishing sound and rapid policy schemes. Our analysis of an Israeli dataset aims at understanding the spatio-temporal dynamics of H1N1 in its initial phase.
Methods: We constructed and analyzed a unique dataset from Israel on all confirmed cases (between April 26 toJuly 7, 2009), representing most swine flu cases in this period. We estimated and characterized fundamentalepidemiological features of the pandemic in Israel (e.g. effective reproductive number, age-class distribution, at-risksocial groups, infections between sexes, and spatial dynamics). Contact data collected during this stage was usedto estimate the generation time distribution of the pandemic.
Results: We found a low effective reproductive number (Re = 1.06), an age-class distribution of infected individuals(skewed towards ages 18-25), at-risk social groups (soldiers and ultra Orthodox Jews), and significant differences ininfections between sexes (skewed towards males). In terms of spatial dynamics, the pandemic spread from thecentral coastal plain of Israel to other regions, with higher infection rates in more densely populated sub-districtswith higher income households.
Conclusions: Analysis of high quality data holds much promise in reducing uncertainty regarding fundamentalaspects of the initial phase of an outbreak (e.g. the effective reproductive number Re, age-class distribution, at-risk social groups). The formulation for determining the effective reproductive number Re used here has manyadvantages for studying the initial phase of the outbreak since it neither assumes exponential growth ofinfectives and is independent of the reporting rate. The finding of a low Re (close to unity threshold), combinedwith identification of social groups with high transmission rates would have enabled the containment of swineflu during the summer in Israel. Our unique use of contact data provided new insights into the differentialdynamics of influenza in different ages and sexes, and should be promoted in future epidemiological studies.Thus our work highlights the importance of conducting a comprehensive study of the initial stage of apandemic in real time.
Keywords: Epidemiology H1N1, pandemic influenza, swine-flu
* Correspondence: [email protected]† Contributed equally1Biomathematics Unit, Department of Zoology, Faculty of Life Sciences, Tel-Aviv University, 69978 Tel-Aviv, IsraelFull list of author information is available at the end of the article
Roll et al. BMC Infectious Diseases 2011, 11:92http://www.biomedcentral.com/1471-2334/11/92
© 2011 Roll et al; licensee BioMed Central Ltd. This is an Open Access article distributed under the terms of the Creative CommonsAttribution License (http://creativecommons.org/licenses/by/2.0), which permits unrestricted use, distribution, and reproduction inany medium, provided the original work is properly cited.

BackgroundInfluenza A of the H1N1 subtype, known as swine flu,was identified as a new strain in Mexico and is nowconsidered the fastest moving pandemic in the historyof the world. As it circled the globe it received muchattention by the scientific community and policy makers[1]. The early phase of an outbreak presents scientistswith challenges on key issues such as: the magnitude ofthe problem at hand when a disease first appears, popu-lation susceptibility, attack rates, and severity of the ill-ness and its symptoms, all of which are uncertain whena new disease first appears. Acting early and establishingrapid policy schemes is crucial. However such urgentdecisions have to be made under great uncertainty dueto the lack, or poor quality, of data [2].Several basic characteristics of the swine flu epidemic
differentiate it from seasonal influenza. The diseasespread during late spring and summer in NorthernHemisphere [3] - a phenomenon that has also beenobserved in previous pandemics [4]. Also, the age distri-bution of individuals infected with swine flu deviatesfrom that of seasonal influenza - with more morbidityand mortality amongst young adults [5], again a charac-teristic noted in previous pandemics [6,7].This work makes use of the fact that the data gathered
in Israel from April 26, 2009 (the first confirmed case)until July 7, 2009, is of great detail. During the first twomonths of the outbreak the Israeli health authoritiesattempted to identify and test all cases of people suspectedwith symptomatic swine flu. Their efforts were aided bythe high media impact of the disease and the attentivenessof the general public. There is reason to believe that mostsymptomatic swine flu cases in Israel over this period werediagnosed by the national surveillance campaign, makingthe dataset unique in its detail and scope.The national surveillance also provided contact data
that presented a snapshot of the population’s infectionnetwork. During the time span of this study the numberof laboratory confirmed cases in Israel (713) was thethird highest in Europe exceeded only by the UK andSpain, which have much larger populations [8]. The pre-valence and fatality rate of swine flu in Israel remainedhigh compared to other Mediterranean and Europeancountries.We examined the spatio-temporal distribution of all
cases and sub-groups and various characteristics of thedisease. This analysis of the unique Israeli dataset madeit possible to elucidate numerous interesting aspects ofthe initial phase of a pandemic.
MethodsOur analysis is based only on cases that are laboratoryconfirmed with swine flu. The first person to be diag-nosed in Israel as suffering from swine influenza
infection arrived to Israel from Mexico and was hospita-lized in the Laniado hospital on April 26, 2009. For thefirst cases the laboratory tests were PCR amplification ofthe matrix (M) gene followed by sequence analysiswhich demonstrated a perfect match to the A/Califor-nia/7/2009 strain [9]. Later cases were identified usingthe WHO/CDC protocol (http://www.who.int/csr/resources/publications/swineflu/CDCRealtimeRTPCR_S-wineH1Assay-2009_20090430.pdf). The clinical samplescollected were throat swab specimen and two nasalswab specimens, one from each nostril collected intoviral transport medium.A database of all cases confirmed to have swine flu
was assembled at the National Influenza Center in theCentral Virology Laboratory, Tel Hashomer, Israel, fromthe 26th of April until July 7, 2009. All patients testedwere requested to provide the following personal details:name, age, sex, disease initiation (as reported by thepatient), date of arrival to the clinic, return from a for-eign country in the previous week, contact with otherinfected patients, visits to educational institutions, andsymptoms. Patients were also classified according to therespective social groups to which they belong to such assoldiers, ultra-orthodox Jews, or Arabs. Altogether circa2,400 samples of patients with symptoms of influenzalike illness (ILI) were taken, of which 713 (30%) werefound positive. This number should closely match mostIsraelis with symptomatic swine flu in this time period(see below for more details). As a result of the WHOguidelines, the systematic collection of samples from allsuspected patients ended after July 2 2009, and the ana-lyses reported here are based on data collected up toJuly 7.Obtaining a comprehensive database that includes
most symptomatic cases was possible due to both exten-sive efforts made by the Israeli health authorities andparticular attributes of the country of Israel. During theinitial phase of the outbreak, the Deputy Director Gen-eral of the Ministry of Health (MoH) conducted meet-ings or teleconferences with representatives of allmedical institutions, government agencies responsiblefor disease control and professional consultants regard-ing the pandemic situation almost daily. The goal of theMoH during this period was to mitigate the epidemic asmuch as possible. An important part of the MoH strat-egy was based on having the best possible surveillanceof infected cases. To achieve this, the General Directorof the MoH published between the 5th of April and the17th of August 7 MoH guidelines and binding regula-tions for the H1N1 pandemic. The documents have alegal status and the entire Israeli medical establishment(doctors, Health Maintenance Organizations - HMOs,hospitals) is required to follow these guidelines. In addi-tion the Israeli authorities launched a media campaign
Roll et al. BMC Infectious Diseases 2011, 11:92http://www.biomedcentral.com/1471-2334/11/92
Page 2 of 13
which called for every individual with influenza likesymptoms, or anyone in contact with people having ILIsymptoms, to be tested for the H1N1 virus. Below wesummarize their main policy guidelines.On the 5th of April 2009, the Ministry added H1N1 to
the list of mandatory reportable diseases. Anyone sus-pected of having a respiratory illness, was tested usingswabs which were sent to the Ministry’s Central Virol-ogy Laboratory. In the first stages of the outbreak (until17.6.2009) all laboratory diagnosed cases were hospita-lized. Official epidemiological forms were provided tothe medical staff at hospitals and in community clinics.In cases of a cluster of three or more confirmed casesthe guidelines required the Health District Physician toconduct a full epidemiological investigation and toreport the results to the MoH headquarters. At the Ben-Gurion international airport (the main international air-port in the country) a special medical clinic was openedfor examining every passenger who arrived to Israelfrom Mexico within 7 days of departure from Mexico.At a later stage every passenger arriving from Mexico,the US or Canada with fever within the previous 24hours was tested and sent to a hospital directly from theairport. All patients were hospitalized in isolation condi-tions to prevent further spread of the disease.In addition to the above, Israel has several unique
characteristics which made a major contribution to thesuccess of MoH’s surveillance during the initial stage ofthe pandemic. Israel is a small country in size (21,000km2). There is hardly any human movement across theland borders and most people entering the country arepassengers entering the Ben-Gurion International air-port. Also, during the initial phase, the pandemicreceived a great deal of attention from all branches ofthe media. The Israeli public health system is composedof four HMOs which work in tight connection with theMoH and there was excellent collaboration during theoutbreak between the different organizations. Israel alsohas wide experience in preparing for catastrophic eventsas evidenced by the detailed Israeli pandemic prepared-ness program from 2007 (http://www.health.gov.il/Download/pages/tol_pand07.doc) which had planned thesurveillance program in great detail ahead of time. Tak-ing into account all of these attributes, the Israeli MoHargued that during the initial phase of the epidemic, itwas possible to pinpoint most symptomatic case ofswine flu is Israel - making this dataset very promisingfor epidemiological analysis.Estimating the reproductive number R0 is of great
importance when studying epidemics, When, as inmany situations, the population is not fully suscepti-ble (S0 < N) the effective reproduction number - Re
which is defined as: Re = R0·S0/N [10], is used. Ourestimates of Re are based on the formulation of a
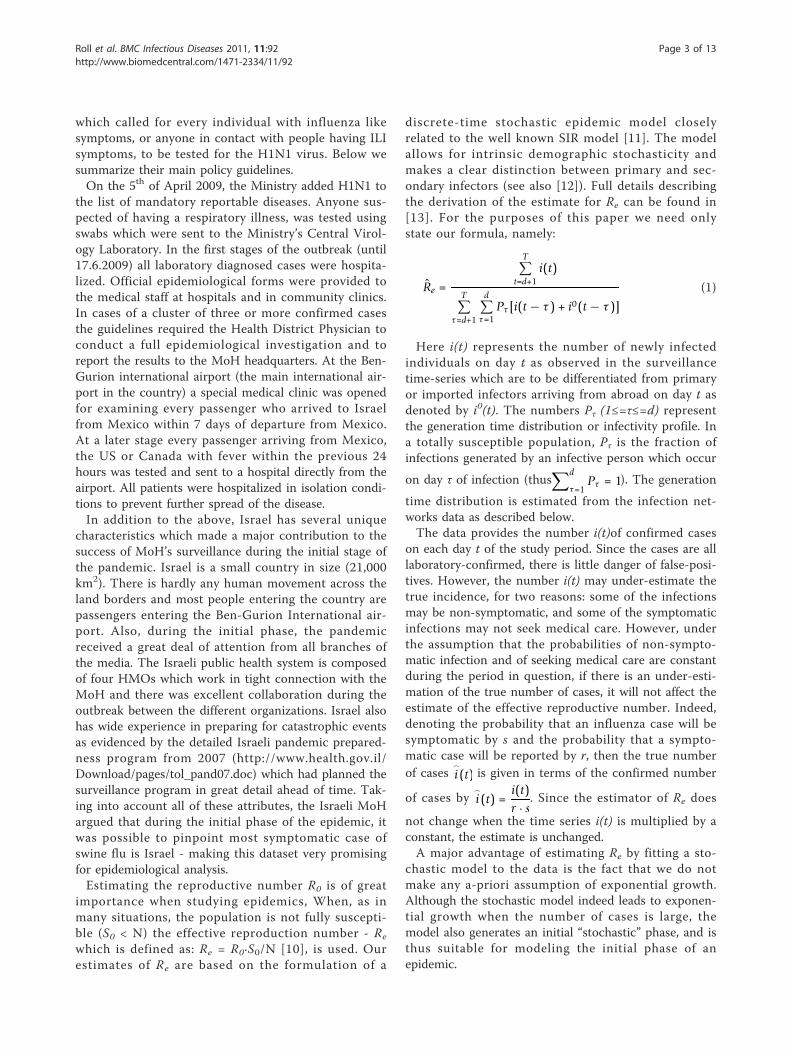
discrete-time stochastic epidemic model closelyrelated to the well known SIR model [11]. The modelallows for intrinsic demographic stochasticity andmakes a clear distinction between primary and sec-ondary infectors (see also [12]). Full details describingthe derivation of the estimate for Re can be found in[13]. For the purposes of this paper we need onlystate our formula, namely:
R̂e =
T∑t=d+1
i(t)
T∑τ=d+1
d∑τ=1
Pτ [i(t − τ ) + i0(t − τ )]
(1)
Here i(t) represents the number of newly infectedindividuals on day t as observed in the surveillancetime-series which are to be differentiated from primaryor imported infectors arriving from abroad on day t asdenoted by i0(t). The numbers Pτ (1≤=τ≤=d) representthe generation time distribution or infectivity profile. Ina totally susceptible population, Pτ is the fraction ofinfections generated by an infective person which occur
on day τ of infection (thus∑d
τ=1Pτ = 1). The generation
time distribution is estimated from the infection net-works data as described below.The data provides the number i(t)of confirmed cases
on each day t of the study period. Since the cases are alllaboratory-confirmed, there is little danger of false-posi-tives. However, the number i(t) may under-estimate thetrue incidence, for two reasons: some of the infectionsmay be non-symptomatic, and some of the symptomaticinfections may not seek medical care. However, underthe assumption that the probabilities of non-sympto-matic infection and of seeking medical care are constantduring the period in question, if there is an under-esti-mation of the true number of cases, it will not affect theestimate of the effective reproductive number. Indeed,denoting the probability that an influenza case will besymptomatic by s and the probability that a sympto-matic case will be reported by r, then the true numberof cases
�
i(t) is given in terms of the confirmed number
of cases by�
i(t) =i(t)r · s
. Since the estimator of Re does
not change when the time series i(t) is multiplied by aconstant, the estimate is unchanged.A major advantage of estimating Re by fitting a sto-
chastic model to the data is the fact that we do notmake any a-priori assumption of exponential growth.Although the stochastic model indeed leads to exponen-tial growth when the number of cases is large, themodel also generates an initial “stochastic” phase, and isthus suitable for modeling the initial phase of anepidemic.
Roll et al. BMC Infectious Diseases 2011, 11:92http://www.biomedcentral.com/1471-2334/11/92
Page 3 of 13

There were 451 patients who reported the date atwhich they perceived their illness began. We calculatedthe difference between this onset date and the date inwhich they arrived at the health clinic or hospital fortreatment. Also, most individuals tested for swine fluwere asked by their doctor to identify who they believedthey were infected from. Of the 713 cases, 183 (25.6%)were able to provide information establishing contactlinks. This data was used to assemble contact networkswhich map the connections between an infected person(infector) and the different individuals he/she infected(infectees). Based on the contact networks, it was possi-ble to determine the generation-time interval distribu-tion for swine flu - the distribution of durationsbetween the time an individual becomes infected andthe times of infection of the people he or she infects.We used the reported dates of disease initiation at bothends of a link as the samples of the generation-timeintervals. We counted all infector ® infectee relationsbetween males (M) and females (F), and also betweenage classes. The expected numbers of these interactionswere then calculated assuming random mixing betweengroups of infectors and infectees via standard contin-gency table analysis [14].We used the geographic locality information to plot
the spatial dynamics of the epidemic. Each case wasassigned to one of fifteen sub-districts in Israel. As thecorrelation between the population size and the numberof cases in each sub-district proved highly significant (P-value <0.0001, R2 = 0.833), for all further analyses weused the rates of swine flu per 100,000 people. Theserates were plotted for each week of the epidemic in thedifferent sub-districts. We conducted a spatial autocor-relation analysis by calculating the global Moran’s Iindex [15] for the above rates in the first 11 weeks ofthe epidemic. The index was also calculated for thecumulative rate over the entire time frame.We conducted a forward stepwise multiple regression of
the influenza rates (in the different sub-regions), againstseveral explanatory variables: sub-district area, percentageof built area, average gross household income, averagenumber of inhabitants per household, percentage of work-force arriving from other sub-districts, and mean maxi-mum and minimum temperatures over the duration of theepidemic. Furthermore, we applied the Akaike informationcriterion (AIC) in order to choose the best fitting modelamong several possible models (see below) [16].
ResultsThe time series of swine flu cases in Israel during theinitial phase of the outbreak is displayed in Figure 1a. Inthe first weeks of the epidemic, nearly all new casesarrived sporadically from abroad, infecting some indivi-duals but eventually becoming locally extinct, as seen in
the period April 26 to June 6, 2009 (Figure 1a). In themonth of June the percentage of primary cases (arrivingfrom abroad) vs. secondary cases (infected locally) drops,but still remains relatively high (Figure 1b). In the secondweek of June, some nineteen members of a group of visit-ing young American students (from the “birthright” pro-gram) traveling the country were confirmed to haveswine flu. The records show that at least twelve otherpatients came into contact with this group, most of themsoldiers (see below). Since the arrival of these young tra-velers, there was a clear jump in the number of cases andin the spatial spread of the disease (Figures 1a, 2).Although the pandemic was inevitable in Israel, with orwithout this specific group, the surveillance procedureswere refined to a degree that enabled identification of thekey triggering factors.
Basic reproductive numberFor the Israeli swine flu time series (Figure 1), our mod-eling approach produced estimates for Re = 1.06 with a95% confidence interval 0.963-1.134. Our results high-light the importance of separately modeling importedinfected persons migrating into a region or country,rather than considering them as just a particular subsetof the local infected population. The latter is an incor-rect approach and will result in an over-estimate of Re.For example, had all infections been regarded as local,the estimate for Re via Equation (1) (taking i0(t) = 0),would have resulted in Re = 1.27 (95% C.I. 1.17,1.37).Alternatively, if the imported infectives had beenremoved from the data, this would have resulted in Re =1.26 (95% C.I. 1.16, 1.37). Although as the epidemicspreads the number of immigrant cases becomes negligi-ble in comparison to the locally infected cases, in thetimeframe covered by this study this stage is not yetreached (see figure 1b). As the example here shows, atthe initiation of the epidemic, the imported infectiveshave a significant effect on the estimate of Re.The mean time of delay between arrival at the hospital
or health clinic and the reported date at which patientsperceived their illness began is 1.93 days with a mode ofone day and median of two days (see Figure 3). Hence,a large portion of the patient’s infectivity period was infact prior to their diagnosis. The significance of thisfinding is discussed below.
Age distributionThe mean age of the confirmed cases was 22.1 yearswith a median of 21 and a mode of 20. The age distri-bution of cases in many other countries in the sameperiod gave a median age lower than 20 [17] (Figure 4shows the age distribution of cases in Israel). Cases weredivided into three different age classes 0-18, 19-30 andabove 30. Calculating the incidence rate for the
Roll et al. BMC Infectious Diseases 2011, 11:92http://www.biomedcentral.com/1471-2334/11/92
Page 4 of 13

secondary cases (i.e. those infected within Israel) overthe entire period of data collection for each of the agegroups, we obtained the following rates per 100,000: 7.5(0-18), 17.3 (19-30), 2.9 (31+). Two features of this agedistribution seem striking: 1) The very low rates inadults over 30 compared to the other groups. 2) Thehigh rates among young adults (19-30) compared tochildren (more than twice). Compared to data fromother countries (see Figure 5) it appears that the firstfeature is common to many countries, while the secondfeature is not typical. The 19-30 age group rapidlyincreased from early June and remained high, but the 0-18 age group became significant only later (Figure 6).
Contact Structure and Infection NetworksAltogether there were 66 separate infection networkstotaling 183 nodes, with 123 links between them, manynetworks were disconnected with many isolated links.55.2% of the nodes had no outgoing links, 33.3% had
one outgoing link, 7.1% had two outgoing links and2.7% had three outgoing links. In addition there werethree patients who might be considered “superinfectors”with four, seven and ten outgoing links. The mean num-ber of outgoing links per node was 0.67. Note that thisnumber is much lower than the value of Re = 1.06 wecalculated for this timeframe, which is unsurprising inview of the fact that many of our networks only providea sample of all infections. Despite the fact that our net-works only represent a sample of actual infections wecan, under the assumption of random sampling, usethem to estimate statistical characteristics of infectiontimes and relative rates of infection among variousgroups.
Generation-time distributionThe mean generation-time was found to be μ = 2.92and its standard deviation s = 1.79 based on a genera-tion time distribution of up to seven days. Figure 7
Figure 1 Time series of swine flu in Israel. a- time series of swine flu cases in Israel between the 26/4/2009 and the 7/7/2009, altogether 713cases. Bars represent the incidences per day (left Y-bar scale) and line the cumulative number (right Y-bar scale). Also marked is the date when thesystematic data collection ended (dashed line). b- Percentage of primary versus secondary cases over the epidemic from the 20th of May onwards.
Roll et al. BMC Infectious Diseases 2011, 11:92http://www.biomedcentral.com/1471-2334/11/92
Page 5 of 13

displays the frequency histogram of the generation-time. Superimposed on the histogram is the best fittinggamma distribution which was found to have μ = 2.95and s = 1.43 (with the parameters a = 4.25, b = 1.44).The contact networks include reports of infection forperiods longer than seven days. However, data aboutinfections beyond seven days is controversial [18], andwere not included when fitting the gamma distribution.
Male and Female Contact ratesThe networks were composed of 123 different linksdefining infector ® infectee relations between males(M) and females (F) (Table 1). Our analysis shows thatthe observed numbers are not significantly differentthan expected by random mixing (p = 0.942, c2 =0.0052, Yates corrected chi-square test).
Age-class contact structureThe contact networks analysis of the age-class structureis shown in Table 2. The observed data is significantlydifferent from expected (p = 6.8E-6, c2 = 29.3, chi-square test) and individuals in different age classes arenot mixing randomly. The most significant differencesare found within age-classes (i.e., along the matrix’sdiagonal) which show large deviations from randommixing. Individuals within the 19-30 age class infect oneanother three times more than expected via randommixing. The two age-groups 0-18 and 19-30 appear toinfect one another less than expected (see Table 2).
Sex ratioThe male to female sex ratio of swine flu cases wasskewed, with 59.6% males and 40.4% females (n = 713).
Figure 3 Delay between disease initiation and doctor visit. Frequency distribution of the number of days of delay between the reportedinitiation of the disease and the visit to the health clinic or hospital (N = 451).
Figure 2 “Birthright” influence on spread. Influence of the group of young American students (from the “Birthright” project) on time series ofswine flu cases in Israel. The dashed line shows all the cases that were either group members or identified themselves as being in contact withthe “Birthright” group. The solid line displays the rest of the cases.
Roll et al. BMC Infectious Diseases 2011, 11:92http://www.biomedcentral.com/1471-2334/11/92
Page 6 of 13

This is significantly different from the sex ratio of theentire Israeli population which stands at 50.4% males to49.6% females (P < 0.0001, c2 = 24.1, Yates correctedchi-square test after appropriately normalizing the gen-eral population by the age structure distribution ofswine flu cases). The high male sex ratio was comparedto that observed in seasonal flu records collected over aten year period from one of Israel’s health maintenanceorganizations (n = 286,310). The seasonal flu data hasmore females (46.1% males, 53.9% females), and theseproportions are significantly different from those ofswine flu (P < 0.0001, c2 = 52.18, Yates corrected chi-square test). The Israeli male to female sex ratio forswine flu cases is also higher than that reported in Eur-ope (male 52.4%, female 47.6% - [19]) and several othercountries with available data (Belgium -[20], Chile -[21],France - [22], Italy -[23], Greece -[24]). The analysis ofa more updated swine flu data-set which includes anadditional 3,340 confirmed cases further supported thisdeviation with a male percentage of 54.5%.
Social groupsWe examined the epidemic dynamics of several distin-guishable social groups. Soldiers, for example, who com-prise some 2.4% of the Israeli population [25], arerelatively connected within themselves and isolated fromthe rest of the population in terms of daily activities.Soldiers were highly represented among swine flu caseswith 107 confirmed cases, which is an incidence of 60.6cases per 100,000 people in this group; seven timeshigher than the non-soldier public (8.5 cases per100,000 people). Ultra-orthodox Jews were found tohave roughly the same incidence as the rest of theIsraeli population (10.4 versus 9.8 cases per 100,000respectively). Nevertheless, the first ultra-orthodoxswine flu case was reported on June 22, 2009, and sincethis date ultra-orthodox Jewish cases represent 17.8% ofall cases (in this, more limited time frame), whereas theyrepresent only about 10% of the Israeli population [26].In our database there were only 3 cases of Arabs withswine flu. This value corresponds to an incidence of 0.2
Figure 4 The number of swine flu cases at each age.
Figure 5 Age distribution of cases in different countries. Standardized rates of swine flu in different age classes and different countries. Thenumber of cases in each age class is divided by total population in these ages, and these rates are later divided by the sum of all of the ratesin all age classes. These rates were calculated for the USA - A (confirmed cases from the 15/4-24/7/2009 Based on [55]), Europe - B (confirmedcases up to the 20/7/2009 based on [17]) and Chile - C (all confirmed cases up to the 2/7/2009 based on [7]) and compared to their parallelrates in Israel.
Roll et al. BMC Infectious Diseases 2011, 11:92http://www.biomedcentral.com/1471-2334/11/92
Page 7 of 13

cases per 100,000 people, compared to 12 cases per100,000 people in the non-Arab population of Israel.
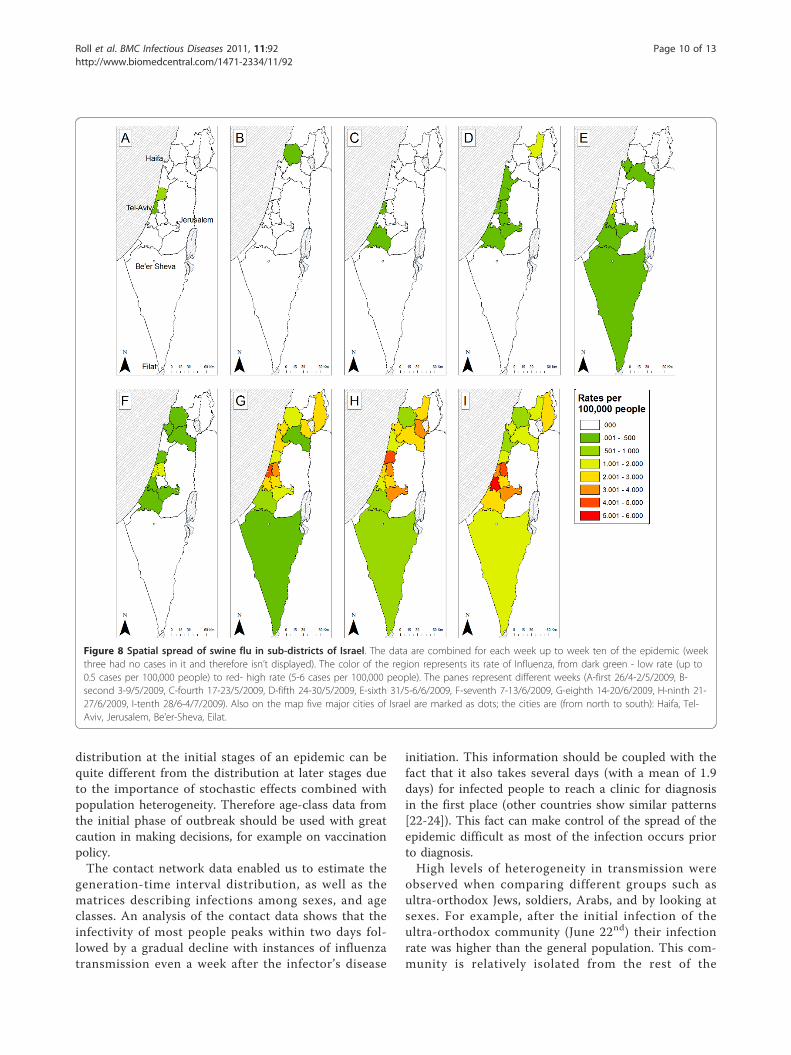
Spatial analysisThe rates for each week of the epidemic in the differentsub-districts are displayed in Figure 8. The epidemic ismore pronounced in the central-western part of Israel,which generally showed higher rates than other regionsand from there it spread to the north east, and south. Inthe first six weeks, swine influenza was unable to persistin all regions; it went locally extinct in 7 of the 13 sub-districts up to this point. Additionally the incidencerates remain below 1 infected person per 100,000 peo-ple. After this period the epidemic climbs - regions
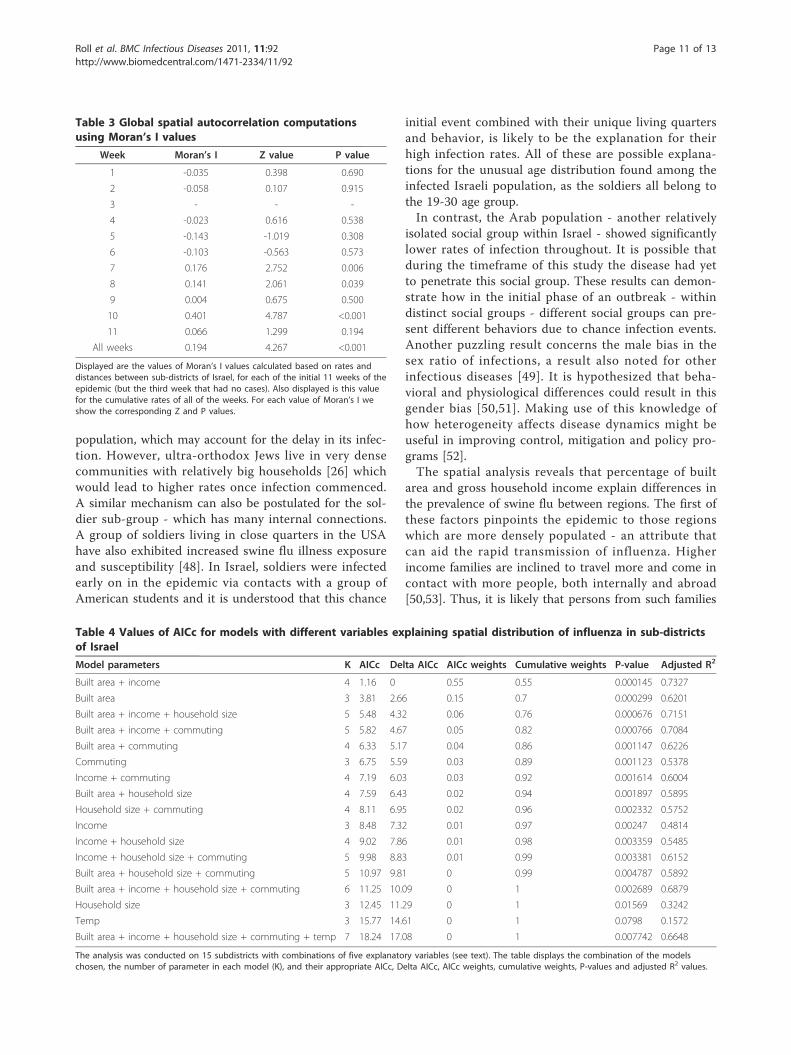
which had infections remained infected, and the ratesincrease.Table 3 displays the Moran’s I values for the autocor-
relation analysis. In the first six weeks there is a patternof spatial non-random dispersion - negative (but non-significant) I values. From the seventh week onward thepattern changes, the rates in the different regions showautocorrelation - positive I values which are significantfor 3 of the 5 weeks (see Table 3). The total Moran’s Ivalue for all of the weeks combined also showed signifi-cant spatial autocorrelation (I = 0.194, Z = 4.267, P <0.0001).When analyzing the various explanatory factors of the
swine-flurates in different sub-districts, using the
Figure 6 Time series of swine flu cases divided into three different age groups.
Figure 7 Frequency distribution of the swine flu generation time. This is based on differences in reported disease initiation dates that werecalculated from our infection networks. Also displayed is a Gamma distribution curve (dashed line) based on data only up to seven days - darkbars (see text for details).
Roll et al. BMC Infectious Diseases 2011, 11:92http://www.biomedcentral.com/1471-2334/11/92
Page 8 of 13
stepwise approach, only two factors stood out as signifi-cant - percentage of built area and gross householdincome (P-value = 0.0001, R2 = 0.77). These two spatialpredictors are significantly positively correlated to eachother (P-Value = 0.046, R2 = 0.273). When looking atthe AICc values of 17 different model combinations, themodel including just these two factors had the lowestAICc score with an AICc weight of 55.3% (see Table 4for a detailed table of AICc and model combinations).
DiscussionPandemic influenza is considered one of the largest bur-dens to human health [27]. However, data on the initia-tion phase of pandemic is scarce. Understanding thedynamics at this phase is fundamental in determiningthe consequent impact of the disease on human popula-tions. The data gathered in Israel during the initiation ofthe current H1N1 influenza pandemic is one of the bestsuch datasets in the world, creating a rare opportunityfor analysis. Such data and real time analysis can greatlyaid management schemes.It is now known that both for seasonal influenza [28]
and the swine flu pandemic there was a considerableproportion of asymptomatic cases [29-31]. However it isunclear how important, if at all, is the role of thesecases in epidemic dynamics [32,33], The proportion ofasymptomatic cases in the 2009 pandemic is believed torange from 10% to 90% [29,30]. Unfortunately in thecurrent study we were unable to analyze the role of theasymptomatic cases on the spread of the pandemic.
However, if the proportion of symptomatic to asympto-matic cases is constant during the period of the studythen our estimates of Re should be valid (see method fordetails). Furthermore, our epidemiological analyses ofrates in different social groups, ages, sexes or regionsshould also hold providing asymptomatic cases are dis-tributed in the population in the same manner as symp-tomatic cases. Therefore this lacuna in our data shouldnot undermine the conclusions based on it.Our estimate of the reproductive number Re = 1.06
was only slightly larger than unity. This is relatively lowcompared to calculations reported in Mexico, USA,Canada, Australia, New-Zealand and Japan based ondata from the initiation phase of the current epidemicwhich range from 1.31-4.11 [34-40], and also lower thanestimates based on data from previous pandemics [41].However, low estimates of Re were also reported forMexico and the Netherlands [42,43]. This low estimatecould derive from either unfavorable weather conditionupon the late arrival of this strain [44], more immunityof the Israeli population to this particular strain, relativeto other countries [45,46], or efficient containment mea-sures by the Israeli health authorities. The fact that Re
was so close to unity raises possibility of containing ormitigating the spread of the disease [47].Many studies of the current pandemic emphasize the
lower rates among adults older than 30 years relative tothe younger age groups, and the same was found here.However, an intriguing feature of the age distributionderived from the Israeli data is the very high ratesamong young adults (19-30) as compared to children.This characteristic appears to be exclusive for Israel. Weshould mention that during the time of the researchthere were no prolonged school vacations and theschool year ended either on the 30th of June for primaryschools or the 20th of June for high-schools (i.e., at simi-lar dates to other northern hemisphere countries). Withrespect to school closure - only one school in Israel wasclosed, for a few days, as a response to a high ratio ofinfection in one of its classes and not as a preplannedpreventative measure. We can therefore assume that thedifferent age morbidity in Israel has no clear relation toany events that pertain to the Israeli education system.Ahmed et al. [6] show that during the 1918 pandemicthere were higher infection rates in young adults, whichwere explained by more immunological memory foradults (aged > 30 ) and a “honeymoon period” for chil-dren having less severe symptoms. It is possible that aunique memory effect has a role in the current pan-demic in Israel, shaping its age group distribution.It is also possible that this effect is due to transient
dynamics at the start of the epidemic related perhaps tothe higher representation of young adults, as comparedto children, among international travelers. Thus the age
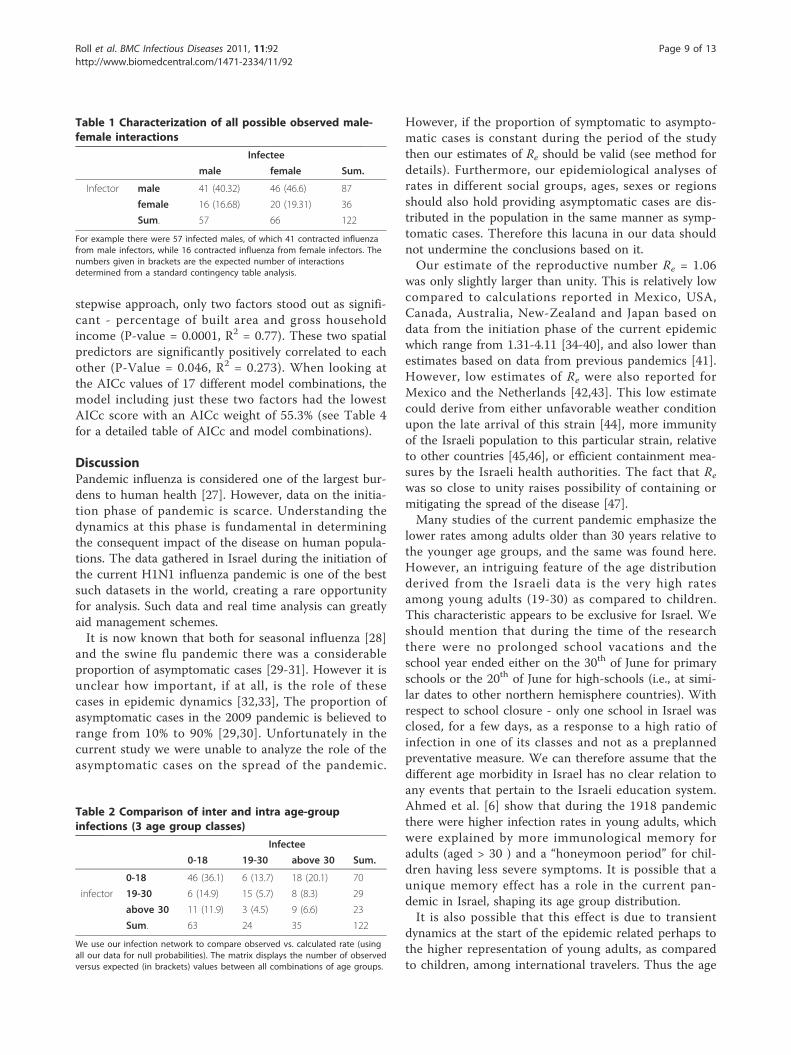
Table 1 Characterization of all possible observed male-female interactions
Infectee
male female Sum.
Infector male 41 (40.32) 46 (46.6) 87
female 16 (16.68) 20 (19.31) 36
Sum. 57 66 122
For example there were 57 infected males, of which 41 contracted influenzafrom male infectors, while 16 contracted influenza from female infectors. Thenumbers given in brackets are the expected number of interactionsdetermined from a standard contingency table analysis.
Table 2 Comparison of inter and intra age-groupinfections (3 age group classes)
Infectee
0-18 19-30 above 30 Sum.
0-18 46 (36.1) 6 (13.7) 18 (20.1) 70
infector 19-30 6 (14.9) 15 (5.7) 8 (8.3) 29
above 30 11 (11.9) 3 (4.5) 9 (6.6) 23
Sum. 63 24 35 122
We use our infection network to compare observed vs. calculated rate (usingall our data for null probabilities). The matrix displays the number of observedversus expected (in brackets) values between all combinations of age groups.
Roll et al. BMC Infectious Diseases 2011, 11:92http://www.biomedcentral.com/1471-2334/11/92
Page 9 of 13
distribution at the initial stages of an epidemic can bequite different from the distribution at later stages dueto the importance of stochastic effects combined withpopulation heterogeneity. Therefore age-class data fromthe initial phase of outbreak should be used with greatcaution in making decisions, for example on vaccinationpolicy.The contact network data enabled us to estimate the
generation-time interval distribution, as well as thematrices describing infections among sexes, and ageclasses. An analysis of the contact data shows that theinfectivity of most people peaks within two days fol-lowed by a gradual decline with instances of influenzatransmission even a week after the infector’s disease
initiation. This information should be coupled with thefact that it also takes several days (with a mean of 1.9days) for infected people to reach a clinic for diagnosisin the first place (other countries show similar patterns[22-24]). This fact can make control of the spread of theepidemic difficult as most of the infection occurs priorto diagnosis.High levels of heterogeneity in transmission were
observed when comparing different groups such asultra-orthodox Jews, soldiers, Arabs, and by looking atsexes. For example, after the initial infection of theultra-orthodox community (June 22nd) their infectionrate was higher than the general population. This com-munity is relatively isolated from the rest of the
Figure 8 Spatial spread of swine flu in sub-districts of Israel. The data are combined for each week up to week ten of the epidemic (weekthree had no cases in it and therefore isn’t displayed). The color of the region represents its rate of Influenza, from dark green - low rate (up to0.5 cases per 100,000 people) to red- high rate (5-6 cases per 100,000 people). The panes represent different weeks (A-first 26/4-2/5/2009, B-second 3-9/5/2009, C-fourth 17-23/5/2009, D-fifth 24-30/5/2009, E-sixth 31/5-6/6/2009, F-seventh 7-13/6/2009, G-eighth 14-20/6/2009, H-ninth 21-27/6/2009, I-tenth 28/6-4/7/2009). Also on the map five major cities of Israel are marked as dots; the cities are (from north to south): Haifa, Tel-Aviv, Jerusalem, Be’er-Sheva, Eilat.
Roll et al. BMC Infectious Diseases 2011, 11:92http://www.biomedcentral.com/1471-2334/11/92
Page 10 of 13
population, which may account for the delay in its infec-tion. However, ultra-orthodox Jews live in very densecommunities with relatively big households [26] whichwould lead to higher rates once infection commenced.A similar mechanism can also be postulated for the sol-dier sub-group - which has many internal connections.A group of soldiers living in close quarters in the USAhave also exhibited increased swine flu illness exposureand susceptibility [48]. In Israel, soldiers were infectedearly on in the epidemic via contacts with a group ofAmerican students and it is understood that this chance
initial event combined with their unique living quartersand behavior, is likely to be the explanation for theirhigh infection rates. All of these are possible explana-tions for the unusual age distribution found among theinfected Israeli population, as the soldiers all belong tothe 19-30 age group.In contrast, the Arab population - another relatively
isolated social group within Israel - showed significantlylower rates of infection throughout. It is possible thatduring the timeframe of this study the disease had yetto penetrate this social group. These results can demon-strate how in the initial phase of an outbreak - withindistinct social groups - different social groups can pre-sent different behaviors due to chance infection events.Another puzzling result concerns the male bias in thesex ratio of infections, a result also noted for otherinfectious diseases [49]. It is hypothesized that beha-vioral and physiological differences could result in thisgender bias [50,51]. Making use of this knowledge ofhow heterogeneity affects disease dynamics might beuseful in improving control, mitigation and policy pro-grams [52].The spatial analysis reveals that percentage of built
area and gross household income explain differences inthe prevalence of swine flu between regions. The first ofthese factors pinpoints the epidemic to those regionswhich are more densely populated - an attribute thatcan aid the rapid transmission of influenza. Higherincome families are inclined to travel more and come incontact with more people, both internally and abroad[50,53]. Thus, it is likely that persons from such families
Table 3 Global spatial autocorrelation computationsusing Moran’s I values
Week Moran’s I Z value P value
1 -0.035 0.398 0.690
2 -0.058 0.107 0.915
3 - - -
4 -0.023 0.616 0.538
5 -0.143 -1.019 0.308
6 -0.103 -0.563 0.573
7 0.176 2.752 0.006
8 0.141 2.061 0.039
9 0.004 0.675 0.500
10 0.401 4.787 <0.001
11 0.066 1.299 0.194
All weeks 0.194 4.267 <0.001
Displayed are the values of Moran’s I values calculated based on rates anddistances between sub-districts of Israel, for each of the initial 11 weeks of theepidemic (but the third week that had no cases). Also displayed is this valuefor the cumulative rates of all of the weeks. For each value of Moran’s I weshow the corresponding Z and P values.
Table 4 Values of AICc for models with different variables explaining spatial distribution of influenza in sub-districtsof Israel
Model parameters K AICc Delta AICc AICc weights Cumulative weights P-value Adjusted R2
Built area + income 4 1.16 0 0.55 0.55 0.000145 0.7327
Built area 3 3.81 2.66 0.15 0.7 0.000299 0.6201
Built area + income + household size 5 5.48 4.32 0.06 0.76 0.000676 0.7151
Built area + income + commuting 5 5.82 4.67 0.05 0.82 0.000766 0.7084
Built area + commuting 4 6.33 5.17 0.04 0.86 0.001147 0.6226
Commuting 3 6.75 5.59 0.03 0.89 0.001123 0.5378
Income + commuting 4 7.19 6.03 0.03 0.92 0.001614 0.6004
Built area + household size 4 7.59 6.43 0.02 0.94 0.001897 0.5895
Household size + commuting 4 8.11 6.95 0.02 0.96 0.002332 0.5752
Income 3 8.48 7.32 0.01 0.97 0.00247 0.4814
Income + household size 4 9.02 7.86 0.01 0.98 0.003359 0.5485
Income + household size + commuting 5 9.98 8.83 0.01 0.99 0.003381 0.6152
Built area + household size + commuting 5 10.97 9.81 0 0.99 0.004787 0.5892
Built area + income + household size + commuting 6 11.25 10.09 0 1 0.002689 0.6879
Household size 3 12.45 11.29 0 1 0.01569 0.3242
Temp 3 15.77 14.61 0 1 0.0798 0.1572
Built area + income + household size + commuting + temp 7 18.24 17.08 0 1 0.007742 0.6648
The analysis was conducted on 15 subdistricts with combinations of five explanatory variables (see text). The table displays the combination of the modelschosen, the number of parameter in each model (K), and their appropriate AICc, Delta AICc, AICc weights, cumulative weights, P-values and adjusted R2 values.
Roll et al. BMC Infectious Diseases 2011, 11:92http://www.biomedcentral.com/1471-2334/11/92
Page 11 of 13

are more likely to come in contact with an infected indi-vidual in the initial stages of an international outbreak.The central coastal plain of Israel, in and around the
city of Tel-Aviv, has consistently higher rates and per-haps acts as an initiation point for the spread to otherregions. This is also manifested by looking at the valuesof the spatial autocorrelation (Table 3). The centralcoastal plain of Israel is the cultural and business hub ofthe country; it is the most densely populated region,with more commuting into it from neighboring regions[54]. This region also houses the major international air-port of Israel, harbors most of the commerce and tradeof the country, and had milder temperatures duringthese eleven weeks. It is therefore unsurprising thatthere are higher rates of swine flu in this region as wellas it being an initiation point of the spread of the epi-demic to other regions in the country.
ConclusionsOur detailed contact networks enabled us to performunique analysis on the particular relationships betweendifferent groups of society (categorized by age, sex, eth-nicity, etc.). The analysis highlighted at-risk groups aswell as paths of spread between them, at this initialstage. As contact data is generally not available, fewsuch studies have been conducted. Such detailed infor-mation, if obtained and analyzed in real time has muchpotential in management and mitigation of an epidemicas it spreads.Our analysis made it possible to elucidate the spatio-
temporal dynamics of the initiation of this pandemic inIsrael. Examining the rates of influenza in differentregions of Israel as the pandemic developed uncoveredpatterns of spatial spread, as well as disease clusters.Correlating disease rates to various socio-economicalattributes of these regions suggested a potentialmechanism generating these spatial patterns. Such spa-tial analysis holds much promise for other epidemiologi-cal studies with available locality information.Gathering detailed data from different parts of the
world and looking for statistical universalities as well ascrucial differences should be of great value to bettercharacterize and improve our understanding of theinitial phase of the swine flu pandemic and forthcomingoutbreaks. Further work is also needed to evaluate thenext phase of the pandemic. We hope our contributionboth sheds light on the dynamics of swine flu and pro-vides methods for analyzing future pandemics.All authors declare no conflict of interests relating to
this article.
AcknowledgementsWe would like to thank the ICDC (Israel Center for Disease Control) and itsdirector Prof. Tamar Shohat, Maccabi Health Services and Dr. Varda Shalev.
This work was supported by the EU-FP7 Epiwork grant, the Israel ScienceFoundation and the Israel Ministry of Health. UR is supported by the AdamsFellowship Program of the Israel Academy of Sciences and Humanities. RY issupported by the Israel National Institute for Health Policy and HealthServices Research. We thank two anonymous reviewers for their suggestionsand comments.
Author details1Biomathematics Unit, Department of Zoology, Faculty of Life Sciences, Tel-Aviv University, 69978 Tel-Aviv, Israel. 2The Porter School of EnvironmentalStudies, Tel-Aviv University, 69978 Tel-Aviv, Israel. 3Central VirologyLaboratory, Ministry of Health, Chaim Sheba Medical Center, Tel-Hashomer.4School of Public Health, the Sackler Faculty of Medicine, Tel-Aviv University.5National Influenza Center, Central Virology Laboratory, Ministry of Health,Chaim Sheba Medical Center, Tel-Hashomer. 6Center for Risk Analysis, theGertner Institute, Chaim Sheba Medical Center, Tel Hashomer, Israel.
Authors’ contributionsMM, EM collected the data, and performed the laboratory tests, OB, UR, AH,RY, GK, LS constructed the database, UR, LS, AH, RY, GK & EM conceived anddesigned the experiments and analysis, UR, RY, OB, AH & GK analyzed thedata, UR, AH & LS wrote the paper
Received: 13 February 2011 Accepted: 14 April 2011Published: 14 April 2011
References1. Pandemic (H1N1) 2009 - update 58. [http://www.who.int/csr/don/
2009_07_06/en/index.html].2. Lipsitch M, Riley S, Cauchemez S, Ghani AC, Ferguson NM: Managing and
Reducing Uncertainty in an Emerging Influenza Pandemic. New EnglandJournal of Medicine 2009, 361(2):112-115.
3. Flahault A, Vergu E, Boelle PY: Potential for a global dynamic of InfluenzaA (H1N1). Bmc Infectious Diseases 2009, 9.
4. Morens DM, Taubenberger JK: Understanding Influenza Backward. Jama-Journal of the American Medical Association 2009, 302(6):679-680.
5. Dawood FS, Jain S, Finelli L, Shaw MW, Lindstrom S, Garten RJ,Gubareva LV, Xu XY, Bridges CB, Uyeki TM: Emergence of a Novel Swine-Origin Influenza A (H1N1) Virus in Humans Novel Swine-Origin InfluenzaA (H1N1) Virus Investigation Team. New England Journal of Medicine 2009,360(25):2605-2615.
6. Ahmed R, Oldstone MBA, Palese P: Protective immunity and susceptibilityto infectious diseases: lessons from the 1918 influenza pandemic. NatureImmunology 2007, 8(11):1188-1193.
7. Simonsen L, Clarke MJ, Schonberger LB, Arden NH, Cox NJ, Fukuda K:Pandemic versus Epidemic Influenza Mortality: A Pattern of ChangingAge Distribution. The Journal of Infectious Diseases 1998, 178(1):53-60.
8. Changes in reporting requirements for pandemic (H1N1) 2009 virusinfection. [http://www.who.int/csr/disease/swineflu/notes/h1n1_surveillance_20090710/en/].
9. Mendelson E, Mandelboim M, Grossman Z, Ram D, Hindiyeh M: Laboratorydiagnosis of influenza H1N1 2009 at the Central Virology Laboratory inIsrael during the first 12 weeks of the pandemic. Harefuah 2009,148:677-671.
10. Katriel G, Stone L: Pandemic Dynamics and the Breakdown of HerdImmunity. PLoS ONE 2010, 5(3):e9565.
11. Kermack WO, McKendrick AG: A Contribution to the Mathematical Theoryof Epidemics. Proceedings of the Royal Society of London Series A 1927,115(772):700-721.
12. White LF, Pagano M: A likelihood-based method for real-time estimationof the serial interval and reproductive number of an epidemic. Statisticsin Medicine 2008, 27(16):2999-3016.
13. Katriel G, Yaari R, Huppert A, Roll U, Stone L: Modelling the initial phase ofan epidemic using incidence and infection network data: 2009 H1N1pandemic in Israel as a case study. Journal of the Royal Society Interface2011, 8(59):856-867.
14. Zar JH: Biostatistical analysis. Upper Saddle River, N.J.: Prentice Hall;, 4 1999.15. Moran PAP: Notes on Continuous Stochastic Phenomena. Biometrika 1950,
37:17-33.16. Anderson DR: Model based inference in the life sciences, a primer on
evidence. New York, NY: Springer; 2008.
Roll et al. BMC Infectious Diseases 2011, 11:92http://www.biomedcentral.com/1471-2334/11/92
Page 12 of 13

17. Reichert T, Chowell G, Nishiura H, Christensen R, McCullers J: Doesglycosylation as a modifier of Original Antigenic Sin explain the caseage distribution and unusual toxicity in pandemic novel H1N1influenza? Bmc Infectious Diseases 2010, 10(1):5.
18. Carrat F, Vergu E, Ferguson NM, Lemaitre M, Cauchemez S, Leach S,Valleron AJ: Time lines of infection and disease in human influenza: Areview of volunteer challenge studies. American Journal of Epidemiology2008, 167(7):775-785.
19. Ammon A, Ciancio B, Coulombier D, Devaux I, Kreidl P, Plata F, Salminen M,Zucs P, H1N EWGIA: Preliminary analysis of influenza A(H1N1)v individualand aggregated case reports from EU and EFTA countries.Eurosurveillance 2009, 14(23).
20. Belgian working group on influenza A(H1N1)v: Influenza A(H1N1)v virusinfections in Belgium, May-June 2009. Eurosurveillance 2009, 14(28), pii=19270.
21. Weekly Report of pandemic influenza A(H1N1). [http://www.minsal.cl/].22. Influenza A(H1N1)v investigation teams: Modified surveillance of influenza
A(H1N1)v virus infections in France. Eurosurveillance 2009, 14(29):pii =19276.
23. Rizzo C, Declich S, Bella A, Caporali MG, Lana S, Pompa MG, Vellucci L,Salmaso S: Enhanced epidemiological surveillance of influenza A(H1N1)vin Italy. Eurosurveillance 2009, 14(27):6-9.
24. Lytras T, Theocharopoulos G, Tsiodras S, Mentis A, Panagiotopoulos T,Bonovas S, the inluenza surveillance report group: Enhanced surveillanceof influenza A(H1N1)v in Greece during the containment phase.Eurosurveillance 2009, 14(29):pii = 19275.
25. INSS: Middle East Military Balance - chapter Israel.Edited by: Studies TIfNS2009.
26. Levin H: Ultra orthodox employment. National economic council Ipmso;2009.
27. Miller MA, Viboud C, Balinska M, Simonsen L: The Signature Features ofInfluenza Pandemics - Implications for Policy. New England Journal ofMedicine 2009, 360(25):2595-2598.
28. Lau LLH, Cowling BJ, Fang VJ, Chan KH, Lau EHY, Lipsitch M, Cheng CKY,Houck PM, Uyeki TM, Peiris JSM, et al: Viral Shedding and Clinical Illness inNaturally Acquired Influenza Virus Infections. Journal of Infectious Diseases2010, 201(10):1509-1516.
29. Papenburg J, Baz M, Hamelin ME, Rheaume C, Carbonneau J, Ouakki M,Rouleau I, Hardy I, Skowronski D, Roger M, et al: Household Transmissionof the 2009 Pandemic A/H1N1 Influenza Virus: Elevated Laboratory-Confirmed Secondary Attack Rates and Evidence of AsymptomaticInfections. Clin Infect Dis 2010, 51(9):1033-1041.
30. Tandale B, Pawar S, Gurav Y, Chadha M, Koratkar S, Shelke V, Mishra A:Seroepidemiology of pandemic influenza A (H1N1) 2009 virus infectionsin Pune, India. Bmc Infectious Diseases 2010, 10(1):255.
31. Lee VJ, Yap J, Tay JK, Barr I, Gao QH, Ho HJ, Tan BH, Kelly PM, Tambyah PA,Kelso A, et al: Seroconversion and asymptomatic infections duringoseltamivir prophylaxis against Influenza A H1N1 2009. Bmc InfectiousDiseases 2010, 10:6.
32. Hsu SB, Hsieh YH: On the Role of Asymptomatic Infection in TransmissionDynamics of Infectious Diseases. Bulletin of Mathematical Biology 2008,70:134-155.
33. Patrozou E, Mermel LA: Does influenza transmission occur fromasymptomatic infection or prior to symptom onset? Public Health Reports2009, 124(2):193-196.
34. Fraser C, Donnelly CA, Cauchemez S, Hanage WP, Van Kerkhove MD,Hollingsworth TD, Griffin J, Baggaley RF, Jenkins HE, Lyons EJ, et al:Pandemic Potential of a Strain of Influenza A (H1N1): Early Findings.Science 2009, 324(5934):1557-1561.
35. Tuite AR, Greer AL, Whelan M, Winter AL, Lee B, Yan P, Wu J, Moghadas S,Buckeridge D, Pourbohloul B, et al: Estimated epidemiologic parametersand morbidity associated with pandemic H1N1 influenza. CMAJ 2009,cmaj.091807.
36. Cruz-Pacheco G, Duran L, Esteva L, Minzoni AA, Lopez-Cervantes M,Panayotaros P, Ortega AA, Ruiz IV: Modeling of the influenza A(H1N1)voutbreak in Mexico city, April-May 2009, with control sanitary measure.Eurosurveillance 2009, 14(26).
37. McBryde ES, Bergeri I, van Gemert C, Rotty J, Headley EJ, Simpson K,Lester RA, Hellard M, Fielding JE: Early transmission characteristics ofinfluenza A(H1N1)v in Australia: Victorian state 16 May - 3 June 2009.Eurosurveillance 2009, 14(42):pii = 19363.
38. Nishiura H, Castillo-Chavez C, Safan M, Chowell G: Transmission potentialof the new influenza A(H1N1) virus and its age-specificity in Japan.Eurosurveillance 2009, 14(22):4.
39. Nishiura H, Wilson N, Baker MG: Estimating the reproduction number ofthe novel influenza A virus (H1N1) in a Southern Hemisphere setting:preliminary estimate in New Zealand. The New Zealand Medical Journal2009, 122(1299):73-77.
40. White LF, Wallinga J, Finelli L, Reed C, Riley S, Lipsitch M, Pagano M:Estimation of the reproductive number and the serial interval in earlyphase of the 2009 influenza A/H1N1 pandemic in the USA. Influenza andOther Respiratory Viruses 2009, 3(6):267-276.
41. Chowell G, Nishiura H, Bettencourt LMA: Comparative estimation of thereproduction number for pandemic influenza from daily casenotification data. Journal of the Royal Society Interface 2007, 4(12):155-166.
42. Balcan D, Hu H, Goncalves B, Bajardi P, Poletto C, Ramasco JJ, Paolotti D,Perra N, Tizzoni M, Van den Broeck W, et al: Seasonal transmissionpotential and activity peaks of the new influenza A(H1N1): a MonteCarlo likelihood analysis based on human mobility. Bmc Medicine 2009, 7.
43. Hahne S, Donker T, Meijer A, Timen A, van Steenbergen J, Osterhaus A, vander Sande M, Koopmans M, Wallinga J, Coutinho R, et al: Epidemiologyand control of influenza A(H1N1)v in the Netherlands: the first 115cases. Eurosurveillance 2009, 14(27):2-5.
44. Charland KML, Buckeridge DL, Sturtevant JL, Melton F, Reis BY, Mandl KD,Brownstein JS: Effect of environmental factors on the spatio-temporalpatterns of influenza spread. Epidemiology and Infection 2009,137(10):1377-1387.
45. McCaw JM, McVernon J, McBryde ES, Mathews JD: Influenza: Accountingfor Prior Immunity. Science 2009, 325(5944):1071-1071.
46. Greenbaum JA, Kotturi MF, Kim Y, Oseroff C, Vaughan K, Salimi N, Vita R,Ponomarenko J, Scheuermann RH, Sette A, et al: Pre-existing immunityagainst swine-origin H1N1 influenza viruses in the general humanpopulation. Proceedings of the National Academy of Sciences of the UnitedStates of America 2009, 106(48):20365-20370.
47. Fraser C, Riley S, Anderson RM, Ferguson NM: Factors that make aninfectious disease outbreak controllable. Proceedings of the NationalAcademy of Sciences of the United States of America 2004,101(16):6146-6151.
48. Barrett JP, Rosen iM, Harris JR, Stout LR, Murphy RA, Martin DP: Respiratoryillnesses at the 2009 U.S. Army ROTC advanced camp. Military Medicine2010, 175(12):990-994.
49. Green MS: The male predominance in the incidence of infectious-diseases in children - a postulated explanation for disparities in theliterature. Int J Epidemiol 1992, 21(2):381-386.
50. Carlsson-Kanyama A, Linden AL: Travel patterns and environmentaleffects now and in the future: implications of differences in energyconsumption among socio-economic groups. Ecological Economics 1999,30(3):405-417.
51. Strachan NJC, Watson RO, Novik V, Hofreuter D, Ogden ID, Galan JE: Sexualdimorphism in campylobacteriosis. Epidemiology and Infection 2008,136(11):1492-1495.
52. Eisenberg JNS, Aiello AE, Spicknall IH, Monto AS, Reingold A: Protecting theHerd from H1N1. Science 2009, 326(5955):934-934.
53. Mallet WJ: Long-distance travel by low-income households. TransportationResearch Circular 2001, E-C026:169-177.
54. Israel Central Bureau of Statistics: Israeli annual statistical report. 2009.55. CDC: Director’s Update Brief novel 2009-H1N1. 2009.
Pre-publication historyThe pre-publication history for this paper can be accessed here:http://www.biomedcentral.com/1471-2334/11/92/prepub
doi:10.1186/1471-2334-11-92Cite this article as: Roll et al.: Onset of a pandemic: characterizing theinitial phase of the swine flu (H1N1) epidemic in Israel. BMC InfectiousDiseases 2011 11:92.
Roll et al. BMC Infectious Diseases 2011, 11:92http://www.biomedcentral.com/1471-2334/11/92
Page 13 of 13