Embed Size (px)
Citation preview

. . ,. 17, . 5, – 2003, 463–488
Research Article
Modelling urban growth and landscape changes in the Atlantametropolitan area
XIAOJUN YANG
Department of Geography and Environmental Studies, Florida StateUniversity, Tallahassee, FL 32306, USA; e-mail: [email protected]
and C. P. LO
Department of Geography, The University of Georgia, Athens, GA 30062,USA; e-mail: [email protected]
(Received 24 July 2001; accepted 15 October 2002)
Abstract. We use an urban growth model, closely coupled with a land transitionmodel, to simulate future urban growth in the Atlanta metropolitan area, one ofthe fastest growing metropolises in the United States during the past three decades.We calibrate the model with historical data that are extracted from a time seriesof satellite images. We design three specific scenarios to simulate the spatialconsequences of urban growth under different environmental conditions. The firstscenario is to simulate the continued growth trend by maintaining unchanged thecurrent conditions. The second scenario is to project the growth trend by takinginto consideration road development and environmental protection. The thirdscenario is to simulate the development trend by slowing down growth andchanging growth pattern. The first two scenarios demonstrate that uncheckedurban growth would result in the displacement of almost the entire naturalvegetation and all of the open space in the metro area. In contrast, the resultfrom the third scenario shows that much more greenness and open space, includingbuffer zones of large streams and lakes, could be preserved. Accordingly, the lastscenario should be the most desirable for the future urban growth of Atlanta. Wealso examine the model’s effectiveness as applied to the Atlanta area and suggestfuture research directions for more accurate simulations.
1. IntroductionOver the past 50 years, humans have substantially altered the surface of the
Earth, principally through agriculture, deforestation and urbanization. Rates ofdeforestation and the dedication of marginal lands to high-impact agriculture havevaried widely across the world, but there has been a uniform world-wide increase inthe number of people residing in cities. At the global scale, urbanization has shownno sign of slowing since World War II and is likely to continue unabated into thetwenty-first century. In 1950, only 29% of the world’s 2.5 billion population wereurban dwellers. By 2005, it is predicted that half of the 6.5 billion people of ourplanet will be living in cities for the first time in human history (United Nations
International Journal of Geographical Information ScienceISSN 1365-8816 print/ISSN 1362-3087 online © 2003 Taylor & Francis Ltd
http://www.tandf.co.uk/journalsDOI: 10.1080/1365881031000086965

X. Yang and C. P. L o464
1997). While most of the non-American cities have grown more compact and clus-tered, cities in the United States have been experiencing a process of acceleratedoutward growth with low-density suburbs spreading beyond the boundaries of centralcities to form larger metropolitan regions (Hartshorn 1992). Such growth of suburbs,sparked by a series of federal and state government policies, massive road buildingprojects, and automobile-dependent community planning, has transformed theAmerican landscape. Statistically, suburbanization was estimated to result in theconversion of more than 5500 acres (2226 ha) of farmland or open space into urbanuses in the United States each day (Kostmayer 1989), which profoundly altered thecharacter and state of the Earth’s surface. The escalating urban growth has oftenbeen viewed as a sign of the vitality of regional economy, but it has rarely been wellplanned, thus provoking concerns over the degradation of our environmental andecological health. Understanding the growth and change brought on by metropolitandevelopment is critical to those who study urban dynamics and those who mustmanage resources and provide services in these rapidly changing environments (Knox1993, Turner et al. 1993).Understanding the dynamics of complex urban systems and evaluating the impact
of urban growth on the environment involve procedures of modelling and simulationwhich require innovative methodology and robust techniques. A number of analyticaland static urban models have been developed that are based on diverse theoriessuch as urban geometry, size relationship between cities, economic functions andsocial and ethnic patterns with respect to city structures. But these models weredeveloped to explain urban expansion and evolving patterns rather than to predictfuture urban development. For understanding the spatial consequences of urbangrowth, a dynamic modelling approach is preferred (Meaille and Ward 1990,Grossmann and Eberhardt 1993, Batty and Longley 1994). In recent years, dynamicmodelling as a primary research field in geographical information science is rapidlygaining popularity among geographers and urban planners as tools for urban andlandscape simulation. Substantial research efforts have been directed to developdifferent dynamic models in relation to urban and environmental applications(Turner 1987, Meaille and Ward 1990, Batty and Xie 1994a and 1994b, Landis 1995,Veldkamp and Fresco 1996, Pijanowski et al. 1997, White and Engelen 1997, Clarkeand Gaydos 1998, Wu and Webster 1998, 2000, Li and Yeh 2000, Sui and Zeng 2001,Wang and Zhang 2001). A variety of such models, mostly cell-based, has beendeveloped as either stand-alone packages or subcomponents that are linked withdifferent software packages from GIS, visualization, or urban planning. They can becategorized as either stochastic, such as logit, Markov and cellular automata, orprocesses based, such as dynamic ecosystemmodel. These models have some commonfeatures such as the use of transition probabilities in a class transition matrix (Turner1987, Veldkamp and Fresco 1996), cellular automata (White and Engelen 1997, Battyet al. 1999), and the GIS weighted overlay approach (Pijanowski et al. 1997). Thesemodelling efforts have demonstrated different levels of success in their specificapplications.Among all the documented dynamic models, those based on cellular automata
(CA) are probably the most impressive in terms of their technological evolution inconnection to urban applications. A typical cellular automaton consists of fourprimary components: cells, states, neighbourhoods, and transition rules. Cells arethe smallest units of allowed states. The states of a cell can change in relation to itsneighbouring cells when a set of transition rules is applied uniformly. Cellular

Modelling urban growth of landscape changes in Atlanta 465
automata offer a framework for the exploration of complex adaptive systems becauseof CA’s advantage including their flexibility, linkages they provide to complexitytheory, connection of form with function and pattern with process, and their affinitieswith remotely sensed data and GIS (Torrens 2000). But the simplicity of cellularautomata has been considered as the greatest weakness for representing real cities.Fortunately, many research efforts have been made in order to improve the intricaciesof cellular automata model construction, particularly in the modification and expan-sion of transition rules to include such notions as hierarchy, self-modification,probabilistic expressions, utility maximization, accessibility measures, exogenouslinks, inertia, and stochasticity (Torrens and O’Sullivan 2001). These innovativetechnological advances have enabled cellular modelling to grow out of an earliergame-like simulator and evolve into a promising tool for urban growth predictionand forecasting, as demonstrated by recent research (Batty and Xie 1994a, Couclelis1997, White and Engelen 1997, Clarke and Gaydos 1998, Wu and Webster 1998, Liand Yeh 2000, Sui and Zeng 2001). Nevertheless, further research attention needs tobe shifted from technical modifications to models in several emergent key appliedareas such as explorations in spatial complexity, infusing cellular automata withurban theory, new strategies for validating cellular urban models, and scenario designand simulation in relation to urban planning practices (Torrens and O’Sullivan 2001).The current research focuses on the exploration of a cellular automata-based
dynamic modelling approach for applied urban studies using Atlanta as the studyarea (figure 1). For the past three decades, Atlanta has been one of the fastest growingmetropolisies in the United States as it emerged to become the premier commercial,industrial, and transportation urban centre of the south-east. Population increase27% between 1970–1980, 33% between 1980–1990 and 40% between 1990–2000.The city has expanded greatly as suburbanization consumes large areas of agriculturaland forest land adjacent to the city, pushing the periurban fringe farther and fartheraway from the original urban boundary. This rampant suburban sprawl has provokedconcerns over losses of large areas of primary forests, inadvertent climate repercus-sions, and the degradation of the quality of life in this region (Bullard et al. 2000).The Sierra Club’s 1998 Annual Report cited Atlanta as America’s most sprawl-threatened large city. On the other hand, because of the significant physical growth,Atlanta’s urban spatial structure and pattern have changed dramatically (Yang andLo 2002, Yang 2002), making the city a ‘hot spot’ in urban studies. Urban geographershave recognized Atlanta as one of the few typical post-modern metropolises in NorthAmerica (Hall 1998). Soja (1989) first used the term ‘post-modern’ to describe citiesthat have undergone restructuring in the United States after the rise of post-Fordistindustrial organization, which is characterized by a flexible subcontracted productionsystem based on small-size and small-batch units. Two typical forms of productionare labour-intensive craft (such as jewellery and garments) and high-technology(defence and aerospace industries). The spatial location of these production units isno longer tied to the older foci of Fordist production in the snowbelt in the UnitedStates. There has been a shift towards the sunbelt, leading to its re-industrialization.The emergence of post-Fordism has resulted in globalization and accelerated flowof global capital to these cities as well as an endless search for areas of cheap labourto locate these production units. The post-modern city exhibits unique urban forms,architectural styles, and socio-economic characteristics. Architecturally, it has multi-centred business districts with office glass towers and stylish buildings. Socially, it isincreasingly minoritized and polarized along class, income, racial and ethnic lines

X. Yang and C. P. L o466
Figure 1. Location of the study area that covers 10 counties under the Atlanta RegionalCommission (ARC) plus three additional counties (Coweta, Forsyth, and Paulding).These counties show similar growth pattern. The modelled area is a rectangle coveringthe 13 counties.
(Dear and Flusty 1998). The urban sprawl is the result of suburbanization madepossible by automobiles and highways. Thus emerged the edge cities at the intersec-tion of an urban beltway and a hub-and-spoke lateral road pattern (Garreau 1991).Los Angeles is in fact the typical post-modern city and is the ‘great grandaddy’ ofedge cities (Dear 2000). Garreau (1991) believed that ‘every American city that isgrowing, is growing in the fashion of Los Angeles’. This is certainly true of manycities in the United States sunbelt, and Atlanta is a good example of such a citybecause it exhibits all the characteristics of the post-modern city described above.

Modelling urban growth of landscape changes in Atlanta 467
Research on Atlanta’s internal structure has led to the formulation of the urbanrealms model to depict the multi-nuclei nature of the city in contrast to the conven-tional single-core urban form (Hartshorn and Muller 1989, Fujii and Hartshorn1995). Thus, Atlanta is an ideal city in which to study post-modern urban dynamicsand environmental consequences of accelerating urban growth. Since 1996, theauthors have conducted various research projects focusing on the understanding ofthe dynamics of change in Atlanta through the use of geographical informationtechnologies. This paper reports the result of urban growth simulation carried outwith a cellular automata model closely coupled with a land transition model, a keyelement of the above research effort. The primary objective of this work is to simulatethe spatial consequences of future urban growth under different planning scenariosconsidering specific environmental and development conditions, so that the beststrategy for growth could be adopted. We also examine the emergent urban spatialforms in relation to these scenarios. Furthermore, we analyse the model’s effectivenesswhen applied to the Atlanta area and suggest future research directions for moreaccurate simulations.
2. The dynamic urban growth modelThe research focus here is not the creation of a new model but the exploration
of an existing dynamic model for problem solving in applied urban studies. This isbuilt upon a self-modifying cellular automata urban growth model originallydeveloped by Keith Clarke at the University of California at Santa Barbara. Thereare a number of reasons leading to the choice of this model for the current research.First, the model is scale independent, dynamic, and future oriented, conforming tothe essential requirement of urban growth simulation in this project. The behaviourrules guiding urban growth in the model consider not only the spatial properties ofneighbouring cells but also existing urban spatial extent, transportation, and terrainslope. The transportation and terrain conditions are found to be significant factorsdriving landscape changes (Yang 2000). These behaviour rules therefore have realist-ically accounted for the driving forces in the formation of edge cities in a post-modern metropolis. The model (Version 2.1) allows Anderson Level I LandUse/Cover transition to be incorporated in the urban growth simulation (Andersonet al. 1976). This is a significant extension of the model’s earlier versions focusingon two land use/cover states only. The model can also modify itself if extensivegrowth or stagnation leads to aberrations from the linear normal growth develop-ment. This may be valuable for producing reasonable growth prediction. The modelcan be verified through rigorous past to present calibration using historical landuse/cover data. The model (Version 2.1) incorporates some rigid statistical measuresfor characterizing historical fit in the phase of model calibration. These contrastgreatly to many existing models which are largely game-like simulators without acomponent of rigid validity. Third, the model can be used to simulate urban growthunder different conditions by modifying some initial conditions and changing inputdata layers. This could be useful not only for guiding future urban planning practicebut also for studying metropolitan dynamics. Last, in contrast to many existingmodels that were developed by different research teams with essentially no reuse,this model’s design allows it to be applied to other regions with different datasets.This can save a great deal of labour and time in model design and programming,allowing researchers to concentrate on model calibration and validation as wellas scenario design and simulation. An earlier version of the model was tested to

X. Yang and C. P. L o468
demonstrate its usefulness for long-term urban growth prediction for San Franciscoand the Washington/Baltimore area (Clarke et al. 1997, Clarke and Gaydos 1998).Using Atlanta as the study area, this project investigates the effectiveness of themodel as a tool to imagine, test and choose between possible future urban growthscenarios in relation to different environmental and development conditions.Only a brief description of the self-modifying cellular automata urban growth
model is given here. More detailed explanation of the model can be found in Clarkeand Gaydos (1998) and Project Gigalopolis (1999). The model’s general structure isillustrated in figure 2. It consists of four major components: input, parameter initial-ization, growth computation, and output. Similar to other predictive models, thismodel requires some input data in order to initiate the simulation. Version 2.1 ofthis model requires an input of at least five types of eight-bit GIF format data. Ifland use/cover is being analysed, the input data should have six types of layers,
Figure 2. General structure of the self-modifying cellular automata urban growth model usedin the project.

Modelling urban growth of landscape changes in Atlanta 469
i.e. urban extent, road, land use/cover, slope, excluded areas, and background. Forall data layers, 256 possible values can be assigned. Zero is always assigned as a nullvalue while any number larger than 0 but equal to or smaller than 255 is treated aslive or existing value. A weighting system can be adopted for certain layers, in whichlarger values mean higher weights.A number of parameters must be defined by users before the model starts to run.
The number of Monte Carlo iterations to be specified is a very important parameter,determining the computation time and the simulation error level at large. There arefive growth control parameters to be initiated, namely, diffusion coefficient, breedcoefficient, spread coefficient, slope resistance, and road gravity. The diffusion coeffi-cient controls the overall dispersiveness of growth. The breed coefficient determineshow likely a newly generated, detached or road influenced settlement is to begin itsown growth cycle. The spread coefficient controls the amount of outward ‘organic’expansion. The slope resistance influences the likelihood of settlement extending upsteeper slopes. The road gravity encourages new settlements to develop near thetransportation network. These parameters must be determined with intensive modelcalibration in which each coefficient combination needs to be tested individually andthe modelled result is compared to historical urban and land use/cover data byusing statistical methods. The current version of the model computes a dozen or sostatistical scores for characterizing the historical fit in the phase of model calibration.The coefficient combinations resulting in the best overall statistical scores are selectedand the final values for these coefficients are then determined.The urbanization is the sum of the four types of growth: spontaneous, diffusive,
organic, and road-influenced. Spontaneous growth models the development of urbansettlements in undeveloped areas. Diffusive growth permits isolated cells to belocations for new urban spreading centres, but these cells must pass random testsfor the diffusion coefficient and slope suitability. Organic growth promotes theexpansion of established urban cells to their surroundings. Only undeveloped cellsthat have at least two urban neighbours and pass the spread coefficient and sloperesistance tests become a new urban location. Last, road influenced growth promotesurbanization along the transportation network because of increased accessibility.These newly urbanized cells must pass the random tests of breed coefficient, diffusioncoefficient, slope resistance, and road gravity. During the urban growth computation,a second level of growth rules, termed self-modification, is invoked if the model’sgrowth rate is larger or smaller than a critical number. In that case, the model willmodify certain parameters to emphasize trend. This component is quite importantto ensure reasonable results.The current version of the urban growth model can call and drive a land use/cover
transition model (termed land cover deltatron model or LCD), although the urbangrowth model can run independently. The general structure of the LCD modelconsists of a number of operations (Clarke 1997) as follows. First, select a pixel atrandom. This pixel must not be an urban pixel, nor a water pixel, nor a no-datapixel. Get this pixel’s land cover class. Select two transition classes at random. Theseclasses must not be urban, nor water, nor no-data, nor the current land cover class.Compare the slope of the selected pixel with the average slope of the two transitionclasses. The transition class whose mean slope is closer to the slope of the selectedpixel is then assigned as the new class. Second, draw a random value. If this valueis smaller than the transition probability for the transition class, then the programwill take the following actions: apply land cover transition to the selected pixel,

X. Yang and C. P. L o470
create land cover transition cluster of neighbourhood pixels through a random walk,and assign ‘ALIVE’ to corresponding pixels in ‘deltatron space’. Last, in deltatronspace, apply cellular automata growth rules to live pixels.The model generates both numeric and graphic outputs. The numerical outputs
include: (1) a log file containing standard model values for the stop year, one linefor each Monte Carlo iteration; (2) a log file containing the finishing values of self-modification coefficients at the stop year, one line for each Monte Carlo iteration;and (3) a file containing the start and stop times of the prediction run. The graphicoutputs include: (1) a map of predictive land use/cover uncertainty (cumulate); (2) acolour classified urban growth probability image written for the stop date only ifland use is modelled; (3) a colour classified map of the most probable predictiveland class type (cumulate); and (4) single year images of predictive output.
3. Model implementationWe installed and compiled the urban growth model (and also the land use/cover
transition model ) on a SUN UNIX workstation. Figure 3 illustrates the proceduresfor the model implementation in this project, which consist of four major components:(1) preparation of input data, (2) model calibration, (3) simulation of future urbangrowth, and (4) model output.
3.1. Model input dataIn order to run the model, we assemble six themes of the data, most of which
were produced by the authors through various research efforts (Yang 2000, 2002,Yang and Lo 2002). A list of the input data themes is given in table 1. The themeof land use/cover consists of five layers, each for 1973, 1979, 1987, 1993, and 1999(figure 4). They are produced from satellite images with the procedures described byLo and Yang (2000) and Yang (2000, 2002). The accuracy of these maps has exceededthe minimum accuracy requirement of 85% as stipulated in the Anderson classifica-tion scheme (Anderson et al. 1976). Since the LCD model used can only processland use/cover at Anderson Level I, two urban uses that were classified from satelliteimages have been combined into one class, namely, urban extent, which is codedas 1. Cropland/grassland is coded as 2, cultivated/exposed land is coded as 3, forestis coded as 4, and water is coded as 5. Coding land use/cover class in this way canensure a consistent colour coding system for output images. Because the currentversion of the LCD model can only accept two different layers, only the 1973 and1999 land use/cover maps are input into the model. The theme of urban extent is
Figure 3. General procedures for the model implementation.

Modelling urban growth of landscape changes in Atlanta 471
Table 1. List of the model input data, naming convention (structure and example) andschedule files.
Theme Name of layers Schedule filesNo. (no. of layers) Year Source(s)1 Format (structure and example) (example)
1 Urban extent 1973 classified from satellite raster location.urban.year.gif Name: urban.dates2(5) 1979 images atl240.urban.1999.gif Contents:
1987 (240 means the cell size) atl240.urban.1973.gif1993 atl240.urban.1979.gif1999 atl240.urban.1987.gif
atl240.urban.1993.gifatl240.urban.1999.gif
2 Land use/ 1973 classified from satellite raster location.landuse.year.gif Name: landuse.dates3cover (5) 1979 images atl240.landuse.1999.gif Contents:
1987 atl240.landuse.1973.gif1993 atl240.landuse.1999.gif1999
Name:landuse.classes4Contents:1 Urb URB2 Crop/Grass3 Cultivated/Exposed4 Forest5 Water EXC
3 ‘Roads’ (4)5 1973 AND global database rasterized location.roads.year.gif Name: roads.dates61987 updated with satellite (originally vector) atl240.roads.1999.gif Contents:1999 imagery; ARC 2025 atl240.roads.1973.gif2025 Regional atl240.roads.1987.gif
Transportation Plan atl240.roads.1999.gif
4 Slope (1) 1970s computed from raster location.slope.gif NAUSGS 7.5∞ DEM atl240.slope.gif
5 Excluded 1973 water classified from raster location.excluded.gif NAareas (2) and 1973 satellite image; atl240.excluded.gif
1996; 1996 public land and1999 forest; others
Hillshaded 1970s computed from raster location.slope.gif NArelief (1) USGS 7.5∞ DEM atl240.slope.gif
1The procedures for producing these input data layers were described by Yang (2000) andYang and Lo (2001).2At least four years of data are required for the model calibration (Project Gigalopolis
1999), but for future simulation, only the most recent one is required.3The current version of the model only accepts two layers of land use/cover. Here, the
1973 and 1999 land use/cover were used.4If land use/cover is not considered this file should be empty or removed from data
directory. URN (urban) and EXC (excluded) are the constant flags used by the model. TheURN identifies data that has already been included in urban input images; EXC indicatesland use/cover classes that need not be considered for land cover/use change. Most commonly,this will be the ‘water’ class (Project Gigalopolis 1999).5This theme also contains major nodes and large shopping malls (Yang 2000).6At least two ‘roads’ layers are required. Dates need not exactly match urban dates.
extracted from the above land use/cover maps. This theme consists of five layersrepresenting different dates, namely, 1973, 1979, 1987, 1993, and 1999.The theme of roads contains not only major highways but also node points and
large shopping malls. A driving force analysis conducted by the authors found thathighways, nodes, and shopping malls generally promote urban development inAtlanta (Yang 2000). For convenience, this theme is still named as roads. Four layersof roads are produced for 1973, 1987, 1999, and 2025. The roads are weightedaccording to their relative urban attractiveness. A width dimension is added to

X. Yang and C. P. L o472
Figure 4. Historical land use/cover maps covering the Atlanta area: 1973–1999. The boundaryof 13 counties in Atlanta is shown.
highways which are the centre line of roads, and nodes which are points. Thus,weighting buffers are applied to the highways and the nodes (table 2). The resultantbuffered features are further assigned different values (0<n<255) according to theirrelative importance before being converted into raster format. Because shoppingmalls are polygons, no buffering has been applied. But different values are alsoassigned for these polygons according to their relative size. The layers of shoppingmalls are also converted into raster format. Then, the raster layers of highways,nodes, and shopping malls in the same year are combined to form a single roadslayer. In this way, three roads layers were produced for 1973, 1987, and 1999.The roads layer for the year of 2025 is produced by overlaying the 1999 roadswith the improved roadways and new roadways according to the 2025 RegionalTransportation Plan (Atlanta Regional Commission, 2000). The buffer radii andvalues assigned for these proposed (expanded or new) roadways are given in table 2.Two layers of the excluded areas are produced (table 1). The first layer is a binary
image, consisting of the water classified in 1973 (from the 1973 land use/cover map)and public lands compiled in 1996 by the Georgia GIS Clearinghouse. The latterincludes national parks/refuge and wilderness areas, archeological sites/areas, historicsites, off-road vehicle sites/areas, wild and scenic areas, state parks, USDA land,wildlife management areas, other areas and county Parks. These areas are notallowed for urban development. This layer of the excluded areas is mainly used forthe model calibration and simulation for the period of 1974–1999. For prediction, a

Modellin
gurbangrowthoflandscapechangesinAtlanta
473
Table 2. Buffer radius and value assigned for creating ‘roads’ layer.
Highways Node points Shopping malls
Buffer Bufferradius Value radius Value Area (in Value
No Class* Description (in meter) assigned Class** Description (in meter) assigned 100 000 m2 ) assigned
1 I285 Interstate highway 60 200 junction2 I20/75/85 Interstate highway 60 150 1 (exit) 60 30 <1 2553 I575/675/975 Other Interstate Highways 60 150 inter-4 GA400/19 State highway 60 150 2 section 135 55 1–2 1755 Type 1 Other motor way 60 150 town6 Type 2 Federal highway dual 45 100 14 >20,000 90 40 2–4 150
carriage way7 Type 3 Federal highway 30 50 15 town8 Type 4 Regional road 30 15 50 >5000 60 30 <4 1009 Type 5 Local road 30 50 town10 D11 Digitized major highway 30 50 16 >1000 30 20 NA11 D22 Digitized highway 30 5012 Improved Highways expanded by 2025 60 220 NA13 New New roads by 2025 60 255
*Types 1–5 are based on AND global road database. D11 and D22 were two types of the highways that can be observed clearly from satelliteimages. They were created in this dissertation using on-screen digitizer. D11 is for digitized major highways whose reflectance is quite strong fromimages; D22 is for other digitized highways. No. 12 and 13 are based on the 2025 Regional Transportation Plan proposed by the Atlanta RegionalCommission (2000).**The class is based on AND global database. The population size of town where highways cross is also considered in the database.

X. Yang and C. P. L o474
second layer of updated excluded areas is produced, which come with a range ofvalues (0~100) indicating probabilities of exclusion. All excluded areas in the firstlayer are still preserved and assigned a value of 100. In addition, the second layer ofthe excluded areas contains three levels of buffer zones around major streams inAtlanta. Specifically, for the Chattahoochee River, the buffer zone within 50m isassigned a value of 100, meaning that this area is not allowed for urban developmentat all; the buffer zone between 50 and 100m is assigned a value of 60, indicating a60% probability of exclusion; and the buffer zone between 100 and 200m is assigneda value of 20, indicating a 20% probability of exclusion. For other large streams,the three levels of buffer zones are 0–30m (100), 30–60m (60), and 60–120m (20)(table 3).A layer of terrain slope is computed from the United States Geological Survey
7.5∞DEM data. The slope steepness is represented in percent. A layer of the hillshadedimage is computed from the USGS 7.5∞ DEM. This image shows the topographicrelief in the study area. We use this layer as a background image for visualizationpurposes only.To run the model, all the input data layers need to be standardized in terms
of data format, resolution, and dimension. In doing so, we convert all input layersinto a single raster format, namely, the ERDAS IMAGINE (raster) format. UnderIMAGINE, we further subset all images into the same dimension. Then, we resampleeach layer into three levels of spatial resolutions, namely 60m, 120m, and 240m.The next step is to convert these images into an 8-bit GIF format. The resultantGIF files are named according to the convention stipulated by the model (table 1).This ensured that the right input data layers are read by the model. After this, weprepare four types of schedule files (table 1). The model reads input data accordingto the contents in these schedule files.Before performing model calibration, we conduct a test run to determine if
everything works. The input data and the calibration file for this test run are shownin table 4. The test run is successful, indicating that everything is in the right place.
3.2. Model calibrationThe purpose of model calibration is to determine the best fit values for the five
growth control parameters including coefficients of diffusion, breed and spread, sloperesistance, and road gravity, with historical urban extent data and land use/cover asthe reference. The calibration primarily relies upon statistical measures of historicalfit although graphic calibration is also attempted. Because model calibration demandsintensive computational resources, the three-phase calibration has to be adopted,
Table 3. Buffer zones and assigned probability of exclusion for urban development.
River Buffer zones Assigned probability of exclusion
Chattahochee 0– 50 meters 10050–100 meters 60100–200 meters 20
Other large streams* 0– 30 meters 10030– 60 meters 6060–120 meters 20
*Extracted from the EPA River Reach File 3 (RF3) (see http://www.epa.gov/OWOW/gis/reach.html).

Modelling urban growth of landscape changes in Atlanta 475
Table 4. The test run and calibration runs: input data, calibration files, number of MonteCarlo iteration, computation time, and outputs.
Calibration runsParameter
Item Test Run Coarse Fine Final averaging
Input resolution (m) 240data urban extent (year)1 1973, 1979, 1987, 1993, 1999
land use/cover (year)2 1973, 1999‘roads’ (year) 1973, 1987, 1999excluded area stream buffered zones not consideredslope same (only one layer is available)hillshaded relief same (only one layer is available)
calibration calibrate3 3 1 1 1 1location4 atl240 atl240 atl240 atl240 atl240echo5 1 0 0 0 0seed6 2840 2840 2840 2840 2840number_of_times7 1 4 6 10 100diffusion_coeff_start 25 0 40 52 55diffusion_coeff_step 1 25 5 3 1diffusion_coeff_stop 25 100 60 58 55breed_coeff_start 10 0 0 2 8breed_coeff_step 1 25 5 3 1breed_coeff_stop 10 100 10 8 8spread_coeff_start 30 0 15 22 25spread_coeff_step 1 25 5 3 1spread_coeff_stop 30 100 35 28 25slope_resistance_start 70 0 40 47 53slope_resistance_step 1 25 5 3 1slope_resistance_stop 70 100 55 53 53road_gravity_start 100 0 80 90 100road_gravity_step 1 25 10 5 1road_gravity_stop 100 100 100 100 100
Number of iteration(s) 1 3125 900 243 1Computation time 2∞22◊ 14 445∞58◊ 5760∞14◊ 1112∞03◊ 104∞14◊Outputs both images only statistical files
and statisticfiles
1For the test run, all layers were read but only the 1973 layer was actually used for thesimulation.2The current version of the model accepts two layers of land use/cover only.3The urban growth model provides three modes: 1 is to calibrate, 2 is to predict, or 3 is
to test.4This refers to the Atlanta data, a naming convention stipulated by the model.5When the model is initiated, three options are provided: (0) To use existing ‘calibrate’
file; (1) To create new ‘calibrate’ file; and (2) To restart the program from where a modelingrun crashed.6These are about 1 percent of the total pixel numbers.7This number is for the Monte Carlo iterations.
which uses the input dataset with a spatial resolution of 240m only. An earlier testestimates that the time for completing the first stage of calibration using the 120mresolution dataset would be about 32 500 hours or 135 days given the availablecomputer resource (a Sun Ultra Model 1, with 143Mhz CPU and 64Mb RAM).Because of the time constraint and the limitation of computational resources, it is

X. Yang and C. P. L o476
impractical to use the other two datasets with higher spatial resolution for the modelcalibration. This issue will be further discussed in §5. The details concerning theinput data, the calibration files, and computation time for these calibrations aregiven in table 4.The first phase is the coarse calibration, in which the widest range and largest
value steps are tested with the calibration file given in table 4. The goal is to blockout the range for each control coefficient. As shown in table 4, the assigned valuesfor the five control coefficient cover the entire range of possible values (0~100).This range is determined by the system but it can be altered if necessary (see §4).The step specified here is 25 for each coefficient. This results in 55 for 3125 combina-tions. To reduce the computation time, a small value (4) is assigned for the numberof Monte Carlo computations (number_of_times). The resultant number of iterationsis 3125. The entire calibration computations last for about 14 446 minutes, or 10 days.The statistical fit measures are stored in a file called control.stats. Based on theweighted sums of all the statistical measures, three best combinations are identified.A closer look at these combinations leads to the observation that the values of thefirst four coefficients are highly consistent but the last one, namely, the road gravity,tends to be larger. Given the step used for each coefficient, which is 25, the rangesof diffusion coefficient, spread coefficient, and slope resistance are 25 (±12.5); theranges of breed coefficient and road gravity are 12.5 (±6.25).The second phase is the fine calibration. The result obtained in the coarse
calibration has been quite encouraging since the ranges are blocked within 25 forthese parameters. The goal for the fine calibration is to further narrow down theranges to about 10 or less (±5). In doing so, these coefficients are held to 2~4 steps,and increments of 5~10 are used (see table 4). Because fewer steps are used here,the resultant combinations of different coefficient values should decrease substantiallywhen compared to those in the coarse calibration. This means that the entirecomputation time should decrease proportionally. Thus, more times of Monte Carlocomputations (number_of_times) could be allowed to reduce the level of errors. Thenumber_of_times is therefore increased to 6. Given these conditions, the number ofiterations at this stage is 900, which is 2225 less than the number in the coarsecalibration. But the unit computation time increases since a slightly larger numberof Monte Carlo computations is used at this stage. The total computation time is5760∞14◊, or about 4 days. Using the weighted sums, the best three combinations areidentified. Based on these combinations, it is found that both the values of spreadcoefficient and slope resistance are still very consistent. Moreover, the other threecoefficients show narrower ranges. These results are also quite encouraging.The last stage is the final calibration, with the goal to determine the best
combination. To this end, these coefficients are held to two steps and 3~5 are usedas the increments (see table 4). This should result in a substantial reduction of thenumber of combinations when compared to the fine calibration. More time forMonte Carlo computations is possible. Thus, the number_of_times is increased to 10.Given these conditions, the number of iterations is 243. The total computation timeis 1112∞03◊, or 18.50 hours. Using the weighted sum of statistical measures, the bestcombination is identified, which has the following starting values: diffusion coefficient(55), breed coefficient (8), spread coefficient (25), slope resistance (53), and roadgravity (100).One more step is undertaken in order to get the starting values for future urban
growth simulation. The best values identified during the final calibration are actually
Modelling urban growth of landscape changes in Atlanta 477
the starting values of the control coefficients. Because of self-modification incorpor-ated in the model, these starting values tend to be altered when a run is completed.Thus, a coefficient may have different starting and finishing values for each run. Thefinishing values are better for future simulations, which are determined after aparameter averaging run. There are two steps followed. First, the best values derivedfrom the final calibration are used as the starting values for the five control coefficientsin order to simulate the urban growth during the period of 1974 to 1999. Thecalibration file for this run is given in table 4. Since only one combination is availablefor the computation, the number of times for Monte Carlo computations can beincreased in order to minimize the level of errors. Thus, a large number, namely,100, is used for the number_of_times. The finishing values of the control coefficientsare stored in a file named param.log. Then, these values are further averaged usingthe MEAN utility provided by the model. In this way, the final values of the controlcoefficients are determined: diffusion coefficient (71), breed coefficient (10), spreadcoefficient (32), slope resistance (73), and road gravity (100).
3.3. Model simulationSimulations have been attempted to model the urban growth and landscape
change from the past to the present and to project future changes for differentscenarios. The past to the present (1974–1999) simulation not only serves as a visualverification for the accuracy of the model calibration but also provides a historicalperception of urban development and landscape change. The final values determinedin §3.2 are used as the starting values for the control coefficients. The detailsconcerning the input data, self-modification constraints, control coefficients, andrandom samples for these runs are given in table 5. To minimize the uncertainty inthe simulation, 100 of Monte Carlo computations is used. The simulation is com-pleted after five hours. Some statistical measures for these runs are given in table 6.The output images for single years are organized into a movie by using a professionalanimation software package (see §4). The progressive urban growth and landscapechange from 1974 to 1999 is clearly visualized when running the movies. With thehistorical data as the reference (see figure 4), it is found that these simulated imagesrepresent the general trend of urban growth and landscape change quite well. Thisis particularly true for the urban growth along ( linear) transportation corridors andexisting urban centres. The issue of simulation accuracy will be further discussed in §5.Simulation of future changes is carried out with different planing scenarios. Three
major scenarios have been designed, each of which is linked with different conditionsfor future urban development (table 5). But there are several commonalities for allthe simulation runs here. The time span is the same, which is from 2000 to 2050.Because of the limitation in computation resources, only the dataset with 240mspatial resolution is used. The two input data layers, namely, slope and hillshadedrelief, are used without change for all the runs. The number of times of MonteCarlo computations is 100 and the random samples are 2840, or about 1% of thetotal pixel numbers available. These scenarios will be compared in terms of theirenvironmental and development conditions and results in §4.
4. ResultsThree possible planning scenarios for future urban development in Atlanta are
considered here. The first scenario assumes that the current growth trend wouldcontinue when environmental and developmental conditions do not alter. Thus, this

X. Yang and C. P. L o478
Table 5. The conditions and the computation time for each simulation.
Past to Future simulationsthe present
Items simulation Scenario 1 Scenario 2 Scenario 3
Time span 1974–1999 2000–2050Input data Resolution (m) 240
Urban extent (year) 1973 1999land use/cover (years) 1973, 1999‘roads’ 1973, 1987, and 1999 1999, 2025
1999excluded areas stream buffered zones not stream buffered zones
considered consideredslope same (only one layer can be chosen)hillshaded relief same (only one layer can be chosen)
Self critical_high 1.500 1.500modification critical_low 0.050 0.050constraints1 boom 1.010 1.010
bust 0.090 0.090critical_slope 21 10
Control diffusion 71/92 71/88 71/88 100/100coefficients2 breed 10/13 10/12 10/12 100/100
spread 32/41 32/40 32/40 15/15slope resistance 73/95 73/100 73/100 10/40road gravity 100/100 100/100 100/100 200/2003
Number of Monte Carlo computations 100Random samples 2840Computation time (hours) 5 7 8 8
1The definitions are: critical_high (when the growth rate exceeds this value, self-modification increases the control parameter values), critical_low (when the growth rate fallsbelow this value, self-modification increases the control parameter values), boom (value of themultiplier (greater than one) by which parameter values are increased when the growth rateexceeds critical_high), bust (value of the multiplier ( less than one) by which parameter valuesare decreased when the growth rate falls below critical_low), and Critical_slope(average slope at which system increases spread).2Both starting and ending values are given. It should be noted that the ending values
were the averaged values after100 times of Monte Carlo computations.3Program code was changed to allow up to 200 for road gravity.
scenario may be termed as ‘continuation’. The model is used to simulate the spatialconsequence for this scenario with almost the same initial conditions as those usedfor the past to the present simulation (table 5). The only difference is that the 1999urban extent data is used. This scenario assumes the continuation of urban sprawlas the factors for the growth of the post-modern metropolis remain unchanged andthe post-Fordist flexible production system continues to prevail globally. It providestherefore a benchmark for comparison with alternative growth strategies. Some ofthe most important statistical measures for this run are given in table 6. The simulatedurban area for 2050 would be 1 321 757 ha. The net increment in urban land between1999 and 2050 would be 955 761 ha, or 51 ha per day, representing an increase of261% for the entire period. As a result of such a dramatic growth, urban land wouldoccupy about 85.89% of the total modelled land by 2050. The number of urbanclusters would decrease from 19 815 in 1999 to 2234 in 2050; while the averaged sizeof each cluster would increase from about 25 ha in 1999 to 586 ha in 2050. This

Modelling urban growth of landscape changes in Atlanta 479
Table 6. Selected statistical measures for the simulations under different conditions given intable 5.
Future simulationsPast to the
Statistical measures1 present simulation Scenario 1 Scenario 2 Scenario 3
percent road 4.13 2.31 2.35 2.35pop 67 994.81 229 471.65 224 721.95 167 715.86edges 32 446.20 42 411.26 47 210.62 79 610.63clusters 6873.77 2233.75 2466.83 6919.99mean_cluster_size 9.12 101.67 90.09 23.62average_slope 4.87 8.29 8.09 4.48percent_urban 25.93 85.89 85.50 63.81rad 147.12 270.26 267.45 231.05diffusion 91.96 88.70 88.53 100.00breed 12.95 12.49 12.47 100.00spread 41.45 39.98 39.90 15.00slope_resistance 95.11 100.00 100.00 39.93road_gravity 100.00 100.00 100.00 200.00sng 901.48 529.94 512.54 895.02sdc 190.52 98.67 98.08 1510.49og 44 235.10 143 215.37 138 483.25 79 675.95rt 25.71 11.67 12.08 18.40
1The definitions of these abbreviations (Project Gigalopolis, 1999): percent road (percentof the number of road pixels divided by the total number of pixels in the whole image whichis subtracted by the number of pixels that are excluded from urban growth), pop (total numberof urban pixels), edges (number of urban to nonurban pixel edges), clusters (number of urbanpixel clusters), mean_cluster_size (average urban cluster size), average_slope (average slope ofurbanized size), percent_urban (percent of urbanized pixels divided by the number of pixelsavailable for urbanization), rad (the radius of the circle which encloses the urban area),diVusion (diffusion coefficient at control year), breed (breed coefficient at control year), spread(spread coefficient at control year), slope_resistance (slope resistance value at control year),road_gravity (road gravity value at control year), sng (cumulative number of urbanized pixelsby Spontaneous Neighborhood Growth), sdc(cumulative number of urbanized pixels byDiffusive Growth and Creation of a New Growth Center), og (cumulative number of urbanizedpixels by Organic Growth), and rt (cumulative number of urbanized pixels by Road InfluencedGrowth). All values given were the averaged values after 100 runs of Monte Carlo computa-tions. The values of the five control coefficients were the averaged finishing values.
means that smaller urban clusters would grow outward and join together to formmuch larger clusters, thus favouring the formation of more edge cities in the metro-polis. On the other hand, such massive growth of urban land would alter thelandscape structure substantially. The averaged slope steepness for urban land wouldincrease from 5.87% in 1999 to 8.29% in 2050, indicating that many forested areaswould be converted into urban use. Forest distribution in Atlanta has found a strongpositive relationship with terrain slope (Yang 2000). The dramatic change as pro-jected into the future 51 years can be perceived very well from the model’s visualoutputs for a single year. Some of these outputs are displayed in figure 5. Byevaluating these graphic outputs carefully, it is found that by approximately the year2025, a Los Angeles-like metropolis would emerge, characterized by huge urbanagglomerations. The vegetated area and open space in the 13 metro counties(excluding the north-western hilly area in the image) would be very limited.The second scenario considers future road development and environmental

X. Yang and C. P. L o480
Figure 5. Simulation of the spatial consequences of future urban growth and landscapechange in Atlanta for three different scenarios. The results of the first two scenariosare quite similar and visual discrimination is difficult. The boundary of 13 countiesis shown.
protection while other conditions used in the first scenario are still valid (table 5).This reflects an alternative growth strategy in which protection of the environmentis emphasized so that the city is more liveable. In order to address the problems ofair quality and traffic congestion in Atlanta (see Bullard et al. 2000), the AtlantaRegional Commission (ARC) adopted an air-quality-conforming 25-year RegionalTransportation Plan (RTP) on 22 March 2000 (Atlanta Regional Commission 2000).This plan includes some roadway improvements and construction including theNorthern Arc, the so-called ‘second loop’ highway in Atlanta. With this updatedinformation, a new ‘roads’ layer was prepared for the year of 2025 (see §3.1). On theother hand, environmental protection is another important concern for future urbandevelopment planning in Atlanta. Water conservation is a critical issue to ensureclean water supply throughout the region. The protection of lakes, rivers, and streamsis therefore a key step towards this goal. To implement this idea in the urbanmodelling, some buffered zones have been created along major streams and lakes.These buffered zones cover areas of 120 to 200m wide from the centre lines (or banks)of these streams (or lakes). These areas contain not only fresh water but also flood-plains and wetlands which are of great ecological value. Different probabilities ofexclusion for urban development are assigned for these buffered zones (see §3.1).Then, these buffered zones are combined with the existing layer of excluded areasto create a new file for future urban simulation under this scenario. In addition tothe conditions used for the first scenario, the second scenario uses one more ‘roads’layer (2025) and an updated layer of excluded areas (see table 1). The statistical

Modelling urban growth of landscape changes in Atlanta 481
measures for this run are given in table 6. Under this scenario, the projected urbanarea for 2050 would 1 294 375 ha. The net increase in urban land from 1999 to 2050would be 928 379 ha, or about 50 ha per day, representing an increase of 254% forthe entire period. By 2050, urban land would occupy about 85.5% of the entire area.The number of urban clusters would decrease from 19 815 in 1999 to 2466 in 2050;while the mean size of these clusters would increase from 25 ha in 1999 to 519 ha in2050. The mean slope steepness for urban land would increase from 5.87% in 1999to 8.9% in 2050. Some graphic outputs for a single year are illustrated in figure 5.The last scenario embodies an anti-growth strategy, which requires slowing down
the growth rate and altering the spatial pattern of growth while maintaining theliveability of the city. The model is used to simulate the spatial consequence of thisscenario with the environmental and development conditions given in table 5. Theproposed transportation improvements and new additions as well as environmentalconservation introduced in the second scenario are still valid here. The model runsfor the past two scenarios indicate that more than 99.5% of the urban growth areaccounted for by a single type of growth, namely, the organic growth (og). The threeother types of growth (spontaneous, diffusive, and road influenced) contributed toless than 0.5% of the growth (see table 6). The current scenario intends to suppressthe organic growth but encourage the other three types of growth. Thus, the expan-sion of existing urban cells to their surroundings (organic growth) should be reducedbut the development of urban settlements in undeveloped areas (spontaneous growthand diffusive growth) and the road-influenced growth should be increased. In thisway, more residential growth should be encouraged in the future simulations. Thisdesign is based on the finding that the low-density urban use (mainly residential )tended to develop away from existing large urban facilities in Atlanta (Yang 2000).To implement this idea in the simulation, some parameters are altered. The startingvalue of spread coefficient has been reduced to 15 but both diffusive and breedcoefficients are increased to 100. Given the road-influenced growth accounts for avery tiny share of total growth in the past two scenarios (table 6), the road gravityused in the current scenario has been raised to 200 with the change of the model’ssystem code. The historical urban development direction in Atlanta was towards thenorth (Yang 2000) but the first two scenarios show that southern Atlanta has morepotential for development. This may be related to the fact that the southern part isgentler and more suitable for future development according to the model’s growthcontrols. In the hope of encouraging more development in the northern part, thecurrent scenario adopts a reduced starting value for the slope resistance (10). Inaddition, the critical slope (a system constraint) is reduced to 10 in order to encouragemore development in steeper terrain (table 5). The statistical measures for this modelrun are summarized in table 6. Under this scenario, the projected urban land for2050 would be 966 043 ha. The net increase in urban land from 1999 to 2050 wouldbe 600 047 ha, or about 32 ha per day, representing an increase of 164% for theentire period. By 2050, urban settlements would occupy about 63.81% of the entiremodelled area. The number of urban clusters would decrease from 19 815 in 1999 to6933 in 2050; while the mean size of urban clusters would increase from 25 ha in1999 to 136 ha in 2050. The mean slope steepness for urban land would decreasefrom 5.87% in 1999 to 4.48% in 2050. Some graphic outputs for single years aredepicted in figure 5.The results from the first two scenarios are quite different when compared to
those from the third scenario (figure 5). The first two scenarios have shown similar

X. Yang and C. P. L o482
results, making visual discrimination impossible. But the second scenario wouldpreserve some buffer zones along large rivers, streams, and lakes quite well. Thesepreserved zones, although relatively small in area (about 27 358 ha), contain the mostimportant fresh water supply, wetlands, and floodplains for the metropolis. The firsttwo scenarios illustrate that the unchecked urban growth would displace almost theentire vegetation and open space in the metro area, with an exception in the north-western hilly area. The dramatic growth in urban land as projected under these twoscenarios would change the city’s spatial form substantially with numerous edgecities developed throughout a huge area. This would greatly deteriorate the qualityof life in Atlanta. In contrast, the third scenario allows 27% more greenness andopen space, including buffer zones of large streams and lakes. The urban growthrate would be cut down by 32% when compared to the first two scenarios. Therefore,the last scenario should be the most desirable one for planning future growth inAtlanta.Finally, for communicating the research results effectively, three animation
movies were produced with the use of a professional software package. In additionto the year-by-year graphic outputs, other elements, such as title, scale bar, legend,north arrow, etc., were also added. These movies provide really vivid insight intothe progressive growth and change in Atlanta.
5. DiscussionCoupling with a land cover transition model, the cellular automata urban growth
model originally developed by Keith Clarke has been used to simulate growth andchange in the Atlanta region with modest computational resources. The model’sstrength relies on the fact that such factors as urban extent, transportation gravity,slope resistance, and land transition probability can be incorporated, along withcomplicated types of urban growth and self-modification. In a rapidly suburbanizingcity such as Atlanta, urban extent primarily consists of residential use that is assumedto have a linear relationship with population distribution. Thus, by incorporatingurban extent, it means that the population distribution can be considered by themodel, in at least an indirect way. Different location conditions, such as roadnetworks, business centres, urban centres, etc., can be considered as gravity withvarious weights assigned according to their relative significance. The concept ofenvironmental protection can be incorporated within the model. These propertiesprovide a significant potential for modelling growth and changes under differentconditions. The model’s calibration functionality permits a valid linkage betweensimulation and ground truth, thus favouring more realistic predictions to be obtained.This property distinguishes the model from many game-like simulators which donot have any component of calibration. In addition, the model’s source code is open,allowing modification of the programme system. Thus, it is possible for users toupdate the model or add new components for improving the model’s performance.On the other hand, there is much room for refining the model to ensure better
results. This version (2.1) of the model demands intensive computational resources,which has prevented the model calibration and simulation from using the other setsof higher-resolution data (see §3.3). Higher-resolution calibration and simulationshould be more useful for analysing emergent urban spatial patterns and for examin-ing the environmental impacts of future urban growth. More efficient programmingstrategies, such as parallel computation, should be adopted for the future versionof the model. The 3.0 Beta version of the model (released in December 2000) has

Modelling urban growth of landscape changes in Atlanta 483
adopted some refinements—memory model, programme structure, modularity, mas-sively parllel processing, etc. (Project Gigalopolis 2001), which should help improvethe computational efficiency. Since the performance of model calibration can bescored by using a few major statistical measures, a future version of the model mightconsider a regroup or dismissal of some lesser statistical measures computed duringthe phase of model calibration for reducing computational burden. Examples ofthese less useful measures include: centre of gravity (x), centre of gravity (y), andstandard deviation averaged over (xy).Simulation accuracy is another concern. When using the satellite mapping prod-
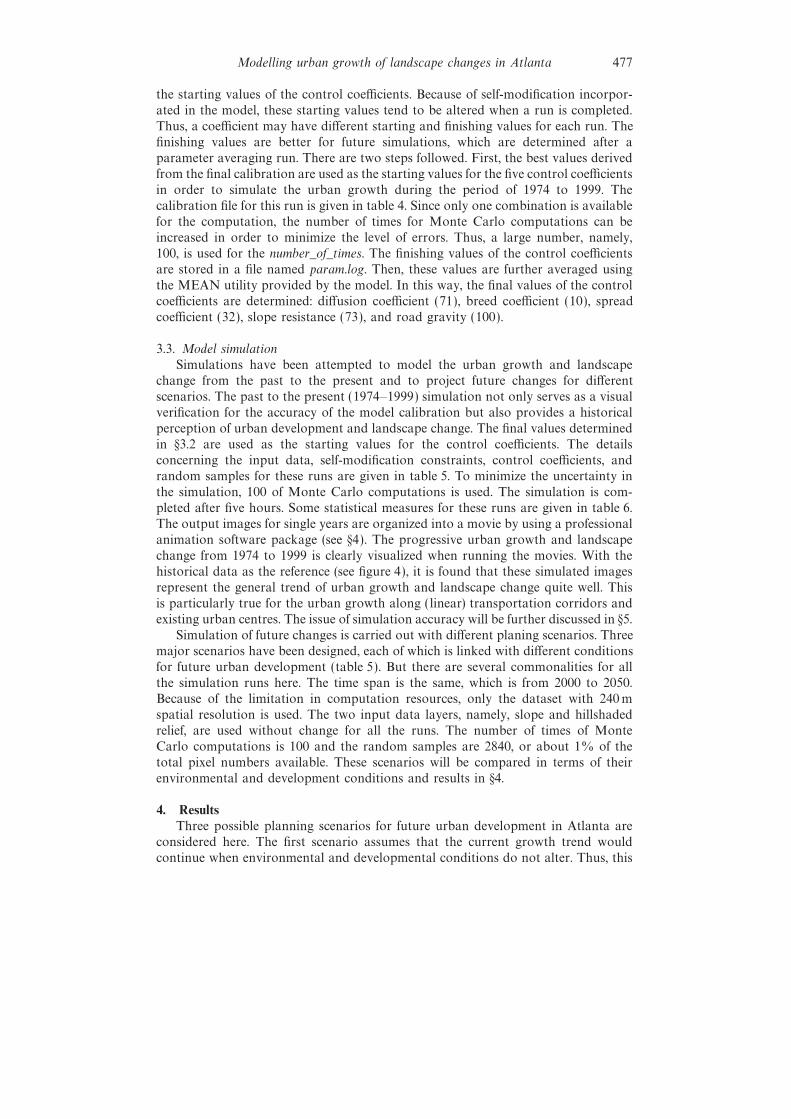
ucts as the reference, the land use/cover spatial patterns predicted through the pastto future simulation (see §3.3) exhibit various levels of discrepancy (figure 6). Inquantitative terms, 61.5 to 74.36% of the simulated land use/cover spatially fits withthe land use/cover distribution derived from satellite mapping (table 7). This resultshould be very encouraging, given the development status of dynamic modellingtechnologies (see also Wang and Zhang 2001). However, for the urban land inparticular, the spatial fit area was only 28.15 to 44.6% (table 7). There are somepossible reasons for this. First, although the model considers a range of variousfactors controlling new developments, there are some other factors that are notconsidered. These factors include, for example, urban or regional development
Figure 6. Comparison of the results from satellite mapping and from the past to currentsimulation. The discrepancy is shown in black.
X. Yang and C. P. L o484
Table 7. Spatial fit of the modeled results with the known land use/cover in different controlyears*.
Land use/cover
Cultivated/Urban Cropland/ exposed Total or
Comparisons use grassland land Forest Water mean
1979 modeled 8486 44 468 5356 198 101 4916 261 327spatial fit 3484 13 057 958 159 403 2804 179 706% correct 41.01 29.36 17.89 80.47 57.04 68.77
1987 modeled 22 255 44 300 5229 184 632 4911 261 327spatial fit 6264 22 927 1518 159 714 3911 194 334% correct 28.15 51.75 29.03 86.50 79.64 74.36
1993 modeled 33 774 44 050 5177 173 415 4910 261 326spatial fit 14 881 11 248 815 129 891 2709 159 544% correct 44.06 25.53 15.74 74.90 55.17 61.05
1999 modeled 45 598 43 578 5060 162 184 4907 261 327spatial fit 17 680 17 769 1468 123 315 4217 164 449% correct 38.77 40.78 29.01 76.03 85.94 62.93
*All the values given in this table are pixel numbers, with the exception of percentagevalues. The pixel size is 240 meter.
policies, human behaviour, tax, income, zoning, or race. These factors could besignificant for new development. Second, for application in rapidly suburbanizingcities such as Atlanta, the model’s transition rules for new urban development mayneed to be adjusted. The urban growth model overwhelmingly favours the so-called‘organic growth’, or expansion from established urban cells to their surroundings(see table 6). This growth pattern is generally true for the development of high-desnity urban uses such as commercial, industrial, and large transportation facilities.But for low-density urban uses dominated by residential, new developments tend tomove away from existing urban facilities in search of a better living environment,and thus, undeveloped areas are gaining popularity in Atlanta (Yang 2000). In thissense, the other three types of urban growth should be strongly encouraged. Thecurrent project has a scenario (the third one) addressing this issue. The resultsindicate that the other three types of growth, although increased in absolute develop-ment area, are still inadequately represented (see §4). Third, the model handles thegravity of ‘roads’ in their real dimensions. But in the real world, ‘roads’ impactsoften act within a buffer zone. Transportation has always been used as a consistentattractive factor for promoting urban development in the model. But in the studyarea, transportation has evolved from being a ‘pull’ force to becoming a ‘push’ forcefor housing development in recent years (Yang 2000). Last, given the significance ofthe model’s self-modification for new development, more tests in relation to real datashould be encouraged to determine the best values for self-modification constraints(other than the system default values). These factors as a whole may affect themodel’s performance when applied to the study area.
6. ConclusionThe escalating urban growth through the world has prompted concerns over the
degradation of our environmental and ecological health. Understanding the dynamicsof complex urban systems and evaluating the impact of urban growth upon the

Modelling urban growth of landscape changes in Atlanta 485
environment involve procedures of modelling and simulation, which require robustmethodology and techniques. In recent years, dynamic modelling was rapidly gainingpopularity among geographers and urban planners as a tool for urban and landscapesimulation. Cellular modelling as a popular dynamic modelling method has witnessedmuch technological advancement in the past ten years, enabling it to grow out ofan earlier game-like simulator and evolve into a promising tool for the explorationof complex urban systems.By using Atlanta as a study site, this project has led to the following conclusions
at the technological, theoretical, and application levels. At the technological level,the study has demonstrated the usefulness of cellular modelling and geographicalinformation technologies for urban and landscape scenario planning. The modelused here has been tested by its developers for long-term urban growth predictionin two study sites. From a user’s perspective, this study has moved forward toinvestigate the effectiveness of the model as a tool to imagine, test and choosebetween possible future urban growth scenarios in relation to different environmentaland development conditions. These scenarios represent different growth strategiesthat can be adopted by planners. This is an area on which substantial researchefforts need to be made in order to adopt cellular modelling technology for problemsolving in applied urban studies. Three major scenarios have been designed andsimulated by manipulating input data layers, self-modification constraints, andgrowth control coefficients. The results are quite encouraging, although more accur-ate simulations could be achieved if more growth constraints were considered andthe model’s transition rules were modified. On the other hand, the model uses aloose strategy to integrate with GIS in order to take full advantage of the existingtechnologies. The role of GIS and remote sensing in cellular automata-based urbanmodelling is indispensable, particularly for input data preparation, model calibrationand verification, emergent urban spatial pattern analysis, and growth impactassessment.At the theoretical level, this study has examined the spatial consequence of urban
growth for Atlanta, one of the few recognized typical post-modern metropolises inNorth America. The cellular automata modelling has been found to be the mostsuitable for use in simulating growth of a post-modern metropolis characterized byurban sprawl. Atlanta’s rapid change in spatial structure and pattern during the past30 years has enabled the city to become a ‘hot spot’ for urban dynamics studies. Themodel’s past to present simulation shows a clear multi-nucleating trend in theevolution of urban spatial form (figure 6), which is compatible with the findingsobtained by urban geographers (Hartshorn and Muller 1989, Fujii and Hartshorn1995) from social and economic perspectives. Thus, this simulation should be usefulfor characterizing post-modern urbanization in Atlanta. On the other hand, thefuture growth simulations further examine metropolitan dynamics under differentconditions. These simulations indicate that smaller urban clusters would grow out-ward and join together to form much larger clusters, which may favour the formationof numerous edge cities throughout the entire metropolis. This would change thecity’s spatial form substantially.At the application level, this study has established a well-documented regional
urban modelling case study focusing on Atlanta, a metropolis without any majornatural barriers. The three scenarios designed with different environmental anddevelopment conditions have largely represented the major possible planningstrategies for Atlanta. The first scenario simulated the continued growth trend if the

X. Yang and C. P. L o486
urban sprawl is allowed to continue. The second scenario projected the growth trendif future road development and environmental protection are considered. The thirdscenario simulated the development trend when the growth rate is slowed down andthe growth pattern is altered. Although with uncertainty, the three scenarios of futureurban growth simulation predict the general trends under different conditions verynicely. These results from the first two scenarios indicate Atlanta would be the next‘Los Angeles’ by approximately 2025 if the current rate and pattern of urban growthdo not alter. These will serve as a good warning to planners in Atlanta. In contrast,the result from the third scenario shows that much more greenness and open space,including buffer zones of large streams and lakes, could be preserved. Accordingly,the last scenario should be the most desirable for the future urban growth of Atlanta.This suggests a smart growth strategy with emphasis on environmental protectionso that the liveability of the city of Atlanta will be maintained for the futuregenerations. These findings should be useful both to those who study urban dynamicsand those who need to manage resources and provide services to people living inthis rapidly changing environment. Given that many major metropolises in theUnited States face the growing problems caused by restless suburban development,the technical frameworks developed in the current study focusing on Atlanta shouldbe applicable to those metropolises with similar growth styles. GIS-based dynamicmodelling can improve our understanding of variations in the nature-societydynamics of landscape, thereby facilitating a sophisticated approach to environmentalmanagement and sustainable development.
AcknowledgmentsFinancial support for this research were provided by the National Science
Foundation (NSF) through grant #9901082, the National Aeronautics and SpaceAdministration (NASA) through grant/contract #NAS8-97081, the American Societyfor Photogrammetry and Remote Sensing (ASPRS) through a Space Imaging Award(1998), the International Geographic Information Foundation (IGF) through a BestProposed Research Award (1999–2000), and the Creative and Scholarship Programat the University of West Florida. The authors also acknowledge the help given byProfessor James O. Wheeler, University of Georgia, for providing literature on post-modern urbanism in this paper.
ReferencesA, J. R., H, E. E., R, J. T., and W, R. E., 1976, A land use and land
cover classification system for use with remote sensor data. USGS Professional Paper964, Sioux Falls, SD, USA.
A R C (ARC), 2000, The 2025 Regional Transportation Plan.http://www.atlantaregional.com
B,M., and L, P., 1994, Fractal Cities: A Geometry of Form and Function (London:Academic Press).
B, M., and X, Y., 1994a, From cells to cities. Environment and Planning, B21, 531–548.B, M., and X, Y., 1994b, Modelling inside GIS: Part 2. Selecting and calibrating urban
models using ARC-INFO. International Journal of Geographical Information Systems,8, 451–470.
B,M., X, Y., and S, Z., 1999, Modelling urban dynamics through GIS-based cellularautomata. Computers, Environment and Urban Systems, 23, 205–233.
B, R. D., J, G. S., and T, A. O. (eds), 2000, Sprawl City: Race, Politics,and Planning in Atlanta (Washington, DC: Island Press).

Modelling urban growth of landscape changes in Atlanta 487
C, K. C., 1997, Land transition modelling with deltatrons. In Proceedings of theL and Use Modelling Workshop, web edition, Santa Barbara, California, June 1997.http://www.ncgia.ucsb.edu
C, K. C., and G, J., 1998, Loose-coupling a cellular automaton model and GIS:long-term urban growth prediction for San Francisco and Washington/Baltimore.International Journal of Geographic Information Science, 12, 699–714.
C, K. C., G, L., and H, S., 1997, A self-modifying cellular automaton modelof historical urbanization in the San Francisco Bay area. Environment and PlanningB, 24, 247–261.
C, H., 1997, From cellular automata to urban models: New principles for modeldevelopment and implementation. Environment and Planning B, 24, 165–174.
D, M. J., 2000, T he Post-modern Urban Condition (Oxford: Blackwell Publishers).D,M., and F, S., 1998, Post-modern urbanism. Annals of the Association of American
Geographers, 88, 50–72.F, T., and H, T., 1995, The changing metropolitan structure of Atlanta, Georgia:
locations of functions and regional structure in a multi-nucleated urban area. UrbanGeography, 16, 680–707.
G, J., 1991, Edge City: L ife on the New Frontier (New York: Doubleday).G,W.D., and E, S., 1993, Geographical information systems and dynamic
modelling potentials for a new approach. In Geographic Information Systems, SpatialModelling, and Policy Evaluation, edited by M. M. Fischer and P. Nijkamp (Berlin:Springer-Verlag), pp. 167–180.
H, T., 1998, Urban Geography (London: Routledge).H, T., 1992, Interpreting the City: An Urban Geography, 2nd edition (New York:
Wiley).H, T., and M, P., 1989, Suburban downtown and the transformation of
metropolitan Atlanta’s business landscape. Urban Geography, 10, 375–395.K, P. H., 1989, The American landscape in the 21st century. Congressional Record,
135, 18 May, 1989.K, P. L. (ed.), 1993, T he Restless Urban L andscape (Englewood Cliffs, NJ: Prentice-Hall ).L, J., 1995, Imaging land use futures: applying the California Urban Futures Model.
Journal of the American Planning Association, 61, 438–457.L, X., and Y, A., 2000, Modelling sustainable urban development by the integration of
constrained cellular automata and GIS. International Journal of GeographicalInformation Science, 14, 131–152.
L, C. P., and Y, X., 2000, Mapping the dynamics of land use and land cover change inthe Atlanta metropolitan area using time sequential Landsat images. In ASPRS 2000Proceedings (Bethesda, MA: American Society for Photogrammetry and RemoteSensing). (Published in CD form).
M, R., and W, L., 1990, Using geographical information systems and satelliteimagery within a numerical simulation of regional urban growth. International Journalof Geographic Information Systems, 4, 445–456.
P, B. C., L, D. T., G, S. H., and C, W. E., 1997, A land transformationmodel: conceptual elements, spatial object class hierarchies, GIS command syntax andan application for Michigan’s Saginaw Bay Watershed. http://www.ncgia.ucsb.edu/conf/landuse97/papers/pijanowski_bryan/paper.html
P G, 1999, The Clarke Urban Growth Model (Version 2.1).http://www.ncgia.ucsb.edu/projects/gig
P G, 2001, Urban Growth Model (UGM) Version 3.0 Difference BetweenVersion 2.0 and 2.1. http://www.ncgia.ucsb.edu/projects/gig
S, E., 1989, Post-modern Geographies: T he Reassertion of Space in Critical Social T heory(London: Verso).
S, M., and S, A. J., 1989, The geographical foundations and social regulation offlexible production complexes. In T he Power of Geography: How T erritory ShapesSocial L ife, edited by M. Dear and J. Wolch (Boston: Unwin Hyman), 21 pp.
S, D. Z., and Z, H., 2001, Modelling the dynamics of landscape structure in Asia’semerging desakota regions: a case study in Shenzhen. L andscape and Urban Planning,53, 37–52.
Modelling urban growth of landscape changes in Atlanta488
T, P. M., 2000, How cellular models of urban systems work, WP-28, Centre forAdvanced Spatial Analysis, University College London. http://www.casa.ucl.uk/how_ca_work.pdf
T, P. M., and O’S, D., 2001, Cellular automata and urban simulation: wheredo we go from here. Environment and Planning B, 28, 163–168.
T, B. L.,M, R. H., and S, D. L., 1993, Relating land use and global land-coverchange: A proposal for an IGBP-HDP core project. International-Geosphere-Biosphere Programme, IGBP Report No. 24, HDP Report No. 5.
T, M. G., 1987, Spatial simulation of landscape changes in Georgia: A comparison of3 transition models. L andscape Ecology, 1, 29–36.
U N, 1997, Urban Agglomerations 1996. United Nations Publications (ST/ESA/SER.A/163), Sales No. E.97. XIII.
V, A., and F, L. O., 1996, CLUE: A conceptual model to study the conversionof land use and its effects. Ecological Modelling, 85, 253–270.
W, Y., and Z, X., 2001, A dynamic modelling approach to simulating socioeconomiceffects on landscape changes. Ecological Modelling, 140, 141–162.
W, M., 1994, Operational urban models: state-of-the-art. Journal of the AmericanPlanning Association, 60, 17–29.
W, R., and E, G., 1997, Cellular automata as the basis of integrated dynamicregional modelling. Environment and Planning B, 24, 235–246.
W, F., and W, C. J., 1998, Simulation of land development through the integrationof cellular automata and multi-criteria evaluation. Environment and Planning B, 25,103–126.
W, F., and W, C. J., 2000, Simulating artificial cities in a GIS environment: urbangrowth under alternative regulation regimes. International Journal of GeographicalInformation Science, 14, 625–648.
Y, X., 2000, Integrating image analysis and dynamic spatial modelling with GIS in arapidly suburbanizing environment. PhD Dissertation, University of Georgia,Athens, Georgia.
Y, X., 2002, Satellite monitoring of urban spatial growth in the Atlanta metropolitan area.Photogrammetric Engineering and Remote Sensing, 68, 725–734.
Y, X., and L, C. P., 2002, Using a time series of normalized satellite imagery to detectland use/cover change in the Atlanta, Georgia metropolitan area. International Journalof Remote Sensing, 23, 1775–1798.