Embed Size (px)
Citation preview

Hindawi Publishing CorporationAdvances in Materials Science and EngineeringVolume 2013, Article ID 830891, 10 pageshttp://dx.doi.org/10.1155/2013/830891
Research ArticleIntegrating the TRIZ and Taguchi’s Method in the Optimizationof Processes Parameters for SMT
Yung-Tsan Jou,1 Wen-Tsann Lin,2 Wei-Cheng Lee,1 and Tsu-Ming Yeh3
1 Department of Industrial and Systems Engineering, Chung Yuan Christian University, Chung Li 32023, Taiwan2Department of Industrial Engineering and Management, National Chin-Yi University of Technology, Taichung 41170, Taiwan3Department of Industrial Engineering and Management, Dayeh University, Changhua 51591, Taiwan
Correspondence should be addressed to Tsu-Ming Yeh; [email protected]
Received 12 August 2013; Accepted 27 October 2013
Academic Editor: Caner Simsir
Copyright © 2013 Yung-Tsan Jou et al. This is an open access article distributed under the Creative Commons Attribution License,which permits unrestricted use, distribution, and reproduction in any medium, provided the original work is properly cited.
SMT is an assembly technology for core circuit board parts. Unless process parameters are effectively controlled, poor solderabilitymay result in a decline in product quality. This study looks at an SMT manufacturing process in a multinational company. First,the TRIZ contradiction matrix is revised to investigate the association between the 39 parameters in the contradiction matrix and13 parameters that influence the unevenness of solder paste in the solder paste printing process. Expert verification is then usedto screen the key factors affecting the quality of SMT, which are then combined with Taguchi’s method to identify the optimalparameter set influencing the thickness of SMT solder paste. Results. TRIZ identifies squeegee pressure, ejection speed, squeegeespeed, and squeegee angle as the four parameters with the greatest influence on SMT solder paste thickness. Taguchi’s methodis used to identify the optimum levels set for the experimental factors and carry out confirmation experiments. The S/N ratioimproved from 21.732 db to 26.632 db, while the mean also improved from the current 0.163mm to 0.155mm, close to the targetvalue of 0.15mm.The results show that applying TRIZ and Taguchi’s method for the purpose of product improvement is feasible.
1. Introduction
Today, product cycles are short and undergo rapid changes.Consumer electronic products, such as smart phones, note-book computers, and digital cameras, play an importantrole in our everyday lives. As consumers become moredemanding, there is an increasing emphasis on lighter,thinner, high quality, and low-priced products that can bedelivered to the consumer quickly. In addition, due to globalcompetition, businesses are increasingly demanding rigorousquality standards to meet customer’s demand [1, 2].
To meet the demand for light, thin, short, and smallelectronic products, print circuit boards (PCB) have evolvedfrom single-layer to multilayer boards, with a consequentreduction in their size. As a result, most traditional plated-through hole parts are gradually falling out of use. Aneffective solution to this is to attach electronic componentsonto the PCB, resulting in the development of surface mounttechnology (SMT). However, unless process parameters areeffectively controlled, poor solderability may result in a
decline in product quality. For example, if insufficient solderpaste is deposited at the PCB printing stage, the strengthof the solder joints may be inadequate or an empty solderphenomenon may occur. However, if too much solder pasteis deposited, bridges may form between the solder joints,leading to short circuits.
Yang et al. [3] point out that SMThas become the primarytool for PCB assembly. An SMT quality problem may causea significant production loss, and SMT quality issues arecrucial to competition between companies. In the researchon optimizing stencil printing, Tsai [4] offers a comparativeperspective, finding that in the SMT manufacturing process60% of stencil quality issues are caused by defects in solderpaste printing. In their research using Taguchi’s method toimprove the parameters of solder paste printer processes, Laiand Wang [5] use optimized printing parameters, leadingto an improvement of approximately 20% in solder pasteprinting quality. Recent studies on solder paste printingquality by Tsai [4] and Lai andWang [5] have both producedsignificant improvements in solder paste printing quality.

2 Advances in Materials Science and Engineering
Worsening feature
Improving feature
1 7 39
Weight of moving object
Volume of moving object Productivity
4Length of nonmoving object
5 Area of moving object 4, 7, 14, 17
39 Productivity
· · ·
· · ·
· · · · · ·
Source: http://www.innovation-triz.com/TRIZ40/
—
Figure 1: An example of the contradiction matrix.
However, they fail to explain how they selected their exper-imental variables. Many researchers, including Yildiz [6, 7],Durgun and Yildiz [8], and Yildiz and Solanki [9], haveapplied Taguchi’s method or algorithms to plan experimentsand parameter optimization in the past few years.
Andersen and Fagerhaug [10] argue that the TRIZcontradiction matrix is a tool for eliminating root causesof problems in the engineering process and can be usedto identify engineering parameters that cause engineeringproblems or conflicts. This study randomly selected 30 setsof data from the process-site and measured and calculatedthe process capability index as 𝐶pk = 1.24. This figuredoes notmeetKane’s [11] recommendedminimumacceptableprocess capability index of 𝐶pk ≧ 1.33, showing that thereis still significant room for improvement in the qualityof the solder paste printing process. Therefore, this studyattempts to combine TRIZ and Taguchi’s method to carryout empirical research. It is hoped that a predictive model ofthe manufacturing process outcomes can be used to identifyoptimized process parameters.
2. Literature Review
2.1. TRIZ. TRIZ is an abbreviation for the “theory of inven-tive problem solving” in the Russian language.The theorywasdeveloped by the Soviet inventor Altshuller [12] in 1946 withthe aim of solving different types of contradictions.
Altshuller [12] developed the concept of the “technicalcontradiction” after observing a large number of inven-tion proposals. The technical contradiction arises becauseimproving one technical system parameter impacts nega-tively on another one. For example, making a product lighterby reducing its thickness also makes the product more proneto being easily damaged [13]. However, using better materialsincreases the cost of manufacturing the product. Whenconfronted with a technical contradiction, a contradictionmatrix can normally be used to analyze the problem. Thus,the contradiction matrix is the key analytical tool of TRIZ,as well as a basic technique for technical deconstruction andinnovation.
The aim of TRIZ is to avoid conflicts between differ-ent elements. Hence, Altshuller identified 39 engineeringparameters that often produce technical contradictions. Inthe matrix, each cell indicates the principles used to resolve
these contradictions. The matrix provides a fast and simpleway to find solutions to technical contradictions. The matrixis a 39 × 39 matrix. To resolve the contradictions, Altshuller[14] proposed a set of 40 inventive principles. For eachcontradiction, several principles are suggested to resolve thecontradiction. Selecting relevant inventive principles can helpthe user to produce a solution to the contradictions.
Loh et al. [15] argue that TRIZ is a method of knowledgeextraction that can be applied systematically to resolve issuesin the area of innovation and improvement. Nakagawa [16]argues that TRIZ is an advanced methodology, which uses acontradiction matrix and 40 inventive principles to provideclear answers to complex problems.
Figure 1 shows an example of a contradiction matrix.In the example, for the improving feature of the area ofa moving object (5), the worsening feature is the volumeof the moving object (7). From the contradiction matrix,we can identify four inventive principles (4, 7, 14, and17) to resolve the contradiction. However, if we choosethe improving and worsening parameters of productivity(39), we find that the contradiction matrix shows a blankcell, indicating the absence of inventive principles that canprovide a solution to the problem. For information on thecontradiction matrix and inventive principles, please seehttp://www.innovation-triz.com/TRIZ40/.
2.2. Taguchi’s Method. Taguchi’s method is derived fromtraditional experimental design methods. This method wasdeveloped by Genichi Taguchi in 1949. When applied indesigning communication systems, it enables the number ofexperiments to be reduced and at the same time identifiesproblems in such systems [17]. The method advocates usingthe orthogonal array function combined with a simplefunction evaluation process to achieve improvements in themanufacturing process and product design [18].
Taguchi et al. [19] point out that Taguchi’s method usesparameter design to improve quality; that is, for producttarget functions that need improvement, the factors and levelsthat affect the target functions are identified. Subsequently,orthogonal arrays are used to determine the configurationof the experimental factors and the number of experimentsin order to obtain the same information provided by a fullfactorial experiment with a smaller number of experiments,
Advances in Materials Science and Engineering 3
analyzing a small amount of experimental data to increaseproduct quality effectively.
Zhang et al. [20] and Yildiz [21] point out that the maintools in Taguchi’s method are orthogonal arrays and 𝑆/𝑁ratios, emphasizing the importance of quality issues in theproduct or during the design and manufacturing process.A tolerance design is used to reduce product performancevariation. ANOVA is then used to find the level of influenceof each significant factor. The tolerance of each significantfactor is set based on the costs of each factor, ensuring thatproduct quality variation is minimal and achieving the mostappropriate level of quality, thereby realizing robust designobjectives.
Yildiz [22] points out that Taguchi’s method appliesengineering knowledge to experiment planning, focusingon solutions to achieve objectives. As the experimentalresults obtained by Taguchi’s experimental design methodshave a high degree of reproducibility, the configurationof experimental factors is straightforward, the number ofexperiments required is reduced, and the method of analysisis simple and easy to understand. Because of these advantages,Taguchi’s method has been applied in many industries toimprove and optimize design parameters. For instance, Suet al. [23] use Taguchi’s dynamic approach to increase opticalwhiteness effectively. Hong [24] uses Taguchi’s method toidentify important factors in market segmentation. In addi-tion, Celani de Souza et al. [25] have shown that Taguchi’smethod can improve the quality of dialysis. Yildiz [26] usesan immune algorithm and Taguchi’s method to design a newdesign optimization framework.
Taguchi’s method specifies the objective function as acertain signal-to-noise ratio (𝑆/𝑁 ratio). According to thismethod, the 𝑆/𝑁 ratio for different quality characteristics canbe separated into larger-the-better (LTB), nominal-the-best(NTB), and smaller-the-better (STB).This study is concernedwith improving the uniformity of solder paste thickness in thesolder paste printing process.Therefore,NTB is applied out ofthese quality characteristics. The calculation of the 𝑆/𝑁 ratiois shown in the following formula (1):
𝑆/𝑁NTB = 10 ⋅ log10 (𝑦2
𝑠2) , (1)
where 𝑦 is the sample mean and 𝑠 is the sample standarddeviation. The variability characteristic is inversely propor-tional to the 𝑆/𝑁 ratio. This means that a larger 𝑆/𝑁 ratiocorresponds to a more robust system.
3. Research Methods
TRIZ and Taguchi’s method are alternative experimentaldesign methods used by enterprises to develop new productsand improve product quality. The two approaches are oftenused separately. The TRIZ contradiction matrix enablestechnical variables that influence quality characteristics tobe quickly identified. Although such an approach is ableto identify inventive principles, it can only help users tospeculate about solutions.The twomethods show awide vari-ation in their experimental efficiency and additivity. Taguchi’s
method can identify a more optimal value from preset factorlevels. However, these variables do not necessarily have asignificant effect on quality characteristics.
Therefore, this study attempts to combine TRIZ andTaguchi’s method, screening variables that have a significantinfluence on quality characteristics by linking factors thatcause uneven solder paste in the solder paste printing processto the 39 engineering parameters in the TRIZ contradictionmatrix, before applying Taguchi’s method to the screenedvariables to identify the optimum process parameter set. Thesteps are as follows.
(1) Determine experimental variables: list the factorsaffecting the evenness of solder paste during thesolder paste printing process, integrate the 39 engi-neering parameters in the TRIZ contradiction matrixto create a correlation table and produce a ranking,screening the variables that have a significant effecton quality characteristics.
(2) Design and run experiment: use the orthogonalarray function from Taguchi’s method for experi-ment design, the number of repetitions, and conductthe experiment; calculate the 𝑆/𝑁 ratio and mean.Process managers, engineers, and quality assurancepersonnel select the levels based on the analysisand discussion of variables that have a significantinfluence and their range.
(3) Optimization analysis: a two-phase optimizationanalysis is carried out on experimental data to identifythe optimum combination and predict the optimummodel for the manufacturing process.
(4) Maximize the 𝑆/𝑁 ratio: this study uses the deltavalue and percent combination suggested by scholarsto select important influence factors. We identifiedexperiment factors with a delta value greater thanthe average effect value and a pooled error smallerthan 15% as important influence factors and the pointclosest to the target level as the optimum level ofinfluence factors.
(5) Move the mean closer to the target value: at this stage,the selection has no effect on the 𝑆/𝑁 ratio. However,factors that have a significant effect on the mean areadjustable,moving themean closer to the target value.
(6) Forecast optimization: applying the additive model,the expected 𝑆/𝑁 ratio and estimated mean for theoptimal combination condition are calculated basedon the set levels of the significant influence factors.
(7) Confirmation tests: confirmation experiments arerun on the optimum combination produced usingTaguchi’s method. This result is then compared withthe predicted results using Taguchi’s method to con-firm the improvement in results.
4. Case Study
4.1. Determine Experiment Variables. This study uses theSMT solder paste printing process for PCB production by
4 Advances in Materials Science and Engineering
Table1:Correlationtableb
etweenfactorsinfl
uencingtheu
neventhickn
esso
fsolderp
asteand39
technicalp
aram
eters.
Technical
parameters
Influ
ence
factors
12
34
56
78
910
1112
13
Work
temperature
Work
humidity
Solder
paste
type
Solder
paste
prop
ortio
n
Squeegee
angle
Squeegee
pressure
Squeegee
speed
Ejectio
nspeed
Solder
paste
poise
Stencil
tensity
Squeegee
stencil
thickn
ess
PCB
flatness
Working
platform
flatness
1 2∨
3∨
∨∨
∨
4∨
∨∨
∨
5∨
∨∨
∨∨
6∨
∨∨
∨∨
∨∨
7 8 9∨
∨∨
∨∨
10∨
∨
11∨
∨∨
∨∨
∨∨
∨
12∨
∨∨
∨∨
∨∨
∨∨
13∨
∨∨
∨∨
∨∨
∨∨
∨∨
14∨
∨∨
∨∨
∨∨
∨∨
15 16∨
17∨
18 19 20 21 22 23 24 25∨
∨∨
∨
26∨
∨∨
∨∨
∨∨
27∨
∨∨
∨∨
∨∨
∨∨
∨∨
∨∨
28∨
∨∨
∨∨
∨∨
∨
29 30∨
31∨
32 33 34 35 36

Advances in Materials Science and Engineering 5
Table1:Con
tinued.
Technical
parameters
Influ
ence
factors
12
34
56
78
910
1112
13
Work
temperature
Work
humidity
Solder
paste
type
Solder
paste
prop
ortio
n
Squeegee
angle
Squeegee
pressure
Squeegee
speed
Ejectio
nspeed
Solder
paste
poise
Stencil
tensity
Squeegee
stencil
thickn
ess
PCB
flatness
Working
platform
flatness
37∨
∨∨
∨
38∨
∨∨
39∨
∨
Num
bero
fcorrelations
42
67
1213
1112
109
79
7
Rank
ing
1213
118
21
42
56
86
8

6 Advances in Materials Science and Engineering
Squeegee pressure
Squeegee
Phase IPrinting motion
Phase IIPrinting motion
Phase IIIPrinting motion
Snap-off
GapPadPCB
Solder paste
Stencil
Stencil open holePrintdirection
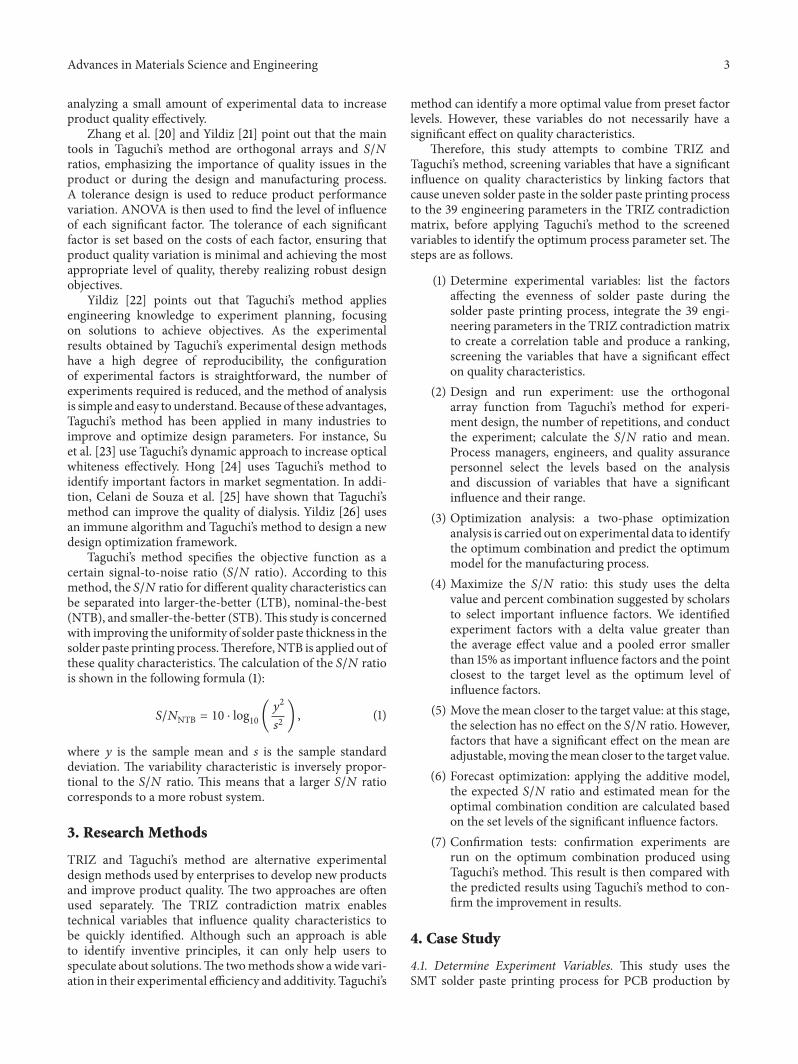
Figure 2: The solder paste printing process.
a multinational company as a case study to investigate theuniformity of solder paste application. The main purpose ofsolder paste in PCB is to fix parts to the PCB to ensure that theproduct functions normally. Solder paste printing is the firststage of the SMTmanufacturing process. A stencil and solderpaste printer squeeze are used to insert the solder paste ontocorresponding pads in the PCB through holes in the board.After removing the stencil, the solder paste is left on the pad inthe correct shape, completing the printing process, as shownin Figure 2.
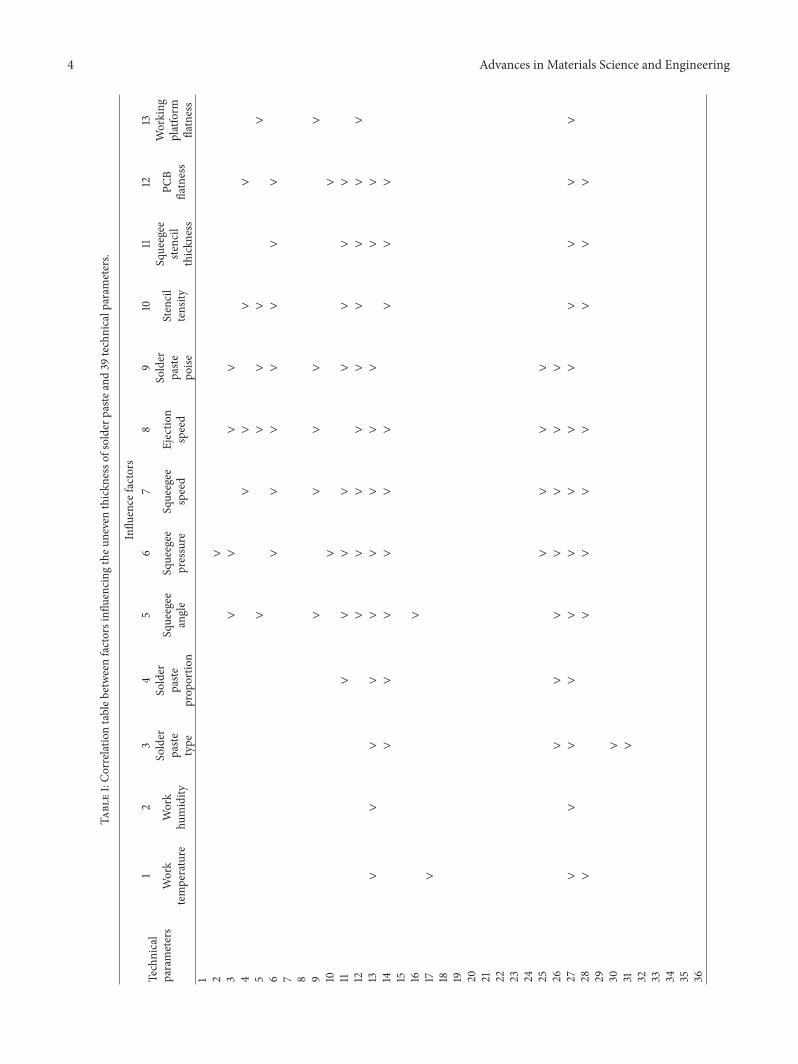
Table 1 shows 13 factors that directly influence the thick-ness of solder paste during the SMT solder paste printingprocess used in the production of printed circuit boardsas selected by process managers, engineers, and qualityassurance personnel in the plant. These are then combinedwith 39 technical parameters in the TRIZ contradictionmatrix to produce a correlation table showing the relationshipbetween the 13 factors and 39 technical parameters. Finally,we screen the squeegee angle, squeegee pressure, squeegeespeed, and ejection speed as the four variables that have asignificant influence on quality characteristics.
4.2. Design and Run the Experiment. We carry out the exper-iment on the squeegee angle, squeegee pressure, squeegeespeed, and ejection speed as the four variables that have asignificant influence on quality characteristics. The exper-imental design uses the 𝐿
9(34) orthogonal array function
proposed by Taguchi’s method. The process managers, engi-neers, and quality assurance personnel select the levels basedon the analysis and discussion of their range. Because thisstudy is aimed at improving the uniformity of solder pastethickness during the solder paste printing process, the qualitycharacteristic applied is that of nominal-the-best (NTB). Thecalculation of the S/N ratio is shown in formula (1).
Based on the influence factor and level settings, nine setsof parameter values are input into the solder paste printer tocarry out actual PCB printing. The experiment was repeatedfour times for each run order and the actual solder pastethickness data was recorded. The target value for solderpaste thickness is set at 0.15mm, with an upper limit of0.20mm and a lower limit of 0.10mm. Table 2 shows the𝐿9(34) orthogonal array and results for uniformity.
4.3. Optimization Analysis. Carry out optimization analysison the experimental data and predict the optimal model forthe experimental process.
4.3.1. Maximize the 𝑆/𝑁 Ratio. Analysis of the influence ofeach experiment factor (𝐴, 𝐵, 𝐶, and 𝐷) on the uniformitywas performed with an 𝑆/𝑁 response table, using a Minitab16 software package.
Table 3 shows the orthogonal array and associated exper-imental results for uniformity with calculated 𝑆/𝑁 ratios.The𝑆/𝑁 response table for uniformity is presented in Table 3.It shows the calculated 𝑆/𝑁 ratios for each level of experi-mental factors.The experimental factor that has the strongestinfluence is determined according to the value of delta asshown in Table 3. The value of delta equals the differencebetweenmaximum andminimum 𝑆/𝑁 ratios for a particularexperimental factor. The higher the value of delta, the moreinfluential the experimental factor. The experiment factorsand their interactions are sorted in relation to the values ofdelta.
Following Lee [27], Sheu [28], and Yang’s [29] recom-mendations, this study defines important influence factors asexperimental factors that have a value of delta greater thanthe average effect size. It can be seen from Table 3 that thestrongest influence was exerted by squeegee pressure (factor𝐴), squeegee angle (factor 𝐵), and ejection speed (factor𝐷).
The ANOVA procedure was used to investigate whichdesign parameters significantly affect quality characteristics.The procedure is performed by separating the total variabilityof the 𝑆/𝑁 ratios into contributions by each of the designparameters and the errors. The total variability of the 𝑆/𝑁ratio is measured by the sum of the squared deviations fromthe total mean 𝑆/𝑁 ratio.
Yildiz [30], Hong [24], Hsiang and Lin [31], and Suand Yeh [32] use percent contribution to carry out decisionmaking. Percent contribution is the pure sum to squares(purse SS) for each factor as a ratio of the total sum to squares(total SS). When the pooled error percentage (𝜌err) ≦ 15%, itcan be assumed that no important factors have been omittedfrom the experiment; in other words, pooled error factors arenot significant and can be neglected.
An examination of the calculated percent contributionfor all experiment factors also shows a very high influence offactor 𝐴, factor 𝐵, and factor 𝐶 on the 𝑆/𝑁 ratios (Table 4).
First, we find that the percent contributions of squeegeepressure (factor 𝐴), squeegee angle (factor 𝐵), and ejectionspeed (factor 𝐷) are 34.14%, 31.17%, and 19.81%, respectively.Second, the pooled error is less than 15% (14.88%).Therefore,we can assume that no important factors were missed. Byanalyzing the experiment factors and ANOVA, this studyshows that squeegee pressure (factor 𝐴), squeegee angle(factor 𝐵), and ejection speed (factor 𝐷) have significanteffects on the contraction rate.
Based on the above analysis, we are able to determine thatsqueegee pressure (factor 𝐴), squeegee angle (factor 𝐵), andejection speed (factor 𝐷) are important influence factors inthe present study.
Advances in Materials Science and Engineering 7
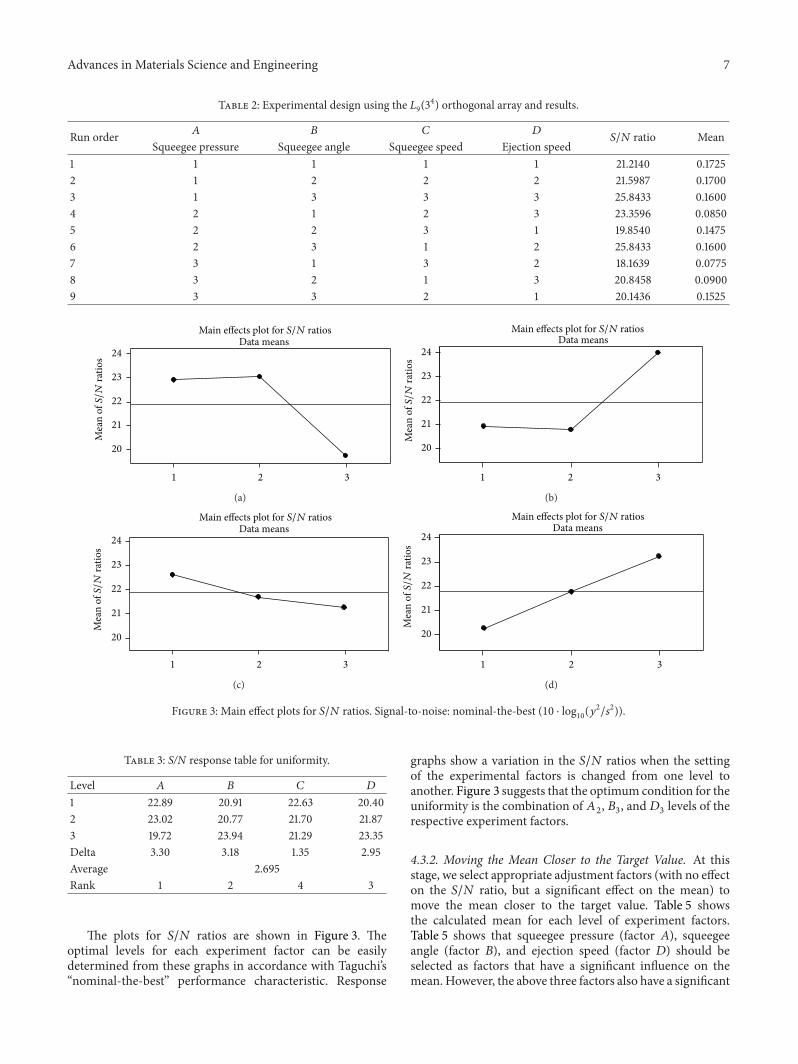
Table 2: Experimental design using the L9(34) orthogonal array and results.
Run order 𝐴 𝐵 𝐶 𝐷𝑆/𝑁 ratio Mean
Squeegee pressure Squeegee angle Squeegee speed Ejection speed1 1 1 1 1 21.2140 0.17252 1 2 2 2 21.5987 0.17003 1 3 3 3 25.8433 0.16004 2 1 2 3 23.3596 0.08505 2 2 3 1 19.8540 0.14756 2 3 1 2 25.8433 0.16007 3 1 3 2 18.1639 0.07758 3 2 1 3 20.8458 0.09009 3 3 2 1 20.1436 0.1525
321
24
23
22
21
20
Data meansMain effects plot for S/N ratios
Mea
n of
S/N
ratio
s
(a)
321
24
23
22
21
20
Data meansMain effects plot for S/N ratios
Mea
n of
S/N
ratio
s
(b)
321
24
23
22
21
20
Data meansMain effects plot for S/N ratios
Mea
n of
S/N
ratio
s
(c)
321
24
23
22
21
20
Data meansMain effects plot for S/N ratios
Mea
n of
S/N
ratio
s
(d)
Figure 3: Main effect plots for 𝑆/𝑁 ratios. Signal-to-noise: nominal-the-best (10 ⋅ log10(𝑦2/𝑠2)).
Table 3: S/N response table for uniformity.
Level 𝐴 𝐵 𝐶 𝐷
1 22.89 20.91 22.63 20.402 23.02 20.77 21.70 21.873 19.72 23.94 21.29 23.35Delta 3.30 3.18 1.35 2.95Average 2.695Rank 1 2 4 3
The plots for 𝑆/𝑁 ratios are shown in Figure 3. Theoptimal levels for each experiment factor can be easilydetermined from these graphs in accordance with Taguchi’s“nominal-the-best” performance characteristic. Response
graphs show a variation in the 𝑆/𝑁 ratios when the settingof the experimental factors is changed from one level toanother. Figure 3 suggests that the optimum condition for theuniformity is the combination of 𝐴
2, 𝐵3, and𝐷
3levels of the
respective experiment factors.
4.3.2. Moving the Mean Closer to the Target Value. At thisstage, we select appropriate adjustment factors (with no effecton the 𝑆/𝑁 ratio, but a significant effect on the mean) tomove the mean closer to the target value. Table 5 showsthe calculated mean for each level of experiment factors.Table 5 shows that squeegee pressure (factor 𝐴), squeegeeangle (factor 𝐵), and ejection speed (factor 𝐷) should beselected as factors that have a significant influence on themean. However, the above three factors also have a significant

8 Advances in Materials Science and Engineering
Table 4: Results of the analysis of variance for S/N ratios.
Source DF SS MS 𝐹 Pure SS Contribution (%)𝐴 2 20.949 10.475 7.33 18.891 34.14%𝐵 2 19.303 9.651 6.75 17.245 31.17%𝐷 2 13.016 6.508 4.55 10.958 19.81%𝐶 + error 2 2.058 1.429 — —Pooled error (2) (2.058) (1.429) 8.232 14.88%Total 8 55.326 55.326 100%
Table 5: Means response table for uniformity.
Level 𝐴 𝐵 𝐶 𝐷
1 0.1675 0.1117 0.1408 0.15752 0.1478 0.1358 0.1358 0.13583 0.1067 0.1575 0.1283 0.1117Delta 0.0608 0.0458 0.0125 0.0458
influence on the 𝑆/𝑁 ratio. Therefore, we do not select anyadjustment factors in this step.
Examination of the calculated percent contribution for allexperiment factors also shows a very high influence of factor𝐴, factor 𝐵, and factor𝐷 on the means: see Table 6.
First, we find that the percent contributions of squeegeepressure (factor 𝐴), squeegee angle (factor 𝐵), and ejectionspeed (factor 𝐷) are 44.29%, 23.96%, and 23.96%, respec-tively. From the aforementioned analysis, we are able todetermine that squeegee pressure (factor 𝐴), squeegee angle(factor 𝐵), and ejection speed (factor 𝐷) have significanteffects on the contraction rate for means.
Based on the previous discussion, this study sets theoptimal factor level to 𝐴
2𝐵3𝐶1𝐷3.
4.3.3. Forecast Optimization. Based on the previous discus-sion, this study sets the optimal factor level to 𝐴
2𝐵3𝐶1𝐷3.
Therefore, the additivemodel is used to estimate the expected𝑆/𝑁 ratio and mean under optimal conditions.
The mean 𝑆/𝑁 ratio for the nine experiments is 𝜂 =
21.874 db, and the predicted 𝑆/𝑁 ratio under optimal con-ditions is
𝜂 = 𝜂 + (𝐴2− 𝜂) + (𝐵
3− 𝜂) + (𝐷
3− 𝜂)
= 23.02 + 23.94 + 23.35 − (2 ∗ 21.874)
= 26.562 db.
(2)
Similarly, the mean observation for the nine experimentsis ̈𝑦 = 0.1350mm, and the predicted mean under optimalconditions is
𝑦 = ̈𝑦 + (𝐴2− ̈𝑦) + (𝐵
3− ̈𝑦) + (𝐷
3− ̈𝑦)
= 0.1478 + 0.1575 + 0.1117 − (2 ∗ 0.1350)
= 0.147mm.
(3)
4.4. Confirmation Tests. The confirmation experiment underoptimal conditions produced 25 individual values and 5 𝑆/𝑁
ratios. To confirm that optimal conditions can be reproduced,it is necessary to estimate the confidence interval of the 𝑆/𝑁and mean. Su [33] recommends using the formula proposedby Ross [34] to calculate the confidence interval in order tofacilitate confirmation experiments. Some scholars [35, 36]suggest that the 𝑆/𝑁 ratio should be within ±3 db of theoptimal value as the basis for assessing the confidence intervalin reproduced experiments. Therefore, combining the afore-mentioned recommendations, this study uses Ross’ proposedformula to calculate the confidence interval. However, whenthe calculated confidence interval exceeds ±3 db, the level isset at ±3 db:
CI = √𝐹𝛼,1,V2 × 𝑉𝑒 × [
1
𝑛eff+1
𝑟], (4)
where CI is the confidence interval, 𝐹𝛼,1,V2 is value 𝐹 at the
significance level,𝛼,𝛼 is the significance level,𝑉2is the degree
of freedomof the pooled error,𝑉𝑒is the variance of the pooled
error, 𝑛eff is the effective number of observations, and 𝑟 is thenumber of repeated confirmation experiments.
The 𝑆/𝑁 ratio and mean confidence intervals for confir-mation experiments under optimal conditions are
CI𝑆/𝑁
= √𝐹𝛼,1,V2 × 𝑉𝑒 × [
1
𝑛eff+1
𝑟]
= √18.51 × 1.429 × [7
9+1
5]
= 5.09 db,
(5)
as CI𝑆/𝑁
= 5.09 db > 3 db; therefore the 𝑆/𝑁 ratio confidenceinterval is ±3 db,
CImean = √𝐹𝛼,1,V2 × 𝑉𝑒 × [1
𝑛eff+1
𝑟]
= √18.51 × 0.000119 × [7
36+1
25]
= 0.023mm.
(6)
The average of the five confirmation experiments is asfollows: 𝑆/𝑁 ratio = 26.632 db and mean = 0.155mm. Thesetwo values fall entirely within the corresponding confi-dence intervals, indicating that the experiment achieved animprovement.The comparison of values before improvement

Advances in Materials Science and Engineering 9
Table 6: Results of the analysis of variance for means.
Source DF SS MS 𝐹 Pure SS Contribution (%)𝐴 2 0.005629 0.002815 23.70 0.005392 44.29%𝐵 2 0.003154 0.001577 13.28 0.002917 23.96%𝐷 2 0.003154 0.001577 13.28 0.002917 23.96%𝐶 + error 2 0.000237 0.000119 — —Pooled error (2) (0.000237) (0.000119) 0.000949 7.79%Total 8 0.012175 0.012175 100%
Table 7: Comparison of values before improvement (current),forecast optimization, and confirmation experiments.
Beforeimprovement(current)
Forecastoptimization
Confirmationexperiment
𝑆/𝑁 ratio 21.732db 26.562 db 26.632 dbMean 0.163mm 0.147mm 0.155mm
(current), forecast optimization, and confirmation experi-ments is shown in Table 7.
Confirmation experiments are run on the optimumcombination produced using Taguchi’s method. This resultis then compared with the predicted results using Taguchi’smethod to confirm the improvement in results.
5. Conclusion
In this study, the 𝑆/𝑁 ratio improved from 21.732 db to26.632 db, while the mean also improved from the current0.163mm to 0.155mm, indicating a reduced variation. Inaddition, the mean was closer to the target value (0.15mm),showing that applying TRIZ and Taguchi’s method forimproving the uniformity of solder paste thickness in thesolder paste printing process is feasible.
This study revised the TRIZ contradiction matrix toinvestigate the correlation between contradiction matrixparameters and parameters that directly influence the uneventhickness of solder paste in the solder paste printing process,screening the squeegee pressure, ejection speed, squeegeespeed, and squeegee angle as the key parameters affecting thequality of SMT solder paste thickness. This is an innovativeapproach that is empirically shown to be feasible.
Taguchi’s method is used to establish an optimal param-eter set from the experimental data, with the predictionerror rate reaching the required accuracy and deliveringreal improvements in process capability and product quality.These improvements can help lower the defect rate andreduce production costs, while shortening delivery timesand increasing customer satisfaction. These results may helpTaiwan’s SMT assembly factories to increase product quality,explore further different machines and productivity factors,and compare different level parameters to produce evenbetter process parameters for realizing additional qualityimprovements.
References
[1] W.-P. Wang, “Evaluating new product development perfor-mance by fuzzy linguistic computing,” Expert Systems withApplications, vol. 36, no. 6, pp. 9759–9766, 2009.
[2] A. R. Yildiz and K. Saitou, “Topology synthesis of multicompo-nent structural assemblies in continuum domains,” Journal ofMechanical Design, vol. 133, no. 1, Article ID 011008, 2011.
[3] T. Yang, T.-N. Tsai, and J. Yeh, “A neural network-basedprediction model for fine pitch stencil-printing quality insurface mount assembly,” Engineering Applications of ArtificialIntelligence, vol. 18, no. 3, pp. 335–341, 2005.
[4] T.-N. Tsai, “Modeling and optimization of stencil printingoperations: a comparison study,” Computers and IndustrialEngineering, vol. 54, no. 3, pp. 374–389, 2008.
[5] Y.-S. Lai and T. H. Wang, “Optimal design towards enhance-ment of board-level thermomechanical reliability of wafer-levelchip-scale packages,” Microelectronics Reliability, vol. 47, no. 1,pp. 104–110, 2007.
[6] A. R. Yildiz, “Hybrid taguchi-harmony search algorithm forsolving engineering optimization problems,” International Jour-nal of Industrial Engineering: Theory Applications and Practice,vol. 15, no. 3, pp. 286–293, 2008.
[7] A. R. Yildiz, “Optimization of cutting parameters in multi-passturning using artificial bee colony-based approach,” Informa-tion Sciences, vol. 220, pp. 399–407, 2013.
[8] I. Durgun and A. R. Yildiz, “Structural design optimization ofvehicle components using Cuckoo search Algorithm,”MaterialsTesting, vol. 54, no. 3, pp. 185–188, 2012.
[9] A. R. Yildiz and K. N. Solanki, “Multi-objective optimizationof vehicle crashworthiness using a new particle swarm basedapproach,” International Journal of Advanced ManufacturingTechnology, vol. 59, no. 1-4, pp. 367–376, 2012.
[10] B. Andersen and T. Fagerhaug, Root Cause Analysis: SimplifiedTools and Techniques, American Society forQuality,Milwaukee,Wis, USA, 2006.
[11] V. E. Kane, “Process capability indices,” Journal of QualityTechnology, vol. 18, no. 1, pp. 41–52, 1986.
[12] G. S. Altshuller,Creativity as an Exact Science, Gordon&BreachScience, New York, NY, USA, 1984.
[13] M. Sawaguchi, “A studay of systematic innovation based on ananalysis of big hits,” in Proceedings of the ETRIA TRIZ FutureConference, pp. 143–151, Bergmo, Italy, 2010.
[14] G. Altshuller, 40 Principles: TRIZ Keys to Technical Innovation,Technical Innovation Center, 1998.
[15] H. T. Loh, C.He, and L. Shen, “Automatic classification of patentdocuments for TRIZ users,” World Patent Information, vol. 28,no. 1, pp. 6–13, 2006.

10 Advances in Materials Science and Engineering
[16] T. Nakagawa, “Overall dataflow structure for creative problemsolving in triz/usit,” in Proceedings of the 7th TRIZCON Confer-ence, 2005.
[17] G. E. P. Box, J. S. Hunter, and W. G. Hunter, Statistics forExperimenters: An Introduction to Design, Data Analysis, andModel Building, John Wiley & Sons, New York, NY, USA, 2ndedition, 2010.
[18] A. R. Yildiz, “A new hybrid particle swarm optimizationapproach for structural design optimization in automotiveindustry,” Journal of Automobile Engineering, vol. 226, pp. 1340–1351, 2012.
[19] G. Taguchi, S. Chowdhury, and Y. Wu, Taguchi’s QualityEngineeringHandbook, JohnWiley& Sons,NewYork,NY,USA,2004.
[20] J. Z. Zhang, J. C. Chen, and E. D. Kirby, “Surface roughnessoptimization in an end-milling operation using the Taguchidesign method,” Journal of Materials Processing Technology, vol.184, no. 1-3, pp. 233–239, 2007.
[21] A. R. Yildiz, “A new hybrid artificial bee colony algorithmfor robust optimal design and manufacturing,” Applied SoftComputing, vol. 13, no. 5, pp. 2906–2912, 2013.
[22] A. R. Yildiz, “Hybrid Taguchi-differential evolution algorithmfor optimization of multi-pass turning operations,” Applied SoftComputing Journal, vol. 13, pp. 1433–1439, 2012.
[23] C.-T. Su, C.-M. Lin, and C.-C. Hsu, “Optimization of the opticalwhiteness ratio for flexible display by using Taguchi’s dynamicapproach,” IEEE Transactions on SemiconductorManufacturing,vol. 25, no. 1, pp. 2–15, 2012.
[24] C.-W. Hong, “Using the Taguchi method for effective marketsegmentation,” Expert Systems with Applications, vol. 39, no. 5,pp. 5451–5459, 2012.
[25] H. J. Celani de Souza, C. B. Moyses, F. J. Pontes et al.,“Molecular assay optimized by Taguchi experimental designmethod for venous thromboembolism investigation,”Molecularand Cellular Probes, vol. 25, no. 5-6, pp. 231–237, 2011.
[26] A. R. Yildiz, “A new design optimization framework basedon immune algorithm and Taguchi’s method,” Computers inIndustry, vol. 60, no. 8, pp. 613–620, 2009.
[27] H. H. Lee, Quality Management, Tsang Hai Book Publishing,Taipei, Taiwan, 2009.
[28] S. H. Sheu, The Management and Control of Quality, FutureCareer Publishing Corporation, Taipei, Taiwan, 2007.
[29] S. F. Yang, Quality Management, Hwa Tai Publishing, Taipei,Taiwan, 2006.
[30] A. R. Yildiz, “Comparison of evolutionary based optimizationalgorithms for structural design optimization,” EngineeringApplications of Artificial Intelligence, vol. 26, no. 1, pp. 327–333,2013.
[31] S.-H. Hsiang and Y.-W. Lin, “Optimization of the extrusionprocess for magnesium alloy sheets using the fuzzy-basedTaguchi method,” Arabian Journal for Science and Engineering,vol. 34, no. 1, pp. 175–185, 2009.
[32] C.-T. Su and C.-J. Yeh, “Optimization of the Cu wire bondingprocess for IC assembly using Taguchimethods,”Microelectron-ics Reliability, vol. 51, no. 1, pp. 53–59, 2011.
[33] C. T. Su, Quality Engineering, Chinese Society for Quality,Taipei, Taiwan, 2009.
[34] P. J. Ross, Taguchi Techniques for Quality Engineer, McGraw-Hill, New York, NY, USA, 1996.
[35] Y. M. Chen, Taguchi Methods, Tingmao, Taipei, Taiwan, 2012.
[36] K. Tatebayashi, Introduction TaguchiMethod, Union of JapaneseScientists and Engineers, Tokyo, Japan, 2004.

Submit your manuscripts athttp://www.hindawi.com
ScientificaHindawi Publishing Corporationhttp://www.hindawi.com Volume 2014
CorrosionInternational Journal of
Hindawi Publishing Corporationhttp://www.hindawi.com Volume 2014
Polymer ScienceInternational Journal of
Hindawi Publishing Corporationhttp://www.hindawi.com Volume 2014
Hindawi Publishing Corporationhttp://www.hindawi.com Volume 2014
CeramicsJournal of
Hindawi Publishing Corporationhttp://www.hindawi.com Volume 2014
CompositesJournal of
NanoparticlesJournal of
Hindawi Publishing Corporationhttp://www.hindawi.com Volume 2014
Hindawi Publishing Corporationhttp://www.hindawi.com Volume 2014
International Journal of
Biomaterials
Hindawi Publishing Corporationhttp://www.hindawi.com Volume 2014
NanoscienceJournal of
TextilesHindawi Publishing Corporation http://www.hindawi.com Volume 2014
Journal of
NanotechnologyHindawi Publishing Corporationhttp://www.hindawi.com Volume 2014
Journal of
CrystallographyJournal of
Hindawi Publishing Corporationhttp://www.hindawi.com Volume 2014
The Scientific World JournalHindawi Publishing Corporation http://www.hindawi.com Volume 2014
Hindawi Publishing Corporationhttp://www.hindawi.com Volume 2014
CoatingsJournal of
Advances in
Materials Science and EngineeringHindawi Publishing Corporationhttp://www.hindawi.com Volume 2014
Smart Materials Research
Hindawi Publishing Corporationhttp://www.hindawi.com Volume 2014
Hindawi Publishing Corporationhttp://www.hindawi.com Volume 2014
MetallurgyJournal of
Hindawi Publishing Corporationhttp://www.hindawi.com Volume 2014
BioMed Research International
MaterialsJournal of
Hindawi Publishing Corporationhttp://www.hindawi.com Volume 2014
Nano
materials
Hindawi Publishing Corporationhttp://www.hindawi.com Volume 2014
Journal ofNanomaterials