Embed Size (px)
Citation preview
Research ArticleHybrid Algorithms for Fuzzy Reverse SupplyChain Network Design
Z H Che1 Tzu-An Chiang2 Y C Kuo1 and Zhihua Cui34
1 Department of Industrial Engineering and Management National Taipei University of Technology Taipei 10608 Taiwan2Department of Business Administration National Taipei College of Business Taipei 10051 Taiwan3 Complex System and Computational Intelligent Laboratory Taiyuan University of Science and Technology Taiyuan 030024 China4 State Key Laboratory for Novel Software Technology Nanjing University Nanjing 210023 China
Correspondence should be addressed to Z H Che zhchentutedutw
Received 11 October 2013 Accepted 23 December 2013 Published 24 April 2014
Academic Editors J Liu and K Matsumoto
Copyright copy 2014 Z H Che et alThis is an open access article distributed under theCreativeCommonsAttribution License whichpermits unrestricted use distribution and reproduction in any medium provided the original work is properly cited
In consideration of capacity constraints fuzzy defect ratio and fuzzy transport loss ratio this paper attempted to establishan optimized decision model for production planning and distribution of a multiphase multiproduct reverse supply chainwhich addresses defects returned to original manufacturers and in addition develops hybrid algorithms such as ParticleSwarm Optimization-Genetic Algorithm (PSO-GA) Genetic Algorithm-Simulated Annealing (GA-SA) and Particle SwarmOptimization-SimulatedAnnealing (PSO-SA) for solving the optimizedmodel During a case study of amulti-phasemulti-productreverse supply chain network this paper explained the suitability of the optimized decision model and the applicability of thealgorithms Finally the hybrid algorithms showed excellent solving capability when compared with original GA and PSOmethods
1 Introduction
Many scholars have been devoted to the study of positivesupply chains for instance [1ndash5] however the reverse supplychain has seldom been involved Dowlatshahi [6] pointedout that reserve logistics which is a new concept in logisticsand supply chainmanagement offer efficient reverse logisticsmanagement that could improve the competitive power ofthe enterprises especially when they face fierce competitionwith low-margin profits Notwithstanding price and qualityas important influential marketing factors within a complexproduct path business operations should focus on howto offer improved after-sale services to customer Settingits target on household appliances and computers in 3C(Computers Communications Consumer Electronics)
Shih [7] discussed the reverse logistics system for end-of-life of products viewing reverse logistics systems as acrucial element of future business operations more effortsshould be made in reutilization rework and recycling atend-of-life [8] reverse logistics is a process of recyclingand refabricating materials [9] reverse logistics is helpfulto protect environments and reduce waste of resources
thus providing an opportunity for the reutilization of prod-ucts Ko and Evans [10] proposed a positive and a reversesupply chain network based on a third partyrsquos logisticsand constructed a mixed-integer nonlinear planning modelof a dynamic integrated distribution network taking intoaccount a two-echelon supply chain network and capacityconstraints underlining the significance of returning thedefective products to the suppliersrsquo partners In addition thedefect ratios and transport loss ratios are fuzzy values in thereal-world supply chain environments Fuzzy defect ratiosand fuzzy transport loss ratios thus are included in thisreverse model for meeting actual conditions
Thus this paper focuses on the reverse supply chain andconstructs an optimized decision model for the selection ofsupply chain partners as well as determination of productionand distribution quantities Multiechelon logistics issuescould be regarded as a Knapsack of a multiple selectionportfolio and resource distribution as a NP-hard issue [11]however the reverse supply chain is more complex in thispaper with production defect ratios transport loss ratios anddesignated reprocessing are considered
Hindawi Publishing Corporatione Scientific World JournalVolume 2014 Article ID 497109 16 pageshttpdxdoiorg1011552014497109
2 The Scientific World Journal
GAs have beenwidely used in solving real-world complexoptimization problems [12ndash16] and Min et al [17] Sha andChe [18] Tsai [19] Ko and Evans [10] Min et al [20]Che and Chiang [21] and Che and Chiang [22] appliedGA to solve the planning issues of a supply chain networkMoreover PSOs also have been widely employed for solvingoptimization problems in different fields and some heuristicalgorithms with similar concept of PSO are developed [23ndash30] Yin and Wang [31] Yu and Fang [32] Chen et al[33] Che and Cui [34] and Che [35] employed a PSO tooptimize a resource distribution system with satisfactoryresults Yet no research efforts were made with respect tothe planning of a reverse supply chain with GA and PSOFor this reason these two heuristic algorithms were used tosolve the reverse supply chain in this paper along with otherthree hybrid algorithms PSO-GA PSO-SA and GA-SAThesolving capability of these five algorithms was compared andthe optimum one was selected as a reference for decision-making
2 Fuzzy Theory
Fuzzy theory first proposed by Zaden in 1965 as an extensionof a general set is a numerical control methodology forimitating human thought and addressing the inaccuracy ofall physical systems According to FuzzyTheory the thoughtlogic of human begins as fuzzy and is intended for judgmenteven if conditions and data are uncertain while moderncomputers feature bipolar logic that is 0 or 1 differentfrom the logic of humans However fuzzy logic theory canrepresent the degree of fuzzy concepts with values between 0and 1 namely ldquomembership functionrdquo
Karkowski [36] indicated that triangular is the mostcommonmembership function in solving possibilistic math-ematical programming problems among the various types ofmembership function Other related studies concerning theuse of triangular fuzzy numbers for decision making prob-lems are [37ndash40] Hence in this paper the defect ratios andtransport loss ratios are denoted by triangular fuzzy numbersThe triangular fuzzy numbers are not compulsory if othertypes of fuzzy numbers are more applicable they can beused
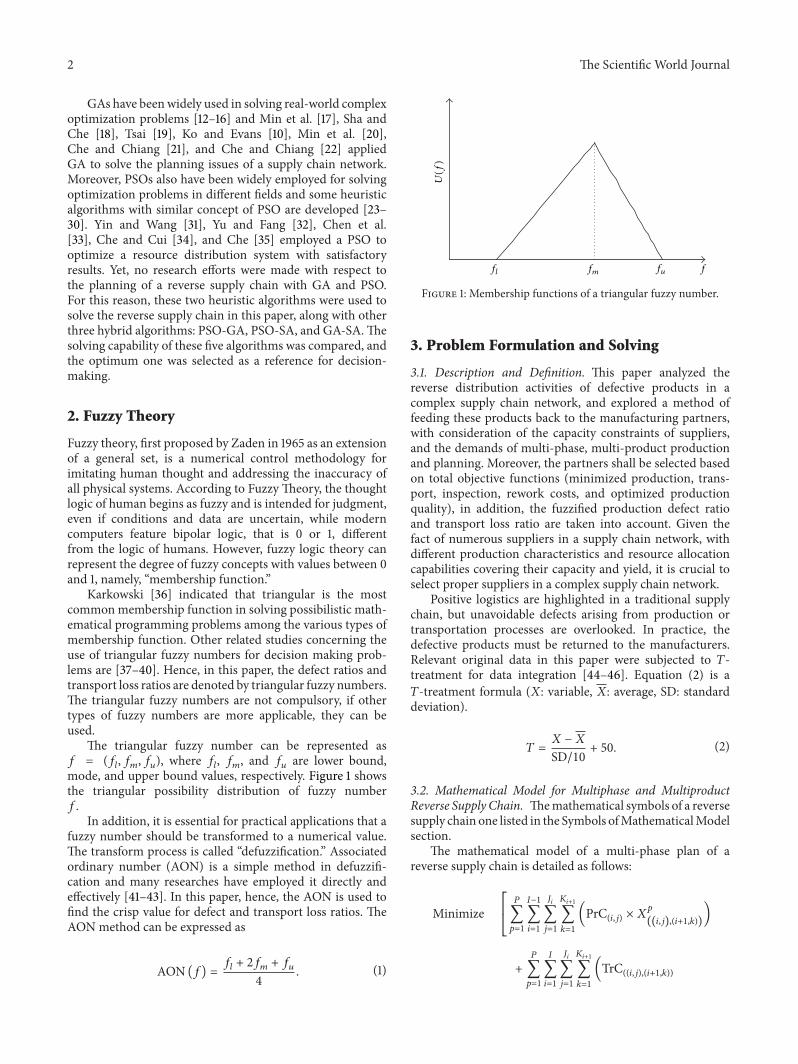
The triangular fuzzy number can be represented as119891 = (119891119897 119891119898 119891119906) where 119891119897 119891119898 and 119891119906 are lower boundmode and upper bound values respectively Figure 1 showsthe triangular possibility distribution of fuzzy number119891
In addition it is essential for practical applications that afuzzy number should be transformed to a numerical valueThe transform process is called ldquodefuzzificationrdquo Associatedordinary number (AON) is a simple method in defuzzifi-cation and many researches have employed it directly andeffectively [41ndash43] In this paper hence the AON is used tofind the crisp value for defect and transport loss ratios TheAONmethod can be expressed as
AON (119891) =119891119897 + 2119891119898 + 119891119906
4 (1)
U(f
)
ffl fm fu
Figure 1 Membership functions of a triangular fuzzy number
3 Problem Formulation and Solving
31 Description and Definition This paper analyzed thereverse distribution activities of defective products in acomplex supply chain network and explored a method offeeding these products back to the manufacturing partnerswith consideration of the capacity constraints of suppliersand the demands of multi-phase multi-product productionand planning Moreover the partners shall be selected basedon total objective functions (minimized production trans-port inspection rework costs and optimized productionquality) in addition the fuzzified production defect ratioand transport loss ratio are taken into account Given thefact of numerous suppliers in a supply chain network withdifferent production characteristics and resource allocationcapabilities covering their capacity and yield it is crucial toselect proper suppliers in a complex supply chain network
Positive logistics are highlighted in a traditional supplychain but unavoidable defects arising from production ortransportation processes are overlooked In practice thedefective products must be returned to the manufacturersRelevant original data in this paper were subjected to 119879-treatment for data integration [44ndash46] Equation (2) is a119879-treatment formula (119883 variable 119883 average SD standarddeviation)
119879 =119883 minus 119883
SD10+ 50 (2)
32 Mathematical Model for Multiphase and MultiproductReverse Supply Chain Themathematical symbols of a reversesupply chain one listed in the Symbols ofMathematicalModelsection
The mathematical model of a multi-phase plan of areverse supply chain is detailed as follows
Minimize [
[
119875
sum119901=1
119868minus1
sum119894=1
119869119894
sum119895=1
119870119894+1
sum119896=1
(PrC(119894119895) times 119883119901
((119894119895)(119894+1119896)))
+119875
sum119901=1
119868
sum119894=1
119869119894
sum119895=1
119870119894+1
sum119896=1
(TrC((119894119895)(119894+1119896))
The Scientific World Journal 3
times (119883119901
((119894119895)(119894+1119896))
+119877119883119901
((119894+1119896)(119894119895))))
+119875
sum119901=1
119868
sum119894=119868
119869119894
sum119895=1
119870119894minus1
sum119896=1
(PrC(119894119895) times 119883119901
((119894minus1119896)(119894119895)))
+119875
sum119901=1
119868
sum119894=1
119869119894
sum119895=1
119870119894+1
sum119896=1
(ChC(119894119895) times 119883119901
((119894119895)(119894+1119896)))]
]
times119875
sum119901=1
119868
sum119894=1
119869119894
sum119895=1
119876119901
(119894119895)
(3)
st119870119894+1
sum119896=1
119883119901
((119894119895)(119894+1119896))
= INT119870119894+1
sum119896=1
119883119901
((119894119895)(119894+1119896))
times (1 minus FTR((119894119895)(119894+1119896))
) + 119877119883119901minus1
((119894+1119896)(119894119895))
119894 = 1 119901 = 1 2 3 119875 119895 = 1 2 3 119869
(4)
119870119894minus1
sum119896=1
119883119901
((119894minus1119896)(119894119895))
= INT[119870119894minus1
sum119896=1
119883119901
((119894minus1119896)(119894119895))times119870119894+1
sum119896=1
(1 minus FTR((119894119895)(119894+1119896))
)]
+
119870119894+1
sum119896=1
119877119883119901minus1
((119894+1119896)(119894119895))minus119870119894minus1
sum119896=1
119877119883119901
((119894119895)(119894minus1119896))
119894 = 2 119868 minus 1 119901 = 1 2 3 119875 119895 = 1 2 3 119869
(5)119870119894minus1
sum119896=1
119883119901
((119894minus1119896)(119894119895))
= INT119870119894minus1
sum119896=1
[119883119901
((119894minus1119896)(119894119895))
times (1 minus FTR((119894119895)(119894minus1119896))
)
minus 119877119883119901
((119894119895)(119894minus1119896))]
119894 = 119868 119901 = 1 2 3 119875 119895 = 1 2 3 119869
(6)
119870119894minus1
sum119896=1
119877119883119901
((119894119895)(119894minus1119896))
= INT(119870119894minus1
sum119896=1
119883119901
((119894minus1119896)(119894119895))
+119870119894+1
sum119896=1
119877119883119901minus1
((119894+1119896)(119894119895))) times FDR
(119894119895)
119894 = 2 3 119868 119901 = 2 3 119875 119895 = 1 2 3 119869
(7)
119883(119894119895)
= INT119870119894+1
sum119896=1
119883119901
((119894119895)(119894+1119896))times (1 minus FDR
(119894119895))
times (1 minus FTR((119894119895)(119894+1119896))
)
119894 = 1 119901 = 1 2 3 119875 119895 = 1 2 3 119869
(8)
119883(119894119895)
= INT119870119894minus1
sum119896=1
119883119901
((119894minus1119896)(119894119895))times (1 minus FDR
(119894119895))
times (1 minus FTR((119894119895)(119894+1119896))
)
119894 = 2 3 119868 minus 1 119901 = 1 2 3 119875
119895 = 1 2 3 119869
(9)
MinCAP(119894119895) le119870119894+1
sum119896=1
119883119901
((119894119895)(119894+1119896))le MaxCAP(119894119895)
119894 = 1 2 119868 minus 1 119901 = 1 2 3 119875 119895 = 1 2 3 119869
(10)
119883119901
((119894119895)(119894+1119896))gt 0 and isin integer forall119894 119895 119896 119901
(11)
119877119883119901
((119894119895)(119894minus1119896))= 0
for 119901 = 0 119894 = 1 2 119868
119895 = 1 2 3 119869 119896 = 1 2 3 119870
(12)
Equation (3) shows objective functions involved in mini-mizing production costs transport costs rework costs checkcosts and quality (quality level 1 is defined as optimumquality and 10 as worst quality) (4) (5) and (6) representquantity transported from the first-hierarchy partner to thesecond-hierarchy partner and finally to the partner of lasthierarchy respectively while the fuzzy transport loss ratioand rework quantity of returned defective products are alsoconsidered (7) represents the rework quantity of defectiveproducts to be returned to the partner of previous hierarchy(8) and (9) indicate that limited production quantities ofpartners from first to last hierarchy shall meet customerdemands (10) indicates that the limited transport quantitywill not be bigger than the maximum capacity nor less thanthe minimum capacity of the partner (11) indicates that thelimited transport quantity must be an integer bigger thanzero and (12) indicates that no defective product is producedin the early phase of multi-product multi-phase productionplanning
4 The Scientific World Journal
33 Proposed Algorithms In this paper GA PSO PSO-GAGA-SA and PSO-SA were applied to determine the bestapproximate solution with minimum objective functions ina reverse supply chain
331 GA Solving Model
Step 1 Develop the structure of chromosome (Figure 2) andthe production and transport quantities were real-codedEiben et al [47] argued that real-coding could accelerate thealgorithm convergence and improve consistency In Figure 2119875(11) rarr 119875(21) represents the transport path from the firstpartner of the first hierarchy to the first partner of the secondhierarchy Gene value is an integral number representing thequantity of partner product transported on the distributionpath
Step 2 Generate a random initial population according tothe final customer demands of the partners restrict thepopulation for meeting the demand constraint (4)sim(12) andthen obtain the Fitness value by substituting the chromosomeinto the objective formula (3)
Step 3 Use Roulette Wheel method to select the chromo-somes Calculate selection probability of every chromosomeof which the chromosomes of better fitness function have ahigher probability
Step 4 Randomly select two chromosomes from the popu-lation for crossover and generate random crossover pointsthen exchange the genes of the chromosome as shown inFigure 3 if the crossover rate is 119909119888 the number of chromo-somes is 119910119888 the crossover quantity is 119909119888 times 119910119888 = 119899119888 a betterefficiency could be achieved if crossover rate is 075sim095 [47]
Step 5 Randomly select a chromosome for mutation with itsposition if the mutation rate is 119909119898 and the number of genesis 119910119898 the mutation number is 119909119898 times 119910119898 = 119899119898 as shown inFigure 4 a higher mutation rate means a higher amplitude amutation rate lt 01 is a typical value [48]
Step 6 When the chromosomes of best offspring are superiorto those of worst population this population will be replacedas a new one
Step 7 Repeat Steps 2 to 6 until the stop conditions aresatisfied
332 PSO Solving Model
Step 1 Set the particle number iteration number maximumspeed learning factor and inertia weight
Step 2 Randomly generate the initial speed and position ofevery particle with the range specified in the constraint (4)sim(12)
Step 3 Substitute the particles of population into the objectivefunction equation (3) to obtain the Pbest of each particle andthe Gbest of the population
Step 4 Update the speed and position of particles usingInertia Weight Method [49] as shown in (13) when 119908ranges between 09 and 12 there is a higher opportunity todetermine a global optimal solution [50] as follows
V119899119894= 119908V119888119894+ 1198881 times rand () times (1199041015840
119894minus 119904119888119894) + 1198882 times rand () times (11990410158401015840
119894minus 119904119888119894)
(13)
119904119899119894= 119904119888119894+ V119899119894 (14)
where V119888119894represents the speed when the particle position is
changed V119899119894is the new speed of particle 119894 119904119888
119894is the current
position of particle 1199041015840119894is the memory value of the individual
best position of particle 119894 11990410158401015840119894is thememory value of the global
best position 119904119899119894is the new position of particle 119894 119908 is inertia
weight rand() is a random variable between (0 1) and 1198881 and1198882 are learning factors
Step 5 Substitute the updated particle position into theconstraint (4)sim(12) review if the updated position meets therequirements of constraints if any particle exceeds the rangeupdate again until all particles meet the requirements ofconstraint (4)sim(12)
Step 6 Compare the particlersquos objective function value withupdated particle position and its Pbest If the objectivefunction value is superior to the Pbest the Pbest of thisparticle will be replaced by its objective function value withupdated particle position
Step 7 Compare the Pbest and Gbest If the best value ofparticle is superior to Gbest the Gbest will be replaced by thebest value of the particle
Step 8 Repeat Steps 2 to 7 until meeting the stop conditionsor reaching the set iteration number
333 PSO-GA Solving Model
Steps 1sim3 Perform Steps 1sim3 of PSO solving model
Step 4 Perform Step 3 of GA solving model to select theparticle positions of better fitness functions stored in thelibraryWith this selectionmechanism there is a higher prob-ability that the particle position of better fitness functionswill become Gbest another new Gbest could be obtainedthrough recombination and the particles could be evaluatedand properly deleted of which the worst individuals arereplaced by optimum individuals after sequencing of fitnessfunctions
The Scientific World Journal 5
Gene cell item
Gene value4660
3793
20519114
893
59
1420
215610
1883855
762721
28512895
00
90
5512821
24143
130
16433
105
P(11)darr darr darr darr darr darr darr darr darr darr darr darr darr darr
P(21)
P(12)
P(21)
P(13)
P(21)
P(14)
P(21)
P(11)
P(22)
P(12)
P(22)
P(13)
P(22)
P(14)
P(22)middot middot middot
middot middot middot
P(31)
P(42)
P(32)
P(42)
P(33)
P(42)
P(31)
P(43)
P(32)
P(43)
P(33)
P(43)43
a
24b
49c
Xa product b product Y
c product Z
Figure 2 Structure of chromosome
Parent 1 Cut point
Gene cell item
Gene value1507481
687914
234139
577622
411552
763790
2010138
Parent 2
Gene cell item
Gene value745641
988678
1269380
802135
338870
501398
162981
Ofspring 1 One point crossover
Gene cell item
Gene value157481
687914
234139
802135
338870
501398
162981
Ofspring 2 Gene cell
item
Gene value745641
988678
1269380
577622
411552
763790
2010138
P(11)darr darr darr darr darr darr darr darr
P(21)
P(12)
P(21)
P(13)
P(21)
P(14)
P(21)
P(11)
P(22)
P(12)
P(22)
P(13)
P(22)
P(14)
P(22)
P(11)darr darr darr darr darr darr darr darr
P(21)
P(12)
P(21)
P(13)
P(21)
P(14)
P(21)
P(11)
P(22)
P(12)
P(22)
P(13)
P(22)
P(14)
P(22)
P(11)darr darr darr darr darr darr darr darr
P(21)
P(12)
P(21)
P(13)
P(21)
P(14) P(11)
P(22)
P(12)
P(22)
P(13)
P(22)
P(14)
P(22)
P(11)darr darr darr darr darr darr darr darr
P(21)
P(12)
P(21)
P(13)
P(21)
P(14)
P(22)
P(22)
P(11)
P(22)
P(12)
P(22)
P(13)
P(22)
P(14)
P(22)
11a
25b
66c
11a
25b
66c
20a
44b
48c
20a
44b
48c
Xa product b product Y
c product Z
Figure 3 Single-point crossover
Step 5 Obtain a new group of good populations using theselection mechanism then perform Steps 1sim3 of PSO solvingmodel and obtain the new Pbest and Gbest
Step 6 Perform Step 5 of GA solving model to randomlyselect mutation particles for single-point mutation and gen-erate a new population
Step 7 Perform Steps 4sim7 of PSO solvingmodel to obtain thenew Pbest and Gbest of the new population
Step 8 Repeat Steps 2 to 7 until stop conditions are met
334 PSO-SA Solving Model
Steps 1sim6 Perform Steps 1sim6 of PSO solving model
Step 7
Substep 71 Set start temperature (119879start) end temperature(119879end) cooling rate (120572) and length of Markov Chain (119872)
Substep 72 Disturb the updated particle under current tem-perature 119879 and generate a neighboring solution 119896
Substep 73 Calculate the objective function perform distur-bance mechanism under current temperature to generate aneighboring solution 119896 and then substitute it into the objec-tive function equation (5) and calculate its fitness function119891(119883) and the difference of the fitness function Δ119891(119899) =119891(1198831015840)minus119891(119883) Obtain initial solution119883 and through iterationof random disturbances neighboring reasonable solutionsobtain a new solution1198831015840 every particle runs across the lengthof Markov Chain119872 several times at start temperature 119879starta fitness is obtained every time (energy function Δ119891(119899))
Substep 74 Judge if this neighboring solution is acceptedthrough probability function using probability function(15) as shown below and then randomly generate randomnumber 119903 from 0 to 1 as follows
119875 (119899) =
1 if Δ119891 (119899) le 0
exp(minusΔ119891 (119899)
119879) if Δ119891 (119899) gt 0
(15)
6 The Scientific World Journal
Old
Gene cell item
Gene value 115687 1505397 176876 234283 871688 412025 469175 923048
New Mutation operator
Gene cell item
Gene value 207964 1505397 176876 234283 573775 412025 287439 923048
P(11)darr darr darr darr darr darr darr darr
P(21)
P(12)
P(21)
P(13)
P(21)
P(14)
P(21)
P(11)
P(22)
P(12)
P(22)
P(13)
P(22)
P(14)
P(22)
P(11)darr darr darr darr darr darr darr darr
P(21)
P(12)
P(21)
P(13)
P(21)
P(14)
P(21)
P(11)
P(22)
P(12)
P(22)
P(13)
P(22)
P(14)
P(22)
Figure 4 Mutation
Substep 75 Compare random number 119903 with probabilitynumber 119875(119899) if 119903 le 119875(119899) it will disturb the neighboringsolution 119896 replace the particle and its fitness function if119903 gt 119875(119899) it will not replace the particle A new disturbancesolution will generate if not accepted until the termination ofset search times
Substep 76 Repeat Substeps 72ndash75 through Markov Chain(119872) until119872 times and then perform the cooling steps indi-cating that a stable state is reached under this temperature
Substep 77 Implement the cooling procedure at the set-cooling rate of 120572 through a cooling mechanism 119879 = 119879 times 120572
Substep 78 Judge if the cycling is finished through the set endtemperature 119879end if 119879 le 119879end perform the next step if 119879 gt119879end repeat Substeps 72 to 77 until 119879 le 119879end
Step 8 Repeat Steps 2 to 7 until reaching the desired iterationnumber
335 GA-SA Solving Model
Steps 1sim5 Perform Steps 1 to 5 of GA solving model
Step 6 Perform Substeps 71 to 78 of PSO-SA solving model
Step 7 Generate new offspring through genetic evolution ifoptimumfitness function of offspring is superior to that of thepopulation will be replaced as a new one otherwise maintainthe chromosomes of original population for next-generationevolution
Step 8 Repeat Steps 3 to 7 until the set stop conditions aremet
4 Illustrative Example and Results Analysis
41 Case Description In a complex supply chain networkeven a leading manufacturer cannot guarantee 100 yieldduring the production process or prevent any defect duringthe transport process However the defect ratio and loss ratioare not fixed thus fuzzy defect ratio and fuzzy transport lossratio are applied in this paper
Based on a supply chain network of 4-4-3-3 thispaper simulated rework activity of returned defective prod-ucts through a multi-product multi-phase production planAssuming that the initial inventory is zero the defectiveproducts arising from the production process of upstreammanufacturers and from the transport process are returnedto original manufacturers for rework the suppliers of 1stndash4th hierarchy have no fixed production defect ratio ortransport loss ratio meanwhile the multi-product multi-phase production is planned into three phases with defectiveproducts only returned during the second phase Moreoverassuming that the production defect ratio and check costsof the first-hierarchy suppliers are not considered only thedefective products from the partners of 2nd to the 4th arereturned for rework in addition assume that the reworkprocess is the same as the production process then therework costs and production costs are the same Accordingto first-phase production planning 119883 products for finalcustomer requirements amount to 400 350 450 and 119884products amount to 250 150 200 and 119885 products amountto 100 200 and 250 Figure 5 depicts the framework ofa reverse supply chain and relevant parameters includingproduction costs (PrC) transport costs (TrC) check costs(ChC) quality (119876) fuzzy defect ratio (FDR) fuzzy transportloss ratio (FTR) and maximum and minimum capacity(Max CAP andMin CAP) Since the production defect ratioand transport loss ratio are fuzzy sets with triangular fuzzynumber (1) is used for defuzzification For partner 119875(21)its fuzzy number of defect ratio is (06 22 3) then itsFDR is 2 according to (1) For the conciseness of this paperthe detail calculating processes of the production defect andtransport loss ratios for all partners and transport paths arenot presented and their defuzzified values are shown inFigure 5
42 Experimental Results and Analysis PSO GA PSO-GAGA-SA and PSO-SAwere applied for solving the distributionissues of a reverse supply chain network the experimentaldesign was conducted under the parameters of solvingperformance of which every combination of parameters wasimplemented 20 times to determine an optimal combinationas listed in Table 1
It is learnt from Table 1 that the optimal combination ofPSO parameters is particle number 10 generation number1000 maximum speed 125 inertia weight 215 and learningfactor 205 the optimal combination of GA parameters is
The Scientific World Journal 7
Table 1 Combination of experimental parameters
PSO
Population size 10 10 10 10 20 20 20 20Generations 500 500 1000 1000 500 500 1000 1000Max velocity 095 125 095 125 095 125 095 125Initial weight 125 215 125 215 125 215 125 215
1198881 1198882 205 205 205 205 205 205 205 205Avg fitness 24462289 24461153 24460103 24458116 24459087 24460841 24458923 24457531
Avg execution time (sec) 6731 6896 12468 12391 12842 12546 21391 21016Avg convergence time (sec) 4766 4275 8791 8437 7986 8311 17694 16972
GA
Population size 5 5 5 5 10 10 10 10Generations 500 500 1000 1000 500 500 1000 1000Crossover rate 075 08 075 08 075 08 075 08Mutation rate 008 007 008 007 008 007 008 007Avg fitness 24465387 24464085 24462752 24461924 24463297 24463159 244603191 24459450
Avg execution time (sec) 19373 18859 67693 68047 47375 47734 225836 217512Avg convergence time (sec) 17716 16827 62549 62764 44507 44642 219675 211741
PSO-GA
Population size 10 10 10 10 20 20 20 20Generations 500 500 1000 1000 500 500 1000 1000Max velocity 095 125 095 125 095 125 095 125Initial weight 125 215 125 215 125 215 125 215
1198881 1198882 205 205 205 205 205 205 205 205Mutation rate 008 007 008 007 008 007 008 007Avg fitness 24790482 24692938 24662117 24579829 24507556 24453060 24697893 24662084
Avg execution time (sec) 6758 6579 11864 12714 12898 12685 23257 22934Avg convergence time (sec) 3147 3038 5342 6182 6379 5824 12681 12507
GA-SA
Population size 5 5 5 5 10 10 10 10Generations 500 500 1000 1000 500 500 1000 1000Crossover rate 075 08 075 08 075 08 075 08Mutation rate 008 007 008 007 008 007 008 007
Initial temperature 300 300 400 400 300 300 400 400Markov Chain Length 50 50 100 100 50 50 100 100
Cooling rate 09 09 099 099 09 09 099 099Final temperature 1 1 5 5 1 1 5 5
Avg fitness 24459076 24458365 24458351 24458067 24457247 24456391 24457425 24457544Avg execution time (sec) 27477 26041 81462 79039 68671 66993 279145 274338
Avg convergence time (sec) 22374 20768 74744 73412 63467 62522 265074 263862
PSO-SA
Population size 10 10 10 10 20 20 20 20Generations 500 500 1000 1000 500 500 1000 1000Max velocity 095 125 095 125 095 125 095 125Initial weight 125 215 125 215 125 215 125 215
1198881 1198882 205 205 205 205 205 205 205 205Initial temperature 300 300 400 400 300 300 400 400
Markov Chain Length 50 50 100 100 50 50 100 100Cooling rate 09 09 099 099 09 09 099 099
Final temperature 1 1 5 5 1 1 5 5Avg fitness 24457588 24457887 24455842 24455147 24455895 24456068 24456457 24456778
Avg execution time (sec) 14073 13422 26087 25971 26479 25706 38926 37433Avg convergence time (sec) 6102 5674 11479 10347 11887 12624 19211 16708
8 The Scientific World Journal
First echelon Second echelon Third echelon Fourth echelon
Q 1 Demand
Demand
Demand
LogisticsReverse logistics
723612414134221413312614425222323521422124722621
843222924322112453511641722235133322
Production cost (PrC)
Quality (Q)
Transportation cost (TrC)
Check cost (ChC)
415542653634242414325423322
Fuzzy defective rate (FDR)
MinCAP lt X lt maxCAP
Fuzzy transportation loss ratio (FTR)
PrC 15
50 lt X lt 3500
Q 1PrC 24
70 lt X lt 3300
Q 3PrC 32
40 lt X lt 3400
Q 5PrC 41
30 lt X lt 3300
Q 4
PrC 35
70 lt X lt 4000
Q 1
PrC 18
50 lt X lt 3500
Q 2
PrC 22
80 lt X lt 3300
Q 4
PrC 34
60 lt X lt 3400
Q 4
PrC 30
40 lt X lt 3200
Q 3
PrC 20
30 lt X lt 3600
Q 2
PrC 27
40 lt X lt 3400
Q 3
PrC 45
30 lt X lt 3700
Q 1
PrC 13
50 lt X lt 3600
Q 2
PrC 36
30 lt X lt 3300
P(31) rarr P(41)
P(31) rarr P(42)
P(31) rarr P(43)
P(32) rarr P(41)
P(32) rarr P(42)
P(32) rarr P(43)
P(33) rarr P(41)
P(33) rarr P(42)
P(33) rarr P(43)
P(21) rarr P(31)
P(21) rarr P(32)
P(21) rarr P(33)
P(22) rarr P(31)
P(22) rarr P(32)
P(22) rarr P(33)
P(23) rarr P(31)
P(23) rarr P(32)
P(23) rarr P(33)
P(24) rarr P(31)
P(24) rarr P(32)
P(24) rarr P(33)
P(14) rarr P(21)
P(14) rarr P(22)
P(14) rarr P(23)
P(14) rarr P(24)
P(11) rarr P(21)
P(11) rarr P(22)
P(11) rarr P(23)
P(11) rarr P(23)
P(12) rarr P(21)
P(12) rarr P(22)
P(12) rarr P(23)
P(12) rarr P(24)
P(13) rarr P(21)
P(13) rarr P(22)
P(13) rarr P(23)
P(13) rarr P(24)
TrCFTRChCTrCFTRChCTrCFTRChC
P(41)P(31)P(21)
P(42)P(32)P(22)
P(43)P(33)P(23)
P(24)
P(11)
P(12)
P(13)
P(14)
FDR 2 FDR 5 FDR 1
FDR 3FDR 3FDR 1
FDR 2 FDR 1 FDR 2
FDR 4
Figure 5 4-4-3-3 reverse supply chain network
population number 10 generation number 1000 crossoverrate 08 and mutation rate 007 the optimal combinationof PSO-GA parameters is particle number 20 generationnumber 500 maximum speed 125 inertia weight 215learning factor 205 and mutation rate 007 the optimalcombination of GA-SA parameters is population number 10generation number 500 crossover rate 08mutation rate 007start temperature 300 Markov Chain 50 cooling rate 09
and end temperature 1 the optimal combination of PSO-SAparameters is particle number 10 generation number 1000maximum speed 125 inertia weight 215 learning factor 205start temperature 400 Markov Chain 100 cooling rate 099end temperature 5
To compare the advantages and disadvantages of thesealgorithms ANOVA was used to judge if convergence valueexecution time and convergence time differed considerably
The Scientific World Journal 9
Table 2 ANOVA verification of fitness values
HypothesizeH0
Fitness120583PSO = Fitness120583GA = Fitness120583PSO-GA = Fitness120583GA-SA = Fitness120583PSO-SA
H1 otherwiseAlgorithm Numbers Sum Average VariancePSO 30 734139577 2447131923 1120394034GA 30 734406462 244802154 910941494PSO-GA 30 733498321 2444994403 1372449396GA-SA 30 733929774 244643258 752499584PSO-SA 30 733666393 2445554643 3467767352Source SS Freedom MS 119865 119875 value Critical valueIntergroup 176119864 + 10 4 4389633912 287880644 002486 2434065Intragroup 221119864 + 11 145 1524810372Sum 239119864 + 11 149
Result reject H0
Table 3 ANOVA verification of execution time
HypothesizeH0
ET120583PSO = ET120583GA = ET120583PSO-GA = ET120583GA-SA = ET120583PSO-SA
H1 otherwiseAlgorithm Numbers Sum Average VariancePSO 30 372022 1240073 0076341375GA 30 6524661 2174887 0165604217PSO-GA 30 380424 126808 0076438303GA-SA 30 2004847 6682823 0187643495PSO-SA 30 775495 2584983 0192059868Source SS Freedom MS 119865 119875 value Critical valueIntergroup 9081557 4 2270389 1626150094 000000 2434065Intragroup 2024453 145 0139617Sum 908176 149
Result reject H0
Table 4 ANOVA verification of convergence time
HypothesizeH0
CT120583PSO = CT120583GA = CT120583PSO-GA = CT120583GA-SA = CT120583PSO-SA
H1 otherwiseAlgorithm Numbers Sum Average VariancePSO 30 246605 8220167 00913266GA 30 6375408 2125136 07256669PSO-GA 30 171189 57063 0014925GA-SA 30 1863747 621249 04336888PSO-SA 30 326895 108965 02385541Source SS Freedom MS 119865 119875 value Critical valueIntergroup 939149 4 2347872 78045896 000000 2434065Intragroup 4362068 145 0300832Sum 123119864 + 09 89
Result reject H0
10 The Scientific World Journal
Table 5 Multiple comparison on fitness valueFitness120583PSO
Fitness120583GAFitness120583PSO-GA
Fitness120583GA-SAFitness120583GA (minus +)Fitness120583PSO-GA (+ +) (+ +)Fitness120583GA-SA (+ +) (+ +) (minus +)Fitness120583PSO-SA (+ +) (+ +) (minus +) (minus +)
Table 6 Multiple comparison on execution timeET120583PSO
ET120583GAET120583PSO-GA
ET120583GA-SAET120583GA (minus minus)ET120583PSO-GA (minus minus) (+ +)ET120583GA-SA (minus minus) (+ +) (minus minus)ET120583PSO-SA (minus minus) (+ +) (minus minus) (+ +)
Table 7 Multiple comparison on convergence timeCT120583PSO
CT120583GACT120583PSO-GA
CT120583GA-SACT120583GA (minus minus)CT120583PSO-GA (+ +) (+ +)CT120583GA-SA (minus minus) (+ +) (minus minus)CT120583PSO-SA (minus minus) (+ +) (minus minus) (+ +)
then the algorithms were compared using Scheffersquos multiplecomparison method [51] one-way ANOVA was used tocheck the difference of characteristics and variables [52]Scheffersquos multiple comparison method was then used tocheck the differences of the various groups and whether thedifferences reached a significant level Tables 2 3 and 4 listthe comparative check data of the five algorithms which weresourced from 30 occasions of independent calculations forthe optimal combination of parameters
In Tables 2ndash4 the results of ANOVA verification areshown that all H0 are rejected (119875 value lt 120572 = 005)Then the fitness value execution time and convergence timeof the algorithms were compared using Scheffersquos multiplecomparison method with Scheffersquos equation as follows
119909119894 minus 119909119895 minus radic(119896 minus 1) 119865120572(119896minus1)(119899minus119896)radicMSE( 1
119899119894+1
119899119895)
119909119894 minus 119909119895 + radic(119896 minus 1) 119865120572(119896minus1)(119899minus119896)radicMSE( 1
119899119894+1
119899119895)
(16)
where 119909119894 119909119895 are the mean values of algorithms compared 119896 isgroup freedom119865120572(119896minus1)(119899minus119896) is critical valueMSE is intergroupMS 119899119894 119899119895 is number of samples
Table 5 shows Fitness120583PSO-GA = Fitness120583GA-SA =Fitness120583PSO-SA lt Fitness120583PSO = Fitness120583GA that is PSO-GA GA-SA and PSO-SA are all better than PSO andGA and there are no clear differences in the fitnessvalues of the three algorithms The comparative resultof system execution time is shown in Table 6 and
ET120583PSO lt ET120583PSO-GA lt ET120583PSO-SA lt ET120583GA-SA lt ET120583GAis the PSO is superior to other solving models Theconvergence times of the algorithms are shown in Table 7and CT120583PSO-GA lt CT120583PSO lt CT120583PSO-SA lt CT120583GA-SA lt CT120583GAPSO-GA lt PSO lt PSO-SA lt GA-SA lt GA that is PSO-GAhas faster convergence speed than PSO PSO-SA GA-SAand GA The results show that PSO-GA performs better infitness value execution time and convergence time Thenthe PSO-GA is employed to make the distribution plan ofthree periods reverse supply chain and the results are shownin Tables 8 9 and 10
5 Conclusions
This paper focused on analyzing the issues of returningdefective products to original manufacturers in a reversesupply chain system Fuzzy defect and fuzzy transport lossratios were considered and an optimized mathematicalmodel was developedThis model combined cost and qualitywithT-technology and described how to plan a reverse supplychain on the precondition of meeting customer demandsand realizing the capacity of partners To solve the problemsefficiently three hybrid algorithms were applied to thisreverse model including PSO-GA PSO-SA and GA-SAthen the performances of these algorithms were comparedThe experimental results show that if the fitness valueexecution time and convergence time are considered PSO-GA has the minimal value which means that PSO-GA hasthe qualities and capabilities for dealing with the productionplanning and distribution of a multi-phase multi-productreverse supply chain
The Scientific World Journal 11
Table8Distrib
utionplan
byPS
O-G
A(firstp
eriod)
From
ToEchelon2
Echelon3
Echelon4
119875(21)
119875(22)
119875(23)
119875(24)
119875(31)
119875(32)
119875(33)
119875(41)
119875(42)
119875(43)
Echelon1
119875(11)
10a 6b49c
7336
4211059
242535
119875(12)
142474
1742633
34182
10210234
119875(13)
1572457
256381
72956
221155
119875(14)
74396
761721
31813
74141
Echelon2
119875(21)
177383
11680
8210325
119875(22)
458237
1091417
8676
119875(23)
5310060
4133
175865
119875(24)
1112369
1029244
921130
Echelon3
119875(31)
17000
1000174
910255
119875(32)
9500
4700
12300
119875(33)
139253101
21315532
2452040
a Produ
ctX
b produ
ctY
c produ
ctZ
12 The Scientific World Journal
Table9Distrib
utionplan
byPS
O-G
A(secon
dperio
d)
From
ToEchelon1
Echelon2
Echelon3
Echelon4
119875(11)
119875(12)
119875(13)
119875(14)
119875(21)
119875(22)
119875(23)
119875(24)
119875(31)
119875(32)
119875(33)
119875(41)
119875(42)
119875(43)
Echelon1
119875(11)
1007612
694880
6134947
18550
119875(12)
341922
0270
2145047
911014
119875(13)
9533495
1311351
81740
285126
119875(14)
111110
1215100
9910
125215
Reverse
Echelon2
119875(21)
000
300
300
122
13032067
1892759
10850
119875(22)
200
400
600
221
15537213
523817
0290
119875(23)
100
100
000
122
82344
12
12362108
819410
119875(24)
000
100
000
183
55051
13970
556390
Reverse
Echelon3119875(31)
600
1500
200
4137
413030
1343610
11700
119875(32)
300
300
100
013
13000
12100
603960
119875(33)
200
000
000
26
32260151
1430304
646150
Reverse
Echelon4119875(41)
300
200
231
119875(42)
400
200
885
119875(43)
300
400
76
3Dem
and
400300150
400350300
25040
0150
The Scientific World Journal 13
Table10D
istrib
utionplan
byPS
O-G
A(th
irdperio
d)
From
ToEchelon1
Echelon2
Echelon3
Echelon4
119875(11)
119875(12)
119875(13)
119875(14)
119875(21)
119875(22)
119875(23)
119875(24)
119875(31)
119875(32)
119875(33)
119875(41)
119875(42)
119875(43)
Echelon1
119875(11)
86184
40615108
301253
248313
119875(12)
346036
137628
1651376
3515930
119875(13)
2724
301217
471160
278285
119875(14)
56010
7831
8610222
174698
Reverse
Echelon2
119875(21)
200
100
200
293
26915
332349
1135511
119875(22)
200
000
400
014
430362
3727318
10504
119875(23)
100
300
000
092
21728238
82238
93646
119875(24)
000
100
000
223
216061
2218348
9910412
Reverse
Echelon3119875(31)
500
600
300
22712
1900354
21300
580193
119875(32)
500
100
300
357
932530
16500
11300
119875(33)
000
000
200
272
16600
12330287
230246
Reverse
Echelon4119875(41)
100
200
36
2119875(42)
500
400
5716
119875(43)
300
200
2175
Dem
and
450250350
500300100
400200200
14 The Scientific World Journal
Symbols of Mathematical Model
119899 Number of products 119899 = 1 2 3 119873119873 Total number119894 Hierarchy of supply chain 119894 = 1 2 3 119868119868 Total number of hierarchy of supply chain119901 Production phase 119905 = 1 2 3 119879119875 Total production phase119869119894 Serial number of partner of 119894th hierarchy119870119894 Serial number of partner of 119894th hierarchy
designated to original manufacturerChC(119894119895) Check cost of 119895th partner of 119894th hierarchyPrC(119894119895) Production cost of 119895th partner of 119894th
hierarchyTrC((119894119895)(119894+1119896)) Transport cost from 119895th partner of 119894th
hierarchy to original (designated) partner119896 of 119894 + 1 hierarchy
FTR((119894119895)(119894+1119896))
Fuzzy transport loss ratio from 119895th partnerof 119894th hierarchy to original (designated)partner of 119894 + 1 hierarchy
FDR(119894119895)
Fuzzy defect ratio of 119895th partner of 119894thhierarchy
119883119901
(119894119895) Production quantity of 119895th partner of 119894th
hierarchy at phase 119901119883119875((119894119895)(119894+1119896))
Transport quantity from 119895th partner of 119894thhierarchy at phase 119901 to original(designated) partner of 119894 + 1 hierarchy
119877119883119875minus1((119894+1119896)(119894119895))
Quantity of defective products transportedfrom 119895th partner of 119894th hierarchy at phase119901 minus 1 back to original (designated) partnerof 119894 + 1 hierarchy
MaxCAP(119894119895) Maximum capacity of 119895th partner of 119894thhierarchy
MinCAP(119894119895) Minimum capacity of 119895th partner of 119894thhierarchy
119876119901
(119894119895) Quality level of 119895th partner of 119894th
hierarchy at phase 119901ChC(119894119895) Check cost of 119895th partner of 119894th hierarchyPrC(119894119895) Production cost of 119895th partner of 119894th
hierarchyTrC((119894119895)(119894+1119896)) Transport cost from 119895th partner of 119894th
hierarchy to original (designated) partner119896 of 119894 + 1 hierarchy
SD119876(119894119895)
Standard deviation of quality of 119895thpartner of 119894th hierarchy
SDChC(119894119895)
Standard deviation of check cost of 119895thpartner of 119894th hierarchy
SDPrC(119894119895)
Standard deviation of production cost of119895th partner of 119894th hierarchy
SDTrC((119894119895)(119894+1119896))
Standard deviation of transport cost from119895th partner of 119894th hierarchy to original(designated) partner 119896 of 119894 + 1 hierarchy
INT Integer
Conflict of Interests
The authors declare that there is no conflict of interestsregarding the publication of this paper
Acknowledgments
The authors would like to thank Mr K Hsiao for supportingwriting programs and theNational ScienceCouncil of Taiwanfor their partial financial support (Grants nos NSC 102-2410-H-027-009 and NSC 101-2410-H-027-006) The authorswould also like to acknowledge the editors and anonymousreviewers for their helpful comments and suggestions whichgreatly improved the presentation of this paper
References
[1] G Desbarats ldquoThe innovation supply chainrdquo Supply ChainManagement vol 4 no 1 pp 7ndash10 1999
[2] S M Disney M M Naim and A Potter ldquoAssessing the impactof e-business on supply chain dynamicsrdquo International Journalof Production Economics vol 89 no 2 pp 109ndash118 2004
[3] T M Simatupang and R Sridharan ldquoThe collaboration indexa measure for supply chain collaborationrdquo International Journalof Physical Distribution and Logistics Management vol 35 no 1pp 44ndash62 2005
[4] D Y Sha and Z H Che ldquoVirtual integration with a multi-criteria partner selectionmodel for themulti-echelonmanufac-turing systemrdquo International Journal of Advanced Manufactur-ing Technology vol 25 no 7-8 pp 793ndash802 2005
[5] M Tuominen and M Anttila ldquoStrategising for innovationand inter-firm collaboration capability analysis in assessingcompetitive superiorityrdquo International Journal of TechnologyManagement vol 33 no 2-3 pp 214ndash233 2006
[6] S Dowlatshahi ldquoDeveloping a theory of reverse logisticsrdquoInterfaces vol 30 no 3 pp 143ndash155 2000
[7] L-H Shih ldquoReverse logistics system planning for recyclingelectrical appliances and computers in Taiwanrdquo ResourcesConservation and Recycling vol 32 no 1 pp 55ndash72 2001
[8] ADesai andAMital ldquoEvaluation of disassemblability to enabledesign for disassembly in mass productionrdquo International Jour-nal of Industrial Ergonomics vol 32 no 4 pp 265ndash281 2003
[9] I Dobos ldquoOptimal production-inventory strategies for aHMMS-type reverse logistics systemrdquo International Journal ofProduction Economics vol 81-82 pp 351ndash360 2003
[10] H J Ko and G W Evans ldquoA genetic algorithm-based heuristicfor the dynamic integrated forwardreverse logistics networkfor 3PLsrdquoComputers and Operations Research vol 34 no 2 pp346ndash366 2007
[11] M Gen and R Cheng Genetic Algorithms and EngineeringDesign John Wiley amp Sons New York NY USA 1997
[12] B Stojanovic M Milivojevic M Ivanovic N Milivojevicand D Divac ldquoAdaptive system for dam behavior modelingbased on linear regression and genetic algorithmsrdquo Advances inEngineering Software vol 65 pp 182ndash190 2013
[13] R Belevicius D Jatulis and D Sesok ldquoOptimization of tallguyed masts using genetic algorithmsrdquo Engineering Structuresvol 56 pp 239ndash245 2013
[14] D S Hong andH S Cho ldquoA genetic-algorithm-based approachto the generation of robotic assembly sequencesrdquo ControlEngineering Practice vol 7 no 2 pp 151ndash159 1999
[15] L Ozdamar ldquoA genetic algorithm approach to a generalcategory project scheduling problemrdquo IEEE Transactions onSystems Man and Cybernetics C vol 29 no 1 pp 44ndash59 1999
[16] M F Sebaaly and H Fujimoto ldquoGenetic planner for assemblyautomationrdquo inProceedings of the IEEE International Conference
The Scientific World Journal 15
on Evolutionary Computation (ICECrsquo96) pp 401ndash406 May1996
[17] H Min C S Ko and H J Ko ldquoThe spatial and temporalconsolidation of returned products in a closed-loop supplychain networkrdquo Computers and Industrial Engineering vol 51no 2 pp 309ndash320 2006
[18] D Y Sha and Z H Che ldquoSupply chain network designpartner selection and productiondistribution planning using asystematic modelrdquo Journal of the Operational Research Societyvol 57 no 1 pp 52ndash62 2006
[19] C-F Tsai ldquoAn intelligent adaptive system for the optimalvariable selections of RampD and quality supply chainsrdquo ExpertSystems with Applications vol 31 no 4 pp 808ndash825 2006
[20] H Min H J Ko and C S Ko ldquoA genetic algorithm approachto developing the multi-echelon reverse logistics network forproduct returnsrdquo Omega vol 34 no 1 pp 56ndash69 2006
[21] Z H Che and C J Chiang ldquoA modified Pareto genetic algo-rithm for multi-objective build-to-order supply chain planningwith product assemblyrdquo Advances in Engineering Software vol41 no 7-8 pp 1011ndash1022 2010
[22] Z H Che and T A Chiang ldquoDesigning a collaborative supplychain plan using the analytic hierarchy process and geneticalgorithm with cycle time estimationrdquo International Journal ofProduction Research vol 50 no 16 pp 4426ndash4443 2012
[23] Z H Che ldquoPSO-based back-propagation artificial neural net-work for product and mold cost estimation of plastic injectionmoldingrdquo Computers and Industrial Engineering vol 58 no 4pp 625ndash637 2010
[24] E Garcıa-Gonzalo and J L Fernandez-Martınez ldquoA briefhistorical review of particle swarmoptimization (PSO)rdquo Journalof Bioinformatics and Intelligent Control vol 1 no 1 pp 3ndash162012
[25] L Ali and S L Sabat ldquoParticle swarm optimization based uni-versal solver for global optimizationrdquo Journal of Bioinformaticsand Intelligent Control vol 1 no 1 pp 95ndash105 2012
[26] R K Sahu S Panda U K Rout and P Raul ldquoApplicationof gravitational search algorithm for load frequency controlof multi area power systemrdquo Journal of Bioinformatics andIntelligent Control vol 2 no 3 pp 200ndash210 2013
[27] A S Reddy and K Vaisakh ldquoEnvironmental constrained eco-nomic dispatch by modified shuffled frog leaping algorithmrdquoJournal of Bioinformatics and Intelligent Control vol 2 no 3pp 216ndash222 2013
[28] L P Xie J C Zeng and R A Formato ldquoSelection strategies forgravitational constant G in artificial physics optimisation basedon analysis of convergence propertiesrdquo International Journal ofBio-Inspired Computation vol 4 no 6 pp 380ndash391 2012
[29] X J Cai S J Fan and Y Tan ldquoLight responsive curve selectionfor photosynthesis operator of APOArdquo International Journal ofBio-Inspired Computation vol 4 no 6 pp 373ndash379 2012
[30] K Agarwal M Goyal and P R Srivastava ldquoCode coverageusing intelligent water drop (IWD)rdquo International Journal ofBio-Inspired Computation vol 4 no 6 pp 392ndash402 2012
[31] P-Y Yin and J-Y Wang ldquoA particle swarm optimizationapproach to the nonlinear resource allocation problemrdquoAppliedMathematics and Computation vol 183 no 1 pp 232ndash2422006
[32] J X Yu and X Y Fang ldquoDynamic reactive power optimizationbased on particle swam optimization algorithmrdquo East ChinaElectric Power vol 34 no 11 pp 21ndash25 2006
[33] Y H Chen W J Wang and C H Chiu ldquoParticle swarmoptimization algorithm and its application to power systemrdquoHenan Science vol 25 no 1 pp 29ndash32 2007
[34] Z H Che and Z Cui ldquoUnbalanced supply chain design usingthe analytic network process and a hybrid heuristic-basedalgorithm with balance modulating mechanismrdquo InternationalJournal of Bio-Inspired Computation vol 3 no 1 pp 56ndash662011
[35] Z H Che ldquoA particle swarm optimization algorithm for solvingunbalanced supply chain planning problemsrdquo Applied SoftComputing Journal vol 12 no 4 pp 1279ndash1287 2012
[36] I Karkowski ldquoArchitectural synthesis with possibilistic pro-grammingrdquo in Proceedings of the 28th Annual Hawaii Interna-tional Conference on System Sciences vol 1 pp 14ndash22 1995
[37] R E Giachetti and R E Young ldquoA parametric representation offuzzy numbers and their arithmetic operatorsrdquo Fuzzy Sets andSystems vol 91 no 2 pp 185ndash202 1997
[38] J H Moon and C S Kang ldquoApplication of fuzzy decisionmaking method to the evaluation of spent fuel storage optionsrdquoProgress in Nuclear Energy vol 39 no 3-4 pp 345ndash351 2001
[39] J K Cochran and H-N Chen ldquoFuzzy multi-criteria selectionof object-oriented simulation software for production systemanalysisrdquo Computers and Operations Research vol 32 no 1 pp153ndash168 2005
[40] H K Chiou and G H Tzeng ldquoFuzzy hierarchical evaluationwith grey relation model of green engineering for industryrdquoInternational of Fuzzy System vol 3 pp 466ndash475 2001
[41] Y Tsujimura S Chang andM Gen ldquoEffectivemethod for largescale project planning with multiple fuzzy activity timesrdquo inProceedings of the 2nd IEEE International Conference on FuzzySystems pp 1009ndash1015 April 1993
[42] J G Greenhut G Norman and C Temponi ldquoToward afuzzy theory of oligopolistic competitionrdquo in Proceedings ofthe 3rd International Symposium on Uncertainty Modeling andAnalysis and Annual Conference of the North American FuzzyInformation Processing Society (ISUMA-NAFIPSrsquo95) pp 286ndash291 September 1995
[43] S Petrovic andC Fayad ldquoA fuzzy shifting bottleneck hybridisedwith genetic algorithm for real-world job shop schedulingrdquo inProceedings of the Mini-EURO Conference Managing Uncer-tainty in Decision SupportModels C H Antunes and L C DiasEds pp 1ndash6 Coimbra Portugal 2004
[44] G C Huang and P k Wu ldquoThe Development of a standard-ized mathematics Achievement test for seventh graders andits related study analyzed with IRTrdquo Journal of EducationalResearch and Development vol 2 pp 109ndash142 2006
[45] H S Wang and Z H Che ldquoAn integrated model for supplierselection decisions in configuration changesrdquo Expert Systemswith Applications vol 32 no 4 pp 1132ndash1140 2007
[46] M Y Liou and C M Lu ldquoApplication of the transtheoreticalmodel to smoking behavior among freshmenrdquo Journal of HealthEducation vol 24 pp 47ndash70 2005
[47] A E Eiben R Hinterding and Z Michalewicz ldquoParametercontrol in evolutionary algorithmsrdquo IEEE Transactions onEvolutionary Computation vol 3 no 2 pp 124ndash141 1999
[48] W D Kelton R P Sadowski and D A Sadowski Simulationwith ARENA McGraw-Hill New York NY USA 1998
[49] Y Shi and R C Eberhart ldquoComparison between geneticalgorithms and particle swarm optimizationrdquo in Proceedings ofthe 7th International Conference on Evolutionary ProgrammingVII vol 1447 pp 611ndash616 1998
16 The Scientific World Journal
[50] Y Shi and R Eberhart ldquoModified particle swarm optimizerrdquoin Proceedings of the 1998 IEEE International Conference onEvolutionary Computation (ICECrsquo98) pp 69ndash73 May 1998
[51] H Schee ldquoA method for judging all contrasts in the analysis ofvariancerdquo Biometrica vol 40 no 1-2 pp 87ndash104 1953
[52] C C Shen and C Y Hsieh ldquoA study on the relationship amongattraction tourist satisfaction and loyalty of religious tourisma case of Fo Guang Shan in Kaohsiungrdquo Tourism ManagementResearch vol 3 no 1 pp 79ndash95 2003
Submit your manuscripts athttpwwwhindawicom
Computer Games Technology
International Journal of
Hindawi Publishing Corporationhttpwwwhindawicom Volume 2014
Hindawi Publishing Corporationhttpwwwhindawicom Volume 2014
Distributed Sensor Networks
International Journal of
Advances in
FuzzySystems
Hindawi Publishing Corporationhttpwwwhindawicom
Volume 2014
International Journal of
ReconfigurableComputing
Hindawi Publishing Corporation httpwwwhindawicom Volume 2014
Hindawi Publishing Corporationhttpwwwhindawicom Volume 2014
Applied Computational Intelligence and Soft Computing
thinspAdvancesthinspinthinsp
Artificial Intelligence
HindawithinspPublishingthinspCorporationhttpwwwhindawicom Volumethinsp2014
Advances inSoftware EngineeringHindawi Publishing Corporationhttpwwwhindawicom Volume 2014
Hindawi Publishing Corporationhttpwwwhindawicom Volume 2014
Electrical and Computer Engineering
Journal of
Journal of
Computer Networks and Communications
Hindawi Publishing Corporationhttpwwwhindawicom Volume 2014
Hindawi Publishing Corporation
httpwwwhindawicom Volume 2014
Advances in
Multimedia
International Journal of
Biomedical Imaging
Hindawi Publishing Corporationhttpwwwhindawicom Volume 2014
ArtificialNeural Systems
Advances in
Hindawi Publishing Corporationhttpwwwhindawicom Volume 2014
RoboticsJournal of
Hindawi Publishing Corporationhttpwwwhindawicom Volume 2014
Hindawi Publishing Corporationhttpwwwhindawicom Volume 2014
Computational Intelligence and Neuroscience
Industrial EngineeringJournal of
Hindawi Publishing Corporationhttpwwwhindawicom Volume 2014
Modelling amp Simulation in EngineeringHindawi Publishing Corporation httpwwwhindawicom Volume 2014
The Scientific World JournalHindawi Publishing Corporation httpwwwhindawicom Volume 2014
Hindawi Publishing Corporationhttpwwwhindawicom Volume 2014
Human-ComputerInteraction
Advances in
Computer EngineeringAdvances in
Hindawi Publishing Corporationhttpwwwhindawicom Volume 2014
2 The Scientific World Journal
GAs have beenwidely used in solving real-world complexoptimization problems [12ndash16] and Min et al [17] Sha andChe [18] Tsai [19] Ko and Evans [10] Min et al [20]Che and Chiang [21] and Che and Chiang [22] appliedGA to solve the planning issues of a supply chain networkMoreover PSOs also have been widely employed for solvingoptimization problems in different fields and some heuristicalgorithms with similar concept of PSO are developed [23ndash30] Yin and Wang [31] Yu and Fang [32] Chen et al[33] Che and Cui [34] and Che [35] employed a PSO tooptimize a resource distribution system with satisfactoryresults Yet no research efforts were made with respect tothe planning of a reverse supply chain with GA and PSOFor this reason these two heuristic algorithms were used tosolve the reverse supply chain in this paper along with otherthree hybrid algorithms PSO-GA PSO-SA and GA-SAThesolving capability of these five algorithms was compared andthe optimum one was selected as a reference for decision-making
2 Fuzzy Theory
Fuzzy theory first proposed by Zaden in 1965 as an extensionof a general set is a numerical control methodology forimitating human thought and addressing the inaccuracy ofall physical systems According to FuzzyTheory the thoughtlogic of human begins as fuzzy and is intended for judgmenteven if conditions and data are uncertain while moderncomputers feature bipolar logic that is 0 or 1 differentfrom the logic of humans However fuzzy logic theory canrepresent the degree of fuzzy concepts with values between 0and 1 namely ldquomembership functionrdquo
Karkowski [36] indicated that triangular is the mostcommonmembership function in solving possibilistic math-ematical programming problems among the various types ofmembership function Other related studies concerning theuse of triangular fuzzy numbers for decision making prob-lems are [37ndash40] Hence in this paper the defect ratios andtransport loss ratios are denoted by triangular fuzzy numbersThe triangular fuzzy numbers are not compulsory if othertypes of fuzzy numbers are more applicable they can beused
The triangular fuzzy number can be represented as119891 = (119891119897 119891119898 119891119906) where 119891119897 119891119898 and 119891119906 are lower boundmode and upper bound values respectively Figure 1 showsthe triangular possibility distribution of fuzzy number119891
In addition it is essential for practical applications that afuzzy number should be transformed to a numerical valueThe transform process is called ldquodefuzzificationrdquo Associatedordinary number (AON) is a simple method in defuzzifi-cation and many researches have employed it directly andeffectively [41ndash43] In this paper hence the AON is used tofind the crisp value for defect and transport loss ratios TheAONmethod can be expressed as
AON (119891) =119891119897 + 2119891119898 + 119891119906
4 (1)
U(f
)
ffl fm fu
Figure 1 Membership functions of a triangular fuzzy number
3 Problem Formulation and Solving
31 Description and Definition This paper analyzed thereverse distribution activities of defective products in acomplex supply chain network and explored a method offeeding these products back to the manufacturing partnerswith consideration of the capacity constraints of suppliersand the demands of multi-phase multi-product productionand planning Moreover the partners shall be selected basedon total objective functions (minimized production trans-port inspection rework costs and optimized productionquality) in addition the fuzzified production defect ratioand transport loss ratio are taken into account Given thefact of numerous suppliers in a supply chain network withdifferent production characteristics and resource allocationcapabilities covering their capacity and yield it is crucial toselect proper suppliers in a complex supply chain network
Positive logistics are highlighted in a traditional supplychain but unavoidable defects arising from production ortransportation processes are overlooked In practice thedefective products must be returned to the manufacturersRelevant original data in this paper were subjected to 119879-treatment for data integration [44ndash46] Equation (2) is a119879-treatment formula (119883 variable 119883 average SD standarddeviation)
119879 =119883 minus 119883
SD10+ 50 (2)
32 Mathematical Model for Multiphase and MultiproductReverse Supply Chain Themathematical symbols of a reversesupply chain one listed in the Symbols ofMathematicalModelsection
The mathematical model of a multi-phase plan of areverse supply chain is detailed as follows
Minimize [
[
119875
sum119901=1
119868minus1
sum119894=1
119869119894
sum119895=1
119870119894+1
sum119896=1
(PrC(119894119895) times 119883119901
((119894119895)(119894+1119896)))
+119875
sum119901=1
119868
sum119894=1
119869119894
sum119895=1
119870119894+1
sum119896=1
(TrC((119894119895)(119894+1119896))
The Scientific World Journal 3
times (119883119901
((119894119895)(119894+1119896))
+119877119883119901
((119894+1119896)(119894119895))))
+119875
sum119901=1
119868
sum119894=119868
119869119894
sum119895=1
119870119894minus1
sum119896=1
(PrC(119894119895) times 119883119901
((119894minus1119896)(119894119895)))
+119875
sum119901=1
119868
sum119894=1
119869119894
sum119895=1
119870119894+1
sum119896=1
(ChC(119894119895) times 119883119901
((119894119895)(119894+1119896)))]
]
times119875
sum119901=1
119868
sum119894=1
119869119894
sum119895=1
119876119901
(119894119895)
(3)
st119870119894+1
sum119896=1
119883119901
((119894119895)(119894+1119896))
= INT119870119894+1
sum119896=1
119883119901
((119894119895)(119894+1119896))
times (1 minus FTR((119894119895)(119894+1119896))
) + 119877119883119901minus1
((119894+1119896)(119894119895))
119894 = 1 119901 = 1 2 3 119875 119895 = 1 2 3 119869
(4)
119870119894minus1
sum119896=1
119883119901
((119894minus1119896)(119894119895))
= INT[119870119894minus1
sum119896=1
119883119901
((119894minus1119896)(119894119895))times119870119894+1
sum119896=1
(1 minus FTR((119894119895)(119894+1119896))
)]
+
119870119894+1
sum119896=1
119877119883119901minus1
((119894+1119896)(119894119895))minus119870119894minus1
sum119896=1
119877119883119901
((119894119895)(119894minus1119896))
119894 = 2 119868 minus 1 119901 = 1 2 3 119875 119895 = 1 2 3 119869
(5)119870119894minus1
sum119896=1
119883119901
((119894minus1119896)(119894119895))
= INT119870119894minus1
sum119896=1
[119883119901
((119894minus1119896)(119894119895))
times (1 minus FTR((119894119895)(119894minus1119896))
)
minus 119877119883119901
((119894119895)(119894minus1119896))]
119894 = 119868 119901 = 1 2 3 119875 119895 = 1 2 3 119869
(6)
119870119894minus1
sum119896=1
119877119883119901
((119894119895)(119894minus1119896))
= INT(119870119894minus1
sum119896=1
119883119901
((119894minus1119896)(119894119895))
+119870119894+1
sum119896=1
119877119883119901minus1
((119894+1119896)(119894119895))) times FDR
(119894119895)
119894 = 2 3 119868 119901 = 2 3 119875 119895 = 1 2 3 119869
(7)
119883(119894119895)
= INT119870119894+1
sum119896=1
119883119901
((119894119895)(119894+1119896))times (1 minus FDR
(119894119895))
times (1 minus FTR((119894119895)(119894+1119896))
)
119894 = 1 119901 = 1 2 3 119875 119895 = 1 2 3 119869
(8)
119883(119894119895)
= INT119870119894minus1
sum119896=1
119883119901
((119894minus1119896)(119894119895))times (1 minus FDR
(119894119895))
times (1 minus FTR((119894119895)(119894+1119896))
)
119894 = 2 3 119868 minus 1 119901 = 1 2 3 119875
119895 = 1 2 3 119869
(9)
MinCAP(119894119895) le119870119894+1
sum119896=1
119883119901
((119894119895)(119894+1119896))le MaxCAP(119894119895)
119894 = 1 2 119868 minus 1 119901 = 1 2 3 119875 119895 = 1 2 3 119869
(10)
119883119901
((119894119895)(119894+1119896))gt 0 and isin integer forall119894 119895 119896 119901
(11)
119877119883119901
((119894119895)(119894minus1119896))= 0
for 119901 = 0 119894 = 1 2 119868
119895 = 1 2 3 119869 119896 = 1 2 3 119870
(12)
Equation (3) shows objective functions involved in mini-mizing production costs transport costs rework costs checkcosts and quality (quality level 1 is defined as optimumquality and 10 as worst quality) (4) (5) and (6) representquantity transported from the first-hierarchy partner to thesecond-hierarchy partner and finally to the partner of lasthierarchy respectively while the fuzzy transport loss ratioand rework quantity of returned defective products are alsoconsidered (7) represents the rework quantity of defectiveproducts to be returned to the partner of previous hierarchy(8) and (9) indicate that limited production quantities ofpartners from first to last hierarchy shall meet customerdemands (10) indicates that the limited transport quantitywill not be bigger than the maximum capacity nor less thanthe minimum capacity of the partner (11) indicates that thelimited transport quantity must be an integer bigger thanzero and (12) indicates that no defective product is producedin the early phase of multi-product multi-phase productionplanning
4 The Scientific World Journal
33 Proposed Algorithms In this paper GA PSO PSO-GAGA-SA and PSO-SA were applied to determine the bestapproximate solution with minimum objective functions ina reverse supply chain
331 GA Solving Model
Step 1 Develop the structure of chromosome (Figure 2) andthe production and transport quantities were real-codedEiben et al [47] argued that real-coding could accelerate thealgorithm convergence and improve consistency In Figure 2119875(11) rarr 119875(21) represents the transport path from the firstpartner of the first hierarchy to the first partner of the secondhierarchy Gene value is an integral number representing thequantity of partner product transported on the distributionpath
Step 2 Generate a random initial population according tothe final customer demands of the partners restrict thepopulation for meeting the demand constraint (4)sim(12) andthen obtain the Fitness value by substituting the chromosomeinto the objective formula (3)
Step 3 Use Roulette Wheel method to select the chromo-somes Calculate selection probability of every chromosomeof which the chromosomes of better fitness function have ahigher probability
Step 4 Randomly select two chromosomes from the popu-lation for crossover and generate random crossover pointsthen exchange the genes of the chromosome as shown inFigure 3 if the crossover rate is 119909119888 the number of chromo-somes is 119910119888 the crossover quantity is 119909119888 times 119910119888 = 119899119888 a betterefficiency could be achieved if crossover rate is 075sim095 [47]
Step 5 Randomly select a chromosome for mutation with itsposition if the mutation rate is 119909119898 and the number of genesis 119910119898 the mutation number is 119909119898 times 119910119898 = 119899119898 as shown inFigure 4 a higher mutation rate means a higher amplitude amutation rate lt 01 is a typical value [48]
Step 6 When the chromosomes of best offspring are superiorto those of worst population this population will be replacedas a new one
Step 7 Repeat Steps 2 to 6 until the stop conditions aresatisfied
332 PSO Solving Model
Step 1 Set the particle number iteration number maximumspeed learning factor and inertia weight
Step 2 Randomly generate the initial speed and position ofevery particle with the range specified in the constraint (4)sim(12)
Step 3 Substitute the particles of population into the objectivefunction equation (3) to obtain the Pbest of each particle andthe Gbest of the population
Step 4 Update the speed and position of particles usingInertia Weight Method [49] as shown in (13) when 119908ranges between 09 and 12 there is a higher opportunity todetermine a global optimal solution [50] as follows
V119899119894= 119908V119888119894+ 1198881 times rand () times (1199041015840
119894minus 119904119888119894) + 1198882 times rand () times (11990410158401015840
119894minus 119904119888119894)
(13)
119904119899119894= 119904119888119894+ V119899119894 (14)
where V119888119894represents the speed when the particle position is
changed V119899119894is the new speed of particle 119894 119904119888
119894is the current
position of particle 1199041015840119894is the memory value of the individual
best position of particle 119894 11990410158401015840119894is thememory value of the global
best position 119904119899119894is the new position of particle 119894 119908 is inertia
weight rand() is a random variable between (0 1) and 1198881 and1198882 are learning factors
Step 5 Substitute the updated particle position into theconstraint (4)sim(12) review if the updated position meets therequirements of constraints if any particle exceeds the rangeupdate again until all particles meet the requirements ofconstraint (4)sim(12)
Step 6 Compare the particlersquos objective function value withupdated particle position and its Pbest If the objectivefunction value is superior to the Pbest the Pbest of thisparticle will be replaced by its objective function value withupdated particle position
Step 7 Compare the Pbest and Gbest If the best value ofparticle is superior to Gbest the Gbest will be replaced by thebest value of the particle
Step 8 Repeat Steps 2 to 7 until meeting the stop conditionsor reaching the set iteration number
333 PSO-GA Solving Model
Steps 1sim3 Perform Steps 1sim3 of PSO solving model
Step 4 Perform Step 3 of GA solving model to select theparticle positions of better fitness functions stored in thelibraryWith this selectionmechanism there is a higher prob-ability that the particle position of better fitness functionswill become Gbest another new Gbest could be obtainedthrough recombination and the particles could be evaluatedand properly deleted of which the worst individuals arereplaced by optimum individuals after sequencing of fitnessfunctions
The Scientific World Journal 5
Gene cell item
Gene value4660
3793
20519114
893
59
1420
215610
1883855
762721
28512895
00
90
5512821
24143
130
16433
105
P(11)darr darr darr darr darr darr darr darr darr darr darr darr darr darr
P(21)
P(12)
P(21)
P(13)
P(21)
P(14)
P(21)
P(11)
P(22)
P(12)
P(22)
P(13)
P(22)
P(14)
P(22)middot middot middot
middot middot middot
P(31)
P(42)
P(32)
P(42)
P(33)
P(42)
P(31)
P(43)
P(32)
P(43)
P(33)
P(43)43
a
24b
49c
Xa product b product Y
c product Z
Figure 2 Structure of chromosome
Parent 1 Cut point
Gene cell item
Gene value1507481
687914
234139
577622
411552
763790
2010138
Parent 2
Gene cell item
Gene value745641
988678
1269380
802135
338870
501398
162981
Ofspring 1 One point crossover
Gene cell item
Gene value157481
687914
234139
802135
338870
501398
162981
Ofspring 2 Gene cell
item
Gene value745641
988678
1269380
577622
411552
763790
2010138
P(11)darr darr darr darr darr darr darr darr
P(21)
P(12)
P(21)
P(13)
P(21)
P(14)
P(21)
P(11)
P(22)
P(12)
P(22)
P(13)
P(22)
P(14)
P(22)
P(11)darr darr darr darr darr darr darr darr
P(21)
P(12)
P(21)
P(13)
P(21)
P(14)
P(21)
P(11)
P(22)
P(12)
P(22)
P(13)
P(22)
P(14)
P(22)
P(11)darr darr darr darr darr darr darr darr
P(21)
P(12)
P(21)
P(13)
P(21)
P(14) P(11)
P(22)
P(12)
P(22)
P(13)
P(22)
P(14)
P(22)
P(11)darr darr darr darr darr darr darr darr
P(21)
P(12)
P(21)
P(13)
P(21)
P(14)
P(22)
P(22)
P(11)
P(22)
P(12)
P(22)
P(13)
P(22)
P(14)
P(22)
11a
25b
66c
11a
25b
66c
20a
44b
48c
20a
44b
48c
Xa product b product Y
c product Z
Figure 3 Single-point crossover
Step 5 Obtain a new group of good populations using theselection mechanism then perform Steps 1sim3 of PSO solvingmodel and obtain the new Pbest and Gbest
Step 6 Perform Step 5 of GA solving model to randomlyselect mutation particles for single-point mutation and gen-erate a new population
Step 7 Perform Steps 4sim7 of PSO solvingmodel to obtain thenew Pbest and Gbest of the new population
Step 8 Repeat Steps 2 to 7 until stop conditions are met
334 PSO-SA Solving Model
Steps 1sim6 Perform Steps 1sim6 of PSO solving model
Step 7
Substep 71 Set start temperature (119879start) end temperature(119879end) cooling rate (120572) and length of Markov Chain (119872)
Substep 72 Disturb the updated particle under current tem-perature 119879 and generate a neighboring solution 119896
Substep 73 Calculate the objective function perform distur-bance mechanism under current temperature to generate aneighboring solution 119896 and then substitute it into the objec-tive function equation (5) and calculate its fitness function119891(119883) and the difference of the fitness function Δ119891(119899) =119891(1198831015840)minus119891(119883) Obtain initial solution119883 and through iterationof random disturbances neighboring reasonable solutionsobtain a new solution1198831015840 every particle runs across the lengthof Markov Chain119872 several times at start temperature 119879starta fitness is obtained every time (energy function Δ119891(119899))
Substep 74 Judge if this neighboring solution is acceptedthrough probability function using probability function(15) as shown below and then randomly generate randomnumber 119903 from 0 to 1 as follows
119875 (119899) =
1 if Δ119891 (119899) le 0
exp(minusΔ119891 (119899)
119879) if Δ119891 (119899) gt 0
(15)
6 The Scientific World Journal
Old
Gene cell item
Gene value 115687 1505397 176876 234283 871688 412025 469175 923048
New Mutation operator
Gene cell item
Gene value 207964 1505397 176876 234283 573775 412025 287439 923048
P(11)darr darr darr darr darr darr darr darr
P(21)
P(12)
P(21)
P(13)
P(21)
P(14)
P(21)
P(11)
P(22)
P(12)
P(22)
P(13)
P(22)
P(14)
P(22)
P(11)darr darr darr darr darr darr darr darr
P(21)
P(12)
P(21)
P(13)
P(21)
P(14)
P(21)
P(11)
P(22)
P(12)
P(22)
P(13)
P(22)
P(14)
P(22)
Figure 4 Mutation
Substep 75 Compare random number 119903 with probabilitynumber 119875(119899) if 119903 le 119875(119899) it will disturb the neighboringsolution 119896 replace the particle and its fitness function if119903 gt 119875(119899) it will not replace the particle A new disturbancesolution will generate if not accepted until the termination ofset search times
Substep 76 Repeat Substeps 72ndash75 through Markov Chain(119872) until119872 times and then perform the cooling steps indi-cating that a stable state is reached under this temperature
Substep 77 Implement the cooling procedure at the set-cooling rate of 120572 through a cooling mechanism 119879 = 119879 times 120572
Substep 78 Judge if the cycling is finished through the set endtemperature 119879end if 119879 le 119879end perform the next step if 119879 gt119879end repeat Substeps 72 to 77 until 119879 le 119879end
Step 8 Repeat Steps 2 to 7 until reaching the desired iterationnumber
335 GA-SA Solving Model
Steps 1sim5 Perform Steps 1 to 5 of GA solving model
Step 6 Perform Substeps 71 to 78 of PSO-SA solving model
Step 7 Generate new offspring through genetic evolution ifoptimumfitness function of offspring is superior to that of thepopulation will be replaced as a new one otherwise maintainthe chromosomes of original population for next-generationevolution
Step 8 Repeat Steps 3 to 7 until the set stop conditions aremet
4 Illustrative Example and Results Analysis
41 Case Description In a complex supply chain networkeven a leading manufacturer cannot guarantee 100 yieldduring the production process or prevent any defect duringthe transport process However the defect ratio and loss ratioare not fixed thus fuzzy defect ratio and fuzzy transport lossratio are applied in this paper
Based on a supply chain network of 4-4-3-3 thispaper simulated rework activity of returned defective prod-ucts through a multi-product multi-phase production planAssuming that the initial inventory is zero the defectiveproducts arising from the production process of upstreammanufacturers and from the transport process are returnedto original manufacturers for rework the suppliers of 1stndash4th hierarchy have no fixed production defect ratio ortransport loss ratio meanwhile the multi-product multi-phase production is planned into three phases with defectiveproducts only returned during the second phase Moreoverassuming that the production defect ratio and check costsof the first-hierarchy suppliers are not considered only thedefective products from the partners of 2nd to the 4th arereturned for rework in addition assume that the reworkprocess is the same as the production process then therework costs and production costs are the same Accordingto first-phase production planning 119883 products for finalcustomer requirements amount to 400 350 450 and 119884products amount to 250 150 200 and 119885 products amountto 100 200 and 250 Figure 5 depicts the framework ofa reverse supply chain and relevant parameters includingproduction costs (PrC) transport costs (TrC) check costs(ChC) quality (119876) fuzzy defect ratio (FDR) fuzzy transportloss ratio (FTR) and maximum and minimum capacity(Max CAP andMin CAP) Since the production defect ratioand transport loss ratio are fuzzy sets with triangular fuzzynumber (1) is used for defuzzification For partner 119875(21)its fuzzy number of defect ratio is (06 22 3) then itsFDR is 2 according to (1) For the conciseness of this paperthe detail calculating processes of the production defect andtransport loss ratios for all partners and transport paths arenot presented and their defuzzified values are shown inFigure 5
42 Experimental Results and Analysis PSO GA PSO-GAGA-SA and PSO-SAwere applied for solving the distributionissues of a reverse supply chain network the experimentaldesign was conducted under the parameters of solvingperformance of which every combination of parameters wasimplemented 20 times to determine an optimal combinationas listed in Table 1
It is learnt from Table 1 that the optimal combination ofPSO parameters is particle number 10 generation number1000 maximum speed 125 inertia weight 215 and learningfactor 205 the optimal combination of GA parameters is
The Scientific World Journal 7
Table 1 Combination of experimental parameters
PSO
Population size 10 10 10 10 20 20 20 20Generations 500 500 1000 1000 500 500 1000 1000Max velocity 095 125 095 125 095 125 095 125Initial weight 125 215 125 215 125 215 125 215
1198881 1198882 205 205 205 205 205 205 205 205Avg fitness 24462289 24461153 24460103 24458116 24459087 24460841 24458923 24457531
Avg execution time (sec) 6731 6896 12468 12391 12842 12546 21391 21016Avg convergence time (sec) 4766 4275 8791 8437 7986 8311 17694 16972
GA
Population size 5 5 5 5 10 10 10 10Generations 500 500 1000 1000 500 500 1000 1000Crossover rate 075 08 075 08 075 08 075 08Mutation rate 008 007 008 007 008 007 008 007Avg fitness 24465387 24464085 24462752 24461924 24463297 24463159 244603191 24459450
Avg execution time (sec) 19373 18859 67693 68047 47375 47734 225836 217512Avg convergence time (sec) 17716 16827 62549 62764 44507 44642 219675 211741
PSO-GA
Population size 10 10 10 10 20 20 20 20Generations 500 500 1000 1000 500 500 1000 1000Max velocity 095 125 095 125 095 125 095 125Initial weight 125 215 125 215 125 215 125 215
1198881 1198882 205 205 205 205 205 205 205 205Mutation rate 008 007 008 007 008 007 008 007Avg fitness 24790482 24692938 24662117 24579829 24507556 24453060 24697893 24662084
Avg execution time (sec) 6758 6579 11864 12714 12898 12685 23257 22934Avg convergence time (sec) 3147 3038 5342 6182 6379 5824 12681 12507
GA-SA
Population size 5 5 5 5 10 10 10 10Generations 500 500 1000 1000 500 500 1000 1000Crossover rate 075 08 075 08 075 08 075 08Mutation rate 008 007 008 007 008 007 008 007
Initial temperature 300 300 400 400 300 300 400 400Markov Chain Length 50 50 100 100 50 50 100 100
Cooling rate 09 09 099 099 09 09 099 099Final temperature 1 1 5 5 1 1 5 5
Avg fitness 24459076 24458365 24458351 24458067 24457247 24456391 24457425 24457544Avg execution time (sec) 27477 26041 81462 79039 68671 66993 279145 274338
Avg convergence time (sec) 22374 20768 74744 73412 63467 62522 265074 263862
PSO-SA
Population size 10 10 10 10 20 20 20 20Generations 500 500 1000 1000 500 500 1000 1000Max velocity 095 125 095 125 095 125 095 125Initial weight 125 215 125 215 125 215 125 215
1198881 1198882 205 205 205 205 205 205 205 205Initial temperature 300 300 400 400 300 300 400 400
Markov Chain Length 50 50 100 100 50 50 100 100Cooling rate 09 09 099 099 09 09 099 099
Final temperature 1 1 5 5 1 1 5 5Avg fitness 24457588 24457887 24455842 24455147 24455895 24456068 24456457 24456778
Avg execution time (sec) 14073 13422 26087 25971 26479 25706 38926 37433Avg convergence time (sec) 6102 5674 11479 10347 11887 12624 19211 16708
8 The Scientific World Journal
First echelon Second echelon Third echelon Fourth echelon
Q 1 Demand
Demand
Demand
LogisticsReverse logistics
723612414134221413312614425222323521422124722621
843222924322112453511641722235133322
Production cost (PrC)
Quality (Q)
Transportation cost (TrC)
Check cost (ChC)
415542653634242414325423322
Fuzzy defective rate (FDR)
MinCAP lt X lt maxCAP
Fuzzy transportation loss ratio (FTR)
PrC 15
50 lt X lt 3500
Q 1PrC 24
70 lt X lt 3300
Q 3PrC 32
40 lt X lt 3400
Q 5PrC 41
30 lt X lt 3300
Q 4
PrC 35
70 lt X lt 4000
Q 1
PrC 18
50 lt X lt 3500
Q 2
PrC 22
80 lt X lt 3300
Q 4
PrC 34
60 lt X lt 3400
Q 4
PrC 30
40 lt X lt 3200
Q 3
PrC 20
30 lt X lt 3600
Q 2
PrC 27
40 lt X lt 3400
Q 3
PrC 45
30 lt X lt 3700
Q 1
PrC 13
50 lt X lt 3600
Q 2
PrC 36
30 lt X lt 3300
P(31) rarr P(41)
P(31) rarr P(42)
P(31) rarr P(43)
P(32) rarr P(41)
P(32) rarr P(42)
P(32) rarr P(43)
P(33) rarr P(41)
P(33) rarr P(42)
P(33) rarr P(43)
P(21) rarr P(31)
P(21) rarr P(32)
P(21) rarr P(33)
P(22) rarr P(31)
P(22) rarr P(32)
P(22) rarr P(33)
P(23) rarr P(31)
P(23) rarr P(32)
P(23) rarr P(33)
P(24) rarr P(31)
P(24) rarr P(32)
P(24) rarr P(33)
P(14) rarr P(21)
P(14) rarr P(22)
P(14) rarr P(23)
P(14) rarr P(24)
P(11) rarr P(21)
P(11) rarr P(22)
P(11) rarr P(23)
P(11) rarr P(23)
P(12) rarr P(21)
P(12) rarr P(22)
P(12) rarr P(23)
P(12) rarr P(24)
P(13) rarr P(21)
P(13) rarr P(22)
P(13) rarr P(23)
P(13) rarr P(24)
TrCFTRChCTrCFTRChCTrCFTRChC
P(41)P(31)P(21)
P(42)P(32)P(22)
P(43)P(33)P(23)
P(24)
P(11)
P(12)
P(13)
P(14)
FDR 2 FDR 5 FDR 1
FDR 3FDR 3FDR 1
FDR 2 FDR 1 FDR 2
FDR 4
Figure 5 4-4-3-3 reverse supply chain network
population number 10 generation number 1000 crossoverrate 08 and mutation rate 007 the optimal combinationof PSO-GA parameters is particle number 20 generationnumber 500 maximum speed 125 inertia weight 215learning factor 205 and mutation rate 007 the optimalcombination of GA-SA parameters is population number 10generation number 500 crossover rate 08mutation rate 007start temperature 300 Markov Chain 50 cooling rate 09
and end temperature 1 the optimal combination of PSO-SAparameters is particle number 10 generation number 1000maximum speed 125 inertia weight 215 learning factor 205start temperature 400 Markov Chain 100 cooling rate 099end temperature 5
To compare the advantages and disadvantages of thesealgorithms ANOVA was used to judge if convergence valueexecution time and convergence time differed considerably
The Scientific World Journal 9
Table 2 ANOVA verification of fitness values
HypothesizeH0
Fitness120583PSO = Fitness120583GA = Fitness120583PSO-GA = Fitness120583GA-SA = Fitness120583PSO-SA
H1 otherwiseAlgorithm Numbers Sum Average VariancePSO 30 734139577 2447131923 1120394034GA 30 734406462 244802154 910941494PSO-GA 30 733498321 2444994403 1372449396GA-SA 30 733929774 244643258 752499584PSO-SA 30 733666393 2445554643 3467767352Source SS Freedom MS 119865 119875 value Critical valueIntergroup 176119864 + 10 4 4389633912 287880644 002486 2434065Intragroup 221119864 + 11 145 1524810372Sum 239119864 + 11 149
Result reject H0
Table 3 ANOVA verification of execution time
HypothesizeH0
ET120583PSO = ET120583GA = ET120583PSO-GA = ET120583GA-SA = ET120583PSO-SA
H1 otherwiseAlgorithm Numbers Sum Average VariancePSO 30 372022 1240073 0076341375GA 30 6524661 2174887 0165604217PSO-GA 30 380424 126808 0076438303GA-SA 30 2004847 6682823 0187643495PSO-SA 30 775495 2584983 0192059868Source SS Freedom MS 119865 119875 value Critical valueIntergroup 9081557 4 2270389 1626150094 000000 2434065Intragroup 2024453 145 0139617Sum 908176 149
Result reject H0
Table 4 ANOVA verification of convergence time
HypothesizeH0
CT120583PSO = CT120583GA = CT120583PSO-GA = CT120583GA-SA = CT120583PSO-SA
H1 otherwiseAlgorithm Numbers Sum Average VariancePSO 30 246605 8220167 00913266GA 30 6375408 2125136 07256669PSO-GA 30 171189 57063 0014925GA-SA 30 1863747 621249 04336888PSO-SA 30 326895 108965 02385541Source SS Freedom MS 119865 119875 value Critical valueIntergroup 939149 4 2347872 78045896 000000 2434065Intragroup 4362068 145 0300832Sum 123119864 + 09 89
Result reject H0
10 The Scientific World Journal
Table 5 Multiple comparison on fitness valueFitness120583PSO
Fitness120583GAFitness120583PSO-GA
Fitness120583GA-SAFitness120583GA (minus +)Fitness120583PSO-GA (+ +) (+ +)Fitness120583GA-SA (+ +) (+ +) (minus +)Fitness120583PSO-SA (+ +) (+ +) (minus +) (minus +)
Table 6 Multiple comparison on execution timeET120583PSO
ET120583GAET120583PSO-GA
ET120583GA-SAET120583GA (minus minus)ET120583PSO-GA (minus minus) (+ +)ET120583GA-SA (minus minus) (+ +) (minus minus)ET120583PSO-SA (minus minus) (+ +) (minus minus) (+ +)
Table 7 Multiple comparison on convergence timeCT120583PSO
CT120583GACT120583PSO-GA
CT120583GA-SACT120583GA (minus minus)CT120583PSO-GA (+ +) (+ +)CT120583GA-SA (minus minus) (+ +) (minus minus)CT120583PSO-SA (minus minus) (+ +) (minus minus) (+ +)
then the algorithms were compared using Scheffersquos multiplecomparison method [51] one-way ANOVA was used tocheck the difference of characteristics and variables [52]Scheffersquos multiple comparison method was then used tocheck the differences of the various groups and whether thedifferences reached a significant level Tables 2 3 and 4 listthe comparative check data of the five algorithms which weresourced from 30 occasions of independent calculations forthe optimal combination of parameters
In Tables 2ndash4 the results of ANOVA verification areshown that all H0 are rejected (119875 value lt 120572 = 005)Then the fitness value execution time and convergence timeof the algorithms were compared using Scheffersquos multiplecomparison method with Scheffersquos equation as follows
119909119894 minus 119909119895 minus radic(119896 minus 1) 119865120572(119896minus1)(119899minus119896)radicMSE( 1
119899119894+1
119899119895)
119909119894 minus 119909119895 + radic(119896 minus 1) 119865120572(119896minus1)(119899minus119896)radicMSE( 1
119899119894+1
119899119895)
(16)
where 119909119894 119909119895 are the mean values of algorithms compared 119896 isgroup freedom119865120572(119896minus1)(119899minus119896) is critical valueMSE is intergroupMS 119899119894 119899119895 is number of samples
Table 5 shows Fitness120583PSO-GA = Fitness120583GA-SA =Fitness120583PSO-SA lt Fitness120583PSO = Fitness120583GA that is PSO-GA GA-SA and PSO-SA are all better than PSO andGA and there are no clear differences in the fitnessvalues of the three algorithms The comparative resultof system execution time is shown in Table 6 and
ET120583PSO lt ET120583PSO-GA lt ET120583PSO-SA lt ET120583GA-SA lt ET120583GAis the PSO is superior to other solving models Theconvergence times of the algorithms are shown in Table 7and CT120583PSO-GA lt CT120583PSO lt CT120583PSO-SA lt CT120583GA-SA lt CT120583GAPSO-GA lt PSO lt PSO-SA lt GA-SA lt GA that is PSO-GAhas faster convergence speed than PSO PSO-SA GA-SAand GA The results show that PSO-GA performs better infitness value execution time and convergence time Thenthe PSO-GA is employed to make the distribution plan ofthree periods reverse supply chain and the results are shownin Tables 8 9 and 10
5 Conclusions
This paper focused on analyzing the issues of returningdefective products to original manufacturers in a reversesupply chain system Fuzzy defect and fuzzy transport lossratios were considered and an optimized mathematicalmodel was developedThis model combined cost and qualitywithT-technology and described how to plan a reverse supplychain on the precondition of meeting customer demandsand realizing the capacity of partners To solve the problemsefficiently three hybrid algorithms were applied to thisreverse model including PSO-GA PSO-SA and GA-SAthen the performances of these algorithms were comparedThe experimental results show that if the fitness valueexecution time and convergence time are considered PSO-GA has the minimal value which means that PSO-GA hasthe qualities and capabilities for dealing with the productionplanning and distribution of a multi-phase multi-productreverse supply chain
The Scientific World Journal 11
Table8Distrib
utionplan
byPS
O-G
A(firstp
eriod)
From
ToEchelon2
Echelon3
Echelon4
119875(21)
119875(22)
119875(23)
119875(24)
119875(31)
119875(32)
119875(33)
119875(41)
119875(42)
119875(43)
Echelon1
119875(11)
10a 6b49c
7336
4211059
242535
119875(12)
142474
1742633
34182
10210234
119875(13)
1572457
256381
72956
221155
119875(14)
74396
761721
31813
74141
Echelon2
119875(21)
177383
11680
8210325
119875(22)
458237
1091417
8676
119875(23)
5310060
4133
175865
119875(24)
1112369
1029244
921130
Echelon3
119875(31)
17000
1000174
910255
119875(32)
9500
4700
12300
119875(33)
139253101
21315532
2452040
a Produ
ctX
b produ
ctY
c produ
ctZ
12 The Scientific World Journal
Table9Distrib
utionplan
byPS
O-G
A(secon
dperio
d)
From
ToEchelon1
Echelon2
Echelon3
Echelon4
119875(11)
119875(12)
119875(13)
119875(14)
119875(21)
119875(22)
119875(23)
119875(24)
119875(31)
119875(32)
119875(33)
119875(41)
119875(42)
119875(43)
Echelon1
119875(11)
1007612
694880
6134947
18550
119875(12)
341922
0270
2145047
911014
119875(13)
9533495
1311351
81740
285126
119875(14)
111110
1215100
9910
125215
Reverse
Echelon2
119875(21)
000
300
300
122
13032067
1892759
10850
119875(22)
200
400
600
221
15537213
523817
0290
119875(23)
100
100
000
122
82344
12
12362108
819410
119875(24)
000
100
000
183
55051
13970
556390
Reverse
Echelon3119875(31)
600
1500
200
4137
413030
1343610
11700
119875(32)
300
300
100
013
13000
12100
603960
119875(33)
200
000
000
26
32260151
1430304
646150
Reverse
Echelon4119875(41)
300
200
231
119875(42)
400
200
885
119875(43)
300
400
76
3Dem
and
400300150
400350300
25040
0150
The Scientific World Journal 13
Table10D
istrib
utionplan
byPS
O-G
A(th
irdperio
d)
From
ToEchelon1
Echelon2
Echelon3
Echelon4
119875(11)
119875(12)
119875(13)
119875(14)
119875(21)
119875(22)
119875(23)
119875(24)
119875(31)
119875(32)
119875(33)
119875(41)
119875(42)
119875(43)
Echelon1
119875(11)
86184
40615108
301253
248313
119875(12)
346036
137628
1651376
3515930
119875(13)
2724
301217
471160
278285
119875(14)
56010
7831
8610222
174698
Reverse
Echelon2
119875(21)
200
100
200
293
26915
332349
1135511
119875(22)
200
000
400
014
430362
3727318
10504
119875(23)
100
300
000
092
21728238
82238
93646
119875(24)
000
100
000
223
216061
2218348
9910412
Reverse
Echelon3119875(31)
500
600
300
22712
1900354
21300
580193
119875(32)
500
100
300
357
932530
16500
11300
119875(33)
000
000
200
272
16600
12330287
230246
Reverse
Echelon4119875(41)
100
200
36
2119875(42)
500
400
5716
119875(43)
300
200
2175
Dem
and
450250350
500300100
400200200
14 The Scientific World Journal
Symbols of Mathematical Model
119899 Number of products 119899 = 1 2 3 119873119873 Total number119894 Hierarchy of supply chain 119894 = 1 2 3 119868119868 Total number of hierarchy of supply chain119901 Production phase 119905 = 1 2 3 119879119875 Total production phase119869119894 Serial number of partner of 119894th hierarchy119870119894 Serial number of partner of 119894th hierarchy
designated to original manufacturerChC(119894119895) Check cost of 119895th partner of 119894th hierarchyPrC(119894119895) Production cost of 119895th partner of 119894th
hierarchyTrC((119894119895)(119894+1119896)) Transport cost from 119895th partner of 119894th
hierarchy to original (designated) partner119896 of 119894 + 1 hierarchy
FTR((119894119895)(119894+1119896))
Fuzzy transport loss ratio from 119895th partnerof 119894th hierarchy to original (designated)partner of 119894 + 1 hierarchy
FDR(119894119895)
Fuzzy defect ratio of 119895th partner of 119894thhierarchy
119883119901
(119894119895) Production quantity of 119895th partner of 119894th
hierarchy at phase 119901119883119875((119894119895)(119894+1119896))
Transport quantity from 119895th partner of 119894thhierarchy at phase 119901 to original(designated) partner of 119894 + 1 hierarchy
119877119883119875minus1((119894+1119896)(119894119895))
Quantity of defective products transportedfrom 119895th partner of 119894th hierarchy at phase119901 minus 1 back to original (designated) partnerof 119894 + 1 hierarchy
MaxCAP(119894119895) Maximum capacity of 119895th partner of 119894thhierarchy
MinCAP(119894119895) Minimum capacity of 119895th partner of 119894thhierarchy
119876119901
(119894119895) Quality level of 119895th partner of 119894th
hierarchy at phase 119901ChC(119894119895) Check cost of 119895th partner of 119894th hierarchyPrC(119894119895) Production cost of 119895th partner of 119894th
hierarchyTrC((119894119895)(119894+1119896)) Transport cost from 119895th partner of 119894th
hierarchy to original (designated) partner119896 of 119894 + 1 hierarchy
SD119876(119894119895)
Standard deviation of quality of 119895thpartner of 119894th hierarchy
SDChC(119894119895)
Standard deviation of check cost of 119895thpartner of 119894th hierarchy
SDPrC(119894119895)
Standard deviation of production cost of119895th partner of 119894th hierarchy
SDTrC((119894119895)(119894+1119896))
Standard deviation of transport cost from119895th partner of 119894th hierarchy to original(designated) partner 119896 of 119894 + 1 hierarchy
INT Integer
Conflict of Interests
The authors declare that there is no conflict of interestsregarding the publication of this paper
Acknowledgments
The authors would like to thank Mr K Hsiao for supportingwriting programs and theNational ScienceCouncil of Taiwanfor their partial financial support (Grants nos NSC 102-2410-H-027-009 and NSC 101-2410-H-027-006) The authorswould also like to acknowledge the editors and anonymousreviewers for their helpful comments and suggestions whichgreatly improved the presentation of this paper
References
[1] G Desbarats ldquoThe innovation supply chainrdquo Supply ChainManagement vol 4 no 1 pp 7ndash10 1999
[2] S M Disney M M Naim and A Potter ldquoAssessing the impactof e-business on supply chain dynamicsrdquo International Journalof Production Economics vol 89 no 2 pp 109ndash118 2004
[3] T M Simatupang and R Sridharan ldquoThe collaboration indexa measure for supply chain collaborationrdquo International Journalof Physical Distribution and Logistics Management vol 35 no 1pp 44ndash62 2005
[4] D Y Sha and Z H Che ldquoVirtual integration with a multi-criteria partner selectionmodel for themulti-echelonmanufac-turing systemrdquo International Journal of Advanced Manufactur-ing Technology vol 25 no 7-8 pp 793ndash802 2005
[5] M Tuominen and M Anttila ldquoStrategising for innovationand inter-firm collaboration capability analysis in assessingcompetitive superiorityrdquo International Journal of TechnologyManagement vol 33 no 2-3 pp 214ndash233 2006
[6] S Dowlatshahi ldquoDeveloping a theory of reverse logisticsrdquoInterfaces vol 30 no 3 pp 143ndash155 2000
[7] L-H Shih ldquoReverse logistics system planning for recyclingelectrical appliances and computers in Taiwanrdquo ResourcesConservation and Recycling vol 32 no 1 pp 55ndash72 2001
[8] ADesai andAMital ldquoEvaluation of disassemblability to enabledesign for disassembly in mass productionrdquo International Jour-nal of Industrial Ergonomics vol 32 no 4 pp 265ndash281 2003
[9] I Dobos ldquoOptimal production-inventory strategies for aHMMS-type reverse logistics systemrdquo International Journal ofProduction Economics vol 81-82 pp 351ndash360 2003
[10] H J Ko and G W Evans ldquoA genetic algorithm-based heuristicfor the dynamic integrated forwardreverse logistics networkfor 3PLsrdquoComputers and Operations Research vol 34 no 2 pp346ndash366 2007
[11] M Gen and R Cheng Genetic Algorithms and EngineeringDesign John Wiley amp Sons New York NY USA 1997
[12] B Stojanovic M Milivojevic M Ivanovic N Milivojevicand D Divac ldquoAdaptive system for dam behavior modelingbased on linear regression and genetic algorithmsrdquo Advances inEngineering Software vol 65 pp 182ndash190 2013
[13] R Belevicius D Jatulis and D Sesok ldquoOptimization of tallguyed masts using genetic algorithmsrdquo Engineering Structuresvol 56 pp 239ndash245 2013
[14] D S Hong andH S Cho ldquoA genetic-algorithm-based approachto the generation of robotic assembly sequencesrdquo ControlEngineering Practice vol 7 no 2 pp 151ndash159 1999
[15] L Ozdamar ldquoA genetic algorithm approach to a generalcategory project scheduling problemrdquo IEEE Transactions onSystems Man and Cybernetics C vol 29 no 1 pp 44ndash59 1999
[16] M F Sebaaly and H Fujimoto ldquoGenetic planner for assemblyautomationrdquo inProceedings of the IEEE International Conference
The Scientific World Journal 15
on Evolutionary Computation (ICECrsquo96) pp 401ndash406 May1996
[17] H Min C S Ko and H J Ko ldquoThe spatial and temporalconsolidation of returned products in a closed-loop supplychain networkrdquo Computers and Industrial Engineering vol 51no 2 pp 309ndash320 2006
[18] D Y Sha and Z H Che ldquoSupply chain network designpartner selection and productiondistribution planning using asystematic modelrdquo Journal of the Operational Research Societyvol 57 no 1 pp 52ndash62 2006
[19] C-F Tsai ldquoAn intelligent adaptive system for the optimalvariable selections of RampD and quality supply chainsrdquo ExpertSystems with Applications vol 31 no 4 pp 808ndash825 2006
[20] H Min H J Ko and C S Ko ldquoA genetic algorithm approachto developing the multi-echelon reverse logistics network forproduct returnsrdquo Omega vol 34 no 1 pp 56ndash69 2006
[21] Z H Che and C J Chiang ldquoA modified Pareto genetic algo-rithm for multi-objective build-to-order supply chain planningwith product assemblyrdquo Advances in Engineering Software vol41 no 7-8 pp 1011ndash1022 2010
[22] Z H Che and T A Chiang ldquoDesigning a collaborative supplychain plan using the analytic hierarchy process and geneticalgorithm with cycle time estimationrdquo International Journal ofProduction Research vol 50 no 16 pp 4426ndash4443 2012
[23] Z H Che ldquoPSO-based back-propagation artificial neural net-work for product and mold cost estimation of plastic injectionmoldingrdquo Computers and Industrial Engineering vol 58 no 4pp 625ndash637 2010
[24] E Garcıa-Gonzalo and J L Fernandez-Martınez ldquoA briefhistorical review of particle swarmoptimization (PSO)rdquo Journalof Bioinformatics and Intelligent Control vol 1 no 1 pp 3ndash162012
[25] L Ali and S L Sabat ldquoParticle swarm optimization based uni-versal solver for global optimizationrdquo Journal of Bioinformaticsand Intelligent Control vol 1 no 1 pp 95ndash105 2012
[26] R K Sahu S Panda U K Rout and P Raul ldquoApplicationof gravitational search algorithm for load frequency controlof multi area power systemrdquo Journal of Bioinformatics andIntelligent Control vol 2 no 3 pp 200ndash210 2013
[27] A S Reddy and K Vaisakh ldquoEnvironmental constrained eco-nomic dispatch by modified shuffled frog leaping algorithmrdquoJournal of Bioinformatics and Intelligent Control vol 2 no 3pp 216ndash222 2013
[28] L P Xie J C Zeng and R A Formato ldquoSelection strategies forgravitational constant G in artificial physics optimisation basedon analysis of convergence propertiesrdquo International Journal ofBio-Inspired Computation vol 4 no 6 pp 380ndash391 2012
[29] X J Cai S J Fan and Y Tan ldquoLight responsive curve selectionfor photosynthesis operator of APOArdquo International Journal ofBio-Inspired Computation vol 4 no 6 pp 373ndash379 2012
[30] K Agarwal M Goyal and P R Srivastava ldquoCode coverageusing intelligent water drop (IWD)rdquo International Journal ofBio-Inspired Computation vol 4 no 6 pp 392ndash402 2012
[31] P-Y Yin and J-Y Wang ldquoA particle swarm optimizationapproach to the nonlinear resource allocation problemrdquoAppliedMathematics and Computation vol 183 no 1 pp 232ndash2422006
[32] J X Yu and X Y Fang ldquoDynamic reactive power optimizationbased on particle swam optimization algorithmrdquo East ChinaElectric Power vol 34 no 11 pp 21ndash25 2006
[33] Y H Chen W J Wang and C H Chiu ldquoParticle swarmoptimization algorithm and its application to power systemrdquoHenan Science vol 25 no 1 pp 29ndash32 2007
[34] Z H Che and Z Cui ldquoUnbalanced supply chain design usingthe analytic network process and a hybrid heuristic-basedalgorithm with balance modulating mechanismrdquo InternationalJournal of Bio-Inspired Computation vol 3 no 1 pp 56ndash662011
[35] Z H Che ldquoA particle swarm optimization algorithm for solvingunbalanced supply chain planning problemsrdquo Applied SoftComputing Journal vol 12 no 4 pp 1279ndash1287 2012
[36] I Karkowski ldquoArchitectural synthesis with possibilistic pro-grammingrdquo in Proceedings of the 28th Annual Hawaii Interna-tional Conference on System Sciences vol 1 pp 14ndash22 1995
[37] R E Giachetti and R E Young ldquoA parametric representation offuzzy numbers and their arithmetic operatorsrdquo Fuzzy Sets andSystems vol 91 no 2 pp 185ndash202 1997
[38] J H Moon and C S Kang ldquoApplication of fuzzy decisionmaking method to the evaluation of spent fuel storage optionsrdquoProgress in Nuclear Energy vol 39 no 3-4 pp 345ndash351 2001
[39] J K Cochran and H-N Chen ldquoFuzzy multi-criteria selectionof object-oriented simulation software for production systemanalysisrdquo Computers and Operations Research vol 32 no 1 pp153ndash168 2005
[40] H K Chiou and G H Tzeng ldquoFuzzy hierarchical evaluationwith grey relation model of green engineering for industryrdquoInternational of Fuzzy System vol 3 pp 466ndash475 2001
[41] Y Tsujimura S Chang andM Gen ldquoEffectivemethod for largescale project planning with multiple fuzzy activity timesrdquo inProceedings of the 2nd IEEE International Conference on FuzzySystems pp 1009ndash1015 April 1993
[42] J G Greenhut G Norman and C Temponi ldquoToward afuzzy theory of oligopolistic competitionrdquo in Proceedings ofthe 3rd International Symposium on Uncertainty Modeling andAnalysis and Annual Conference of the North American FuzzyInformation Processing Society (ISUMA-NAFIPSrsquo95) pp 286ndash291 September 1995
[43] S Petrovic andC Fayad ldquoA fuzzy shifting bottleneck hybridisedwith genetic algorithm for real-world job shop schedulingrdquo inProceedings of the Mini-EURO Conference Managing Uncer-tainty in Decision SupportModels C H Antunes and L C DiasEds pp 1ndash6 Coimbra Portugal 2004
[44] G C Huang and P k Wu ldquoThe Development of a standard-ized mathematics Achievement test for seventh graders andits related study analyzed with IRTrdquo Journal of EducationalResearch and Development vol 2 pp 109ndash142 2006
[45] H S Wang and Z H Che ldquoAn integrated model for supplierselection decisions in configuration changesrdquo Expert Systemswith Applications vol 32 no 4 pp 1132ndash1140 2007
[46] M Y Liou and C M Lu ldquoApplication of the transtheoreticalmodel to smoking behavior among freshmenrdquo Journal of HealthEducation vol 24 pp 47ndash70 2005
[47] A E Eiben R Hinterding and Z Michalewicz ldquoParametercontrol in evolutionary algorithmsrdquo IEEE Transactions onEvolutionary Computation vol 3 no 2 pp 124ndash141 1999
[48] W D Kelton R P Sadowski and D A Sadowski Simulationwith ARENA McGraw-Hill New York NY USA 1998
[49] Y Shi and R C Eberhart ldquoComparison between geneticalgorithms and particle swarm optimizationrdquo in Proceedings ofthe 7th International Conference on Evolutionary ProgrammingVII vol 1447 pp 611ndash616 1998
16 The Scientific World Journal
[50] Y Shi and R Eberhart ldquoModified particle swarm optimizerrdquoin Proceedings of the 1998 IEEE International Conference onEvolutionary Computation (ICECrsquo98) pp 69ndash73 May 1998
[51] H Schee ldquoA method for judging all contrasts in the analysis ofvariancerdquo Biometrica vol 40 no 1-2 pp 87ndash104 1953
[52] C C Shen and C Y Hsieh ldquoA study on the relationship amongattraction tourist satisfaction and loyalty of religious tourisma case of Fo Guang Shan in Kaohsiungrdquo Tourism ManagementResearch vol 3 no 1 pp 79ndash95 2003
Submit your manuscripts athttpwwwhindawicom
Computer Games Technology
International Journal of
Hindawi Publishing Corporationhttpwwwhindawicom Volume 2014
Hindawi Publishing Corporationhttpwwwhindawicom Volume 2014
Distributed Sensor Networks
International Journal of
Advances in
FuzzySystems
Hindawi Publishing Corporationhttpwwwhindawicom
Volume 2014
International Journal of
ReconfigurableComputing
Hindawi Publishing Corporation httpwwwhindawicom Volume 2014
Hindawi Publishing Corporationhttpwwwhindawicom Volume 2014
Applied Computational Intelligence and Soft Computing
thinspAdvancesthinspinthinsp
Artificial Intelligence
HindawithinspPublishingthinspCorporationhttpwwwhindawicom Volumethinsp2014
Advances inSoftware EngineeringHindawi Publishing Corporationhttpwwwhindawicom Volume 2014
Hindawi Publishing Corporationhttpwwwhindawicom Volume 2014
Electrical and Computer Engineering
Journal of
Journal of
Computer Networks and Communications
Hindawi Publishing Corporationhttpwwwhindawicom Volume 2014
Hindawi Publishing Corporation
httpwwwhindawicom Volume 2014
Advances in
Multimedia
International Journal of
Biomedical Imaging
Hindawi Publishing Corporationhttpwwwhindawicom Volume 2014
ArtificialNeural Systems
Advances in
Hindawi Publishing Corporationhttpwwwhindawicom Volume 2014
RoboticsJournal of
Hindawi Publishing Corporationhttpwwwhindawicom Volume 2014
Hindawi Publishing Corporationhttpwwwhindawicom Volume 2014
Computational Intelligence and Neuroscience
Industrial EngineeringJournal of
Hindawi Publishing Corporationhttpwwwhindawicom Volume 2014
Modelling amp Simulation in EngineeringHindawi Publishing Corporation httpwwwhindawicom Volume 2014
The Scientific World JournalHindawi Publishing Corporation httpwwwhindawicom Volume 2014
Hindawi Publishing Corporationhttpwwwhindawicom Volume 2014
Human-ComputerInteraction
Advances in
Computer EngineeringAdvances in
Hindawi Publishing Corporationhttpwwwhindawicom Volume 2014
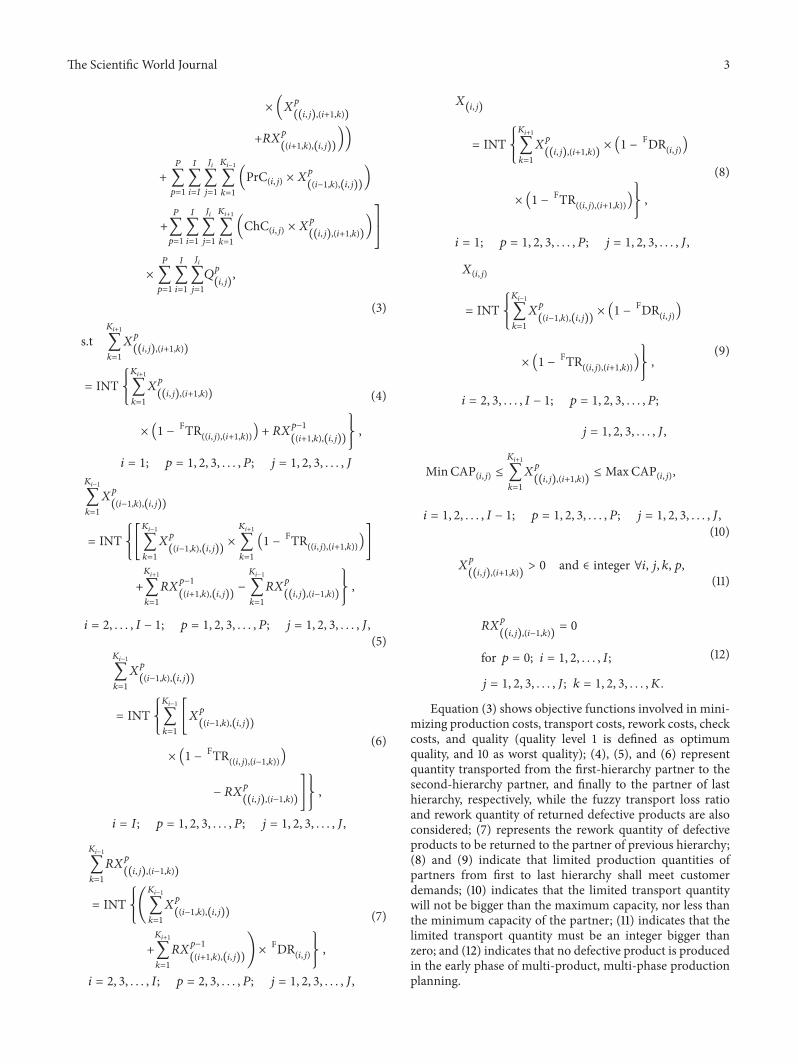
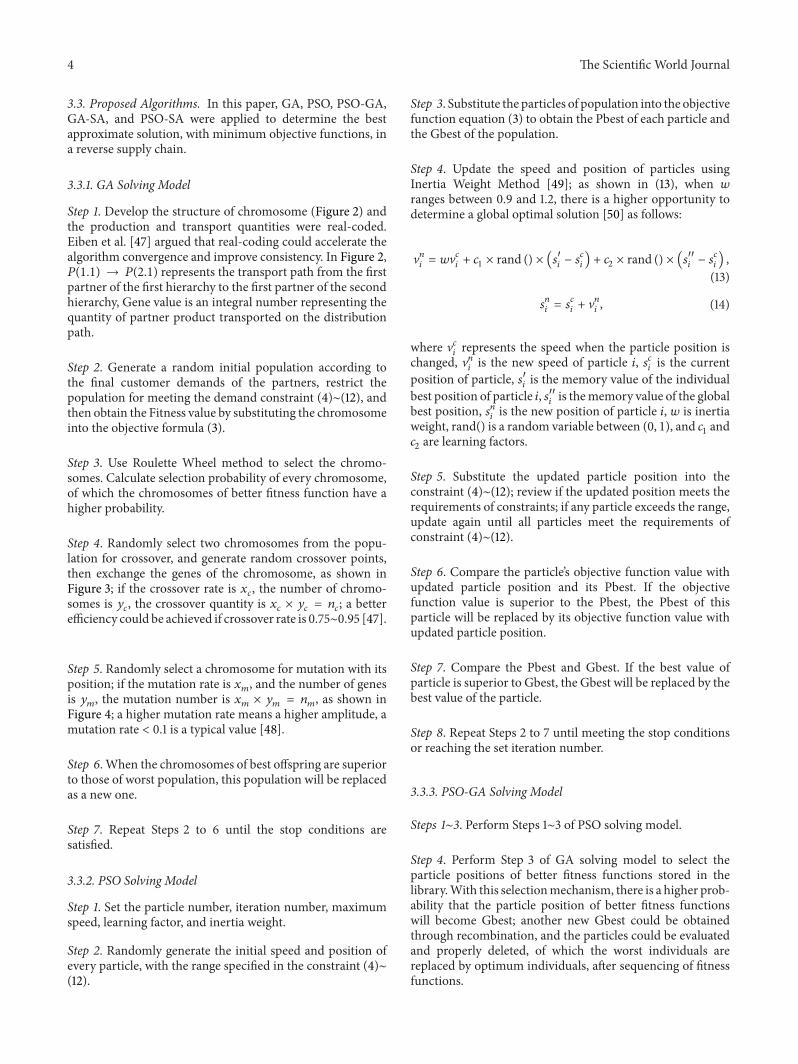
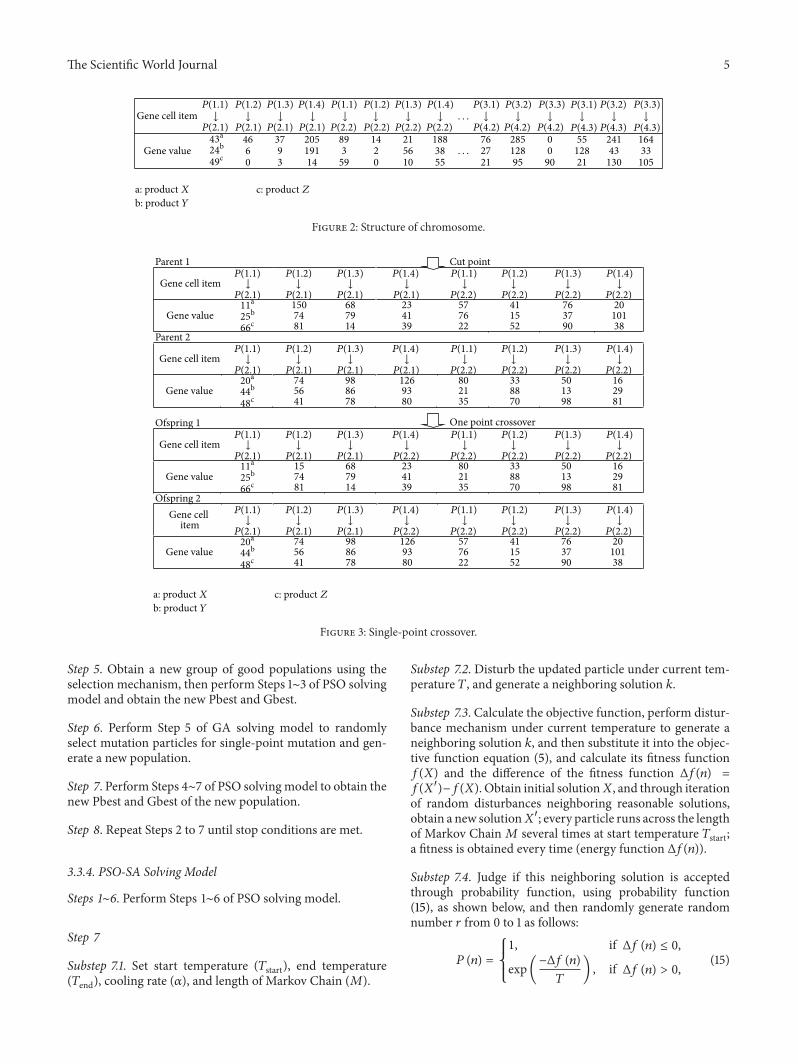
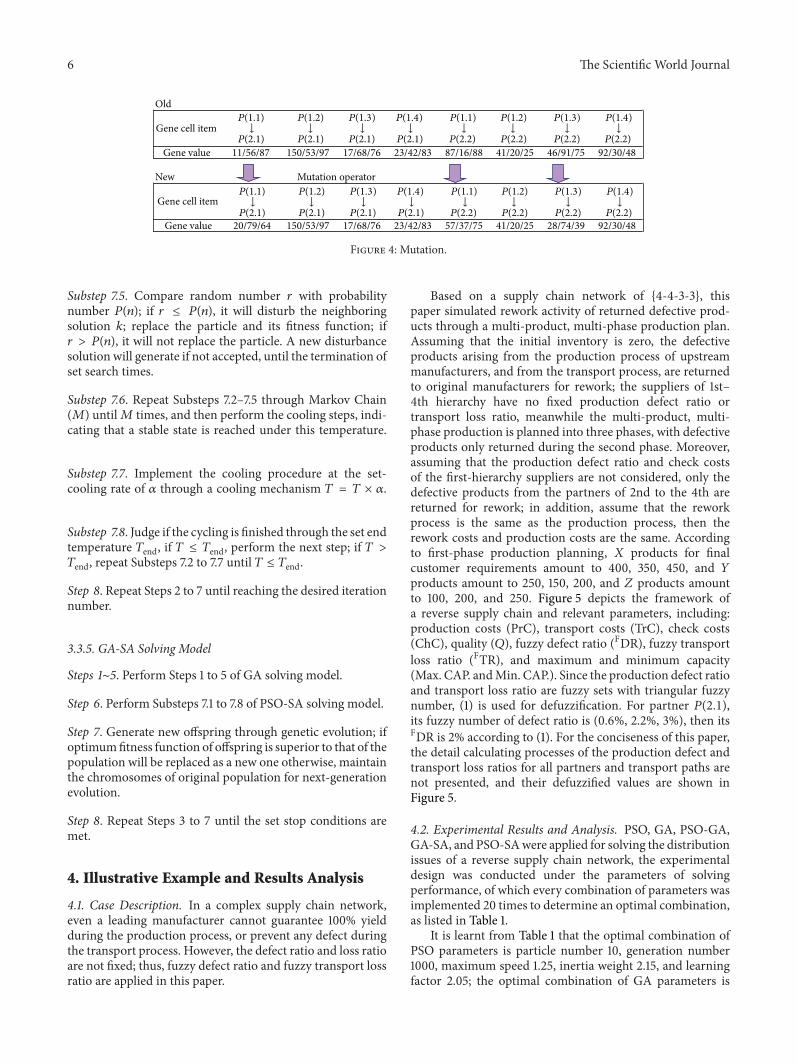
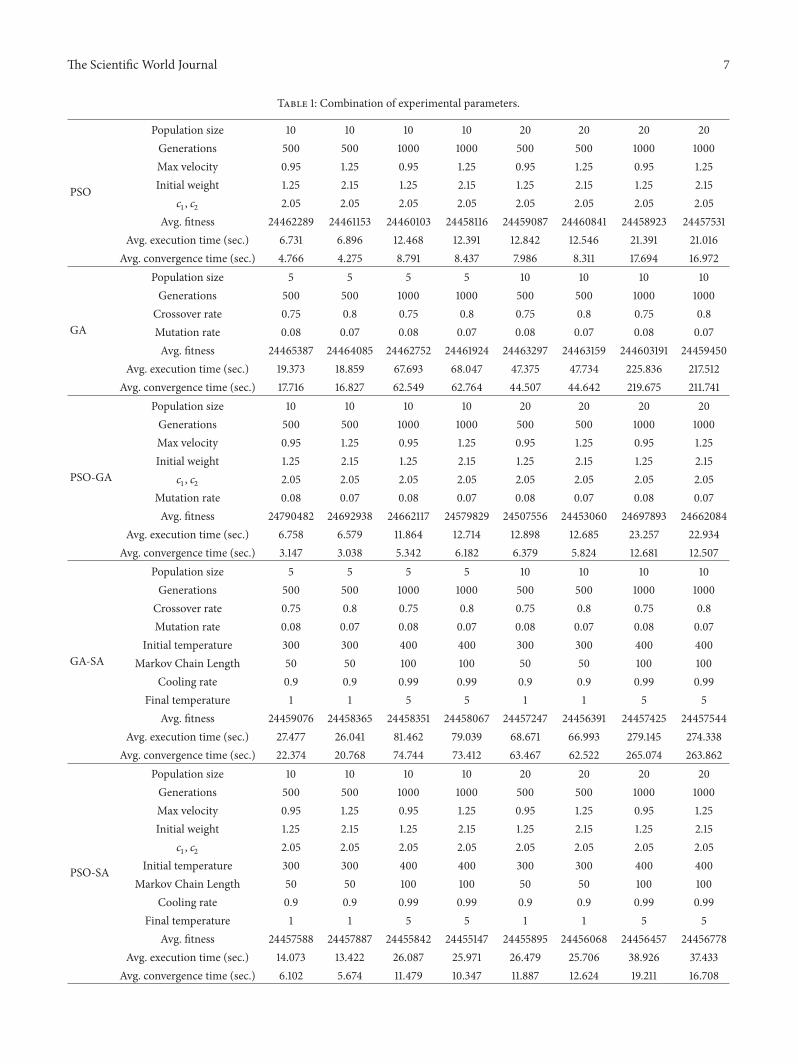
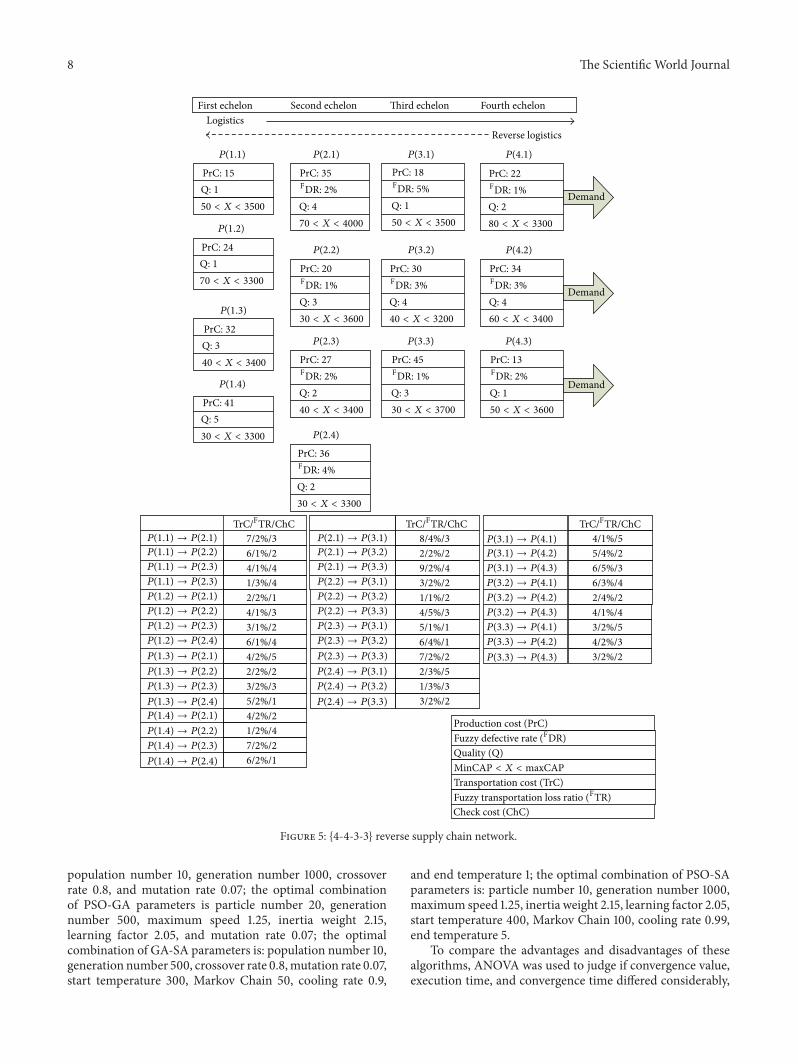
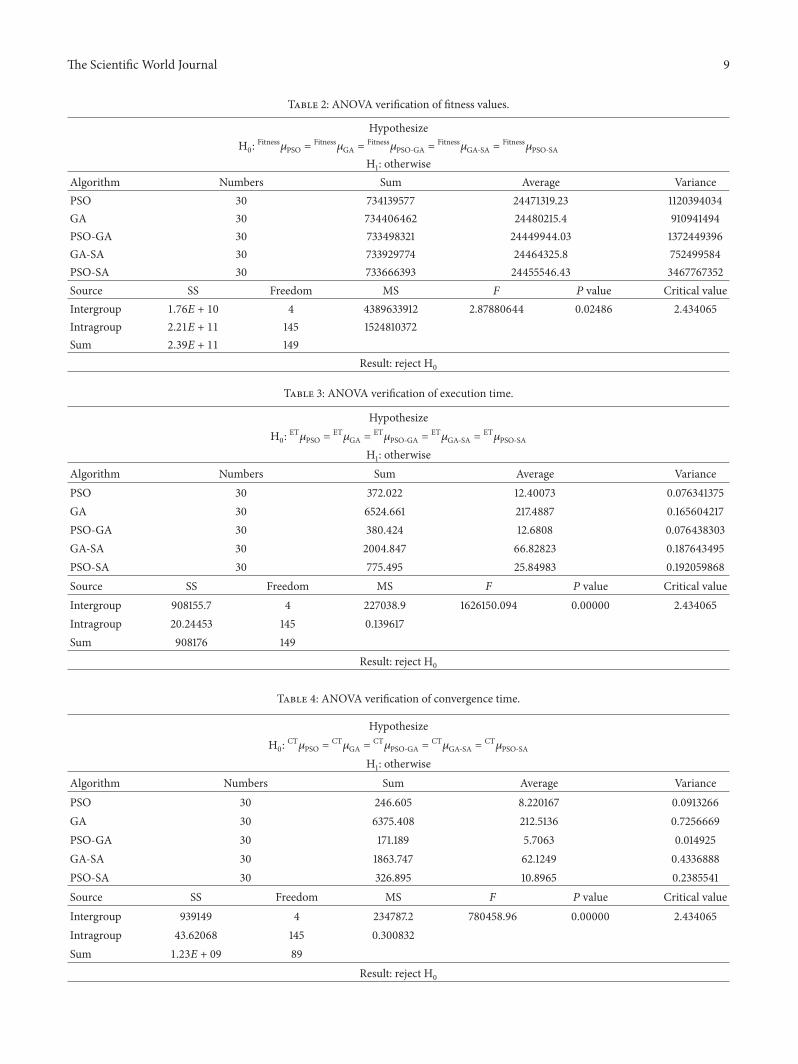
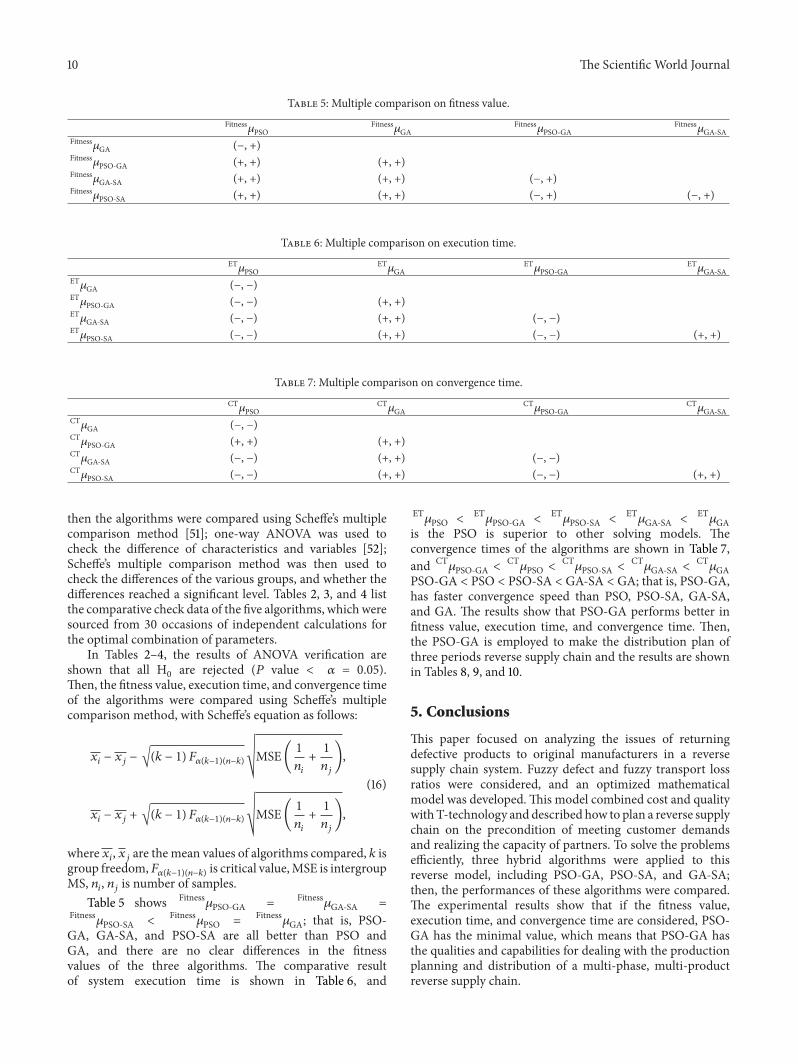
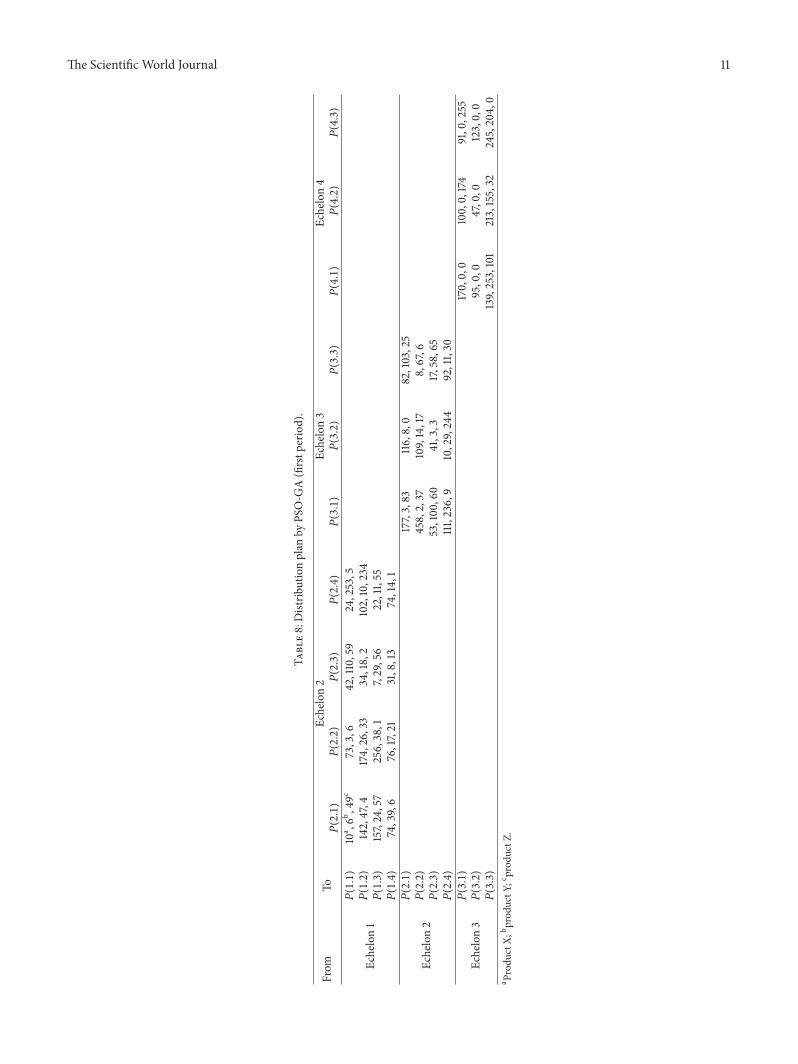
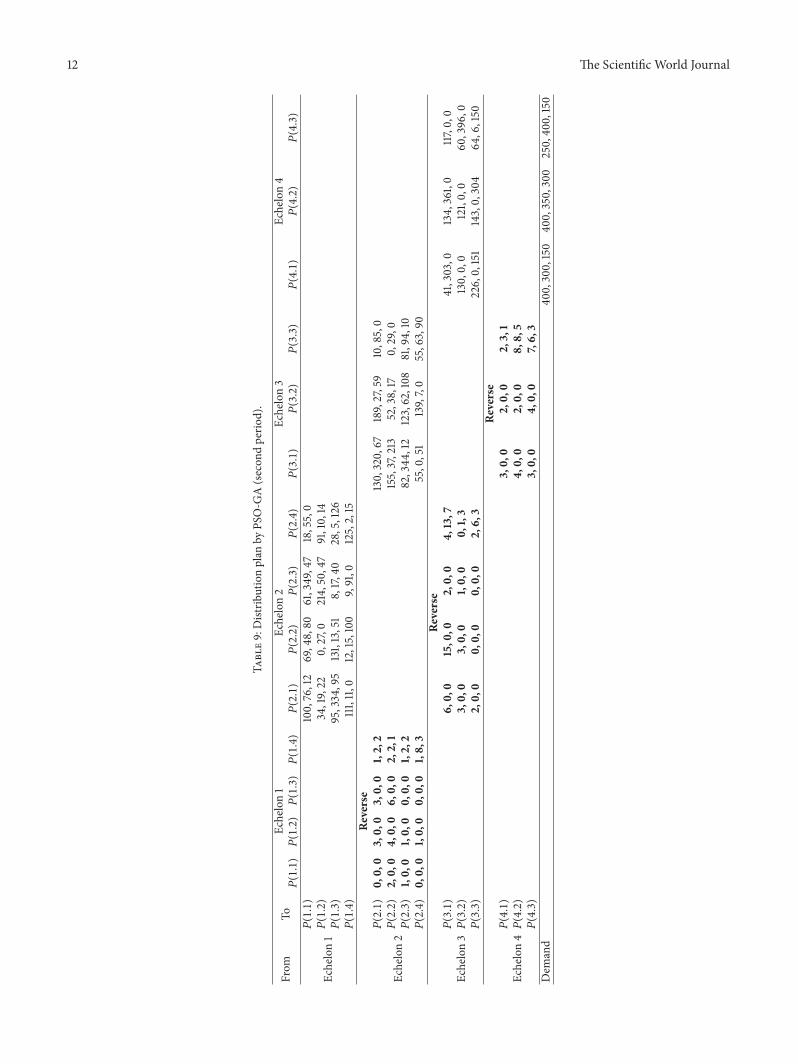
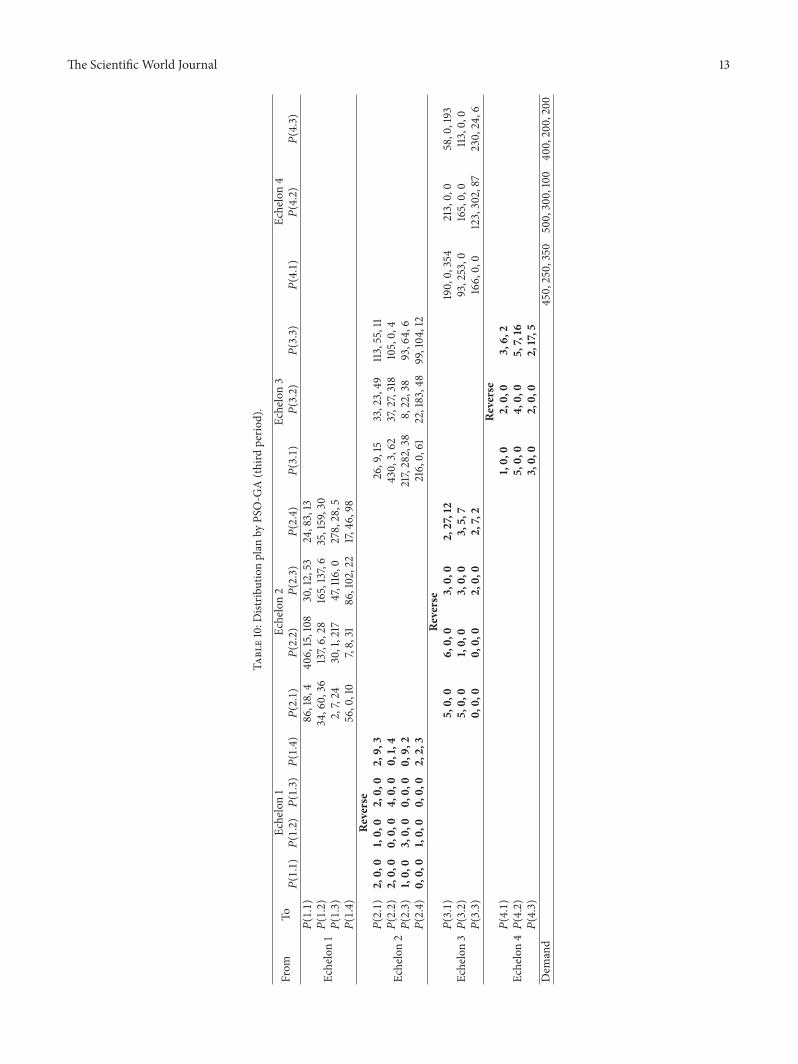