Embed Size (px)
Citation preview

Research ArticleDenoising Method Based on Sparse Representation forWFT Signal
Xu Chen1 Guoyu Lin2 and Yuxin Zhang2
1 School of Information and Control Nanjing University of Information Science and Technology Nanjing 210044 China2 School of Instrument Science and Engineering Southeast University Nanjing 210096 China
Correspondence should be addressed to Xu Chen soniachen163com
Received 26 October 2013 Revised 2 January 2014 Accepted 9 January 2014 Published 13 February 2014
Academic Editor Alexander Vergara
Copyright copy 2014 Xu Chen et alThis is an open access article distributed under the Creative Commons Attribution License whichpermits unrestricted use distribution and reproduction in any medium provided the original work is properly cited
Affected by external noise and various nature disturbances Wheel Force Transducer (WFT) signal may be completely submergedand the sensitivity and the reliability of measurement can be strongly decreased In this paper a new wavelet packet denoisingmethod based on sparse representation is proposed to remove the noises from WFT signal In this method the problem ofrecovering the noiseless signal is converted into an optimization problem of recovering the sparsity of their wavelet packagecoefficients and the wavelet package coefficients of the noiseless signals can be obtained by the augmented Lagrange optimizationmethod Then the denoised WFT signal can be reconstructed by wavelet packet reconstruction The experiments on simulationsignal and WFT signal show that the proposed denoising method based on sparse representation is more effective for denoisingWFT signal than the soft and hard threshold denoising methods
1 Introduction
Wheel Force Transducer (WFT) can measure the forcesand torques (longitudinal force 119865
119909 lateral force 119865
119910 vertical
force 119865119911 heeling moment 119872
119909 twist torque 119872
119910 and aligning
torque 119872119911 which are shown in Figure 1) applied in the
wheel dynamically so it is an important vehicle test devicefor the research of body vibration suspension and wheeldynamics as well as the performance matching of vehicletransmission and braking system [1 2] Figure 2 shows theoverall structure of WFT which is composed of the elasticbody reforming rims intermediate flange sample moduleand transfer moduleThewheel rims are reformed to connectwith the elastic body by bolt and the intermediate flangeis used to protect bridge circuit in the elastic body fromwater and dirt The sample module acquires the datum ofthe wheelrsquos forcetorques and rotation angle and then sendsthem to the transfer module by wireless Finally the transfermodule forwards the datum to the data acquisition devices byCAN bus
Because the elastic body rotateswith the rollingwheel theoutputs of 119865
119909bridge and 119865
119911bridge are similar to sinusoidal
signals and the phase difference between them is 90 degreeFigure 3 shows the typical outputs of the two bridges But allthe signals obtained by WFT mounted on wheel are affectedby external noise and various nature disturbances when thevehicle is moving According to the previous research [3 4]the main causes of these noises include the following (1)Vehicle braking road roughness and suspension vibrationmay result in the distortion ofWFT signal (2) As the sensingelement the strain gages are connected to form aWheatstonebridge The output of the bridge is only a few millivolts andshould be amplified hundreds of times to match the requestof data collection Meanwhile the electromagnetic noise ofthe circuit and Johnson noise of the resistance will also beamplified So even in stationary state the outputs of WFTstill fluctuate irregularly Based on these the WFT signalis nonstationary signal with random noise which greatlydegrades the measurement accuracy of WFT
In recent years the wavelet transform has been pro-posed as an alternative technique that has been appliedto the signal processing [5ndash9] Wavelet transform involvesmultiresolution decomposition of the measured data intowavelet coefficients each having unique time and frequency
Hindawi Publishing CorporationJournal of SensorsVolume 2014 Article ID 145870 10 pageshttpdxdoiorg1011552014145870
2 Journal of Sensors
Zw
Ow
Xw
YwFx
Fy
Fz
Mx
My
Mz
120579
Zc
Xc
Yc
Figure 1 Diagram of forces and torques applied in the wheel
Elastic body ReformingrimsBridge circuit
Transfermodule
Samplemodule Intermediate
flange
Figure 2 Overall structure of WFT
information Compared with Fourier transform wavelettransform suppresses noises more effectively than FourierTransform Due to its merits of low entropy multiresolutionand decorrelation wavelet transform (WT) can be used torecover original WFT signal from severe noises [10 11]There exist three major forms of wavelet denoising methodsThe first method provided by Mallat and Zhong [12ndash15]is based on the extrema in the wavelet coefficients whichreflect the propagation properties of the signal and noiseacross wavelet decomposition scales The second method iscalled the relativity method [16ndash21] in which the waveletcoefficients are kept or eliminated according to themagnitudevalues of their relativities across the neighboring scales Thethird method relies on the threshold operation [22 23] inwhich the wavelet coefficients whose amplitude values arelarger than a given threshold are kept or shrunk while theremaining coefficients are eliminated Commonly referred toas ldquohardrdquo or ldquosoftrdquo threshold method the last one which isthe most widely used has the advantages of simplicity andless computer burden But based on the different distributionof analyzed signal and noises under different resolution andby thresholding empirical wavelet coefficients individually
6740
0
6750
0
6760
0
6770
0
6780
0
6790
0
6800
0
6810
0
6820
0
6830
0
6840
0
1950
2000
2050
2100
2150
2200
2250
2300
Fx bridgeFz bridge
Figure 3 Typical outputs of 119865119909bridge and 119865
119911bridge
threshold denoisingmethod ignores the structural propertiesin the wavelet coefficients [24]
In this paper based on the compressive sensing theoryand sparse theory a new wavelet packet denoising algorithmwith sparse representation (WPDSR) is presented The pro-posed algorithm is efficient in recovering the noiseless signalfromnoisy signal andwell suited forWFT signalThemethodpresented here has two major advantages First it employswavelet packet transform (WPT) for signal decompositionSimilarly toWTWPT also has the framework ofmultiresolu-tion analysisWPT can simultaneously decompose detail andapproximation parts of the signal but WT only decomposesapproximation Therefore the presented method is moresuitable for analyzing signal because of its good resolutionregardless of high and low frequencies [25] Second sparserepresentation technique is adopted aiming at faithfullyestimating the noiseless wavelet packet coefficients withoutlosing significant information It should be noticed thatWPDSR is quite different from the denoising method basedon sparse decomposition The latter should construct theover-complete dictionary based on which the minimumnonzero (most sparse) atoms are solved to reconstruct thenoiseless signal However WPDSR just selects the sparse andeffective wavelet packet coefficients from the original coeffi-cients to reconstruct the noiseless signal without constructingany dictionary
The rest of the paper is organized as follows Comparedwith the hard and soft threshold methods our proposedmethod is depicted in Section 2 Then the details of thealgorithm are elaborated upon in Section 3 by introducingthe sparse representation of the wavelet packet coefficientsand showing the denoising framework In Section 4 toillustrate the efficiency and effectiveness of the proposeddenoising method we review the selection of wavelet baseand decomposition level briefly and then report the experi-mental results on the denoising effectiveness by comparingour proposed methods with hard and soft threshold methodFinally we draw the conclusions and discuss the future workin Section 5
Journal of Sensors 3
Waveletpacket
decompositionCoefficients processing
Waveletpacket
reconstruction
Noisysignal
Denoisedsignal
Figure 4 Structure of wavelet packet denoising algorithm with sparse representation
2 Denoising Principle
Assume that the observed signal is contaminated with addi-tive noise as shown in (1)
119891 (119905) = 119904 (119905) + 119899 (119905) (1)
where 119891(119905) and 119904(119905) are the observed and noiseless signalsrespectively and 119899(119905) is a random noise with standardnormal distribution 119873(0 120590
2
) After wavelet transform thetransformation of (1) to the wavelet domain is
119891119895119896
= 119908119895119896
+ 119899119895119896 (2)
where 119891119895119896 119908119895119896 and 119899
119895119896are the wavelet coefficients of
observed signal 119891(119905) noiseless signal 119904(119905) and noise signal119899(119905) respectively 119895 denotes the decomposition level and 119896
denotes the index of the coefficient at 119895th level From (2) it isclear that the wavelet coefficients of the observed signal canthemselves be considered as a noisy version of the waveletcoefficients of the noiseless signal
Based on the wavelet transform Donoho proposed thethreshold denoising method [21] The basic of the method isthat the coefficients smaller than threshold are considered tobe generated by noise and should be set to zero meanwhilethe coefficients larger than threshold are considered to begenerated by origin signal and should be remainedGenerallythere are soft and hard threshold denoisingmethods based onthe different threshold value quantization which are definedas follows in (3) and (4) respectively [24]
119908lowast
119895119896=
sign (119908119895119896) sdot (
10038161003816100381610038161003816119908119895119896
10038161003816100381610038161003816minus 120582)
10038161003816100381610038161003816119908119895119896
10038161003816100381610038161003816ge 120582
010038161003816100381610038161003816119908119895119896
10038161003816100381610038161003816lt 120582
(3)
119908lowast
119895119896=
119908119895119896
10038161003816100381610038161003816119908119895119896
10038161003816100381610038161003816ge 120582
010038161003816100381610038161003816119908119895119896
10038161003816100381610038161003816lt 120582
(4)
In these methods threshold is usually defined as
120582 = 120590radic2 log (119873)
119873 (5)
where 120590 = median(|119908119895119896
|)0675 is the noise standarddeviation and 119873 is the length of the signal
In hard threshold method 119908lowast
119895119896is not continuous so
it brings oscillating to the reconstructed signal while insoft threshold method though 119908
lowast
119895119896is continuous overall
it has constant deviation with wavelet coefficients and thereconstructed signal appears so smooth that the accuracycomes down to some extent [26] Moreover from (3) and(4) it can be seen that in the threshold denoising method
the thresholding process is executed point by point So thestructural property of wavelet coefficients is omitted
From the principle of the hard and soft threshold meth-ods the hidden information can be induced as follows
(1) The wavelet coefficient of noiseless signal is largerthan that of noise
(2) The number of wavelet coefficient of noiseless signalis less than that of observed signal
From the hidden information and many experimentswe can get an inference that if the wavelet base is selectedcorrectly the wavelet coefficients of the noiseless signal aresparse However if the signal is contaminated by noises thesparsity of its wavelet coefficients is destroyed [27] Based onthat we think it is possible to denoise the signal by recoveringthe sparsity of its wavelet coefficients And taking the overallstructural property of wavelet coefficients into considerationit will get better denoising performance than hard and softthreshold methods
3 Wavelet Packet Denoising Algorithm withSparse Representation
The threshold denoising method uses a coordinate-wiseprocessing scheme which ignores the structural propertyof the wavelet coefficients Instead of thresholding waveletcoefficients individually we manage a denoising methodbased on sparse representation according to the compressivesensing theory The presented denoising algorithm calledwavelet packet denoising algorithm with sparse representa-tion (WPDSR) has the following steps (shown in Figure 4)
(1) Wavelet Packet Decomposition Choose a proper waveletbase function and ascertain the wavelet decomposition level119873 and then decompose the signal at 119873 levels by waveletpacket But there is no unified theory about how to choosewavelet function in the process of denoising The universalway is to choose and compare the different wavelet functionsand find out the best wavelet and its base function
(2) Coefficients Processing The key step in WPDSR is therecovery of the noiseless coefficients from the noisy coef-ficients We propose to apply sparse representation duringthis key step Idealy the wavelet coefficients of noiselesssignal should have a small set of large-amplitude values (iesparsity) If the signal is heavily contaminated by noise thesparsity of the wavelet coefficients decreases [28 29] So weapproach this problem by employing the powerful sparse
4 Journal of Sensors
representation technique aiming at faithfully recovering thesparsity of the wavelet coefficients
(3) Wavelet Packet ReconstructionThe wavelet packet recon-struction is realized to get the denoised signal based on itsresulting coefficients
Among these three steps the most important one is howto process the coefficients based on sparse representation Itto some extent directly relates to the denoising effectiveness
31Wavelet Packet Algorithm The following is the decompo-sition algorithm of wavelet packet
1198892119899
119895[119905] = sum
119896isin119885
ℎ119897minus2119896
119889119895+1
[119897] 1198892119899+1
119895[119905] = sum
119896isin119885
119892119897minus2119896
119889119895+1
[119897]
(6)
where ℎ119896 is the low-pass filter coefficient and 119892
119896 is the
high-pass filter coefficient After passing through a low-passfilter LF and a high-pass filter HF and then being sampleddown by a factor of two the signal can be decomposed intotwo components one representing the rapidly time varyingfeatures of the signal (output of the HF) and the otherrepresenting the slowly time varying features (output of theLF) at a specific scale These two components are called thedetail and the approximation coefficients respectively Thenthe decomposition process is iterated on both the detail andapproximate subsequence until the detail and approximatecoefficients are suited to the scales for a particular application
Next is the reconstruction algorithm of wavelet packet
119889119899
119895+1= sum
119896isin119885
ℎ119896minus2119897
1198892119899
119895[119897] + sum
119896isin119885
119892119896minus2119897
1198892119899+1
119895[119897] (7)
32 Sparse Representation According to the theory of har-monic analysis a one-dimensional discrete time signal 119891
whose length is 119873 can be expressed as linear combinationsof a set of orthonormal basis (120595
119894 119894 = 1 119898) as follows
119891 =
119873
sum
119894=1
119909119894120595119894 (8)
where120595119894is a column vector and can be for example a wavelet
basis or a Fourier basis which depends on the applicationx = [119909
1 1199092 119909
119873] is a 119873 times 1 vector which is the weighted
coefficients of signal 119891 and 119909119894= ⟨119891 120595
119894⟩ If there are only 119870
nonzero elements in x then x can be considered as the 119870-sparse representation of 119891
33 Compressive Sensing Assume that there exists a mea-surement matrix Φ isin 119877
119872times119873 (with 119872 less than 119873) and ameasurement y which is defined as y =Φx where x is anunknown signal According to compressive sensing theory[30] if x is 119870-sparsity then the unknown signal x can berecovered by solving the following equation
119909 = arg min 1199090
st 119910 = Φ119909 (9)
where sdot 0is 1198710norm which means the number of the
nonzero elements in x
34 WPDSR
341 Denoising Mode The theories of sparse representa-tion and compressive sensing can be applied to the signaldenoising For wavelet basis is a kind of orthonormal basisif the signal is noiseless according to Section 32 the waveletcoefficients of the signal is 119870-sparsity However according toSection 2 if the signal is contaminated by noise the sparsityof their wavelet coefficients will decrease This means thatthe nonzero elements of wavelet coefficients will be beyond119870 Suppose 119904 and 119891 represent the noiseless signal and noisysignal and their elements satisfy (1) or (2) Let 119908
lowast denotethe wavelet packet coefficients of 119904 and 119908 denote the waveletpacket coefficients of 119891 According to Section 2 if we canrecover119908lowast from119908 then we can recover the noiseless signal 119904from the noisy signal 119891
According to Section 33 because 119908lowast is sparse but
unknown and119908 can be obtained byWPT then if we can finda suitable measurement matrix Φ then 119908
lowast can be solved bythe following equation
119908lowast
= arg min 1003817100381710038171003817119908lowast10038171003817100381710038170
st 119908 = Φ119908lowast
(10)
Considering the reconstruction error (10) can be con-verted to (11) by replacing the equality constraints withinequality constraints
119908lowast
= arg min 1003817100381710038171003817119908lowast10038171003817100381710038170
st 1003817100381710038171003817119908 minus Φ119908lowast1003817100381710038171003817 le 120576 (11)
where 120576 is the error toleranceIt should be noticed that one of the preconditions of
(9) or (10) is that the measurement matrix Φ should satisfythe restricted isometry constants Being independent of anyorthonormal basis approximately [31 32] Gaussian randommatrix satisfies the restricted isometry constants and can beexploited as the measurement matrixΦ
So it is clear that the problem of recovering the noiselesssignals is converted to an optimization problem of recoveringthe sparsity of their wavelet packet coefficients If the optimalsolution is acquired the noise can be removed from thesignal
342 Solution of the Denoising Model The equation shownin (11) cannot be solved in general because it is an NP-hardproblem in combinatorial mathematics Here we apply aug-mented Lagrange multiplier method to handle the problemwith inequality constraint in order to avoid the ill condition ofthe augmented Lagrange function and the dependency of thepenalty parameters of the traditional penalty function Theaugmented Lagrange function for this constrained optimiza-tion problem shown in (11) can be defined as follows [33]
119871120572(119908lowast
120573 120574) = 1199080+ 120574[max(1003817100381710038171003817119908 minus 120601119908
lowast10038171003817100381710038172minus 120576 minus
120573
2120574)]
2
+ 120573[max(1003817100381710038171003817119908 minus 120601119908lowast10038171003817100381710038172
minus 120576 minus120573
2120574)]
(12)
where 120574 is a penalty parameter and the correspondingLagrangemultiplier120573 is associatedwith inequality constraint
Journal of Sensors 5
(1) choose the proper wavelet basic(2) calculate 119908
119895
(119895 = 1 119869) using WPD(3) let 119895 = 119869(4) while 119895 ltgt 1
(1) let 1199081198950= 0 and 119908
119895
1= 120573119895
(2) while 10038171003817100381710038171003817119908119895
1minus 119908119895
0
10038171003817100381710038171003817gt 120576 do
119908119895
0= 119908119895
1
compute 119908119895
1by (12)
(3) let 119908lowast119895 = 119908119895
1
(4) 119895 = 119895 minus 1(5) reconstruct the signal by 119908
lowast119895
Algorithm 1 Flowchart of the proposed denoising algorithm
To solve this constrained optimization problem the iterativealgorithm is adopted In each iteration the Lagrange mul-tiplier 120573 and the penalty parameter 120574 are updated in orderto improve the convergence of the algorithm The Lagrangemultiplier 120573 is typically updated as follows
120573119895+1
= 120573119895
+ 2120574 [max(1003817100381710038171003817119908 minus 120601119908lowast10038171003817100381710038172
minus 120576 minus120573
2120574)] (13)
And the penalty parameter 120574 is increased by a constantrate until it reaches the predetermined maximum value 120574maxas shown below
120574119895+1
= 119888 times 120574119895
if 120574119895 lt 120574max
120574max otherwise(14)
where 119888 is the positive constant increasing rate and 120574max is themaximum penalty multiplier corresponded with inequalityconstraint
343 Denoising Steps The wavelet packet coefficients of thenoiseless signal are correlated across levels so it is likelythat the nonzero wavelet packet coefficients are located inthe similar area at different levels Therefore the waveletpacket coefficients at the 119895th level can be predicted from thecoefficients at the (119895 + 1)th level which helps to select theinitial value iteratively at each level Based on it the detailedsteps of the proposed denoising algorithm based on sparserepresentation are listed in Algorithm 1 and some prioriknowledge and symbol are given below
(1) 119869 is the wavelet packet decomposition level
(2) 119908119895 (119895 = 1 119869) is the wavelet packet coefficients of
noisy signal at 119895th level
(3) 119908lowast119895 (119895 = 1 119869) is the reconstructed wavelet packet
coefficients at 119895th level
(4) Φ is the measurement matrix as shown inSection 341 Gaussian random matrix is used
(5) 120573119895 (119895 = 1 119869) is the iterative initial value at 119895th
level according to the correlation of wavelet packetcoefficients across levels shown above 120573119895 is set as
120573119895
= 119908119869
if 119895 = 119869
119908lowast119895+1
if 119895 lt 119869(15)
4 Experiments and Results
To verify the effectiveness of the presented method the sim-ulation WFT signal and real WFT signal are exploited andSNR (signal-to-noise ratio) and CC (correlation coefficient)are used to evaluate the denoising performance which areformulated as follows [34]
SNR (db) = 10 times log10
Energy (signal)Energy (noise)
CC =
sum119873
119894=1(119865 (119894) minus 119865) (119877 (119894) minus 119877)
radicsum119873
119894=1(119865 (119894) minus 119865)
2
radicsum119873
119894=1(119877 (119894) minus 119877)
2
(16)
where 119865 and 119877 are the denoised and noise-free signalsrespectively 119865 and 119877 are the mean value of 119865 and 119877respectively and119873 is the length of the signal 119865
SNR measures the ratio between the energy of signaland that of noise and the smaller the SNR is the better thedenoising effect is CC measures the similarity between thedenoised signal and the noise-free signal so the larger the CCis the more similar they are and the better the performanceis
Because the outputs of119865119909bridge and119865
119911bridge ofWFTare
similar to the sinusoidal signals with random noise we selectthem as the simulation signal and the frequency is 50Hz55Hz 60Hz 65Hz and 70Hz respectively with differentSNR
41 Selection of Wavelet and Decomposition Level The selec-tion of an optimal wavelet and the decomposition level is twoimportant issues of the wavelet packet decomposition
The first task to be accomplished is to choose the optimalwavelet In this paper a method based on minimum promi-nent decomposition coefficients [35] is extended to choosethe optimal wavelet from a set of wavelet bases candidatesincluding Daubechies Symlets and Coiflets considering thefeatures such as regularity and vanishing moments For eachcandidate wavelet the method first decomposes the signalinto the wavelet packet domain down to a predeterminedlevel of 4 Secondly the average of absolute values (denoted as120578) of detail wavelet packet coefficients is calculated for eachdecomposition level and then summated across all decom-position levels and it is formulated as 120578 = sum
119869
119895=1abs(1198892119899119895)119873119895
where 119895 (119895 = 1 119869) is the decomposition level and 1198892119899
119895is the
119899th (119899 = 1 119873119895) detail coefficient at 119895th level 120578 indicates
how closely the candidate wavelet is describing the selectedsignal and the smaller 120578 is the better the performance isThen this procedure is applied to all signals by all candidateswaveletsThe wavelet giving the lowest 120578 is chosen as the best
6 Journal of Sensors
Table 1 120578 of test signals with 5 dB SNR by different wavelet
Wavelet Frequency (Hz)50 55 60 65 70
db2 14931 15620 15549 15129 14843db4 11897 12464 12392 11830 11897db6 10958 11454 11058 10634 10950db8 10840 11089 10548 10112 10716db10 10375 10904 10633 09943 10374sym2 14931 15620 15549 15129 14843sym4 11938 12521 12455 11881 11904sym6 10991 11534 11357 10785 11159sym8 10558 10788 10553 10394 11072sym10 10229 10896 10634 10364 11336coif2 12084 12639 12353 11895 12048coif3 11405 12096 11836 11142 11283coif4 11243 11508 11498 11009 11614coif5 11372 11499 10808 10635 11697
wavelet Table 1 shows the results of the simulation signal with5 dB SNR and the three smallest 120578 are displayed in bold FromTable 1 it can be seen that wavelet ldquodb10rdquo could achieve thebest performance because of the lower 120578 The similar resultsare obtained for other signals with different SNR which arenot listed here in detail for lack of space forbids So ldquodb10rdquo ischosen as the wavelet for WFT signal decomposition
Besides the optimal choice of the wavelet how to selectthe best decomposition level is also important In the aboveexperiments the decomposition level is preset (119869 = 4) Toasses the performance of the wavelet at other decompositionlevels all the parameters above are kept unchanged except thedecomposition level then we can see how the decompositionlevel influences the denoising effect of the proposed methodFigures 5 and 6 show the influence of decomposition levelon SNR and CC for the simulation signal with 5 dB SNRfrom which it can be seen that SNR and CC could hardlyincrease when the decomposition level gets beyond 5 Thesimilar results are obtained for signals with different SNR Aswe know the less the wavelet decomposition level is the lessthe computational operation of signal denoising will be Soaccording to the experimental results we choose the optimaldecomposition scale (119869 = 5) during the following denoisingexperiments
42 Comparison of Different Denoising Methods for Sim-ulation Signal To evaluate the denoising performance ofWPDSR our proposed method is compared with the thresh-old method including soft and hard In the experiments theparameters of the proposed WPDSR are set empirically
(1) the error tolerance 120576 is set as 1(2) the maximum penalty multiplier 120574max is set as 10(3) the positive constant 119888 is set as 01
Table 2 shows SNR and CC of the denoised signal by thedifferent denoisingmethods FromTable 2 it can be seen thatthe presented denoising method leads to the largest SNR and
3 4 5 6 7 87
75
8
85
9
95
10
SNR
after
den
oisin
g (d
B)
Decomposition level
50Hz55Hz60Hz
65Hz70Hz
Figure 5 Influence of decomposition level on SNR
091
092
093
094
095
096
097
098
099
CC aft
er d
enoi
sing
3 4 5 6 7 8Decomposition level
50Hz55Hz60Hz
65Hz70Hz
Figure 6 Influence of decomposition level on CC
CC after denoising This means that WPDSR outperformsthe other two methods for both noise reduction and signalrestoration
As an example the denoising results of the simulationnoisy signal with SNR= 5 dB and frequency = 50Hz using theproposedmethod as well as the othermentionedmethods areshown in Figure 7 It is obvious that the curve denoised by theproposedmethod is much smoother than the curve denoisedby the other two methods And the mean of squared error(MSE) from hard threshold soft threshold and our methodare 05376 04880 and 04184 respectively so the absolute
Journal of Sensors 7
Table 2 Comparison of SNR and CC by using the three different denoising methods
SNR beforedenoising Frequency
SNR after denoising (dB) CC after denoising
Hard threshold Soft threshold The proposedmethod Hard threshold Soft threshold The proposed
method
10 dB
50 118975 125750 133241 09901 09908 0991255 121520 128504 134851 09798 09813 0984560 117591 124382 135607 09732 09735 0975665 116483 120538 132084 09789 09800 0981270 115608 124672 136375 09816 09833 09863
5 dB
50 80593 88428 90593 09843 09854 0989355 83879 88534 97245 09620 09632 0968960 83189 90547 98915 09609 09637 0966465 80125 88504 97581 09636 09658 0969270 75483 81592 92461 09709 09724 09759
0 dB
50 61360 68254 75268 09738 09755 0978055 58967 65249 70423 09586 09614 0963160 51586 54860 67808 09694 09721 0974365 61404 65328 70524 09638 09645 0967270 51453 58918 69245 09652 09674 09695
minus5 dB
50 35524 39805 45246 09631 09647 0966355 28593 34395 41250 09646 09651 0968460 27695 30256 38925 09659 09683 0970565 31369 35284 42386 09571 09588 0959470 31245 38925 48425 09609 09613 09635
minus10 dB
50 12534 18562 25851 09476 09489 0949855 15962 21256 28408 09549 09553 0956360 12564 17592 23614 09423 09428 0944665 09547 15410 20596 09362 09365 0937270 15814 19854 25468 09438 09443 09456
error from the proposed method is much smaller than thatfrom the other two methods
43 Comparison of Different Denoising Methods for WFTSignal To verify the effectiveness of the proposed methodin the real application the real WFT signal is denoised bythe above methods Figure 8 shows the denoising results ofthe 119865119909bridge output by the proposed method soft threshold
method and hard threshold method It can be seen that theWPDSR obtains superior visual quality
To further show the performance of the proposedmethodacting on theWFT signal processing we use the original andthe denoised bridge outputs to obtain the longitudinal force119865119909and twist torque 119872
119910applied to the wheel Figure 9 shows
the comparison of the original and the denoised forcetorquein an acceleration course There exist two gear shifts inthis experiment During shifting T1-T2 the driver pressesthe clutch and then the engine and the gearbox detachThen the driver presses the accelerator pedal in T2-T3 Afterthat shifting T3-T4 follows In this acceleration process theoutput torque of the gearbox causes 119865
119909and 119872
119910to change
correspondingly
From Figures 8 and 9 it is shown that the proposeddenoising method can effectively remove the noise from theoutput of WFT and the forcetorque applied to the wheel canbe measured effectively by using the proposed method
5 Conclusions
Although the standardwavelet threshold denoisingmethod issimple and practical it does not work well for signals with alow SNR besides it uses coordinate-wise processing withouttaking the structural information of the wavelet coefficientsinto account In this paper the new denoising method basedon wavelet packet transform and sparse representation isused to overcome these problems It can estimate the noise-free wavelet packet coefficients by solving an optimiza-tion problem and is suitable for signals with a low SNRExperiments were conducted on different simulation signalswhich were corrupted by various noise levels to assess theperformance of the proposed algorithm in comparison withsoft and hard threshold denoising methods The analysis ofthe results indicated that the proposed method outperformsthe universal hard threshold and soft threshold methods and
8 Journal of Sensors
200 400 600 800 1000 1200 1400 1600 1800 2000
0
1
minus1
(a) Noise-free signal
200 400 600 800 1000 1200 1400 1600 1800 2000
0
1
2
minus1
minus2
(b) Noisy signal with SNR = 5 dB
200 400 600 800 1000 1200 1400 1600 1800 2000
0
1
minus1
(c) Result of hard threshold
200 400 600 800 1000 1200 1400 1600 1800 2000
0
05
minus05
(d) Absolute error from hard threshold
200 400 600 800 1000 1200 1400 1600 1800 2000
0
1
minus1
(e) Result of soft threshold
200 400 600 800 1000 1200 1400 1600 1800 2000
0
05
minus05
(f) Absolute error from soft threshold
200 400 600 800 1000 1200 1400 1600 1800 2000
0
1
minus1
(g) Result of the proposed method
200 400 600 800 1000 1200 1400 1600 1800 2000
0
05
minus05
(h) Absolute error from proposed method
Figure 7 Comparison of the denoising performance for simulation WFT signal with SNR = 5 dB
0 200 400 600 800 1000 1200 1400 1600 1800 2000190021002300
0 200 400 600 800 1000 1200 1400 1600 1800 2000190021002300
0 200 400 600 800 1000 1200 1400 1600 1800 2000190021002300
0 200 400 600 800 1000 1200 1400 1600 1800 2000190021002300
Original WFT signal
Result of hard threshold
Result of soft threshold
Result of the proposed method
Figure 8 Comparison of the denoising performance for real WFTsignal
0 500 1000 1500 2000 2500
Fx
(N)
t (ms)0 500 1000 1500 2000 2500
My
(Nmiddotm
)
T1 T2 T3 T4
t (ms)
Denoised My
Original My
Denoised Fx
Original Fx
minus2500
minus2000minus1500minus1000minus500
05001000
minus700
minus500
minus300
minus100
100
300
Figure 9 119865119909and119872
119910in an acceleration process
Journal of Sensors 9
it could be competent for denoising WFT signal with heavynoise Through the relevant graphs and data the superiorityof the presented method is illustrated clearly Furthermorethe proposed method also can be used in other applicationsand should acquire satisfactory results
Conflict of Interests
The authors declare that there is no conflict of interestsregarding the publication of this paper
Acknowledgments
This work was supported by the National Natural ScienceFoundation of China (nos 51305078 and 61272223)
References
[1] X Zhang N Feng and W Zhang ldquoExperimental research onthe abs performance based on the wheel forces measured byroadway testrdquo China Mechanical Engineering vol 19 no 6 pp751ndash755 2008
[2] M Corno M Gerard M Verhaegen and E Holweg ldquoHybridABS Control Using Force Measurementrdquo IEEE Transactions onControl Systems Technology vol 20 no 5 pp 1223ndash1235 2011
[3] W G Zhang ldquoStudy onmulti-component wheel forcemeasure-ment technologyrdquo Journal of Jiangsu University vol 25 no 1 pp25ndash28 2004
[4] G F Liu W G Zhang and Z G Li ldquoResearch on staticdecoupling for multi dimensional wheel force transducerrdquoInstrument Technique and Sensor vol 7 pp 15ndash18 2006
[5] A Grinsted J C Moore and S Jevrejeva ldquoApplication of thecross wavelet transform and wavelet coherence to geophysicaltimes seriesrdquo Nonlinear Processes in Geophysics vol 11 no 5-6pp 561ndash566 2004
[6] MAntoniniM Barlaud PMathieu and I Daubechies ldquoImagecoding using wavelet transformrdquo IEEE Transactions of ImageProcessing vol 1 no 2 pp 205ndash220 1992
[7] E Matsuyama D-Y Tsai Y Lee et al ldquoComparison of adiscrete wavelet transform method and a modified undec-imated discrete wavelet transform method for denoising ofmammogramsrdquo in Proceedings of the 35th Annual InternationalConference of the IEEEEngineering in Medicine and BiologySociety (EMBC rsquo13) pp 3403ndash3406 2013
[8] J S Murguirsquoa A Vergaraa C Vargas-Olmos et al ldquoTwo-dimensional wavelet transform feature extraction for poroussilicon chemical sensorsrdquo Analytica Chimica Acta vol 785 pp1ndash15 2013
[9] P Ghorbanian D M Devilbiss A Verma et al ldquoIdentificationof resting and active state EEG features of Alzheimerrsquos diseaseusing discrete wavelet transformrdquo Annals of Biomedical Engi-neering vol 41 no 6 pp 1243ndash1257 2013
[10] Q Liu and W Zhang ldquoDesign of acquisition system for roadloading spectra data based on wheel force transducerrdquo Journalof Jiangsu University vol 32 no 4 pp 389ndash393 2011
[11] G F Liu W D Zhu W G Zhang and S G Li ldquoDe-noising ofsignals of wheel force transducer based on wavelet transformrdquoInstrument Technique and Sensor vol 1 pp 44ndash46 2007
[12] S Mallat and S Zhong ldquoCharacterization of signals frommultiscale edgesrdquo IEEE Transactions on Pattern Analysis andMachine vol 14 no 7 pp 710ndash732 1992
[13] C Bai Y Peng and Q Zhang ldquoA new wavelet transformmodulus maximum denoising algorithm for UWB systemrdquoAdvanced Materials Research vol 443-444 pp 542ndash547 2012
[14] Z Fan M Cai and H Wang ldquoAn improved denoisingalgorithm based on wavelet transform modulus maxima fornon-intrusive measurement signalsrdquoMeasurement Science andTechnology vol 23 no 4 Article ID 045007 pp 1ndash11 2012
[15] Y Qin J Wang and Y Mao ldquoSignal denoising based on softthresholding and reconstruction fromdyadicwavelet transformmodulus maximardquo Journal of Vibration Measurement andDiagnosis vol 31 no 5 pp 543ndash547 2011
[16] Y Xu J BWeaver DMHealy Jr and J Lu ldquoWavelet transformdomain filters a spatially selective noise filtration techniquerdquoIEEETransactions on Image Processing vol 3 no 6 pp 747ndash7581994
[17] W Zhan J Tan and Y Wen ldquoDenoising algorithm based oncorrelation of inter scales wavelet coefficient for damage signalof wire roperdquo Advanced Materials Research vol 328ndash330 pp2027ndash2031 2011
[18] Q Xiao J-H Wang X-K Fang and S-P Guan ldquoA waveletcoefficient threshold denoising method based on a cross-correlation functionrdquo Journal of NortheasternUniversity vol 32no 3 pp 318ndash321 2011
[19] Z-G Zhang X-J Zhou F-C Yang andM-X Xie ldquoDenoisingmethod based on wavelet transform coefficient correlation andlocal laplacian modelrdquo Journal of Vibration and Shock vol 27no 11 pp 32ndash36 2008
[20] J Portilla and E P Simoncelli ldquoImage denoising via adjustmentof wavelet coefficient magnitude correlationrdquo in Proceedings ofthe International Conference on Image Processing (ICIP rsquo00) pp277ndash280 September 2000
[21] D L Donoho ldquoDe-noising by soft-thresholdingrdquo IEEE Trans-actions on Information Theory vol 41 no 3 pp 613ndash627 1995
[22] J Hairong R Yongmei and Z Xueying ldquoAn improved waveletpacket threshold function for speech enhancement methodrdquoJournal of Information and Computational Science vol 10 no3 pp 941ndash948 2013
[23] Z Di J Zhang and C Jia ldquoAn improved wavelet thresholddenoising algorithmrdquo in Proceedings of the 3rd InternationalConference on Intelligent System Design and Engineering Appli-cations (ISDEA rsquo13) pp 297ndash299 2013
[24] X Dong Y Yue X Qin XWang and Z Tao ldquoSignal denoisingbased on improved wavelet packet thresholding functionrdquoin Proceedings of the International Conference on ComputerMechatronics Control and Electronic Engineering (CMCE rsquo10)pp 382ndash385 August 2010
[25] I Daubechies ldquoWavelet transform time-frequency localizationand signal analysisrdquo IEEE Transactions on Information Theoryvol 36 no 5 pp 961ndash1005 1990
[26] Z Yongxiang Z Xiaoxu Y Huimei and Z Weigong ldquoWaveletpacket threshold approach to denoising piezoelectricity gyrosignalrdquo in Proceedings of the International Conference on Com-puter Engineering and Technology pp 266ndash269 Singapore2009
[27] R Zhao X Liu C-C Li R J Sclabassi and M Sun ldquoA newdenoising method based on Wavelet transform and sparse rep-resentationrdquo in Proceedings of the 9th International Conferenceon Signal Processing (ICSP rsquo08) pp 171ndash174 Beijing ChinaOctober 2008
[28] D L Donoho ldquoCompressed sensingrdquo IEEE Transactions onInformation Theory vol 52 no 4 pp 1289ndash1306 2006
10 Journal of Sensors
[29] R G Baraniuk ldquoCompressive sensingrdquo IEEE Signal ProcessingMagazine vol 24 no 4 pp 118ndash124 2007
[30] S-T Li and D Wei ldquoA survey on compressive sensingrdquo ActaAutomatica Sinica vol 35 no 11 pp 1369ndash1377 2009
[31] E J Candes J K Romberg and T Tao ldquoStable signal recoveryfrom incomplete and inaccurate measurementsrdquo Communica-tions on Pure and Applied Mathematics vol 59 no 8 pp 1207ndash1223 2006
[32] E J Candes and T Tao ldquoDecoding by linear programmingrdquoIEEE Transactions on Information Theory vol 51 no 12 pp4203ndash4215 2005
[33] G Yan H Wang G Ding and L Lin ldquoAugmented Lagrangemultiplier based fuzzy evolutionary algorithm and applicationfor constrained optimizationrdquo in Proceedings of the 4th WorldCongress on Intelligent Control and Automation pp 1774ndash1778June 2002
[34] C Petrarca and G Lupo ldquoWavelet packet denoising of partialdischarge datardquo in Proceedings of the Conference on ElectricalInsulation and Dielectric Phenomena (CEIDP rsquo06) pp 644ndash647October 2006
[35] C S Chang S Kumar Q Su et al ldquoDenoising of partialdischarge signals in wavelet packets domainrdquo IEEE ProceedingsScience Measurement and Technology vol 152 no 3 pp 129ndash140 2005
International Journal of
AerospaceEngineeringHindawi Publishing Corporationhttpwwwhindawicom Volume 2014
RoboticsJournal of
Hindawi Publishing Corporationhttpwwwhindawicom Volume 2014
Hindawi Publishing Corporationhttpwwwhindawicom Volume 2014
Active and Passive Electronic Components
Control Scienceand Engineering
Journal of
Hindawi Publishing Corporationhttpwwwhindawicom Volume 2014
International Journal of
RotatingMachinery
Hindawi Publishing Corporationhttpwwwhindawicom Volume 2014
Hindawi Publishing Corporation httpwwwhindawicom
Journal ofEngineeringVolume 2014
Submit your manuscripts athttpwwwhindawicom
VLSI Design
Hindawi Publishing Corporationhttpwwwhindawicom Volume 2014
Hindawi Publishing Corporationhttpwwwhindawicom Volume 2014
Shock and Vibration
Hindawi Publishing Corporationhttpwwwhindawicom Volume 2014
Civil EngineeringAdvances in
Acoustics and VibrationAdvances in
Hindawi Publishing Corporationhttpwwwhindawicom Volume 2014
Hindawi Publishing Corporationhttpwwwhindawicom Volume 2014
Electrical and Computer Engineering
Journal of
Advances inOptoElectronics
Hindawi Publishing Corporation httpwwwhindawicom
Volume 2014
The Scientific World JournalHindawi Publishing Corporation httpwwwhindawicom Volume 2014
SensorsJournal of
Hindawi Publishing Corporationhttpwwwhindawicom Volume 2014
Modelling amp Simulation in EngineeringHindawi Publishing Corporation httpwwwhindawicom Volume 2014
Hindawi Publishing Corporationhttpwwwhindawicom Volume 2014
Chemical EngineeringInternational Journal of Antennas and
Propagation
International Journal of
Hindawi Publishing Corporationhttpwwwhindawicom Volume 2014
Hindawi Publishing Corporationhttpwwwhindawicom Volume 2014
Navigation and Observation
International Journal of
Hindawi Publishing Corporationhttpwwwhindawicom Volume 2014
DistributedSensor Networks
International Journal of
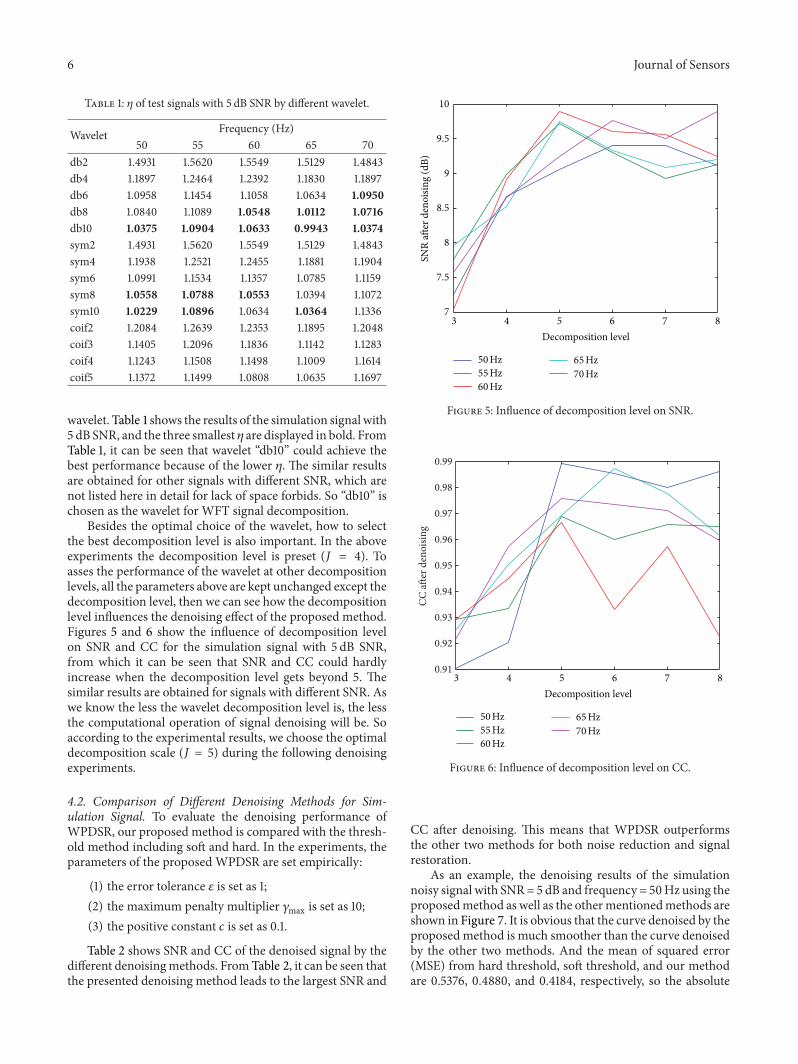

International Journal of
AerospaceEngineeringHindawi Publishing Corporationhttpwwwhindawicom Volume 2014
RoboticsJournal of
Hindawi Publishing Corporationhttpwwwhindawicom Volume 2014
Hindawi Publishing Corporationhttpwwwhindawicom Volume 2014
Active and Passive Electronic Components
Control Scienceand Engineering
Journal of
Hindawi Publishing Corporationhttpwwwhindawicom Volume 2014
International Journal of
RotatingMachinery
Hindawi Publishing Corporationhttpwwwhindawicom Volume 2014
Hindawi Publishing Corporation httpwwwhindawicom
Journal ofEngineeringVolume 2014
Submit your manuscripts athttpwwwhindawicom
VLSI Design
Hindawi Publishing Corporationhttpwwwhindawicom Volume 2014
Hindawi Publishing Corporationhttpwwwhindawicom Volume 2014
Shock and Vibration
Hindawi Publishing Corporationhttpwwwhindawicom Volume 2014
Civil EngineeringAdvances in
Acoustics and VibrationAdvances in
Hindawi Publishing Corporationhttpwwwhindawicom Volume 2014
Hindawi Publishing Corporationhttpwwwhindawicom Volume 2014
Electrical and Computer Engineering
Journal of
Advances inOptoElectronics
Hindawi Publishing Corporation httpwwwhindawicom
Volume 2014
The Scientific World JournalHindawi Publishing Corporation httpwwwhindawicom Volume 2014
SensorsJournal of
Hindawi Publishing Corporationhttpwwwhindawicom Volume 2014
Modelling amp Simulation in EngineeringHindawi Publishing Corporation httpwwwhindawicom Volume 2014
Hindawi Publishing Corporationhttpwwwhindawicom Volume 2014
Chemical EngineeringInternational Journal of Antennas and
Propagation
International Journal of
Hindawi Publishing Corporationhttpwwwhindawicom Volume 2014
Hindawi Publishing Corporationhttpwwwhindawicom Volume 2014
Navigation and Observation
International Journal of
Hindawi Publishing Corporationhttpwwwhindawicom Volume 2014
DistributedSensor Networks
International Journal of

![Dynamic Dictionary Optimization for Sparse …epubs.surrey.ac.uk/813550/1/New-TSLSRC_elsarticle-template.pdf · 5 age denoising [9], and pattern recognition [34, 35, 40]. ... algorithm,](https://img.pdfslide.us/doc/110x75/5b88222f7f8b9a1a248e555d/dynamic-dictionary-optimization-for-sparse-epubs-5-age-denoising-9-and-pattern.jpg)


![Study of Curvelet and Wavelet Image Denoising by Using … · 2018-12-15 · novel image denoising method which is based on DCT basis and sparse representation [6]. To achieve a good](https://img.pdfslide.us/doc/110x75/5f03a8f47e708231d40a24d6/study-of-curvelet-and-wavelet-image-denoising-by-using-2018-12-15-novel-image.jpg)