Embed Size (px)
Citation preview

Hindawi Publishing CorporationComputational and Mathematical Methods in MedicineVolume 2013, Article ID 848123, 10 pageshttp://dx.doi.org/10.1155/2013/848123
Research ArticleComplex Codon Usage Pattern and CompositionalFeatures of Retroviruses
Sourav RoyChoudhury1,2 and Debaprasad Mukherjee1,3
1 School of Information Technology, Bengal Engineering and Science University, Shibpur, Howrah, West Bengal 711103, India2 School of Medical Science and Technology, Indian Institute of Technology Kharagpur, Kharagpur-721302, India3 Department of Information Technology, Dr. B.C. Roy Engineering College, West Bengal University of Technology,Durgapur, West Bengal 713206, India
Correspondence should be addressed to Debaprasad Mukherjee; [email protected]
Received 30 May 2013; Revised 5 September 2013; Accepted 7 September 2013
Academic Editor: Kazuhisa Nishizawa
Copyright © 2013 S. RoyChoudhury and D. Mukherjee. This is an open access article distributed under the Creative CommonsAttribution License, which permits unrestricted use, distribution, and reproduction in any medium, provided the original work isproperly cited.
Retroviruses infect a wide range of organisms including humans. Among them,HIV-1, which causes AIDS, has now become amajorthreat for world health. Some of these viruses are also potential gene transfer vectors. In this study, the patterns of synonymouscodon usage in retroviruses have been studied through multivariate statistical methods on ORFs sequences from the available 56retroviruses. The principal determinant for evolution of the codon usage pattern in retroviruses seemed to be the compositionalconstraints, while selection for translation of the viral genes plays a secondary role. This was further supported by multivariateanalysis on relative synonymous codon usage. Thus, it seems that mutational bias might have dominated role over translationalselection in shaping the codon usage of retroviruses. Codon adaptation index was used to identify translationally optimal codonsamong genes from retroviruses. The comparative analysis of the preferred and optimal codons among different retroviral groupsrevealed that four codons GAA, AAA, AGA, and GGA were significantly more frequent in most of the retroviral genes inspite ofsome differences. Cluster analysis also revealed that phylogenetically related groups of retroviruses have probably evolved theircodon usage in a concerted manner under the influence of their nucleotide composition.
1. Introduction
The retroviruses are a diverse family of enveloped singlestranded retro transcribing RNA viruses unique for their useof reverse transcription of the viral RNA into linear doublestranded DNA during replication and the subsequent inte-gration of the DNA into the host genome. Members of thisfamily cause diseases in a wide range of organisms, includ-ing humans [1]. Human immunodeficiency virus 1 (HIV-1) is responsible for acquired immunodeficiency syndrome(AIDS) and is largely dependent on transmission of con-taminated body fluids during sexual intercourse, pregnancy,and so forth [2]. More than 30 million people worldwideare living with HIV. Besides, retroviruses are increasinglybecoming valuable tools in molecular biology and have beenused successfully in gene therapy [3]. Based on morphol-ogy, pathogenicity, andmolecular phylogenetics, retroviruses
have been classified into two subfamilies: Orthoretrovirinae,Spumaretrovirinae and rest of the viruses are unclassified.The Orthoretrovirinae is further classified into six genera:Alpharetrovirus, Betaretrovirus, Deltaretrovirus, Epsilonretro-virus, Gammaretrovirus, and Lentivirus.
The analysis of codon usage of whole organisms and/ororganisms from closely related groups of them reveals trendsand anomalies in the choice and bias in the frequency ofcodons and related nucleotide composition, including evolu-tionary features. Synonymous codons do not occur in equalfrequency in genes and genomes. The relative frequency ofthese synonymous codons in the genes varies significantly ina nonrandom manner between species, even between thosefrom the same taxon due to a complex balance betweenmuta-tional bias, various selection forces (e.g., translational selec-tion), and drift acting on the genes or genomes [4]. Codonand base usage patterns reveal information on the nature
2 Computational and Mathematical Methods in Medicine
of molecular evolution of genes and genomes, sometimeseven events of horizontal gene transfer. Evidence exists ofcorrelations between codon usage bias and nucleotide com-position in some viruses, clearly indicating that mutationalbias towards particular nucleotide content influences generalcodon usage of organisms [5]. For example, in free livingorganisms, such as E. coli, S. cerevisiae, C. elegans, D. mel-anogaster, and A. thaliana, knowledge of codon usage biasgives insights into the content of the isoacceptor tRNAsin genomes, their coadaptation, and potential levels ofgene expression due to selection for translational efficiency[6, 7].
In this study, the codon usage patterns of all the available56 sequenced retroviruses’ genomes (from GenBank) con-taining 246ORFs (longer than 150 bp) were analyzed. Resultsfrom this study would be useful for revealing retroviral genecomposition and evolution and additionally may be useful inselecting appropriate host expression systems to improve theexpression of target genes in vivo and in vitro for the design ofgene delivery and expression systems for use in gene therapyand immunization.
2. Materials and Methods
56 completely sequenced retroviral genomes were availablefromNCBI GenBank (February 2010).These belonged to twomajor subfamilies: Orthoretrovirinae, Spumaretrovirinaeand rest of the viruses were unclassified. Six viruses belongto Spumaretrovirinae, while 3 viruses were unclassified. Theremaining 47 viruses belong to Orthoretrovirinae subfamily.Six genera are present within Orthoretrovirinae, namely:Alpharetrovirus, Betaretrovirus, Deltaretrovirus, Epsilonret-rovirus, Gammaretrovirus, and Lentivirus. Among the 47Orthoretrovirinae viruses, there are 7 Alpharetroviruses,6 Betaretroviruses, 8 Deltaretroviruses, 2 Epsilonretroviruses,14 Gammaretroviruses, and 10 Lentiviruses. 246 ORFs cor-responding to all the completely sequenced genomes wereavailable in GenBank. Only the genes with a length greaterthan or equal to 150 bp have been considered for furtherstudy. All these sequences together contained 135,304 ofcodons.
The various statistical parameters characterizing syn-onymous codon frequency, codon bias, base compositionof whole genes, base composition at 3rd codon positions,relative gene expression levels, preferred and optimal codons,correspondence and cluster analysis on codon usage, and theassociatedmeans, standard deviations (SD), correlation coef-ficients, and chi-square statistics (𝜒2) were computed usingCodonW [8], GCUA [9], and STATISTICA 8.0 (http://www.statsoft.com/).
3. Results
3.1. Codon and Nucleotide Bias. The “Effective Number ofCodons” (ENc) of a gene sequence measures the degree ofbias in codon usage in the gene [10]. It ranges from 20 to61, with values below 35 implying high bias while above 50implying low bias. It is found that none of the retroviral geneshad any strong codon bias. Around 50% of the genes had
weak codon bias, implying that the rest half of the genesare moderately/randomly biased. Approximately 80% of themoderately biased genes belong to Orthoretorvirinae, 50%belong to Lentivirus, and 13% to Deltaretrovirus. Spumare-torvirinae and “other Orthoretrovirinae groups” containsome amount of the moderately biased genes (Table 1). Someretroviruses showmore codon bias than the others.These areFIV, SFV-3, VISNA, OLV, and HIV-1 whose average ENc liesbetween 40 and 45. All of these are Lentiviruses, except SFV-3which belongs to Spumaretorvirinae. The total range of ENcfor all the retroviruses taken together was from 40 to 60.
Nucleotide preferences are usually an indication for thenature of mutational bias in genes or genomes. Here, inretroviruses, explicit differences are observed in nucleotidepreferences.TheAU content (overall A +U) of genes in singleretrovirus ranged from 35% to about 60% (Table 1). AU3 (A +U content of the 3rd synonymous codon position) content inretroviruses varied over a large range, from about 20% to 75%.FIV had the highest, both AU (60%) and AU3 (70%) content.FFV, SFV-3, VISNA, OLV, and HIV-1 also had similar levelsof high AU content. These viruses also had relatively highercodon bias among the whole set of retroviruses. ACMHV-2had the lowest AU (35%) and AU3 (20%) content. Amongall the retroviruses, FuSV, Y73SV, AMCV, WMSV, HTLV-4, HTLV-1, and STLV-2 had low AU (35 to 45%) and AU3(20 to 45%) content. It was observed that AU content of thegenes correlated strongly with their AU3 content (𝑟 = 0.91,𝑃 < 0.0001). AU1 and AU2 content (AU contents at first andsecond codon positions of genes, resp.) of retroviral genes areboth about 50%.This indicates an almost equal preference forAU andGC in both the first and second codon positions. But,in general, AU12 content (AU1 + AU2) is notably less thanAU3 of retroviral genes as a whole.
When ENc versus AU3 content is plotted for the wholedataset, it is seen that only a small number of genes lie onthe expected curve (the curve representing the variation ofcodon bias when determined by base composition only),while majority of the genes with low ENc values were lyingwell below it (Figure 1(a)). In the viruseswith relatively highercodon bias, most of the genes with moderate codon biashave high AU3 (i.e., low GC) content. Furthermore, whileconsidering the length of retroviral genes, it was found that nosignificant correlation existed between it and ENc of genes.
3.2. Preferred and Optimal Codons. Codons occurring inhigh frequencies in the total codon usage data of an organismare called preferred codons. Here, in retroviruses, significantdifferences (using 𝜒2 test) in overall codon usage frequencieswere observed between the pairwise combinations of retro-viral clades. But some pairs of viruses—Betaretrovirus andSpumaretrovirinae/Epsilonretrovirus; Epsilonretrovirus andBetaretrovirus/Lentivirus or other unclassified retroviruses;and Gammaretrovirus and Deltaretrovirus or the remainingunclassified retroviruses—were exceptions and did not showsignificant differences in their overall codon usage frequen-cies (𝑃 > 0.05). Four codons, GAA (Glu), AAA (Lys),AGA (Arg), and GGA (Gly), were particularly preferred toa large extent in retroviruses. Seven other codons, UUU(Phe), UUA (Leu), UAU (Tyr), CAA (Gln), AAU (Asn),

Computational and Mathematical Methods in Medicine 3
Table 1: Characteristics and codon usage pattern and AU distribution of retroviral genomes (shown in clades).
Virus∗ Abbrev. names Accn. number Mean ENc SD Mean AU % SD Mean AU3 % SDOrthoretrovirinae
AlpharetrovirusAvian carcinoma virus ACMHV-2 NC 001402 40.51 0.00 36.20 0.00 18.50 0.00Avian leukosis virus—RSA ALV-A NC 001408 57.09 3.32 44.80 7.35 45.23 9.32Avian myelocytomatosis virus AMCV NC 001866 52.79 0.00 39.60 0.00 32.00 0.00Fujinami sarcoma virus FuSV NC 001403 42.61 0.00 37.90 0.00 22.20 0.00Rous sarcoma virus RSV NC 001407 53.50 9.93 44.90 5.28 41.90 15.25UR2 sarcoma virus UR2SV NC 001618 55.68 0.59 53.40 0.00 56.65 1.77Y73 sarcoma virus Y73SV NC 008094 39.41 0.00 38.20 0.00 21.20 0.00
BetaretrovirusEnzootic nasal tumour virus of goats ENTV-2 NC 004994 49.86 1.36 57.63 2.33 70.20 1.53Jaagsiekte sheep retrovirus JSRV NC 001494 49.25 4.26 58.58 2.38 66.08 9.57Mason-Pfizer monkey virus MPMV NC 001550 50.10 1.31 57.58 1.27 68.13 1.60Mouse mammary tumor virus MMTV NC 001503 51.84 2.16 55.98 0.62 62.80 2.42Ovine enzootic nasal tumour virus ENTV-1 NC 007015 49.23 2.80 58.28 2.72 71.45 2.87Squirrel monkey retrovirus—HLB SMRV-HLB NC 001514 53.01 4.61 51.68 2.01 54.78 3.39
DeltaretrovirusBovine leukemia virus BLV NC 001414 52.05 2.54 44.98 3.49 47.35 4.83Primate T-lymphotropic virus 1
Human T-lymphotropic virus 1 HTLV-1 NC 001436 50.88 1.62 46.27 2.05 45.35 2.82Simian T-lymphotropic virus 1 STLV-1 NC 000858 51.09 2.06 46.73 2.29 45.80 3.45
Primate T-lymphotropic virus 2Human T-lymphotropic virus 2 HTLV-2 NC 001488 50.04 1.86 45.58 3.31 44.46 3.11Simian T-lymphotropic virus 2 STLV-2 NC 001815 51.19 4.24 43.08 3.82 41.97 5.16
Human T-lymphotropic virus 4 HTLV-4 NC 011800 50.86 2.71 42.85 2.62 40.68 2.23Simian T-cell lymphotropic virus 6 STLV-6 NC 011546 54.01 3.83 47.00 2.78 48.73 4.68Simian T-lymphotropic virus 3 STLV-3 NC 003323 55.39 3.72 44.92 2.73 44.52 2.31
EpsilonretrovirusSnakehead retrovirus SnRV NC 001724 51.88 7.91 50.31 4.73 58.46 4.80Walleye dermal sarcoma virus WDSV NC 001867 53.51 2.45 57.82 3.39 65.50 3.56
GammaretrovirusAbelson murine leukemia virus AbMLV NC 001499 55.03 6.45 46.73 8.81 46.50 11.23Feline leukemia virus FeLV NC 001940 53.84 4.16 50.30 1.70 53.60 0.99Murine leukemia virus
Friend murine leukemia virus FrMLV NC 001362 54.95 1.03 46.70 1.41 47.70 1.82Moloney murine leukemia virus MoMLV NC 001501 54.72 0.10 47.00 1.84 48.77 2.80Murine type C retrovirus MTCR NC 001702 52.33 3.00 45.90 0.99 45.50 2.44Rauscher murine leukemia virus R-MuLV NC 001819 55.42 0.62 46.87 1.40 47.60 1.32
Gibbon ape leukemia virus GALV NC 001885 55.83 1.34 47.57 1.16 48.83 0.67Moloney murine sarcoma virus MOMSV NC 001502 56.40 3.24 47.60 6.26 46.08 8.42Murine osteosarcoma virus MuSV NC 001506 49.97 0.98 42.65 1.77 37.35 7.14RD114 retrovirus RD-114 NC 009889 54.31 1.93 49.70 3.68 51.60 3.25Reticuloendotheliosis virus REV NC 006934 57.09 0.20 46.90 0.80 46.50 1.44Spleen focus-forming virus SFFV NC 001500 51.03 5.85 45.27 2.28 47.33 3.37Woolly monkey sarcoma virus WMSV NC 009424 51.39 8.65 42.60 4.04 37.97 13.23Xenotropic MuLV-related virus VP62 XMRV-VP62 NC 007815 52.79 2.41 46.43 1.29 46.80 2.18
LentivirusBovine immunodeficiency virus BIV NC 001413 53.22 4.43 53.26 3.60 57.90 5.35Caprine arthritis-encephalitis virus CAEV NC 001463 45.93 6.96 57.10 3.45 67.63 4.46Equine infectious anemia virus EIAV NC 001450 47.05 7.93 59.25 4.56 67.43 1.18Feline immunodeficiency virus FIV NC 001482 43.87 6.58 62.01 3.83 71.39 9.91Human immunodeficiency virus 1 HIV-1 NC 001802 45.05 4.01 55.49 4.66 64.78 7.24

4 Computational and Mathematical Methods in Medicine
Table 1: Continued.
Virus∗ Abbrev. names Accn. number Mean ENc SD Mean AU % SD Mean AU3 % SDHuman immunodeficiency virus 2 HIV-2 NC 001722 52.43 5.73 51.49 3.02 56.51 4.77Ovine lentivirus OLV NC 001511 44.59 4.47 57.72 3.78 65.73 6.90Simian immunodeficiency virus
Simian immunodeficiency virus SIV NC 001549 48.80 4.12 54.73 3.32 60.62 7.82Simian immunodeficiency virus SIV-mnd 2 SIV-mnd-2 NC 004455 51.44 5.83 54.91 2.63 58.94 6.43
Visna/Maedi virus VISNA NC 001452 44.47 5.34 57.83 2.70 68.25 6.51Spumaretrovirinae
Bovine foamy virus BFV NC 001831 55.93 2.36 52.14 3.66 58.76 5.22Equine foamy virus EFV NC 002201 45.53 2.69 58.00 4.83 71.16 5.47Feline foamy virus FFV NC 001871 48.58 3.78 60.53 2.95 70.40 3.59Macaque simian foamy virus SFVmac NC 010819 46.02 3.01 58.52 4.92 73.60 5.31Simian foamy virus SFV NC 001364 47.94 3.91 58.03 4.38 70.58 8.48Simian foamy virus 3 SFV-3 NC 010820 44.33 3.23 59.50 5.31 75.20 4.35
Unclassified retrovirusesAtlantic salmon swim bladder sarcoma virus SSSV NC 007654 54.69 2.28 51.70 3.54 57.90 6.65Avian endogenous retrovirus EAV-HP EAV-HP NC 005947 59.38 0.00 47.60 0.00 47.80 0.00Xenopus laevis endogenous retrovirus Xen1 Xen-1 NC 010955 59.60 1.80 53.35 2.76 58.00 4.11
∗Viruses are shown in their respective genera.
20
25
30
35
40
45
50
55
60
65
0 0.2 0.4 0.6 0.8 1
ENc
GC3s
OthersFIV
VISNAOLV
SFV-3 HIV-1
(a)
−0.6
−0.4
−0.2
0
0.2
0.4
0.6
−1 −0.5 0 0.5 1
1st axis Major factor (25.75%)
2nd
axis
Min
or fa
ctor
(8.8
2%)
OthersFIVSFV-3VISNAOLV
HIV-1HTLV-4HTLV-1STLV-2
(b)
Figure 1: (a) ENc versus GC3 plot of all the genes. The reference viruses are in different colors. (b)The values of the first axis and the secondaxis of each gene in CoA. Genes from reference retroviruses are shown in different colors; genes from other viruses are plotted in blue colour.
GAU (Asp), and UGU (Cys), are also frequently pre-ferred (see Supplementary Material available online athttp://dx.doi.org/10.1155/2013/848123). It was also observedthat closely related viruses, for example, those within theOrthoretrovirinae subfamily and those which are phyloge-netically relatively closer to this group, prefer similar set ofcodons. It was observed especially among the viruses withingenera like Betaretrovirus, Deltaretrovirus, Spumaretroviri-nae, and Lentivirus. On the other hand, the Alpharetroviruses
and Gammaretroviruses were somewhat of an exception withless similarity in their set of preferred codons. In general,the preferred codons almost always had A or U at their3rd synonymous codon positions (in Betaretrovirus, Epsilon-retrovirus, Lentivirus, and Spumaretrovirinae). But someviruses (Alpharetrovirus, Gammaretrovirus, and Deltaretro-virus) were exceptions, with high G or C content at their 3rdcodon positions of preferred codons. It is also observed thatthe choice of preferred codons correlated with the overall

Computational and Mathematical Methods in Medicine 5
−1
−0.5
0
0.5
1
30 45 60 75Axi
s1
AU (%)
(a)
UUC
UCC
UAC
UGCCUC
CCC
CAC
CGC
AUC
ACC
AAC
AGC
GUCGCC
GACGGC
UUG
UCG
CUG
CCGCAG
CGG
ACG
AAG AGG
GUGGCG
GAGGGG
UUA
UCA
CUA
CCA
CAA
CGA
AUA
ACA
AAA
AGAGUA
GCA
GAA
GGA
UUU
UCU
UAUUGU
CUUCCU
CAU
CGU
AUU ACU
AAU
AGU
GUU
GCU
GAU
GGU
−0.8
−0.6
−0.4
−0.2
0
0.2
0.4
0.6
0.8
−0.8 −0.6 −0.4 −0.2 0 0.2 0.4 0.6 0.8
1st axis (major factor)
2nd
axis
(min
or fa
ctor
)
3rd codon position C/G3rd codon position A/U
(b)
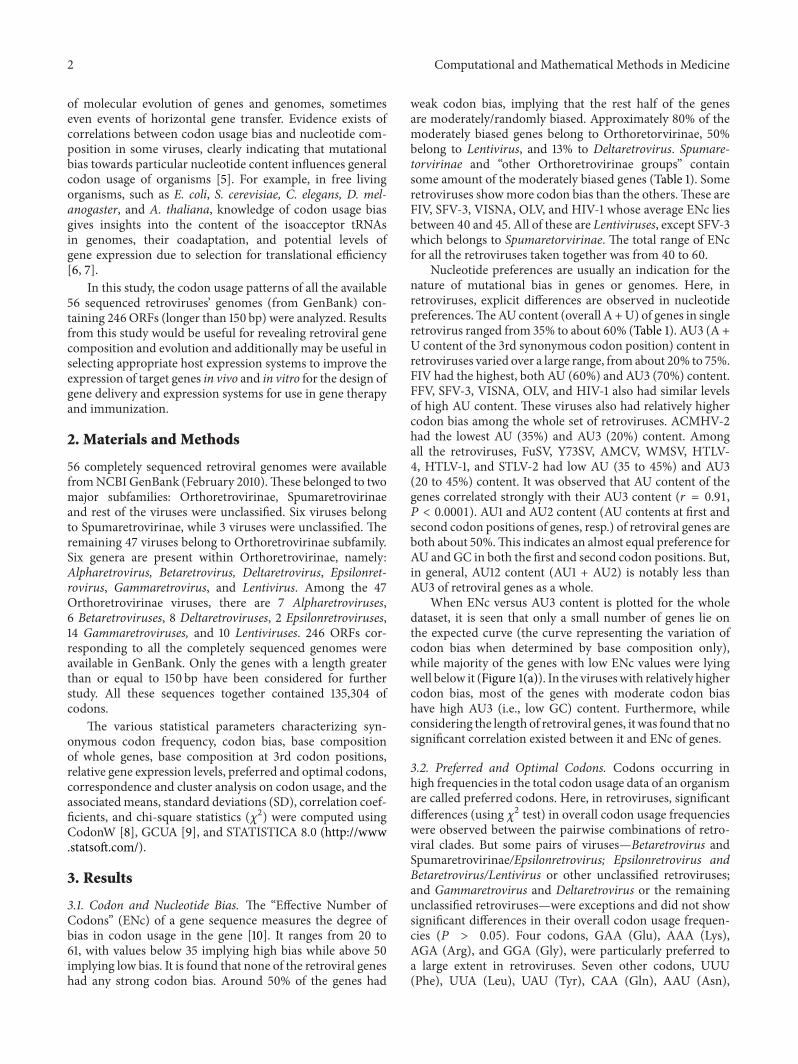
Figure 2: (a) Correlation between AU content of each retroviral gene and their position on the first axis of CoA. (b) The distribution ofsynonymous codons is shown along the first and second axes of the CoA. Codons ending with G or C are shown in blue colors, and codonsending with A or U are shown in orange colour.
genomic composition of the viruses. AU rich genomes pre-ferredAUending codons, andGC rich genomes preferredGCending codons.
The codon adaptation index (CAI) is one measure that isused to estimate the extent of bias towards codons that arepreferred in highly expressed genes. The CAI value rangesfrom 0 and 1.0 for a gene, where a higher value is likely toindicate stronger codon usage bias and a potential higherexpression level. Higher CAI for a large set of genes may alsoindicate that selection for translation is active over that setof genes. Codons whose frequencies of usage were signifi-cantly higher in the genes with higher CAI, than that of thegenes with lower CAI, are considered as the optimal codons.In this study, codon usage of retroviruses was compared (withchi-squared contingency test) between two groups of genes.One group of genes was constituted from 5% of the totalnumber of genes, which had the maximum CAI values. Theother group of geneswas similarly constructed from the geneshaving minimum CAI. In all, 26 codons, UUU (Phe), UUA,UUG, CUA (Leu), AUA (Ile), GUA (Val), UAU (Tyr), CAU(His), CAA (Gln), AAU (Asn), AAA (Lys), GAU (Asp), GAA(Glu), UCU, UCA, AGU (Ser), CCU, CCA (Pro), ACU, ACA(Thr), GCU, GCA (Ala), UGU (Cys), AGA, AGG (Arg), andGGA (Gly), were identified as the optimal codons (𝑃 < 0.01)(Table 2). Almost all of these codons have an A or U at thethird position. It may be noted that the previously identifiedpreferred codons are a subset of these optimal codons.Furthermore, it was found that significant correlations existbetween CAI and ENc, AU and AU3 values (𝑟 = 0.23, −0.32,−0.44 resp., 𝑃 < 0.05) over the whole data set of retroviralgenes. As expected if mutational bias is the main factorexplaining codon usage bias in retroviruses, the frequency ofpreferred codons, as defined bymost frequently used codons,is positively correlated with average AU composition.
3.3. Correspondence and Cluster Analysis. Correspondenceanalysis (CoA) on relative synonymous codon usage (RSCU)
is a method for identifying major trends/factors (as orthogo-nal axes) responsible for the variation in codon usage amonggenes represented as 59- (number of sense codons) dimen-sional vectors. In the correspondence analysis on codonusage of retroviral genes, the two axes which accounted forthe largest amount of variations, accounted for about 25%(major axis) and 10% of the variation of the whole data set.Each of the remaining axes accounted for less than 5% ofthe variation. The retroviral genes were widely distributedalong the length of the first major axis. Genes belonging todifferently biased viruses were distinctly separated on the firstmajor axis. The AU rich retroviruses, for example, FIV, SFV-3, VISNA, OLV, and HIV-1, were on the extreme right, whilethe GC rich viruses were on the other end (Figure 1(b)). Itwas interesting to note that Lentiviruses were closer to eachother on the axis than to viruses from other retroviral genera.AU,AU3, andCAI correlated stronglywith the firstmajor axis(𝑟 = 0.89, 0.9, −0.52, resp., 𝑃 < 0.05) (Figure 2(a)). The plotof the codons on first and second axes reveals that the A/U-ending and G/C-ending synonymous codons are also clearlyseparated along the first major axis (Figure 2(b)).
Cluster analysis based on codon usage reveals the group-ing within and across the organisms based on the similaritiesand differences in their codon usage. The organisms aregrouped based on a distance measure which is proportionalto the similarities of the codon usage between pairs of organ-isms. Cluster analysis on retroviral codon usage revealedthat the retroviruses are grouped into two major clusters(Figure 3), the larger cluster being further divided into twosubclusters. Alpharetroviruses with single genes constitutedthe minor cluster, while all the remaining viruses constitutedthe major cluster. It was observed that phylogeneticallyclosely related retroviruses are relatively closer to eachother in the clusters. Some retroviruses are relatively biased,grouped together in one subcluster. Retroviruses with higherAU and AU3 form one subcluster, while those with higherGC and GC3 form the other subcluster. It is seen that

6 Computational and Mathematical Methods in Medicine
Euclidean distances
0 1 2 3 4 5 6 7 8
VirusAbMLV 55.03 46.73 46.50WMSV 51.39 42.60 37.97AMCV 52.79 39.60 32.00MuSV 49.97 42.65 37.35BLV 52.05 44.98 47.35HTLV-1 50.88 46.27 45.35STLV-1 51.09 46.73 45.80STLV-6 54.01 47.00 48.73STLV-3 55.39 44.92 44.52HTLV-2 50.04 45.58 44.46HTLV-4 50.86 42.85 40.68STLV-2 51.19 43.08 41.97FeLV 53.84 50.30 53.60FrMLV 54.95 46.70 47.70R-MuLV 55.42 46.87 47.60MoMLV 54.72 47.00 48.77XMRV-VP62 52.79 46.43 46.80MTCR 52.33 45.90 45.50MOMSV 56.40 47.60 46.08SFFV 51.03 45.27 47.33GALV 55.83 47.57 48.83RD-114 54.31 49.70 51.60REV 57.09 46.90 46.50SMRV-HLB 53.01 51.68 54.78ALV-A 57.09 44.80 45.23RSV 53.50 44.90 41.90EAV-HP 59.38 47.60 47.80BFV 55.93 52.14 58.76BIV 53.22 53.26 57.90SnRV 51.88 50.31 58.46SSSV 54.69 51.70 57.90WDSV 53.51 57.82 65.50UR2SV 55.68 53.40 56.65CAEV 45.93 57.10 67.63OLV 44.59 57.72 65.73VISNA 44.47 57.83 68.25HIV-1 45.05 55.49 64.78HIV-2 52.43 51.49 56.51
SIV 48.80 54.73 60.62SIV-mnd-2 51.44 54.91 58.94EFV 45.53 58.00 71.16SFV 47.94 58.03 70.58SFVmac 46.02 58.52 73.60SFV-3 44.33 59.50 75.20FFV 48.58 60.53 70.40MMTV 51.84 55.98 62.80EIAV 47.05 59.25 67.43FIV 43.87 62.01 71.39MPMV 50.10 57.58 68.13ENTV-1 49.23 58.28 71.45ENTV-2 49.86 57.63 70.20JSRV 49.25 58.58 66.08Xen-1 59.60 53.35 58.00ACMHV-2 40.51 36.20 18.50FuSV 42.61 37.90 22.20Y73SV 39.41 38.20 21.20
Linkage distance
GammaretrovirusAlpharetrovirus Betaretrovirus
Spumaretrovirinae
DeltaretrovirusEpsilonretrovirus Lentivirus
Unclassified Retroviridae
AU 3%AU (%)ENc
Figure 3: Dendogram representing the extent of divergence in relative synonymous codon usage of 56 retroviruses, using unweighed pairgroup average clustering, and distances are in Euclidean distance. Different clades are in different colors. To the extreme right mean ENc,mean AU% and AU3% are added from Table 1.

Computational and Mathematical Methods in Medicine 7
Table 2: Translational optimal codons.
Amino acid Codon# High LowRSCU Number RSCU Number
Phe UUU∗ 1.64 184 0.7 61UUC 0.36 40 1.3 113
Leu
UUA∗ 2.67 323 0.34 35UUG∗ 1.21 146 0.5 51CUU 0.47 57 0.63 65CUC 0.29 35 1.83 189CUA∗ 0.94 114 0.53 55CUG 0.41 50 2.17 223
IleAUU 0.85 193 0.77 55AUC 0.29 66 1.72 122AUA∗ 1.86 425 0.51 36
Val
GUU 0.65 80 0.63 44GUC 0.36 44 1.38 96GUA∗ 2.17 267 0.32 22GUG 0.82 101 1.68 117
Tyr UAU∗ 1.74 270 0.44 34UAC 0.26 41 1.56 121
His CAU∗ 1.5 144 0.64 63CAC 0.5 48 1.36 134
Gln CAA∗ 1.49 383 0.47 71CAG 0.51 131 1.53 228
Asn AAU∗ 1.67 317 0.54 38AAC 0.33 62 1.46 104
Lys AAA∗ 1.38 481 0.68 93AAG 0.62 218 1.32 182
Asp GAU∗ 1.51 259 0.53 54GAC 0.49 85 1.47 149
Glu GAA∗ 1.5 474 0.61 99GAG 0.5 159 1.39 228
Ser
UCU∗ 1.18 77 0.76 49UCC 0.56 37 2.1 136UCA∗ 1.88 123 0.51 33UCG 0.2 13 0.71 46AGU∗ 1.53 100 0.37 24AGC 0.66 43 1.56 101
Pro
CCU∗ 1.47 162 0.68 81CCC 0.52 57 2.04 243CCA∗ 1.78 196 0.75 89CCG 0.24 26 0.54 64
Thr
ACU∗ 1.29 156 0.67 57ACC 0.42 51 2.1 178ACA∗ 2.09 252 0.67 57ACG 0.2 24 0.55 47
Ala
GCU∗ 1.09 130 0.7 69GCC 0.58 69 2.11 207GCA∗ 2.07 246 0.67 66GCG 0.26 31 0.51 50
Cys UGU∗ 1.69 133 0.5 27UGC 0.31 24 1.5 81
Table 2: Continued.
Amino acid Codon# High LowRSCU Number RSCU Number
Arg
CGU 0.03 2 0.53 26CGC 0.09 6 1.64 81CGA 0.42 28 0.65 32CGG 0.12 8 2.03 100AGA∗ 3.71 250 0.45 22AGG∗ 1.63 110 0.71 35
Gly
GGU 0.49 73 0.42 37GGC 0.32 48 1.52 134GGA∗ 2.22 333 0.74 65GGG 0.97 145 1.33 117
#W, M, and stop codons are excluded. Those codons are significantly higherin highly expressed genes.
Lentiviruses are groupedwithBetaretrovirus, Spumaretroviri-nae, Epsilonretrovirus, someAlpharetrovirus, and unclassifiedretroviruses, which have higher AU and AU3. Delta andGamma retroviruses exist in the other subcluster with GCand GC3 rich viruses. This observation was in accordancewith the findings from CoA.
4. Discussion
Retroviruses are an extremely important system for study,especially so because of its potential to adversely affect thequality of life and life-span of a large fraction of the worldpopulation especially in developing countries. These virusesare a potential threat to mankind, because of their complexbiological mechanisms and evolution. This study aims toreveal the nature of some important genetic, genomic, andevolutionary features of these viruses which may be furtherutilized in better understanding of the retroviral system andhas been designed to elucidate the general complexity andpreferences of codon usage of all the retroviruses based oncertain well-established parameters. Analysis of codon usageand base composition of retroviral genes documented herehave revealed some useful facts. Furthermore, the resultsobtained through the various analyses were found to beconsistent with each other, thus strongly validating the resultsobtained.
The large majority of the completely sequenced 56 retro-viruses belonged to the Orthoretrovirinae subfamily. Withinthe Orthoretrovirinae, different genera contained almostequal number of viruses. Several features of retroviruses havebeen revealed through computation and analysis of differentwell-established parameters to understand their composi-tional and codon usage characteristics.They are RSCU, codonbias (ENc), base content, preferred and optimal codons,major factors of CoA, and grouping by cluster analysis ofthese viruses based on their codon usages.
It is found that retroviral genes do not possess sig-nificantly high codon bias. The genes are almost equallydistributed between weak bias andmoderate bias.This obser-vation is very similar to the findings of Jenkins and Holmes,

8 Computational and Mathematical Methods in Medicine
in 2003, where they had also observed moderate bias in50 human RNA viruses [7]. However, the study by Jenkinsand Holmes included only 4 human retroviruses, and in thepresent study a total of 56 completely sequenced retroviralsequences were analyzed, thus providing a more completeview of the totalRetroviridae family that strongly supports theearlier observations by Jenkins and Holmes [7]. In addition,CoA was also performed in this present study that success-fully discriminates between differently biased groups andadded a new dimension in explaining the factors responsiblefor shaping the codon usage bias of the retroviruses. Largemajority of the moderately biased genes belonged to theviruses from the Orthoretrovirinae subfamily. Among thetotal biased genes, most of the genes were from only FIV,SFV-3, VISNA, OLV, and HIV-1. There are large variationsin the nucleotide composition of the retroviral genes. TheAU content of the genes varied over a wide range of about25% (range size), while the AU3 content varied over far largerrange of 55% (range size).This varying pattern of AU contentin retroviruses is in good agreement with the earlier studyby Jenkins and Holmes [7]. Four of the human retrovirusesreported by Jenkins and Holmes and in this present studyalso followed similar base usage pattern [7]. Viruses, whichexhibited higher codon usage bias (mentioned earlier), alsopossessed higher AU content, both at the third synonymouscodon position and in overall gene composition. FIV had thehighest AU and AU3 content over other retroviruses, whileACMHV-2 had the lowest. Though AU3 content increasedwith overall AU content, there was no specific nucleotidebias in the major fraction of first and second codon positionsof retroviruses. AU content of the first and second codonpositions combined is relatively higher in viruses whichhave relatively higher codon bias and higher AU & AU3content. There are some notable variations of base content ofgenes and codon bias even within retroviral genomes. Thus,heterogeneity of compositional bias exists both within andacross retroviral genomes. Additionally, it is also clear fromdata that codon usage and base composition are virus-specificto a considerable extent. Majority of the genes were belowthe expected curve of codon bias when plotted against basecomposition of the third codon position (Figure 1(a)). Thissignifies that additional factors other than base compositionmight also have influenced retroviral codon usage.
Some retroviruses were significantly similar in theiroverall codon usage, while majority was not. Four preferredcodons were identified, all of which were subset of the setof 26 optimal codons separately identified. It was observedthat phylogenetically closer retroviruses possess relativelysimilar codon usage and almost the same sets of preferred andoptimal codons havingA orU in their synonymous positions.But Alpharetrovirus, Gammaretrovirus, and Deltaretroviruswere exceptions with relatively higher G or C in their 3rdcodon positions. Compositions of the optimal codons werecorrelated with the average genetic base composition ofthese viruses. In correspondence analysis, the two dominantaxes accounted for about one-third of the total variationof codon usage in retroviruses. It was seen that these axessuccessfully differentiated the genes based on codon bias,base content, and codon composition. Correlation between
CAI, as a measure of relative expression and first major axis,indicates that translational selection seemingly has a role inretroviruses. This observation implicates that once the viralgenome enters into host translationary mechanism, then thebiased genes (indicated by ENC and 1st major axis) havinghigher relative expression potential (higher CAI value) thatmatches the host can translate faster, thus achieving higherfitness for the virus [11]. These results and correlationsbetween CAI, codon bias, and base composition indicatethat genes with relatively higher codon bias are primarilycomposed of mostly optimal codons. Cluster analysis alsovalidated that evolutionary-related retroviruses have similarcodon usage, and those which are distant have distinctlydifferent codon usage.
In the light of the general fact that selective constraintsare greater in the first two positions of codons, whereasmutational bias is greater in the third position, all the obser-vations indicate that codon bias in retroviruses in general isstrongly dependent on base composition andmutational bias.This observation is also supported by earlier studies where ithas been shown that main factor explaining codon usage inviruses is mutation bias [7, 12–14] and generally ATmutationbias in RNA viruses [15, 16]. Selection for overall efficientexpression for genes is probably an important factor affectingcodon usage in these systems (as indicated by correlationbetween CAI and the first major axis). Groupings observedfrom cluster analysis and the conservation of preferred andoptimal codons and similar base usage in phylogeneticallyclose retroviruses indicate that codon usage and nucleotidecompositionmight have evolved through a concerted processin these viral systems.There is a certain possibility that overallall AU richness of the retroviruses, being host dependentviruses, might have evolved due to differential cost andexploit the availability of relevant metabolites in the host cell[17]. This is also supported by the fact that small genomeviruses, like retroviruses, are more AU prone than in contrastto largeDNA viruses which aremostly GC rich [18]. Evidenceof translational selection on codon usage bias in the viruseshas been found on a subset of genes only, those for whichselection efficiency or accuracy is possibly the most impor-tant for the survival of the viruses based on their improvedexpression [19, 20]. This fact is also supported by earlierstudies, where correlation between viral codon usage bias andhost codon usage bias implicates better exploitation of thehost translationary mechanism in cooperation with the hosttranslational bias [11, 20].
There is a good possibility that compositional biasdetected in retroviruses in this study is the result of a direc-tional mutational pressure imposed by one of the twoenzymes that copies the retroviral genome, that is, retrovirus-specific reverse-transcriptase (RT) enzyme, which convertsthe viral RNA into DNA. It is a distinct possibility that theabsence of any strong codon bias in retroviruses might bedue to the combined effect of missincorporations by theerror-prone RT polymerase enzyme (mentioned above)and another class of enzyme, cytidine deaminases such asenzymes of APOBEC3 superfamily [21, 22] and lack of strongselection on codons in retroviral genes. There is indeedsome experimental evidence that the HIV-1 RT enzyme is

Computational and Mathematical Methods in Medicine 9
responsible for accumulation of A nucleotides in viral plus-strand genome. These enzymes are also supposed to beresponsible for hypermutation of retroviruses, such as HIV-1 and SIV [22, 23]. Relatively error-prone RT polymeraseenzyme and enzymes like APOBEC3 cytidine deaminasespreferentially incorporate G to U mismatches during minusstrand cDNAsynthesis [21, 23] and eventually further inducesG to Amutations in the viral RNA genome [24]. It is possiblethat other retroviruses also have evolved under the influenceof similar enzymes, inducing hypermutation in those viruses.Relations observed in this study between distinct AU pref-erence and codon usage bias in retroviruses may be due tothis general propensity of G to U and further to A muta-tion. In fact, absence of relation between gene length andcodon usage, implying the absence of strong selection fortranslational accuracy, specifically, in these viruses, mightbe due to the effect of missincorporations by the error-prone, RT polymerase itself [21] and cytidine deaminases[23]. Weak codon bias observed is possibly the result ofthese high mutation rates in retroviruses. This might beadvantageous for maintaining high mutation rates in theseviruses. Such rapid mutation, for example, in HIV-1, leads toan accumulation of diversity of its gene sequences. By diver-sifying, the viruses are probably able to escape host immunedetection. But this phenomenon must be occurring at theexpense of purifying effect of the general selection forces[25, 26]. Furthermore, the weak codon bias in retrovirusesmight also be contributing towards decreasing host immuneresponse during retroviral infection in the host by allowingthe relatively lower expression of viral “env” to be suppressedin order to minimize antigenic profile of these viruses [27].These critical processes may have shaped retroviral genesover time to become a very successful immunoinvadingsystem. There are some lines of evidence that suggest thatretroviruses, such as HIV-1, are subject to a positive selectionpressure imposed by the immune system [28]. Additionally,previous studies indicate that retroviral gene expression iscontrolled by multiple complex regulatory mechanisms [29].For example, HIV structural proteins are expressed fromunspliced 9 kb (gag/pol) and partially spliced 4 kb (env) tran-scripts that are unstable and can efficiently be exported fromthe nucleus in absence of HIV regulatory protein Rev. Thelack of nuclear stability and export in absence of Rev is partlydue to the presence of defined inhibitory sequences (knownas INS, IN, and CRS) within structural genes themselves. Inthis context, the lowGC content ofHIVRNAalso contributesto nuclear instability, even in absence of defined inhibitorysequences [30]. All these facts may help to put in context thecompositional patterns and codon usage bias in majority ofretroviruses.
Observations from comparative analysis of codon usagebias reveal lack of strong translational selection in consid-erable number of retroviruses and this could be a problemof using retroviruses as expression vectors for gene therapyand immunization. Instead, use of the retroviruses withAU rich nucleotide composition is recommended, utilizingoptimal set of codons. Information on optimal codonsobtained from this study is expected to be useful for codonoptimization especially for designing retroviral vectors with
higher translational efficiency and production of simple andsafe retroviral vectors for gene therapy and immunization.
5. Conclusion
Overall, the results point towards the fact that mutationalbias is a dominant factor, relative to translational selection, inshaping codon usage of retroviruses. In these viruses, wherecodon usage bias is not strong, it is primarily determined bybase composition, that is, AU (or GC) content of the genes,while selection for efficient expression for genes is probablyanother important factor affecting their codon usage. Theintricate character of codon usage of these viral systemsis probably maintained by incorporations of errors duringmolecular processing of the retroviral genomes, to help avoidstrong immune response from the infected host but yetstrike a balance with adequate execution of basic life cyclemechanisms of these viruses. In spite of inter- and intra-genomic differences of base and codon usage, it is possiblethat the extant retroviruses, in general, have emerged througha complex but concerted process of evolution.
Conflict of Interests
The authors declare that they have no conflict of interests andthat they did not receive financial support for this study.
Acknowledgment
The authors are thankful to Arpita Mukherjee (Scientist,Department of Electronics, Central Mechanical EngineeringResearch Institute, Durgapur-713209, India) for her technicalhelp on statistics and critical reading of the paper.
References
[1] J. M. Coffin, “Retroviridae: the viruses and their replication,” inFields Virologyed, B. N. Fields, D. M. Knipe, and P. M. Howley,Eds., pp. 1767–1847, Lippincott-Raven, Philadelphia, Pa, USA,3rd edition, 1996.
[2] R. A.Weiss, “How does HIV cause AIDS?” Science, vol. 260, no.5112, pp. 1273–1279, 1993.
[3] R. Kurth and N. Bannert, Retroviruses: Molecular Biology.Genomics and Pathogenesis, Caister Academic Press, Berlin,Germany, 2010.
[4] M. Bulmer, “The selection-mutation-drift theory of synony-mous codon usage,” Genetics, vol. 129, no. 3, pp. 897–907, 1991.
[5] S. RoyChoudhury and D. Mukherjee, “A detailed comparativeanalysis on the overall codon usage pattern in herpesviruses,”Virus Research, vol. 148, no. 1-2, pp. 31–43, 2010.
[6] L.Duret, “Evolution of synonymous codonusage inmetazoans,”Current Opinion in Genetics and Development, vol. 12, no. 6, pp.640–649, 2002.
[7] G.M. Jenkins and E. C.Holmes, “The extent of codon usage biasin human RNA viruses and its evolutionary origin,” VirusResearch, vol. 92, no. 1, pp. 1–7, 2003.
[8] J. Peden, Analysis of Codon Usage, University of Notting-ham, Department of Genetics, Nottingham, UK, 1997, http://codonw.sourceforge.net.

10 Computational and Mathematical Methods in Medicine
[9] J. O. McInerney, “GCUA: general codon usage analysis,” Bioin-formatics, vol. 14, no. 4, pp. 372–373, 1998.
[10] F. Wright, “The “effective number of codons” used in a gene,”Gene, vol. 87, no. 1, pp. 23–29, 1990.
[11] A. Carbone, “Codon bias is amajor factor explaining phage evo-lution in translationally biased hosts,” Journal of Molecular Evo-lution, vol. 66, no. 3, pp. 210–223, 2008.
[12] I. S. Belalov and A. N. Lukashev, “Causes and implications ofcodon usage bias in RNA viruses,” PLoS ONE, vol. 8, no. 2,Article ID e56642, 2013.
[13] Y. Zhang, Y. Liu, W. Liu et al., “Analysis of synonymous codonusage in hepatitis A virus,” Virology Journal, vol. 8, article 174,2011.
[14] S. Roychoudhury, A. Pan, and D. Mukherjee, “Genus specificevolution of codon usage and nucleotide compositional traitsof poxviruses,” Virus Genes, vol. 42, no. 2, pp. 189–199, 2011.
[15] Q. Zhong, W. Xu, Y. Wu, and H. Xu, “Patterns of synonymouscodon usage on human metapneumovirus and its influencingfactors,” Journal of Biomedicine and Biotechnology, vol. 2012,Article ID 460837, 7 pages, 2012.
[16] N. Goni, A. Iriarte, V. Comas et al., “Pandemic influenza A viruscodon usage revisited: biases, adaptation and implications forvaccine strain development,”Virology Journal, vol. 9, article 263,2012.
[17] E. P. C. Rocha and A. Danchin, “Base composition bias mightresult from competition for metabolic resources,” Trends inGenetics, vol. 18, no. 6, pp. 291–294, 2002.
[18] L. A. Shackelton, C. R. Parrish, and E. C. Holmes, “Evolutionarybasis of codon usage and nucleotide composition bias invertebrate DNA viruses,” Journal ofMolecular Evolution, vol. 62,no. 5, pp. 551–563, 2006.
[19] E. Cowe and P. M. Sharp, “Molecular evolution of bacterio-phages: discrete patterns of codon usage in T4 genes are relatedto the time of gene expression,” Journal of Molecular Evolution,vol. 33, no. 1, pp. 13–22, 1991.
[20] S. Michely, E. Toulza, L. Subirana et al., “Evolution of codonusage in the smallest photosynthetic eukaryotes and their giantviruses,” Genome Biology and Evolution, vol. 5, no. 5, pp. 848–859, 2013.
[21] J. Vartanian,A.Meyerhans,M. Sala, and S.Wain-Hobson, “G →A hypermutation of the human immunodeficiency virus type1 genome: evidence for dCTP pool imbalance during reversetranscription,” Proceedings of the National Academy of Sciencesof the United States of America, vol. 91, no. 8, pp. 3092–3096,1994.
[22] A. Takaori-Kondo, “APOBEC family proteins: novel antiviralinnate immunity,” International Journal of Hematology, vol. 83,no. 3, pp. 213–216, 2006.
[23] K. Sato, T. Izumi, N. Misawa et al., “Remarkable lethal G-to-A mutations in vif-proficient HIV-1 provirus by individualAPOBEC3 proteins in humanized mice,” Journal of Virology,vol. 84, no. 18, pp. 9546–9556, 2010.
[24] B. Brekhout, A. T. Das, and N. Beerens, “HIV-1 RNA editing,hypermutation and error-prone reverse transcription,” Science,vol. 292, no. 5514, article 7, 2001.
[25] L. M. Mansky, “Retrovirus mutation rates and their role ingenetic variation,” Journal of General Virology, vol. 79, no. 6, pp.1337–1345, 1998.
[26] R. Shankarappa, J. B. Margolick, S. J. Gange et al., “Consistentviral evolutionary changes associated with the progression ofhuman immunodeficiency virus type 1 infection,” Journal ofVirology, vol. 73, no. 12, pp. 10489–10502, 1999.
[27] C. Williamson, L. Morris, M. F. Maughan et al., “Characteriza-tion and selection of HIV-1 subtype C isolates for use in vaccinedevelopment,” AIDS Research and Human Retroviruses, vol. 19,no. 2, pp. 133–144, 2003.
[28] H. A. Ross and A. G. Rodrigo, “Immune-mediated positiveselection drives human immunodeficiency virus type 1 molecu-lar variation and predicts disease duration,” Journal of Virology,vol. 76, no. 22, pp. 11715–11720, 2002.
[29] H. Tang, K. L. Kuhen, and F.Wong-Staal, “Lentivirus replicationand regulation,” Annual Review of Genetics, vol. 33, pp. 133–170,1999.
[30] K. Nguyen, M. Llano, H. Akari et al., “Codon optimization ofthe HIV-1 vpu and vif genes stabilizes their mRNA and allowsfor highly efficient Rev-independent expression,” Virology, vol.319, no. 2, pp. 163–175, 2004.

Submit your manuscripts athttp://www.hindawi.com
Stem CellsInternational
Hindawi Publishing Corporationhttp://www.hindawi.com Volume 2014
Hindawi Publishing Corporationhttp://www.hindawi.com Volume 2014
MEDIATORSINFLAMMATION
of
Hindawi Publishing Corporationhttp://www.hindawi.com Volume 2014
Behavioural Neurology
EndocrinologyInternational Journal of
Hindawi Publishing Corporationhttp://www.hindawi.com Volume 2014
Hindawi Publishing Corporationhttp://www.hindawi.com Volume 2014
Disease Markers
Hindawi Publishing Corporationhttp://www.hindawi.com Volume 2014
BioMed Research International
OncologyJournal of
Hindawi Publishing Corporationhttp://www.hindawi.com Volume 2014
Hindawi Publishing Corporationhttp://www.hindawi.com Volume 2014
Oxidative Medicine and Cellular Longevity
Hindawi Publishing Corporationhttp://www.hindawi.com Volume 2014
PPAR Research
The Scientific World JournalHindawi Publishing Corporation http://www.hindawi.com Volume 2014
Immunology ResearchHindawi Publishing Corporationhttp://www.hindawi.com Volume 2014
Journal of
ObesityJournal of
Hindawi Publishing Corporationhttp://www.hindawi.com Volume 2014
Hindawi Publishing Corporationhttp://www.hindawi.com Volume 2014
Computational and Mathematical Methods in Medicine
OphthalmologyJournal of
Hindawi Publishing Corporationhttp://www.hindawi.com Volume 2014
Diabetes ResearchJournal of
Hindawi Publishing Corporationhttp://www.hindawi.com Volume 2014
Hindawi Publishing Corporationhttp://www.hindawi.com Volume 2014
Research and TreatmentAIDS
Hindawi Publishing Corporationhttp://www.hindawi.com Volume 2014
Gastroenterology Research and Practice
Hindawi Publishing Corporationhttp://www.hindawi.com Volume 2014
Parkinson’s Disease
Evidence-Based Complementary and Alternative Medicine
Volume 2014Hindawi Publishing Corporationhttp://www.hindawi.com