Embed Size (px)
Citation preview
Stop codon usage in bacteria
1
Comprehensive analysis of stop codon usage in bacteria and its correlation with release factor abundance
Gürkan Korkmaz, Mikael Holm, Tobias Wiens and Suparna Sanyal*
Department of Cell and Molecular Biology, Uppsala University, Box-596, BMC, Uppsala, Sweden
Running Title: Stop codon usage in bacteria
*To whom correspondence should be addressed: Suparna Sanyal, Department of Cell and Molecular Biology, Uppsala University, Box-596, BMC, Uppsala, Sweden, Tel: +46-18-4714220, Fax: +46-18-4714262, E-mail: [email protected]
Keywords: ribosome, translation, codon usage, stop codon, release factor
Background: Stop codon frequencies in 4684 bacterial genomes are analyzed. Results: With increasing genomic GC-content TAA% decreases and TGA% increases reciprocally, but TAG% remains almost unchanged (~20%). The TAG:TGA ratio matches well with RF1:RF2 ratio. Conclusion: TAG is the minor stop codon and expression of genes with TAG is correlated with the RF1 level. Significance: Establishes correlation between stop codon frequency and RF1/RF2 abundance.
ABSTRACT: We present a comprehensive analysis of
stop codon usage in bacteria by analyzing over 8 billion nucleotide sequences of 4684 bacterial sequences. Using a newly developed program called ‘stop codon counter’, the frequencies of the three classical stop codons TAA, TAG and TGA have been analyzed and a publicly available stop codon database has been built. Our analysis show that with increase in genomic GC content, the frequency of the TAA codon decreases and that of the TGA codon increases in a reciprocal manner. Interestingly, the release factor 1 specific codon TAG maintains a more or less uniform frequency (~20%), irrespective of the GC content. The low
abundance of TAG is also valid with respect to expression level of the genes ending with different stop codons. In contrast, the highly expressed genes predominantly end with TAA, ensuring termination with either of the two release factors. Using three model bacteria with different stop codon usage (Escherichia coli, Mycobacterium smegmatis, and Bacillus subtilis), we show that the frequency of TAG and TGA codons correlates well with the relative steady state amount of mRNA and protein for release factors RF1 and RF2 during exponential growth. Furthermore, using available microarray data for gene expression, we show that in both fast growing and contrasting biofilm formation condition, the relative level of RF1 is nicely correlated with the expression level of the genes ending with TAG.
Many bacteria and eukaryotic organisms
show bias in their usage of synonymous codons. For the 61 sense codons this phenomenon has been studied in depth (1, 2). Sense codon frequency is believed to correlate well with tRNA abundance (2, 3), and thus, might influence the rate and accuracy of protein synthesis as well as folding of the individual domains (4–6). In the standard bacterial codon table there are three stop codons; TAG, TGA and TAA (UAG, UGA and UAA on mRNA), which are recognized by two class – I
http://www.jbc.org/cgi/doi/10.1074/jbc.M114.606632The latest version is at JBC Papers in Press. Published on September 12, 2014 as Manuscript M114.606632
Copyright 2014 by The American Society for Biochemistry and Molecular Biology, Inc.
by guest on Decem
ber 31, 2019http://w
ww
.jbc.org/D
ownloaded from
Stop codon usage in bacteria
2
release factors, RF1 and RF2. The release factors initiate termination of translation by binding to the stop codons at the decoding center and releasing the nascent peptide from the peptidyl tRNA at the peptidyl transferase center. The stop codons are not perfectly synonymous as UAG is recognized solely by RF1, UGA solely by RF2 and UAA is recognized by both factors (7). However, the existence of three stop codons raises the question of whether or not there is bias in their usage. There are not many studies on stop codon usage in bacteria till date. In an earlier study, Sharp and Bulmer (8) analyzed the stop codon bias in Escherichia coli, Bacillus subtilis and Saccharomyces cerevisae. In the few coding sequences (CDS) available at that time TAA was observed to be the most abundant stop codon. The authors concluded that this strong bias towards TAA might be due to the fact that it can be recognized by both release factors, which was suggested in other related studies as well (9, 10). In a later work, Sun and colleagues analyzed more than 70000 genes from eukaryotes including fungi, plant and human (11). They found TAA to be the most abundant stop codon in lower eukaryotes, whereas in higher eukaryotes, TGA was the most abundant one. In a more detailed investigation, stop codon determinants in six prokaryotic and five eukaryotic genomes were studied, with the same conclusions (12). In other earlier works, the context of surrounding nucleotides, especially those immediately after the stop codon, in translation termination has been discussed (10, 13, 14). Also, tools such as ‘TRANSTERM’ were prepared to investigate the up- and downstream region of stop codons in a given species (9). This tool also allowed to clarify the relevance of tandem stop codons in E. coli (15). There is only one example till date, where a large scale analysis of stop codon usage in bacteria (736 species) has been performed (16). This work clearly demonstrated the pattern of variation of the stop codons with genomic GC content and reached to the conclusion that the bacterial stop codons are
not selectively equivalent. The authors, however, didn’t make the detailed data for stop codon distribution in a particular species available to the general readers. Also, while they correctly identified TAG as the least frequent stop codon, no biochemical experiments were performed to elucidate the molecular mechanisms behind negative selection on TAG stop codon.
Here we present a complementary large scale analysis of stop codon usage in bacteria involving over 8.5 million coding sequences from 4684 bacterial genome sequences. We have intentionally limited our analysis to bacteria, and didn’t explore the eukaryotic cellular organelles of bacterial origin, since the assigned stop codons for the organelles (e.g. mitochondria) are not fully established (17). We have constructed a publicly available stop codon usage database for common bacterial genomic sequences (http://www.icm.uu.se/forskning/struktur-och-molekylarbiologi/Molekylarbiologi/sanyal-lab/), where information regarding a specific bacterium can be easily extracted from an alphabetically arranged list. Our results, reconfirming earlier reports (16, 18) demonstrate strong bias in stop codon usage in different bacteria and show that the distribution of TGA and TAA, but not of TAG, is likely driven by genomic GC content. Next, we analyzed the region immediately downstream to the stop codon for all genes in Escherichia coli, Bacillus subtilis and Mycobacterium smegmatis for additional stop codons.
Since in bacteria, three stop codons are read by two release factors in semi-specific manner, we asked an additional question whether there exists a correlation between the usage of the stop codons and the abundance of RF1 and RF2. Previous results showed that in exponentially growing E. coli, RF2 is about five times more abundant than RF1 (19, 20). In the present study, we have analyzed three model bacteria E. coli, Mycobacterium smegmatis and Bacillus subtilis, for RF1 and RF2 abundance using qPCR and Western blotting. Furthermore, we have analyzed
by guest on Decem
ber 31, 2019http://w
ww
.jbc.org/D
ownloaded from
Stop codon usage in bacteria
3
the gene-types associated with the three stop codons and investigated stop codon usage in E. coli based on available gene–expression microarray data. We observe that level of expression of the genes ending with TAG correlates very well with the level of RF1 in different physiological conditions.
EXPERIMENTAL PROCEDURES
Sequences - The gene sequences used in this work were obtained from the National Center for Biotechnology Information (NCBI) database. In total 4684 genomes (including bacterial plasmids) were analyzed, which is gathered in a database that can be downloaded from http://clamator.its.uu.se/uploader/162/stopcodondatabase.zip. Throughout the paper TAA, TAG and TGA are used as stop codons irrespective of the DNA or mRNA context to simplify the discussion. The Stop Codon Counter - The ‘stop codon counter’ is a custom program written in the Java programming language. Given a file with coding sequences in the FASTA format, the program determines how often a set of specified codons (called ‘criteria’) appear as the last codon in a gene. The three canonical stop codon sequences (TAA, TAG, TGA) are set as the default to be counted. The set of counted codons can be extended by using the ‘add criteria’ function in the program. Once the files containing the sequences are loaded into the program and analyzed, the stop codon counter generates a separate output file for each input file, where the genes are categorized by their stop codons. Additionally, the frequency and absolute count of each codon are also recorded. The program and the database are freely available on our homepage at http://www.icm.uu.se/forskning/struktur-och-molekylarbiologi/Molekylarbiologi/sanyal-lab/. The program can be downloaded as a compressed file from http://clamator.its.uu.se/uploader/162/StopCodonCounter-V0.2.zip.
Determination of additional stop codons - In order to identify additional stop codons after a primary stop codon, we have scanned all 3’ untranslated regions (UTRs) in the chromosome of E. coli K12, B. subtilis (substr. 168) and M. smegmatis (MC2 155). The UTRs were extracted using the powerful web based tool TRANSTERM (9). A shell script was applied to search for the stop codons in the 3’ UTRs. The frequency of occurrence was estimated by dividing the number of genes with additional stop codons with the total number of genes.
Gene Expression Analysis – The expression levels from aerobic growing (21), or under biofilm forming (22) E. coli cells were obtained from microarray data and analyzed with GENEVESTIGATOR (23). The genes were categorized according to their affiliation of biological processes using the PANTHER database (24).
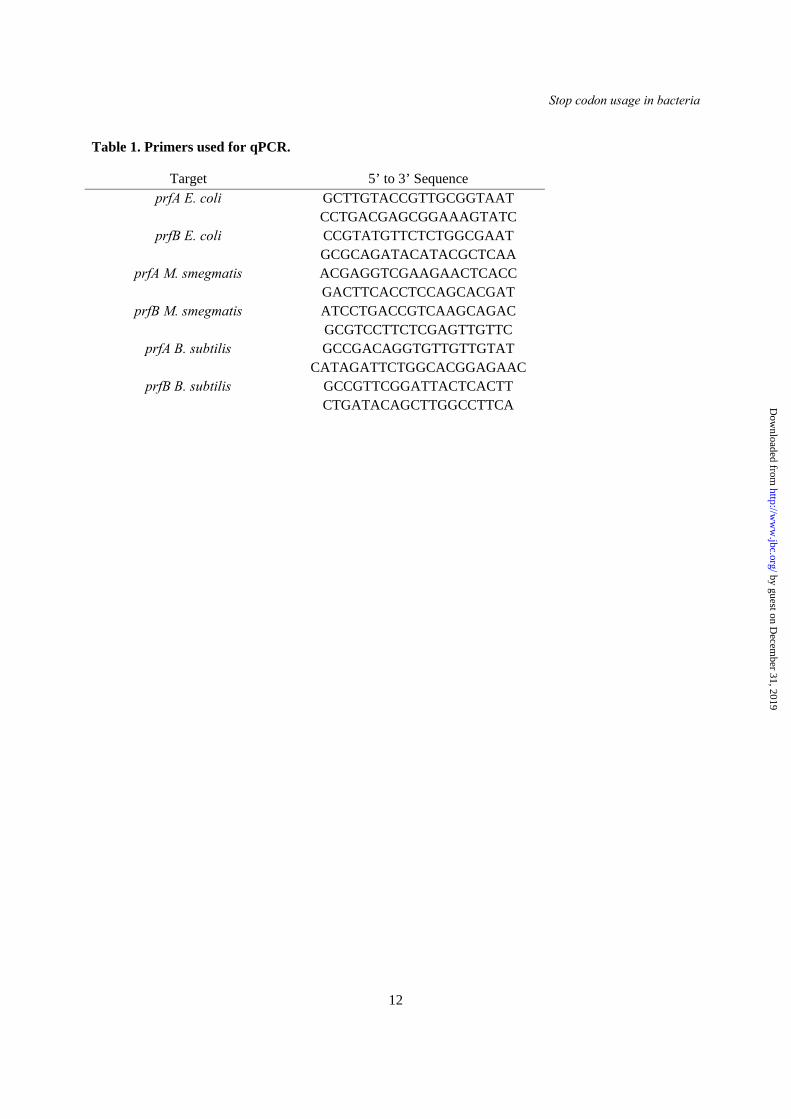
Absolute quantitative real-time PCR - Log phase cultures of E. coli BL21(DE3), M. smegmatis MC2 155 and B. subtilis 168 were harvested and growth was stopped by adding 1/5th of the starting volume of stop solution (5% water saturated phenol, 95% ethanol). The cells were pelleted by centrifugation, suspended in lysis buffer (100 mM Tris-HCl, 40 mM EDTA, 200 mM NaCl and 0.5% sodium dodecyl sulfate) and incubated for 5 min. at 65˚ C. The cell wall of M. smegmatis and B. subtilis cells were disrupted by vortexing with 0.1 mm diameter glass beads prior to incubation at 65˚C. Total RNA was extracted by using a standard phenol extraction procedure (25). Residual DNA was removed by addition of one unit of DNase I (Fermentas) twice at 37˚C at an interval of 30 min. Further, cDNA synthesis was performed using MultiScribe Reverse Transcriptase (Invitrogen) following the protocol supplied by the manufacturer. In order to estimate the in vivo concentration of prfA and prfB transcripts an absolute quantitative PCR was performed using the ABI 7300 cycler (Applied Biosystems). Primers specific to different bacteria
by guest on Decem
ber 31, 2019http://w
ww
.jbc.org/D
ownloaded from
Stop codon usage in bacteria
4
were ordered from Invitrogen (Table 1). HOT FIREPol® EvaGreen® qPCR Mix plus (includes ROX as a passive reference) from Solis BioDyne was used. qPCR cycles were set as following: initial denaturation at 95˚C for 15 min., denaturation 95˚C for 15 sec., annealing at 63˚C for 20 sec. and elongation at 72˚C for 40 sec. In total 40 cycles were performed where the signal was detected during elongation.
Quantitative Western Blot - To estimate the in vivo protein levels of the class I release factors, quantitative Western blots were performed using rabbit polyclonal antibodies against RF1 and RF2 (kind gifts from Richard Buckingham, France). Cell lysate was prepared from E. coli BL21(DE3), harvested at OD A600 = 0.1 and a total of 1 OD A600 was applied to a 12% SDS-PAGE. Known amounts of purified RF1/ RF2 (0.05 pmol to 1 pmol) were loaded in the same gel for making a standard curve. The proteins were transferred to the nitrocellulose membrane with a semi-dry method (BioRad Semi-Dry Trans-Blot Cell) using 25 mM Tris, 192 mM glycine and 20% methanol for 50 min. at 18V. The membrane was blocked with 5% non-fat milk (in wash buffer 100 mM Tris pH 7.4, 100 mM NaCl, 0.1% Tween 20). The primary antibody against RF1 or RF2 was delivered in the same 5% milk solution at a 1:10000 dilution and incubated for 40 min. at 37°C. The membrane was washed in washing buffer for 5 min. and incubated with secondary antibody (ECL Anti-rabbit IgG, Horseradish Peroxidase-linked whole antibody, GE Healthcare). The bound antibodies were detected using Western Bright Sirius (Advansta) horseradish substrate and ChemiDoc MP System (BioRad). Band intensities were quantified by the UN-SCAN-IT gel TM Version 6.1 (Silk Scientific, Orem, UT). RESULTS
Distribution of stop codons within and across different bacterial phyla - We have analyzed stop codon frequencies in 4684 bacterial genomes involving all annotated ORFs according
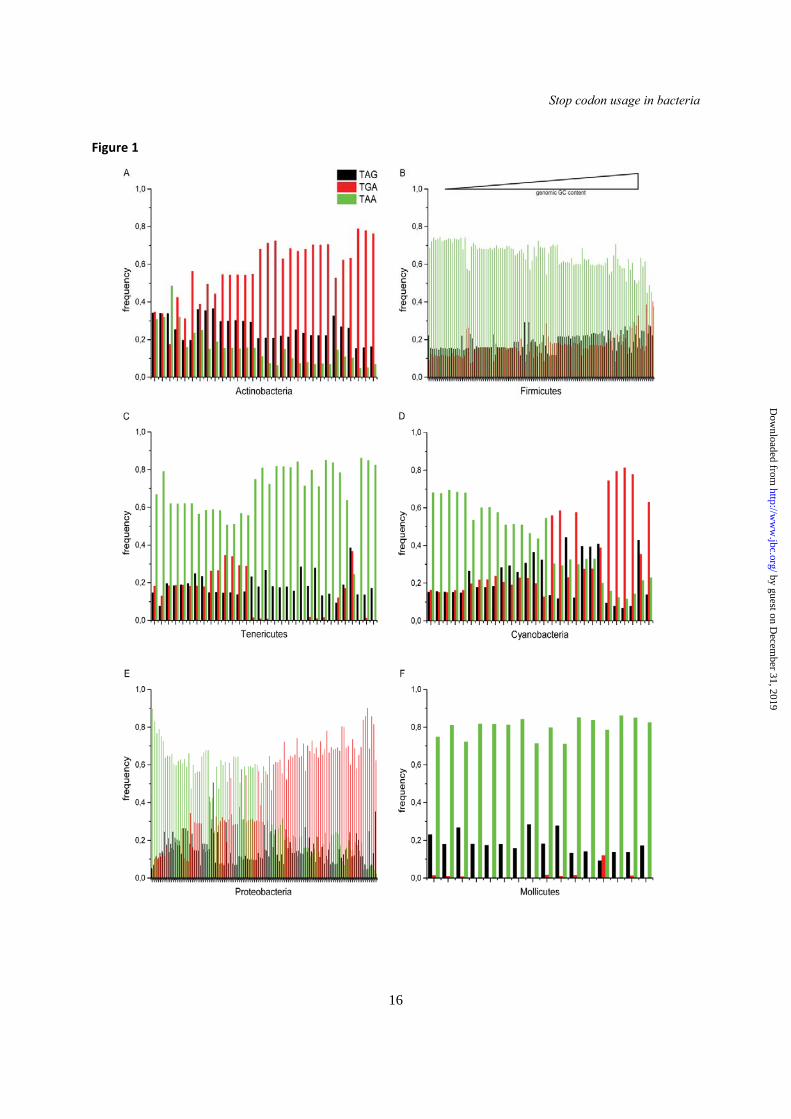
to the NCBI database using ‘stop codon counter’. The results are sorted and grouped according to bacterial phyla (for a selection of around 600 bacterial species). Since the program analyzed DNA sequences corresponding to the stop codons, the results are presented as TAA, TAG and TGA sequences. The distribution of stop codons within and across phyla varies dramatically (Fig. 1). While in Actinobacteria TGA is the predominant stop codon (Fig. 1A), in Firmicutes and Tenericutes (Fig. 1B and C) TAA is the major stop codon. In the phyla of Cyanobacteria and Proteobacteria, either TAA or TGA appears as the most frequent stop codon depending on the genomic GC content (Fig. 1D and E). However, in all these phyla TAG is the minor stop codon. One interesting exception from this feature was found in Mollecutes, which represents a small class of Proteobacteria with smallest genome size (26). In this class of bacteria the frequency of RF2 specific stop codon TGA was found close to zero (Fig. 1F). This unique feature and its consequences are discussed later.
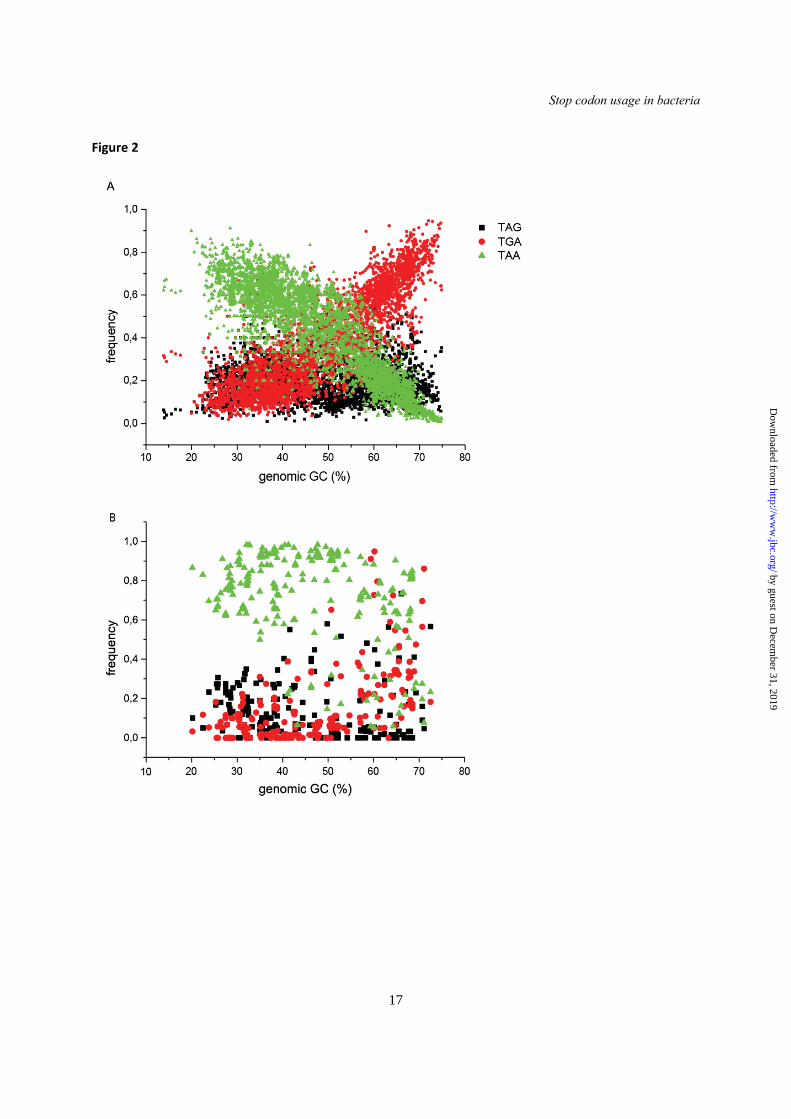
Variations in stop codon usage with genomic GC content - It has previously been suggested that genomic GC content is one of the primary driving forces behind codon usage bias (16, 18). In order to generate a global view on stop codon usage in bacteria we have plotted our results as a function of genomic GC content. The lowest GC content was 13.9% in our dataset, which belonged to Candidatus Carsonella ruddii CE isolate Thao2000 in Proteobacteria phylum. In contrast, Anaeromyxobacter dehalogenans 2CP-C within Proteobacteria phylum showed highest GC content (75%). In line with the previous reports (16, 18), the frequency of the TAA codon decreased with increase in GC content and that of the TGA codon increased in a reciprocal manner (Fig. 2A). Interestingly, the frequency of TAG codon, despite the same G content as the TGA, remained more or less constant (~20%) irrespective of the GC content (Fig. 2A). Thus, our results confirmed the pattern of stop codon
by guest on Decem
ber 31, 2019http://w
ww
.jbc.org/D
ownloaded from
Stop codon usage in bacteria
5
distribution in bacteria and called for further analysis for having TAG as the minor stop codon.
Stop codon usage in highly expressed genes – We have further analyzed stop codon usage only in the highly expressed genes. For that, we extracted the coding sequences of all ribosomal proteins and some of the translation factors (IF1, IF2, IF3, EF-Tu, EF-Ts and EF-G) from 240 bacterial genomes from our original dataset and analyzed with the ‘stop codon counter’. We looked specifically at these translation-related genes as these are usually expressed at a high level during rapid growth. Interestingly, we observed a totally different distribution of the stop codons in these genes. The universal stop codon TAA was found by far to be the most preferred stop codon and the effect of genomic GC content was much less pronounced (Fig. 2B, compare with Fig. 2A). At very high GC content (60% – 75%), some genes were found with TGA. Also, few exceptional cases where TAG was used were also seen. Overall, our analysis showed a clear bias for TAA in the highly expressed genes.
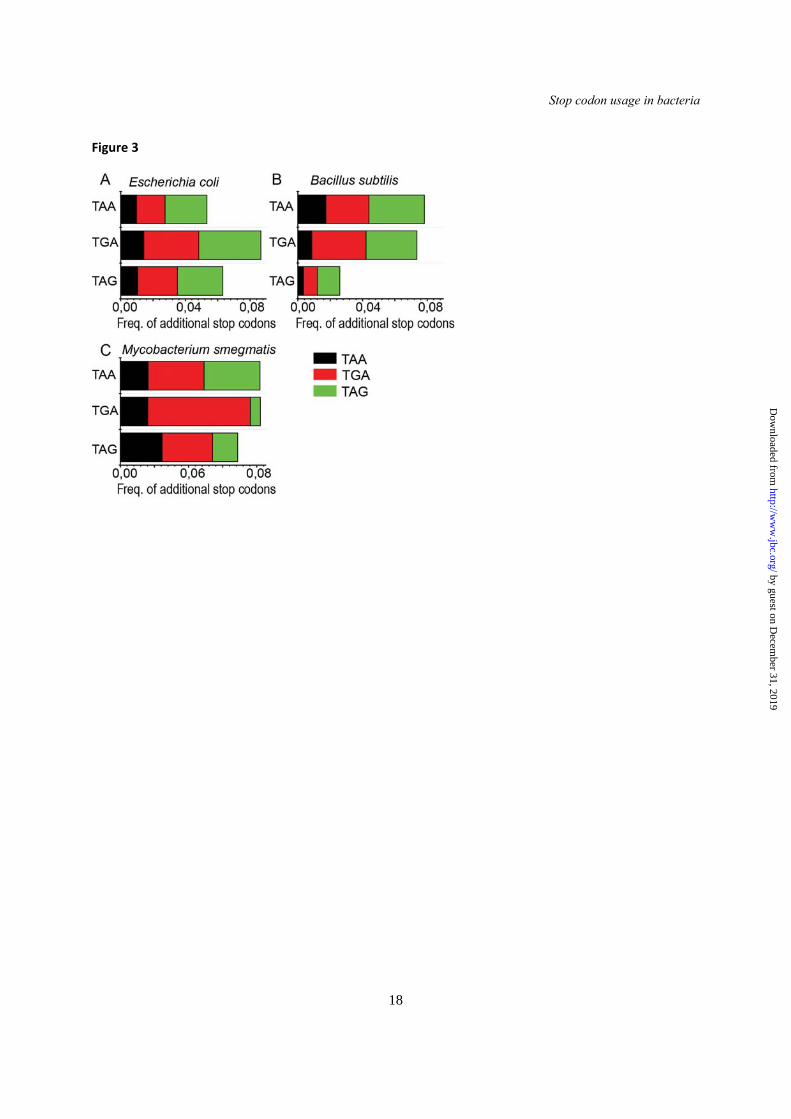
Occurrence of additional stop codons - The occurrence of additional stop codons in the downstream region from the end of the gene is often viewed as a ‘fail safe mechanism’ to ensure termination. It has been reported that in E. coli, approximately 7% of all genes possess an additional stop codon where a second stop codon is present immediately downstream of the primary stop codon (15). Since TAG is the minor stop codon we wanted to check whether there is any bias for an additional stop codon for the genes ending with TAG. For that, we analyzed the next five in-frame codons following the primary stop codon in all genes from three different bacteria E. coli K12, B. subtilis (substr. 168) and M. smegmatis (MC2 155). In agreement with earlier studies (15), we see about 8% of all genes in E. coli having a downstream stop codon (Fig. 3A). However, we observed no preference for any of the three stop codons for occurrence of additional stop codons in E. coli (Fig. 3A-C). Alternatively,
in B. subtilis and M. smegmatis, lowest occurrence of additional downstream stop codons was found with TAG as the primary stop codon. Also notable that the appearances of TAG as an additional stop codon is lower than TGA and TAA in almost all cases (Fig. 3A-C). Thus, we infer that TAG is truly a minor stop codon in all aspects.
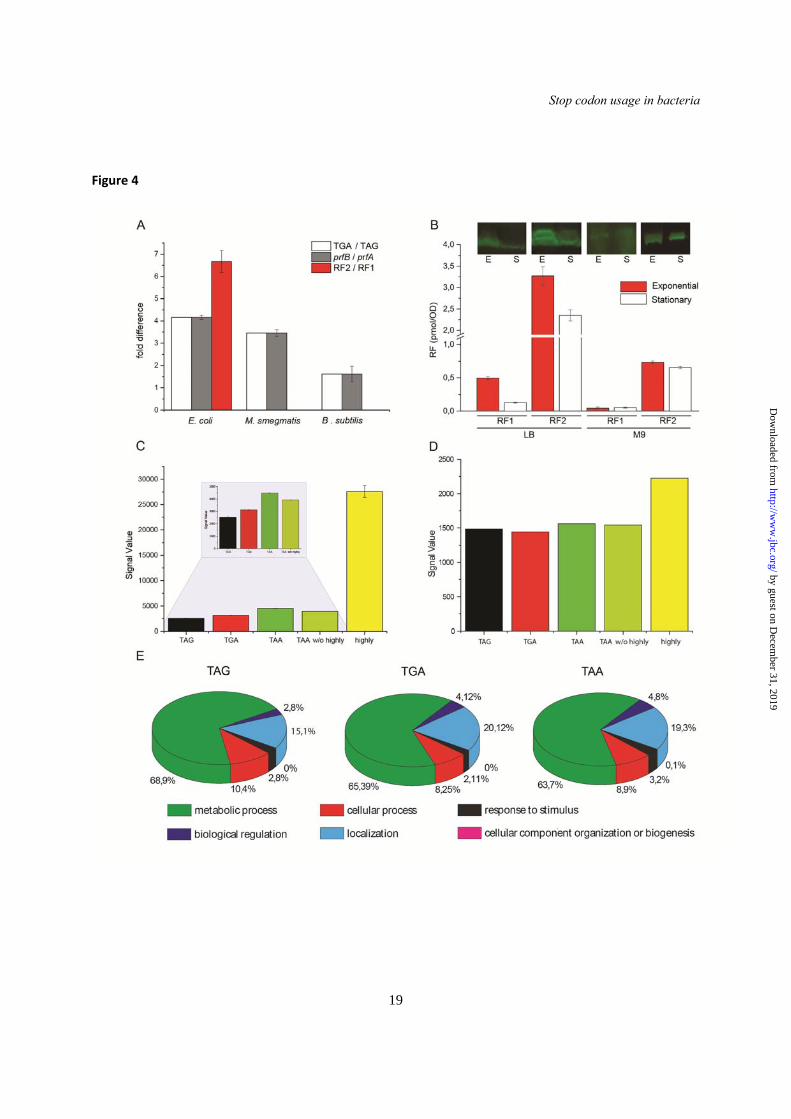
Correlation of release factor abundance and frequency of TAG and TGA codons - Since sense codon usage and tRNA abundance could be correlated in past (2, 3), we asked the same question in relation to stop codon usage and the abundance of the release factors RF1 and RF2. Since TAA could be read by both release factors, the analysis has been restricted only to TAG and TGA codons. In order to follow the relative expression of the prfA and prfB genes, absolute real-time qPCR was performed on total RNA extracted from exponentially growing cells. E. coli, M. smegmatis and B. subtilis were chosen as model organisms as they show different relative frequency of the TAG and TGA codons. In parallel, quantitative western blotting was performed to estimate the relative amount of RF1 and RF2 proteins in E. coli. For all three systems, the prfB to prfA transcript ratio matched strikingly well with the relative frequency of TGA and TAG (Fig. 4A, compare white bars with grey bars). The prfB transcript was estimated four times in excess over prfA in E. coli; three times in M. smegmatis; and 1.5 times in B. subtilis, which are highly similar to the relative frequency of TGA and TAG codons. Thus, a very good correlation was found between the frequency of TAG and TGA codons and the expression of the release factors specific to these codons. The analysis in the protein level showed RF2 expression in E. coli six to seven fold higher than RF1 (Fig. 4A, red bars), which is in good agreement with previous studies (19, 20). Thus, the RF2: RF1 ratio matched well with the ratio of TGA to TAG.
Further, we extended our analysis to quantify the amount of release factors in E. coli in different growth conditions. For that, quantitative
by guest on Decem
ber 31, 2019http://w
ww
.jbc.org/D
ownloaded from
Stop codon usage in bacteria
6
western blotting (Fig. 4B) was performed using equal amount of cells from the exponential and stationary phase, grown in rich LB media and minimal M9 media. Our result shows that RF2 is always expressed in excess over RF1 irrespective of growth condition and media. In rich LB media, both RF1 and RF2 are expressed in higher amount in the exponential phase compared to the stationary phase. In minimal M9 media, this difference is less pronounced, especially for RF1. However, the ratio of RF2 to RF1 remains more or less unchanged (RF2 in 5 – 7 times excess over RF1) in all conditions suggesting RF2 as the major release factor in E. coli (Fig. 4B).
One would likely expect that the genes terminating with TAG, and thereby limited by termination with only RF1, would be expressed at a low level. Indeed, when we looked into the expression level of the genes in fast growing E. coli, those terminating at TAG were found to be expressed at the lowest level compared to all others (Fig. 4C). This inference remained valid even after removal of the expression data of the highly expressed genes (a total of 62 genes) ending with TAA (Fig. 4C w/o highly). Only under biofilm conditions, the expression level of the genes ending at TAG, TGA and TAA was found very much equal (Fig. 4D). Interestingly, under that condition, the ratio of RF1 and RF2 in E. coli also changes to approximately 1:1 as analyzed by GENEVESTIGATOR (23) by comparing microarray data from aerobic growing (21) vs. biofilm forming E. coli (22).Thus, our analysis clearly suggests a strong correlation between actual TAG- and TGA- frequency and the expression level of RF1 and RF2.
We have further sorted the genes ending with TAG, TGA and TAA according to their biological functions, such as the genes involved in metabolic processes, biological regulation, cellular processes, localization, response to stimulus, cellular component organization or biogenesis. The aim was to check if a particular gene type is enriched with a particular stop codon. As shown in
the Fig. 4E, we don’t observe clustering of TAG / TGA / TAA to any specific class of genes. In fact, the relative distribution of various classes of genes are more or less same for all three stop codons. This implies that there is no bias for stop codon usage in the genes associated with a particular type of biological function. DISCUSSION
By analyzing more than 8 billion nucleotide sequences (8.5 million coding sequences) we have shown that stop codon usage in bacteria varies with genomic GC content in case of the codons TAA and TGA in a reciprocal manner; however the RF1 specific codon TAG remains more or less constant irrespective of the genomic GC content (Fig. 2A). This result fits well with the theoretical model where a bias has been applied on the TAG codon (16). Thus, our results confirm the earlier observation (16) (using only around 700 sequences) that in bacteria the usage of three stop codons is not selectively equivalent. Also, analysis of additional stop codon at the immediate downstream stop codon did not show preference for any of the three stop codons in those three species analyzed (Fig. 3).
Our analysis of the highly expressed genes shows that TAA is undoubtedly the major stop codon. The predominant occurrence of the major codon in the highly expressed genes is quite common for the sense codons (5). Thus, it is not surprising that the stop codon abundance follows the same pattern. Indeed, having TAA as the stop codon offers significant advantage over TAG or TGA; this was put forward in an earlier hypothesis (8–10) Most importantly, TAA can be read by both release factors, and with efficiency comparable to the release factor specific codons (13). Thus, having TAA in the highly expressed genes not only secures termination by either of the two release factors, but also ensures that the termination at TAA takes place with a high speed and accuracy.
by guest on Decem
ber 31, 2019http://w
ww
.jbc.org/D
ownloaded from
Stop codon usage in bacteria
7
While it can be explained fairly well why TAA is the major stop codon, it remains somewhat unclear why TAG is the minor stop codon. It is interesting to note that TAG is also significantly underrepresented as the tandem stop codon when TAA and TGA are the primary stop codons (15) (Fig. 3). Earlier, the low abundance of TAG was speculated to correlate with lower efficiency of termination with RF1 (14, 19, 20). When compared for kcat/KM, which is often correlated with efficiency in an enzymatic reaction, the value reported for RF1 is 6.0 x 10⁷ M-1s-1 and the same for RF2(Chromosomal) is 4.6 x 10⁷ M-1s-1, which apparently implies that RF1 has about 1.5 times higher efficiency than RF2 (27). However, the
cellular concentration of RF1 and RF2 is in the M range (19), which is significantly higher than the KM values for the cognate codons for both release factors; 8.3 nM for RF1 and 66 nM for RF2 (27). Thus, the termination efficiency in vivo is likely determined by the kcat values, which is six times higher for RF2(Chromosomal) (3.0 s-1) than RF1 (0.5 s-
1) (27).Thus, under cellular condition RF1 mediated termination is certainly less efficient than that with RF2, which might be a reason why TAG evolved as a less favored stop codon.
Another explanation for TAG being the minor codon can be brought forward from the view point of affinity and recycling of the two release factors. It has been reported that the efficiency of termination by RF1 and RF2 are strongly correlated with the affinity of the release factor for the post-termination complex after hydrolysis of the peptidyl tRNA (13). It was demonstrated that the affinity of RF1 for post-termination complex is much higher than RF2. This would immediately suggest that RF1 is more difficult to recycle than RF2, which is also evident from the measurements of the spontaneous recycling time of the two release factors under same experimental conditions (~60 sec. for RF1 and 11 sec. for RF2) (28). In line with this argument it has also been shown that RF1 is more dependent on RF3 for its recycling than RF2 (13, 28). The slow dissociation of RF1 after
peptide release can have significant consequence in a polysomic scenario, where multiple ribosomes are lined up on a translating mRNA. Furthermore, dissociation of the release factors is also important for turnover of the ribosomes, which is crucial for fast translation and hence, for fast growth. Thus, we can infer that inefficient and strictly RF3 dependent recycling of RF1 is another reason which makes TAG a non-preferred stop codon. We suggest that the low TAG frequency can be seen as a mechanism to bypass slow recycling events, which is disadvantageous from the growth perspective.
The underrepresentation of TAG codons can also be related to the higher misreading of TAG in vivo. It was demonstrated that when an essential lysine codon in the firefly luciferase gene was replaced with other codons including the stop codons, TAG but not TGA showed significantly high luciferase activity (29). This would be only possible if the protein synthesis didn’t stop at the TAG codon and was read by an aminoacyl-tRNA (possibly lysine) instead. Thus, TAG was shown to be a ‘misreading hotspot’, which can be a reason why nature has kept its frequency low.
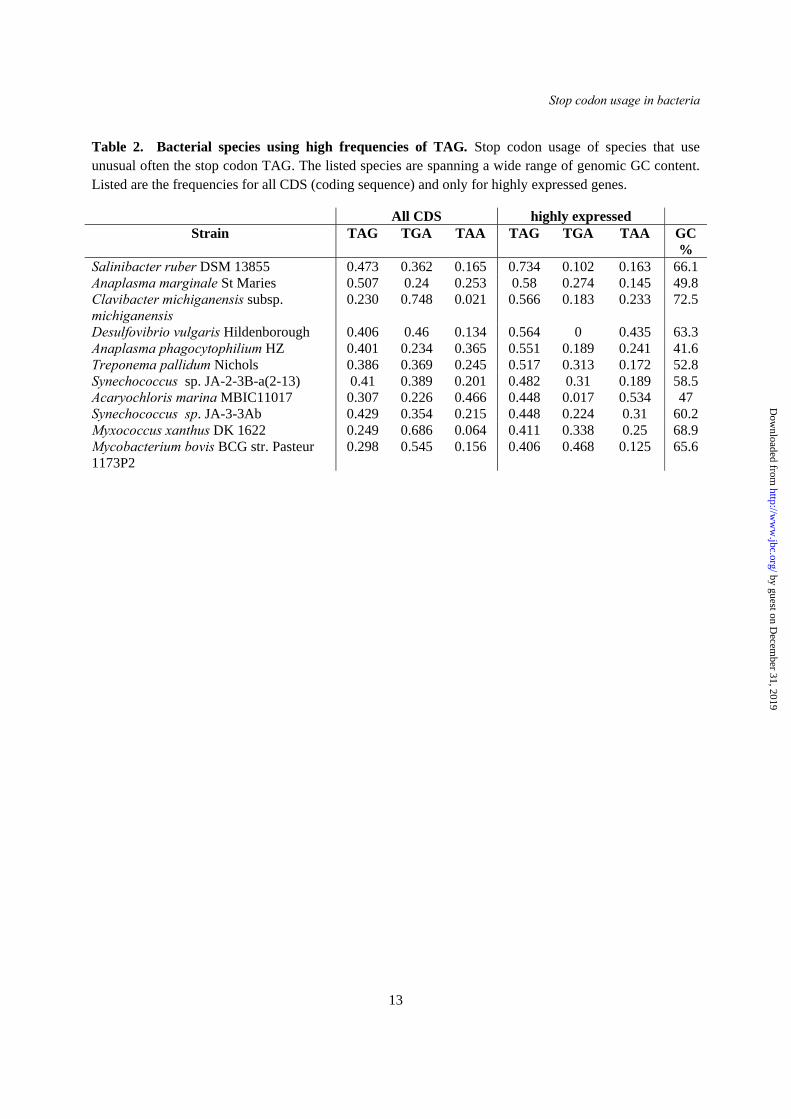
The bias of TAG being a minor codon is not valid for chloroplast (16). Recently it was postulated that plastidial as well as mitochondrial release factors underwent a complex evolution of reassignment of stop codons as well as reinvention of stop codons (30). In this work the ancestor of plastidial release factors was postulated to be of an origin of Gloeobacter violaceus and/or Thermosynechococcus elongatus. In our database we find that also G. violaceus and T. elongatus are not following the bias of using TAG at a low frequency (30 and 44% of TAG frequency, respectively). This may imply that not only the origin of the plastidial factors but also the frequency of the stop codons have the same origin. We are aware of a few exceptions of bacterial strains that have a high frequency of TAG in their coding sequence (listed in Table 2). Highly expressed genes in these bacteria also end
by guest on Decem
ber 31, 2019http://w
ww
.jbc.org/D
ownloaded from
Stop codon usage in bacteria
8
frequently with TAG, which are seen in Fig. 2B. Those bacterial genomes may display examples of organisms on the verge of reassigning TGA from stop to sense codon (31) in order to expand their genetic code. This idea is supported by a very recent article showing that no reassignment of TAG is found in bacteria (32), while reassignment of TGA (Trp in Mycoplasma) and also TAA (Tyr in planario) has been reported earlier (33).
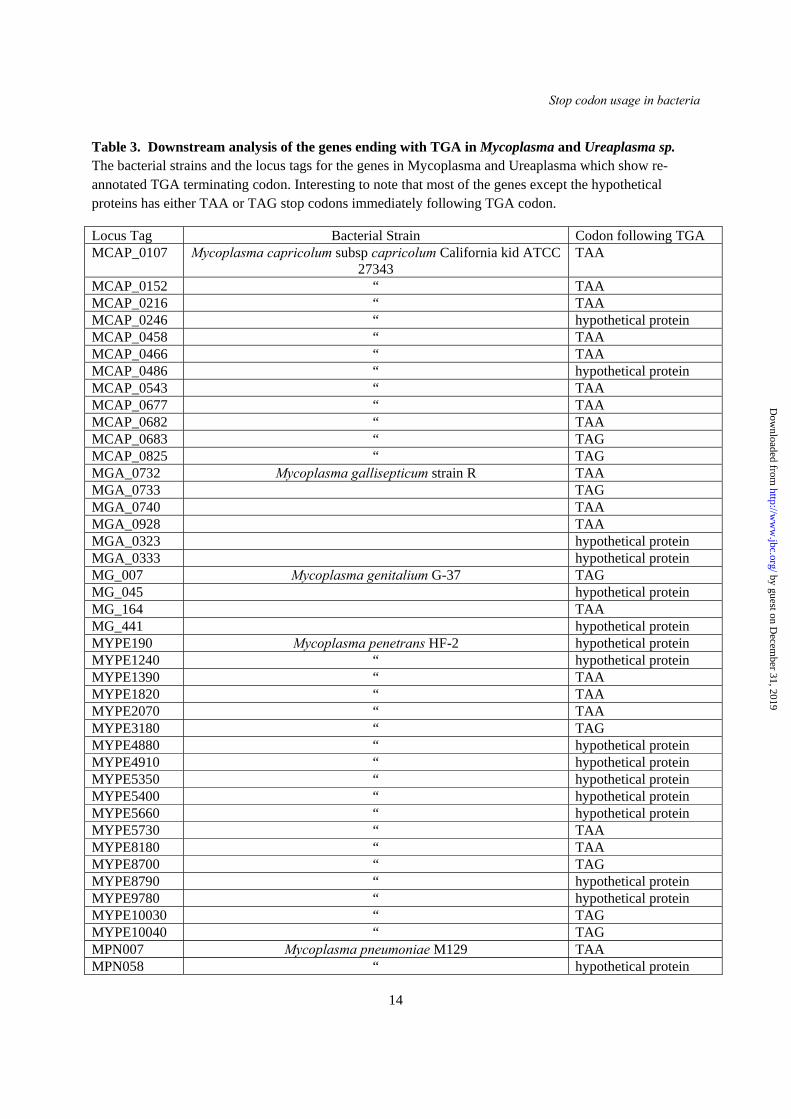
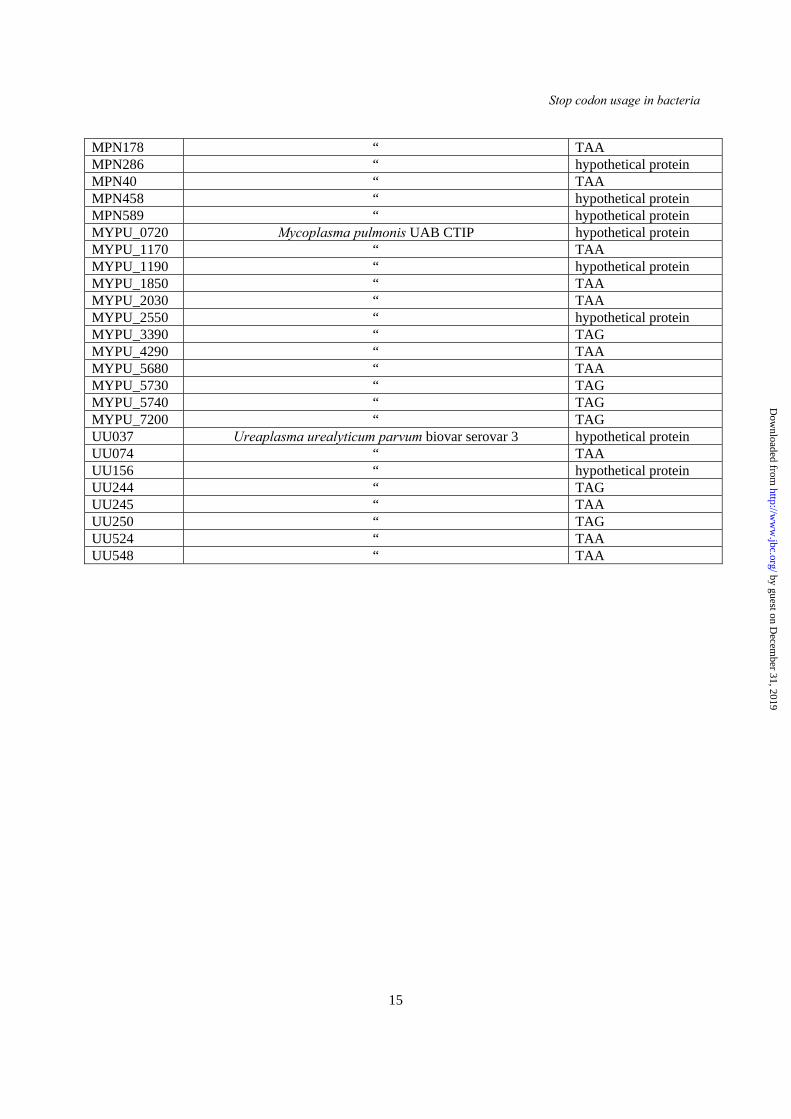
Our analysis of stop codon frequency draws special attention on Mollicutes, which are a class of Proteobacteria that show frequency of TGA stop codons zero or close to zero (Fig. 1F). This would imply that these bacteria do not contain RF2 or alternatively, RF2 recognizes some other codon. When searched in literature, we came across a previous report that demonstrated that mycoplasma, one of the representatives of this class commonly lack the gene for release factor 2; prfB (26). Therefore, we checked the occurrence of prfB gene in this class. It turns out that almost all Mollicutes, except Phytoplasma asteris, commonly called Onion Yellows lacks the prfB gene. Thus, for this group of bacteria, the lack of TGA codon can be correlated quite well with the absence of RF2. The small percentage of TGA observed in these genomes occurred mostly in hypothetical genes and in some ribosomal protein genes (Table 3). Interestingly, it was found that TGA codes for tryptophan in these bacteria instead of ‘stop’ (34). Moreover, in all occasions, the TGA codon is found to be followed by an immediate downstream TAA or TAG stop codon (Table 3). This shows that still wrong codon annotations can be found in available databases. It is interesting to note that
prfC, the gene for the class II release factor RF3 is also frequently missing in these bacteria (35). However, no correlation of the lack of RF3 and that of RF2 could be seen.
In this study, we have estimated expression level of RF1 and RF2 in three bacteria in parallel to stop codon frequencies using genome sequences. Our analysis shows a strong correlation between the frequency of TAG and TGA codons and the abundance of RF1 and RF2 in the cell. However, the actual frequency of the stop codons should depend on the expression level of the translating mRNAs carrying a specific stop codon, which would also vary under different physiological conditions. Our analysis using gene expression microarray data showed that the genes ending with TAG are expressed at the lowest level under fast growing condition (Fig. 4C, D), when RF1 is also expressed at a significantly low level than RF2. In contrast, under biofilm forming condition, the expression level of the genes ending with TAG or TGA becomes similar, when RF1 and RF2 level also changes to 1:1. Thus, we conclude that the relative abundance of RF1 is tightly correlated with the frequency of actually expressed TAG codons; the cellular factors involved in the regulation of the two remains to be seen. Lastly, the growth condition dependent fluctuation of the codon usage is not special only for the stop codons, but must be applicable to all other codons. Thus, our finding from stop codon usage calls for new estimation and mathematical modelling of codon usage in bacteria, taking mRNA expression levels into account.
ACKNOWLEDGEMENTS We thank Richard Buckingham and Valérie Heurgué-Hamard for providing antibodies against E. coli RF1 and RF2 protein. We also thank Måns Ehrenberg and Siv Andersson for valuable discussion during revision of the manuscript.
by guest on Decem
ber 31, 2019http://w
ww
.jbc.org/D
ownloaded from
Stop codon usage in bacteria
9
REFERENCES
1. Nakamura, Y., Gojobori, T., and Ikemura, T. (2000) Codon usage tabulated from international DNA sequence databases: status for the year 2000. Nucleic Acids Res. 28, 292
2. Plotkin, J. B., and Kudla, G. (2011) Synonymous but not the same: the causes and consequences of codon bias. Nat Rev Genet 12, 32–42
3. Dong, H., Nilsson, L., and Kurland, C. G. (1996) Co-variation of tRNA Abundance and Codon Usage in Escherichia coli at Different Growth Rates. J. Mol. Biol. 260, 649–663
4. Gilchrist, M. A. (2007) Combining Models of Protein Translation and Population Genetics to Predict Protein Production Rates from Codon Usage Patterns. Mol. Biol. Evol. 24, 2362–2372
5. Ikemura, T. (1981) Correlation between the abundance of Escherichia coli transfer RNAs and the occurrence of the respective codons in its protein genes. J. Mol. Biol. 146, 1–21
6. Zhang, G., and Ignatova, Z. (2009) Generic Algorithm to Predict the Speed of Translational Elongation: Implications for Protein Biogenesis. PLoS ONE 4, e5036
7. Scolnick, E., Tompkins, R., Caskey, T., and Nirenberg, M. (1968) Release factors differing in specificity for terminator codons. Proc Natl Acad Sci USA 61, 768 – 774
8. Sharp, P. M., and Bulmer, M. (1988) Selective differences among translation termination codons. Gene 63, 141–5
9. Brown, C. M., Dalphin, M. E., Stockwell, P. A., and Tate, W. P. (1993) The translational termination signal database. Nucleic Acids Res. 21, 3119–3123
10. Bonetti, B., Fu, L., Moon, J., and Bedwell, D. M. (1995) The Efficiency of Translation Termination is Determined by a Synergistic Interplay Between Upstream and Downstream Sequences inSaccharomyces cerevisiae. J. Mol. Biol. 251, 334–345
11. Sun, J., Chen, M., Xu, J., and Luo, J. (2005) Relationships Among Stop Codon Usage Bias, Its Context, Isochores, and Gene Expression Level in Various Eukaryotes. J. Mol. Evol. 61, 437–444
12. Cridge, A. G., Major, L. L., Mahagaonkar, A. A., Poole, E. S., Isaksson, L. A., and Tate, W. P. (2006) Comparison of characteristics and function of translation termination signals between and within prokaryotic and eukaryotic organisms. Nucleic Acids Res. 34, 1959–1973
13. Pavlov, M. Y., Freistroffer, D. V., Dincbas, V., MacDougall, J., Buckingham, R. H., and Ehrenberg, M. (1998) A direct estimation of the context effect on the efficiency of termination. J. Mol. Biol. 284, 579–590
14. Poole, E. S., Brown, C. M., and Tate, W. P. (1995) The identity of the base following the stop codon determines the efficiency of in vivo translation termination in Escherichia coli. Embo J. 14, 151–158
15. Major, L. L., Edgar, T. D., Yee Yip, P., Isaksson, L. A., and Tate, W. P. (2002) Tandem termination signals: myth or reality? FEBS Lett. 514, 84–89
16. Povolotskaya, I., Kondrashov, F., Lleda, A., and Vlasov, P. (2012) Stop codons in bacteria are not selectively equivalent. Biol. Direct 7, 30
17. Lind, C., Sund, J., and Åqvist, J. (2013) Codon-reading specificities of mitochondrial release factors and translation termination at non-standard stop codons. Nat Commun 4
18. Santos, M. A. S., Moura, G., Massey, S. E., and Tuite, M. F. (2004) Driving change: The evolution of alternative genetic codes. Trends Genet. 20, 95–102
19. Adamski, F. M., McCaughan, K. K., Jørgensen, F., Kurland, C. G., and Tate, W. P. (1994) The Concentration of Polypeptide Chain Release Factors 1 and 2 at Different Growth Rates of Escherichia coli. J. Mol. Biol. 238, 302–308
20. Mora, L., Heurgué-Hamard, V., de Zamaroczy, M., Kervestin, S., and Buckingham, R. H. (2007) Methylation of Bacterial Release Factors RF1 and RF2 Is Required for Normal Translation Termination in Vivo. J. Biol. Chem. 282, 35638–35645
21. Covert, M. W., Knight, E. M., Reed, J. L., Herrgard, M. J., and Palsson, B. O. (2004) Integrating high-throughput and computational data elucidates bacterial networks. Nature 429, 92–96
22. Yang, X., Ma, Q., and Wood, T. K. (2008) The R1 Conjugative Plasmid Increases Escherichia coli Biofilm Formation through an Envelope Stress Response. Appl. Environ. Microbiol. 74, 2690–2699
by guest on Decem
ber 31, 2019http://w
ww
.jbc.org/D
ownloaded from
Stop codon usage in bacteria
10
23. Hruz, T., Laule, O., Szabo, G., Wessendorp, F., Bleuler, S., Oertle, L., Widmayer, P., Gruissem, W., and Zimmermann, P. (2008) Genevestigator V3: A Reference Expression Database for the Meta-Analysis of Transcriptomes. Adv. Bioinforma. 2008, 5
24. Mi, H., Muruganujan, A., and Thomas, P. D. (2013) PANTHER in 2013: modeling the evolution of gene function, and other gene attributes, in the context of phylogenetic trees. Nucleic Acids Res. 41, D377–D386
25. Sambrook, J., Fritsch, E. F., and Maniatis, T. (1989) Molecular Cloning: A Laboratory Manual. 26. Fraser, C. M., Gocayne, J. D., White, O., Adams, M. D., Clayton, R. A., Fleischmann, R. D., Bult,
C. J., Kerlavage, A. R., Sutton, G., Kelley, J. M., Fritchman, J. L., Weidman, J. F., Small, K. V., Sandusky, M., Fuhrmann, J., Nguyen, D., Utterback, T. R., Saudek, D. M., Phillips, C. A., Merrick, J. M., Tomb, J.-F., Dougherty, B. A., Bott, K. F., Hu, P.-C., Lucier, T. S., Peterson, S. N., Smith, H. O., Hutchison, C. A., and Venter, J. C. (1995) The Minimal Gene Complement of Mycoplasma genitalium. Science 270, 397–404
27. Freistroffer, D. V., Kwiatkowski, M., Buckingham, R. H., and Ehrenberg, M. (2000) The accuracy of codon recognition by polypeptide release factors. Proc Natl Acad Sci USA 97, 2046 – 2051
28. Gao, H., Zhou, Z., Rawat, U., Huang, C., Bouakaz, L., Wang, C., Cheng, Z., Liu, Y., Zavialov, A., Gursky, R., Sanyal, S., Ehrenberg, M., Frank, J., and Song, H. (2007) RF3 Induces Ribosomal Conformational Changes Responsible for Dissociation of Class I Release Factors. Cell 129, 929–941
29. Kramer, E. B., and Farabaugh, P. J. (2007) The frequency of translational misreading errors in E. coli is largely determined by tRNA competition. RNA 13, 87–96
30. Duarte, I., Nabuurs, S. B., Magno, R., and Huynen, M. (2012) Evolution and Diversification of the Organellar Release Factor Family. Mol. Biol. Evol. 29, 3497–3512
31. Tate, W. P., Mansell, J. B., Mannering, S. A., Irvine, J. H., Major, L. L., and Wilson, D. N. (1999) UGA: a dual signal for “stop” and for recoding in protein synthesis. Biochem. Biokhimii͡ a 64, 1342–1353
32. Ivanova, N. N., Schwientek, P., Tripp, H. J., Rinke, C., Pati, A., Huntemann, M., Visel, A., Woyke, T., Kyrpides, N. C., and Rubin, E. M. (2014) Stop codon reassignments in the wild. Science 344, 909–913
33. Osawa, S., Jukes, T. H., Watanabe, K., and Muto, A. (1992) Recent evidence for evolution of the genetic code. Microbiol. Rev. 56, 229–264
34. Inamine, J. M., Ho, K. C., Loechel, S., and Hu, P. C. (1990) Evidence that UGA is read as a tryptophan codon rather than as a stop codon by Mycoplasma pneumoniae, Mycoplasma genitalium, and Mycoplasma gallisepticum. J Bacteriol 172, 504–506
35. Margus, T., Remm, M., and Tenson, T. (2007) Phylogenetic distribution of translational GTPases in bacteria. BMC Genomics 8, 15
by guest on Decem
ber 31, 2019http://w
ww
.jbc.org/D
ownloaded from
Stop codon usage in bacteria
11
FOOTNOTES This work was supported by the research grants to S.S. from the Swedish Research Council (2010-2619 [M], 2011-6088 [NT], and 2008-6593 [Linnaeus grant to Uppsala RNA Research Center]); Carl-Tryggers Foundation (CTS 09:341 and 10:330); Wenner-Gren Foundation; and Knut and Alice Wallenberg Foundation (KAW 2011.0081 to RiboCORE). G.K. is supported by a scholarship from the Sven and Lilly Lawski Foundation for Scientific Research.
FIGURE LEGENDS Figure 1. Stop codon distribution in different bacterial phyla. The frequencies of three stop codons TAA (green), TAG (black) and TGA (red) in different bacteria classified and grouped in different phyla (A-E) and within the class of Mollicutes (F), plotted as a function of genomic GC content.
Figure 2. Distribution of the three canonical stop codons in bacteria. A. The frequency of the three stop codons estimated involving all ORFs in 4684 bacterial sequences (chromosomes and plasmids) plotted as a function of genomic GC content. B. Distribution of stop codon frequency in highly expressed genes (comprised of ribosomal proteins and translation factor genes) of 220 randomly selected bacteria.
Figure 3. Occurrence of downstream additional stop codons. The occurrence of additional stop codons within 15 nucleotides downstream from the primary stop codons TAA, TAG and TGA. All ORFs in Escherichia coli (A), Bacillus subtilis (B) and Mycobacterium smegmatis (C) are analyzed. The horizontal bars represent percentage of the total genes with additional stop codons TAG (black), TGA (red) and TAA (green).
Figure 4. Expression analysis and correlation of release factors and stop codon frequency. A. Correlation of the stop codon frequency (TGA / TAG) with mRNA transcripts determined with q-PCR (prfB / prfA) and the amount of the release factor proteins (RF2 / RF1) estimated with quantitative Western blot using antibodies against E. coli RF1 and RF2. B. Western blotting based determination of the amount of RFs in E. coli growing exponentially (E) and in stationary (S) phase in rich (LB) and minimal (M9) media. The bars represent the amount of the release factors in pmol estimated from the blots (presented above) done in quadruplicates. C. E. coli genes ending with TAG/TGA/TAA are grouped and the mean expression level under fast growing condition is plotted according to the linear expression value of the microarray. TAA w/o are the genes ending with TAA without the highly expressed genes (yellow). D. Same as C, but shows expression data under biofilm forming conditions. E. Classification of the genes ending with TAG / TGA / TAA according to the biological functions.
by guest on Decem
ber 31, 2019http://w
ww
.jbc.org/D
ownloaded from
Stop codon usage in bacteria
12
Table 1. Primers used for qPCR.
Target 5’ to 3’ Sequence prfA E. coli GCTTGTACCGTTGCGGTAAT
CCTGACGAGCGGAAAGTATC prfB E. coli CCGTATGTTCTCTGGCGAAT
GCGCAGATACATACGCTCAA prfA M. smegmatis ACGAGGTCGAAGAACTCACC
GACTTCACCTCCAGCACGAT prfB M. smegmatis ATCCTGACCGTCAAGCAGAC
GCGTCCTTCTCGAGTTGTTC prfA B. subtilis GCCGACAGGTGTTGTTGTAT
CATAGATTCTGGCACGGAGAAC prfB B. subtilis GCCGTTCGGATTACTCACTT
CTGATACAGCTTGGCCTTCA
by guest on Decem
ber 31, 2019http://w
ww
.jbc.org/D
ownloaded from
Stop codon usage in bacteria
13
Table 2. Bacterial species using high frequencies of TAG. Stop codon usage of species that use unusual often the stop codon TAG. The listed species are spanning a wide range of genomic GC content. Listed are the frequencies for all CDS (coding sequence) and only for highly expressed genes.
All CDS highly expressed Strain TAG TGA TAA TAG TGA TAA GC
% Salinibacter ruber DSM 13855 0.473 0.362 0.165 0.734 0.102 0.163 66.1 Anaplasma marginale St Maries 0.507 0.24 0.253 0.58 0.274 0.145 49.8 Clavibacter michiganensis subsp. michiganensis
0.230 0.748 0.021 0.566 0.183 0.233 72.5
Desulfovibrio vulgaris Hildenborough 0.406 0.46 0.134 0.564 0 0.435 63.3 Anaplasma phagocytophilium HZ 0.401 0.234 0.365 0.551 0.189 0.241 41.6 Treponema pallidum Nichols 0.386 0.369 0.245 0.517 0.313 0.172 52.8 Synechococcus sp. JA-2-3B-a(2-13) 0.41 0.389 0.201 0.482 0.31 0.189 58.5 Acaryochloris marina MBIC11017 0.307 0.226 0.466 0.448 0.017 0.534 47 Synechococcus sp. JA-3-3Ab 0.429 0.354 0.215 0.448 0.224 0.31 60.2 Myxococcus xanthus DK 1622 0.249 0.686 0.064 0.411 0.338 0.25 68.9 Mycobacterium bovis BCG str. Pasteur 1173P2
0.298 0.545 0.156 0.406 0.468 0.125 65.6
by guest on Decem
ber 31, 2019http://w
ww
.jbc.org/D
ownloaded from
Stop codon usage in bacteria
14
Table 3. Downstream analysis of the genes ending with TGA in Mycoplasma and Ureaplasma sp. The bacterial strains and the locus tags for the genes in Mycoplasma and Ureaplasma which show re-annotated TGA terminating codon. Interesting to note that most of the genes except the hypothetical proteins has either TAA or TAG stop codons immediately following TGA codon.
Locus Tag Bacterial Strain Codon following TGA MCAP_0107 Mycoplasma capricolum subsp capricolum California kid ATCC
27343 TAA
MCAP_0152 “ TAA MCAP_0216 “ TAA MCAP_0246 “ hypothetical protein MCAP_0458 “ TAA MCAP_0466 “ TAA MCAP_0486 “ hypothetical protein MCAP_0543 “ TAA MCAP_0677 “ TAA MCAP_0682 “ TAA MCAP_0683 “ TAG MCAP_0825 “ TAG MGA_0732 Mycoplasma gallisepticum strain R TAA MGA_0733 TAG MGA_0740 TAA MGA_0928 TAA MGA_0323 hypothetical protein MGA_0333 hypothetical protein MG_007 Mycoplasma genitalium G-37 TAG MG_045 hypothetical protein MG_164 TAA MG_441 hypothetical protein MYPE190 Mycoplasma penetrans HF-2 hypothetical protein MYPE1240 “ hypothetical protein MYPE1390 “ TAA MYPE1820 “ TAA MYPE2070 “ TAA MYPE3180 “ TAG MYPE4880 “ hypothetical protein MYPE4910 “ hypothetical protein MYPE5350 “ hypothetical protein MYPE5400 “ hypothetical protein MYPE5660 “ hypothetical protein MYPE5730 “ TAA MYPE8180 “ TAA MYPE8700 “ TAG MYPE8790 “ hypothetical protein MYPE9780 “ hypothetical protein MYPE10030 “ TAG MYPE10040 “ TAG MPN007 Mycoplasma pneumoniae M129 TAA MPN058 “ hypothetical protein
by guest on Decem
ber 31, 2019http://w
ww
.jbc.org/D
ownloaded from
Stop codon usage in bacteria
15
MPN178 “ TAA MPN286 “ hypothetical protein MPN40 “ TAA MPN458 “ hypothetical protein MPN589 “ hypothetical protein MYPU_0720 Mycoplasma pulmonis UAB CTIP hypothetical protein MYPU_1170 “ TAA MYPU_1190 “ hypothetical protein MYPU_1850 “ TAA MYPU_2030 “ TAA MYPU_2550 “ hypothetical protein MYPU_3390 “ TAG MYPU_4290 “ TAA MYPU_5680 “ TAA MYPU_5730 “ TAG MYPU_5740 “ TAG MYPU_7200 “ TAG UU037 Ureaplasma urealyticum parvum biovar serovar 3 hypothetical protein UU074 “ TAA UU156 “ hypothetical protein UU244 “ TAG UU245 “ TAA UU250 “ TAG UU524 “ TAA UU548 “ TAA
by guest on Decem
ber 31, 2019http://w
ww
.jbc.org/D
ownloaded from
Stop codon usage in bacteria
16
Figure 1
by guest on Decem
ber 31, 2019http://w
ww
.jbc.org/D
ownloaded from
Stop codon usage in bacteria
17
Figure 2
by guest on Decem
ber 31, 2019http://w
ww
.jbc.org/D
ownloaded from
Stop codon usage in bacteria
18
Figure 3
by guest on Decem
ber 31, 2019http://w
ww
.jbc.org/D
ownloaded from
Stop codon usage in bacteria
19
Figure 4
by guest on Decem
ber 31, 2019http://w
ww
.jbc.org/D
ownloaded from
Gürkan Korkmaz, Mikael Holm, Tobias Wiens and Suparna SanyalRelease Factor Abundance
Comprehensive Analysis of Stop Codon Usage in Bacteria and its Correlation with
published online September 12, 2014J. Biol. Chem.
10.1074/jbc.M114.606632Access the most updated version of this article at doi:
Alerts:
When a correction for this article is posted•
When this article is cited•
to choose from all of JBC's e-mail alertsClick here
by guest on Decem
ber 31, 2019http://w
ww
.jbc.org/D
ownloaded from