Embed Size (px)
Citation preview
Research ArticleCloud Monitoring for Solar Plants with Support Vector MachineBased Fault Detection System
Hong-Chan Chang,1 Shang-Chih Lin,1 Cheng-Chien Kuo,2 and Hao-Ping Yu1
1 Department of Electrical Engineering, National Taiwan University of Science and Technology, No. 43, Section 4,Keelung Road, Taipei 10607, Taiwan
2Department of Electrical Engineering, Saint John’s University, No. 499, Section 4, TamKing Road, Tamsui, Taipei 25135, Taiwan
Correspondence should be addressed to Cheng-Chien Kuo; [email protected]
Received 28 February 2014; Accepted 4 April 2014; Published 3 July 2014
Academic Editor: Her-Terng Yau
Copyright © 2014 Hong-Chan Chang et al. This is an open access article distributed under the Creative Commons AttributionLicense, which permits unrestricted use, distribution, and reproduction in any medium, provided the original work is properlycited.
This study endeavors to develop a cloud monitoring system for solar plants. This system incorporates numerous subsystems, suchas a geographic information system, an instantaneous power-consumption information system, a reporting system, and a failurediagnosis system. Visual C# was integrated with ASP.NET and SQL technologies for the proposed monitoring system. A userinterface for database management system was developed to enable users to access solar power information and managementsystems. In addition, by using peer-to-peer (P2P) streaming technology and audio/video encoding/decoding technology, real-timevideo data can be transmitted to the client end, providing instantaneous and direct information. Regarding smart failure diagnosis,the proposed system employs the support vector machine (SVM) theory to train failure mathematical models.The solar power dataare provided to the SVM for analysis in order to determine the failure types and subsequently eliminate failures at an early stage.The cloud energy-management platform developed in this study not only enhances the management and maintenance efficiencyof solar power plants but also increases the market competitiveness of solar power generation and renewable energy.
1. Introduction
Green energy is universally regarded as an alternative energyfor the future. The production and consumption of greenenergy slightly pollute or do not pollute ecological envi-ronments, and it will not be exhausted. Therefore, variousadvanced countries pay increasing attention to green energy,and Taiwan continually pushes green energy plans in accor-dance with the global trend. Therefore, the green energy ofsolar power generation and wind electric power generationwill be extensively used in the future. This paper is aimed atthis future trend and proposes a solar energy monitoring andfault diagnosis system based on the cloud structure, which iscombined with power consumption information to providea professional and complete electrical energy managementservice.
This electric energy management platform architectureapproximately consists of three basic structures, includingdata collection, data storage, and data application. First,
for the data collection layer, this electric energy manage-ment platform will be equipped with an environmentalmonitoring system, a power monitoring system for solarpower generation, GPS, and communication system. Themost important information for the environmental monitor-ing system includes temperature, humidity, and luminance.Therefore, the environmental monitoring system requirescorresponding sensors to extract relevant information. Forthe power monitoring system of solar power generation, thesensors must be mounted on the solar inverter in order toextract the power generation data of solar panels. Each of theaforesaid subsystems consists of numerous sensors and com-munication equipment. The data measured by all sensors aretransmitted by the communication system to the relay station,where the data received by the relay station are uploaded vianetwork to the data storage center. The data storage centeruses database technology to store the data collected by eachsubsystem. Professional software technology is required fordata storage in order to maintain data acquisition speed
Hindawi Publishing CorporationMathematical Problems in EngineeringVolume 2014, Article ID 564517, 10 pageshttp://dx.doi.org/10.1155/2014/564517
2 Mathematical Problems in Engineering
D+ D+D−
D+D
−
D−
D+ D+D− D−
3S 3L 2S 2L 1S 1L R S T N
PA3000ID: 1 TC
P/IP
Internet
Internet
AP
TCP/IP
N
R
S
T
LoadPA3000ID: n
D+ D+D− D−
D+ D+D− D−
D+ D+D− D−
PA3000ID: 2
PA3000ID: 3
PA3000ID: 4
· · ·
· · ·
·
·
·
· · ·
·
·
·
Figure 1: Hardware architecture.
and security. Finally, this electric energy management systemuses software technology to convert the data detected byvarious equipment into useful information, thus providingelectric energy management services of failure diagnosis andequipment operating state for solar power plants.
2. Cloud Structure-Based Monitoring System
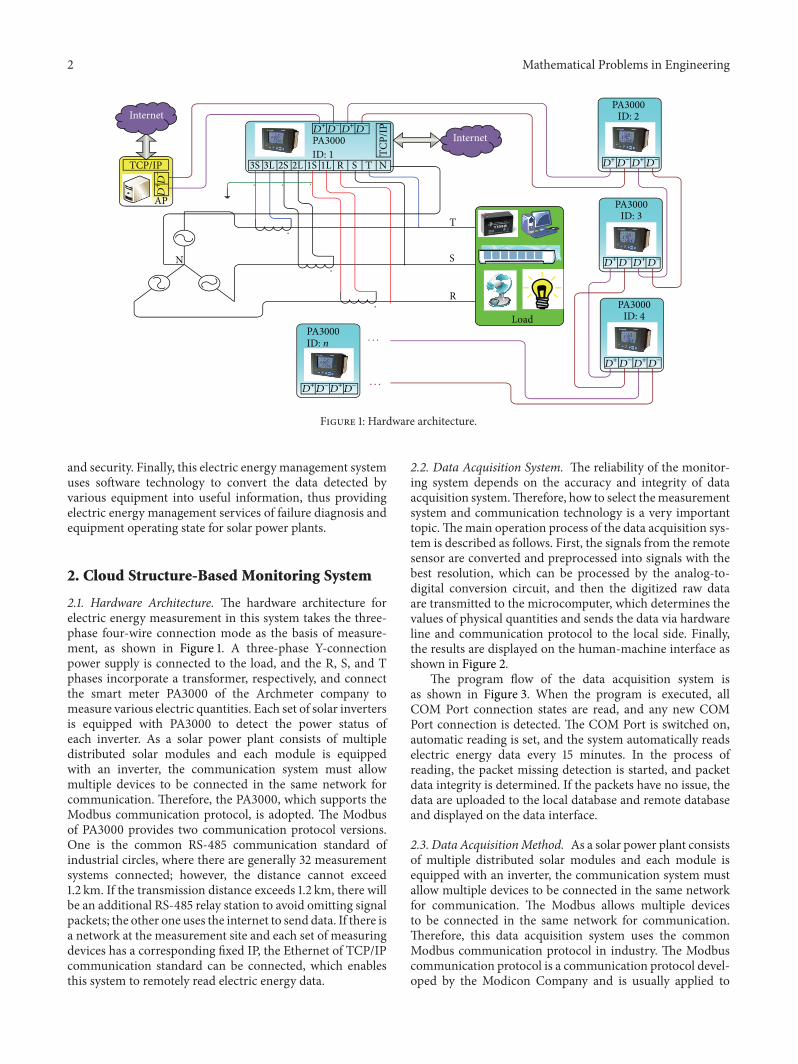
2.1. Hardware Architecture. The hardware architecture forelectric energy measurement in this system takes the three-phase four-wire connection mode as the basis of measure-ment, as shown in Figure 1. A three-phase Y-connectionpower supply is connected to the load, and the R, S, and Tphases incorporate a transformer, respectively, and connectthe smart meter PA3000 of the Archmeter company tomeasure various electric quantities. Each set of solar invertersis equipped with PA3000 to detect the power status ofeach inverter. As a solar power plant consists of multipledistributed solar modules and each module is equippedwith an inverter, the communication system must allowmultiple devices to be connected in the same network forcommunication. Therefore, the PA3000, which supports theModbus communication protocol, is adopted. The Modbusof PA3000 provides two communication protocol versions.One is the common RS-485 communication standard ofindustrial circles, where there are generally 32 measurementsystems connected; however, the distance cannot exceed1.2 km. If the transmission distance exceeds 1.2 km, there willbe an additional RS-485 relay station to avoid omitting signalpackets; the other one uses the internet to send data. If there isa network at the measurement site and each set of measuringdevices has a corresponding fixed IP, the Ethernet of TCP/IPcommunication standard can be connected, which enablesthis system to remotely read electric energy data.
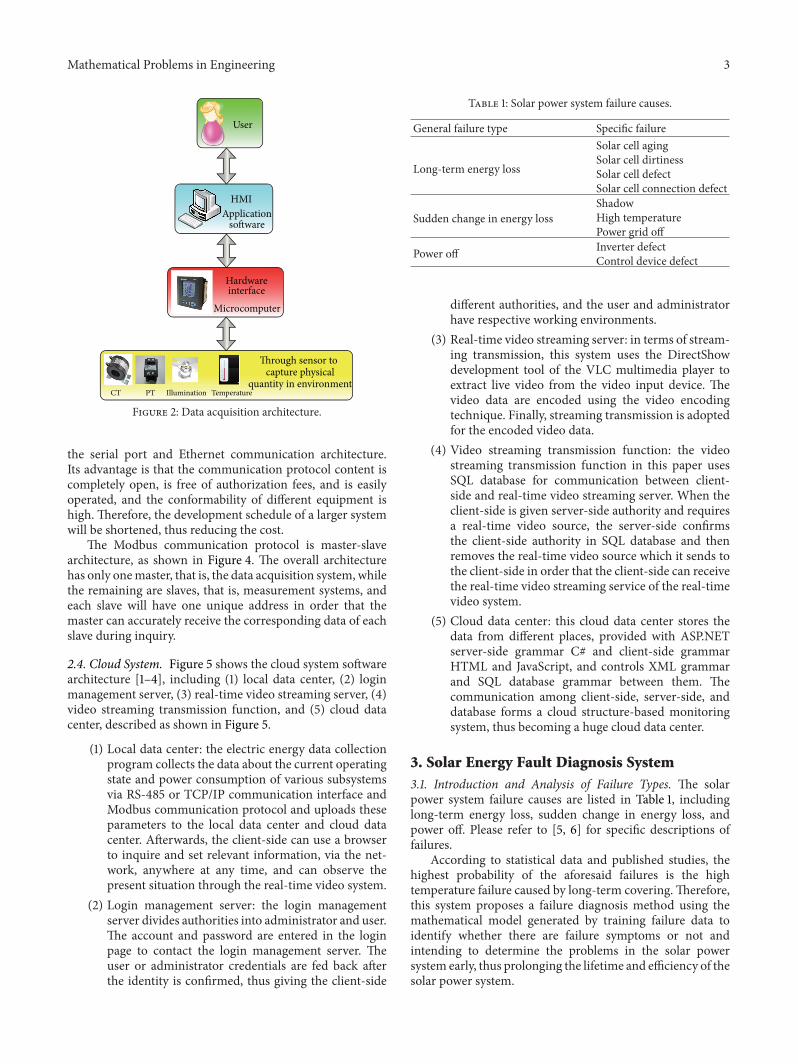
2.2. Data Acquisition System. The reliability of the monitor-ing system depends on the accuracy and integrity of dataacquisition system.Therefore, how to select themeasurementsystem and communication technology is a very importanttopic.Themain operation process of the data acquisition sys-tem is described as follows. First, the signals from the remotesensor are converted and preprocessed into signals with thebest resolution, which can be processed by the analog-to-digital conversion circuit, and then the digitized raw dataare transmitted to the microcomputer, which determines thevalues of physical quantities and sends the data via hardwareline and communication protocol to the local side. Finally,the results are displayed on the human-machine interface asshown in Figure 2.
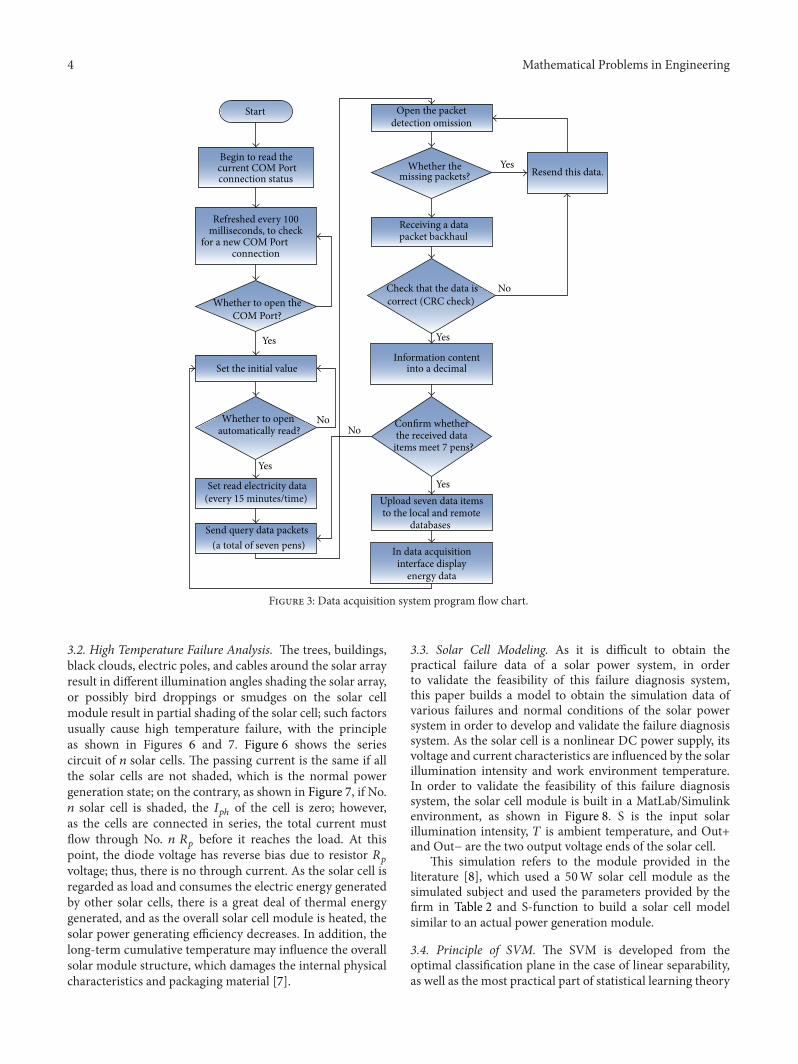
The program flow of the data acquisition system isas shown in Figure 3. When the program is executed, allCOM Port connection states are read, and any new COMPort connection is detected. The COM Port is switched on,automatic reading is set, and the system automatically readselectric energy data every 15 minutes. In the process ofreading, the packet missing detection is started, and packetdata integrity is determined. If the packets have no issue, thedata are uploaded to the local database and remote databaseand displayed on the data interface.
2.3. Data AcquisitionMethod. As a solar power plant consistsof multiple distributed solar modules and each module isequipped with an inverter, the communication system mustallow multiple devices to be connected in the same networkfor communication. The Modbus allows multiple devicesto be connected in the same network for communication.Therefore, this data acquisition system uses the commonModbus communication protocol in industry. The Modbuscommunication protocol is a communication protocol devel-oped by the Modicon Company and is usually applied to
Mathematical Problems in Engineering 3
HMIApplication
software
User
Microcomputerinterface
Hardware
CT PT Illumination Temperature
Through sensor tocapture physical
quantity in environment
Figure 2: Data acquisition architecture.
the serial port and Ethernet communication architecture.Its advantage is that the communication protocol content iscompletely open, is free of authorization fees, and is easilyoperated, and the conformability of different equipment ishigh. Therefore, the development schedule of a larger systemwill be shortened, thus reducing the cost.
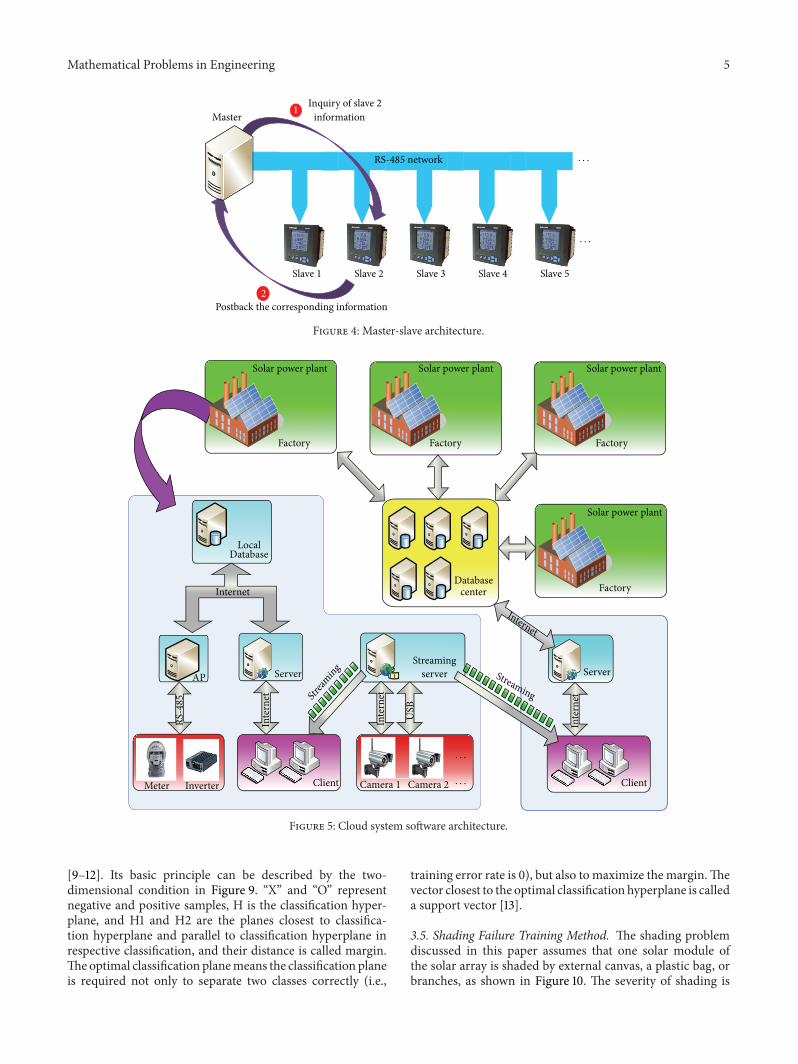
The Modbus communication protocol is master-slavearchitecture, as shown in Figure 4. The overall architecturehas only onemaster, that is, the data acquisition system, whilethe remaining are slaves, that is, measurement systems, andeach slave will have one unique address in order that themaster can accurately receive the corresponding data of eachslave during inquiry.
2.4. Cloud System. Figure 5 shows the cloud system softwarearchitecture [1–4], including (1) local data center, (2) loginmanagement server, (3) real-time video streaming server, (4)video streaming transmission function, and (5) cloud datacenter, described as shown in Figure 5.
(1) Local data center: the electric energy data collectionprogram collects the data about the current operatingstate and power consumption of various subsystemsvia RS-485 or TCP/IP communication interface andModbus communication protocol and uploads theseparameters to the local data center and cloud datacenter. Afterwards, the client-side can use a browserto inquire and set relevant information, via the net-work, anywhere at any time, and can observe thepresent situation through the real-time video system.
(2) Login management server: the login managementserver divides authorities into administrator and user.The account and password are entered in the loginpage to contact the login management server. Theuser or administrator credentials are fed back afterthe identity is confirmed, thus giving the client-side
Table 1: Solar power system failure causes.
General failure type Specific failure
Long-term energy loss
Solar cell agingSolar cell dirtinessSolar cell defectSolar cell connection defect
Sudden change in energy lossShadowHigh temperaturePower grid off
Power off Inverter defectControl device defect
different authorities, and the user and administratorhave respective working environments.
(3) Real-time video streaming server: in terms of stream-ing transmission, this system uses the DirectShowdevelopment tool of the VLC multimedia player toextract live video from the video input device. Thevideo data are encoded using the video encodingtechnique. Finally, streaming transmission is adoptedfor the encoded video data.
(4) Video streaming transmission function: the videostreaming transmission function in this paper usesSQL database for communication between client-side and real-time video streaming server. When theclient-side is given server-side authority and requiresa real-time video source, the server-side confirmsthe client-side authority in SQL database and thenremoves the real-time video source which it sends tothe client-side in order that the client-side can receivethe real-time video streaming service of the real-timevideo system.
(5) Cloud data center: this cloud data center stores thedata from different places, provided with ASP.NETserver-side grammar C# and client-side grammarHTML and JavaScript, and controls XML grammarand SQL database grammar between them. Thecommunication among client-side, server-side, anddatabase forms a cloud structure-based monitoringsystem, thus becoming a huge cloud data center.
3. Solar Energy Fault Diagnosis System3.1. Introduction and Analysis of Failure Types. The solarpower system failure causes are listed in Table 1, includinglong-term energy loss, sudden change in energy loss, andpower off. Please refer to [5, 6] for specific descriptions offailures.
According to statistical data and published studies, thehighest probability of the aforesaid failures is the hightemperature failure caused by long-term covering.Therefore,this system proposes a failure diagnosis method using themathematical model generated by training failure data toidentify whether there are failure symptoms or not andintending to determine the problems in the solar powersystem early, thus prolonging the lifetime and efficiency of thesolar power system.
4 Mathematical Problems in Engineering
Start
Begin to read thecurrent COM Portconnection status
Refreshed every 100milliseconds, to check
for a new COM Portconnection
Whether to open theCOM Port?
No
NoNo
Set the initial value
Whether to open automatically read?
Open the packetdetection omission
Set read electricity data(every 15 minutes/time)
Send query data packets(a total of seven pens)
Whether themissing packets? Resend this data.
Receiving a datapacket backhaul
Check that the data iscorrect (CRC check)
Information contentinto a decimal
Confirm whetherthe received dataitems meet 7 pens?
Upload seven data itemsto the local and remote
databases
In data acquisitioninterface display
energy data
Yes
Yes
Yes
Yes
Yes
Figure 3: Data acquisition system program flow chart.
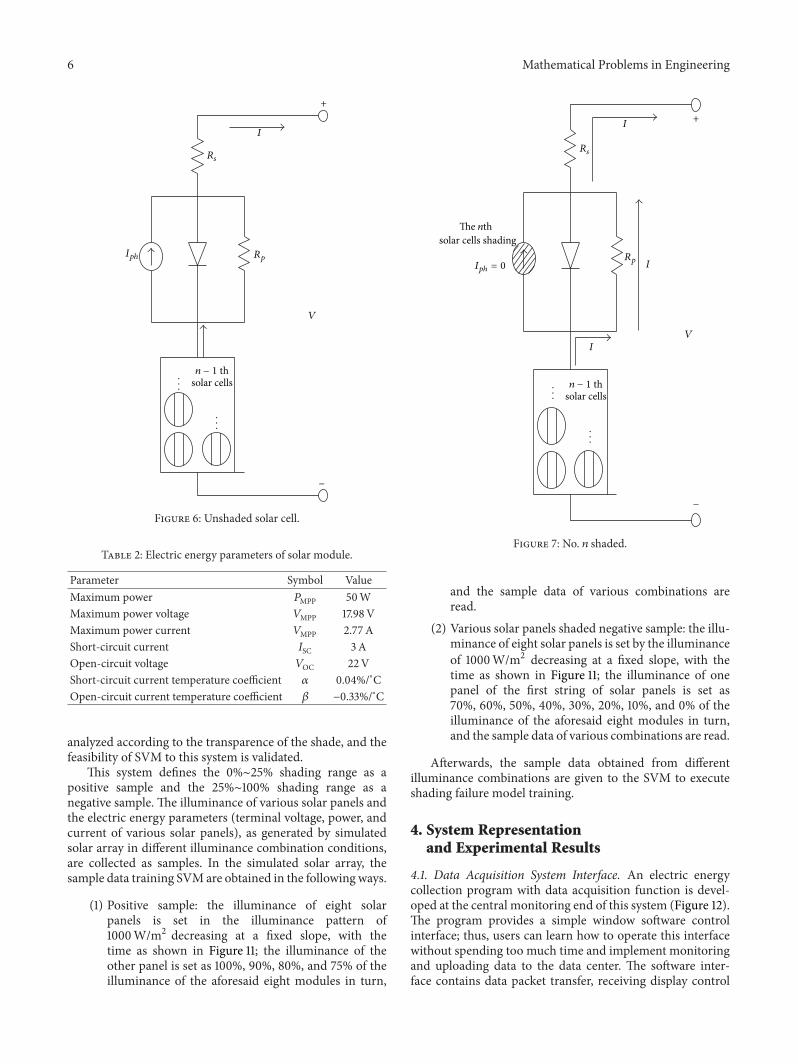
3.2. High Temperature Failure Analysis. The trees, buildings,black clouds, electric poles, and cables around the solar arrayresult in different illumination angles shading the solar array,or possibly bird droppings or smudges on the solar cellmodule result in partial shading of the solar cell; such factorsusually cause high temperature failure, with the principleas shown in Figures 6 and 7. Figure 6 shows the seriescircuit of 𝑛 solar cells. The passing current is the same if allthe solar cells are not shaded, which is the normal powergeneration state; on the contrary, as shown in Figure 7, if No.𝑛 solar cell is shaded, the 𝐼𝑝ℎ of the cell is zero; however,as the cells are connected in series, the total current mustflow through No. 𝑛 𝑅𝑝 before it reaches the load. At thispoint, the diode voltage has reverse bias due to resistor 𝑅𝑝voltage; thus, there is no through current. As the solar cell isregarded as load and consumes the electric energy generatedby other solar cells, there is a great deal of thermal energygenerated, and as the overall solar cell module is heated, thesolar power generating efficiency decreases. In addition, thelong-term cumulative temperature may influence the overallsolar module structure, which damages the internal physicalcharacteristics and packaging material [7].
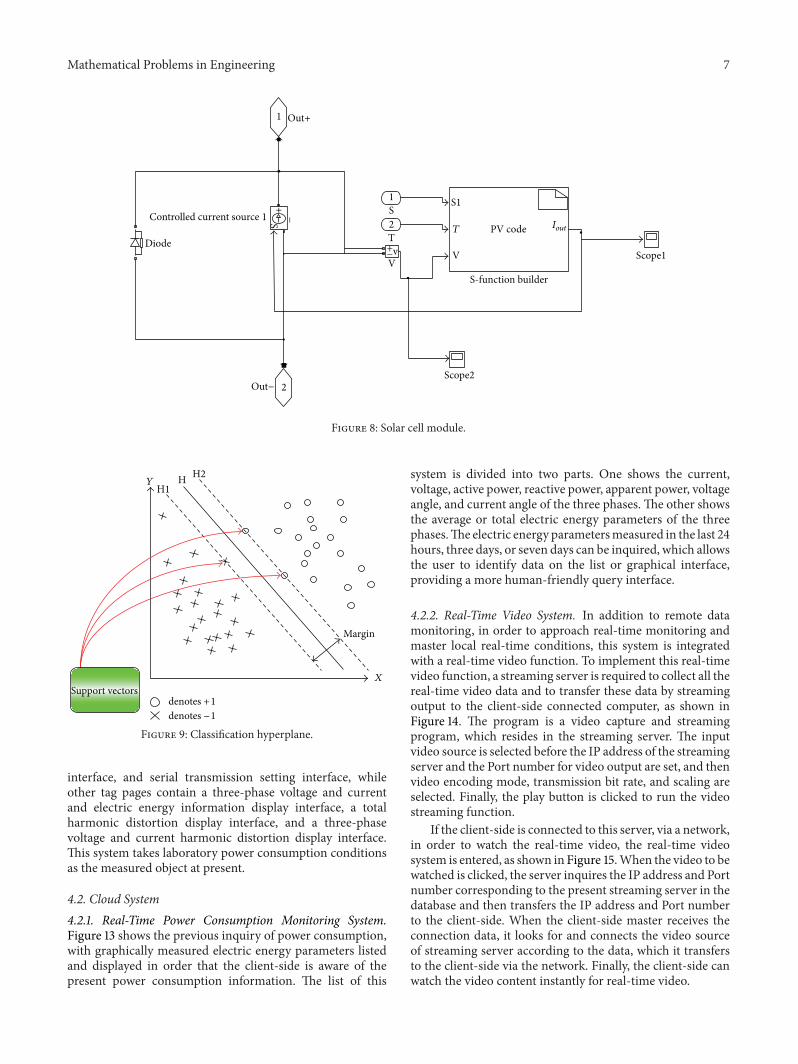
3.3. Solar Cell Modeling. As it is difficult to obtain thepractical failure data of a solar power system, in orderto validate the feasibility of this failure diagnosis system,this paper builds a model to obtain the simulation data ofvarious failures and normal conditions of the solar powersystem in order to develop and validate the failure diagnosissystem. As the solar cell is a nonlinear DC power supply, itsvoltage and current characteristics are influenced by the solarillumination intensity and work environment temperature.In order to validate the feasibility of this failure diagnosissystem, the solar cell module is built in a MatLab/Simulinkenvironment, as shown in Figure 8. S is the input solarillumination intensity, 𝑇 is ambient temperature, and Out+and Out− are the two output voltage ends of the solar cell.
This simulation refers to the module provided in theliterature [8], which used a 50W solar cell module as thesimulated subject and used the parameters provided by thefirm in Table 2 and S-function to build a solar cell modelsimilar to an actual power generation module.
3.4. Principle of SVM. The SVM is developed from theoptimal classification plane in the case of linear separability,as well as the most practical part of statistical learning theory
Mathematical Problems in Engineering 5
Slave 1 Slave 2 Slave 3 Slave 4 Slave 5
RS-485 network
Master informationInquiry of slave 2
Postback the corresponding information
1
2
· · ·
· · ·
Figure 4: Master-slave architecture.
Solar power plant Solar power plant Solar power plant
Factory Factory Factory
Factory
LocalDatabase
Internet
Solar power plant
AP
RS-4
85
Server
Inte
rnet Str
eaming
Databasecenter
Meter Inverter Client Camera 1 Camera 2
Inte
rnet
USB
Streamingserver
Internet
Streaming
Server
Inte
rnet
Client
· · ·
· · ·
Figure 5: Cloud system software architecture.
[9–12]. Its basic principle can be described by the two-dimensional condition in Figure 9. “X” and “O” representnegative and positive samples, H is the classification hyper-plane, and H1 and H2 are the planes closest to classifica-tion hyperplane and parallel to classification hyperplane inrespective classification, and their distance is called margin.Theoptimal classification planemeans the classification planeis required not only to separate two classes correctly (i.e.,
training error rate is 0), but also to maximize the margin.Thevector closest to the optimal classification hyperplane is calleda support vector [13].
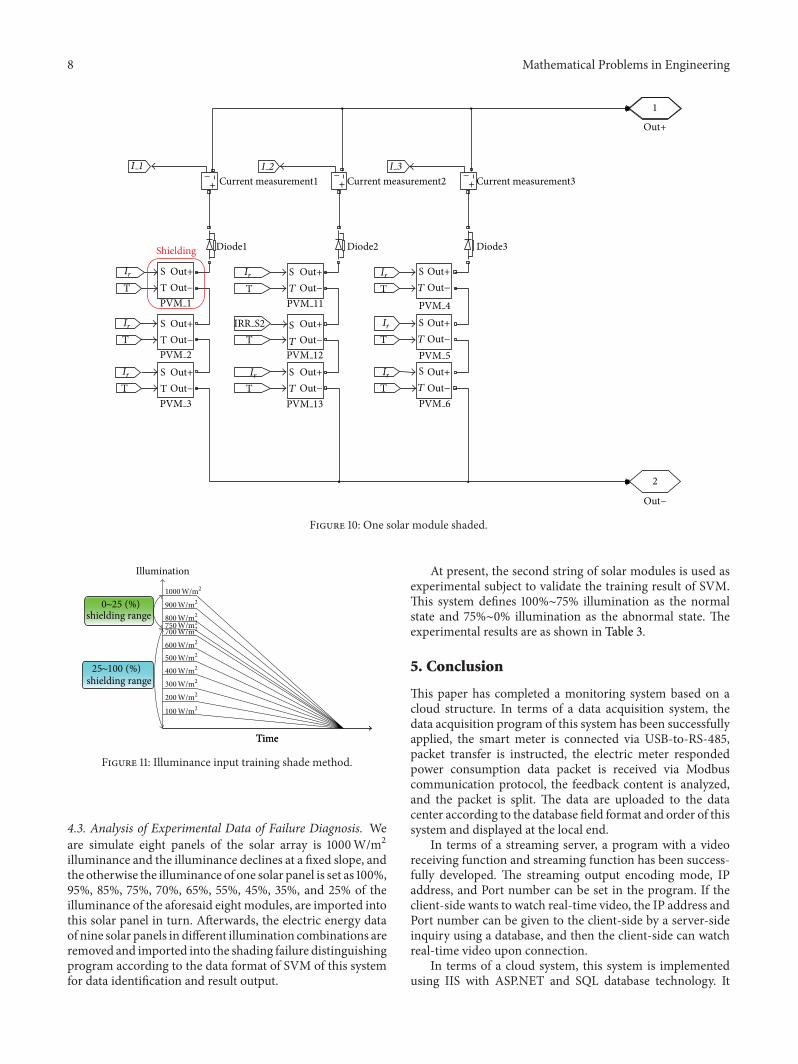
3.5. Shading Failure Training Method. The shading problemdiscussed in this paper assumes that one solar module ofthe solar array is shaded by external canvas, a plastic bag, orbranches, as shown in Figure 10. The severity of shading is
6 Mathematical Problems in Engineering
I
Iph Rp
Rs
V
+
−
...
...
n − 1 thsolar cells
Figure 6: Unshaded solar cell.
Table 2: Electric energy parameters of solar module.
Parameter Symbol ValueMaximum power 𝑃MPP 50WMaximum power voltage 𝑉MPP 17.98VMaximum power current 𝑉MPP 2.77AShort-circuit current 𝐼SC 3 AOpen-circuit voltage 𝑉OC 22VShort-circuit current temperature coefficient 𝛼 0.04%/∘COpen-circuit current temperature coefficient 𝛽 −0.33%/∘C
analyzed according to the transparence of the shade, and thefeasibility of SVM to this system is validated.
This system defines the 0%∼25% shading range as apositive sample and the 25%∼100% shading range as anegative sample. The illuminance of various solar panels andthe electric energy parameters (terminal voltage, power, andcurrent of various solar panels), as generated by simulatedsolar array in different illuminance combination conditions,are collected as samples. In the simulated solar array, thesample data training SVM are obtained in the following ways.
(1) Positive sample: the illuminance of eight solarpanels is set in the illuminance pattern of1000W/m2 decreasing at a fixed slope, with thetime as shown in Figure 11; the illuminance of theother panel is set as 100%, 90%, 80%, and 75% of theilluminance of the aforesaid eight modules in turn,
I
I
Rp
Rs
V
+
−
...
...
n − 1 thsolar cells
Iph = 0
The nthsolar cells shading
I
Figure 7: No. 𝑛 shaded.
and the sample data of various combinations areread.
(2) Various solar panels shaded negative sample: the illu-minance of eight solar panels is set by the illuminanceof 1000W/m2 decreasing at a fixed slope, with thetime as shown in Figure 11; the illuminance of onepanel of the first string of solar panels is set as70%, 60%, 50%, 40%, 30%, 20%, 10%, and 0% of theilluminance of the aforesaid eight modules in turn,and the sample data of various combinations are read.
Afterwards, the sample data obtained from differentilluminance combinations are given to the SVM to executeshading failure model training.
4. System Representationand Experimental Results
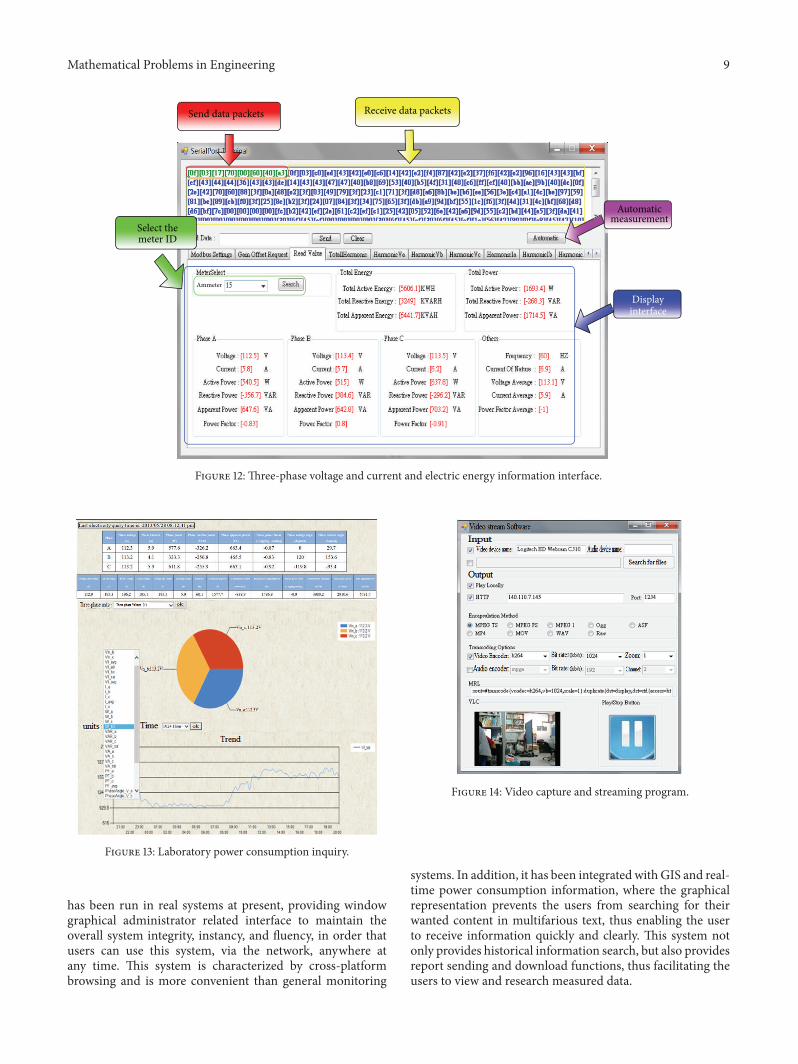
4.1. Data Acquisition System Interface. An electric energycollection program with data acquisition function is devel-oped at the central monitoring end of this system (Figure 12).The program provides a simple window software controlinterface; thus, users can learn how to operate this interfacewithout spending too much time and implement monitoringand uploading data to the data center. The software inter-face contains data packet transfer, receiving display control
Mathematical Problems in Engineering 7
Diode
Controlled current source 1
1
2
Out+
+−
Out−
S
1
2
S
T
V+−v
Scope2
S1
T
V
PV code
S-function builder
Scope1
Iout
Figure 8: Solar cell module.
H1H2H
Margin
Support vectors
Y
X
denotes +1 denotes −1
Figure 9: Classification hyperplane.
interface, and serial transmission setting interface, whileother tag pages contain a three-phase voltage and currentand electric energy information display interface, a totalharmonic distortion display interface, and a three-phasevoltage and current harmonic distortion display interface.This system takes laboratory power consumption conditionsas the measured object at present.
4.2. Cloud System4.2.1. Real-Time Power Consumption Monitoring System.Figure 13 shows the previous inquiry of power consumption,with graphically measured electric energy parameters listedand displayed in order that the client-side is aware of thepresent power consumption information. The list of this
system is divided into two parts. One shows the current,voltage, active power, reactive power, apparent power, voltageangle, and current angle of the three phases. The other showsthe average or total electric energy parameters of the threephases.The electric energy parametersmeasured in the last 24hours, three days, or seven days can be inquired, which allowsthe user to identify data on the list or graphical interface,providing a more human-friendly query interface.
4.2.2. Real-Time Video System. In addition to remote datamonitoring, in order to approach real-time monitoring andmaster local real-time conditions, this system is integratedwith a real-time video function. To implement this real-timevideo function, a streaming server is required to collect all thereal-time video data and to transfer these data by streamingoutput to the client-side connected computer, as shown inFigure 14. The program is a video capture and streamingprogram, which resides in the streaming server. The inputvideo source is selected before the IP address of the streamingserver and the Port number for video output are set, and thenvideo encoding mode, transmission bit rate, and scaling areselected. Finally, the play button is clicked to run the videostreaming function.
If the client-side is connected to this server, via a network,in order to watch the real-time video, the real-time videosystem is entered, as shown in Figure 15.When the video to bewatched is clicked, the server inquires the IP address and Portnumber corresponding to the present streaming server in thedatabase and then transfers the IP address and Port numberto the client-side. When the client-side master receives theconnection data, it looks for and connects the video sourceof streaming server according to the data, which it transfersto the client-side via the network. Finally, the client-side canwatch the video content instantly for real-time video.
8 Mathematical Problems in Engineering
T
Ir
T
Ir
T
I 1
ST
ST
ST
ST
ST
ST
Out+Out−
Out+Out−
ST
Out+
Out+
Out−
Out−
ST
Out+Out−
ST
Out+Out−
Out+Out−
Out+Out−
Out+Out−
Out+Out−
Shielding
PVM 1 PVM 4
PVM 5
PVM 6
PVM 11
PVM 12
PVM 13
PVM 2
PVM 3
−+
−+
−+
Diode1 Diode2 Diode3
Current measurement1 Current measurement2 Current measurement3
T
T
T
T
T
T
IRR S2
1
2
Ir Ir Ir
Ir
IrIr
I 2 I 3
Figure 10: One solar module shaded.
1000W/m2
900W/m2
800W/m2
750W/m2
700W/m2
600W/m2
500W/m2
400W/m2
300W/m2
200W/m2
100W/m2
Illumination
0∼25 (%)shielding range
25∼100 (%)shielding range
TimeTime
Figure 11: Illuminance input training shade method.
4.3. Analysis of Experimental Data of Failure Diagnosis. Weare simulate eight panels of the solar array is 1000W/m2illuminance and the illuminance declines at a fixed slope, andthe otherwise the illuminance of one solar panel is set as 100%,95%, 85%, 75%, 70%, 65%, 55%, 45%, 35%, and 25% of theilluminance of the aforesaid eight modules, are imported intothis solar panel in turn. Afterwards, the electric energy dataof nine solar panels in different illumination combinations areremoved and imported into the shading failure distinguishingprogram according to the data format of SVM of this systemfor data identification and result output.
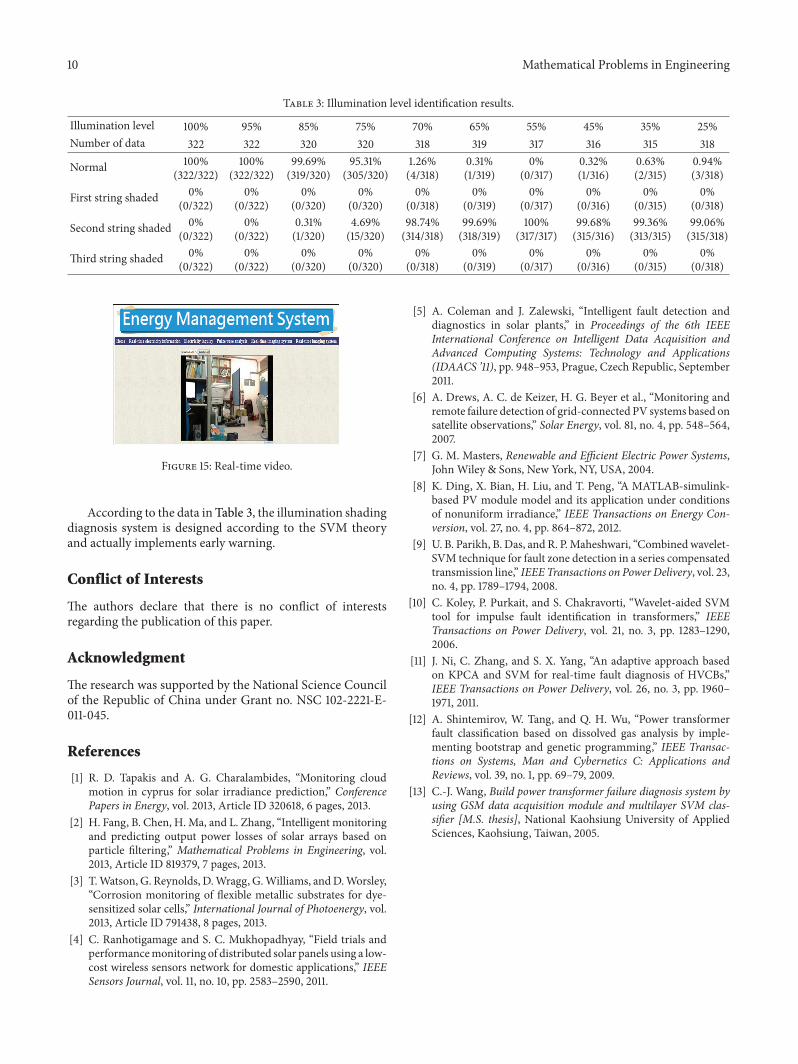
At present, the second string of solar modules is used asexperimental subject to validate the training result of SVM.This system defines 100%∼75% illumination as the normalstate and 75%∼0% illumination as the abnormal state. Theexperimental results are as shown in Table 3.
5. Conclusion
This paper has completed a monitoring system based on acloud structure. In terms of a data acquisition system, thedata acquisition program of this system has been successfullyapplied, the smart meter is connected via USB-to-RS-485,packet transfer is instructed, the electric meter respondedpower consumption data packet is received via Modbuscommunication protocol, the feedback content is analyzed,and the packet is split. The data are uploaded to the datacenter according to the database field format and order of thissystem and displayed at the local end.
In terms of a streaming server, a program with a videoreceiving function and streaming function has been success-fully developed. The streaming output encoding mode, IPaddress, and Port number can be set in the program. If theclient-side wants to watch real-time video, the IP address andPort number can be given to the client-side by a server-sideinquiry using a database, and then the client-side can watchreal-time video upon connection.
In terms of a cloud system, this system is implementedusing IIS with ASP.NET and SQL database technology. It
Mathematical Problems in Engineering 9
Send data packets Receive data packets
Select themeter ID
Automaticmeasurement
Displayinterface
Ammeter
Figure 12: Three-phase voltage and current and electric energy information interface.
Figure 13: Laboratory power consumption inquiry.
has been run in real systems at present, providing windowgraphical administrator related interface to maintain theoverall system integrity, instancy, and fluency, in order thatusers can use this system, via the network, anywhere atany time. This system is characterized by cross-platformbrowsing and is more convenient than general monitoring
Figure 14: Video capture and streaming program.
systems. In addition, it has been integrated with GIS and real-time power consumption information, where the graphicalrepresentation prevents the users from searching for theirwanted content in multifarious text, thus enabling the userto receive information quickly and clearly. This system notonly provides historical information search, but also providesreport sending and download functions, thus facilitating theusers to view and research measured data.
10 Mathematical Problems in Engineering
Table 3: Illumination level identification results.
Illumination level 100% 95% 85% 75% 70% 65% 55% 45% 35% 25%Number of data 322 322 320 320 318 319 317 316 315 318
Normal 100%(322/322)
100%(322/322)
99.69%(319/320)
95.31%(305/320)
1.26%(4/318)
0.31%(1/319)
0%(0/317)
0.32%(1/316)
0.63%(2/315)
0.94%(3/318)
First string shaded 0%(0/322)
0%(0/322)
0%(0/320)
0%(0/320)
0%(0/318)
0%(0/319)
0%(0/317)
0%(0/316)
0%(0/315)
0%(0/318)
Second string shaded 0%(0/322)
0%(0/322)
0.31%(1/320)
4.69%(15/320)
98.74%(314/318)
99.69%(318/319)
100%(317/317)
99.68%(315/316)
99.36%(313/315)
99.06%(315/318)
Third string shaded 0%(0/322)
0%(0/322)
0%(0/320)
0%(0/320)
0%(0/318)
0%(0/319)
0%(0/317)
0%(0/316)
0%(0/315)
0%(0/318)
Figure 15: Real-time video.
According to the data in Table 3, the illumination shadingdiagnosis system is designed according to the SVM theoryand actually implements early warning.
Conflict of Interests
The authors declare that there is no conflict of interestsregarding the publication of this paper.
Acknowledgment
The research was supported by the National Science Councilof the Republic of China under Grant no. NSC 102-2221-E-011-045.
References
[1] R. D. Tapakis and A. G. Charalambides, “Monitoring cloudmotion in cyprus for solar irradiance prediction,” ConferencePapers in Energy, vol. 2013, Article ID 320618, 6 pages, 2013.
[2] H. Fang, B. Chen, H. Ma, and L. Zhang, “Intelligent monitoringand predicting output power losses of solar arrays based onparticle filtering,” Mathematical Problems in Engineering, vol.2013, Article ID 819379, 7 pages, 2013.
[3] T.Watson, G. Reynolds, D.Wragg, G.Williams, andD.Worsley,“Corrosion monitoring of flexible metallic substrates for dye-sensitized solar cells,” International Journal of Photoenergy, vol.2013, Article ID 791438, 8 pages, 2013.
[4] C. Ranhotigamage and S. C. Mukhopadhyay, “Field trials andperformancemonitoring of distributed solar panels using a low-cost wireless sensors network for domestic applications,” IEEESensors Journal, vol. 11, no. 10, pp. 2583–2590, 2011.
[5] A. Coleman and J. Zalewski, “Intelligent fault detection anddiagnostics in solar plants,” in Proceedings of the 6th IEEEInternational Conference on Intelligent Data Acquisition andAdvanced Computing Systems: Technology and Applications(IDAACS ’11), pp. 948–953, Prague, Czech Republic, September2011.
[6] A. Drews, A. C. de Keizer, H. G. Beyer et al., “Monitoring andremote failure detection of grid-connected PV systems based onsatellite observations,” Solar Energy, vol. 81, no. 4, pp. 548–564,2007.
[7] G. M. Masters, Renewable and Efficient Electric Power Systems,John Wiley & Sons, New York, NY, USA, 2004.
[8] K. Ding, X. Bian, H. Liu, and T. Peng, “A MATLAB-simulink-based PV module model and its application under conditionsof nonuniform irradiance,” IEEE Transactions on Energy Con-version, vol. 27, no. 4, pp. 864–872, 2012.
[9] U. B. Parikh, B. Das, and R. P.Maheshwari, “Combined wavelet-SVM technique for fault zone detection in a series compensatedtransmission line,” IEEE Transactions on Power Delivery, vol. 23,no. 4, pp. 1789–1794, 2008.
[10] C. Koley, P. Purkait, and S. Chakravorti, “Wavelet-aided SVMtool for impulse fault identification in transformers,” IEEETransactions on Power Delivery, vol. 21, no. 3, pp. 1283–1290,2006.
[11] J. Ni, C. Zhang, and S. X. Yang, “An adaptive approach basedon KPCA and SVM for real-time fault diagnosis of HVCBs,”IEEE Transactions on Power Delivery, vol. 26, no. 3, pp. 1960–1971, 2011.
[12] A. Shintemirov, W. Tang, and Q. H. Wu, “Power transformerfault classification based on dissolved gas analysis by imple-menting bootstrap and genetic programming,” IEEE Transac-tions on Systems, Man and Cybernetics C: Applications andReviews, vol. 39, no. 1, pp. 69–79, 2009.
[13] C.-J. Wang, Build power transformer failure diagnosis system byusing GSM data acquisition module and multilayer SVM clas-sifier [M.S. thesis], National Kaohsiung University of AppliedSciences, Kaohsiung, Taiwan, 2005.

Submit your manuscripts athttp://www.hindawi.com
Hindawi Publishing Corporationhttp://www.hindawi.com Volume 2014
MathematicsJournal of
Hindawi Publishing Corporationhttp://www.hindawi.com Volume 2014
Mathematical Problems in Engineering
Hindawi Publishing Corporationhttp://www.hindawi.com
Differential EquationsInternational Journal of
Volume 2014
Applied MathematicsJournal of
Hindawi Publishing Corporationhttp://www.hindawi.com Volume 2014
Probability and StatisticsHindawi Publishing Corporationhttp://www.hindawi.com Volume 2014
Journal of
Hindawi Publishing Corporationhttp://www.hindawi.com Volume 2014
Mathematical PhysicsAdvances in
Complex AnalysisJournal of
Hindawi Publishing Corporationhttp://www.hindawi.com Volume 2014
OptimizationJournal of
Hindawi Publishing Corporationhttp://www.hindawi.com Volume 2014
CombinatoricsHindawi Publishing Corporationhttp://www.hindawi.com Volume 2014
International Journal of
Hindawi Publishing Corporationhttp://www.hindawi.com Volume 2014
Operations ResearchAdvances in
Journal of
Hindawi Publishing Corporationhttp://www.hindawi.com Volume 2014
Function Spaces
Abstract and Applied AnalysisHindawi Publishing Corporationhttp://www.hindawi.com Volume 2014
International Journal of Mathematics and Mathematical Sciences
Hindawi Publishing Corporationhttp://www.hindawi.com Volume 2014
The Scientific World JournalHindawi Publishing Corporation http://www.hindawi.com Volume 2014
Hindawi Publishing Corporationhttp://www.hindawi.com Volume 2014
Algebra
Discrete Dynamics in Nature and Society
Hindawi Publishing Corporationhttp://www.hindawi.com Volume 2014
Hindawi Publishing Corporationhttp://www.hindawi.com Volume 2014
Decision SciencesAdvances in
Discrete MathematicsJournal of
Hindawi Publishing Corporationhttp://www.hindawi.com
Volume 2014 Hindawi Publishing Corporationhttp://www.hindawi.com Volume 2014
Stochastic AnalysisInternational Journal of