Embed Size (px)
Citation preview
Research ArticleAnalysis and Discussion of Atmospheric Precursor ofEuropean Heat Summers
Christine Traumlger-Chatterjee1 Richard W Muumlller1 and Joumlrg Bendix2
1 Deutscher Wetterdienst Frankfurter Straszlige 135 63067 Offenbach am Main Germany2 Laboratory for Climatology and Remote Sensing Department of Geography Philipps University Deutschhausstraszlige 1035032 Marburg Germany
Correspondence should be addressed to Christine Trager-Chatterjee christinetraeger-chatterjeedwdde
Received 4 September 2014 Accepted 6 October 2014 Published 24 November 2014
Academic Editor Gwo-Fong Lin
Copyright copy 2014 Christine Trager-Chatterjee et al This is an open access article distributed under the Creative CommonsAttribution License which permits unrestricted use distribution and reproduction in any medium provided the original work isproperly cited
The prediction of summers with notable droughts and heatwaves on the seasonal scale is challenging especially in extratropicalregions since their development is not yet fully understood Thus monitoring and analysis of such summers are important tasksto close this knowledge gap In a previous paper the authors presented hints that extreme summers are connected with specificconditions during the winter-spring transition season Here these findings are further discussed and analysed in the context of theEarthrsquos circulation systems No evidence for a connection between the North Atlantic Oscillation or the Arctic Oscillation duringthe winter-spring transition and extremely hot and dry summers is found However inspection of the geopotential at 850 hPa showsthat a Greenland-North Sea-Dipole is connected with extreme summers in Central EuropeThis motivated the introduction of thenovel Greenland-North Sea-Dipole-Index GNDI However using this index as predictor would lead to one false alarm and onemissed event in the time series analysed (1958ndash2011) Hints are found that the disturbance of the ldquodipole-summerrdquo connection isdue to El NinoSouthern Oscillation (ENSO) To consider the ENSO effect the novel Central European Drought Index (CEDI) hasbeen developed which is composed of the GNDI and the Bivariate ENSOTime Series IndexTheCEDI enables a correct indicationof all extremely hot and dry summers between 1958 and 2011 without any false alarm
1 Introduction
Extreme summers with droughts and heat waves significantlyaffect human wellbeing During the heat summer 2003 forinstance several thousand of mainly elderly people werediseased in Central Europe [1] probably due to perilousdehydration [2] andor cardiovascular problems [3] Besidethe effect on human wellbeing heat summers have adverseeconomic effects for example on agriculture [4] and forestry[5] In some regions severe problems with water supplyoccurred The financial loss due to crop failure induced bythe 2003 heat wave is estimated at 123 US $ [6] Moreoverextremely hot and dry summers increase the risk of forestfires (eg [7]) and are likely to increase rock-fall in the Alpineregion due to intensified thawing of permafrost [8]
It is evident that the impact of extremely hot and dry sum-mers on human wellbeing and the environment is eminentlyessential Extreme weather cannot be avoided but adaptation
and precautionary measures could be installed Yet thisrequires sufficient handling time Hence early and reliablemeteorological predictions of extreme heat and droughtevents could significantly contribute to the mitigation of theadverse effects described above and could minimize theirnegative impact
For purposes like this seasonal prediction systems aredeveloped The goal of seasonal prediction is not to forecastthe weather at a certain place and time months aheadbut to estimate the dominant circulation regimes over alarger region in the upcoming months This type of pre-diction is based on low frequence oscillations in the Earth-Atmosphere-System such as ENSO acting on hemisphericalto global scales [9] For the tropics seasonal prediction sys-tems perform better than for extratropical regions (eg [9])This is due to the dominance of low frequence oscillations inthe tropics whereas in the extratropics internal variabilitiesdominateThat is in the extratropics the chaotic nature of the
Hindawi Publishing CorporationAdvances in MeteorologyVolume 2014 Article ID 427916 11 pageshttpdxdoiorg1011552014427916
2 Advances in Meteorology
Earth-Atmosphere-System has a larger influence on weatherregimes than low frequence oscillations whereas the formerare more difficult to capture in seasonal prediction than thelatter
Especially the prediction of extreme summers in extra-tropical regions like the one in 2003 in Europe remainschallenging [10]
To enhance the skill of the prediction of the summerseason in extratropical regions is the goal of various researchapproaches For example Dutra et al [11] developed the ext-reme forecast index (EFI) for the seasonal scale By scaling theensemble forecast of the ECMWF seasonal forecast systemS4 of 2-m temperature and precipitation with respect to themodel climate the EFI measures the departure of the meanmodel climate and the actual forecast However an evaluationof the performance of EFI is currently not available
Pavan and Doblas-Reyes [12] suggest a method to cali-brate model outputs with observational climate indices usingprincipal component analysis to enhance the prediction ofsummer maximum temperature over Italy The method isbased on the finding that persistent extreme temperatureevents during summer develop due to a linkage betweenlarge-scale circulation anomalies and local climate anoma-lies Pavan and Doblas-Reyes [12] conclude that wheneverdynamical forecast systems capture large-scale patterns withrelevance to local climate anomalies their proposed calibra-tion method ldquoleads to more skilful and reliable predictionsrdquoThis finding supports the fact that seasonal prediction ispossible because low frequency oscillations that is large scalepatterns influence regional climate on the seasonal scale asmentioned above
However the origin of the issue to reliably forecastextremely hot summers on the seasonal scale is the knowl-edge gap of the processes behind the development leading tothese extremes [13] To close this gap it is essential to analyseextremely hot summers and the meteorological situation intheir preceding time frame The severe impact of the heatsummer 2003 in Europe might be one reason why heat wavesattracted wide interest both in the public and the scientificcommunity and this event has been analyzed in detail fromvarious disciplines (see [14] and references therein)
Several authors have analysed and discussed the devel-opment and origin of heat waves within the scope of mete-orology Long lasting anticyclonic circulation anomalies havebeen discussed by several authors as a key factor for midlatitudinal summer heat waves [15ndash18] The European 2003heat wave [14] as well as the 1995 and 1999 heat wave overthe US [19 20] was characterised by 500 hPa geopotentialanomaly patterns The anticyclonic anomalies are associatedwith clear skies and subsequent heating of the Earth by solarsurface irradiationThis in turn generates stable atmosphericstratification which suppresses local convection
Furthermore circulation anomalies as blocking stormtracks and frontal systems (eg [21]) are often associatedwith a large scale stationary Rossby wave pattern Fischer (see[14] and references therein) In stable anticyclones trajectoriesof air parcels are bounded to the core of the cyclone in amanner that the area covered by the trajectories is muchsmaller than in typical summer years [22] Air parcels are
ldquotrappedrdquo in the anticyclone This behavior indicates a Lya-punov stable equilibrium state of the atmospheric circulationin this region Extreme heat summers are characterised bylong lasting stable situations which also indicates that theatmospheric circulation is in a regional equilibrium For suchextraordinary stable atmospheric states it could be expectedthat a specific atmospheric precursor (initial state) mightindicate the occurrence of extremely hot and dry summersSuch an indicator could be used to issue early warnings
Indeed empirical hints have been found that a precursor[23] of extreme summers in Central Europe exists and that anearly prediction of heat summers might thus be possible
Trager-Chatterjee et al [23] showed that extremely sunnyand dry summer seasons (June-July-August JJA) in CentralEurope are preceded by winter-spring transition seasons(February-March-April FMA) with large positive (negative)anomalies of solar irradiation (precipitation) if the El NinoSouthern Oscillation (ENSO) is not notably extreme
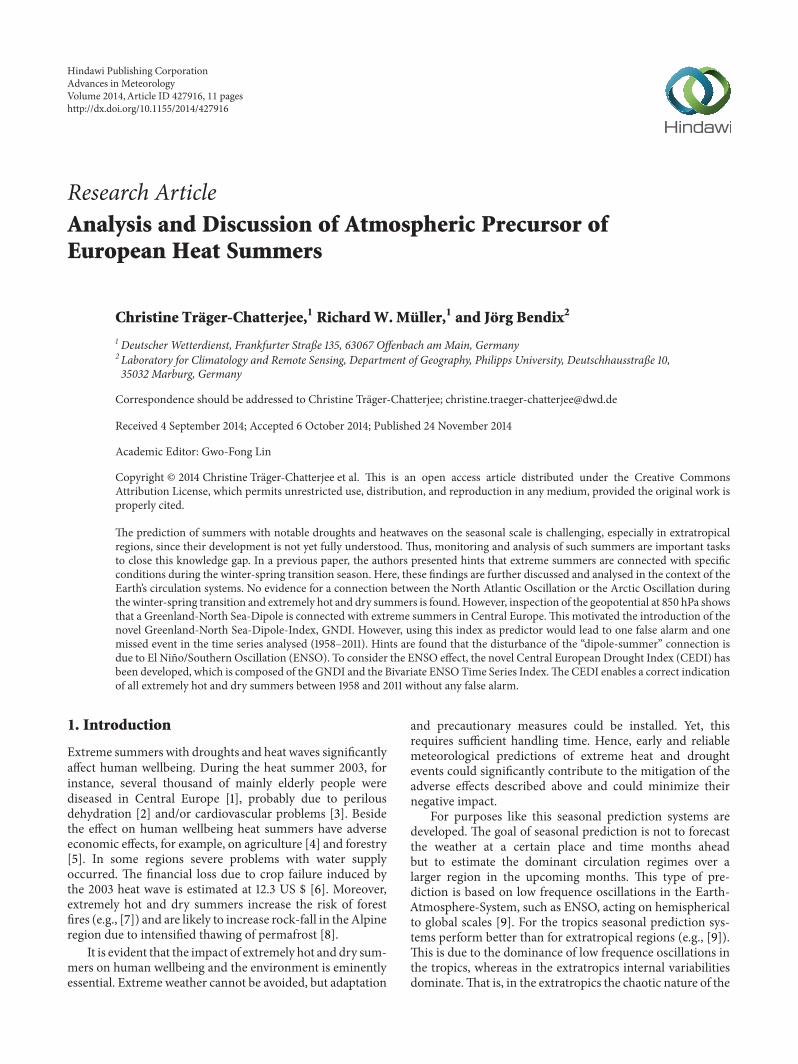
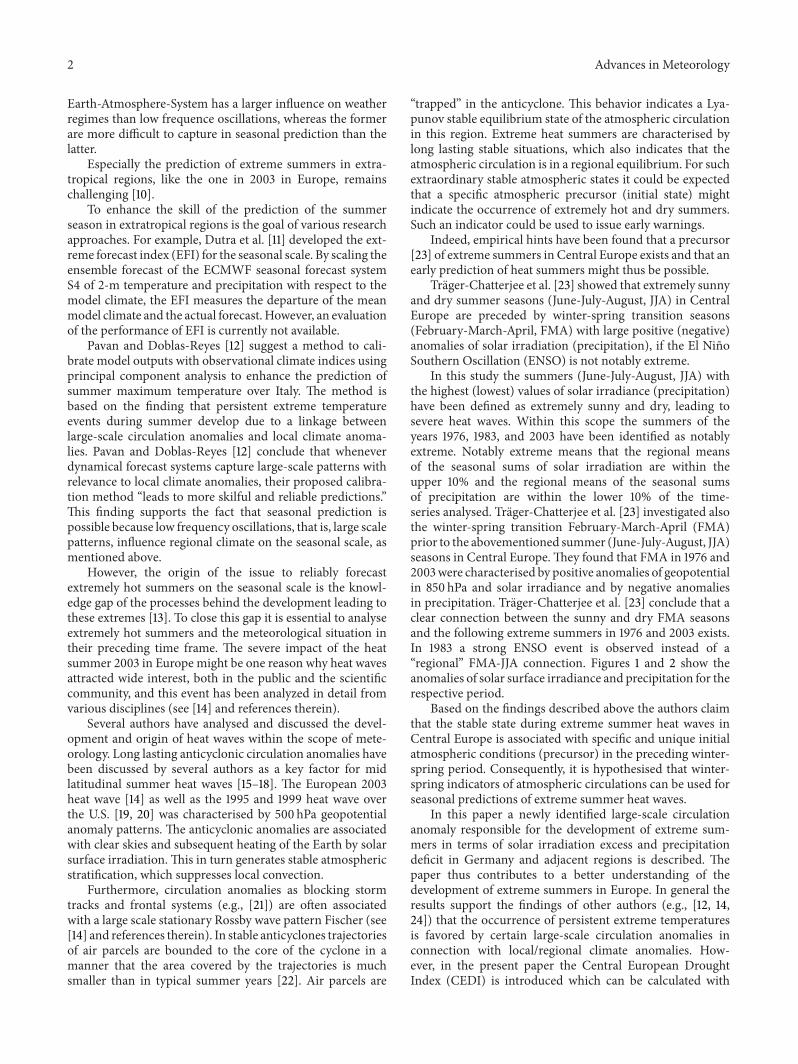
In this study the summers (June-July-August JJA) withthe highest (lowest) values of solar irradiance (precipitation)have been defined as extremely sunny and dry leading tosevere heat waves Within this scope the summers of theyears 1976 1983 and 2003 have been identified as notablyextreme Notably extreme means that the regional meansof the seasonal sums of solar irradiation are within theupper 10 and the regional means of the seasonal sumsof precipitation are within the lower 10 of the time-series analysed Trager-Chatterjee et al [23] investigated alsothe winter-spring transition February-March-April (FMA)prior to the abovementioned summer (June-July-August JJA)seasons in Central EuropeThey found that FMA in 1976 and2003were characterised by positive anomalies of geopotentialin 850 hPa and solar irradiance and by negative anomaliesin precipitation Trager-Chatterjee et al [23] conclude that aclear connection between the sunny and dry FMA seasonsand the following extreme summers in 1976 and 2003 existsIn 1983 a strong ENSO event is observed instead of aldquoregionalrdquo FMA-JJA connection Figures 1 and 2 show theanomalies of solar surface irradiance and precipitation for therespective period
Based on the findings described above the authors claimthat the stable state during extreme summer heat waves inCentral Europe is associated with specific and unique initialatmospheric conditions (precursor) in the preceding winter-spring period Consequently it is hypothesised that winter-spring indicators of atmospheric circulations can be used forseasonal predictions of extreme summer heat waves
In this paper a newly identified large-scale circulationanomaly responsible for the development of extreme sum-mers in terms of solar irradiation excess and precipitationdeficit in Germany and adjacent regions is described Thepaper thus contributes to a better understanding of thedevelopment of extreme summers in Europe In general theresults support the findings of other authors (eg [12 1424]) that the occurrence of persistent extreme temperaturesis favored by certain large-scale circulation anomalies inconnection with localregional climate anomalies How-ever in the present paper the Central European DroughtIndex (CEDI) is introduced which can be calculated with
Advances in Meteorology 3
1958
1962
1966
1970
1974
1978
1982
1986
1990
1994
1998
2002
2006
2010
1976
1983 20
03
1959 20
11
Anomaly FMAAnomaly JJA
150
100
50
0
minus50
minus100
minus150
Ano
mal
y so
lar i
rrad
iatio
n (W
mminus2)
Figure 1 Anomalies of the seasons regional mean (SRM fordefinition please refer to Trager-Chatterjee et al [23]) of solarirradiation [Wmminus2] during winter-spring transition season FMA(green) and summer season JJA (red) in all years of the time series1958ndash2011 Years marked with their number had (highly) extremeanomalies in FMA andor JJA Figure taken from Trager-Chatterjeeet al [23]
one-month lead time prior to the onset of the event usinganalysis data of geopotential and the Bivariate ENSO IndexTime series (BEST) representing the status of the ENSOConsequently nomodel forecasts would be necessary to issueearly warnings of extremely hot and dry summers in CentralEurope Furthermore compared to other seasonal predictionmethods (eg see above) the index is easy to apply
2 Materials and Methods
This study follows the definition and selection of extremelysunny and dry summers of Trager-Chatterjee et al [23]according to extremes in solar radiation and precipitationThose summers showing the highest amounts of solarirradiation and (at the same time) the lowest amounts ofprecipitation in the time series investigated are defined asextreme Please refer to Trager-Chatterjee et al [23] forfurther details about the data sources andmethodsThe sametime period (1958ndash2011) as in Trager-Chatterjee et al [23]is investigated here in order to discuss potential precursorof extremely sunny and dry summers by analysis of theatmospheric circulation
The atmospheric circulation of the Earth is characterizedby a complex nonlinear system of coupled differential equa-tions which is not closed and hence not solvable withoutapproximations and simplifications Frequently used analysismethods in the atmospheric sciences such as EmpiricalOrthogonal Functions (EOF)Principal Component Analysis(PCA) are linked with an implicit linearisation of the systemwhich might cover significant processes within the scope ofextremes However according to the understanding of theauthors it is necessary to consider the nonlinearity of theglobal circulation system to improve the understanding of itsprocesses Based on these considerations an extensive empir-ical analysis of the system is presented in this paper together
1958
1961
1964
1967
1970
1973
1976
1979
1982
1985
1988
1991
1994
1997
2000
2003
2006
2009
Anomaly FMAAnomaly JJA
1959
1976 19
83 2003
2011
150
100
50
0
minus50
minus100
minus150
Ano
mal
y pr
ecip
itatio
n (m
mlowast
mon
thminus1)
Figure 2 Anomalies of the seasons regional mean (SRM for def-inition please refer to Trager-Chatterjee et al [23]) of precipitation[mmmonth] during winter-spring transition season FMA (green)and summer season JJA (red) in all years of the time series 1958ndash2011Years marked with their number had (highly) extreme anomalies inFMA andor JJA Figure taken from Trager-Chatterjee et al [23]
with a discussion and investigation of established indicesdescribing the conditions of well-known large scale climateoscillations such as the North Atlantic Oscillation (NAO)the Arctic Oscillation (AO) and the El NinoSouthernOscillation (ENSO)The results of these investigations lead tothe definition of two novel indices using nonlinear relations
For the definition of these novel indices the geopotentialat 850 hPa provided by the European Center for MediumRange Weather Forecast (ECMWF) is analysed The 40-yearreanalysis dataset ERA-40 [25] for the period 1958ndash1988 andthe ERA-Interim dataset [26] for 1989ndash2011 are used
The North Atlantic Oscillation (NAO) and the ArcticOscillation (AO) (Arctic Oscillation (AO) is described byThompson and Wallace [27] as a seesaw of see level pressure(atmospheric mass) ldquobetween the Arctic basin and parts ofthe surrounding ringrdquo) are very important for the weatherand climate in Central Europe and theNorth Atlantic Hencethe well-established NAO and AO indices according to Hur-rell et al [28 29] are discussed in Section 31 Further a newindicator a distinct pressure difference index is introducedin Section 32This index results from analysis of geopotentialfields at 850 hPa and aims at describing a potential precursorof extremely sunny and dry summers in Central EuropeThis index covers circulations on the synoptic scale onlyHowever extreme summers might also be affected by globalscale circulations
Several authors discussed the effect of the El NinoSouthern Oscillation (ENSO) on the seasonal climate inEurope (see [30] and references therein) Therefore ENSOrsquospotential role on the development of European heat summersis discussed and analysed in Section 33 using the BEST indexaccording to Smith and Sardeshmukh [31]The analysis of theBEST index leads to the postulation of a further novel indexwhich aims at coupling the synoptic scale and the global scaleThis is discussed in Section 34
4 Advances in Meteorology
1959
1976
1983
2003
2011
1960 1970 1980 1990 2000 2010Year
2
1
0
minus1
minus2
Mea
n N
AO D
JFM
Figure 3 Time series of Hurrellrsquos North Atlantic Oscillationindex for December-January-February-March based on PrincipalComponent Analysis [28]
3 Results and Discussions
31 North Atlantic Oscillation and Arctic Oscillation TheNorth Atlantic Oscillation is widely accepted as the mostimportant circulation pattern in the northern hemisphere(eg [32ndash35]) According to several authors the NAO isclosely associated with the Atlantic storm track in terms ofits strength and direction (see [35] and references therein)During summer the NAO is not as pronounced as duringwinter Consequently its dominance on European weatherduring winter is stronger than during summer (eg [24 3334])
On the other hand [36] found that NAOAO conditionsin winter are highly correlated with pressure anomalies overthe British Isles in summer
A reason for this correlation might be that strong win-tertime NAO ldquocan interact with the slower components ofthe climate system (the ocean ) to leave persistent surfaceanomalies into the ensuing parts of the year that maysignificantly influence the evolution of the climate rdquo ([3738] both in [33])
Thus to investigate whether NAOAO indices might beuseful for the prediction of summer heat waves we analysedthe behavior of the NAO and the AO in the time series 1958ndash2011
For the NAO the PCA based seasonal NAO index(December-January-February-March DJFM) according toHurrell et al [28] is used (see Figure 3) This index isavailable from the NCAR (National Center for AtmosphericResearch)UCAR (University Corporation for AtmosphericResearch) climate data guide homepage (see http link in[28]) In contrast to station based NAO indices the PCAbased index accounts for the movement of the NAO pressurecentersAzoresHigh andAtlantic Low [28]This is regarded asan advantage compared to the station based indices since the
1960 1970 1980 1990 2000 2010Year
1959
1976
1983
2003 20
11
3
2
1
0
minus1
minus2
Mea
n AO
DJF
M
Figure 4 Time series of Hurrellrsquos Arctic Oscillation index forDecember-January-February-March based on Principal Compo-nent Analysis [29]
PCA based index covers most of the Atlantic (20ndash80∘N and90∘Wto 40∘E) and thus captures the action centers regardlessof their actual position
Figure 3 reveals that the years of the summer seasonsidentified as being extremely sunny and dry do not showcharacteristic NAO index values indicating that the NAOis not suited as an indicator of extreme summer heat wavesahead
The same holds for the AO To analyse the ArcticOscillation as a possible predictor of extremely sunny and drysummers in Central Europe the wintertime (DJFM) ArcticOscillation index (also referred to as ldquoNorthern AnnularModerdquo) according to Hurrell at al [29] published at NCARUCAR climate data guide homepage (please see http link in[29]) is usedThis index refers not only to the North Atlantic(as the NAO) but to the entire northern hemisphere sea levelpressure and is defined as the first EOF of the latter [29] Alsoin the time series of the AO index no threshold value can beidentified for the years with highly extreme sunny and drysummer seasons see Figure 4
The analysis of NAO and AO provides no hints that theymight be appropriate indicators for extremely sunny and drysummers in Central Europe
32 Greenland-North Sea-Dipole-Index (GNDI) Since noexplicit connection between the NAOAO and the occur-rence of extremely sunny and dry FMA seasons and thefollowing extreme JJA seasons in Central Europe could befound in the data the atmospheric circulation over theNorth Atlantic has been analysed using the geopotential at850 hPa In the years with notably extreme sunny and dryFMA seasons a conspicuous dipole structure of anomaliesbetween southern Greenland (negative pressure anomaly)and theNorth SeaFennoscandia (positive pressure anomaly)has been found Figure 5 shows an example of this dipole in
Advances in Meteorology 5
20
40
60
801000
500
0
minus500
minus1000
(m2s2
)
minus150 minus50 0 50 150
minus200 minus200
Latit
ude (
∘N
)
Longitude (∘E)
FMA 2003
minus600
minus400
0
0
0
0
200
200
400
minus200
(a)
600
minus200
20
40
60
80
minus200
minus200
0
0
0
0
200
200
400
1000
500
0
minus500
minus1000
(m2s2
)
minus150 minus50 0 50 150
FMA 2005
Latit
ude (
∘N
)
Longitude (∘E)
(b)
Figure 5 Example of the dipole geopotential anomaly at 850 hPa of FMA for 2003 and 2005 In FMA prior to the European hot summer of2003 the dipole is clearly apparent (left map) while in the relatively normal year 2005 it is not apparent (right map) The red boxes indicatethe regions that are always captured by anomalies of the same direction prior to the extreme summers in Central Europe
comparison to a year with normal winterspring and summerconditions
In contrast to the NAO which is generally described asa meridional pressure gradient over the North Atlantic [33]the FMA geopotential anomaly maps prior to the extremesummers (eg the year 2003 shown in Figure 5) rather showa zonal pressure gradient between southern Greenland andthe North SeaFennoscandia
To quantitatively analyse this dipole the mean anomalyvalues of the regions southern Greenland (minus5096∘ to minus3478∘longitude 5527∘ to 6688∘ latitude red box over Greenlandin Figure 5) and North Sea (minus346∘ to 934∘ longitude 5193∘to 6182∘ latitude red box over the North Sea in Figure 5) arecalculated and normalised with their standard deviation forthe time series 1958ndash2011 for each of the two dipole regionsThe exponential function of the difference of these values isintroduced as the novel Greenland-North Sea-Dipole-Index(GNDI) Equation (1) provides themathematical definition ofthe GNDI The use of the exponential function is motivatedby the finding that only after the occurrence of notablylarge differences between the geopotential anomalies of thedipole centers extremely sunny and dry summer seasonsoccurred Thus strong anomaly differences need to bestronger emphasized than weaker differences Further theuse of this nonlinear function accounts for the nonlinearnature of the circulation system (see Section 2)
GNDI = exp (119873119860 minus 119866119860) with (1)
119873119860 =
119860
119873
119910
minus 119860
119873
120590119860
119873
(2)
119866119860 =
119860
119866
119910
minus 119860
119866
120590119860
119866
(3)
10
0
20
30
40
GN
DI
1959
1976
1983
2003 2011
1960 1970 1980 1990 2000 2010Year
Figure 6 Time series of the Greenland-North Sea-Dipole-Index
Here 119860 is the anomaly of the geopotential 119860 is thearithmetic mean and 120590119860 is the standard deviation of theanomalies 119866 and119873 depict North Sea and Greenland regionrespectively The time series of the GNDI is shown inFigure 6
The alignment of the GNDI with the heat summer years1976 and 2003 reveals a threshold of gt20 That is in yearswhere theGNDI during FMAexceeds 20 an extremely sunnyand dry summer would be indicated for Central EuropeYears exceeding a GNDI of 20 are 1959 1976 2003 and 2011The FMA season of all the four years exceeding a GNDI of20 shows large positive anomalies of solar irradiation and
6 Advances in Meteorology
large negative anomalies of precipitation in Central Europesee Figures 1 and 2
Two of the years 1976 and 2003 were among thehighly extreme summers regarding high solar irradiationand low precipitation in the time series that is amongthe 10 with the highest solar irradiation amounts and thelowest precipitation amounts (for the definition of highlyextreme summers please refer to Trager-Chatterjee et al[23])
The dipole situation associated with the highly extremesummers may depict a stable solution of the dynamicsassociated with the atmospheric flow This stability in theatmospheric circulation is observed in 1976 and 2003 bythe predominance of the anticyclonic weather conditionsover Central Europe which largely persists from winter-spring transition throughout summer The stable anticyclonedetermines the high (low) solar irradiation (precipitation)amounts Solar irradiation and precipitation in turn deter-mine soil moisture which is an important factor in the devel-opment of strong heat waves [14 39] due to its importance forthe development (or suppression) of convective clouds andprecipitation [23 40]
Thus the findings provide hints for a connection betweenconditions during winter-spring transition of the NorthAtlantic circulation and the following summer season inCentral Europe That is a dipole with negative geopotentialanomaly over Greenland and positive geopotential anomalyover the North SeaFennoscandia during FMA is a valuableindicator for extremely sunny and dry summer seasons inCentral Europe
According to the definition in Trager-Chatterjee et al [23]the summer of 1959 is not among the highly extreme summersbut among the extreme summers that is among the 20withhighest solar irradiation and lowest precipitation amountsand is thus not contradicting the connection describedabove
However the evaluation of heat summers performed inTrager-Chatterjee et al [23] reveals that the GNDI wouldlead to a year with ldquofalse alarmrdquo and one year with a ldquomissedeventrdquo the false alarm year 2011 has a GNDI value clearlyabove the threshold (see Figure 6) which is associated withan extremely sunny and dry FMA season but the followingsummer had close to normal solar irradiation amounts andwas more rainy than usual that is it was by no meansextremely sunny and dry 1983 the yearwith themissed eventhas a GNDI value far below the threshold but the cloudyand wet FMA season has been followed by an extremelysunny and dry summer In the following the former (2011)is referred to as a false alarm and the latter (1983) as a missedevent In 1983 and 2011 the dipole shows a different behaviorthan in 1976 and 2003 In both years (1983 2011) the dipolechanges polarity between FMA and JJA (not shown) Thismight indicate that in these two years the connection ofthe dipole to the following summer is disturbed by anotherinterfering large scale circulation
Indeed in both years the large scale El Nino SouthernOscillation (ENSO) was in an extreme state In 2011 theyear with the false alarm a very strong La Nina event wasrecognized and in 1983 the year with the missed event
1959
1976
1983
2003
2011
1960 1970 1980 1990 2000 2010Year
4
2
0
minus2
minus4
Mea
n BE
STD
J
Figure 7 Time series of the December-January BEST indexaccording to [4]The year dates refer to January of the year indicatedand to December of the year before (eg 1959 refers to December1958 and January 1959) Positive values indicate El Nino eventsnegative values indicate La Nina events The BEST index is extremefor the years with false alarms or missed events according to GNDI
a strong El Nino was recognized which both might haveinfluenced the large scale circulation also in the north-ern hemisphere and thus also the summer conditions inEurope
33 The ENSO Disturbance In the analysis presented twosummers have been found for which the GNDI is not asuitable indicator In 1983 the GNDI indicated a normalsummer but an extremely hot and dry summer occurred afterthe cloudy and rainy FMA (missed event) In 2011 on theother hand the GNDI indicated a hot and dry summer buta summer with relatively ldquonormalrdquo solar radiation and highprecipitation occurred (false alarm)
For 2011 the dipole between Southern Greenland and theNorth SeaFennoscandia exists in FMA but not in JJA (notshown) This means that during that year the atmosphericequilibriumconnection is presumably disturbed (superim-posed) by another effect In 1983 the situation is vice versa adipole is apparent butwith opposite polarity hence theGNDIis close to 0 but the following JJA was extremely hot and dry
As discussed in Trager-Chatterjee et al [23] the missedevent and false alarm are accompanied with strong El NinoSouthern Oscillation (ENSO) events in the winter seasons198283 and 201011 (please see Figure 7)We assume that thisis not a coincidence but that ENSO is the disturbing factorwhich is further discussed and analysed hereafter
It is widely agreed that the El Nino Southern Oscillation(ENSO) is one of the most important [30] and strongest[41] climate patterns of the globe [42] Its impacts are notrestricted to the tropical Pacific but it affects weather andclimate all over the globe [42] A summary description of
Advances in Meteorology 7
ENSO and its impacts on European climate can be found inthe review paper of [30]
Broennimann [30] concludes that ENSO effects onEurope interact with many other mechanisms (eg PacificDecadal Oscillation tropical Atlantic SSTs and NAO) differwith the strength and position of the respective ENSO eventand are modulated by other environmental phenomena suchas volcanic eruptions That is ENSO induced effects onEuropean climate are variable
However some common features appearing during ElNino (La Nina) winters could be identified for Europe morecyclonic (anticyclonic) pressure systems following after ElNino (La Nina) events associated with more (less) precipita-tion over western and Central Europe and the contrary overnorthern Europe [43]
Beside others Lau and Nath [44] and Herceg Bulic andKucharski [45] show that ENSO events could lead to SSTanomalies in the Atlantic As a possible physical explanationof the connection between ENSO events and SST anomaliesin the northern Pacific and Atlantic Lau and Nath [44]describe an ldquoatmospheric bridgerdquo their model experimentsexhibit that a chain of air-sea-interactions resulting fromldquoheat and radiative fluxes at the air-sea interfacerdquo In theirmodel experiments this chain of air-sea-interactions startingin the ENSO region needs 4-months lead time to affect theNorth Atlantic The feedback of the SST anomalies to theweather in Central Europe needs additional time As ENSOevents usually occur around Christmas the ldquoatmosphericbridgerdquo serves as a possible physical explanation for the effectof ENSO on European spring and summer conditions
In summary several authors show clear evidence thatENSO events affect the weather in Central Europe (see [30]and references therein) Thus it is likely that extreme ENSOevents disturbsuperimpose the synoptic connection betweenwinter-spring transition and the subsequent summer Asthe ENSO events in 198283 and 201011 have been notablyextreme it is a self-evident assumption that LaNina has been areason for the normally sunny and rather rainy summer 2011despite the high GNDI value and that EL Nino has been areason for the extremely sunny and dry summer 1983 despitethe low GNDI value Hence the extreme ENSO events arelikely the reason for the ldquofailurerdquo of the GNDI
That is due to the extremely strong ENSO events in 1983and 2011 the climate during summer of those two years isnot a consequence of the prior North Atlantic winter-springconditions Instead the anomalies in both seasons FMA andJJA of these years are likely a consequence of interactionsof the Earth-Ocean-Atmosphere system which was stronglyinfluenced by ENSO induced processes Hence in years withextreme ENSO events the GNDI alone is not suitable toindicate hot and extreme summers
The analysis performed so far indicates that for thedefinition of an indicator for extreme sunny anddry summersthe Greenland-North Sea-Dipole as well as the ENSO hasto be considered Thus the combination of the BEST indexrepresenting ENSO and the GNDI representing the strengthof the Greenland-North Sea-Dipole might lead to an indexwhich can be used to improve the predictability of hot and
dry summers in Central Europe significantlyThis leads to theintroduction of the novel Central European Drought Index(CEDI) which is discussed and evaluated in the followingsection
34The Central European Drought Index (CEDI) To accountfor the ENSO influence on the development of CentralEuropean summer climate as discussed in Section 33 theGNDI is combined with the BEST index a measure of thestate of the ENSO [31] Negative BEST values indicate a LaNina and positive BEST values indicate El Nino events
The combination of GNDI and BEST results in theCentral European Drought Index (CEDI) Several tests weremade to find an appropriate definition of the CEDI aimingat identifying as many of the highly extreme summers aspossible in the time period analysed by the end of April whilekeeping the number of false alarms as low as possible Inall the CEDI definitions presented below the BEST index isconsidered in such a way that only very strong ENSO eventshave an influence on the value of the CEDI This considera-tion results from the findings presented in Section 33 that thefalse alarms and the missed events resulting from the GNDIcoincide with years that followed after very strong ENSOevents (see Section 33 and Figures 6 and 7) This findingcan be explained with the large distance between Europe andthe South Pacific where ENSO occurs That is only verystrong events have the power to send their signal to Europeand are strong enough to not be (completely) masked byother disturbances as discussed in Broennimann [30] In thedefinitions of the CEDI the absolute value of the BEST indexaveraged over the early winter season (December-January)prior to the FMA season to which the GNDI refers is usedUsing the absolute value of BEST has the advantage that thealgebraic sign of CEDI provides information whether GNDI(positive) or ENSO (negative) has been a driving factor forextreme summers
The results of the different CEDI definitions are presentedin the following
CEDIV1 is defined in such a way that the ENSO term isonly applied if the absolute BEST value exceeds 2 In the caseof weaker ENSO events the Greenland-North Sea-Dipoledominates the development of the summer season
CEDIV1 = GNDI minus 100381610038161003816
1003816
1003816
BEST119889119895
1003816
1003816
1003816
1003816
1003816
if 1003816100381610038161003816
1003816
BEST119889119895
1003816
1003816
1003816
1003816
1003816
ge 2
GNDI else(4)
where |BEST119889119895
| is the absolute value of the BEST indexaveraged over the early winter season (December-January)prior to the FMA to which the GNDI refers
The time series of CEDIV1 is shown in the top row ofFigure 8 Even though a distinction between weak and strongevents ismade in this definition theCEDI values hardly differfrom the GNDI values (6) Thus the missed event (1983) andthe false alarm (2011) are not eliminated using this definitionThis is due to the imbalance between GNDI and BESTGNDI is defined as the exponential function of the differencebetween the anomalies of the dipole centers (see Section 32)That is large differences in the geopotential anomaly dipole
8 Advances in Meteorology
1960 1970 1980 1990 2000 2010Year
1959 1976
1983
2003 2011
19591976
1983
2003 2011
19591976
1983
20032011
CEDI1
CEDI2
CEDI3
40
20
0
minus20
CED
I
1960 1970 1980 1990 2000 2010Year
1960 1970 1980 1990 2000 2010Year
40
20
0
minus20
CED
I
40
20
0
minus20
CED
I
Figure 8 Time series of the three different CEDI definitionsdiscussed
result in large values and small differences result in smallvalues However to use an exponential function of the BESTindex as well is not an option since it would depress largenegative values of the BEST index which indicate notable ElNino events
In order to balance between the effect of the Greenland-North Sea-Dipole (expressed in the GNDI) and ENSO(expressed in the BEST term) the power of 2 of the BESTindex is applied Which results in definition of CEDIV2 asfollows
CEDIV2 = GNDI minus 100381610038161003816
1003816
1003816
BEST119889119895
1003816
1003816
1003816
1003816
1003816
2
if 1003816100381610038161003816
1003816
BEST119889119895
1003816
1003816
1003816
1003816
1003816
ge 2
GNDI else(5)
However as can be seen in the time series of CEDIV2(Figure 8 middle row) the power of 2 is still too weak topronounce large ENSO events appropriately
Thus in CEDIV3 the power of 3 of the BEST index isapplied
CEDIV3 = GNDI minus 100381610038161003816
1003816
1003816
BEST119889119895
1003816
1003816
1003816
1003816
1003816
3
if 1003816100381610038161003816
1003816
BEST119889119895
1003816
1003816
1003816
1003816
1003816
ge 2
GNDI else(6)
The time series of the CEDIV3 is shown in the bottom rowof Figure 8 The highly extreme summers 1976 and 2003 areclearly visible as notable extremes and exceed the threshold of20 Also the extreme summer 1959 exceeds a CEDI thresholdof 20 The previously missed event of 1983 can also bepredicted using CEDIV3 and a threshold of minus15 And finally
the false alarm in 2011 is no more occurring since CEDIV3shows a very low value for this year
Based on these results the authors propose to definethe Central European Drought Index (CEDI) following (6)Large positive CEDI values are associated with an extremedipole anomaly in theNorthernAtlantic andhence associatedwith the synoptic scale Large negative values indicate astrong El Nino event as the reason for the extremely hot anddry summer Thus the algebraic sign indicates whether theGreenland-North Sea-Dipole of ENSO is the dominant driverfor the development of the summer season It is obvious thatif CEDI is dominated by very strong El Nino events (negativevalues) a different threshold has to be applied
Due to the low number of extreme summer events in thetime series the CEDI as well as the mentioned thresholdsof 20 and minus15 respectively and the |BEST
119889119895
| threshold of 2cannot be finally evaluated However the skill of CEDI ishigh which supports the discussion and hypothesis outlinedA final evaluation of the CEDI and a final definition of thethreshold used require a larger database At the time thisstudy started the 20th century reanalysis dataset [46] wasnot yet available However this dataset may now be used tofurther evaluate CEDI and GNDI and their influence on thedevelopment of extremely sunny and dry summer seasons inEurope
4 Conclusions
Long lasting anticyclonic circulation anomalies have beendiscussed by several authors as a key factor formid latitudinalsummer heat waves [15ndash18] These circulation anomaliesblock storm tracks and frontal systems (eg [21]) and areoften associated with a large scale stationary Rossby wavepattern (see [14] and references therein) Moreover in thecenter of the anticyclone air parcel trajectories are ldquotrappedrdquocompared to normal summers [22] which is an indicator fora regional Lyapunov stable equilibrium of the atmosphericcirculation
It is likely that long lasting stable atmospheric statesduring summer time have indicators that are visible prior tosummer season
Indeed in Trager-Chatterjee et al [23] evidence hasbeen found that extremely hot and dry summers might beconnected to specific conditions during the winter-springtransitions (February-March-April FMA) namely sunnyand dry conditions in Central EuropeThis connectionmightbe useful to improve the predictability of heat waves
In the present study the atmospheric dynamic on thesynoptic and the global scale has been analysed in orderto gain a deeper knowledge of the winter-spring transition(FMA) and summer (JJA) connection described by Trager-Chatterjee et al and its disturbance Furthermore potentialindices have been evaluated regarding their suitability tosupport the prediction of extremely hot and dry summers inCentral Europe
For this purpose the potential interlink of North AtlanticOscillation (NAO) as well as Arctic Oscillation (AO) withextreme summers in Central Europe has been investigated
Advances in Meteorology 9
No evidence for an interlink of NAO or AO with extremesummers has been found Instead an analysis of the geopo-tential anomaly as proxy for the atmospheric circulation hasled to the introduction of the Greenland-North Sea-Dipole-Index (GNDI) This index is a measure for the strengthof the dipole anomaly in the geopotential at 850 hPa oversouthern Greenland and North SeaFennoscandia It hasbeen discussed that the GNDI serves as an indicator ofapproaching summers with very large positive anomaliesin solar irradiation and very large negative anomalies inprecipitation in Central Europe The GNDI supports theconclusions of Trager-Chatterjee et al 2013 that solar irra-diation and precipitation are an important proxy for thedevelopment of sunny and dry summers the atmosphericpressure regimes which determine the high solar irradiationamounts and the low precipitation amounts have now beenidentified
Hence monitoring of the Greenland-North Sea-Dipoleis expected to improve our knowledge of the North-Atlanticcirculation system and its role for the development ofextreme Central European summers in terms of heat (solarirradiation) and drought While the GNDI indicates the heatsummers in 2003 and 1976 it shows no evidence for the heatsummer 1983 and erroneously indicates 2011
It has been analysed whether these failures are due toglobal scale ENSO disturbances Indeed evidence has beenfound that ENSO is the second main driver for extremesummers on one hand and the disturbance of the GNDIconnection on the other
In order to account for both synoptic scale and globalscale processes a coupled index the Central EuropeanDrought Index (CEDI) is proposed This index considersthe coupling of the dominant processes for the developmentof extreme summers on synoptic and global scale For thesynoptic scale the novel GNDI and for the global scale thewell-established BEST index as ameasure of ENSO are used
With the definition of the CEDI it is possible to indicateall extreme summers during the investigated time period(1956ndash2011) without any false alarm According to the resultspresented the CEDI serves as an indicator of approachingsummers with highly extreme positive anomalies in solarirradiation and highly extreme negative anomalies in precip-itation in Central Europe
However due to the nonlinear nature of the Atmosphere-Ocean system and the (by definition) low frequency of occur-rence of extremes the forecast skill of CEDI cannot yet befinally determined Moreover further empirical adjustmentsof CEDImight be neededThis could for example be done byanalysing reanalysis datasets reaching further back into thepast than the datasets used in this study and by monitoringCEDI in the future Yet for the investigated time periodthe skill of CEDI is close to 1 (no missed event no falsealarm)This is a strong hint that the described coupling of thenorthern hemisphere circulation and ENSO is a key elementfor the understanding and prediction of extremely hot anddry summers in Europe To the knowledge of the authors itis the first time that the coupling of the synoptic northernhemisphere circulation and the ENSO has been expressedin a convenient coupled circulation index Hence although
CEDI might be not finally defined it describes an importantfeature in the development of extremely hot and dry summersin Central Europe
Conflict of Interests
The authors declare that there is no conflict of interestsregarding the publication of this paper
Acknowledgments
The work presented in this paper has been partly funded byEUMETSAT in the context of CM SAF as part of the SatelliteApplication Facilities Network In this study geopotentialdata of the ECMWF reanalysis datasets ERA-40 [25] andERA-interim [26] were used The PC based NAO and AOindices according to Hurrell have been taken from thepages of the NCAR (National Center for AtmosphericResearch)UCAR (University Corporation for AtmosphericResearch) climate data guide (httpsclimatedataguideucaredu) The authors thank the anonymous reviewer fora constructive critique and helpful comments which havesignificantly contributed to improve the paper
References
[1] World Health Organization (WHO) The Solid Facts on Cli-mateChange andHealth 2010 httpwwweurowhoint dataassetspdf file001095815FS ParmaClosurepdf
[2] H-G Muecke and P Becker Klimawandel und GesundheitmdashInformationen zu den gesundheitlichen Auswirkungen somm-erlicher Hitze un d Hitzewellen und Tipps zum vorbeugendenGesundheitsschutz 2008 httpwwwumweltbundesamtdepublikationenratgeber-klimawandel-gesundheit
[3] World Health Organization ldquoProtecting the public and mini-mizing health effects from heat towards the development ofa heat-health action framework for the prefecture of HyogoJapanrdquo Tech Rep WHO 2013
[4] Munich Re Group Geschaftsbericht der Munchener-RuckGruppe 2003 2004
[5] G Lobinger ldquoDer Kafersommerrdquo LWF (Bay Erische Lande-sanstalt fuer Wald und Forstwirtschaft) vol 43 pp 26ndash27 2004httpwwwwaldwissennetwaldwirtschaftschadeninsektenlwf kaefersommerindex DE
[6] P Heck P Zanetti R Enz J Green and S Suter ldquoNaturalcatastrophes andmanmade disasters in 2003rdquo Technical ReportSigma Report 12004 Swisse Re 2004
[7] B Muhr D James B Khazai et al ldquoAnalysis of US extremedrought and record heat 2012rdquo Tech Rep Center for DisasterManagement and Risk Reduction Technology CEDIM 2012httpswwwcedimdedownload20120921usa drought no2pdf
[8] S Gruber M Hoelzle and W Haeberli ldquoPermafrost thaw anddestabilization of Alpine rock walls in the hot summer of 2003rdquoGeophysical Research Letters vol 31 no 13 2004
[9] T N Palmer and D L T Anderson ldquoThe prospects for seasonalforecastingmdasha review paperrdquo Quarterly Journal of the RoyalMeteorological Society vol 120 no 518 pp 755ndash793 1994
10 Advances in Meteorology
[10] A Weisheimer F J Doblas-Reyes T Jung and T N PalmerldquoOn the predictability of the extreme summer 2003 overEuroperdquo Geophysical Research Letters vol 38 no 5 2011
[11] E Dutra M Diamantakis I Tsonevsky et al ldquoThe extremeforecast index at the seasonal scalerdquoAtmospheric Science Lettersvol 14 no 4 pp 256ndash262 2013
[12] V Pavan and F J Doblas-Reyes ldquoCalibrated multi-modelensemble summer temperature predictions over Italyrdquo ClimateDynamics vol 41 no 7-8 pp 2115ndash2132 2013
[13] E Fischer ldquoAutopsy of twomega-heatwavesrdquoNatureGeosciencevol 7 pp 332ndash333 2014
[14] E M Fischer The role of land-atmosphere intera ctions forEuropean summer heat waves past present and future [PhDthesis] ETH Zurich Zurich Switzerland 2007
[15] D Barriopedro E M Fischer J Luterbacher R M Trigo andR Garcıa-Herrera ldquoThe hot summer of 2010 redrawing thetemperature record map of Europerdquo Science vol 332 no 6026pp 220ndash224 2011
[16] A F Carril S Gualdi A Cherchi and A Navarra ldquoHeatwavesin Europe areas of homogeneous variability and links withthe regional to large-scale atmospheric and SSTs anomaliesrdquoClimate Dynamics vol 30 no 1 pp 77ndash98 2008
[17] A Fink T Brucher G Leckebuch J Pinto andU Ulbrich ldquoThe2003 Europe an summer heatwaves and droughtmdashsynopticdiagnosis and impactsrdquo Weather vol 59 no 8 pp 209ndash2162004
[18] M Ionita G Lohmann N Rimbu and P Scholz ldquoDominantmodes of diurnal temperature range variability over Europeand their relationships with large-scale atmospheric circulationand sea surface temperature anomaly patternsrdquo Journal ofGeophysical Research D Atmospheres vol 117 no 15 Article IDD15111 2012
[19] K E Kunkel S A Changnon B C Reinke and R W ArrittldquoThe July 1995 heat wave in the midwest a climatic perspectiveand critical weather factorsrdquo Bulletin of the American Meteoro-logical Society vol 77 no 7 pp 1507ndash1518 1996
[20] M A Palecki S A Changnon and K E Kunkel ldquoThe natureand impacts of the July 1999 heat wave in the midwesternUnited States learning from the lessons of 1995rdquo Bulletin of theAmerican Meteorological Society vol 82 no 7 pp 1353ndash13672001
[21] J M Wallace ldquoMeteorological conditions during heat wavesand droughts in the United States Great Plainsrdquo MonthlyWeather Review vol 115 no 7 pp 1253ndash1269 1987
[22] A Black M Blackburn G Harrison and J Methven ldquoFactorscontributing to the summer 2003 European heatwaverdquoWeathervol 59 pp 217ndash223 2004
[23] C Trager-Chatterjee R W Muller and J Bendix ldquoAnalysis ofextreme summers and prior late winterspring conditions incentral EuroperdquoNatural Hazards and Earth System Science vol13 no 5 pp 1243ndash1257 2013
[24] C Cassou L Terray and A S Phillips ldquoTropical Atlanticinfluence on European heat wavesrdquo Journal of Climate vol 18no 15 pp 2805ndash2811 2005
[25] P Kallberg A Simmons S Uppala and M Fuentes ldquoTheERA-40 archive ECMWF 2005rdquo Tech Rep ERA-40 ProjectReport Series No17 2005 httpwwwecmwfintpublicationslibrarydoreferenceslist192
[26] P Berrisford D Dee K Fielding et al ldquoThe ERA-interimarchiverdquo Technical Report ERA Report Series No 1 ECMWFReading UK 2009 httpwwwecmwfint
[27] D W J Thompson and J M Wallace ldquoThe Arctic oscillationsignature in the wintertime geopotential height and tempera-ture fieldsrdquoGeophysical Research Letters vol 25 no 9 pp 1297ndash1300 1998
[28] J Hurrell and National Center for Atmospheric ResearchStaffTheClimate Data Guide Hurrell North Atlantic Oscillation(NAO) Index (PC-based) 2013 httpsclimatedataguideucareduclimate-datahurrell-north-atlantic-oscillation-nao-index-pc-based
[29] J Hurrell et al The Climate Data Guide Hurrell wintertimeSLP-based Northern Annular Mode (NAM) Index 2013httpsclimatedataguideucareduclimate-datahurrell-winter-time-slp-based-northern-annular-mode-nam-index
[30] S Broennimann ldquoImpact of El Nino-Southern Oscillation onEuropean climaterdquo Reviews of Geophysics vol 45 no 3 ArticleID RG3003 2007
[31] C Smith and P Sardeshmukh ldquoThe Effect of ENSO on theintraseasonal variance of surface temperature in winterrdquo Inter-national Journal of Climatology vol 20 pp 1543ndash1557 2000
[32] A G Barnston and R E Livezey ldquoClassification seasonalityand persistence of low-frequency atmospheric circulation pat-ternsrdquo Monthly Weather Review vol 115 no 6 pp 1083ndash11261987
[33] J W Hurrell and C Deser ldquoNorth Atlantic climate variabilitythe role of the North Atlantic Oscillationrdquo Journal of MarineSystems vol 79 no 3-4 pp 231ndash244 2010
[34] GWalker and E Bliss ldquoWorld weather VrdquoMemoirs of the RoyalMeteorological Society vol 4 no 36 pp 53ndash85 1932
[35] K Walter and H F Graf ldquoThe North Atlantic variabilitystructure storm tracks and precipitation depending on thepolar vortex strengthrdquo Atmospheric Chemistry and Physics vol5 no 1 pp 239ndash248 2005
[36] M Ogi K Yamazaki and Y Tachibana ldquoThe summertimeannular mode in the Northern Hemisphere and its linkage tothe winter moderdquo Journal of Geophysical Research D Atmo-spheres vol 109 no D20 article 27 2004
[37] A Czaja A Robertson and T Huck ldquoThe role of Atlanticocean-atmosphere coupling in affecting North Atlantic Oscil-lation variabilityrdquo in The North Atlantic Oscillation ClimaticSignificance and Environmental Impact JWHurrell Y KushnirG Ottersen and M Visbeck Eds vol 134 of AGU GeophysicalMonograph pp 147ndash172 Wiley New York NY USA 2003
[38] M Rodwell ldquoOn the predictability of the north atlantic climaterdquoin The North Atlantic Oscillation Climatic Significance andEnvrionmental Impact J W Hurrell Y Kushnir G Ottersenand M Visbeck Eds vol 134 of AGU Geophysical Monographpp 173ndash192 2003
[39] M Hirschi S I Seneviratne V Alexandrov et al ldquoObserva-tional evidence for soil-moisture impact on hot extremes inSoutheastern Europerdquo Nature Geoscience vol 4 no 1 pp 17ndash21 2011
[40] M Zampieri F DrsquoAndrea R Vautard P Ciais N De Noblet-Ducoudre and P Yiou ldquoHot European summers and the roleof soil moisture in the propagation of mediterranean droughtrdquoJournal of Climate vol 22 no 18 pp 4747ndash4758 2009
[41] H-F Graf and D Zanchetin ldquoCentral Pacific El Nino the ldquosub-tropical bridgerdquo and Eurasian climaterdquo Journal of GeophysicalResearch Atmospheres vol 117 no 1 2012
[42] K Trenberth ldquoGeneral characteristics of El Nino-SouthernOscillationrdquo in Teleconnections Linking Worldwide ClimateAnomalies M H Glant Ed pp 13ndash42 Cambridge UniversityPress Cambridge UK 1991
Advances in Meteorology 11
[43] K Fraedrich and K Muller ldquoClimate anomalies in Europeassociated with ENSO extremesrdquo International Journal of Cli-matology vol 12 no 1 pp 25ndash31 1992
[44] N C Lau and M J Nath ldquoThe role of the ldquoatmospheric bridgerdquoin linking tropical pacific ENSO events to extratropical SSTanomaliesrdquo Journal of Climate vol 9 no 9 pp 2036ndash2057 1996
[45] I Herceg Bulic and F Kucharski ldquoDelayed ENSO impacton spring precipitation over NorthAtlantic European regionrdquoClimate Dynamics vol 38 no 11-12 pp 2593ndash2612 2012
[46] G P Compo J S Whitaker P D Sardeshmukh et al ldquoThetwentieth century reanalysis projectrdquo Quarterly Journal of theRoyal Meteorological Society vol 137 no 654 pp 1ndash28 2011
Submit your manuscripts athttpwwwhindawicom
Hindawi Publishing Corporationhttpwwwhindawicom Volume 2014
ClimatologyJournal of
EcologyInternational Journal of
Hindawi Publishing Corporationhttpwwwhindawicom Volume 2014
EarthquakesJournal of
Hindawi Publishing Corporationhttpwwwhindawicom Volume 2014
Hindawi Publishing Corporationhttpwwwhindawicom
Applied ampEnvironmentalSoil Science
Volume 2014
Mining
Hindawi Publishing Corporationhttpwwwhindawicom Volume 2014
Journal of
Hindawi Publishing Corporation httpwwwhindawicom Volume 2014
International Journal of
Geophysics
OceanographyInternational Journal of
Hindawi Publishing Corporationhttpwwwhindawicom Volume 2014
Journal of Computational Environmental SciencesHindawi Publishing Corporationhttpwwwhindawicom Volume 2014
Journal ofPetroleum Engineering
Hindawi Publishing Corporationhttpwwwhindawicom Volume 2014
GeochemistryHindawi Publishing Corporationhttpwwwhindawicom Volume 2014
Journal of
Atmospheric SciencesInternational Journal of
Hindawi Publishing Corporationhttpwwwhindawicom Volume 2014
OceanographyHindawi Publishing Corporationhttpwwwhindawicom Volume 2014
Advances in
Hindawi Publishing Corporationhttpwwwhindawicom Volume 2014
MineralogyInternational Journal of
Hindawi Publishing Corporationhttpwwwhindawicom Volume 2014
MeteorologyAdvances in
The Scientific World JournalHindawi Publishing Corporation httpwwwhindawicom Volume 2014
Paleontology JournalHindawi Publishing Corporationhttpwwwhindawicom Volume 2014
ScientificaHindawi Publishing Corporationhttpwwwhindawicom Volume 2014
Hindawi Publishing Corporationhttpwwwhindawicom Volume 2014
Geological ResearchJournal of
Hindawi Publishing Corporationhttpwwwhindawicom Volume 2014
Geology Advances in
2 Advances in Meteorology
Earth-Atmosphere-System has a larger influence on weatherregimes than low frequence oscillations whereas the formerare more difficult to capture in seasonal prediction than thelatter
Especially the prediction of extreme summers in extra-tropical regions like the one in 2003 in Europe remainschallenging [10]
To enhance the skill of the prediction of the summerseason in extratropical regions is the goal of various researchapproaches For example Dutra et al [11] developed the ext-reme forecast index (EFI) for the seasonal scale By scaling theensemble forecast of the ECMWF seasonal forecast systemS4 of 2-m temperature and precipitation with respect to themodel climate the EFI measures the departure of the meanmodel climate and the actual forecast However an evaluationof the performance of EFI is currently not available
Pavan and Doblas-Reyes [12] suggest a method to cali-brate model outputs with observational climate indices usingprincipal component analysis to enhance the prediction ofsummer maximum temperature over Italy The method isbased on the finding that persistent extreme temperatureevents during summer develop due to a linkage betweenlarge-scale circulation anomalies and local climate anoma-lies Pavan and Doblas-Reyes [12] conclude that wheneverdynamical forecast systems capture large-scale patterns withrelevance to local climate anomalies their proposed calibra-tion method ldquoleads to more skilful and reliable predictionsrdquoThis finding supports the fact that seasonal prediction ispossible because low frequency oscillations that is large scalepatterns influence regional climate on the seasonal scale asmentioned above
However the origin of the issue to reliably forecastextremely hot summers on the seasonal scale is the knowl-edge gap of the processes behind the development leading tothese extremes [13] To close this gap it is essential to analyseextremely hot summers and the meteorological situation intheir preceding time frame The severe impact of the heatsummer 2003 in Europe might be one reason why heat wavesattracted wide interest both in the public and the scientificcommunity and this event has been analyzed in detail fromvarious disciplines (see [14] and references therein)
Several authors have analysed and discussed the devel-opment and origin of heat waves within the scope of mete-orology Long lasting anticyclonic circulation anomalies havebeen discussed by several authors as a key factor for midlatitudinal summer heat waves [15ndash18] The European 2003heat wave [14] as well as the 1995 and 1999 heat wave overthe US [19 20] was characterised by 500 hPa geopotentialanomaly patterns The anticyclonic anomalies are associatedwith clear skies and subsequent heating of the Earth by solarsurface irradiationThis in turn generates stable atmosphericstratification which suppresses local convection
Furthermore circulation anomalies as blocking stormtracks and frontal systems (eg [21]) are often associatedwith a large scale stationary Rossby wave pattern Fischer (see[14] and references therein) In stable anticyclones trajectoriesof air parcels are bounded to the core of the cyclone in amanner that the area covered by the trajectories is muchsmaller than in typical summer years [22] Air parcels are
ldquotrappedrdquo in the anticyclone This behavior indicates a Lya-punov stable equilibrium state of the atmospheric circulationin this region Extreme heat summers are characterised bylong lasting stable situations which also indicates that theatmospheric circulation is in a regional equilibrium For suchextraordinary stable atmospheric states it could be expectedthat a specific atmospheric precursor (initial state) mightindicate the occurrence of extremely hot and dry summersSuch an indicator could be used to issue early warnings
Indeed empirical hints have been found that a precursor[23] of extreme summers in Central Europe exists and that anearly prediction of heat summers might thus be possible
Trager-Chatterjee et al [23] showed that extremely sunnyand dry summer seasons (June-July-August JJA) in CentralEurope are preceded by winter-spring transition seasons(February-March-April FMA) with large positive (negative)anomalies of solar irradiation (precipitation) if the El NinoSouthern Oscillation (ENSO) is not notably extreme
In this study the summers (June-July-August JJA) withthe highest (lowest) values of solar irradiance (precipitation)have been defined as extremely sunny and dry leading tosevere heat waves Within this scope the summers of theyears 1976 1983 and 2003 have been identified as notablyextreme Notably extreme means that the regional meansof the seasonal sums of solar irradiation are within theupper 10 and the regional means of the seasonal sumsof precipitation are within the lower 10 of the time-series analysed Trager-Chatterjee et al [23] investigated alsothe winter-spring transition February-March-April (FMA)prior to the abovementioned summer (June-July-August JJA)seasons in Central EuropeThey found that FMA in 1976 and2003were characterised by positive anomalies of geopotentialin 850 hPa and solar irradiance and by negative anomaliesin precipitation Trager-Chatterjee et al [23] conclude that aclear connection between the sunny and dry FMA seasonsand the following extreme summers in 1976 and 2003 existsIn 1983 a strong ENSO event is observed instead of aldquoregionalrdquo FMA-JJA connection Figures 1 and 2 show theanomalies of solar surface irradiance and precipitation for therespective period
Based on the findings described above the authors claimthat the stable state during extreme summer heat waves inCentral Europe is associated with specific and unique initialatmospheric conditions (precursor) in the preceding winter-spring period Consequently it is hypothesised that winter-spring indicators of atmospheric circulations can be used forseasonal predictions of extreme summer heat waves
In this paper a newly identified large-scale circulationanomaly responsible for the development of extreme sum-mers in terms of solar irradiation excess and precipitationdeficit in Germany and adjacent regions is described Thepaper thus contributes to a better understanding of thedevelopment of extreme summers in Europe In general theresults support the findings of other authors (eg [12 1424]) that the occurrence of persistent extreme temperaturesis favored by certain large-scale circulation anomalies inconnection with localregional climate anomalies How-ever in the present paper the Central European DroughtIndex (CEDI) is introduced which can be calculated with
Advances in Meteorology 3
1958
1962
1966
1970
1974
1978
1982
1986
1990
1994
1998
2002
2006
2010
1976
1983 20
03
1959 20
11
Anomaly FMAAnomaly JJA
150
100
50
0
minus50
minus100
minus150
Ano
mal
y so
lar i
rrad
iatio
n (W
mminus2)
Figure 1 Anomalies of the seasons regional mean (SRM fordefinition please refer to Trager-Chatterjee et al [23]) of solarirradiation [Wmminus2] during winter-spring transition season FMA(green) and summer season JJA (red) in all years of the time series1958ndash2011 Years marked with their number had (highly) extremeanomalies in FMA andor JJA Figure taken from Trager-Chatterjeeet al [23]
one-month lead time prior to the onset of the event usinganalysis data of geopotential and the Bivariate ENSO IndexTime series (BEST) representing the status of the ENSOConsequently nomodel forecasts would be necessary to issueearly warnings of extremely hot and dry summers in CentralEurope Furthermore compared to other seasonal predictionmethods (eg see above) the index is easy to apply
2 Materials and Methods
This study follows the definition and selection of extremelysunny and dry summers of Trager-Chatterjee et al [23]according to extremes in solar radiation and precipitationThose summers showing the highest amounts of solarirradiation and (at the same time) the lowest amounts ofprecipitation in the time series investigated are defined asextreme Please refer to Trager-Chatterjee et al [23] forfurther details about the data sources andmethodsThe sametime period (1958ndash2011) as in Trager-Chatterjee et al [23]is investigated here in order to discuss potential precursorof extremely sunny and dry summers by analysis of theatmospheric circulation
The atmospheric circulation of the Earth is characterizedby a complex nonlinear system of coupled differential equa-tions which is not closed and hence not solvable withoutapproximations and simplifications Frequently used analysismethods in the atmospheric sciences such as EmpiricalOrthogonal Functions (EOF)Principal Component Analysis(PCA) are linked with an implicit linearisation of the systemwhich might cover significant processes within the scope ofextremes However according to the understanding of theauthors it is necessary to consider the nonlinearity of theglobal circulation system to improve the understanding of itsprocesses Based on these considerations an extensive empir-ical analysis of the system is presented in this paper together
1958
1961
1964
1967
1970
1973
1976
1979
1982
1985
1988
1991
1994
1997
2000
2003
2006
2009
Anomaly FMAAnomaly JJA
1959
1976 19
83 2003
2011
150
100
50
0
minus50
minus100
minus150
Ano
mal
y pr
ecip
itatio
n (m
mlowast
mon
thminus1)
Figure 2 Anomalies of the seasons regional mean (SRM for def-inition please refer to Trager-Chatterjee et al [23]) of precipitation[mmmonth] during winter-spring transition season FMA (green)and summer season JJA (red) in all years of the time series 1958ndash2011Years marked with their number had (highly) extreme anomalies inFMA andor JJA Figure taken from Trager-Chatterjee et al [23]
with a discussion and investigation of established indicesdescribing the conditions of well-known large scale climateoscillations such as the North Atlantic Oscillation (NAO)the Arctic Oscillation (AO) and the El NinoSouthernOscillation (ENSO)The results of these investigations lead tothe definition of two novel indices using nonlinear relations
For the definition of these novel indices the geopotentialat 850 hPa provided by the European Center for MediumRange Weather Forecast (ECMWF) is analysed The 40-yearreanalysis dataset ERA-40 [25] for the period 1958ndash1988 andthe ERA-Interim dataset [26] for 1989ndash2011 are used
The North Atlantic Oscillation (NAO) and the ArcticOscillation (AO) (Arctic Oscillation (AO) is described byThompson and Wallace [27] as a seesaw of see level pressure(atmospheric mass) ldquobetween the Arctic basin and parts ofthe surrounding ringrdquo) are very important for the weatherand climate in Central Europe and theNorth Atlantic Hencethe well-established NAO and AO indices according to Hur-rell et al [28 29] are discussed in Section 31 Further a newindicator a distinct pressure difference index is introducedin Section 32This index results from analysis of geopotentialfields at 850 hPa and aims at describing a potential precursorof extremely sunny and dry summers in Central EuropeThis index covers circulations on the synoptic scale onlyHowever extreme summers might also be affected by globalscale circulations
Several authors discussed the effect of the El NinoSouthern Oscillation (ENSO) on the seasonal climate inEurope (see [30] and references therein) Therefore ENSOrsquospotential role on the development of European heat summersis discussed and analysed in Section 33 using the BEST indexaccording to Smith and Sardeshmukh [31]The analysis of theBEST index leads to the postulation of a further novel indexwhich aims at coupling the synoptic scale and the global scaleThis is discussed in Section 34
4 Advances in Meteorology
1959
1976
1983
2003
2011
1960 1970 1980 1990 2000 2010Year
2
1
0
minus1
minus2
Mea
n N
AO D
JFM
Figure 3 Time series of Hurrellrsquos North Atlantic Oscillationindex for December-January-February-March based on PrincipalComponent Analysis [28]
3 Results and Discussions
31 North Atlantic Oscillation and Arctic Oscillation TheNorth Atlantic Oscillation is widely accepted as the mostimportant circulation pattern in the northern hemisphere(eg [32ndash35]) According to several authors the NAO isclosely associated with the Atlantic storm track in terms ofits strength and direction (see [35] and references therein)During summer the NAO is not as pronounced as duringwinter Consequently its dominance on European weatherduring winter is stronger than during summer (eg [24 3334])
On the other hand [36] found that NAOAO conditionsin winter are highly correlated with pressure anomalies overthe British Isles in summer
A reason for this correlation might be that strong win-tertime NAO ldquocan interact with the slower components ofthe climate system (the ocean ) to leave persistent surfaceanomalies into the ensuing parts of the year that maysignificantly influence the evolution of the climate rdquo ([3738] both in [33])
Thus to investigate whether NAOAO indices might beuseful for the prediction of summer heat waves we analysedthe behavior of the NAO and the AO in the time series 1958ndash2011
For the NAO the PCA based seasonal NAO index(December-January-February-March DJFM) according toHurrell et al [28] is used (see Figure 3) This index isavailable from the NCAR (National Center for AtmosphericResearch)UCAR (University Corporation for AtmosphericResearch) climate data guide homepage (see http link in[28]) In contrast to station based NAO indices the PCAbased index accounts for the movement of the NAO pressurecentersAzoresHigh andAtlantic Low [28]This is regarded asan advantage compared to the station based indices since the
1960 1970 1980 1990 2000 2010Year
1959
1976
1983
2003 20
11
3
2
1
0
minus1
minus2
Mea
n AO
DJF
M
Figure 4 Time series of Hurrellrsquos Arctic Oscillation index forDecember-January-February-March based on Principal Compo-nent Analysis [29]
PCA based index covers most of the Atlantic (20ndash80∘N and90∘Wto 40∘E) and thus captures the action centers regardlessof their actual position
Figure 3 reveals that the years of the summer seasonsidentified as being extremely sunny and dry do not showcharacteristic NAO index values indicating that the NAOis not suited as an indicator of extreme summer heat wavesahead
The same holds for the AO To analyse the ArcticOscillation as a possible predictor of extremely sunny and drysummers in Central Europe the wintertime (DJFM) ArcticOscillation index (also referred to as ldquoNorthern AnnularModerdquo) according to Hurrell at al [29] published at NCARUCAR climate data guide homepage (please see http link in[29]) is usedThis index refers not only to the North Atlantic(as the NAO) but to the entire northern hemisphere sea levelpressure and is defined as the first EOF of the latter [29] Alsoin the time series of the AO index no threshold value can beidentified for the years with highly extreme sunny and drysummer seasons see Figure 4
The analysis of NAO and AO provides no hints that theymight be appropriate indicators for extremely sunny and drysummers in Central Europe
32 Greenland-North Sea-Dipole-Index (GNDI) Since noexplicit connection between the NAOAO and the occur-rence of extremely sunny and dry FMA seasons and thefollowing extreme JJA seasons in Central Europe could befound in the data the atmospheric circulation over theNorth Atlantic has been analysed using the geopotential at850 hPa In the years with notably extreme sunny and dryFMA seasons a conspicuous dipole structure of anomaliesbetween southern Greenland (negative pressure anomaly)and theNorth SeaFennoscandia (positive pressure anomaly)has been found Figure 5 shows an example of this dipole in
Advances in Meteorology 5
20
40
60
801000
500
0
minus500
minus1000
(m2s2
)
minus150 minus50 0 50 150
minus200 minus200
Latit
ude (
∘N
)
Longitude (∘E)
FMA 2003
minus600
minus400
0
0
0
0
200
200
400
minus200
(a)
600
minus200
20
40
60
80
minus200
minus200
0
0
0
0
200
200
400
1000
500
0
minus500
minus1000
(m2s2
)
minus150 minus50 0 50 150
FMA 2005
Latit
ude (
∘N
)
Longitude (∘E)
(b)
Figure 5 Example of the dipole geopotential anomaly at 850 hPa of FMA for 2003 and 2005 In FMA prior to the European hot summer of2003 the dipole is clearly apparent (left map) while in the relatively normal year 2005 it is not apparent (right map) The red boxes indicatethe regions that are always captured by anomalies of the same direction prior to the extreme summers in Central Europe
comparison to a year with normal winterspring and summerconditions
In contrast to the NAO which is generally described asa meridional pressure gradient over the North Atlantic [33]the FMA geopotential anomaly maps prior to the extremesummers (eg the year 2003 shown in Figure 5) rather showa zonal pressure gradient between southern Greenland andthe North SeaFennoscandia
To quantitatively analyse this dipole the mean anomalyvalues of the regions southern Greenland (minus5096∘ to minus3478∘longitude 5527∘ to 6688∘ latitude red box over Greenlandin Figure 5) and North Sea (minus346∘ to 934∘ longitude 5193∘to 6182∘ latitude red box over the North Sea in Figure 5) arecalculated and normalised with their standard deviation forthe time series 1958ndash2011 for each of the two dipole regionsThe exponential function of the difference of these values isintroduced as the novel Greenland-North Sea-Dipole-Index(GNDI) Equation (1) provides themathematical definition ofthe GNDI The use of the exponential function is motivatedby the finding that only after the occurrence of notablylarge differences between the geopotential anomalies of thedipole centers extremely sunny and dry summer seasonsoccurred Thus strong anomaly differences need to bestronger emphasized than weaker differences Further theuse of this nonlinear function accounts for the nonlinearnature of the circulation system (see Section 2)
GNDI = exp (119873119860 minus 119866119860) with (1)
119873119860 =
119860
119873
119910
minus 119860
119873
120590119860
119873
(2)
119866119860 =
119860
119866
119910
minus 119860
119866
120590119860
119866
(3)
10
0
20
30
40
GN
DI
1959
1976
1983
2003 2011
1960 1970 1980 1990 2000 2010Year
Figure 6 Time series of the Greenland-North Sea-Dipole-Index
Here 119860 is the anomaly of the geopotential 119860 is thearithmetic mean and 120590119860 is the standard deviation of theanomalies 119866 and119873 depict North Sea and Greenland regionrespectively The time series of the GNDI is shown inFigure 6
The alignment of the GNDI with the heat summer years1976 and 2003 reveals a threshold of gt20 That is in yearswhere theGNDI during FMAexceeds 20 an extremely sunnyand dry summer would be indicated for Central EuropeYears exceeding a GNDI of 20 are 1959 1976 2003 and 2011The FMA season of all the four years exceeding a GNDI of20 shows large positive anomalies of solar irradiation and
6 Advances in Meteorology
large negative anomalies of precipitation in Central Europesee Figures 1 and 2
Two of the years 1976 and 2003 were among thehighly extreme summers regarding high solar irradiationand low precipitation in the time series that is amongthe 10 with the highest solar irradiation amounts and thelowest precipitation amounts (for the definition of highlyextreme summers please refer to Trager-Chatterjee et al[23])
The dipole situation associated with the highly extremesummers may depict a stable solution of the dynamicsassociated with the atmospheric flow This stability in theatmospheric circulation is observed in 1976 and 2003 bythe predominance of the anticyclonic weather conditionsover Central Europe which largely persists from winter-spring transition throughout summer The stable anticyclonedetermines the high (low) solar irradiation (precipitation)amounts Solar irradiation and precipitation in turn deter-mine soil moisture which is an important factor in the devel-opment of strong heat waves [14 39] due to its importance forthe development (or suppression) of convective clouds andprecipitation [23 40]
Thus the findings provide hints for a connection betweenconditions during winter-spring transition of the NorthAtlantic circulation and the following summer season inCentral Europe That is a dipole with negative geopotentialanomaly over Greenland and positive geopotential anomalyover the North SeaFennoscandia during FMA is a valuableindicator for extremely sunny and dry summer seasons inCentral Europe
According to the definition in Trager-Chatterjee et al [23]the summer of 1959 is not among the highly extreme summersbut among the extreme summers that is among the 20withhighest solar irradiation and lowest precipitation amountsand is thus not contradicting the connection describedabove
However the evaluation of heat summers performed inTrager-Chatterjee et al [23] reveals that the GNDI wouldlead to a year with ldquofalse alarmrdquo and one year with a ldquomissedeventrdquo the false alarm year 2011 has a GNDI value clearlyabove the threshold (see Figure 6) which is associated withan extremely sunny and dry FMA season but the followingsummer had close to normal solar irradiation amounts andwas more rainy than usual that is it was by no meansextremely sunny and dry 1983 the yearwith themissed eventhas a GNDI value far below the threshold but the cloudyand wet FMA season has been followed by an extremelysunny and dry summer In the following the former (2011)is referred to as a false alarm and the latter (1983) as a missedevent In 1983 and 2011 the dipole shows a different behaviorthan in 1976 and 2003 In both years (1983 2011) the dipolechanges polarity between FMA and JJA (not shown) Thismight indicate that in these two years the connection ofthe dipole to the following summer is disturbed by anotherinterfering large scale circulation
Indeed in both years the large scale El Nino SouthernOscillation (ENSO) was in an extreme state In 2011 theyear with the false alarm a very strong La Nina event wasrecognized and in 1983 the year with the missed event
1959
1976
1983
2003
2011
1960 1970 1980 1990 2000 2010Year
4
2
0
minus2
minus4
Mea
n BE
STD
J
Figure 7 Time series of the December-January BEST indexaccording to [4]The year dates refer to January of the year indicatedand to December of the year before (eg 1959 refers to December1958 and January 1959) Positive values indicate El Nino eventsnegative values indicate La Nina events The BEST index is extremefor the years with false alarms or missed events according to GNDI
a strong El Nino was recognized which both might haveinfluenced the large scale circulation also in the north-ern hemisphere and thus also the summer conditions inEurope
33 The ENSO Disturbance In the analysis presented twosummers have been found for which the GNDI is not asuitable indicator In 1983 the GNDI indicated a normalsummer but an extremely hot and dry summer occurred afterthe cloudy and rainy FMA (missed event) In 2011 on theother hand the GNDI indicated a hot and dry summer buta summer with relatively ldquonormalrdquo solar radiation and highprecipitation occurred (false alarm)
For 2011 the dipole between Southern Greenland and theNorth SeaFennoscandia exists in FMA but not in JJA (notshown) This means that during that year the atmosphericequilibriumconnection is presumably disturbed (superim-posed) by another effect In 1983 the situation is vice versa adipole is apparent butwith opposite polarity hence theGNDIis close to 0 but the following JJA was extremely hot and dry
As discussed in Trager-Chatterjee et al [23] the missedevent and false alarm are accompanied with strong El NinoSouthern Oscillation (ENSO) events in the winter seasons198283 and 201011 (please see Figure 7)We assume that thisis not a coincidence but that ENSO is the disturbing factorwhich is further discussed and analysed hereafter
It is widely agreed that the El Nino Southern Oscillation(ENSO) is one of the most important [30] and strongest[41] climate patterns of the globe [42] Its impacts are notrestricted to the tropical Pacific but it affects weather andclimate all over the globe [42] A summary description of
Advances in Meteorology 7
ENSO and its impacts on European climate can be found inthe review paper of [30]
Broennimann [30] concludes that ENSO effects onEurope interact with many other mechanisms (eg PacificDecadal Oscillation tropical Atlantic SSTs and NAO) differwith the strength and position of the respective ENSO eventand are modulated by other environmental phenomena suchas volcanic eruptions That is ENSO induced effects onEuropean climate are variable
However some common features appearing during ElNino (La Nina) winters could be identified for Europe morecyclonic (anticyclonic) pressure systems following after ElNino (La Nina) events associated with more (less) precipita-tion over western and Central Europe and the contrary overnorthern Europe [43]
Beside others Lau and Nath [44] and Herceg Bulic andKucharski [45] show that ENSO events could lead to SSTanomalies in the Atlantic As a possible physical explanationof the connection between ENSO events and SST anomaliesin the northern Pacific and Atlantic Lau and Nath [44]describe an ldquoatmospheric bridgerdquo their model experimentsexhibit that a chain of air-sea-interactions resulting fromldquoheat and radiative fluxes at the air-sea interfacerdquo In theirmodel experiments this chain of air-sea-interactions startingin the ENSO region needs 4-months lead time to affect theNorth Atlantic The feedback of the SST anomalies to theweather in Central Europe needs additional time As ENSOevents usually occur around Christmas the ldquoatmosphericbridgerdquo serves as a possible physical explanation for the effectof ENSO on European spring and summer conditions
In summary several authors show clear evidence thatENSO events affect the weather in Central Europe (see [30]and references therein) Thus it is likely that extreme ENSOevents disturbsuperimpose the synoptic connection betweenwinter-spring transition and the subsequent summer Asthe ENSO events in 198283 and 201011 have been notablyextreme it is a self-evident assumption that LaNina has been areason for the normally sunny and rather rainy summer 2011despite the high GNDI value and that EL Nino has been areason for the extremely sunny and dry summer 1983 despitethe low GNDI value Hence the extreme ENSO events arelikely the reason for the ldquofailurerdquo of the GNDI
That is due to the extremely strong ENSO events in 1983and 2011 the climate during summer of those two years isnot a consequence of the prior North Atlantic winter-springconditions Instead the anomalies in both seasons FMA andJJA of these years are likely a consequence of interactionsof the Earth-Ocean-Atmosphere system which was stronglyinfluenced by ENSO induced processes Hence in years withextreme ENSO events the GNDI alone is not suitable toindicate hot and extreme summers
The analysis performed so far indicates that for thedefinition of an indicator for extreme sunny anddry summersthe Greenland-North Sea-Dipole as well as the ENSO hasto be considered Thus the combination of the BEST indexrepresenting ENSO and the GNDI representing the strengthof the Greenland-North Sea-Dipole might lead to an indexwhich can be used to improve the predictability of hot and
dry summers in Central Europe significantlyThis leads to theintroduction of the novel Central European Drought Index(CEDI) which is discussed and evaluated in the followingsection
34The Central European Drought Index (CEDI) To accountfor the ENSO influence on the development of CentralEuropean summer climate as discussed in Section 33 theGNDI is combined with the BEST index a measure of thestate of the ENSO [31] Negative BEST values indicate a LaNina and positive BEST values indicate El Nino events
The combination of GNDI and BEST results in theCentral European Drought Index (CEDI) Several tests weremade to find an appropriate definition of the CEDI aimingat identifying as many of the highly extreme summers aspossible in the time period analysed by the end of April whilekeeping the number of false alarms as low as possible Inall the CEDI definitions presented below the BEST index isconsidered in such a way that only very strong ENSO eventshave an influence on the value of the CEDI This considera-tion results from the findings presented in Section 33 that thefalse alarms and the missed events resulting from the GNDIcoincide with years that followed after very strong ENSOevents (see Section 33 and Figures 6 and 7) This findingcan be explained with the large distance between Europe andthe South Pacific where ENSO occurs That is only verystrong events have the power to send their signal to Europeand are strong enough to not be (completely) masked byother disturbances as discussed in Broennimann [30] In thedefinitions of the CEDI the absolute value of the BEST indexaveraged over the early winter season (December-January)prior to the FMA season to which the GNDI refers is usedUsing the absolute value of BEST has the advantage that thealgebraic sign of CEDI provides information whether GNDI(positive) or ENSO (negative) has been a driving factor forextreme summers
The results of the different CEDI definitions are presentedin the following
CEDIV1 is defined in such a way that the ENSO term isonly applied if the absolute BEST value exceeds 2 In the caseof weaker ENSO events the Greenland-North Sea-Dipoledominates the development of the summer season
CEDIV1 = GNDI minus 100381610038161003816
1003816
1003816
BEST119889119895
1003816
1003816
1003816
1003816
1003816
if 1003816100381610038161003816
1003816
BEST119889119895
1003816
1003816
1003816
1003816
1003816
ge 2
GNDI else(4)
where |BEST119889119895
| is the absolute value of the BEST indexaveraged over the early winter season (December-January)prior to the FMA to which the GNDI refers
The time series of CEDIV1 is shown in the top row ofFigure 8 Even though a distinction between weak and strongevents ismade in this definition theCEDI values hardly differfrom the GNDI values (6) Thus the missed event (1983) andthe false alarm (2011) are not eliminated using this definitionThis is due to the imbalance between GNDI and BESTGNDI is defined as the exponential function of the differencebetween the anomalies of the dipole centers (see Section 32)That is large differences in the geopotential anomaly dipole
8 Advances in Meteorology
1960 1970 1980 1990 2000 2010Year
1959 1976
1983
2003 2011
19591976
1983
2003 2011
19591976
1983
20032011
CEDI1
CEDI2
CEDI3
40
20
0
minus20
CED
I
1960 1970 1980 1990 2000 2010Year
1960 1970 1980 1990 2000 2010Year
40
20
0
minus20
CED
I
40
20
0
minus20
CED
I
Figure 8 Time series of the three different CEDI definitionsdiscussed
result in large values and small differences result in smallvalues However to use an exponential function of the BESTindex as well is not an option since it would depress largenegative values of the BEST index which indicate notable ElNino events
In order to balance between the effect of the Greenland-North Sea-Dipole (expressed in the GNDI) and ENSO(expressed in the BEST term) the power of 2 of the BESTindex is applied Which results in definition of CEDIV2 asfollows
CEDIV2 = GNDI minus 100381610038161003816
1003816
1003816
BEST119889119895
1003816
1003816
1003816
1003816
1003816
2
if 1003816100381610038161003816
1003816
BEST119889119895
1003816
1003816
1003816
1003816
1003816
ge 2
GNDI else(5)
However as can be seen in the time series of CEDIV2(Figure 8 middle row) the power of 2 is still too weak topronounce large ENSO events appropriately
Thus in CEDIV3 the power of 3 of the BEST index isapplied
CEDIV3 = GNDI minus 100381610038161003816
1003816
1003816
BEST119889119895
1003816
1003816
1003816
1003816
1003816
3
if 1003816100381610038161003816
1003816
BEST119889119895
1003816
1003816
1003816
1003816
1003816
ge 2
GNDI else(6)
The time series of the CEDIV3 is shown in the bottom rowof Figure 8 The highly extreme summers 1976 and 2003 areclearly visible as notable extremes and exceed the threshold of20 Also the extreme summer 1959 exceeds a CEDI thresholdof 20 The previously missed event of 1983 can also bepredicted using CEDIV3 and a threshold of minus15 And finally
the false alarm in 2011 is no more occurring since CEDIV3shows a very low value for this year
Based on these results the authors propose to definethe Central European Drought Index (CEDI) following (6)Large positive CEDI values are associated with an extremedipole anomaly in theNorthernAtlantic andhence associatedwith the synoptic scale Large negative values indicate astrong El Nino event as the reason for the extremely hot anddry summer Thus the algebraic sign indicates whether theGreenland-North Sea-Dipole of ENSO is the dominant driverfor the development of the summer season It is obvious thatif CEDI is dominated by very strong El Nino events (negativevalues) a different threshold has to be applied
Due to the low number of extreme summer events in thetime series the CEDI as well as the mentioned thresholdsof 20 and minus15 respectively and the |BEST
119889119895
| threshold of 2cannot be finally evaluated However the skill of CEDI ishigh which supports the discussion and hypothesis outlinedA final evaluation of the CEDI and a final definition of thethreshold used require a larger database At the time thisstudy started the 20th century reanalysis dataset [46] wasnot yet available However this dataset may now be used tofurther evaluate CEDI and GNDI and their influence on thedevelopment of extremely sunny and dry summer seasons inEurope
4 Conclusions
Long lasting anticyclonic circulation anomalies have beendiscussed by several authors as a key factor formid latitudinalsummer heat waves [15ndash18] These circulation anomaliesblock storm tracks and frontal systems (eg [21]) and areoften associated with a large scale stationary Rossby wavepattern (see [14] and references therein) Moreover in thecenter of the anticyclone air parcel trajectories are ldquotrappedrdquocompared to normal summers [22] which is an indicator fora regional Lyapunov stable equilibrium of the atmosphericcirculation
It is likely that long lasting stable atmospheric statesduring summer time have indicators that are visible prior tosummer season
Indeed in Trager-Chatterjee et al [23] evidence hasbeen found that extremely hot and dry summers might beconnected to specific conditions during the winter-springtransitions (February-March-April FMA) namely sunnyand dry conditions in Central EuropeThis connectionmightbe useful to improve the predictability of heat waves
In the present study the atmospheric dynamic on thesynoptic and the global scale has been analysed in orderto gain a deeper knowledge of the winter-spring transition(FMA) and summer (JJA) connection described by Trager-Chatterjee et al and its disturbance Furthermore potentialindices have been evaluated regarding their suitability tosupport the prediction of extremely hot and dry summers inCentral Europe
For this purpose the potential interlink of North AtlanticOscillation (NAO) as well as Arctic Oscillation (AO) withextreme summers in Central Europe has been investigated
Advances in Meteorology 9
No evidence for an interlink of NAO or AO with extremesummers has been found Instead an analysis of the geopo-tential anomaly as proxy for the atmospheric circulation hasled to the introduction of the Greenland-North Sea-Dipole-Index (GNDI) This index is a measure for the strengthof the dipole anomaly in the geopotential at 850 hPa oversouthern Greenland and North SeaFennoscandia It hasbeen discussed that the GNDI serves as an indicator ofapproaching summers with very large positive anomaliesin solar irradiation and very large negative anomalies inprecipitation in Central Europe The GNDI supports theconclusions of Trager-Chatterjee et al 2013 that solar irra-diation and precipitation are an important proxy for thedevelopment of sunny and dry summers the atmosphericpressure regimes which determine the high solar irradiationamounts and the low precipitation amounts have now beenidentified
Hence monitoring of the Greenland-North Sea-Dipoleis expected to improve our knowledge of the North-Atlanticcirculation system and its role for the development ofextreme Central European summers in terms of heat (solarirradiation) and drought While the GNDI indicates the heatsummers in 2003 and 1976 it shows no evidence for the heatsummer 1983 and erroneously indicates 2011
It has been analysed whether these failures are due toglobal scale ENSO disturbances Indeed evidence has beenfound that ENSO is the second main driver for extremesummers on one hand and the disturbance of the GNDIconnection on the other
In order to account for both synoptic scale and globalscale processes a coupled index the Central EuropeanDrought Index (CEDI) is proposed This index considersthe coupling of the dominant processes for the developmentof extreme summers on synoptic and global scale For thesynoptic scale the novel GNDI and for the global scale thewell-established BEST index as ameasure of ENSO are used
With the definition of the CEDI it is possible to indicateall extreme summers during the investigated time period(1956ndash2011) without any false alarm According to the resultspresented the CEDI serves as an indicator of approachingsummers with highly extreme positive anomalies in solarirradiation and highly extreme negative anomalies in precip-itation in Central Europe
However due to the nonlinear nature of the Atmosphere-Ocean system and the (by definition) low frequency of occur-rence of extremes the forecast skill of CEDI cannot yet befinally determined Moreover further empirical adjustmentsof CEDImight be neededThis could for example be done byanalysing reanalysis datasets reaching further back into thepast than the datasets used in this study and by monitoringCEDI in the future Yet for the investigated time periodthe skill of CEDI is close to 1 (no missed event no falsealarm)This is a strong hint that the described coupling of thenorthern hemisphere circulation and ENSO is a key elementfor the understanding and prediction of extremely hot anddry summers in Europe To the knowledge of the authors itis the first time that the coupling of the synoptic northernhemisphere circulation and the ENSO has been expressedin a convenient coupled circulation index Hence although
CEDI might be not finally defined it describes an importantfeature in the development of extremely hot and dry summersin Central Europe
Conflict of Interests
The authors declare that there is no conflict of interestsregarding the publication of this paper
Acknowledgments
The work presented in this paper has been partly funded byEUMETSAT in the context of CM SAF as part of the SatelliteApplication Facilities Network In this study geopotentialdata of the ECMWF reanalysis datasets ERA-40 [25] andERA-interim [26] were used The PC based NAO and AOindices according to Hurrell have been taken from thepages of the NCAR (National Center for AtmosphericResearch)UCAR (University Corporation for AtmosphericResearch) climate data guide (httpsclimatedataguideucaredu) The authors thank the anonymous reviewer fora constructive critique and helpful comments which havesignificantly contributed to improve the paper
References
[1] World Health Organization (WHO) The Solid Facts on Cli-mateChange andHealth 2010 httpwwweurowhoint dataassetspdf file001095815FS ParmaClosurepdf
[2] H-G Muecke and P Becker Klimawandel und GesundheitmdashInformationen zu den gesundheitlichen Auswirkungen somm-erlicher Hitze un d Hitzewellen und Tipps zum vorbeugendenGesundheitsschutz 2008 httpwwwumweltbundesamtdepublikationenratgeber-klimawandel-gesundheit
[3] World Health Organization ldquoProtecting the public and mini-mizing health effects from heat towards the development ofa heat-health action framework for the prefecture of HyogoJapanrdquo Tech Rep WHO 2013
[4] Munich Re Group Geschaftsbericht der Munchener-RuckGruppe 2003 2004
[5] G Lobinger ldquoDer Kafersommerrdquo LWF (Bay Erische Lande-sanstalt fuer Wald und Forstwirtschaft) vol 43 pp 26ndash27 2004httpwwwwaldwissennetwaldwirtschaftschadeninsektenlwf kaefersommerindex DE
[6] P Heck P Zanetti R Enz J Green and S Suter ldquoNaturalcatastrophes andmanmade disasters in 2003rdquo Technical ReportSigma Report 12004 Swisse Re 2004
[7] B Muhr D James B Khazai et al ldquoAnalysis of US extremedrought and record heat 2012rdquo Tech Rep Center for DisasterManagement and Risk Reduction Technology CEDIM 2012httpswwwcedimdedownload20120921usa drought no2pdf
[8] S Gruber M Hoelzle and W Haeberli ldquoPermafrost thaw anddestabilization of Alpine rock walls in the hot summer of 2003rdquoGeophysical Research Letters vol 31 no 13 2004
[9] T N Palmer and D L T Anderson ldquoThe prospects for seasonalforecastingmdasha review paperrdquo Quarterly Journal of the RoyalMeteorological Society vol 120 no 518 pp 755ndash793 1994
10 Advances in Meteorology
[10] A Weisheimer F J Doblas-Reyes T Jung and T N PalmerldquoOn the predictability of the extreme summer 2003 overEuroperdquo Geophysical Research Letters vol 38 no 5 2011
[11] E Dutra M Diamantakis I Tsonevsky et al ldquoThe extremeforecast index at the seasonal scalerdquoAtmospheric Science Lettersvol 14 no 4 pp 256ndash262 2013
[12] V Pavan and F J Doblas-Reyes ldquoCalibrated multi-modelensemble summer temperature predictions over Italyrdquo ClimateDynamics vol 41 no 7-8 pp 2115ndash2132 2013
[13] E Fischer ldquoAutopsy of twomega-heatwavesrdquoNatureGeosciencevol 7 pp 332ndash333 2014
[14] E M Fischer The role of land-atmosphere intera ctions forEuropean summer heat waves past present and future [PhDthesis] ETH Zurich Zurich Switzerland 2007
[15] D Barriopedro E M Fischer J Luterbacher R M Trigo andR Garcıa-Herrera ldquoThe hot summer of 2010 redrawing thetemperature record map of Europerdquo Science vol 332 no 6026pp 220ndash224 2011
[16] A F Carril S Gualdi A Cherchi and A Navarra ldquoHeatwavesin Europe areas of homogeneous variability and links withthe regional to large-scale atmospheric and SSTs anomaliesrdquoClimate Dynamics vol 30 no 1 pp 77ndash98 2008
[17] A Fink T Brucher G Leckebuch J Pinto andU Ulbrich ldquoThe2003 Europe an summer heatwaves and droughtmdashsynopticdiagnosis and impactsrdquo Weather vol 59 no 8 pp 209ndash2162004
[18] M Ionita G Lohmann N Rimbu and P Scholz ldquoDominantmodes of diurnal temperature range variability over Europeand their relationships with large-scale atmospheric circulationand sea surface temperature anomaly patternsrdquo Journal ofGeophysical Research D Atmospheres vol 117 no 15 Article IDD15111 2012
[19] K E Kunkel S A Changnon B C Reinke and R W ArrittldquoThe July 1995 heat wave in the midwest a climatic perspectiveand critical weather factorsrdquo Bulletin of the American Meteoro-logical Society vol 77 no 7 pp 1507ndash1518 1996
[20] M A Palecki S A Changnon and K E Kunkel ldquoThe natureand impacts of the July 1999 heat wave in the midwesternUnited States learning from the lessons of 1995rdquo Bulletin of theAmerican Meteorological Society vol 82 no 7 pp 1353ndash13672001
[21] J M Wallace ldquoMeteorological conditions during heat wavesand droughts in the United States Great Plainsrdquo MonthlyWeather Review vol 115 no 7 pp 1253ndash1269 1987
[22] A Black M Blackburn G Harrison and J Methven ldquoFactorscontributing to the summer 2003 European heatwaverdquoWeathervol 59 pp 217ndash223 2004
[23] C Trager-Chatterjee R W Muller and J Bendix ldquoAnalysis ofextreme summers and prior late winterspring conditions incentral EuroperdquoNatural Hazards and Earth System Science vol13 no 5 pp 1243ndash1257 2013
[24] C Cassou L Terray and A S Phillips ldquoTropical Atlanticinfluence on European heat wavesrdquo Journal of Climate vol 18no 15 pp 2805ndash2811 2005
[25] P Kallberg A Simmons S Uppala and M Fuentes ldquoTheERA-40 archive ECMWF 2005rdquo Tech Rep ERA-40 ProjectReport Series No17 2005 httpwwwecmwfintpublicationslibrarydoreferenceslist192
[26] P Berrisford D Dee K Fielding et al ldquoThe ERA-interimarchiverdquo Technical Report ERA Report Series No 1 ECMWFReading UK 2009 httpwwwecmwfint
[27] D W J Thompson and J M Wallace ldquoThe Arctic oscillationsignature in the wintertime geopotential height and tempera-ture fieldsrdquoGeophysical Research Letters vol 25 no 9 pp 1297ndash1300 1998
[28] J Hurrell and National Center for Atmospheric ResearchStaffTheClimate Data Guide Hurrell North Atlantic Oscillation(NAO) Index (PC-based) 2013 httpsclimatedataguideucareduclimate-datahurrell-north-atlantic-oscillation-nao-index-pc-based
[29] J Hurrell et al The Climate Data Guide Hurrell wintertimeSLP-based Northern Annular Mode (NAM) Index 2013httpsclimatedataguideucareduclimate-datahurrell-winter-time-slp-based-northern-annular-mode-nam-index
[30] S Broennimann ldquoImpact of El Nino-Southern Oscillation onEuropean climaterdquo Reviews of Geophysics vol 45 no 3 ArticleID RG3003 2007
[31] C Smith and P Sardeshmukh ldquoThe Effect of ENSO on theintraseasonal variance of surface temperature in winterrdquo Inter-national Journal of Climatology vol 20 pp 1543ndash1557 2000
[32] A G Barnston and R E Livezey ldquoClassification seasonalityand persistence of low-frequency atmospheric circulation pat-ternsrdquo Monthly Weather Review vol 115 no 6 pp 1083ndash11261987
[33] J W Hurrell and C Deser ldquoNorth Atlantic climate variabilitythe role of the North Atlantic Oscillationrdquo Journal of MarineSystems vol 79 no 3-4 pp 231ndash244 2010
[34] GWalker and E Bliss ldquoWorld weather VrdquoMemoirs of the RoyalMeteorological Society vol 4 no 36 pp 53ndash85 1932
[35] K Walter and H F Graf ldquoThe North Atlantic variabilitystructure storm tracks and precipitation depending on thepolar vortex strengthrdquo Atmospheric Chemistry and Physics vol5 no 1 pp 239ndash248 2005
[36] M Ogi K Yamazaki and Y Tachibana ldquoThe summertimeannular mode in the Northern Hemisphere and its linkage tothe winter moderdquo Journal of Geophysical Research D Atmo-spheres vol 109 no D20 article 27 2004
[37] A Czaja A Robertson and T Huck ldquoThe role of Atlanticocean-atmosphere coupling in affecting North Atlantic Oscil-lation variabilityrdquo in The North Atlantic Oscillation ClimaticSignificance and Environmental Impact JWHurrell Y KushnirG Ottersen and M Visbeck Eds vol 134 of AGU GeophysicalMonograph pp 147ndash172 Wiley New York NY USA 2003
[38] M Rodwell ldquoOn the predictability of the north atlantic climaterdquoin The North Atlantic Oscillation Climatic Significance andEnvrionmental Impact J W Hurrell Y Kushnir G Ottersenand M Visbeck Eds vol 134 of AGU Geophysical Monographpp 173ndash192 2003
[39] M Hirschi S I Seneviratne V Alexandrov et al ldquoObserva-tional evidence for soil-moisture impact on hot extremes inSoutheastern Europerdquo Nature Geoscience vol 4 no 1 pp 17ndash21 2011
[40] M Zampieri F DrsquoAndrea R Vautard P Ciais N De Noblet-Ducoudre and P Yiou ldquoHot European summers and the roleof soil moisture in the propagation of mediterranean droughtrdquoJournal of Climate vol 22 no 18 pp 4747ndash4758 2009
[41] H-F Graf and D Zanchetin ldquoCentral Pacific El Nino the ldquosub-tropical bridgerdquo and Eurasian climaterdquo Journal of GeophysicalResearch Atmospheres vol 117 no 1 2012
[42] K Trenberth ldquoGeneral characteristics of El Nino-SouthernOscillationrdquo in Teleconnections Linking Worldwide ClimateAnomalies M H Glant Ed pp 13ndash42 Cambridge UniversityPress Cambridge UK 1991
Advances in Meteorology 11
[43] K Fraedrich and K Muller ldquoClimate anomalies in Europeassociated with ENSO extremesrdquo International Journal of Cli-matology vol 12 no 1 pp 25ndash31 1992
[44] N C Lau and M J Nath ldquoThe role of the ldquoatmospheric bridgerdquoin linking tropical pacific ENSO events to extratropical SSTanomaliesrdquo Journal of Climate vol 9 no 9 pp 2036ndash2057 1996
[45] I Herceg Bulic and F Kucharski ldquoDelayed ENSO impacton spring precipitation over NorthAtlantic European regionrdquoClimate Dynamics vol 38 no 11-12 pp 2593ndash2612 2012
[46] G P Compo J S Whitaker P D Sardeshmukh et al ldquoThetwentieth century reanalysis projectrdquo Quarterly Journal of theRoyal Meteorological Society vol 137 no 654 pp 1ndash28 2011
Submit your manuscripts athttpwwwhindawicom
Hindawi Publishing Corporationhttpwwwhindawicom Volume 2014
ClimatologyJournal of
EcologyInternational Journal of
Hindawi Publishing Corporationhttpwwwhindawicom Volume 2014
EarthquakesJournal of
Hindawi Publishing Corporationhttpwwwhindawicom Volume 2014
Hindawi Publishing Corporationhttpwwwhindawicom
Applied ampEnvironmentalSoil Science
Volume 2014
Mining
Hindawi Publishing Corporationhttpwwwhindawicom Volume 2014
Journal of
Hindawi Publishing Corporation httpwwwhindawicom Volume 2014
International Journal of
Geophysics
OceanographyInternational Journal of
Hindawi Publishing Corporationhttpwwwhindawicom Volume 2014
Journal of Computational Environmental SciencesHindawi Publishing Corporationhttpwwwhindawicom Volume 2014
Journal ofPetroleum Engineering
Hindawi Publishing Corporationhttpwwwhindawicom Volume 2014
GeochemistryHindawi Publishing Corporationhttpwwwhindawicom Volume 2014
Journal of
Atmospheric SciencesInternational Journal of
Hindawi Publishing Corporationhttpwwwhindawicom Volume 2014
OceanographyHindawi Publishing Corporationhttpwwwhindawicom Volume 2014
Advances in
Hindawi Publishing Corporationhttpwwwhindawicom Volume 2014
MineralogyInternational Journal of
Hindawi Publishing Corporationhttpwwwhindawicom Volume 2014
MeteorologyAdvances in
The Scientific World JournalHindawi Publishing Corporation httpwwwhindawicom Volume 2014
Paleontology JournalHindawi Publishing Corporationhttpwwwhindawicom Volume 2014
ScientificaHindawi Publishing Corporationhttpwwwhindawicom Volume 2014
Hindawi Publishing Corporationhttpwwwhindawicom Volume 2014
Geological ResearchJournal of
Hindawi Publishing Corporationhttpwwwhindawicom Volume 2014
Geology Advances in
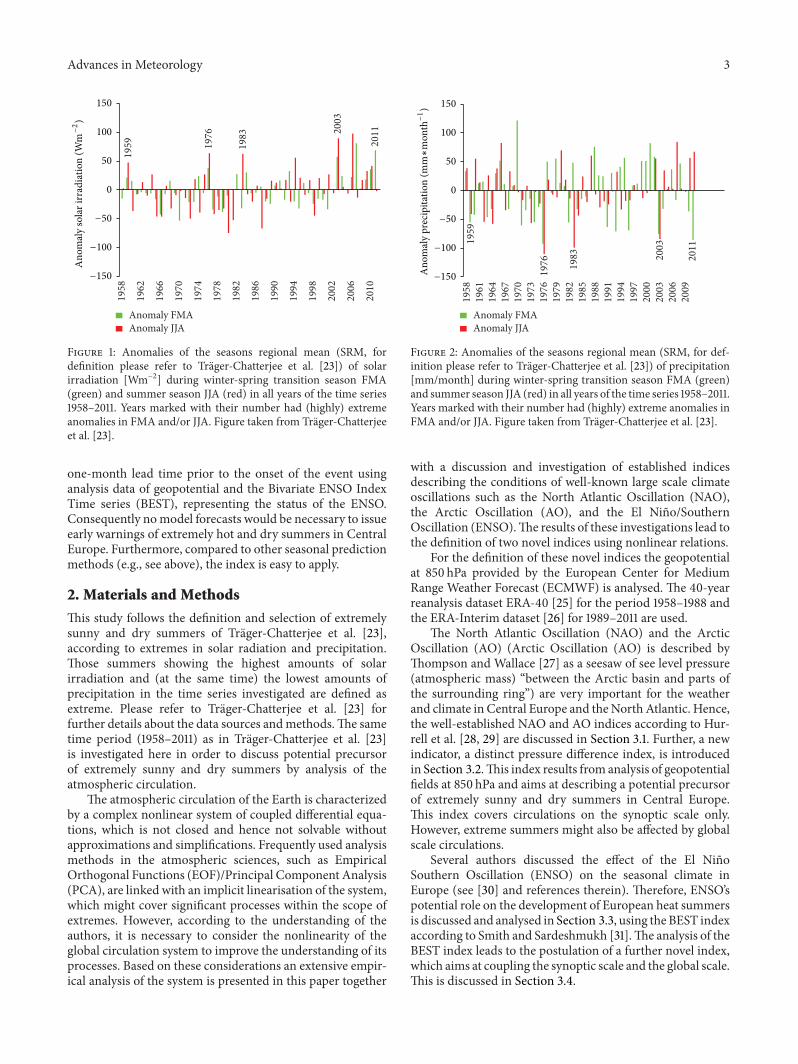
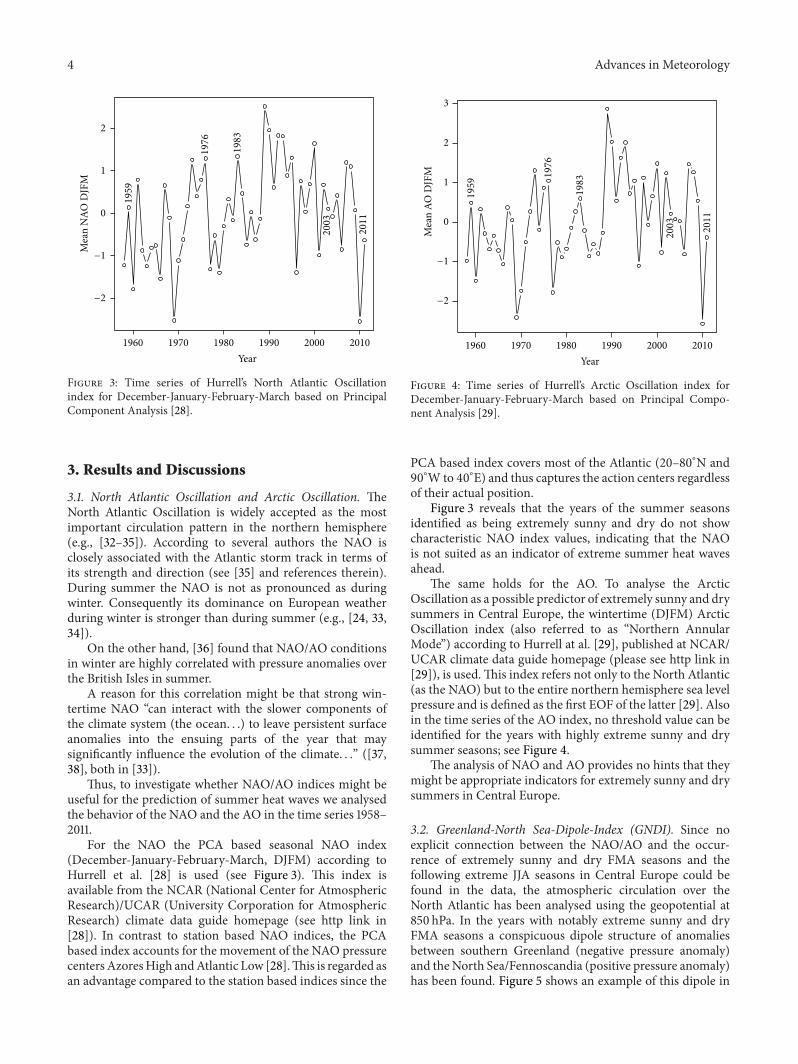
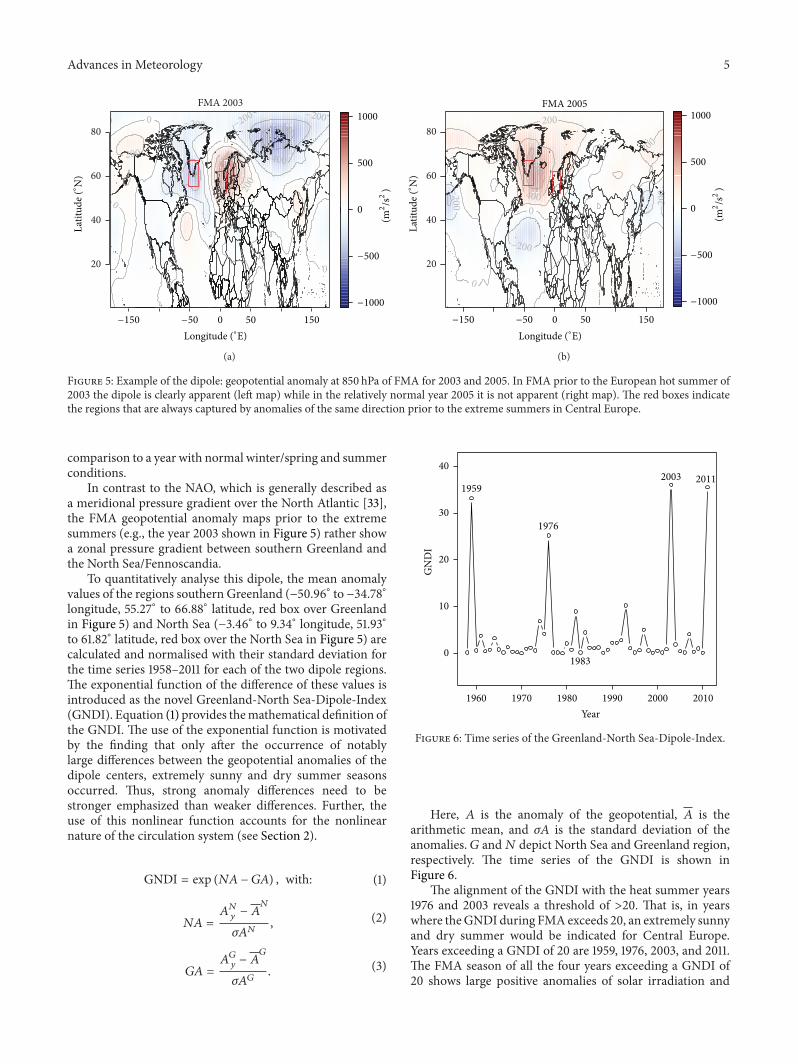
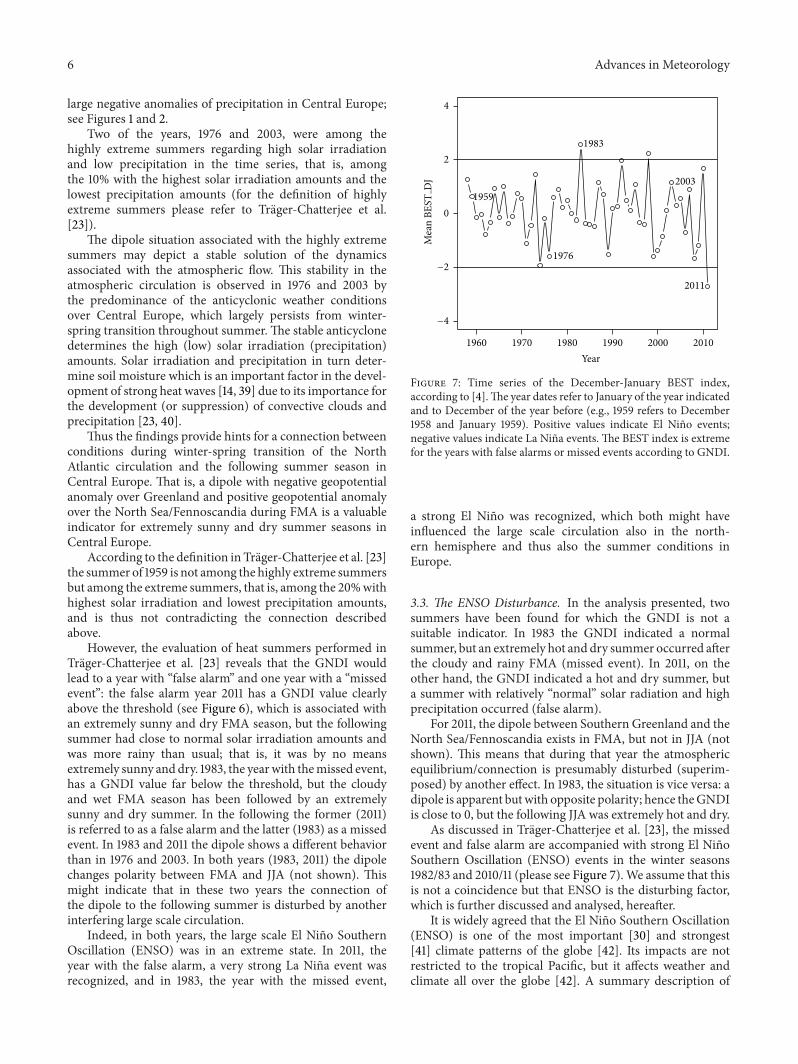
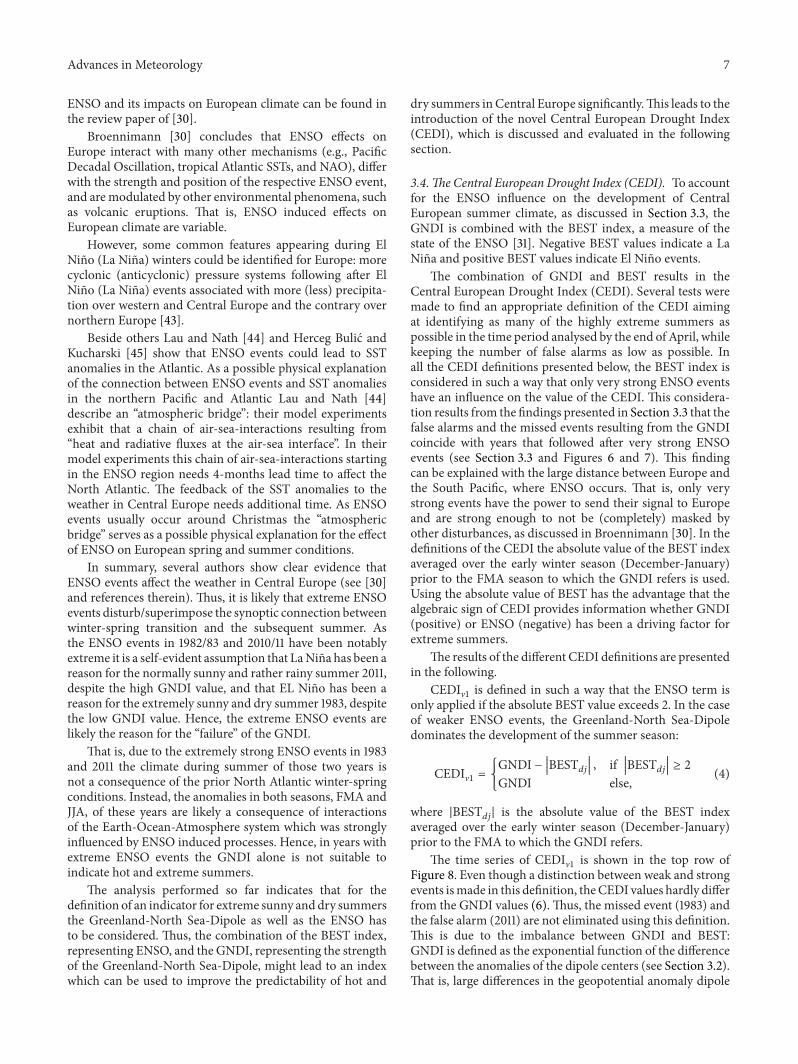
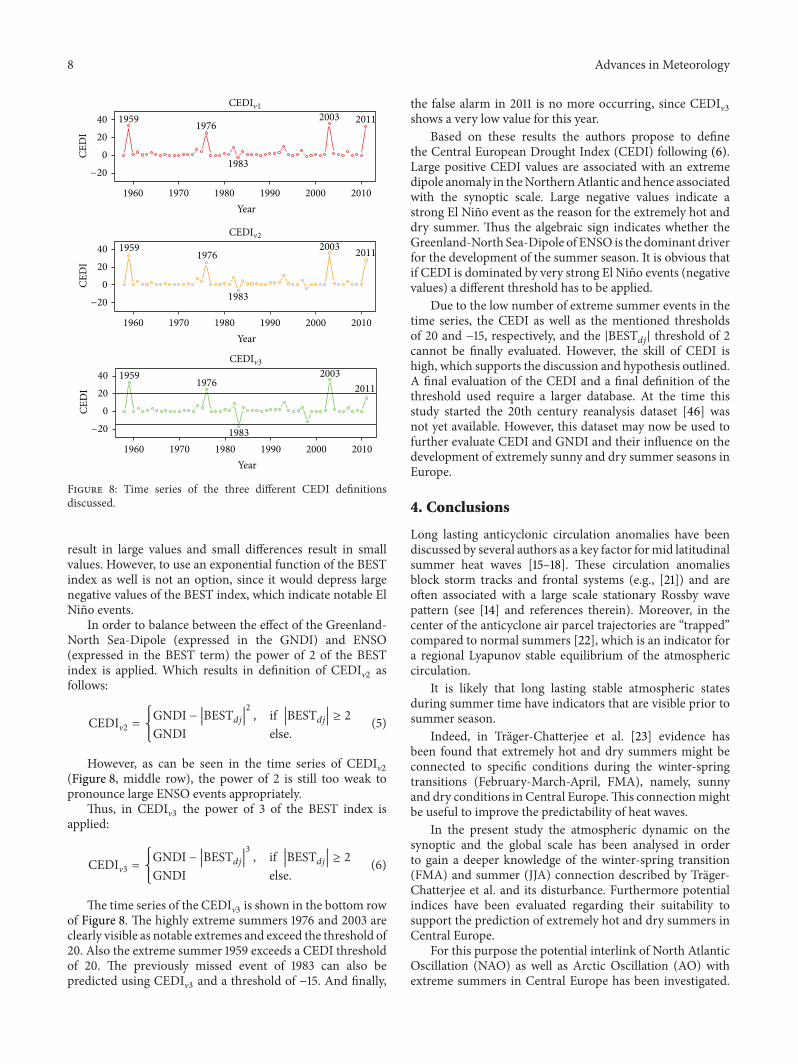
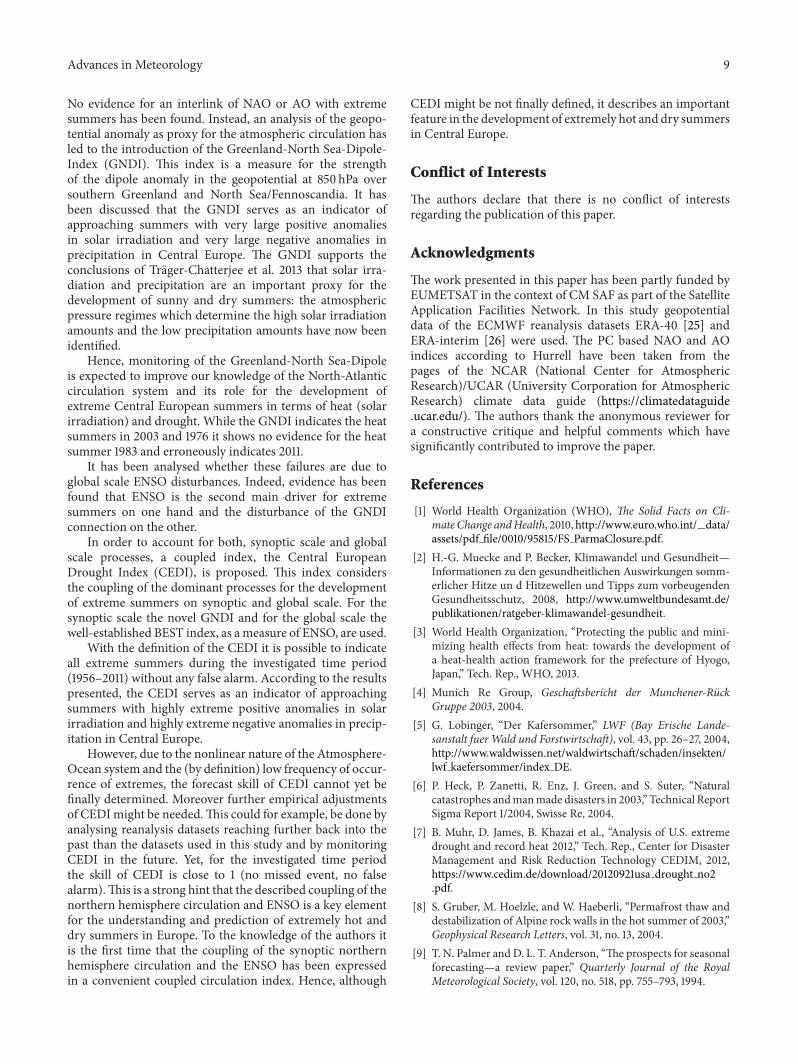
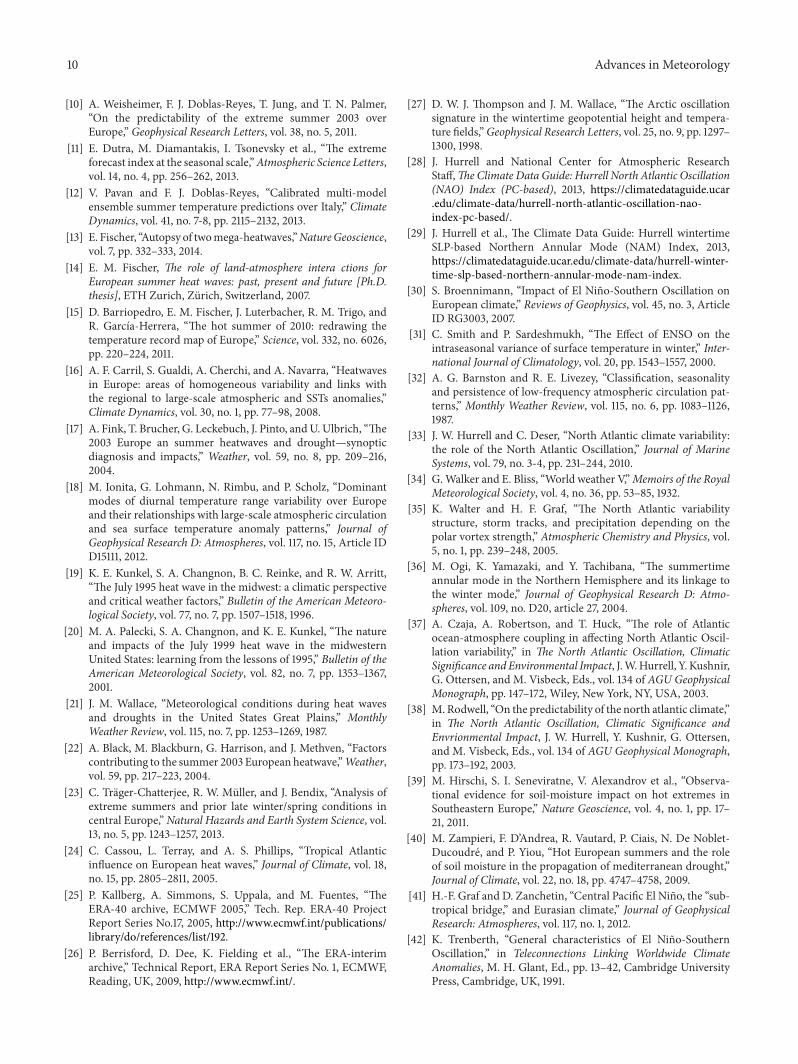
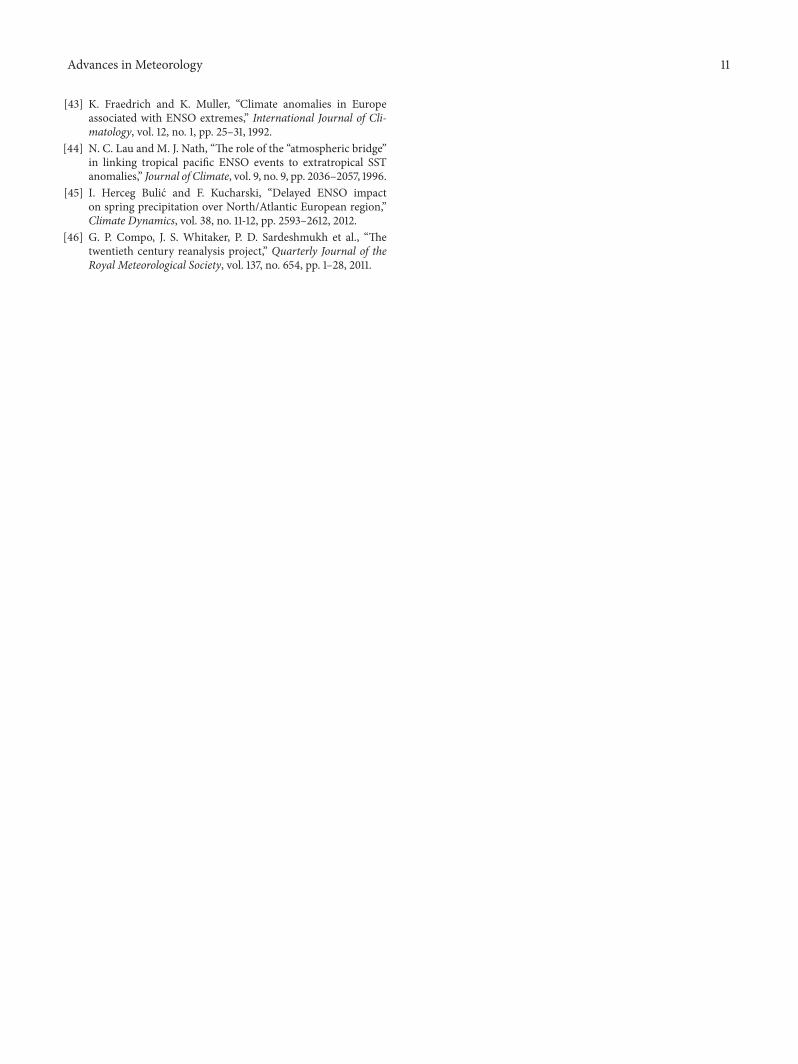