Embed Size (px)
Citation preview

Research and Evaluation Considerations
Multiple Measures Assessment Project
March 29, 2017
http://rpgroup.org/All-Projects/ctl/ArticleView/mid/1686/articleId/118/Multiple-Measures-
Assessment-Project-MMAP

Overview• Baseline report• Planning comparisons• Outcome metrics/reporting intervals
– Initial placement changes– Course success rates– Sequence completion– Long-term outcomes
• Disaggregation of outcomes• Student and faculty surveys• Performance of overall assessment system• Other useful analyses/evaluation to plan
• Don’t forget to submit your placement, self-report, and NCV data for inclusion in the statewide analysis!

Baseline reporting & key categories
• Develop a baseline report prior to implementation
– proportion of students who place into each level
– proportion of students who enroll into each level
– success rates, by level
– sequence completion, by cohort and by initial placement
• Develop method/plan for identifying students placed via:
– Overlap group (MM and Test)
– Multiple measures (MM only or MM only with overlap group)
– Test placement (Test only or Test only with overlap group)
– Entire Group
– Total of 6 possible combinations

The six groups
Test placement
MMAP placementTest only
MMAP only
Both test & MMAP
All MMAPAll Test
All students

Planning Comparisons
• Students from prior terms– Identify students who would have been eligible for MMAP using local
criteria (e.g., first-time students, high school, etc.)– Make sure to use comparable terms (e.g., fall vs. fall)– Retrospective datafile available:
•useful to help identify students who would have been eligible•good for propensity score matching, logistic regression, etc.
• Ineligible or students w/o available data in same term
• Additional comparisons for specific outcomes:– Placements: what placements MMAP-eligible students would have
received– Throughput rates: students who have progressed through sequence
(no. of gateway completers / no. of those initially enrolled)
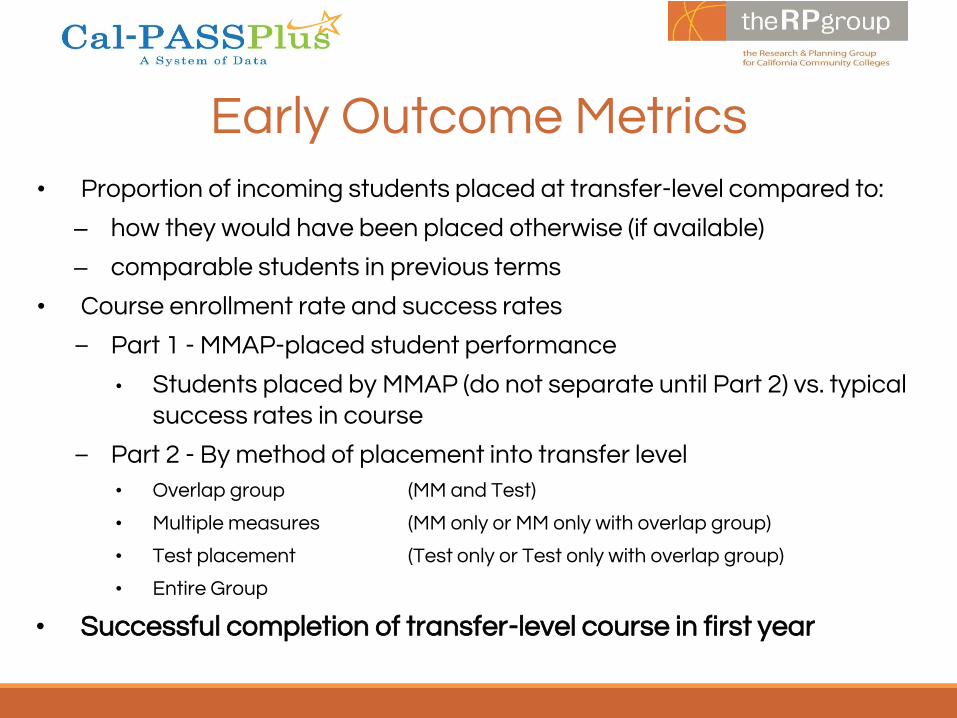
Early Outcome Metrics• Proportion of incoming students placed at transfer-level compared to:
– how they would have been placed otherwise (if available)
– comparable students in previous terms
• Course enrollment rate and success rates
– Part 1 - MMAP-placed student performance
• Students placed by MMAP (do not separate until Part 2) vs. typical success rates in course
– Part 2 - By method of placement into transfer level
• Overlap group (MM and Test)
• Multiple measures (MM only or MM only with overlap group)
• Test placement (Test only or Test only with overlap group)
• Entire Group
• Successful completion of transfer-level course in first year
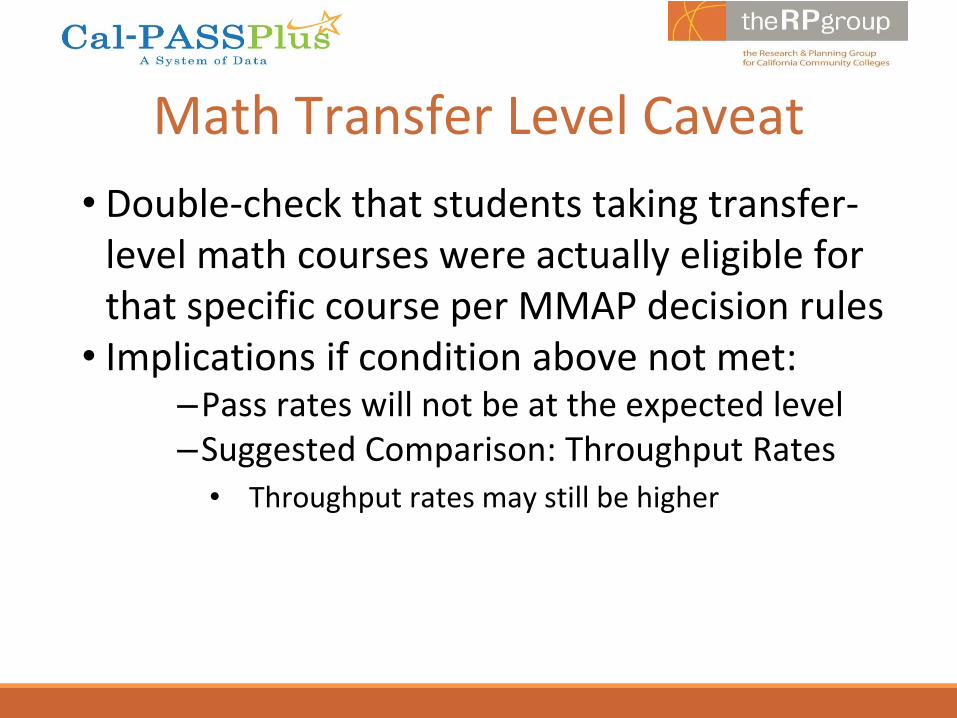
Math Transfer Level Caveat
• Double-check that students taking transfer-level math courses were actually eligible for that specific course per MMAP decision rules
• Implications if condition above not met:–Pass rates will not be at the expected level–Suggested Comparison: Throughput Rates
• Throughput rates may still be higher

Survey Students and Faculty
• Consequential validity survey • Sample consequential validity questions (see p. 9)
http://bit.ly/CutScore
Which of the following is most true of your placement? 1. I should be in a course higher (more advanced) than this one. 2. I am in the right class. 3. I should be in a class lower (less advanced) than this one.
• Potential multiple administrations of survey (e.g.: before course, beginning, and end of course)
–advantage: data on students who drop, evidence of change through semester

Potential Important Survey Limitations
• Self-reported satisfaction with assessment by instructors and students may have significant methodological flaws:
• Selection bias
• Confirmation bias
• Effort justification
• System justification
• Self-fulfilling prophecy effects and stereotype threat
• Relative invisibility of underplacement
• Abstract/overall assessments also problematic
–Grounded in pre-existing beliefs rather than experiences

Survey Students and Faculty• ESL survey for additional multiple measures evidence
• Focus Groups
• Interviews
• Other implementation/satisfaction surveys of students, faculty, and staff (some samples at www.lbcc.edu/PromisePathways)

Assessing Disproportionate Impacts
• Disaggregate placement, success and throughput by equity categories
• Ethnicity, gender, DSPS status, Foster Youth, EOPS, CalWorks, SES, Veterans, etc.
• Potential methods from student equity http://bit.ly/DispImpact
• 80% Rule• Percentage gap method• Proportionality index
• Compared to other assessment methods does multiple measures reduce DI?
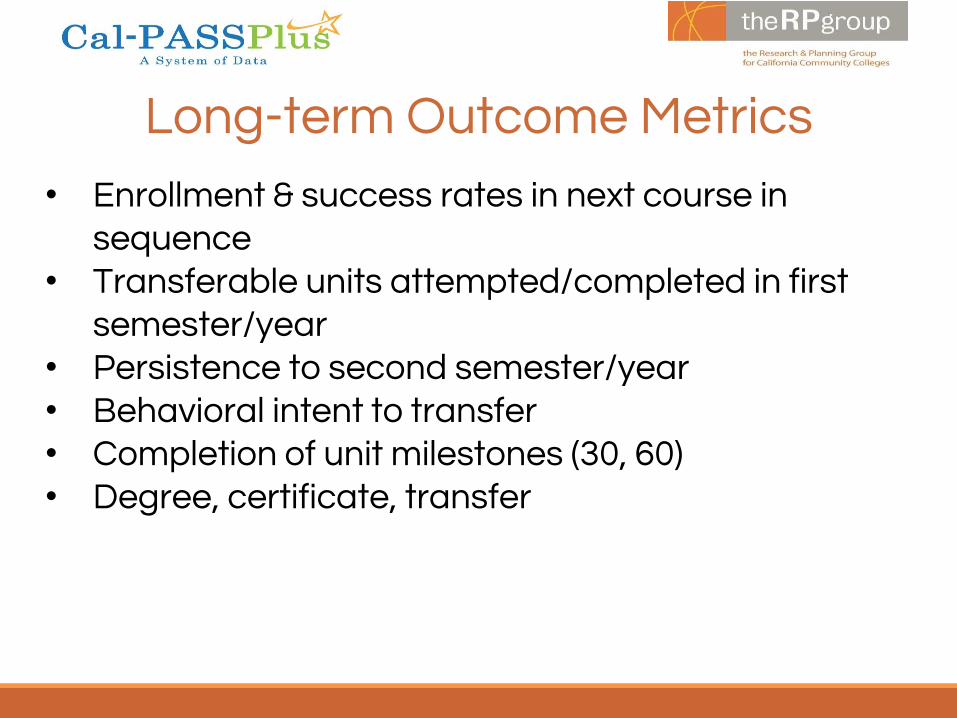
Long-term Outcome Metrics
• Enrollment & success rates in next course in sequence
• Transferable units attempted/completed in first semester/year
• Persistence to second semester/year• Behavioral intent to transfer• Completion of unit milestones (30, 60)• Degree, certificate, transfer

Placement Error
– Overplacement: Student is placed above their ability to succeed. Highly visible.
– Underplacement: Student could have been successful at a higher level than where placed. Tends to be invisible.
– Current placement systems tend to result in much greater underplacement error.
– Total placement error is minimized when over- and underplacement are balanced.
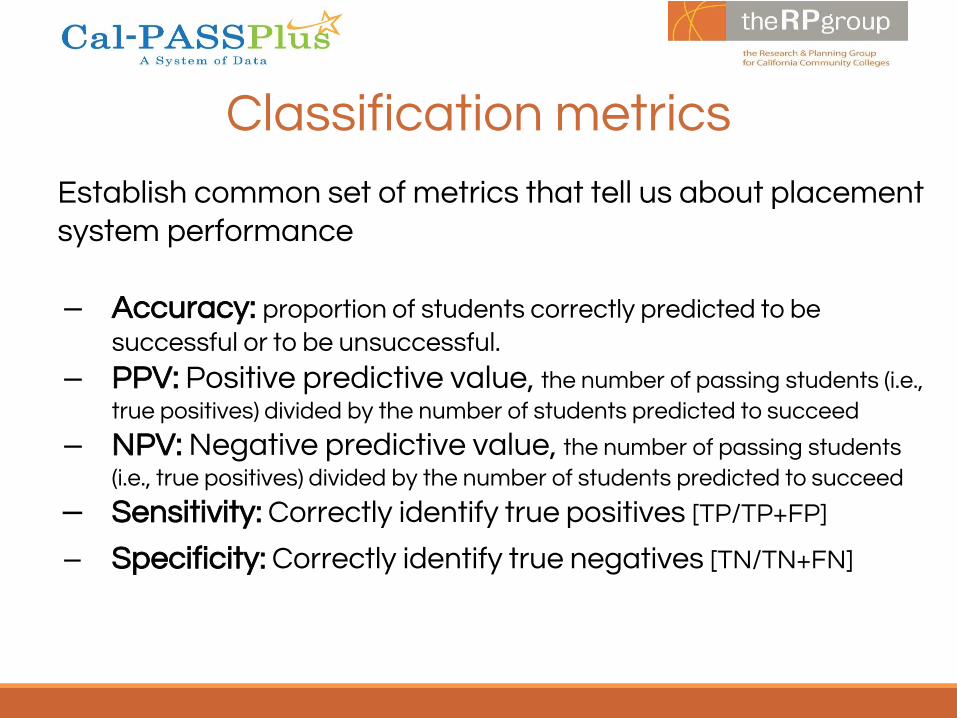
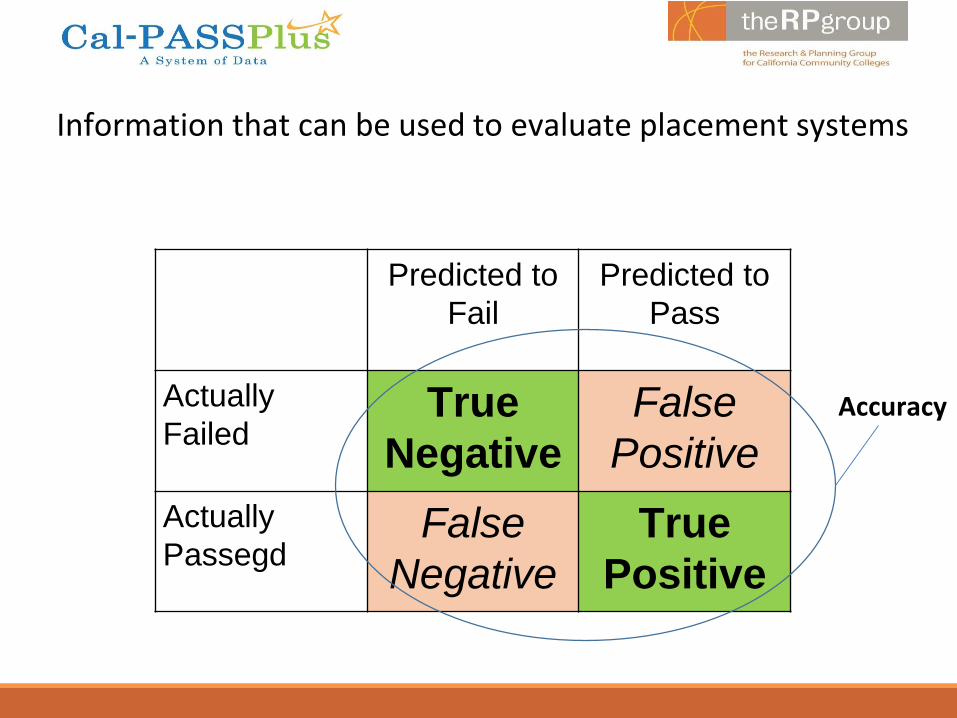
Classification metrics
Establish common set of metrics that tell us about placement system performance
– Accuracy: proportion of students correctly predicted to be successful or to be unsuccessful.
– PPV: Positive predictive value, the number of passing students (i.e., true positives) divided by the number of students predicted to succeed
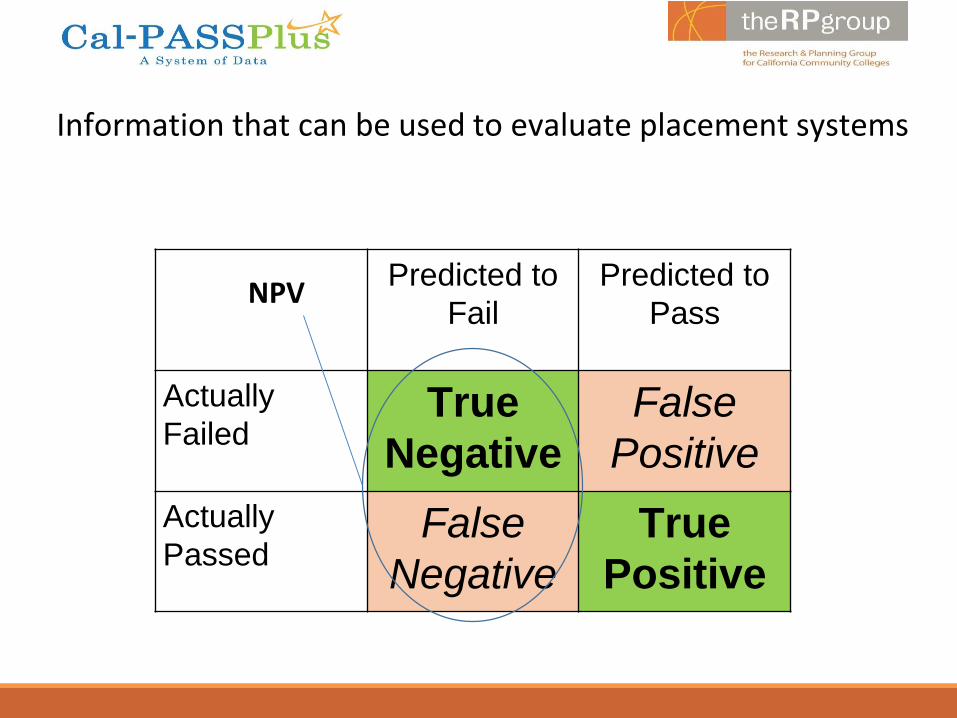
– NPV: Negative predictive value, the number of passing students (i.e., true positives) divided by the number of students predicted to succeed
– Sensitivity: Correctly identify true positives [TP/TP+FP]
– Specificity: Correctly identify true negatives [TN/TN+FN]

Information that can be used to evaluate placement systems
Predicted to
Fail
Predicted to
Pass
Actually
FailedTrue
Negative
False
Positive
Actually
PassedFalse
Negative
True
Positive
Information that can be used to evaluate placement systems
Predicted to
Fail
Predicted to
Pass
Actually
FailedTrue
Negative
False
Positive
Actually
PassegdFalse
Negative
True
Positive
Accuracy

Information that can be used to evaluate placement systems
Predicted to
Fail
Predicted to
Pass
Actually
FailedTrue
Negative
False
Positive
Actually
PassedFalse
Negative
True
PositivePPV
Information that can be used to evaluate placement systems
Predicted to
Fail
Predicted to
Pass
Actually
FailedTrue
Negative
False
Positive
Actually
PassedFalse
Negative
True
Positive
NPV

Information that can be used to evaluate placement systems
Predicted to
Fail
Predicte to
Pass
Actually
FailedTrue
Negative
False
Positive
Actually
PassedFalse
Negative
True
Positive
Specificity

Information that can be used to evaluate placement systems
Predicted to
Fail
Predicted to
Pass
Actually
FailedTrue
Negative
False
Positive
Actually
PassedFalse
Negative
True
Positive
Sensitivity

Additional Resources
• Guide to Developing a Research Agenda:
http://bit.ly/2npBBHI
• Sample Template: http://bit.ly/2nL4MWl
• Sample research plan: http://bit.ly/2mUNxkL
• Long Beach City College Example Plan: ttp://bit.ly/2mSzGat
• California Acceleration Project Data Template: http://bit.ly/2nEQwhF•Using DI Methods to Identify Equity Gaps:https://prolearningnetwork.cccco.edu/ask-resource/disproportionate-impact/

Return Your Data to the MMAP Team
• The research team is collecting pilot college data in order to analyze the results and determine how well the models are working.– Assessment data for students placed by MMAP and all other methods
for comparison– Self-reported transcript data– Non cognitive variable data
– Resources on returning your data on the “returning your pilot college data” tab: http://bit.ly/2my3J73
– Guide to returning pilot college data: http://bit.ly/2nL5zGL– Data File Structure: http://bit.ly/2np2ifI

John HettsEducational Results [email protected]
Ken SoreyEducational Results [email protected]
Daniel LamoreeEducational Results [email protected]
MMAP Research TeamLoris FagioliThe RP [email protected]
Mallory NewellThe RP [email protected]
Terrence WillettThe RP Group [email protected]
Craig HaywardThe RP [email protected]
Rachel BakerUC [email protected]
Nathan PellegrinThe RP [email protected]
Peter BahrUniversity of [email protected]
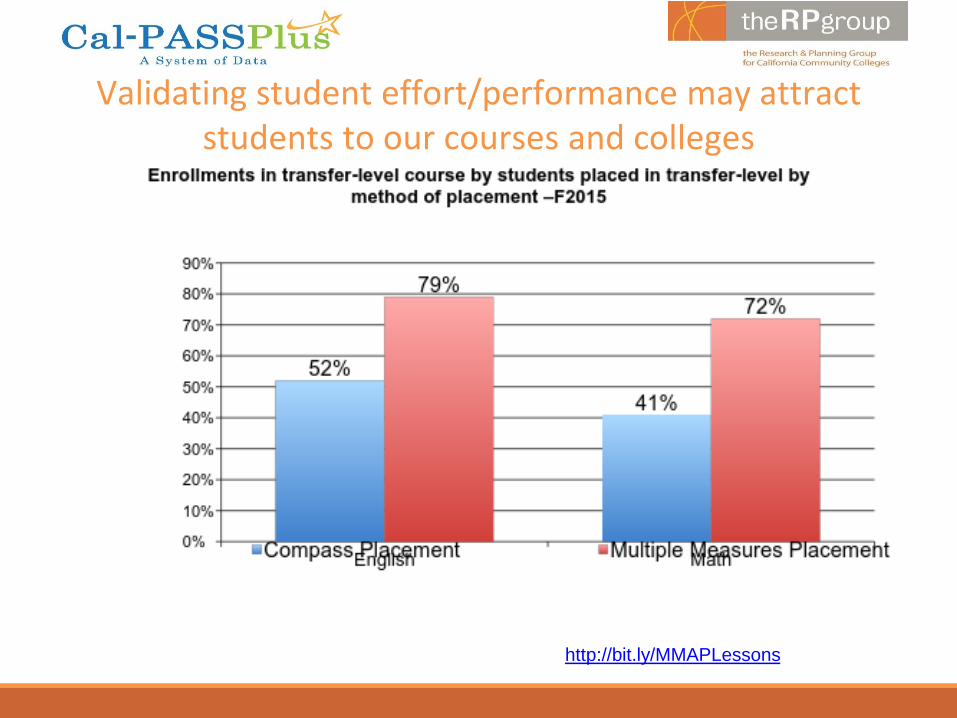
Validating student effort/performance may attract students to our courses and colleges
http://bit.ly/MMAPLessons

Transfer Level Fall Outcomes:English Success Rates – Part 1
Group Cohort Count Rate
Accuplacer Only (Includes Local MM) 1041 707 68%
MMAP 197 155 79%
Other (EAP, SAT, ACT, etc.) 757 523 69%
Sequence (completed one-level below) 1,802 1,259 70%
Total 3,797 2,644 70%

Group Cohort Count Rate
Accuplacer Only (Includes Local MM) 1,012 689 68%
Accuplacer (MMAP lower) 29 18 62%
Placed by both MMAP and Accuplacer 81 66 81%
MMAP Only (Accuplacer lower) 116 89 77%
Other (EAP, SAT, ACT, etc.) 757 523 69%
Sequence (completed one-level below) 1,802 1,259 70%
Total 3,797 2,644 70%
Transfer Level Fall Outcomes:English Success Rates – Part 2

Spring 2016 English Pilot

Transfer-Level English Success rate by year/placement type

Additional resources on DI
• Using DI Methods to Identify Equity Gaps– https://prolearningnetwork.cccco.edu/ask-resource/disproportionate-impact/
• Assessing and Mitigating Disproportionate Impact in Matriculation Services– http://rpgroup.org/resources/assessing-and-mitigating-disproportionate-impact-
matriculation-services
• Assessment Validation Project– http://rpgroup.org/content/assessment-validation-project
• Matriculation Evaluation: Student Resources– http://rpgroup.org/content/matriculation-evaluation-student-resources
Additional Potential Supportive Analyses
• Regression discontinuity designs– Or simple version - compare students on either side (+/-
~5-6 points) of cutscore
– Sequence completion, persistence, graduation/transfer, units completed at 3 and 4 years
– See http://bit.ly/CCRCDEVED for an overview of effects of developmental education treatment
• Transfer-rate comparisons based on grade in first course in sequence

Hayward & Fagioli (in preparation) Irvine Valley College Multiple Measures Research: First course enrolled in, Spring 2000 to Fall 2011 - transfer within 4 years of course
Students who get a C in transfer-level course are more likely to transfer


![DNVGL-RP-0043 Safety, operation and performance …rules.dnvgl.com/docs/pdf/DNVGL/RP/2017-09/DNVGL-RP-0043.pdfFor safety considerations regarding second life systems, see [7.5.1.7]](https://img.pdfslide.us/doc/110x75/5f9e7843ea8263465129a2ef/dnvgl-rp-0043-safety-operation-and-performance-rulesdnvglcomdocspdfdnvglrp2017-09dnvgl-rp-0043pdf.jpg)