Embed Size (px)
Citation preview
16 December 2010
Research and Development Satellite Account Update Estimates for 1959–2007
By Jennifer Lee and Andrew G. Schmidt
THE BUREAU of Economic Analysis (BEA) research and development (R&D) satellite account
provides detailed statistics designed to facilitate research into the effects of R&D on the economy. The account shows how gross domestic product (GDP) and other measures would be affected if R&D spending were “capitalized,” that is, if R&D spending were treated as investment rather than as an expense.
This update of the R&D satellite account extends BEA’s estimates of the effects of R&D on economic growth through 2007, and it now includes coverage of the business cycle expansion that ended in December 2007. The summary estimates presented in this article include revised national statistics for R&D, beginning with estimates for 1959, for R&D-intensive industries, beginning with estimates for 1987, for regional statistics, beginning with estimates for 1998, and for international accounts, beginning with estimates for 1995. The methods used to derive the R&D estimates for this update are consistent with the methods used for deriving the estimates that were released in 2007.1
For this update, several improvements were made to the statistics on R&D investment by industry. R&D statistics for the finance, insurance, real estate, rental, and leasing industry are now separately identified; this industry had been included in “all other for-profit industries” in the prior satellite account update. In addition, the R&D satellite account by industry has now been expanded to include R&D investment by nonprofit industries and by government in order to pro
1. For more information on the R&D satellite account estimates released in 2007 and the methods used, see Carol A. Robbins and Carol E. Moylan, “Research and Development Satellite Account Update: Estimates for 1959–2004 and New Estimates for Industry, Regional, and International Accounts,” SURVEY OF CURRENT BUSINESS 87 (October 2007): 49–64.
Christian Awuku-Budu contributed the section on regional R&D estimates, and Alexis Chaves contributed the section on international R&D estimates.
vide a more complete picture of R&D investment in the GDP by industry accounts.
According to the updated R&D satellite account estimates, treating R&D spending as investment would significantly affect several of BEA’s measures of the economy.
● Growth in R&D investment from 1995 to 2007 continued to track with business cycles. R&D’s contribution to economic growth slowed in 2001 and 2002, recovered in 2003, and outpaced the expansion through 2007.
● The contribution to real GDP growth from treating R&D as investment would have been approximately 0.20 percentage point of the average 2.9 percent growth, or about a 7.1 percent share of the average growth rate from 2002 to 2007.
● The level of current-dollar GDP for 2007 would have increased $396.3 billion, or 2.8 percent.
● Current-dollar private fixed investment for 2007 would have been 11.3 percent, or $256.4 billion, higher than published private fixed investment.
● The largest contribution from an R&D-intensive industry to average real GDP growth from 1995 to 2007 would have been from the pharmaceutical and medicine manufacturing industry. This industry’s contribution would have accounted for about a 1 percent share of the average real GDP growth rate. The second-largest contribution would have been from the software publishing industry, which would have accounted for an additional 0.5 percent share.
● The level of GDP by state would have increased the most for New Mexico (9.2 percent), Maryland (6.2 percent), and Massachusetts (6.0 percent) over the period 1998 to 2007.
● In the international accounts, the surplus on direct investment income would have been larger in 2008, and as a result, the current-account deficit would have been reduced $3.5 billion. The net international investment position would have been $17.0 billion lower as a result of a larger increase in the inward position than in the outward position.
17 December 2010 SURVEY OF CURRENT BUSINESS
Currently, the national income and product accounts (NIPAs) do not treat R&D and many other intangibles as investment. Thus, the contribution of R&D and other intangibles to U.S. economic growth cannot be separately identified. The R&D satellite account is part of BEA’s long-term efforts to better measure the effects of innovation and intangible assets on the economy.2
The R&D satellite account format provides a means of exploring the impact of adjusting the treatment of R&D activity on the economy and a framework through which various methodological and conceptual issues can be examined. The account can be seen as a prelude to adjusting BEA’s core economic accounts to better reflect the impact of R&D. Currently, BEA plans to incorporate R&D spending as investment into its core accounts around 2013 as part of the 2007 input-output accounts and as part of the comprehensive revision of the NIPAs. This article marks the final update of the satellite account before R&D investment is incorporated into BEA’s accounts.3
The rest of this report is organized as follows. First, the effects of the updated estimates on GDP and investment are explained, revisions to previous R&D estimates are discussed, and relationships between private and government R&D investment and the business cycle are presented. Second, the price indexes used for deflating R&D investment in the satellite account are discussed. Third, estimates for the impacts of treating R&D as investment by industry are described, in
2. For more information, see Ana M. Aizcorbe, Carol E. Moylan, and Carol Robbins, “Toward Better Measurement of Innovation and Intangibles,” SURVEY 89 (January 2009): 10–23.
3. For the first time, the System of National Accounts, 2008 recommends treating R&D expenditures as investment.
Acknowledgments Carol E. Moylan, Chief of the National Income and Wealth Division, and Erich H. Strassner, Chief of the Industry Applications Division, directed the R&D satellite account update. Marissa J. Crawford, Lisa S. Mataloni, Jennifer A. Ribarsky, and Andrew G. Schmidt prepared the NIPA-based estimates. Lisa C. Ninomiya developed and operated the computer system used to compile, analyze, and report the final NIPA-based estimates. Teresa L. Gilmore, William A. Jolliff, Jennifer Lee, Brian M. Lindberg, and Gabriel W. Medeiros prepared the industry-based estimates. Christian Awuku-Budu and Carol A. Robbins prepared the regional estimates. Alexis Chaves and Daniel R. Yorgason prepared the international estimates.
cluding new estimates for the finance, insurance, real estate, rental, and leasing industry, for nonprofit industries, and for government. Fourth, estimates of the effects of R&D investment on GDP by state are presented. Lastly, the impacts of capitalizing R&D in the international accounts are discussed.
R&D and the Economy Effect on GDP and investment If R&D spending were treated as investment, real GDP would have grown slightly faster, on average, from 1959 to 2007 (table A). The average difference was 0.13 percentage point for 1959 to 1973. The average difference narrowed to almost zero for the period 1974 to 1994, before picking up again to 0.17 percentage point for the period 1995 to 2001. From 2002 to 2007, the average difference narrowed to 0.12 percentage point.
The level of current-dollar GDP would have been, on average, 2.6 percent higher for 2002 to 2007 if R&D spending were treated as investment in the NIPAs. The impact of treating R&D spending as investment on GDP growth can be seen by looking at the contribution of R&D to the annual real GDP growth rate (table B). This contribution would have been approximately 0.20 percentage point of the average 2.9 percent growth, or about a 7.1 percent share of the average growth rate from 2002 to 2007.
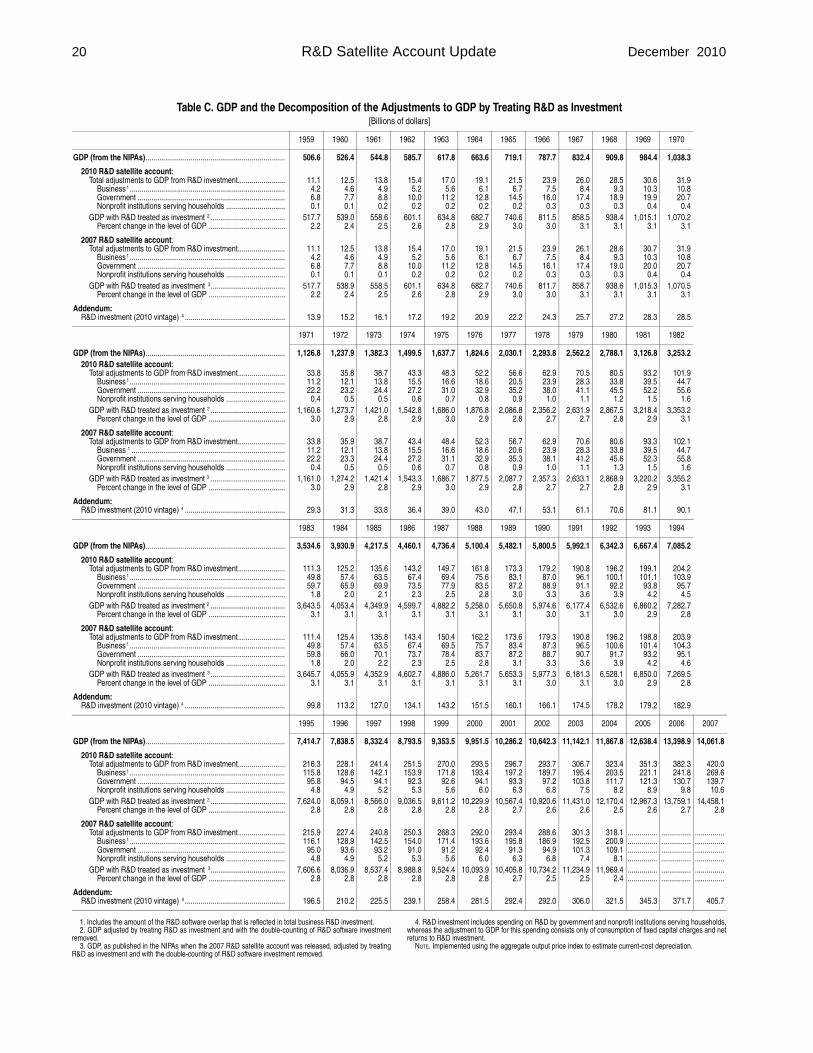
For 2007, current-dollar R&D investment would have been $405.7 billion, an increase of 9.1 percent from $371.7 billion for 2006 (table C). Real GDP would have grown 2.2 percent for 2007 if R&D were treated as investment, and the contribution of the new treatment of R&D to real GDP growth would have been 0.28 percentage point, or about a 12.9 percent share of the growth rate (table B). Business investment would have contributed 0.20 percentage point to the growth rate, while the newly recognized capital services from government and from nonprofit institutions serving households would together have
Table A. Comparison of Average Annual Real GDP Growth Rates [Percent]
2010 vintage 2007 vintage
Unadjusted real GDP 1
Adjusted real GDP 2
Unadjusted real GDP 3
Adjusted real GDP 2
1959–1973 ................................................. 1974–1994 ................................................. 1995–2001 ................................................. 2002–2007 ................................................. 1959–2004 ................................................. 1959–2007 .................................................
4.20 3.02 3.76 2.75 3.37 3.32
4.33 3.03 3.93 2.87 3.44 3.39
4.20 3.02 3.53 n.a. 3.33 n.a.
4.33 3.03 3.72 n.a. 3.40 n.a.
n.a. Not available. The 2007 R&D satellite account only presents estimates for 1959–2004. 1. As published in the national income and product accounts (NIPAs). 2. Real GDP with R&D treated as investment and the double-counting of R&D software removed. 3. As published in the NIPAs when the 2007 R&D satellite account estimates were released. NOTE. Implemented using the aggregate output price index.
8
9
9
10
10
18 R&D Satellite Account Update December 2010
contributed 0.08 percentage point.4
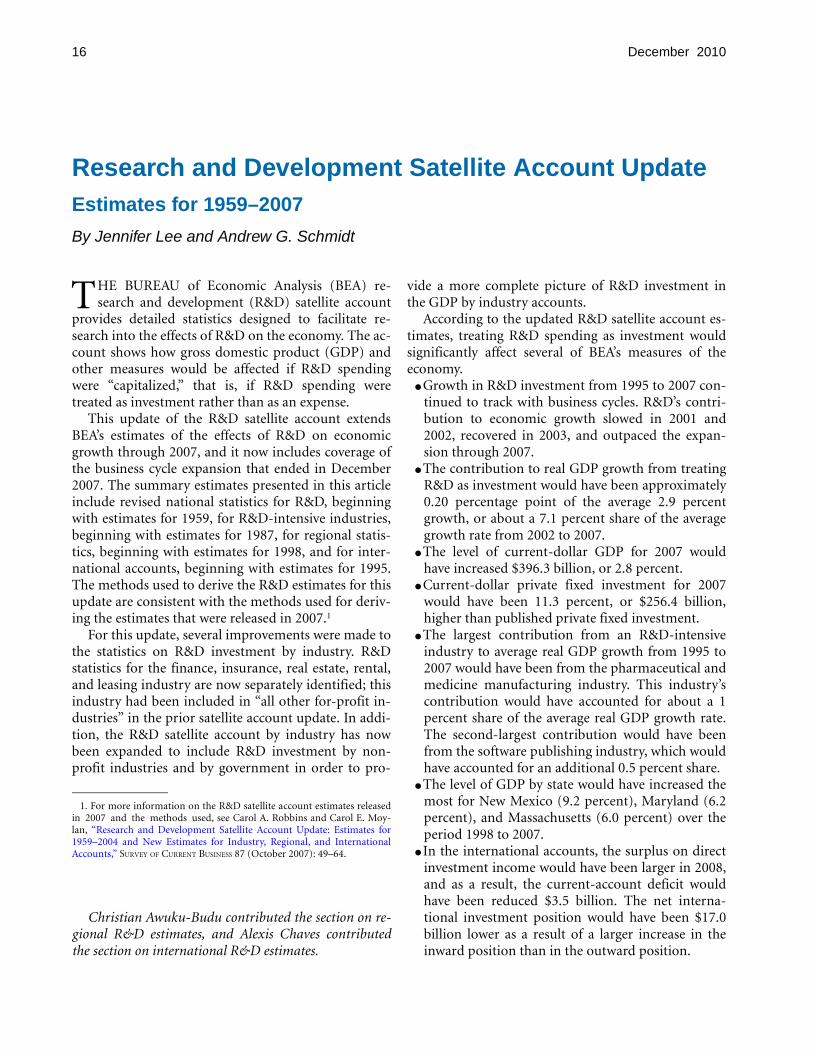
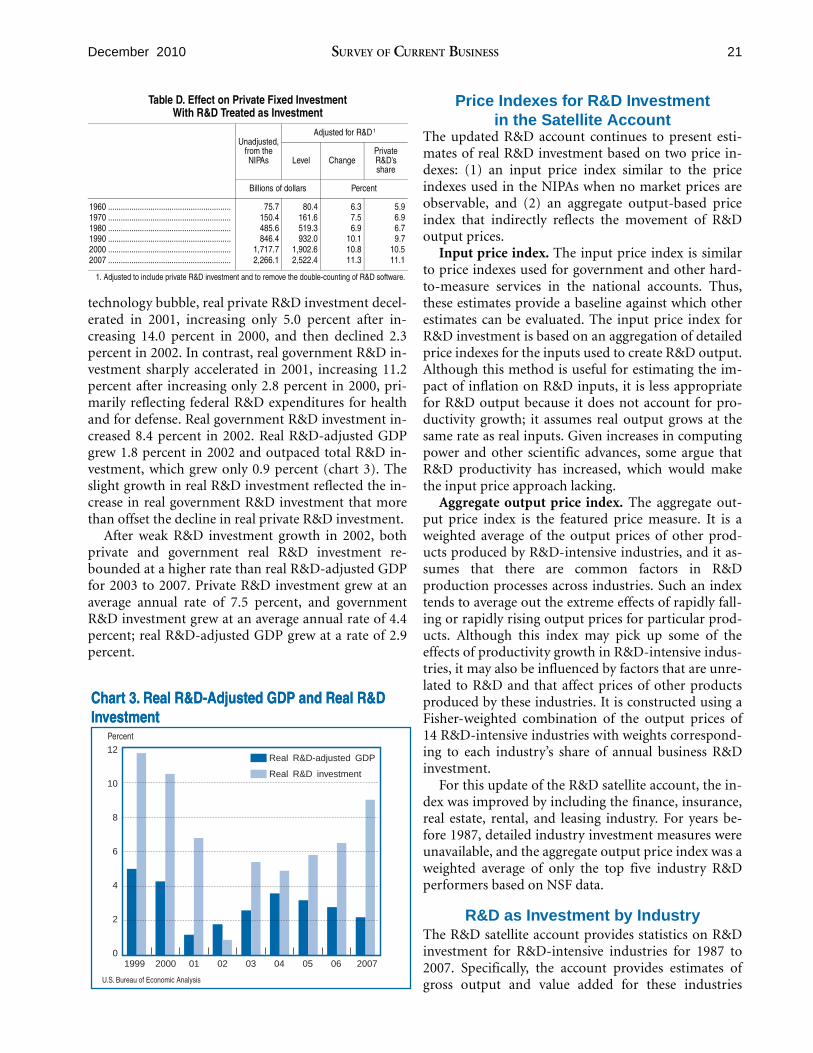
The impact of treating R&D as investment can also be seen by examining the effect of R&D investment on certain NIPA components, such as private fixed investment. Current-dollar private fixed investment for 2007 would have been 11.3 percent, or $256.4 billion, higher than published private fixed investment if R&D were included (table D, page 21). R&D as a share of R&D-adjusted private fixed investment would have increased to 11.1 percent for 2007 from 10.1 percent for 2006 (chart 1). Private R&D investment accelerated while residential fixed investment posted a notably larger decrease because of the housing market crash, resulting in R&D capturing a larger share of private fixed investment. R&D’s gain as a share of private fixed investment for 2007 was the largest since 1991, when the share of R&D increased 1.4 percentage points and also accounted for 11.1 percent of R&D-adjusted private fixed investment.
4. The value of capital services, the value of the R&D assets’ use in production, is defined as the sum of depreciation and the net return on investment. The inclusion in the R&D satellite account of net returns to nonprofits and to general government is a departure from BEA’s current calculation of gross domestic income, which includes only depreciation, a partial measure of capital services. In the current GDP accounts, governments do not earn profits, so only depreciation is counted.
Revisions The picture of the economy presented in the revised R&D estimates is similar to that shown by the estimates published in 2007. In the updated estimates, from 1959 to 1986, current-dollar investment in R&D was revised down slightly for each year; the largest downward revision was $0.2 billion for 1986. From
CharChartt 1.1. PrivPrivate R&D Inate R&D Investment as a Share ofvestment as a Share of R&D-Adjusted PrivR&D-Adjusted Private Fixate Fixed Ined Investmentvestment
U.S. Bureau of Economic Analysis
1999 2000 01 02 03 04 05 06 2007
Percent 11.2
11.0
10.8
10.6
10.4
10.2
10.0
9.8
9.6
9.4
9.2
Table B. Contributions to the Annual Growth Rate of Real GDP With R&D Treated as Investment
1960 1961 1962 1963 1964 1965 1966 1967 1968 1969 1970 1971
Percent change at annual rate: Real GDP 1................................................................
Percentage points at annual rates:
2.73 2.55 6.29 4.46 6.01 6.61 6.63 2.71 4.95 3.23 0.22 3.34
Effect of R&D as Investment 2 ................................... 0.30 0.28 0.38 0.21 0.37 0.36 0.30 0.25 0.25 0.22 0.03 0.08 Business................................................................ 0.09 0.05 0.07 0.06 0.07 0.09 0.10 0.08 0.08 0.09 0.01 0.00 Government .......................................................... 0.21 0.23 0.30 0.14 0.30 0.27 0.19 0.17 0.17 0.12 0.02 0.08 Nonprofit institutions serving households ............. 0.00 0.00 0.00 0.00 0.00 0.00 0.00 0.00 0.00 0.00 0.00 0.00
1972 1973 1974 1975 1976 1977 1978 1979 1980 1981 1982 1983
Percent change at annual rate: Real GDP 1 ................................................................
Percentage points at annual rates:
5.34 5.82 –0.61 –0.33 5.27 4.54 5.51 3.09 –0.25 2.52 –1.84 4.52
Effect of R&D as Investment 2 ................................... 0.18 0.18 –0.07 –0.12 0.06 0.07 0.10 0.06 0.03 0.06 0.06 0.15 Business................................................................ 0.06 0.11 0.00 –0.07 0.06 0.05 0.09 0.09 0.07 0.05 0.07 0.09 Government .......................................................... 0.12 0.07 –0.07 –0.05 0.00 0.02 0.01 –0.03 –0.04 0.00 –0.01 0.05 Nonprofit institutions serving households ............. 0.00 0.00 0.00 0.00 0.00 0.00 0.00 0.00 0.00 0.00 0.00 0.00
1984 1985 1986 1987 1988 1989 1990 1991 1992 1993 1994 1995
Percent change at annual rate: Real GDP 1................................................................
Percentage points at annual rates:
7.19 4.16 3.45 3.20 4.16 3.65 1.94 –0.07 3.42 2.83 4.05 2.71
Effect of R&D as Investment 2................................... 0.23 0.16 0.10 0.11 0.18 0.19 0.13 0.16 0.14 0.06 0.10 0.27 Business................................................................ 0.14 0.11 0.05 0.03 0.10 0.12 0.07 0.13 0.08 0.02 0.05 0.20 Government .......................................................... 0.08 0.05 0.04 0.08 0.08 0.06 0.06 0.03 0.06 0.04 0.05 0.06 Nonprofit institutions serving households ............. 0.00 0.00 0.00 0.00 0.00 0.00 0.00 0.00 0.01 0.01 0.01 0.00
1996 1997 1998 1999 2000 2001 2002 2003 2004 2005 2006 2007
Percent change at annual rate: Real GDP 1 ................................................................
Percentage points at annual rates:
3.97 4.67 4.52 4.99 4.31 1.18 1.78 2.56 3.62 3.17 2.83 2.17
Effect of R&D as Investment 2 ................................... 0.34 0.34 0.29 0.32 0.30 0.14 0.02 0.15 0.16 0.20 0.22 0.28 Business................................................................ 0.25 0.24 0.22 0.26 0.25 0.09 –0.05 0.06 0.07 0.12 0.14 0.20 Government .......................................................... 0.08 0.09 0.07 0.06 0.05 0.04 0.06 0.08 0.09 0.08 0.07 0.08 Nonprofit institutions serving households ............. 0.01 0.01 0.00 0.01 0.01 0.00 0.01 0.01 0.01 0.01 0.01 0.01
1. GDP with R&D treated as investment and with the double-counting of R&D software investment removed. 2. Includes business investment, consumption of fixed capital charges for government and nonprofit institutions serving households, and a net return to government and these nonprofit institutions. NOTE. Implemented using the aggregate output price index.
19 December 2010 SURVEY OF CURRENT BUSINESS
1987 to 2004, current-dollar R&D investment was revised up for each year; the largest revision was $6.7 billion for 2002, reflecting upward revisions to business and federal R&D investment. The upward revision to business R&D investment primarily reflected revisions to net exports of R&D. The upward revisions to federal R&D investment reflected upward revisions to both federal intramural R&D investment and federal extramural R&D investment, based on revised source data from the National Science Foundation (NSF) on federal intramural R&D investment and a revised R&D seller’s margin for R&D purchased from business by the federal government.5 For 2004, the latest available year for the estimates published in 2007, investment in R&D totaled $321.5 billion, an upward revision of $4.9 billion from the previous estimates, reflecting revisions to business R&D investment and to federal extramural R&D investment, based on the same factors cited above (table C).
Revisions to current-dollar R&D-adjusted GDP from 1959 to 2001 primarily reflected the incorporation of the results of the 2009 comprehensive revision of the NIPAs.6 Excluding the effects of the comprehensive revision, the upward revisions to current-dollar R&D-adjusted GDP for 2002 to 2004 primarily reflected upward revisions to business R&D investment and downward revisions to the software R&D overlap adjustment. The software overlap adjustment removes the double-counting of software between the NSF
5. The value of purchased R&D includes the R&D seller’s margin between receipts and costs. Because funds for industrial R&D are valued by businesses at cost in the source data for business R&D performance (National Science Foundation Survey of Industrial Research and Development), the cost-basis value of the R&D funding must be converted to a purchase basis using an estimate of the R&D seller’s margin in order to capture the full value of the R&D investment. The R&D seller’s margin is estimated using the ratio of net operating surplus to gross output for miscellaneous professional, scientific, and technical services from BEA’s GDP by industry data.
6. For more information, see Eugene P. Seskin and Shelly Smith, “Improved Estimates of the National Income and Product Accounts: Results of the 2009 Comprehensive Revision,” SURVEY 89 (September 2009): 15–35.
based R&D investment estimates and the own-account software investment estimates in the NIPAs.7 The revision to the software R&D adjustment reflected a transition to a NIPA-based software adjustment from a NSF-based software adjustment.
As shown in table A, the previous estimates of real R&D-adjusted GDP growth are similar to the updated estimates, although the updated estimates of the average annual growth rates were higher for the periods 1995 to 2001 and 1959 to 2004. The differences in the growth rates primarily reflected the incorporation of the NIPA comprehensive revision in the updated estimates.
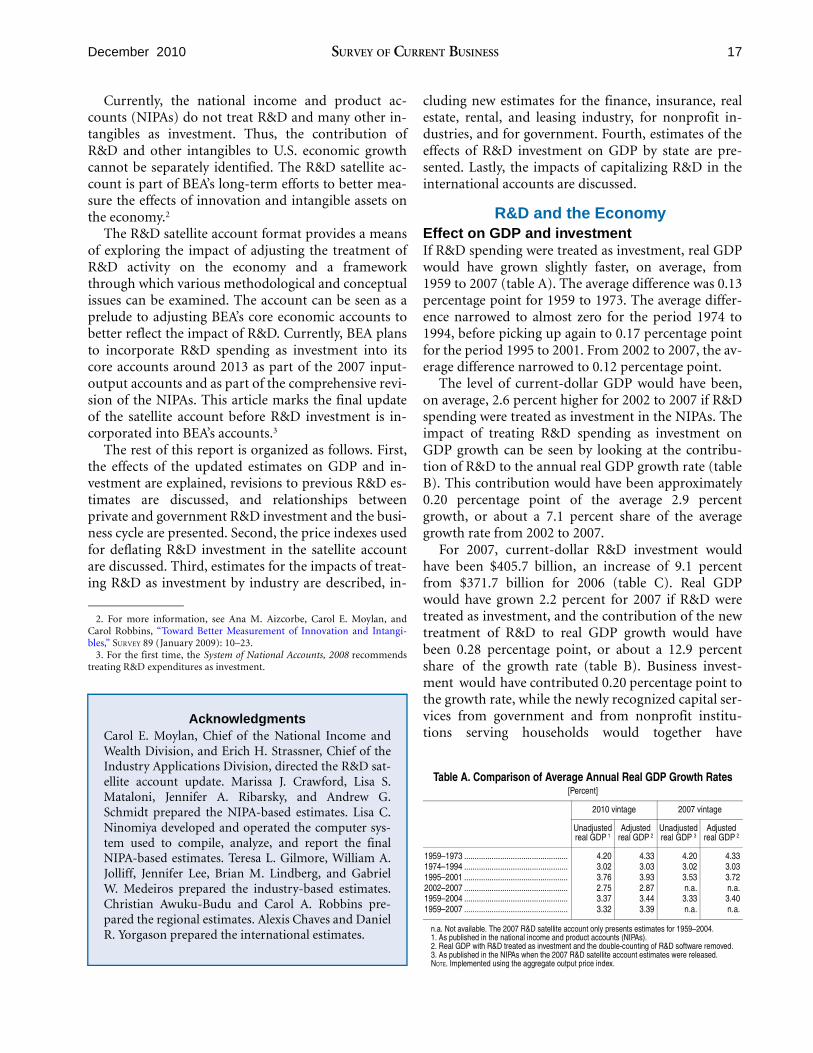
Private and government R&D investment and the business cycle Both private and government R&D investment are shown to be strongly procyclical from 1959 to 2007.8 In years of increasing economic growth, R&D investment usually contributes to that acceleration. Similarly, when economic growth slows, R&D often contributes to the slowdown. A major period of growth during the 1991 to 2000 economic expansion was the information technology boom from 1995 to 2000 in which real private R&D investment grew at an average annual rate of 14.9 percent, while real R&D-adjusted GDP grew at a rate of 4.5 percent (chart 2). By comparison, real government R&D investment grew only slightly faster (5.3 percent) than real R&D-adjusted GDP in this period. Reflecting the recession in 2001 and the bursting of the
7. The expense of developing software that is marketed outside the company is treated as an R&D activity in the NSF source data, which is used to derive R&D investment estimates, and is included in the own-account software investment in the NIPA estimates. For this article, this software R&D overlap amount is removed from the NIPA own-account software investment estimates and is retained in R&D investment.
8. Private R&D investment includes R&D spending by business and by nonprofit institutions (including private universities and colleges and other nonprofit institutions) serving households. Government R&D investment includes R&D spending by federal and state and local governments (including public universities and colleges).
Chart 2. Real R&D-Adjusted GDP, Real Private R&D Investment, and Real Government R&D Investment
U.S. Bureau of Economic Analysis
Percent
16
14
12
10
8
6
4
2
0
–2
–4 1995–2000 2001 2002 2003–2007
Real R&D-adjusted GDP Real private R&D investment Real government R&D investment
20 R&D Satellite Account Update December 2010
Table C. GDP and the Decomposition of the Adjustments to GDP by Treating R&D as Investment [Billions of dollars]
GDP (from the NIPAs).......................................................................
1959
506.6
1960
526.4
1961
544.8
1962
585.7
1963
617.8
1964
663.6
1965
719.1
1966
787.7
1967
832.4
1968
909.8
1969
984.4
1970
1,038.3
2010 R&D satellite account: Total adjustments to GDP from R&D investment........................ 11.1 12.5 13.8 15.4 17.0 19.1 21.5 23.9 26.0 28.5 30.6 31.9
Business 1 ............................................................................... 4.2 4.6 4.9 5.2 5.6 6.1 6.7 7.5 8.4 9.3 10.3 10.8 Government ........................................................................... 6.8 7.7 8.8 10.0 11.2 12.8 14.5 16.0 17.4 18.9 19.9 20.7 Nonprofit institutions serving households .............................. 0.1 0.1 0.2 0.2 0.2 0.2 0.2 0.3 0.3 0.3 0.4 0.4
GDP with R&D treated as investment 2 ...................................... 517.7 539.0 558.6 601.1 634.8 682.7 740.6 811.5 858.5 938.4 1,015.1 1,070.2 Percent change in the level of GDP ....................................... 2.2 2.4 2.5 2.6 2.8 2.9 3.0 3.0 3.1 3.1 3.1 3.1
2007 R&D satellite account: Total adjustments to GDP from R&D investment........................ 11.1 12.5 13.8 15.4 17.0 19.1 21.5 23.9 26.1 28.6 30.7 31.9
Business 1 ............................................................................... 4.2 4.6 4.9 5.2 5.6 6.1 6.7 7.5 8.4 9.3 10.3 10.8 Government ........................................................................... 6.8 7.7 8.8 10.0 11.2 12.8 14.5 16.1 17.4 19.0 20.0 20.7 Nonprofit institutions serving households .............................. 0.1 0.1 0.1 0.2 0.2 0.2 0.2 0.3 0.3 0.3 0.4 0.4
GDP with R&D treated as investment 3...................................... 517.7 538.9 558.5 601.1 634.8 682.7 740.6 811.7 858.7 938.6 1,015.3 1,070.5 Percent change in the level of GDP ....................................... 2.2 2.4 2.5 2.6 2.8 2.9 3.0 3.0 3.1 3.1 3.1 3.1
Addendum: R&D investment (2010 vintage) 4 ...................................................
GDP (from the NIPAs)....................................................................... 2010 R&D satellite account:
13.9
1971
1,126.8
15.2
1972
1,237.9
16.1
1973
1,382.3
17.2
1974
1,499.5
19.2
1975
1,637.7
20.9
1976
1,824.6
22.2
1977
2,030.1
24.3
1978
2,293.8
25.7
1979
2,562.2
27.2
1980
2,788.1
28.3
1981
3,126.8
28.5
1982
3,253.2
Total adjustments to GDP from R&D investment........................ 33.8 35.8 38.7 43.3 48.3 52.2 56.6 62.9 70.5 80.5 93.2 101.9 Business 1 ............................................................................... 11.2 12.1 13.8 15.5 16.6 18.6 20.5 23.9 28.3 33.8 39.5 44.7 Government ........................................................................... 22.2 23.2 24.4 27.2 31.0 32.9 35.2 38.0 41.1 45.5 52.2 55.6 Nonprofit institutions serving households .............................. 0.4 0.5 0.5 0.6 0.7 0.8 0.9 1.0 1.1 1.2 1.5 1.6
GDP with R&D treated as investment 2 ...................................... 1,160.6 1,273.7 1,421.0 1,542.8 1,686.0 1,876.8 2,086.8 2,356.2 2,631.9 2,867.5 3,218.4 3,353.2 Percent change in the level of GDP .......................................
2007 R&D satellite account:
3.0 2.9 2.8 2.9 3.0 2.9 2.8 2.7 2.7 2.8 2.9 3.1
Total adjustments to GDP from R&D investment........................ 33.8 35.9 38.7 43.4 48.4 52.3 56.7 62.9 70.6 80.6 93.3 102.1 Business 1 .............................................................................. 11.2 12.1 13.8 15.5 16.6 18.6 20.6 23.9 28.3 33.8 39.5 44.7 Government ........................................................................... 22.2 23.3 24.4 27.2 31.1 32.9 35.3 38.1 41.2 45.6 52.3 55.8 Nonprofit institutions serving households .............................. 0.4 0.5 0.5 0.6 0.7 0.8 0.9 1.0 1.1 1.3 1.5 1.6
GDP with R&D treated as investment 3 ...................................... 1,161.0 1,274.2 1,421.4 1,543.3 1,686.7 1,877.5 2,087.7 2,357.3 2,633.1 2,868.9 3,220.2 3,355.2 Percent change in the level of GDP .......................................
Addendum:
3.0 2.9 2.8 2.9 3.0 2.9 2.8 2.7 2.7 2.8 2.9 3.1
R&D investment (2010 vintage) 4 ...................................................
GDP (from the NIPAs).......................................................................
2010 R&D satellite account:
29.3
1983
3,534.6
31.3
1984
3,930.9
33.8
1985
4,217.5
36.4
1986
4,460.1
39.0
1987
4,736.4
43.0
1988
5,100.4
47.1
1989
5,482.1
53.1
1990
5,800.5
61.1
1991
5,992.1
70.6
1992
6,342.3
81.1
1993
6,667.4
90.1
1994
7,085.2
Total adjustments to GDP from R&D investment........................ 111.3 125.2 135.6 143.2 149.7 161.8 173.3 179.2 190.8 196.2 199.1 204.2 Business 1 ............................................................................... 49.8 57.4 63.5 67.4 69.4 75.6 83.1 87.0 96.1 100.1 101.1 103.9 Government ........................................................................... 59.7 65.9 69.9 73.5 77.9 83.5 87.2 88.9 91.1 92.2 93.8 95.7 Nonprofit institutions serving households .............................. 1.8 2.0 2.1 2.3 2.5 2.8 3.0 3.3 3.6 3.9 4.2 4.5
GDP with R&D treated as investment 2 ...................................... 3,643.5 4,053.4 4,349.9 4,599.7 4,882.2 5,258.0 5,650.8 5,974.6 6,177.4 6,532.6 6,860.2 7,282.7 Percent change in the level of GDP .......................................
2007 R&D satellite account:
3.1 3.1 3.1 3.1 3.1 3.1 3.1 3.0 3.1 3.0 2.9 2.8
Total adjustments to GDP from R&D investment........................ 111.4 125.4 135.8 143.4 150.4 162.2 173.6 179.3 190.8 196.2 198.8 203.9 Business 1 ............................................................................... 49.8 57.4 63.5 67.4 69.5 75.7 83.4 87.3 96.5 100.6 101.4 104.3 Government ........................................................................... 59.8 66.0 70.1 73.7 78.4 83.7 87.2 88.7 90.7 91.7 93.2 95.1 Nonprofit institutions serving households .............................. 1.8 2.0 2.2 2.3 2.5 2.8 3.1 3.3 3.6 3.9 4.2 4.6
GDP with R&D treated as investment 3 ...................................... 3,645.7 4,055.9 4,352.9 4,602.7 4,886.0 5,261.7 5,653.3 5,977.3 6,181.3 6,528.1 6,850.0 7,269.5 Percent change in the level of GDP .......................................
Addendum:
3.1 3.1 3.1 3.1 3.1 3.1 3.1 3.0 3.1 3.0 2.9 2.8
R&D investment (2010 vintage) 4 ................................................... 99.8 113.2 127.0 134.1 143.2 151.5 160.1 166.1 174.5 178.2 179.2 182.9
1995 1996 1997 1998 1999 2000 2001 2002 2003 2004 2005 2006 2007
GDP (from the NIPAs).......................................................................
2010 R&D satellite account:
7,414.7 7,838.5 8,332.4 8,793.5 9,353.5 9,951.5 10,286.2 10,642.3 11,142.1 11,867.8 12,638.4 13,398.9 14,061.8
Total adjustments to GDP from R&D investment........................ 216.3 228.1 241.4 251.5 270.0 293.5 296.7 293.7 306.7 323.4 351.3 382.3 420.0 Business 1 ............................................................................... 115.8 128.6 142.1 153.9 171.8 193.4 197.2 189.7 195.4 203.5 221.1 241.8 269.6 Government ........................................................................... 95.8 94.5 94.1 92.3 92.6 94.1 93.3 97.2 103.8 111.7 121.3 130.7 139.7 Nonprofit institutions serving households .............................. 4.8 4.9 5.2 5.3 5.6 6.0 6.3 6.8 7.5 8.2 8.9 9.8 10.6
GDP with R&D treated as investment 2 ...................................... 7,624.0 8,059.1 8,566.0 9,036.5 9,611.2 10,229.9 10,567.4 10,920.6 11,431.0 12,170.4 12,967.3 13,759.1 14,458.1 Percent change in the level of GDP .......................................
2007 R&D satellite account:
2.8 2.8 2.8 2.8 2.8 2.8 2.7 2.6 2.6 2.5 2.6 2.7 2.8
Total adjustments to GDP from R&D investment........................ 215.9 227.4 240.8 250.3 268.3 292.0 293.4 288.6 301.3 318.1 ............... ............... ............... Business 1 ............................................................................... 116.1 128.9 142.5 154.0 171.4 193.6 195.8 186.9 192.5 200.9 ............... ............... ............... Government ........................................................................... 95.0 93.6 93.2 91.0 91.2 92.4 91.3 94.9 101.3 109.1 ............... ............... ............... Nonprofit institutions serving households .............................. 4.8 4.9 5.2 5.3 5.6 6.0 6.3 6.8 7.4 8.1 ............... ............... ...............
GDP with R&D treated as investment 3...................................... 7,606.6 8,036.9 8,537.4 8,988.8 9,524.4 10,093.9 10,405.8 10,734.2 11,234.9 11,969.4 ............... ............... ............... Percent change in the level of GDP .......................................
Addendum:
2.8 2.8 2.8 2.8 2.8 2.8 2.7 2.5 2.5 2.4 ............... ............... ...............
R&D investment (2010 vintage) 4 ................................................... 196.5 210.2 225.5 239.1 258.4 281.5 292.4 292.0 306.0 321.5 345.3 371.7 405.7
1. Includes the amount of the R&D software overlap that is reflected in total business R&D investment. 4. R&D investment includes spending on R&D by government and nonprofit institutions serving households, 2. GDP adjusted by treating R&D as investment and with the double-counting of R&D software investment whereas the adjustment to GDP for this spending consists only of consumption of fixed capital charges and net
removed. returns to R&D investment. 3. GDP, as published in the NIPAs when the 2007 R&D satellite account was released, adjusted by treating NOTE. Implemented using the aggregate output price index to estimate current-cost depreciation.
R&D as investment and with the double-counting of R&D software investment removed.
8
9
9
10
10
21 December 2010 SURVEY OF CURRENT BUSINESS
Table D. Effect on Private Fixed Investment With R&D Treated as Investment
Unadjusted, from the NIPAs
Adjusted for R&D 1
Level Change Private R&D’s share
Billions of dollars Percent
1960 .......................................................... 1970 .......................................................... 1980 .......................................................... 1990 .......................................................... 2000 .......................................................... 2007 ..........................................................
75.7 80.4 150.4 161.6 485.6 519.3 846.4 932.0
1,717.7 1,902.6 2,266.1 2,522.4
6.3 5.9 7.5 6.9 6.9 6.7
10.1 9.7 10.8 10.5 11.3 11.1
1. Adjusted to include private R&D investment and to remove the double-counting of R&D software.
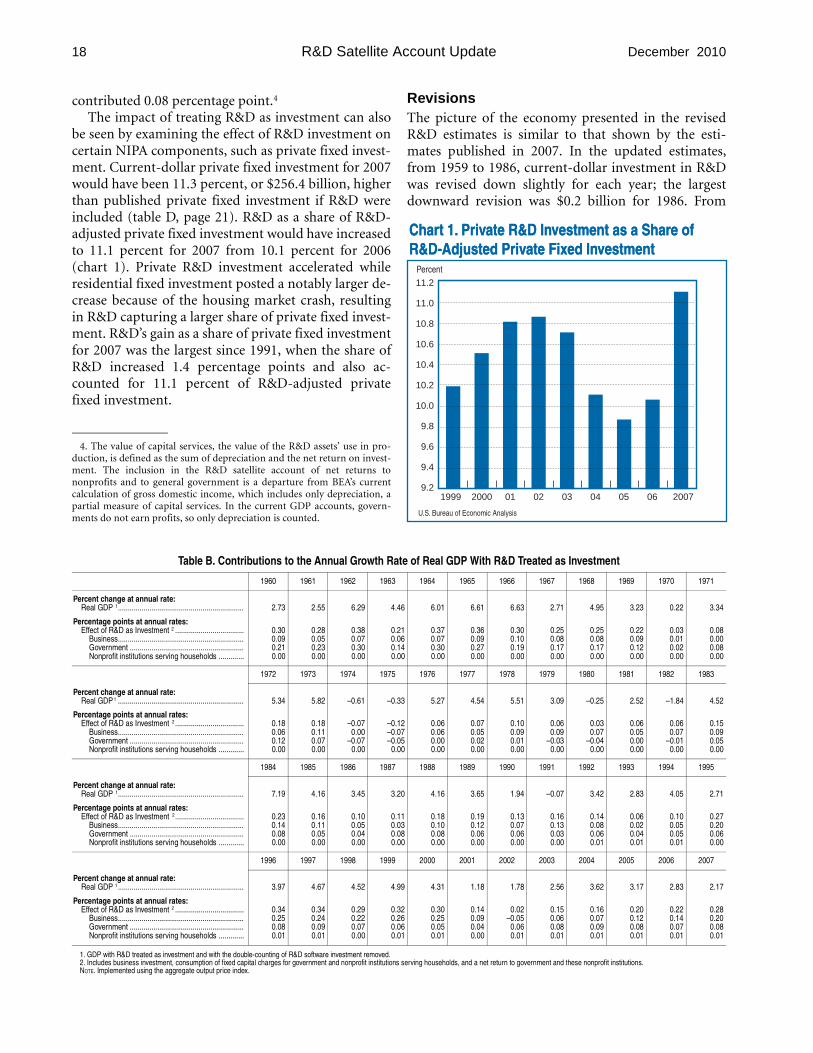
technology bubble, real private R&D investment decelerated in 2001, increasing only 5.0 percent after increasing 14.0 percent in 2000, and then declined 2.3 percent in 2002. In contrast, real government R&D investment sharply accelerated in 2001, increasing 11.2 percent after increasing only 2.8 percent in 2000, primarily reflecting federal R&D expenditures for health and for defense. Real government R&D investment increased 8.4 percent in 2002. Real R&D-adjusted GDP grew 1.8 percent in 2002 and outpaced total R&D investment, which grew only 0.9 percent (chart 3). The slight growth in real R&D investment reflected the increase in real government R&D investment that more than offset the decline in real private R&D investment.
After weak R&D investment growth in 2002, both private and government real R&D investment rebounded at a higher rate than real R&D-adjusted GDP for 2003 to 2007. Private R&D investment grew at an average annual rate of 7.5 percent, and government R&D investment grew at an average annual rate of 4.4 percent; real R&D-adjusted GDP grew at a rate of 2.9 percent.
CharChartt 3.3. Real R&D-Adjusted GDP and Real R&DReal R&D-Adjusted GDP and Real R&D InInvestmentvestment
Percent 12
10
8
6
4
2
0
Real R&D-adjusted GDP
Real R&D investment
1999 2000 01 02 03 04 05 06 2007
U.S. Bureau of Economic Analysis
Price Indexes for R&D Investment in the Satellite Account
The updated R&D account continues to present estimates of real R&D investment based on two price indexes: (1) an input price index similar to the price indexes used in the NIPAs when no market prices are observable, and (2) an aggregate output-based price index that indirectly reflects the movement of R&D output prices.
Input price index. The input price index is similar to price indexes used for government and other hard-to-measure services in the national accounts. Thus, these estimates provide a baseline against which other estimates can be evaluated. The input price index for R&D investment is based on an aggregation of detailed price indexes for the inputs used to create R&D output. Although this method is useful for estimating the impact of inflation on R&D inputs, it is less appropriate for R&D output because it does not account for productivity growth; it assumes real output grows at the same rate as real inputs. Given increases in computing power and other scientific advances, some argue that R&D productivity has increased, which would make the input price approach lacking.
Aggregate output price index. The aggregate output price index is the featured price measure. It is a weighted average of the output prices of other products produced by R&D-intensive industries, and it assumes that there are common factors in R&D production processes across industries. Such an index tends to average out the extreme effects of rapidly falling or rapidly rising output prices for particular products. Although this index may pick up some of the effects of productivity growth in R&D-intensive industries, it may also be influenced by factors that are unrelated to R&D and that affect prices of other products produced by these industries. It is constructed using a Fisher-weighted combination of the output prices of 14 R&D-intensive industries with weights corresponding to each industry’s share of annual business R&D investment.
For this update of the R&D satellite account, the index was improved by including the finance, insurance, real estate, rental, and leasing industry. For years before 1987, detailed industry investment measures were unavailable, and the aggregate output price index was a weighted average of only the top five industry R&D performers based on NSF data.
R&D as Investment by Industry The R&D satellite account provides statistics on R&D investment for R&D-intensive industries for 1987 to 2007. Specifically, the account provides estimates of gross output and value added for these industries
22 R&D Satellite Account Update December 2010
when R&D is treated as investment. The R&D satellite account provides detail for 14
R&D-intensive private industries. These 14 industries have the highest ratios of R&D investment to industry receipts and accounted for more than two-thirds of business R&D spending for 2007 (table 5.1). These industries include pharmaceutical and medicine manufacturing; semiconductor manufacturing; software publishing; motor vehicles, bodies and trailers, and parts manufacturing; computer systems design services; and nine other industries.9
The R&D satellite account by industry was improved to separately estimate R&D statistics for the finance, insurance, real estate, rental, and leasing industry. In the previous satellite account update, R&D investment for this industry was included in “all other for-profit industries.” For 2007, R&D investment by this industry was $2.2 billion, or 1 percent of total private industry investment in R&D.
The updated R&D satellite account contains an additional improvement to the R&D investment estimates by industry. It was expanded to include R&D investment by nonprofit industries and by government based on the methodology used in the NIPA-based satellite account. Including nonprofits and government provides a full accounting of R&D investment in the GDP by industry accounts.
9. Three manufacturing groups can be shown with these data—chemical manufacturing (NAICS 325), computer and electronic product manufacturing (NAICS 334), and transportation equipment manufacturing (NAICS 336). For a list of the detailed industries, see table E.
The methodology used to prepare R&D investment by industry for this update is consistent with that used to construct the 2007 update.10 This methodology is based on the framework that was developed to treat spending on software as investment for the 1999 comprehensive revision of the NIPAs.11 The steps involved in adjusting gross output, intermediate inputs and value added for business R&D as investment are shown in table 8 for the pharmaceutical and medicine manufacturing industry for 2007.
The updated R&D investment by industry estimates incorporate results from the 2009 comprehensive revision of the NIPAs and the 2010 comprehensive revision of the annual industry accounts.12 Overall, the revisions were not large and do not change the picture of the economy presented in the 2007 update. The revisions were primarily due to the incorporation of unpublished source data from BEA’s international accounts.
Industry results Recognizing R&D as investment changes the relative importance of the 14 industries as contributors to economic growth. Table E compares each industry’s share
10. Robbins and Moylan, 56–57. 11. Brent R. Moulton, Robert P. Parker, and Eugene P. Seskin, “A Preview
of the 1999 Comprehensive NIPA Revision: Definitional and Classificational Changes,” SURVEY 79 (August 1999): 7–20.
12. Seskin and Smith, 15–35 and Matthew M. Donahoe, Edward T. Morgan, Kevin J. Muck, and Ricky L. Stewart, “Annual Industry Accounts: Advance Statistics on GDP by Industry for 2009 and Revised Statistics for 1998–2008, Comprehensive Revision,” SURVEY 90 (June 2010): 14–20.
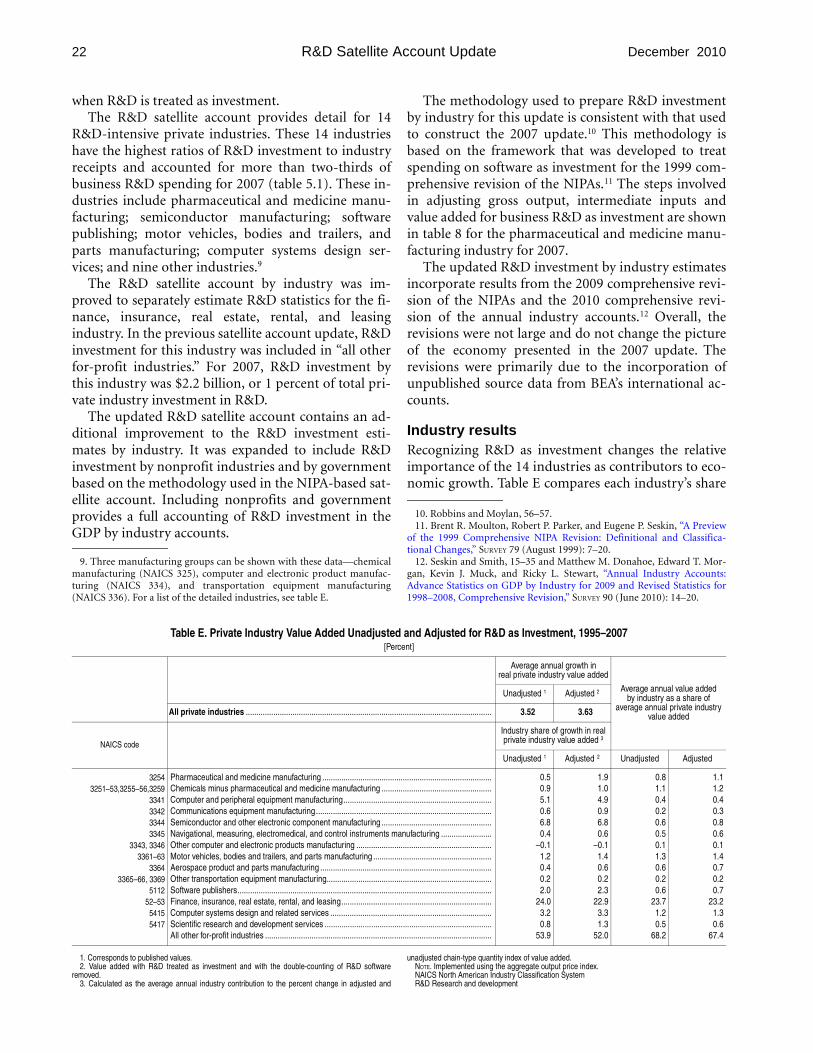
Table E. Private Industry Value Added Unadjusted and Adjusted for R&D as Investment, 1995–2007 [Percent]
Average annual growth in real private industry value added
Average annual value added by industry as a share of
average annual private industry value added
Unadjusted 1 Adjusted 2
All private industries .................................................................................................................... 3.52 3.63
NAICS code
Industry share of growth in real private industry value added 3
Unadjusted 1 Adjusted 2 Unadjusted Adjusted
3254 Pharmaceutical and medicine manufacturing ................................................................................ 0.5 1.9 0.8 1.1 3251–53,3255–56,3259 Chemicals minus pharmaceutical and medicine manufacturing .................................................... 0.9 1.0 1.1 1.2
3341 Computer and peripheral equipment manufacturing...................................................................... 5.1 4.9 0.4 0.4 3342 Communications equipment manufacturing................................................................................... 0.6 0.9 0.2 0.3 3344 Semiconductor and other electronic component manufacturing .................................................... 6.8 6.8 0.6 0.8 3345 Navigational, measuring, electromedical, and control instruments manufacturing ........................ 0.4 0.6 0.5 0.6
3343, 3346 Other computer and electronic products manufacturing ................................................................ –0.1 –0.1 0.1 0.1 3361–63 Motor vehicles, bodies and trailers, and parts manufacturing ........................................................ 1.2 1.4 1.3 1.4
3364 Aerospace product and parts manufacturing ................................................................................. 0.4 0.6 0.6 0.7 3365–66, 3369 Other transportation equipment manufacturing.............................................................................. 0.2 0.2 0.2 0.2
5112 Software publishers........................................................................................................................ 2.0 2.3 0.6 0.7 52–53 Finance, insurance, real estate, rental, and leasing....................................................................... 24.0 22.9 23.7 23.2
5415 Computer systems design and related services ............................................................................ 3.2 3.3 1.2 1.3 5417 Scientific research and development services ............................................................................... 0.8 1.3 0.5 0.6
All other for-profit industries ........................................................................................................... 53.9 52.0 68.2 67.4
1. Corresponds to published values. unadjusted chain-type quantity index of value added. 2. Value added with R&D treated as investment and with the double-counting of R&D software NOTE. Implemented using the aggregate output price index.
removed. NAICS North American Industry Classification System 3. Calculated as the average annual industry contribution to the percent change in adjusted and R&D Research and development
23 December 2010 SURVEY OF CURRENT BUSINESS
of private industry value added before and after the adjustment for R&D investment and its share of the average annual growth rate of real private industry value added.
From 1995 to 2007, if R&D were treated as investment, private industry value added would have grown at an average annual rate of 3.6 percent.13 This compares with an unadjusted estimate of 3.5 percent growth.
If R&D were treated as investment, the pharmaceutical and medicine manufacturing industry’s share of the growth in real private industry value added would be almost four times larger (1.9 percent, compared with the unadjusted estimate of 0.5 percent). In the scientific R&D services industry, the share of real private industry value added growth would be 1.3 per
13. This growth rate differs from that of GDP because (1) the source data used for the estimates differ and (2) the scope of measurement here is only the value added of private industries and does not include the government and nonprofit sectors.
cent, compared with 0.8 percent. The software publishing industry’s and the computer services industry’s shares of growth would each be larger. The slight reduction in the share of growth in private industry value added attributed to the computer and peripheral equipment manufacturing industry and the finance, insurance, real estate, rental, and leasing industry is due to the slower growth of real R&D investment relative to each industry’s real output.
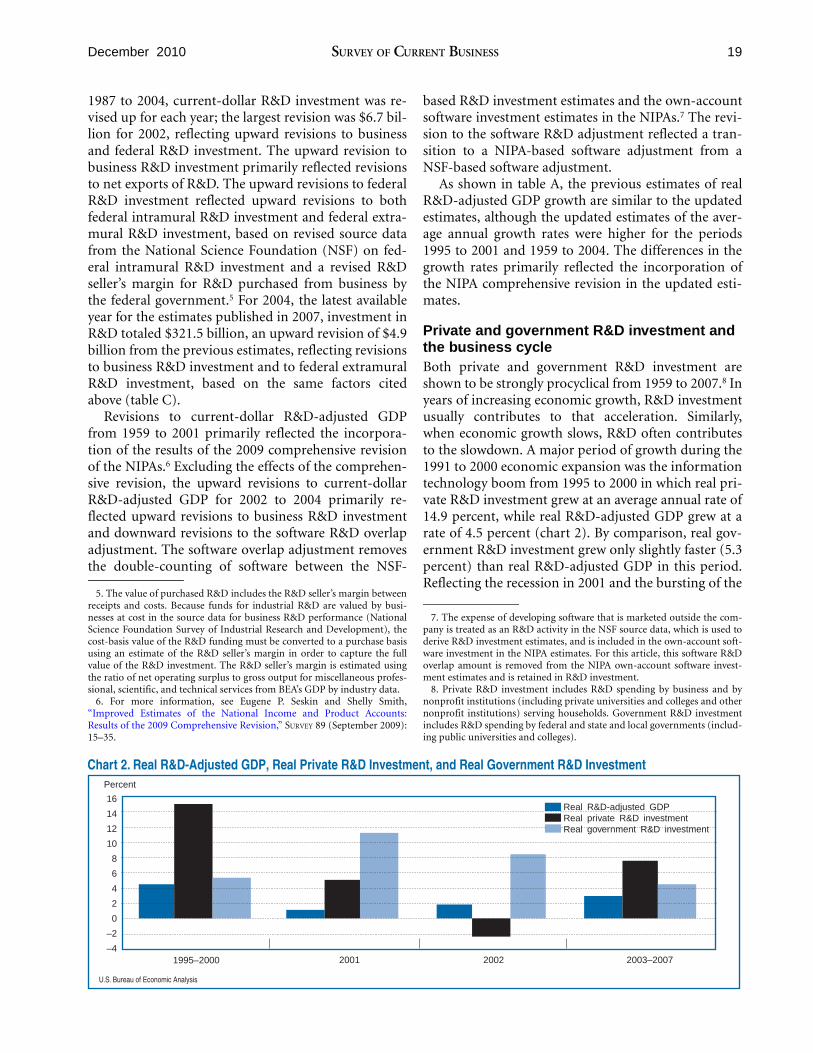
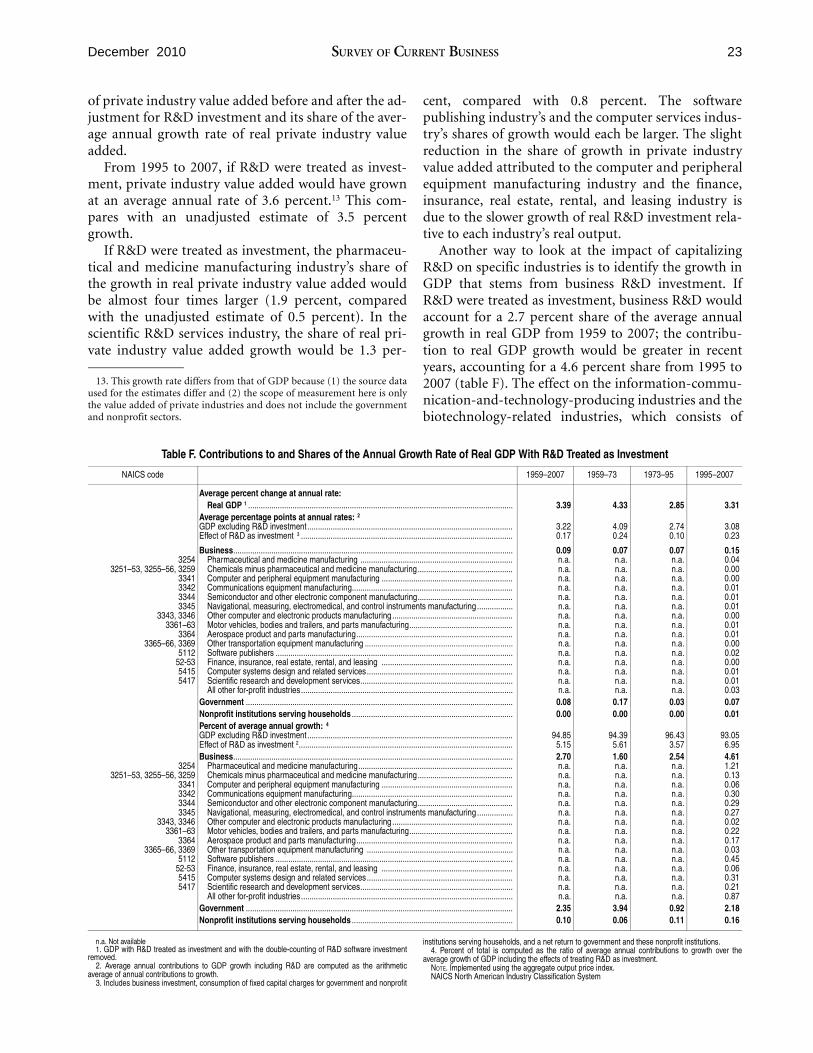
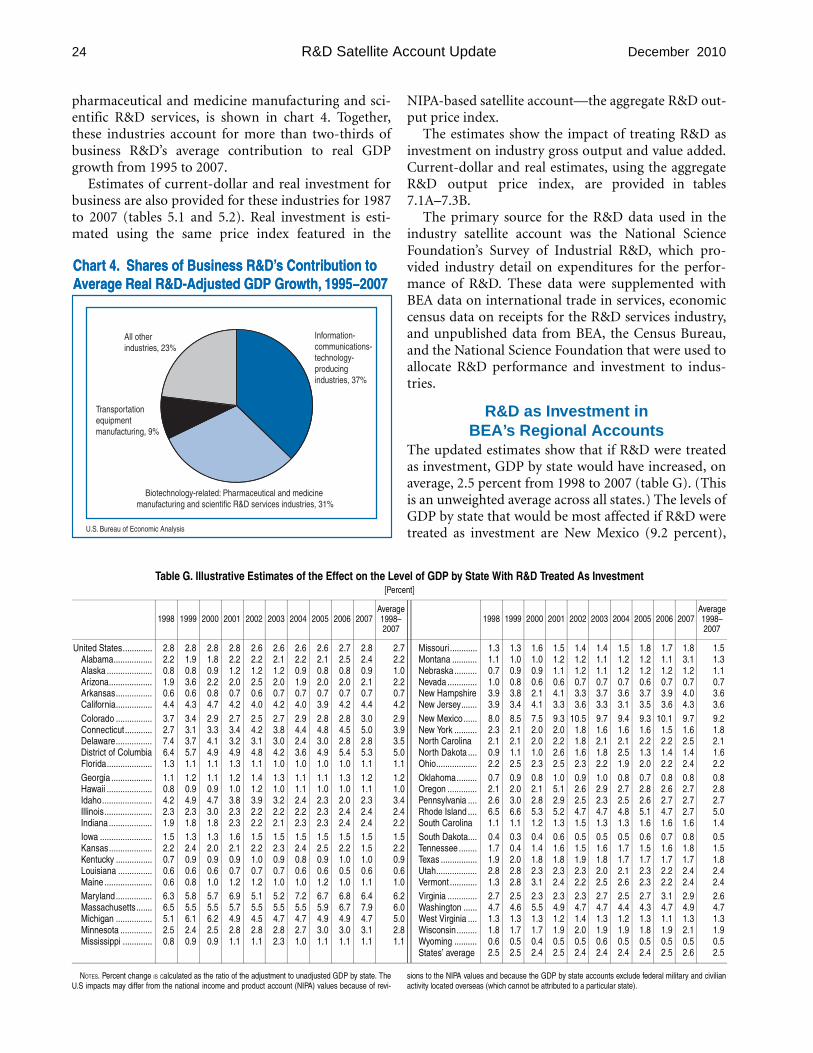
Another way to look at the impact of capitalizing R&D on specific industries is to identify the growth in GDP that stems from business R&D investment. If R&D were treated as investment, business R&D would account for a 2.7 percent share of the average annual growth in real GDP from 1959 to 2007; the contribution to real GDP growth would be greater in recent years, accounting for a 4.6 percent share from 1995 to 2007 (table F). The effect on the information-communication-and-technology-producing industries and the biotechnology-related industries, which consists of
Table F. Contributions to and Shares of the Annual Growth Rate of Real GDP With R&D Treated as Investment
NAICS code 1959–2007 1959–73 1973–95 1995–2007
Average percent change at annual rate: Real GDP 1 .............................................................................................................................
Average percentage points at annual rates: 2
3.39 4.33 2.85 3.31
GDP excluding R&D investment................................................................................................. 3.22 4.09 2.74 3.08 Effect of R&D as investment 3 .................................................................................................... 0.17 0.24 0.10 0.23
Business.................................................................................................................................... 0.09 0.07 0.07 0.15 3254 Pharmaceutical and medicine manufacturing ........................................................................ n.a. n.a. n.a. 0.04
3251–53, 3255–56, 3259 Chemicals minus pharmaceutical and medicine manufacturing ............................................. n.a. n.a. n.a. 0.00 3341 Computer and peripheral equipment manufacturing .............................................................. n.a. n.a. n.a. 0.00 3342 Communications equipment manufacturing............................................................................ n.a. n.a. n.a. 0.01 3344 Semiconductor and other electronic component manufacturing............................................. n.a. n.a. n.a. 0.01 3345 Navigational, measuring, electromedical, and control instruments manufacturing ................. n.a. n.a. n.a. 0.01
3343, 3346 Other computer and electronic products manufacturing ......................................................... n.a. n.a. n.a. 0.00 3361–63 Motor vehicles, bodies and trailers, and parts manufacturing................................................. n.a. n.a. n.a. 0.01
3364 Aerospace product and parts manufacturing.......................................................................... n.a. n.a. n.a. 0.01 3365–66, 3369 Other transportation equipment manufacturing ...................................................................... n.a. n.a. n.a. 0.00
5112 Software publishers ................................................................................................................ n.a. n.a. n.a. 0.02 52-53 Finance, insurance, real estate, rental, and leasing .............................................................. n.a. n.a. n.a. 0.00 5415 Computer systems design and related services..................................................................... n.a. n.a. n.a. 0.01 5417 Scientific research and development services........................................................................ n.a. n.a. n.a. 0.01
All other for-profit industries.................................................................................................... n.a. n.a. n.a. 0.03 Government .............................................................................................................................. 0.08 0.17 0.03 0.07 Nonprofit institutions serving households ............................................................................ Percent of average annual growth: 4
0.00 0.00 0.00 0.01
GDP excluding R&D investment................................................................................................. 94.85 94.39 96.43 93.05 Effect of R&D as investment 2..................................................................................................... 5.15 5.61 3.57 6.95 Business.................................................................................................................................... 2.70 1.60 2.54 4.61
3254 Pharmaceutical and medicine manufacturing......................................................................... n.a. n.a. n.a. 1.21 3251–53, 3255–56, 3259 Chemicals minus pharmaceutical and medicine manufacturing ............................................. n.a. n.a. n.a. 0.13
3341 Computer and peripheral equipment manufacturing .............................................................. n.a. n.a. n.a. 0.06 3342 Communications equipment manufacturing............................................................................ n.a. n.a. n.a. 0.30 3344 Semiconductor and other electronic component manufacturing............................................. n.a. n.a. n.a. 0.29 3345 Navigational, measuring, electromedical, and control instruments manufacturing ................. n.a. n.a. n.a. 0.27
3343, 3346 Other computer and electronic products manufacturing ......................................................... n.a. n.a. n.a. 0.02 3361–63 Motor vehicles, bodies and trailers, and parts manufacturing................................................. n.a. n.a. n.a. 0.22
3364 Aerospace product and parts manufacturing.......................................................................... n.a. n.a. n.a. 0.17 3365–66, 3369 Other transportation equipment manufacturing ..................................................................... n.a. n.a. n.a. 0.03
5112 Software publishers ................................................................................................................ n.a. n.a. n.a. 0.45 52-53 Finance, insurance, real estate, rental, and leasing .............................................................. n.a. n.a. n.a. 0.06 5415 Computer systems design and related services..................................................................... n.a. n.a. n.a. 0.31 5417 Scientific research and development services........................................................................ n.a. n.a. n.a. 0.21
All other for-profit industries.................................................................................................... n.a. n.a. n.a. 0.87 Government .............................................................................................................................. 2.35 3.94 0.92 2.18 Nonprofit institutions serving households ............................................................................ 0.10 0.06 0.11 0.16
n.a. Not available institutions serving households, and a net return to government and these nonprofit institutions. 1. GDP with R&D treated as investment and with the double-counting of R&D software investment 4. Percent of total is computed as the ratio of average annual contributions to growth over the
removed. average growth of GDP including the effects of treating R&D as investment. 2. Average annual contributions to GDP growth including R&D are computed as the arithmetic NOTE. Implemented using the aggregate output price index.
average of annual contributions to growth. NAICS North American Industry Classification System 3. Includes business investment, consumption of fixed capital charges for government and nonprofit
24 R&D Satellite Account Update December 2010
pharmaceutical and medicine manufacturing and scientific R&D services, is shown in chart 4. Together, these industries account for more than two-thirds of business R&D’s average contribution to real GDP growth from 1995 to 2007.
Estimates of current-dollar and real investment for business are also provided for these industries for 1987 to 2007 (tables 5.1 and 5.2). Real investment is estimated using the same price index featured in the
CharChartt 4.4. Shares of Business R&D’Shares of Business R&D’s Contribs Contribution toution to AAveraveragge Real R&D-Adjusted GDP Gre Real R&D-Adjusted GDP Groowth,wth, 1995−20071995−2007
Information-industries, 23% communications-
technology-producing industries, 37%
All other
Transportation equipment manufacturing, 9%
Biotechnology-related: Pharmaceutical and medicine manufacturing and scientific R&D services industries, 31%
U.S. Bureau of Economic Analysis
NIPA-based satellite account—the aggregate R&D output price index.
The estimates show the impact of treating R&D as investment on industry gross output and value added. Current-dollar and real estimates, using the aggregate R&D output price index, are provided in tables 7.1A–7.3B.
The primary source for the R&D data used in the industry satellite account was the National Science Foundation’s Survey of Industrial R&D, which provided industry detail on expenditures for the performance of R&D. These data were supplemented with BEA data on international trade in services, economic census data on receipts for the R&D services industry, and unpublished data from BEA, the Census Bureau, and the National Science Foundation that were used to allocate R&D performance and investment to industries.
R&D as Investment in BEA’s Regional Accounts
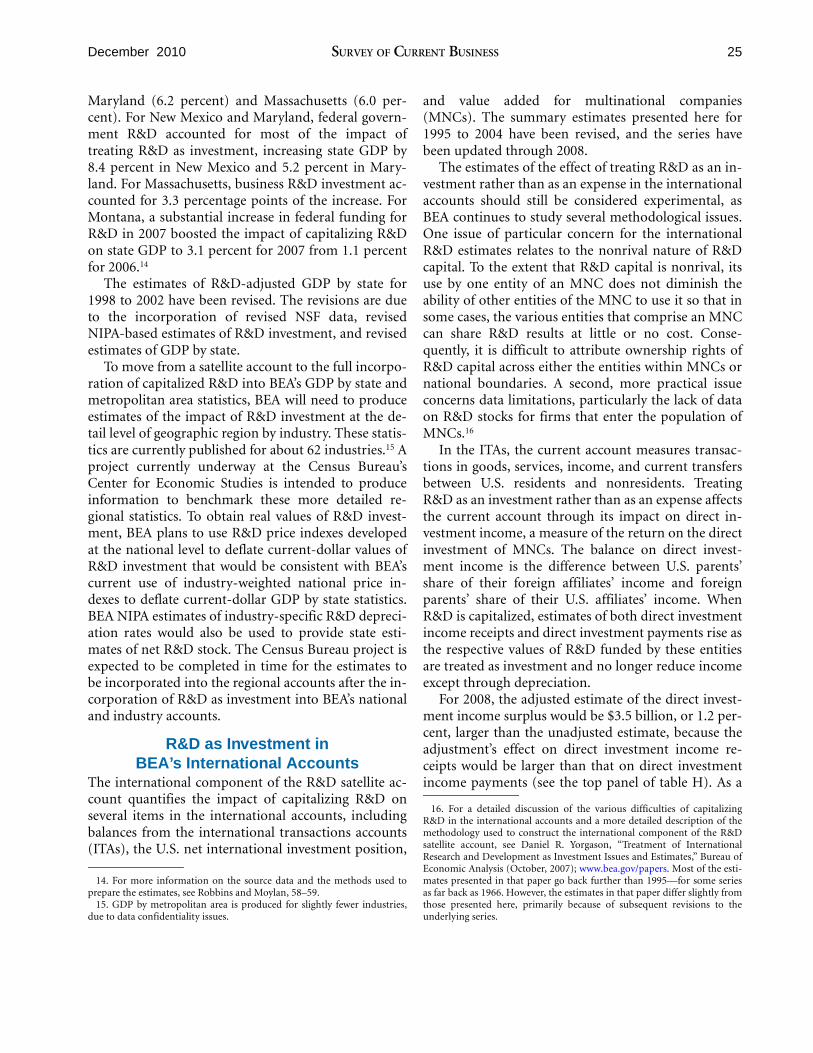
The updated estimates show that if R&D were treated as investment, GDP by state would have increased, on average, 2.5 percent from 1998 to 2007 (table G). (This is an unweighted average across all states.) The levels of GDP by state that would be most affected if R&D were treated as investment are New Mexico (9.2 percent),
Table G. Illustrative Estimates of the Effect on the Level of GDP by State With R&D Treated As Investment [Percent]
1998 1999 2000 2001 2002 2003 2004 2005 2006 2007 Average 1998– 2007
1998 1999 2000 2001 2002 2003 2004 2005 2006 2007 Average 1998– 2007
United States............. 2.8 2.8 2.8 2.8 2.6 2.6 2.6 2.6 2.7 2.8 2.7 Missouri ............ 1.3 1.3 1.6 1.5 1.4 1.4 1.5 1.8 1.7 1.8 1.5 Alabama................. 2.2 1.9 1.8 2.2 2.2 2.1 2.2 2.1 2.5 2.4 2.2 Montana ........... 1.1 1.0 1.0 1.2 1.2 1.1 1.2 1.2 1.1 3.1 1.3 Alaska .................... 0.8 0.8 0.9 1.2 1.2 1.2 0.9 0.8 0.8 0.9 1.0 Nebraska.......... 0.7 0.9 0.9 1.1 1.2 1.1 1.2 1.2 1.2 1.2 1.1 Arizona................... 1.9 3.6 2.2 2.0 2.5 2.0 1.9 2.0 2.0 2.1 2.2 Nevada ............. 1.0 0.8 0.6 0.6 0.7 0.7 0.7 0.6 0.7 0.7 0.7 Arkansas................ 0.6 0.6 0.8 0.7 0.6 0.7 0.7 0.7 0.7 0.7 0.7 New Hampshire 3.9 3.8 2.1 4.1 3.3 3.7 3.6 3.7 3.9 4.0 3.6 California................ 4.4 4.3 4.7 4.2 4.0 4.2 4.0 3.9 4.2 4.4 4.2 New Jersey....... 3.9 3.4 4.1 3.3 3.6 3.3 3.1 3.5 3.6 4.3 3.6 Colorado ................ 3.7 3.4 2.9 2.7 2.5 2.7 2.9 2.8 2.8 3.0 2.9 New Mexico...... 8.0 8.5 7.5 9.3 10.5 9.7 9.4 9.3 10.1 9.7 9.2 Connecticut............ 2.7 3.1 3.3 3.4 4.2 3.8 4.4 4.8 4.5 5.0 3.9 New York .......... 2.3 2.1 2.0 2.0 1.8 1.6 1.6 1.6 1.5 1.6 1.8 Delaware................ 7.4 3.7 4.1 3.2 3.1 3.0 2.4 3.0 2.8 2.8 3.5 North Carolina 2.1 2.1 2.0 2.2 1.8 2.1 2.1 2.2 2.2 2.5 2.1 District of Columbia 6.4 5.7 4.9 4.9 4.8 4.2 3.6 4.9 5.4 5.3 5.0 North Dakota .... 0.9 1.1 1.0 2.6 1.6 1.8 2.5 1.3 1.4 1.4 1.6 Florida.................... 1.3 1.1 1.1 1.3 1.1 1.0 1.0 1.0 1.0 1.1 1.1 Ohio.................. 2.2 2.5 2.3 2.5 2.3 2.2 1.9 2.0 2.2 2.4 2.2 Georgia .................. 1.1 1.2 1.1 1.2 1.4 1.3 1.1 1.1 1.3 1.2 1.2 Oklahoma......... 0.7 0.9 0.8 1.0 0.9 1.0 0.8 0.7 0.8 0.8 0.8 Hawaii .................... 0.8 0.9 0.9 1.0 1.2 1.0 1.1 1.0 1.0 1.1 1.0 Oregon ............. 2.1 2.0 2.1 5.1 2.6 2.9 2.7 2.8 2.6 2.7 2.8 Idaho...................... 4.2 4.9 4.7 3.8 3.9 3.2 2.4 2.3 2.0 2.3 3.4 Pennsylvania .... 2.6 3.0 2.8 2.9 2.5 2.3 2.5 2.6 2.7 2.7 2.7 Illinois..................... 2.3 2.3 3.0 2.3 2.2 2.2 2.2 2.3 2.4 2.4 2.4 Rhode Island .... 6.5 6.6 5.3 5.2 4.7 4.7 4.8 5.1 4.7 2.7 5.0 Indiana ................... 1.9 1.8 1.8 2.3 2.2 2.1 2.3 2.3 2.4 2.4 2.2 South Carolina 1.1 1.1 1.2 1.3 1.5 1.3 1.3 1.6 1.6 1.6 1.4 Iowa ....................... 1.5 1.3 1.3 1.6 1.5 1.5 1.5 1.5 1.5 1.5 1.5 South Dakota.... 0.4 0.3 0.4 0.6 0.5 0.5 0.5 0.6 0.7 0.8 0.5 Kansas................... 2.2 2.4 2.0 2.1 2.2 2.3 2.4 2.5 2.2 1.5 2.2 Tennessee ........ 1.7 0.4 1.4 1.6 1.5 1.6 1.7 1.5 1.6 1.8 1.5 Kentucky ................ 0.7 0.9 0.9 0.9 1.0 0.9 0.8 0.9 1.0 1.0 0.9 Texas ................ 1.9 2.0 1.8 1.8 1.9 1.8 1.7 1.7 1.7 1.7 1.8 Louisiana ............... 0.6 0.6 0.6 0.7 0.7 0.7 0.6 0.6 0.5 0.6 0.6 Utah.................. 2.8 2.8 2.3 2.3 2.3 2.0 2.1 2.3 2.2 2.4 2.4 Maine ..................... 0.6 0.8 1.0 1.2 1.2 1.0 1.0 1.2 1.0 1.1 1.0 Vermont ............ 1.3 2.8 3.1 2.4 2.2 2.5 2.6 2.3 2.2 2.4 2.4 Maryland................ 6.3 5.8 5.7 6.9 5.1 5.2 7.2 6.7 6.8 6.4 6.2 Virginia ............. 2.7 2.5 2.3 2.3 2.3 2.7 2.5 2.7 3.1 2.9 2.6 Massachusetts....... 6.5 5.5 5.5 5.7 5.5 5.5 5.5 5.9 6.7 7.9 6.0 Washington ...... 4.7 4.6 5.5 4.9 4.7 4.7 4.4 4.3 4.7 4.9 4.7 Michigan ................ 5.1 6.1 6.2 4.9 4.5 4.7 4.7 4.9 4.9 4.7 5.0 West Virginia .... 1.3 1.3 1.3 1.2 1.4 1.3 1.2 1.3 1.1 1.3 1.3 Minnesota .............. 2.5 2.4 2.5 2.8 2.8 2.8 2.7 3.0 3.0 3.1 2.8 Wisconsin......... 1.8 1.7 1.7 1.9 2.0 1.9 1.9 1.8 1.9 2.1 1.9 Mississippi ............. 0.8 0.9 0.9 1.1 1.1 2.3 1.0 1.1 1.1 1.1 1.1 Wyoming .......... 0.6 0.5 0.4 0.5 0.5 0.6 0.5 0.5 0.5 0.5 0.5
States’ average 2.5 2.5 2.4 2.5 2.4 2.4 2.4 2.4 2.5 2.6 2.5
NOTES. Percent change IS Calculated as the ratio of the adjustment to unadjusted GDP by state. The sions to the NIPA values and because the GDP by state accounts exclude federal military and civilian U.S impacts may differ from the national income and product account (NIPA) values because of revi- activity located overseas (which cannot be attributed to a particular state).
25 December 2010 SURVEY OF CURRENT BUSINESS
Maryland (6.2 percent) and Massachusetts (6.0 percent). For New Mexico and Maryland, federal government R&D accounted for most of the impact of treating R&D as investment, increasing state GDP by 8.4 percent in New Mexico and 5.2 percent in Maryland. For Massachusetts, business R&D investment accounted for 3.3 percentage points of the increase. For Montana, a substantial increase in federal funding for R&D in 2007 boosted the impact of capitalizing R&D on state GDP to 3.1 percent for 2007 from 1.1 percent for 2006.14
The estimates of R&D-adjusted GDP by state for 1998 to 2002 have been revised. The revisions are due to the incorporation of revised NSF data, revised NIPA-based estimates of R&D investment, and revised estimates of GDP by state.
To move from a satellite account to the full incorporation of capitalized R&D into BEA’s GDP by state and metropolitan area statistics, BEA will need to produce estimates of the impact of R&D investment at the detail level of geographic region by industry. These statistics are currently published for about 62 industries.15 A project currently underway at the Census Bureau’s Center for Economic Studies is intended to produce information to benchmark these more detailed regional statistics. To obtain real values of R&D investment, BEA plans to use R&D price indexes developed at the national level to deflate current-dollar values of R&D investment that would be consistent with BEA’s current use of industry-weighted national price indexes to deflate current-dollar GDP by state statistics. BEA NIPA estimates of industry-specific R&D depreciation rates would also be used to provide state estimates of net R&D stock. The Census Bureau project is expected to be completed in time for the estimates to be incorporated into the regional accounts after the incorporation of R&D as investment into BEA’s national and industry accounts.
R&D as Investment in BEA’s International Accounts
The international component of the R&D satellite account quantifies the impact of capitalizing R&D on several items in the international accounts, including balances from the international transactions accounts (ITAs), the U.S. net international investment position,
14. For more information on the source data and the methods used to prepare the estimates, see Robbins and Moylan, 58–59.
15. GDP by metropolitan area is produced for slightly fewer industries, due to data confidentiality issues.
and value added for multinational companies (MNCs). The summary estimates presented here for 1995 to 2004 have been revised, and the series have been updated through 2008.
The estimates of the effect of treating R&D as an investment rather than as an expense in the international accounts should still be considered experimental, as BEA continues to study several methodological issues. One issue of particular concern for the international R&D estimates relates to the nonrival nature of R&D capital. To the extent that R&D capital is nonrival, its use by one entity of an MNC does not diminish the ability of other entities of the MNC to use it so that in some cases, the various entities that comprise an MNC can share R&D results at little or no cost. Consequently, it is difficult to attribute ownership rights of R&D capital across either the entities within MNCs or national boundaries. A second, more practical issue concerns data limitations, particularly the lack of data on R&D stocks for firms that enter the population of MNCs.16
In the ITAs, the current account measures transactions in goods, services, income, and current transfers between U.S. residents and nonresidents. Treating R&D as an investment rather than as an expense affects the current account through its impact on direct investment income, a measure of the return on the direct investment of MNCs. The balance on direct investment income is the difference between U.S. parents’ share of their foreign affiliates’ income and foreign parents’ share of their U.S. affiliates’ income. When R&D is capitalized, estimates of both direct investment income receipts and direct investment payments rise as the respective values of R&D funded by these entities are treated as investment and no longer reduce income except through depreciation.
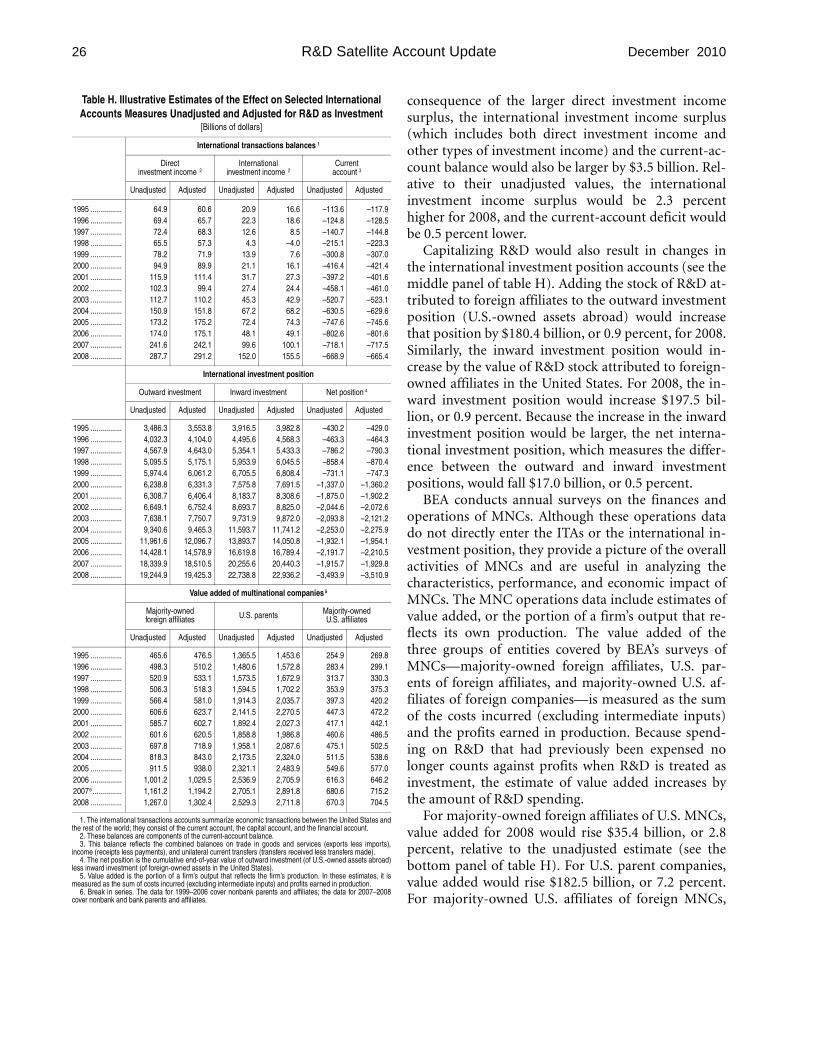
For 2008, the adjusted estimate of the direct investment income surplus would be $3.5 billion, or 1.2 percent, larger than the unadjusted estimate, because the adjustment’s effect on direct investment income receipts would be larger than that on direct investment income payments (see the top panel of table H). As a
16. For a detailed discussion of the various difficulties of capitalizing R&D in the international accounts and a more detailed description of the methodology used to construct the international component of the R&D satellite account, see Daniel R. Yorgason, “Treatment of International Research and Development as Investment Issues and Estimates,” Bureau of Economic Analysis (October, 2007); www.bea.gov/papers. Most of the estimates presented in that paper go back further than 1995—for some series as far back as 1966. However, the estimates in that paper differ slightly from those presented here, primarily because of subsequent revisions to the underlying series.
26 R&D Satellite Account Update December 2010
Table H. Illustrative Estimates of the Effect on Selected International Accounts Measures Unadjusted and Adjusted for R&D as Investment
[Billions of dollars]
International transactions balances 1
Direct investment income 2
International investment income 2
Current account 3
Unadjusted Adjusted Unadjusted Adjusted Unadjusted Adjusted
1995 ................ 1996 ................ 1997 ................ 1998 ................ 1999 ................ 2000 ................ 2001 ................ 2002 ................ 2003 ................ 2004 ................ 2005 ................ 2006 ................ 2007 ................ 2008 ................
64.9 69.4 72.4 65.5 78.2 94.9
115.9 102.3 112.7 150.9 173.2 174.0 241.6 287.7
60.6 65.7 68.3 57.3 71.9 89.9
111.4 99.4
110.2 151.8 175.2 175.1 242.1 291.2
20.9 22.3 12.6
4.3 13.9 21.1 31.7 27.4 45.3 67.2 72.4 48.1 99.6
152.0
16.6 18.6
8.5 –4.0
7.6 16.1 27.3 24.4 42.9 68.2 74.3 49.1
100.1 155.5
–113.6 –124.8 –140.7 –215.1 –300.8 –416.4 –397.2 –458.1 –520.7 –630.5 –747.6 –802.6 –718.1 –668.9
–117.9 –128.5 –144.8 –223.3 –307.0 –421.4 –401.6 –461.0 –523.1 –629.6 –745.6 –801.6 –717.5 –665.4
International investment position
Outward investment Inward investment Net position 4
Unadjusted Adjusted Unadjusted Adjusted Unadjusted Adjusted
1995 ................ 1996 ................ 1997 ................ 1998 ................ 1999 ................ 2000 ................ 2001 ................ 2002 ................ 2003 ................ 2004 ................ 2005 ................ 2006 ................ 2007 ................ 2008 ................
3,486.3 4,032.3 4,567.9 5,095.5 5,974.4 6,238.8 6,308.7 6,649.1 7,638.1 9,340.6
11,961.6 14,428.1 18,339.9 19,244.9
3,553.8 4,104.0 4,643.0 5,175.1 6,061.2 6,331.3 6,406.4 6,752.4 7,750.7 9,465.3
12,096.7 14,578.9 18,510.5 19,425.3
3,916.5 4,495.6 5,354.1 5,953.9 6,705.5 7,575.8 8,183.7 8,693.7 9,731.9
11,593.7 13,893.7 16,619.8 20,255.6 22,738.8
3,982.8 4,568.3 5,433.3 6,045.5 6,808.4 7,691.5 8,308.6 8,825.0 9,872.0
11,741.2 14,050.8 16,789.4 20,440.3 22,936.2
–430.2 –463.3 –786.2 –858.4 –731.1
–1,337.0 –1,875.0 –2,044.6 –2,093.8 –2,253.0 –1,932.1 –2,191.7 –1,915.7 –3,493.9
–429.0 –464.3 –790.3 –870.4 –747.3
–1,360.2 –1,902.2 –2,072.6 –2,121.2 –2,275.9 –1,954.1 –2,210.5 –1,929.8 –3,510.9
Value added of multinational companies 5
Majority-owned foreign affiliates U.S. parents Majority-owned
U.S. affiliates
Unadjusted Adjusted Unadjusted Adjusted Unadjusted Adjusted
1995 ................ 1996 ................ 1997 ................ 1998 ................ 1999 ................ 2000 ................ 2001 ................ 2002 ................ 2003 ................ 2004 ................ 2005 ................ 2006 ................ 20076 ............... 2008 ................
465.6 498.3 520.9 506.3 566.4 606.6 585.7 601.6 697.8 818.3 911.5
1,001.2 1,161.2 1,267.0
476.5 510.2 533.1 518.3 581.0 623.7 602.7 620.5 718.9 843.0 938.0
1,029.5 1,194.2 1,302.4
1,365.5 1,480.6 1,573.5 1,594.5 1,914.3 2,141.5 1,892.4 1,858.8 1,958.1 2,173.5 2,321.1 2,536.9 2,705.1 2,529.3
1,453.6 1,572.8 1,672.9 1,702.2 2,035.7 2,270.5 2,027.3 1,986.8 2,087.6 2,324.0 2,483.9 2,705.9 2,891.8 2,711.8
254.9 283.4 313.7 353.9 397.3 447.3 417.1 460.6 475.1 511.5 549.6 616.3 680.6 670.3
269.8 299.1 330.3 375.3 420.2 472.2 442.1 486.5 502.5 538.6 577.0 646.2 715.2 704.5
1. The international transactions accounts summarize economic transactions between the United States and the rest of the world; they consist of the current account, the capital account, and the financial account.
2. These balances are components of the current-account balance. 3. This balance reflects the combined balances on trade in goods and services (exports less imports),
income (receipts less payments), and unilateral current transfers (transfers received less transfers made). 4. The net position is the cumulative end-of-year value of outward investment (of U.S.-owned assets abroad)
less inward investment (of foreign-owned assets in the United States). 5. Value added is the portion of a firm’s output that reflects the firm’s production. In these estimates, it is
measured as the sum of costs incurred (excluding intermediate inputs) and profits earned in production. 6. Break in series. The data for 1999–2006 cover nonbank parents and affiliates; the data for 2007–2008
cover nonbank and bank parents and affiliates.
consequence of the larger direct investment income surplus, the international investment income surplus (which includes both direct investment income and other types of investment income) and the current-account balance would also be larger by $3.5 billion. Relative to their unadjusted values, the international investment income surplus would be 2.3 percent higher for 2008, and the current-account deficit would be 0.5 percent lower.
Capitalizing R&D would also result in changes in the international investment position accounts (see the middle panel of table H). Adding the stock of R&D attributed to foreign affiliates to the outward investment position (U.S.-owned assets abroad) would increase that position by $180.4 billion, or 0.9 percent, for 2008. Similarly, the inward investment position would increase by the value of R&D stock attributed to foreign-owned affiliates in the United States. For 2008, the inward investment position would increase $197.5 billion, or 0.9 percent. Because the increase in the inward investment position would be larger, the net international investment position, which measures the difference between the outward and inward investment positions, would fall $17.0 billion, or 0.5 percent.
BEA conducts annual surveys on the finances and operations of MNCs. Although these operations data do not directly enter the ITAs or the international investment position, they provide a picture of the overall activities of MNCs and are useful in analyzing the characteristics, performance, and economic impact of MNCs. The MNC operations data include estimates of value added, or the portion of a firm’s output that reflects its own production. The value added of the three groups of entities covered by BEA’s surveys of MNCs—majority-owned foreign affiliates, U.S. parents of foreign affiliates, and majority-owned U.S. affiliates of foreign companies—is measured as the sum of the costs incurred (excluding intermediate inputs) and the profits earned in production. Because spending on R&D that had previously been expensed no longer counts against profits when R&D is treated as investment, the estimate of value added increases by the amount of R&D spending.
For majority-owned foreign affiliates of U.S. MNCs, value added for 2008 would rise $35.4 billion, or 2.8 percent, relative to the unadjusted estimate (see the bottom panel of table H). For U.S. parent companies, value added would rise $182.5 billion, or 7.2 percent. For majority-owned U.S. affiliates of foreign MNCs,
27 December 2010 SURVEY OF CURRENT BUSINESS
the value added would rise $34.2 billion, or 5.1 percent.
Further Research In an effort to improve the R&D estimates for incorporation into BEA’s core accounts, BEA will continue its research on R&D price indexes and depreciation measures. As noted, the R&D satellite account is currently based on two aggregate price indexes: the input price index and an output-based price index. Currently, BEA is working to develop prototype, industry-specific R&D input price indexes that reflect the changing prices of inputs to R&D investment by industry and adjust for productivity. BEA is also exploring the development of updated depreciation measures based on new National Science Foundation (NSF) survey data on R&D service lives as well as depreciation measures based on financial data. Depreciation measures in the R&D satellite account are currently based on averages
for R&D from the economics literature. Other considerations for implementation include
developing more timely indicators of R&D investment and estimating additional industry detail. The main source data for the R&D satellite account is the NSF’s Survey of Industrial R&D, which is published with a 2year lag. As R&D is incorporated into BEA’s core accounts, more timely annual and quarterly indicators must be prepared. In order to capitalize R&D investment in the benchmark input-output accounts, the updated R&D satellite account estimates of R&D investment by industry must also be broken out in greater industry detail.
Incorporating R&D into the core accounts is part of BEA’s broader effort to better capture the impact of innovation on the U.S. economy. In addition to R&D investment, BEA plans to capitalize artistic originals—such as movies, books, and music—in its core accounts in 2013.
Tables 1.1 to 8 follow.