Embed Size (px)
Citation preview

Satellite Accounts for Cooperatives and Mutuals in Spain
(SACMS)
Final Report
The European Union’s Competitiveness and Innovation Programme 2007-2013
This project is co-funded by
the European Union
A project implemented by National Statistical Institute
and CIRIEC- Spain

Instituto Nacional de Estadística (INE)Subdirección General de Cuentas Económicas y Empleo
CIRIEC-España
Directors
José Barea Tejeiro Universidad Autónoma de Madrid
José Luis Monzón Universitat de València
Research Team
Santiago Murgui Izquierdo Universitat de València
José Galán Peláez Universitat de València
Marina García del Val Economista (Actuario de Seguros)
Isidro Antuñano Maruri Universitat de València


THE SATELLITE ACCOUNTS OF THE CO-OPERATIVES AND MUTUAL SOCIETIES AND
MUTUAL PROVIDENT SOCIETIES IN SPAIN. 2008
3
Summary
1. Objectives of the study ...................................................................................................................... 4
2. Identification and classification of the units studied......................................................................... 4 2.1. The co-operatives ......................................................................................................................... 4 2.2. Mutual insurance companies and mutual provident societies............................................................. 6
3. Identification of other corporations in the Social Economy ................................................................ 8 3.1. Business groups and private bodies of the Social Economy................................................................ 8 3.2. The labour companies (sociedades laborales) ................................................................................... 9 3.3. The agricultural transformation societies (SAT) ............................................................................. 10 3.4. Integration and social action organizations (social enterprises)....................................................... 10 3.5. Special employment centres ........................................................................................................ 11 3.6. Fishermen's guilds (cofradías) ...................................................................................................... 12
4. Data and sources of data for drawing up the satellite accounts of the co-operatives and of mutual societies and mutual provident societies.............................................................................. 12
4.1. Co-operatives ............................................................................................................................. 12 4.2. Mutual societies and mutual provident societies ............................................................................ 15
5. The satellite accounts of co-operatives, mutual societies and mutual provident societies by institutional sector..................................................................................................................... 16
5.1. Introduction: the structure of the satellite accounts...................................................................... 16 5.2. The satellite accounts of the non-financial co-operatives (S.11)...................................................... 19 5.3. The satellite accounts of the financial entities of the Social Economy (S12): credit co-operatives, mutual societies and mutual provident societies .............................................. 24 5.3.1. The satellite accounts of the Credit co-operatives ................................................................. 29 5.3.2. The satellite accounts of the Mutual insurance companies and the Mutual
provident societies............................................................................................................. 33 5.4. The satellite accounts of the non-financial corporations (S.11) and financial institutions
(S.12) of the Social Economy: co-operatives, mutual societies and mutual provident societies ............ 42 6. The satellite accounts of the non-financial co-operatives by industry .............................................. 42 6.1. Satellite accounts: non- financial co-operatives by industry ........................................................... 43 7. Other indicators of the non-monetary activity of co-operatives, mutual societies and mutual
provident societies.......................................................................................................................... 55 7.1. Introduction .............................................................................................................................. 55 7.2. Non-monetary data of the co-operatives in Spain in 2008............................................................... 56 7.3. The associated labour co-operatives (CTA) ..................................................................................... 59 7.4. Agro-alimentary co-operatives ..................................................................................................... 61 7.5. Consumers’ and users’ co-operatives ............................................................................................. 62 7.6. Educational co-operatives............................................................................................................ 64 7.7. Credit co-operatives.................................................................................................................... 65 7.8. Non-monetary data of mutual companies and mutual provident societies in the year 2008. ............... 66

THE SATELLITE ACCOUNTS OF THE CO-OPERATIVES AND MUTUAL SOCIETIES AND MUTUAL PROVIDENT SOCIETIES IN SPAIN. 2008
4
1. Objectives of the study
The main aim of this research is to obtain information on the main economic aggregates and other non-monetary indicators of two large groups of companies that behave in a homogeneous way, as is the case for co-operatives and for mutual societies and mutual provident societies. Research has been carried out for all such entities in Spain.
Given that the activities of the companies in the Social Economy, which have been previously mentioned (and are grouped in the institutional sectors of financial and non-financial corporations), do not appear in a disaggregated way in the National Accounts, it is necessary to draw up satellite accounts for co-operatives, mutual societies and mutual provident societies.
These satellite accounts are drawn up adhering to the basic concepts and classifications of the central national accounting framework set out in the European System of National and Regional Accounts (ESA 95), the National Accounts drawn up by the Spanish National Statistics Institute (INE) and the Methodology of the Manual for drawing up the Satellite
Accounts of companies in the Social Economy: Co-operatives and Mutual societies, of the European Commission.
The accounts were drawn up for the financial year 2008 in a joint project between the Spanish National Statistics Institute (INE) and the International Centre of Research and Information on the Public, Social and Co-operative Economy (CIRIEC).
2. Identification and classification of the units studied
2.1. The co-operatives
As indicated in the Manual of the Commission, in the European Union co-operatives are subject to very different and varied bodies of law. Depending on the country, they may be considered commercial corporations, a specific type of company, civil associations or organisations that are difficult to catalogue. There may even be a total lack of specific legal regulation, obliging them to follow the rules for companies in general, which normally means commercial companies. In such cases, it is the co-operative’s members who lay down the operating rules in the articles of association, which enable a company to be identified as a ‘co-operative’.
In terms of the business they conduct, co-operatives are found in both the non-financial corporations sector and the financial corporations sector and in practically every industry.

THE SATELLITE ACCOUNTS OF THE CO-OPERATIVES AND MUTUAL SOCIETIES AND
MUTUAL PROVIDENT SOCIETIES IN SPAIN. 2008
5
In general, it would be fair to say that the vast majority of co-operatives in the European Union share a common core identity based on the historical origins of the co-operative movement and on the acceptance, to varying degrees, of the operating principles detailed in the Statute for a European Co-operative Society
1
These operating principles adhere to each and every one of the characteristics of companies in the Social Economy set out in the Manual of the Commission, so that the co-operatives, as
market producers, are the most important business agent in the Social Economy. Co-operatives are self-help organisations set up by citizens (they are private and are not part of the public sector) that are formally organised and have autonomy of decision. In order to satisfy the needs of their members or conduct their business they operate in the market, from which they obtain their main source of funding. They are organised democratically and their profits are not distributed in proportion to the share capital contributed by their members. In ESA 95, co-operatives are considered private market producer institutional units.
In Spain, there is considerable legislation about co-operatives, which stems from the distribution of powers and responsibilities between the State and the Autonomous Communities. These latter have kept exclusive responsibility regarding co-operatives and all of them, except for Asturias, Cantabria and the Canary Islands, have drawn up their own laws relating to co-operatives. Law 27/1999 of 16th July, about co-operatives in the national sphere, applies to the co-operatives that carry out their co-operativised activity in the territory of several Autonomous Communities, except when one of theses regions is the principal area of operation, as well as to the co-operatives that mainly undertake their co-operativised activity in Ceuta and Melilla. In addition, the state-level law also applies to the credit co-operatives that carry out their co-operativised activity in the territory of more than one Autonomous Community.
Although 14 of the 17 Autonomous Communities have their own law on co-operatives, because of the subject matter, the State is also responsible for the regulation of the credit co-operatives (Law 13/1989 of 26th May and the Regulations of Royal Decree 84/1993 of 22nd January) and the insurance co-operatives (Consolidated Text of the Private Insurance Supervisory Act of Royal Legislative Decree 6/2004 of 29th October and by the implementing Regulation of Royal Decree (R.D.) 2486/1998 of 20th November). For similar reasons, the State has introduced various rules applicable to transport, hauliers and housing co-operatives.
In the sphere called social enterprises by the European Union, there is a wide range of integration and social initiative co-operatives. According to several laws promulgated by the State and by the Autonomous Communities, these co-operatives adopt a variety of names 1 Points (7) to (10) of the preamble to the Council Regulation (EC) No 1435/2003 of 22nd July 2003, relating to the Statute for a European Co-operative Society (SCE).

THE SATELLITE ACCOUNTS OF THE CO-OPERATIVES AND MUTUAL SOCIETIES AND MUTUAL PROVIDENT SOCIETIES IN SPAIN. 2008
6
(co-operatives of social integration, of social services, of social insertion or of social initiative) and can be of different kinds (associated labour, consumption, etc).
In general, these co-operatives are market producer companies and pursue aims of general interest, such as integration in the workforce of people who find it hard to get work, meeting the social needs of groups at risk of social exclusion, etc.
In conclusion, the co-operatives that in this research project draw up the corresponding satellite accounts are market producer units that belong to the institutional sector of non-financial corporations (S.11) or the sector financial corporations (S.12). On 31/12/2008, there were 24,738 economically active co-operatives with at least one worker making contributions to General or Self-Employed Social Security in Spain. Of which 81 were credit co-operatives (S.12 “Financial corporations”) and the rest were other kinds of co-operatives and activities integrated into sector S.11 non-financial corporations (24,657 co-operatives)2.
2.2. Mutual insurance companies and mutual provident societies
As with the co-operatives, mutual societies and mutual provident societies in the European Union are governed by very diverse bodies of law. Depending on their principal activity and the type of risk they insure, mutual societies are divided into two large classes or categories. One group comprises health mutual societies and mutual provident societies. Their field of activity is mainly to cover the health and social welfare risks of individuals. The second group is mutual insurance companies. Their principal activity usually centres on insuring goods (vehicles, fire, third party insurance, etc.), although they can also cover life insurance related areas.
The concept of mutual society used in the previously cited Manual of the European Commission is the following: an autonomous association of persons (legal entities or natural persons), united voluntarily for the primary purpose of satisfying their common needs in the insurance (life and non-life), providence, health and banking sectors, which conducts activities that are subject to competition. It is managed according to the principle of solidarity between the members, who participate in the governance of the business, and adheres to the principles of absence of shares, freedom of membership, lack of pure profit-making objectives, solidarity, democracy and independence3.
These operating principles are very similar to those of the co-operatives, as they also comply with all the characteristics of companies in the Social Economy, so that mutual 2 Data from the Ministry of Labour and Immigration. Among the co-operatives included in S.11 non-financial corporations, it is possible that there is an unimportant non-bank co-operative, dedicated to financial intermediation. 3http://ec.europa.eu/enterprise/newsroom/cf/itemshortdetail.cfm?item_id=487 and the Consultation Document “Mutual Societies in an enlarged Europe”, 2003 http://ec.europa.eu/enterprise/policies/sme/files/mutuals/mutuals-consult-doc_en.pdf

THE SATELLITE ACCOUNTS OF THE CO-OPERATIVES AND MUTUAL SOCIETIES AND
MUTUAL PROVIDENT SOCIETIES IN SPAIN. 2008
7
societies and mutual provident societies, as market producers, are the second most important
business agent in the Social Economy.
However, the Manual of the Commission excludes from the sphere of the Social Economy, social security management bodies and, in general, those mutual societies where membership is obligatory and those controlled by companies that are not part of the Social Economy.
Insurance undertakings, in general, and the Mutual Insurance Companies and Mutual Providence Societies in particular perform an economic role that, in many aspects, is similar to that carried out by economic units classified in other institutional sectors: produce outputs, undertake consumption expenditure and distribute income. However, the particular characteristics inherent to the carrying out of insurance activities confers on these entities the status of financial intermediaries, permitting them to operate as channels for the savings of households and corporations towards the financing of other sectors of the economy.
During the exercise of their activity, insurance enterprises charge in advance for the service that they offer, only providing such services when the damage occurs and the claim covered is made and, always, after the payment of the premium. This gives rise to accumulated savings that have to be reflected in the amount of the technical provisions. Every insurance transaction carries a forecast of provision, the possibility of having to face an event that may occur or will occur after a certain period of time (retirement pension, widow’s or widower’s pension, orphans’ allowances). To cover these contingencies and be able to face incidents when they happen, economic agents, mainly households and corporations, channel part of their disposable income to the circuits of saving by taking out insurance policies.
The funds from the technical provisions are used by the insurance enterprises to acquire non-financial and financial assets (mainly financial liabilities of other economic sectors), in agreement with certain objectives of security, liquidity, profitability, and asset matching, compensated in accordance with the technical requirements and the legal limitations of the insurance activity itself.
All these circumstances, of the insurance business itself, cause the methodological system of description and quantification of the macroeconomic variables and flows used in the drawing up of the National Accounts, the European System of National and Regional Accounts (ESA 95), to consider insurance activity within financial intermediary services and to include it in the institutional sector S.12 “Financial corporations”, but establishing its representation within a specific sub-sector, Sub-sector S.125 “Insurance corporations and pension funds”.

THE SATELLITE ACCOUNTS OF THE CO-OPERATIVES AND MUTUAL SOCIETIES AND MUTUAL PROVIDENT SOCIETIES IN SPAIN. 2008
8
In Spain, the mutual insurance companies and the mutual provident societies are regulated by the Consolidated Text of the Private Insurance Supervisory Act (Royal Legislative Decree 6/2004 of 29th October) and by the implementing Regulation (Royal Decree 2486/1998 of 20th November, modified by R.D. 1318/2008), as well as by the Regulations of Mutual Provident Societies (R.D. 1430/2002 of 27th December), which regulates mutual provident societies whose operations go beyond the sphere of a single Autonomous Community.
Several Autonomous Communities (Catalonia, the Basque Country, and the Valencia and Madrid Communities) have exclusive responsibility regarding mutual societies not integrated into the Social Security system, promulgating regulatory rules regarding mutual provident societies in their respective autonomous regions.
Hence, the mutual societies and mutual provident societies for which satellite accounts are drawn up, within this research area, are those that fulfil the requirements set out in the Manual of the European Commission for drawing up the Satellite Accounts of Companies in the Social Economy, excluding social security management bodies and, in general, those mutual societies where membership is obligatory and/or those controlled by companies that are not part of the Social Economy (for example, employers’ mutual societies for occupational accident cover).
On 31/12/2008, there were 35 Mutual societies and 298 Mutual provident societies in Spain. Of the latter, besides the 55 nationally based mutual provident societies, the remainder were concentrated in the Basque Country (186) and Catalonia (57), with a small number of unimportant regional mutual provident societies that have not been included in the scope of this research.
3. Identification of other corporations in the Social Economy
Although this research project only draws up the satellite accounts of the co-operatives, mutual societies and mutual provident societies, the Manual of the European Commission for the drawing up of Satellite Accounts of companies in the Social Economy also considers some other market producers as companies of the Social Economy. Among others, the following stand out:
3.1. Business groups and private bodies of the Social Economy
The Manual of the Commission also considers certain business groups as market producers of the Social Economy. For that Manual, when a company, coalition of companies or any other

THE SATELLITE ACCOUNTS OF THE CO-OPERATIVES AND MUTUAL SOCIETIES AND
MUTUAL PROVIDENT SOCIETIES IN SPAIN. 2008
9
entity in the Social Economy sets up and controls a business group to improve the delivery of its objectives for the benefit of its rank and file members, it will be considered a social economy group, regardless of the legal form it adopts. In other European Union Countries as well as in Spain, there are groups that engage in agri-food, industrial, distribution and retail, education, social welfare and other activities. Banking and mutual society groups are also found in the social economy. All of these are incorporated under different legal forms, including public limited companies and foundations.
Among these business groups stand out the Co-operative Group of Mondragón, which includes several commercial corporations with non-co-operative legal status and agri-food co-operative holding companies, as well as the National Organisation for the Blind group (ONCE), which includes the ONCE Foundation and the CEOSA and FUNDOSA holding companies.
3.2. The labour companies (sociedades laborales)
The labour companies are commercial corporations and as such, their regulation is the exclusive responsibility of the State, which is exercised through Law 4/1997 of 24th March and the Royal Decree 2114/1998 of 2nd October.
The Manual of the Commission explicitly refers to the Spanish labour companies (sociedades laborales) as forming an integral part of the Social Economy, indicating that they are non-financial corporations, set up in order to create or maintain stable employment for their members, in which the majority of shares are owned by the workers, these control the governing bodies and the company is organised on a workers’ self-management basis, that is companies in which, according to the Manual, the workers’ equity is equally divided among them, so these companies are, in fact, characterised by democratic decision-making processes and equitable distribution of profits (CIRIEC, 2007:52).
Indeed, according to Spanish legislation, the key elements that describe the legal status of these companies are: that most of the capital is the property of all the members who provide paid services in a personal and direct way, who are employed with an open-ended contract; fixing of a maximum limit for all the non-member employees with open-ended contracts; fixing of a maximum amount of capital that can be owned by each member (a third part of the social capital); existence of two types of shares or participations according to whether or not their owners are workers; right to preferential purchase when labour shares or participations are transferred and the establishing of a special reserve fund to compensate for any losses incurred.
THE SATELLITE ACCOUNTS OF THE CO-OPERATIVES AND MUTUAL SOCIETIES AND MUTUAL PROVIDENT SOCIETIES IN SPAIN. 2008
10
The Manual of the Commission concludes by stating that non-financial corporations with majority control vested in the workers, democratic decision-making processes and equitable distribution of profits are also included within the market sub-sector of the Social Economy
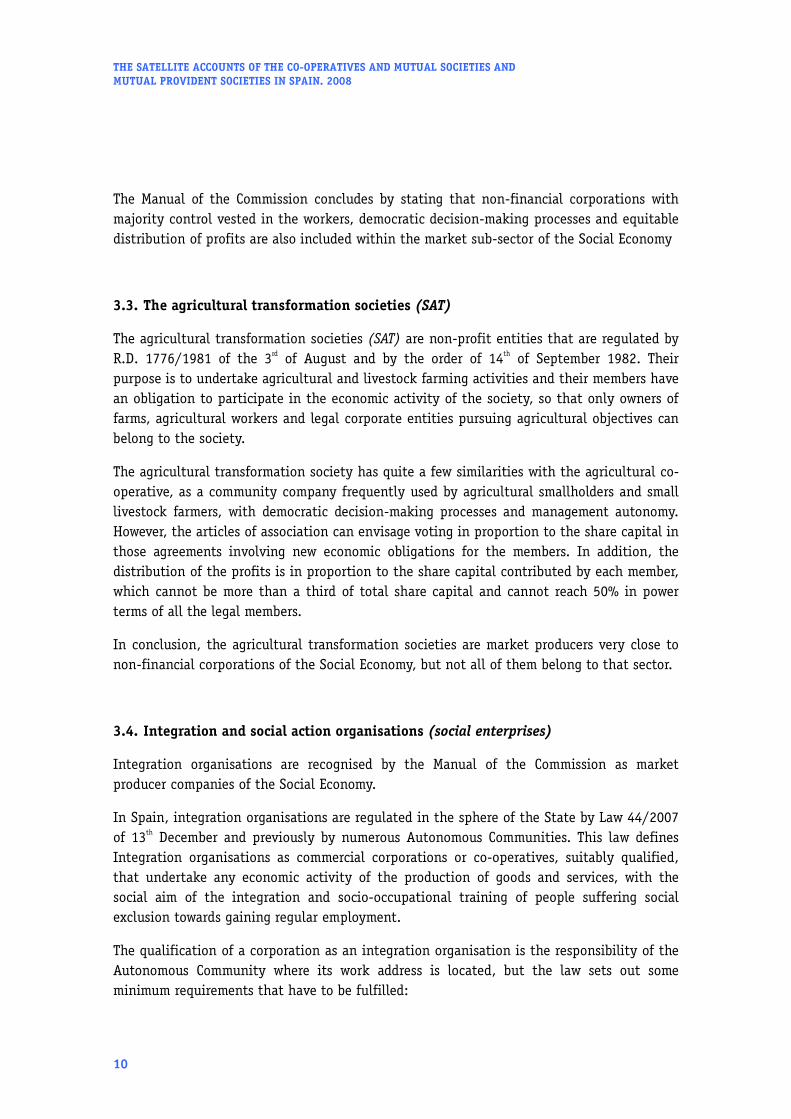
3.3. The agricultural transformation societies (SAT)
The agricultural transformation societies (SAT) are non-profit entities that are regulated by R.D. 1776/1981 of the 3rd of August and by the order of 14th of September 1982. Their purpose is to undertake agricultural and livestock farming activities and their members have an obligation to participate in the economic activity of the society, so that only owners of farms, agricultural workers and legal corporate entities pursuing agricultural objectives can belong to the society.
The agricultural transformation society has quite a few similarities with the agricultural co-operative, as a community company frequently used by agricultural smallholders and small livestock farmers, with democratic decision-making processes and management autonomy. However, the articles of association can envisage voting in proportion to the share capital in those agreements involving new economic obligations for the members. In addition, the distribution of the profits is in proportion to the share capital contributed by each member, which cannot be more than a third of total share capital and cannot reach 50% in power terms of all the legal members.
In conclusion, the agricultural transformation societies are market producers very close to non-financial corporations of the Social Economy, but not all of them belong to that sector.
3.4. Integration and social action organisations (social enterprises)
Integration organisations are recognised by the Manual of the Commission as market producer companies of the Social Economy.
In Spain, integration organisations are regulated in the sphere of the State by Law 44/2007 of 13th December and previously by numerous Autonomous Communities. This law defines Integration organisations as commercial corporations or co-operatives, suitably qualified, that undertake any economic activity of the production of goods and services, with the social aim of the integration and socio-occupational training of people suffering social exclusion towards gaining regular employment.
The qualification of a corporation as an integration organisation is the responsibility of the Autonomous Community where its work address is located, but the law sets out some minimum requirements that have to be fulfilled:

THE SATELLITE ACCOUNTS OF THE CO-OPERATIVES AND MUTUAL SOCIETIES AND
MUTUAL PROVIDENT SOCIETIES IN SPAIN. 2008
11
a) To be promoted by and have the participation of one or several promoting entities: non-profit enterprises, including public law entities; “non-profit associations” and foundations, whose social objective involves the social integration of particularly disadvantaged persons, which promote the establishment of integration organisations, and provide at least, 51% of its capital, if it is a commercial company. For co-operatives and labour companies this participation will be the maximum permitted in the legislation for the collaborating or associate members.
b) To be entered into the register corresponding to its legal form, as well as in the administrative register of integration organisations of the Autonomous Community.
c) To maintain on an annual basis, from its qualification, a percentage of employees in the process of being integrated, whatever the type of contract, of at least 30% for the first three years of activity and of at least 50% of the total workforce from the fourth year, with two being the minimum of such workers employed.
d) To not undertake economic activities different to those of the social objective e) To dedicate, at least, 80% of the available returns or surpluses obtained in each financial
year to the improvement or expansion of its productive and integration structures. f) To present an annual Social Balance sheet of the activity of the corporation, which
includes the social and economic annual report, the degree of integration into the regular labour market and the composition of the workforce, information about integration tasks carried out, and the provisions made for the next financial year.
g) To have the necessary means for fulfilling the commitments arising from the pathways of socio-occupational integration.
3.5. Special employment centres
The special employment centres are market producers, characterised by the three objectives that inspire them: that disabled people have productive and remunerative work; the provision for them of personal and social adjustment services and acting as a bridge for the integration of disabled people into the regular labour market. The regulations applying to these companies are implemented on the basis of Law 13/1982 of 7th April, about the Social Integration of Disabled People (SIDP), the Royal Decrees 13668/1985, of 17th July and 2273/1985, of 4th December, Law 66/1997 of 30th December, the Ministerial Order of 16th
October 1998 and Law 43/2006, of 29th December.
Otherwise, the special employment centres can be publicly or privately owned and, within the latter, companies of the Social Economy and traditional capitalist companies. In all cases, within the workforce must be the highest possible number of disabled people that the nature of the productive process permits, with a minimum of 70%. This means that not all the special employment centres are companies in the Social Economy, but the most

THE SATELLITE ACCOUNTS OF THE CO-OPERATIVES AND MUTUAL SOCIETIES AND MUTUAL PROVIDENT SOCIETIES IN SPAIN. 2008
12
important ones in Spain fulfil the criteria established in the Manual of the Commission for social enterprises, which are market producers in the Social Economy.
3.6. Fishermen’s guilds (cofradías)
The fishermen’s guilds are non-profit public law corporations, that carry out functions representing the fishing sector and providing services, help and assistance, including several economic actions such as the construction of ice making plants, the installation of fuel storage facilities, the maintenance of the wholesale fish markets and others.
The fishermen’s guilds are formed by the owners of fishing vessels and the workers in the extractive industry, who are represented on a parity basis in their governing bodies, which are elected democratically by their members through equal and direct suffrage and secret ballot without external political interference. The legal status of the fishermen’s guilds is regulated by Law 3/2001 of 26th March, about Spain’s State Maritime Fisheries and by Royal Decree 670/1978 of 11th March, about Fishermen’s Guilds.
In terms of their economic behaviour, the fishermen’s guilds are private market producers of the Social Economy, classified in the institutional sector of non-financial corporations within ESA 95.
4. Data and sources of data for drawing up the Satellite Accounts of the co-operatives and of mutual societies and mutual provident societies
4.1. Co-operatives
The information used in the drawing up of the satellite accounts of the Co-operatives corresponding to 2008, is that collected in the Annual Balance Sheets for the financial years of 2007 and 2008 and the Profit and Loss Account for 2008.
Given the difficulty of obtaining access to the individual accounts of each entity, the option was chosen to request the aggregate accounts of the bodies that had these data available:
- The Spanish Taxation Authority provided the aggregate data of the co-operatives based in the so-called “Common Territory”, formed by all the Autonomous Communities of Spain except for Navarra and the Basque Country. There were 25,800 non-financial co-operatives that have presented Corporate income tax returns for the financial year 2008, within

THE SATELLITE ACCOUNTS OF THE CO-OPERATIVES AND MUTUAL SOCIETIES AND
MUTUAL PROVIDENT SOCIETIES IN SPAIN. 2008
13
which are included those co-operatives without economic activity that presented a tax return in that year.
- The Provincial Council (Diputación Foral) of Navarra provided the aggregate values for the non-financial co-operatives of this single province region. In total, there were 369 economically active co-operatives.
- The Basque Provincial Councils (Diputaciones Forales) of Guipúzcoa, Vizcaya and Álava provided, each one separately, the aggregate data for the co-operatives with registered offices in the respective province. There were 1,278 non-financial co-operatives economically active in all the Basque Country
In the overall process of collecting data, it has been taken into account that certain co-operatives have taxes assessed by both the Spanish Taxation Authority and by one of the Provincial Councils and, therefore, they present their accounts simultaneously to more than one public body. In such cases, to avoid duplications, it has been decided to consider their accounts as assigned exclusively to the corresponding Provincial council.
It is important to point out that coming from different public bodies, the way in which the data are presented has not been totally standardised, so that it has been necessary to conduct a process of harmonisation. In particular, differences have been found in the number and demarcation of the economic sectors in which the global accounts of each one of these bodies has been disaggregated. In addition, differences have been detected in the format in which the Profit and Loss Accounts are presented. All these details have been taken into account when defining the variables that the satellite accounts include.
The satellite accounts submitted are the result of aggregating the accounts corresponding to each one of the five territories indicated, a process that has been followed both at the global level for all the co-operatives, and in a separated way for the groups of co-operatives assigned to different economic sectors.
On the basis of the information available, it was decided to consider four branches of activity: Agriculture, Construction, Industry and Services. A classification that is determined by the principal activity of the co-operatives and that does not correspond with that in Spain that defines the term “kind” of co-operative, which is referred to in the section dedicated to analysis of non-monetary activity.
In addition to the indicators of monetary activity, the Satellite Accounts allow the incorporation of non-monetary data, such as employment and its characteristics, number of members, corporations and kinds of corporations, spatial distribution, etc.
To obtain these data, five large types of data sources have been used:

THE SATELLITE ACCOUNTS OF THE CO-OPERATIVES AND MUTUAL SOCIETIES AND MUTUAL PROVIDENT SOCIETIES IN SPAIN. 2008
14
a) Official records of different government departments (Ministry of Labour and Immigration, Directorate General of the Social Economy, Autonomous Work and Corporate Social Responsibility, and Social Security)
b) Records and databases of representative bodies of the Social Economy, especially CEPES and its associated entities, the National Union of Credit Co-operatives and the National Union of Consumers’ and Users’ Co-operatives
c) Annual Reports, Balance Sheets, and Profit and Loss Accounts of corporations, business groups and private bodies of the Social Economy
d) Databases of the Spanish Monitoring Centre of the Social Economy of CIRIEC-Spain, Documentation Centre (CIDEC) of the University Institute of Social and Co-operative Economy (IUDESCOOP) of the University of Valencia and other Universities and Research Centres
e) Field work consisting of a large national survey of co-operatives (CIRIEC-2008 Survey)
The breadth and relevance of this last source of data makes it an essential reference, which offers a rigorous and in-depth knowledge of many non-monetary aggregates of the co-operatives unknown until now.
The CIRIEC-2008 survey targeting co-operatives has taken as its reference universe the 24,738 co-operatives that in the financial year of 2008 had an employee paying Social Security contributions under any scheme and maintained its activity until 31/12/2008, excluding Ceuta and Melilla. This means that there could exist other co-operatives that do have, even important, economic activity, without paid work (for example, as in a fair number of housing co-operatives), which are not reflected in the aggregate figures of this report.
Of the co-operatives mentioned above, the Directorate General of the Social Economy, Autonomous Work and Corporate Social Responsibility provided a Directory of the co-operatives that in the financial year 2008 had an employee paying contributions to the General Scheme of Social Security. The Main Survey carried out with the co-operatives within the framework of the CIRIEC-2008 Survey has exclusively targeted these co-operatives, from which the credit co-operatives have been excluded, the aggregate figures of which have been obtained directly by census. In total, 14,717 co-operatives were all sent the corresponding questionnaires and 2,194 completed questionnaires were returned, a figure that is considered to be more than sufficient to guarantee acceptable levels of reliability.
The high quality of the directory provided by the Directorate General of the Social Economy, Autonomous Work and Corporate Social Responsibility has been a determining factor in achieving these levels of reliability, making possible the post-stratification of data and results, as well as the correction of bias thanks to the relevant information obtained about employees registered in the General Scheme of Social Security.

THE SATELLITE ACCOUNTS OF THE CO-OPERATIVES AND MUTUAL SOCIETIES AND
MUTUAL PROVIDENT SOCIETIES IN SPAIN. 2008
15
Regarding the co-operatives in which the entire workforce pays contributions to the Social Security Self-employed Scheme, with an estimated number of 9,940 enterprises (excluding Ceuta and Melilla) according to the Directorate General of the Social Economy, Autonomous Work and Corporate Social Responsibility, because this was an estimate, no nominal directory of these enterprises was available. This meant that the CIRIEC-2008 Survey had to undertake an auxiliary survey for a new directory of co-operatives of four Autonomous Communities including co-operatives registered and not dissolved, from which were removed those co-operatives included in the directory of co-operatives paying contributions to the General Scheme of Social Security4.
4.2. Mutual societies and mutual provident societies
The data of the mutual societies and mutual provident societies used in the drawing up of the corresponding satellite accounts have been their Profit and Loss Accounts for 2008 and their Annual Balance Sheets for 2007 and 2008. The aggregate accounting information has been provided to INE by the General Directorate of Insurance and Pension Funds (DGFSP) of the Ministry of Economy for the 35 mutual societies and 55 mutual provident societies in the national sphere; by the Department of Justice, Labour and Social Security of the Basque Country state government for the 186 Basque mutual provident societies and by the Department of Economy and Knowledge of the Autonomous Community of Catalonia for the 57 Catalan entities. As mentioned at 2.2, a small number of very insignificant mutual provident societies operating in a local sphere have remained outside the scope of this research.
Regarding other indicators of non-monetary activity, the data for the Basque and Catalan mutual provident societies have been obtained from their corresponding Autonomous Communities, and those for the mutual societies and mutual provident societies in the national sphere have been provided by the General Directorate of Insurance and Pension Funds (DGSFP) of the Ministry of Economy and by the National Confederation of Social Economy Enterprises (CNEPS).
4 The details of these surveys are reflected in the Report Las Grandes Cifras de la Economía Social en España. Año 2008 (The Large Figures of the Social Economy in Spain. 2008).
THE SATELLITE ACCOUNTS OF THE CO-OPERATIVES AND MUTUAL SOCIETIES AND MUTUAL PROVIDENT SOCIETIES IN SPAIN. 2008
16
5. The satellite accounts of co-operatives, mutual societies and mutual provident societies by institutional sector
5.1. Introduction: the structure of the satellite accounts
The activities of the co-operatives, mutual societies and mutual provident societies are quantified, in accordance with the European System of National and Regional Accounts (ESA 95) and with the Manual of the European Commission for companies in the Social Economy, in the following accounts:
a. Production account, which shows the transactions relating to the production process of these entities. These transactions are twofold, to know, the output (resources), which is nearly all market output, and the intermediate consumption in which the output is used. The balancing item of the production account is the gross value added and represents the wealth that these companies in the Social Economy contribute to the value added in the national economy as a whole, as a result of their productive processes. The output can be divided into market output and output for own final use. The net value added is obtained by subtracting consumption of fixed capital from gross value added.
b. Generation of income account, which explains the distribution of the gross value added (resources) between the different production factors, including in the uses the compensation of employees or working members of co-operatives of member employees or of mixed co-operatives, other taxes on production less other subsidies on production and the balancing item that is the outcome or gross operating surplus, which represents the income that the companies obtain from their productive activity.
c. Allocation of primary income account, which includes in resources, the gross operating surplus and the received property income of the corporation (interest, distributed income of corporations, profits from foreign investments, etc.) In uses are included property income and interest paid, and the balancing item that represents the gross balance of primary income.
d. Secondary distribution of income account, whose balancing item is gross disposable income. The resources of this account are the gross balance of primary income, imputed social contributions and current transfers received. The uses are current taxes on income and wealth, unfunded employee social benefits and other current transfers paid, with the closing balance being gross disposable income.
e. Use of income account, the balancing item of which is gross saving (coinciding with gross disposable income, as these corporations do not undertake final consumption). In addition to the balancing items, only the adjustment for the change in net equity of
households on pension funds reserves is reflected in this account. f. Change in net worth due to saving and capital transfers account. It is an
accumulation account in which the only flows that are involved are capital transfers

THE SATELLITE ACCOUNTS OF THE CO-OPERATIVES AND MUTUAL SOCIETIES AND
MUTUAL PROVIDENT SOCIETIES IN SPAIN. 2008
17
receivable and payable, and in which the changes in net worth due to savings and capital
transfers is the balancing item. g. Acquisition of non-financial assets account. It is an accumulation account in which
the balancing item represents net lending (+) or borrowing (-). The flows present in this account as changes in assets are: gross fixed capital formation, consumption of fixed capital (-), changes in inventories, acquisitions less disposals of non-produced non-financial assets.
Production account
Uses Code Resources
P.1 Output
P.11 - Market output
P.12 - Output for own final use
Intermediate consumption P.2
Value added, gross B.1b
Consumption of fixed capital K.1
Value added, net B.1n
Generation of income account
Uses Code Resources
B.1b Value added, gross
Compensation of employees D.1
-Wages and salaries D.11
- Employers' social contributions D.12
Other taxes on production D.2 9
(-)Other subsidies on production D.39
Operating surplus, gross B.2b
Operating surplus, net B.2n
Allocation of primary income account
Uses Code Resources
B.2b Operating surplus, gross
Property income, paid D.4 Property income, received
Balance of primary incomes, gross B.5b
Balance of primary incomes, net B.5n

THE SATELLITE ACCOUNTS OF THE CO-OPERATIVES AND MUTUAL SOCIETIES AND MUTUAL PROVIDENT SOCIETIES IN SPAIN. 2008
18
Secondary distribution of income account
Uses Code Resources
B.5b Balance of primary incomes, gross
Current taxes on income, wealth, etc D.5
D.61 Social contributions
Social benefits other than social D.62
transfers in kind
Other current transfers, paid D.7 Other current transfers, received
Disposable income, gross B.6b
Disposable income, net B.6n
Use of disposable income account
Uses Code Resources
B.6b Disposable income, gross
D.8 Adjustment for the change in net equity of
households in pension funds reserves
Saving, gross B.8b
Saving, net B.8n
Change in net worth due to saving and capital transfers account
Changes in assets Code Changes in liabilities
B.8n Saving, net
D.9 Capital transfers, receivable
D.9 (-) Capital transfers, payable
Changes in net worth due to saving B.10.1
and capital transfers

THE SATELLITE ACCOUNTS OF THE CO-OPERATIVES AND MUTUAL SOCIETIES AND
MUTUAL PROVIDENT SOCIETIES IN SPAIN. 2008
19
Acquisitions of non-financial assets account
Changes in assets Code Changes in liabilities
B.10.1 Changes in net worth due to saving
and capital transfers
Gross fixed capital formation P.51
Consumption of fixed capital K.1
Changes in inventories P.52
Acquisitions less disposals of K.2
non-financial non-produced assets
Net lending(+) / net borrowing(-) B.9
5.2. The satellite accounts of the non-financial co-operatives (S.11)
The satellite accounts of the non-financial co-operatives have been drawn up from the aggregate accounting information provided by the Spanish Taxation Authority and by the Haciendas Forales (regional tax authorities) of Vizcaya, Álava, Guipúzcoa and Navarra. This information comes from the Annual Balance Sheets for 2007 and 2008 and in the Profit and Loss Accounts of 2008.
The integration of the transactions of the co-operatives in the national accounts items has been carried out fulfilling at all times the detailed indications given in Chapter 5 of the Manual of Satellite Accounts of European Commission. It has only been necessary to proceed to make the corresponding estimates to break down “Compensation of employees (D.1)”, in the generation of income account, distributing it between “wages and salaries, in cash or in kind (D.11)” and “employers’ social contributions (D.12)”. This was necessary because the information provided by the Taxation Authority did not foresee this break down as the basic documents supplied by the corporations are “shortened forms” that do not collect the level of detail mentioned.
Regarding the principal items of the satellite accounts of the non-financial co-operatives, their participation of 4.12% of total output of the non-financial corporations stands out, yet it should be stressed that only those entities that have co-operative legal status have been included, with important corporations excluded that are part of co-operative business groups, but have the legal personality of limited or public limited companies among others. This is especially relevant in the activities of commercial distribution and agri-food co-operatives.
The high specific weight of intermediate consumption in output as a whole also stands out, which is translated into a reduced gross value added and into low gross operating surpluses

THE SATELLITE ACCOUNTS OF THE CO-OPERATIVES AND MUTUAL SOCIETIES AND MUTUAL PROVIDENT SOCIETIES IN SPAIN. 2008
20
for these co-operatives. Net lending (+) appears to be the logical consequence of a very low rate of gross fixed capital formation, but both variables show notable contrasts when the different industries were analysed in a separated way, as will be shown below.
Andalusia stands out among the Autonomous Communities, with its output representing more than 18% of total national output of non-financial co-operatives, more even than the Basque Country, but it should be remembered that in this latter case, non-co-operative commercial companies integrated into co-operative holding companies have not been considered, and these are very important in the Basque Country. Even so, the gross value added of Basque non-financial co-operatives represents 30% of the total value added by non-financial co-operatives in Spain.
Satellite accounts for non-financial co-operatives (Summary) Year 2008
Rubric Unit:
Thousands euros
(%) Share of total national non-inancial corporations (S.11)
Output 53,195,972 4.12
Intermediate consumption 45,247,902 5.82
Gross value added at market prices 7,948,070 1.54
Compensation of employees 6,210,892 1.88
Operating surplus,gross 1,736,704 0.93
Saving, gross 1,219,850 1.55
Gross fixed capital formation 478,755 0.27
Net lending (+)/Net borrowing (-) * 673,250 (-)*
* Non-financial corporations as a whole in 2008 have a net lending of 82,607 million euros

THE SATELLITE ACCOUNTS OF THE CO-OPERATIVES AND MUTUAL SOCIETIES AND
MUTUAL PROVIDENT SOCIETIES IN SPAIN. 2008
21
Output and value added for non-financial co-operatives by autonomous community (Thousands euros)
CCAA Output % Value added %
Andalucía 9.776.918 18.4 1.188.516 15.0
Aragón 1.952.331 3.7 169.645 2.1
Asturias 695.430 1.3 68.109 0.9
Baleares 329.098 0.6 43.684 0.5
Canarias 1.208.682 2.3 126.375 1.6
Cantabria 210.810 0.4 24.685 0.3
Castilla La Mancha 2.336.362 4.4 272.145 3.4
Castilla y León 2.791.302 5.2 313.969 4.0
Cataluña 5.230.489 9.8 1.005.893 12.6
Extremadura 1.918.307 3.6 188.447 2.4
Galicia 2.871.978 5.4 203.749 2.5
La rioja 309.406 0.6 44.048 0.5
Madrid 4.680.954 8.8 396.134 5.0
Murcia 2.783.752 5.2 384.678 4.8
Navarra 1.299.673 2.5 212.188 2.7
País vasco 9.676.859 18.1 2.371.841 30.0
Valencia 5.079.259 9.6 918.393 11.5
Ceuta y Melilla 44.362 0.1 15.571 0.2
Total 53.195.972 100 7.948.070 100

THE SATELLITE ACCOUNTS OF THE CO-OPERATIVES AND MUTUAL SOCIETIES AND MUTUAL PROVIDENT SOCIETIES IN SPAIN. 2008
22
SATELLITE ACCOUNTS FOR NON-FINANCIAL CO-OPERATIVES (Excluding Credit Co-operatives)
Year 2008 (Thousands euros)
Current accounts
I. Production account
Uses Code Transactions and balancing items Resources
P.1 Output 53.195.972
P.11 Market output 53.129.511
P.12 Output for own final use 66.461
45.247.902 P.2 Intermediate consumption
7.948.070 B.1b Value added, gross
1.019.895 K.1 Consumption of fixed capital
6.928.175 B.1n Value added, net
II.1.1 Generation of income account
Uses Code Transactions and balancing items Resources
B.1b Gross value added 7.948.070
6.210.892 D.1 Compensation of employees
4.844.496 D.11 Wages and salaries
1.366.396 D.12 Employers' social contributions
2.660 D.2 Taxes on production and imports
- 2.186 D.3 - Subsidies
1.736.704 B.2b Operating surplus, gross
716.809 B.2n Operating surplus, net
II.1.2 Allocation of primary income account
Uses Code Transactions and balancing items Resources
B.2b Operating surplus, net 1.736.704
962.693 D.4 Property income 494.709
1.268.720 B.5b Balance of primary incomes, gross
248.825 B.5n Balance of primary incomes, net

THE SATELLITE ACCOUNTS OF THE CO-OPERATIVES AND MUTUAL SOCIETIES AND
MUTUAL PROVIDENT SOCIETIES IN SPAIN. 2008
23
II.2 Secondary distribution of income account
Uses Code Transactions and balancing items Resources
B.5b Balance of primary incomes, gross 1.268.720
68.296 D.5 Current taxes on income, wealth
D.61 Social contributions 153.036
133.610 D.62 Social benefits other than social transfers in kind
D.7 Other current transfers
1.219.850 B.6b Disposable income, gross
199.955 B .6n Disposable income, net
II.4.1 Use of disposable income account
Uses Code Transactions and balancing items Resources
B.6b Disposable income, gross 1.219.850
D.8 Adjustment for the change in net equity of households
in pension funds reserves
1.219.850 B.8b Gross saving
199.955 B.8n Net saving
Accumulation accounts
III.1.1 Change in net worth due to saving and capital transfers account
Changes in assets
Code Transactions and balancing items Changes in liabilities
and net worth
B.8n Net saving 199.955
D.9 Capital transfers, receivable 125.156
D.9 Capital transfers, payable
325.110 B.10.1 Changes in net worth due to saving and capital transfers

THE SATELLITE ACCOUNTS OF THE CO-OPERATIVES AND MUTUAL SOCIETIES AND MUTUAL PROVIDENT SOCIETIES IN SPAIN. 2008
24
III.1.2 Acquisition of non-financial assets account
Changes in assets
Code Transactions and balancing items Changes in liabilities
and net worth
B.10.1 Changes in net worth due to saving and capital transfers 325.110
478.755 P.51 Gross fixed capital formation
- 1.019.895 K.1 Consumption of fixed capital
193.000 P.52 Changes in inventories
K.2 Acquisitions and disposals of non-financial
non-produced assets
673.250 B.9 Net lending(+) / net borrowing(-)
5.3. The satellite accounts of the financial entities of the Social Economy (S.12): credit co-operatives, mutual societies and mutual provident societies
The Satellite Accounts of the credit co-operatives have been drawn up from aggregate accounting information provided by the Banco de España (Spanish Central Bank) corresponding to the financial years 2007 and 2008. Given that the Financial Intermediation Services Indirectly Measured (FISIM) have been provided by the Banco de España calculated globally for the group of banking financial intermediaries, the part of this sum corresponding to the credit co-operatives was then estimated.
Regarding the mutual societies and the mutual provident societies, the aggregate accounting information has been provided by the General Directorate of Insurance and Pension Funds (DGFSP) of the Ministry of Economy. Given the particular characteristics of the Accounting Plan for insurance enterprises, it seems appropriate to review in detail how the accounting items of the mutual societies and the mutual provident societies fit in with the items of national accounting:
- Output (P1): ESA 95 sets out a specific system of calculation for determining the output of insurance services. This system quantifies the output of Subsector S.125 “Insurance corporations and pension funds” as an aggregation of the three variables explained below: � Output of pension funds and collective life insurance. It is measured as the outcome
of the following transactions: Total actual contributions earned + Total contribution supplements (equal to the income from the investment of the technical reserves of the pension funds or the collective life insurance) – Total benefits due (or Total claims) and – Change in the actuarial reserves of the pension funds (or collective life insurance).
� Output of other types of insurance (individual life insurance and non-life insurance). It is calculated in the following way: Total actual premiums earned + Total

THE SATELLITE ACCOUNTS OF THE CO-OPERATIVES AND MUTUAL SOCIETIES AND
MUTUAL PROVIDENT SOCIETIES IN SPAIN. 2008
25
premium supplements (equal to the income from the investment of the insurance technical reserves) – Total claims due – Change in the actuarial reserves (technical provisions or mathematical reserves) and reserves for with-profits insurance.
� Output of reinsurance: This transaction takes place when the direct insurer transfers part of its risks to another insurer or reinsurer, calculating the amount as the balance of all flows that take place between the direct insurer and the reinsurer. It should be pointed out that the reinsurance accepted is recorded as Output for the accepting insurer, while for the ceding insurer it will be considered as Intermediate Consumption.
- Intermediate consumption (P.2). Intermediate consumption consists of the value of the goods and services (other than capital goods) consumed in the development of the activity of the insurance corporations and pension funds. The services of buying reinsurance and the services provided by insurance auxiliaries must be emphasised as specific Intermediate Consumption of considerable quantitative importance in the insurance business.
- Compensation of employees (D.1). This comprises the total remuneration, in cash and in kind paid to the employees for their contribution to the productive process. This variable is broken down into two components: Wages and salaries (D.11), which are the amounts received by the employees for the different concepts included in the salary plus the contributions by employees to the social security systems and Employers’ social contributions (D.12), which are the actual payments made by the employers to the social security system on behalf of the employees.
- Other taxes on production (D.29): These comprise all taxes that enterprises incur as a result of engaging in production, independently of the quantity or value of the goods and services produced or sold.
- Other subsidies on production (D.39): These are the subsidies that resident units can receive as producers, irrespective of the price or quantity of the product obtained.
- Property income (D.4): This is the income that the owners of a financial asset or a tangible non-produced asset receive in return for putting these assets at the disposal of another institutional unit. A transaction within insurance activity should be indicated as part of property income, the “Property income attributed to insurance policyholders” (D.44). Under this item are recorded all the net income derived from the investment of the technical provisions of life insurance, non-life insurance and of autonomous pension funds. This income is attributable to the policyholders and unit holders.
- Current taxes on income, wealth, etc. (D.5). This transaction collects together corporation tax and the taxes levied on capital gains.
- Social contributions (D.61): This includes the amount of contributions made by Sector S.14 “Households” to the insurance corporations and the autonomous pension funds to acquire the right to the social benefits provided by these institutions.
- Social benefits (D.62): This collects the amount of social benefits that the households (residents or non-residents) receive from Subsector S.125 “Insurance corporations and

THE SATELLITE ACCOUNTS OF THE CO-OPERATIVES AND MUTUAL SOCIETIES AND MUTUAL PROVIDENT SOCIETIES IN SPAIN. 2008
26
pension funds” as a counterpart to the contributions made to the social benefit systems included in it.
- Net non-life insurance premiums (D.71): The premium paid to the insurance enterprises has two components, one part to cover the payment of claims, while the other part remunerates the insurance service. The net premiums of non-life insurance are the part of the non-life insurance (accidents, illness, transport, fires, cars etc.) premiums that finance the claims.
- Non-life insurance claims (D.72): These are the amounts that the insurance corporations are obliged to pay as the corresponding benefits to non-life insurance policies. For the Subsector S.125, the amount of the claims of non-life insurance policies has to be equal to the amount of net premiums corresponding to these insurance policies, thereby fulfilling the basic identity that characterises the performance of the activity.
- Other current transfers (D.7): All transfers in money, goods or services that take place between Subsector S.125 and other sectors and subsectors of the economy are included under this variable.
- Adjustment for the change in net equity of households in pension fund reserves (D.8). This transaction makes it possible to include in the savings of households the changes in actuarial reserves of the pension funds and of the collective life insurance, which implement the pension commitments to which this sector (S.14) has a defined right.
- Capital transfers (D.9): Within this item are the taxes levied on the capital and wealth of economic units, investment grants and other capital transfers (granted or received).
- Gross capital formation (P.5): As established in ESA 95, for the Subsector S.125 Gross fixed capital formation covers the acquisitions less disposals of fixed assets, plus certain additions in the value of non-produced assets (land and other natural resources) arising out of the productive activity of the economic units. It also includes acquisitions less disposal of valuables.
- Consumption of fixed capital (K.1): This represents the amount of fixed assets used up during the period under consideration as a result of normal wear and tear and foreseeable obsolescence, including a provision for losses of fixed assets as a result of accidental damage that can be insured against.
It must be pointed out that the Profit and Loss Account of the insurance enterprises is composed of the following documents: the Life Insurance and Non-life Insurance Technical Accounts and Non-Technical Account. As set out in the Accounting Plan of the Insurance Corporations, the Life insurance and Non-life insurance technical accounts shall comprise, with pertinent separation, the income and expenditure arising during the insurance financial year in the Life Insurance Branch (Life Insurance Technical Account) or in the Non-life Insurance Branches (Non-life Insurance Technical Account). The Non-Technical Account collects the income and expenditure that have not been included in the previous headings.

THE SATELLITE ACCOUNTS OF THE CO-OPERATIVES AND MUTUAL SOCIETIES AND
MUTUAL PROVIDENT SOCIETIES IN SPAIN. 2008
27
Calculation of the principal variables of the satellite accounts of the Mutual societies and the Mutual provident societies:
Output (P.1): Determining the output of the Mutual insurance companies and the Mutual provident societies is carried out in several stages: Calculation of the output of the Life Insurance Branch, calculation of the output of the Non-life Insurance Branches, and calculation of the non-technical output. Aggregation of these components produces the value of the variable that is shown in the satellite accounts.
- Calculation of the output of the Life Insurance Branch: To determine the output of the Life Insurance Branch, the information is taken from its Technical Account. Output will be obtained as an aggregate of the following items:
With a positive sign (+): Direct premiums written and reinsurance premiums accepted. Change in the provision for unearned premiums, direct insurance and reinsurance accepted. Income from financial and real estate investment net of expenditure for these concepts. Profits from financial and real estate investments net of losses for these concepts. With a negative sign (-):
Claims and expenditure paid for direct insurance and reinsurance accepted. Claims and expenditure paid for bonuses and rebates. Changes in technical provisions for claims. Change in the mathematical reserves. Change in life insurance provision in which the policyholder bears the investment risk.
- Calculation of the output of the Non-life Insurance Branches: In this case, the Non-life Insurance Technical Account is used to determine the variable. Output is obtained as an aggregate of the following items:
With a positive sign (+):
Direct premiums written and reinsurance premiums accepted. Change in the provision for unearned premiums, direct insurance and reinsurance accepted. Income from financial and real estate investment net of expenditure for these concepts. With a negative sign (+):
Claims and expenditure paid for direct insurance and reinsurance accepted. Claims and expenditure paid for bonuses and rebates. Changes in technical provisions for claims.
- Calculation of non-technical output: Information from the Non-Technical Account is used to calculate the income from the administration of pension funds, as well as the income and expenditure arising from activities of the enterprises that have not been included in the technical accounts.

THE SATELLITE ACCOUNTS OF THE CO-OPERATIVES AND MUTUAL SOCIETIES AND MUTUAL PROVIDENT SOCIETIES IN SPAIN. 2008
28
Intermediate consumption (P.2): Consumption of the services of buying reinsurance is the primary component within intermediate consumption of the insurance enterprises. The life insurance and non-life insurance technical accounts reflect the flows that take place between the direct insurer and the reinsurer or underwriter. The balancing item of these flows will give the Intermediate consumption for this concept. To this amount must be added other expenditure necessary for the productive activity. This expenditure is obtained from the heading “Reclassification of Expenditure”, which is provided by legal form and by type of business (life or non-life insurance) in the serial publications of the General Directorate of Insurance and Pension Funds (DGFSP).
Compensation of employees (D.1) and Other taxes on production (D.29): Both variables are obtained from “Reclassification of Expenditure”. The detail in which this financial statement treats compensation of employees makes it possible to distinguish between “Wages and salaries”, on one hand, and “Social contributions” on the other.
Property income received (D.4): This is obtained by adding the amounts for income from financial investments in the Life insurance and Non-life insurance technical accounts, and the Non-technical account.
Property income paid (D.4): This variable is determined from the information about expenditure arising from financial investments in the Life insurance and Non-life insurance technical accounts, and the Non-technical account.
Property income attributed to insurance policyholders (D.44): This is the income from investments net of the expenditure generated by this same concept, which appears in the technical accounts. This income from investment of the technical provisions or reserves is attributed to the policyholders.
Current taxes on income, wealth, etc. (D.5): Under this item is the Corporation tax that is shown in the Non-technical Account.
Social contributions (D.61): These are the collective life insurance premiums, which implement pension commitments. ESA 95 sets out that this variable must be calculated as a net amount. That is, it will be determined by deducing from the premiums earned plus the net income arising from the technical provisions or reserves, the amount of the insurance service that corresponds to the social contributions.
Social benefits (D.62). The value of this variable is equivalent to the amount of claims and expenditure paid by collective life insurance that implement pension commitment.
Net non-life insurance premiums (D.71): This is the amount of the claims incurred that are recorded in the Non-life Insurance Account.

THE SATELLITE ACCOUNTS OF THE CO-OPERATIVES AND MUTUAL SOCIETIES AND
MUTUAL PROVIDENT SOCIETIES IN SPAIN. 2008
29
Non-life insurance claims (D.72): This variable coincides with the amount for Net non-life insurance premiums.
Adjustment for the change in net equity of households in the reserves of the pension funds (D.8): Its value is determined as the difference between Social contributions and Social benefits. The outcome will emerge from the insurance accounts and will form part of the savings of households.
As an expression of the above, the satellite accounts of National Accounts are presented for Mutual insurance Companies, on one hand, and Mutual Provident Societies on the other.
Satellite accounts (summary) of financial companies of Social Economy (mutual societies, mutual provident societies and credit co-operatives)
Year 2008 (Thousands euros)
Mutual
societies
Mutual provident societies
Total Credit. Co-operatives
Total
Share of total
Financial corpora-
tions (S.12)
(1) (2) (1)+(2) (3) (1)+(2)+(3)
(%)
Output 1,266,596 1,021,765 2,288,361 2,057,000 4,345,361 5.43
Intermediate consumption 588,559 572,084 1,160,643 588,000 1,748,643 6.28
Gross value added 678,037 449,681 1,127,718 1,469,000 2,596,718 4.98
Compensation of employees 323,709 91,119 414,828 985,000 1,399,828 6.11
Operating surplus, gross 345,442 356,707 702,149 481,000 1,183,149 4.10
Saving, gross 295,189 259,974 555,163 1,305,000 1,860,163 5.76
Gross fixed capital formation 131,561 99,438 230,999 607,000 837,999 9.53
Net lending (+)/Net borrowing (-) + 163,745 + 164,798 + 328,543 + 632,000 + 960,543 4.50
5.3.1. The satellite accounts of the credit co-operatives
The credit co-operatives participate in the output of the groups of monetary financial institutions to around 4%, and contribute a slightly inferior percentage in value added. However, the gross operating surplus in 2008 represents a significantly lower percentage (2.12%), although gross capital formation stands out at more than 7% of the total of this item for the subsector of monetary financial institutions

THE SATELLITE ACCOUNTS OF THE CO-OPERATIVES AND MUTUAL SOCIETIES AND MUTUAL PROVIDENT SOCIETIES IN SPAIN. 2008
30
Credit co-operatives share of total sub-sector S.122
(%)
Output 3.85
Intermediate consumption 4.90
Gross value added 3.54
Compensation of employees 5.33
Operating surplus, gross 2.12
Balance of primary incomes, gross 5.04
Disposable income, gross 5.64
Saving, gross 5.27
Gross capital formation 7.18
Net lending(+) / net borrowing(-) 4.60

THE SATELLITE ACCOUNTS OF THE CO-OPERATIVES AND MUTUAL SOCIETIES AND
MUTUAL PROVIDENT SOCIETIES IN SPAIN. 2008
31
CREDIT CO-OPERATIVES Year 2008 (Thousands euros)
Current accounts
I. Production account
Uses Code Transactions and balancing items Resources
P.1 Output 2,057,000
P.11 Market output
P.12 Output for own final use
588,000 P.2 Intermediate consumption
1,469,000 B.1b Value added, gross
252,850 K.1 Consumption of fixed capital
1,216,150 B.1n Value added, net
II.1.1 Generation of income account
Uses Code Transactions and balancing items Resources
B.1b Gross value added 1,469,000
985,000 D.1 Compensation of employees
759,000 D.11 Wages and salaries
226,000 D.12 Employers' social contributions
7,000 D.29 Other taxes on production
- 4,000 D.39 Other subsidies on production
481,000 B.2b Operating surplus, gross
228,150 B.2n Operating surplus, net
II.1.2 Allocation of primary income account
Uses Code Transactions and balancing items Resources
B.2b Operating surplus, gross 481,000
3,825,000 D.4 Property income 4,876,000
1,532,000 B.5b Balance of primary incomes, gross
1,279,150 B.5n balance of primary incomes, net

THE SATELLITE ACCOUNTS OF THE CO-OPERATIVES AND MUTUAL SOCIETIES AND MUTUAL PROVIDENT SOCIETIES IN SPAIN. 2008
32
II.2 Secondary distribution of income account
Uses Code Transactions and balancing items Resources
B.5b Balance of primary incomes, gross 1,532,000
135,000 D.5 Current taxes on income, wealth
D.61 Social contributions 51,000
49,000 D.62 Social benefits other than social transfers in kind
92,000 D.7 Other current transfers
1,307,000 B.6b Disposable income, gross
1,054,150 B .6n Disposable income, net
II.4.1 Use of disposable income account
Uses Code Transactions and balancing items Resources
B.6b Disposable income, gross 1,307,000
2,000 D.8 Adjustment for the change in net equity of households
in pension funds reserves
1,305,000 B.8b Gross saving
1,052,150 B.8n Net saving
Accumulation accounts
III.1.1 Change in net worth due to saving and capital transfers account
Changes in assets
Code Transactions and balancing items Changes in liabilities
and net worth
B.8n Net saving 1,052,150
D.9 Capital transfers, receivable
D.9 Capital transfers, payable -66.000
986,150 B.10.1 Changes in net worth due to saving and capital transfers

THE SATELLITE ACCOUNTS OF THE CO-OPERATIVES AND MUTUAL SOCIETIES AND
MUTUAL PROVIDENT SOCIETIES IN SPAIN. 2008
33
III.1.2 Acquisition of non-financial assets account
Changes in assets
Code Transactions and balancing items Changes in liabilities
and net worth
B.10.1 Changes in net worth due to saving and capital transfers 986,150
607,000 P.51 Gross fixed capital formation
- 252,850 K.1 Consumption of fixed capital
P.52 Changes in inventories
K.2 Acquisitions less disposals of non-financial non-produced assets
+ 632,000 B.9 Net lending (+) / net borrowing (-)
5.3.2. The satellite accounts of the Mutual insurance companies and the Mutual provident
societies
An initial reading of the satellite accounts of the Mutual insurance companies and the Mutual provident societies clearly shows that although, in the financial year of 2008, the contribution of these entities to the formation of the main aggregates of S.125 “Insurance corporations and pension funds” was, in most cases, between 10 and 15%, there were variables significantly outside this range, which makes it necessary, therefore, to provide a more detailed analysis of their contents.
The Output of the Mutual insurance companies and the Mutual provident societies contributed 13% of the Output of Sub-sector S.125, while within the framework of these enterprises they generated 16% of its Gross value added. The Mutual insurance companies contributed 7% and 10%, respectively, to the determination of those variables, whereas the Mutual provident societies provided 6% and 7%, respectively.
As regards to the distribution of the Gross value added between the factors participating in its creation showed that the Compensation of the employees accounted for by the Sub-sector S.125 came from 15% of these social economy enterprises. Within this group, the Mutual insurance companies carried the most relative weight with nearly 12%, with the remaining 3% accounted for by Mutual provident societies. The Gross operating surplus generated by the Mutual insurance companies and the Mutual provident societies maintains a similar contribution to S.125 similar to that of Gross value added, at 17 %, with a contribution of similar sums between the Mutual insurance companies and the Mutual provident societies.
In Property income (resources and uses), these enterprises of the Social Economy were around 11%, while the Property income attributed to the policyholders was 8%.

THE SATELLITE ACCOUNTS OF THE CO-OPERATIVES AND MUTUAL SOCIETIES AND MUTUAL PROVIDENT SOCIETIES IN SPAIN. 2008
34
Regarding Net non-life insurance premiums and Claims, the Mutual Societies were the ones that made higher contributions to the amounts accounted for in S.125; of the 15% contribution made by the Mutual insurance companies and the Mutual provident societies, 12% came from the Mutual insurance companies, indicating a specialization by these enterprises in non-life insurance.
These two groups of enterprises generated 12% of the Gross disposable income of S.125, with the Mutual provident societies generating 9% and the Mutual insurance companies 3%.
In relation to change in net equity of households in pension fund reserves, it only reached a significant amount for the Mutual provident societies, for the reasons expressed about specialization in non-life branches, which has little relevance for the Mutual societies.
Mutual societies and Mutual provident societies contributed approximately 14% to Gross savings, a higher percentage than that for Gross disposable income.
As regards to Accumulation accounts, the important relative weight that Mutual societies and Mutual provident societies had within Gross Capital Formation should be stressed, reaching 58% of the total amount for S.125.
The aggregate behaviour of Mutual Societies and Mutual Provident Societies, detailed above through the analysis of their role in the Sub-sector of which they are a part, made a 10% contribution to the net lending of S.125.

THE SATELLITE ACCOUNTS OF THE CO-OPERATIVES AND MUTUAL SOCIETIES AND
MUTUAL PROVIDENT SOCIETIES IN SPAIN. 2008
35
Mutual societies and mutual provident societies: contribution to sub sector S.125 “insurance corporations and pension funds”
MUTUAL SOCIETIES
Year 2008 (Thousands euros)
Current accounts
I. Production account
Uses Code Transactions and balancing items Resources
P.1 Output 1,266,596
P.11 Market output 1,266,596
P.12 Output for own final use
588,559 P.2 Intermediate consumption
678,037 B.1b Value added, gross
12,284 K.1 Consumption of fixed capital
665,753 B.1n Value added, net
Mutual provident
societies Percentage of total sub-sector S.125
Mutual societies
Percentage of total sub-sector S.125
Provident societies
and mutual societies Percentage of total sub-sector S.125
Output 5.61 6.95 12.56 Intermediate consumption 5.04 5.18 10.22 Gross value added 6.56 9.88 16.44 Compensation of employees 3.29 11.7 14.99 Operating surplus, gross 8.81 8.53 17.34 Balance of primary incomes, gross 5.19 7.08 12.27 Disposable income, gross 9.27 3.07 12.34 Saving, gross 6.76 7.68 14.45 Gross capital formation 25.37 33.56 58.93 Net lending(+) / net borrowing(-) 4.78 4.74 9.52

THE SATELLITE ACCOUNTS OF THE CO-OPERATIVES AND MUTUAL SOCIETIES AND MUTUAL PROVIDENT SOCIETIES IN SPAIN. 2008
36
II.1.1 Generation of income account
Uses Code Transactions and balancing items Resources
B.1b Value added, gross 678,037
B.1n Value added, net 665,753
323,709 D.1 Compensation of employees
229,142 D.11 Wages and salaries
94,566 D.12 Employers' social contributions
8,886 D.29 Other taxes on production
D.39 Other subsidies on production
345,442 B.2b Operating surplus, gross
333,158 B.2n Operating surplus, net
II.1.2 Allocation of primary income account
Uses Code Transactions and balancing items Resources
B.2b Operating surplus, gross 345,442
B.2n Operating surplus, net 333,158
353,532 D.4 Property income 372,781
39,417 D.41 Interest 342,959
D.42 Distributed income of corporations 29,822
D.43 Reinvested earnings on direct foreign investment
314,115 D.44 Property income attributed to insurance policy holders
D.45 Rents
364,691 B.5b Balance of primary incomes, gross
352,407 B.5n balance of primary incomes, net

THE SATELLITE ACCOUNTS OF THE CO-OPERATIVES AND MUTUAL SOCIETIES AND
MUTUAL PROVIDENT SOCIETIES IN SPAIN. 2008
37
II.2 Secondary distribution of income account
Uses Code Transactions and balancing items Resources
B.5b Balance of primary incomes, gross 364,691
B.5n Balance of primary incomes, net 352,407
69,502 D.5 Current taxes on income, wealth
D.61 Social contributions
D.62 Social benefits other than social transfers in kind
2,521,907 D.7 Other current transfers 2.521.907
D.71 Net non-life insurance premiums 2.521.907
2,521,907 D.72 Non-life insurance claims
D.75 Miscellaneous current transfers
295,189 B.6b Disposable income, gross
282,905 B .6n Disposable income, net
II.4.1 Use of disposable income account
Uses Code Transactions and balancing items Resources
B.6b Disposable income, gross 295,189
B.6n Disposable income, net 282,905
D.8 Adjustment for the change in net equity of households
in pension funds reserves
295,189 B.8b Saving, gross
282,905 B.8n Saving, net

THE SATELLITE ACCOUNTS OF THE CO-OPERATIVES AND MUTUAL SOCIETIES AND MUTUAL PROVIDENT SOCIETIES IN SPAIN. 2008
38
Accumulation accounts
III.1.1 Change in net worth due to saving and capital transfers account
Changes
in assets
Code Transactions and balancing items Changes in liabilities
and net worth
B.8n Saving, net 282,905
D.9 Capital transfers, receivable 117
D.91 Capital taxes
D.92 Investment grants
D.99 Other capital transfers 117
D.9 Capital transfers, payable
D.91 Capital taxes
D.92 Investment grants
D.99 Other capital transfers
283,022 B.10.1 Changes in net worth due to saving and capital transfers
III.1.2. Acquisition of non-financial assets account
Changes in
assets
Code Transactions and balancing items Changes in liabilities
and net worth
B.10.1 Changes in net worth due to saving and capital transfers 283,022
131,561 P.5 Gross capital formation
131,561 P.51 Gross fixed capital formation
-12,284 K.1 Consumption of fixed capital
P.52/53 Changes in inventories and acquisitions less disposals of
valuables
K.2 Acquisitions less disposals of non-financial non-produced
assets
163,745 B.9 Net lending (+) / net borrowing (-)

THE SATELLITE ACCOUNTS OF THE CO-OPERATIVES AND MUTUAL SOCIETIES AND
MUTUAL PROVIDENT SOCIETIES IN SPAIN. 2008
39
MUTUAL PROVIDENT SOCIETIES
Year 2008. (Thousands euros)
Current accounts
I. Production account
Uses Code Transactions and balancing items Resources
P.1 Output 1,021,765
P.11 Market output 1,021,765
P.12 Output for own final use
572,084 P.2 Intermediate consumption
449,681 B.1b Value added, gross
14,934 K.1 Consumption of fixed capital
434,747 B.1n Value added, net
II.1.1. Generation of income account
Uses Code Transactions and balancing items Resources
B.1b Gross value added 449,681
B.1n Net value added 434,747
91,119 D.1 Compensation of employees
66,267 D.11 Wages and salaries
24,851 D.12 Employers' social contributions
1,920 D.29 Other taxes on production
-65 D.39 Other subsidies on production
356,707 B.2b Operating surplus, gross
341,773 B.2n Operating surplus, net

THE SATELLITE ACCOUNTS OF THE CO-OPERATIVES AND MUTUAL SOCIETIES AND MUTUAL PROVIDENT SOCIETIES IN SPAIN. 2008
40
II.1.2. Allocation of primary income account
Uses Code Transactions and balancing items Resources
B.2b Operating surplus, gross 356,707
B.2n Operating surplus, net 341,773
2,025,288 D.4 Property income 1,935,929
1,031,404 D.41 Interest 1,829,721
D.42 Distributed income of corporations 106,208
D.43 Reinvested earnings on direct foreign investment
993,884 D.44 Property income attributed to insurance policy holders
D.45 Rents
267,348 B.5b Balance of primary incomes, gross
252,414 B.5n balance of primary incomes, net
II.2. Secondary distribution of income account
Uses Code Transactions and balancing items Resources
B.5b Balance of primary incomes, gross 267,348
B.5n Balance of primary incomes, net 252,414
7,446 D.5 Current taxes on income, wealth
D.61 Social contributions 2,338,559
1,707,988 D.62 Social benefits other than social transfers in kind
683,694 D.7 Other current transfers 683,766
D.71 Net non-life insurance premiums 683,694
683,694 D.72 Non-life insurance claims
D.75 Miscellaneous current transfers 72
890,545 B.6b Disposable income, gross
875,611 B .6n Disposable income, net
II.4.1. Use of disposable income account
Uses Code Transactions and balancing items Resources
B.6b Disposable income, gross 890,545
B.6n Disposable income, net 875,611
630,571 D.8 Adjustment for the change in net equity of households
in pension funds reserves
259,974 B.8b Saving, gross
245,040 B.8n Saving, net

THE SATELLITE ACCOUNTS OF THE CO-OPERATIVES AND MUTUAL SOCIETIES AND
MUTUAL PROVIDENT SOCIETIES IN SPAIN. 2008
41
Accumulation accounts
III.1.1 Change in net worth due to saving and capital transfers account
Changes in assets
Code Transactions and balancing items Changes in liabilities
and net worth
B.8n Saving, net 245,040
D.9 Capital transfers, receivable 4,262
D.91 Capital taxes
D.92 Investment grants
D.99 Other capital transfers 4,262
D.9 Capital transfers, payable
D.91 Capital taxes
D.92 Investment grants
D.99 Other capital transfers
249,302 B.10.1 Changes in net worth due to saving and capital transfers
III.1.2. Acquisition of non-financial assets account
Changes in assets
Code Transactions and balancing items Changes in liabilities
and net worth
B.10.1 Changes in net worth due to saving and capital transfers 249,302
99,438 P.5 Gross capital formation
99,438 P.51 Gross fixed capital formation
-14,934 K.1 Consumption of fixed capital
P.52/53 Changes in inventories and acquisitions less disposals of
valuables
K.2 Acquisitions less disposals of non-financial non-produced
assets
164,798 B.9 Net lending (+) / net borrowing (-)

THE SATELLITE ACCOUNTS OF THE CO-OPERATIVES AND MUTUAL SOCIETIES AND MUTUAL PROVIDENT SOCIETIES IN SPAIN. 2008
42
5.4 The satellite accounts of the non-financial corporations (S.11) and financial institutions (S.12) of the Social Economy: co-operatives, mutual societies and mutual provident societies
Satelite accounts (summary) for non-financial co-operatives and financial bodies of Social Economy (Thousands euros)
Non-financial Co-operatives
Financial corporations
of Social Economy
Total Share of
total S 11 + S 12
(1) (2) (1+2) (%)
Output 53,195,972 4,345,361 57,541,333 4.19
Intermediate consumption 45,247,902 1,748,643 46,996,545 5.84
Gross value added at market prices 7,948,070 2,596,718 10,544,788 1.90
Compensation of employees 6,210,892 1,399,828 7,610,720 2.16
Operating surplus, gross 1,736,704 1,183,149 2,919,853 2.71
Saving, gross 1,219,850 1,860,163 3,080,013 2.78
Gross fixed capital formation 478,755 837,999 1,316,754 0.91
Net lending (+) / net borrowing (-) + 673,250 + 960,543 + 1,633,793 ---
6. The satellite accounts of the non-financial co-operatives by industry
In this section, the satellite accounts of the non-financial co-operatives by industry are presented, grouped into four large blocks: Agriculture and fishing, Industry, Construction and Services. It can be verified that the most important branch is that of “services”, which includes more than 64% of the output of all non-financial co-operatives. It must be taken into account that the activity of numerous “agri-food” co-operatives has been included in the branch “services”, as these enterprises state that their principal activity is the commercialisation of the market for the products of their members. Therefore, their activity has been included in the branch “services”. Moreover, the activity of powerful co-operatives involved in the commercial distribution of products of final consumption or of merchandise to retail members is included in the branch “services”.

THE SATELLITE ACCOUNTS OF THE CO-OPERATIVES AND MUTUAL SOCIETIES AND
MUTUAL PROVIDENT SOCIETIES IN SPAIN. 2008
43
Industrial activity is the second most important (22.45% of the total) and all the branches, except for construction, have a positive net lending. Construction has an evident net borrowing requirement even though, like the rest of the industries, it is characterised by a low rate of gross fixed capital formation.
6.1. Satellite accounts: non-financial co-operatives by industry
Major balancing items of satellite accounts of non financial co-operatives by industry. Year 2008 (Thousands euros)
Gross value added of non financial co-operatives by industry Year 2008 (Thousands euros)
INDUSTRIES
Agr
icul
ture
and
fi
shin
g
(%)S
hare
of
tota
l no
n-F
inan
cial
Co
-ope
rati
ves
Man
ufac
turi
ng
(%)
Shar
e of
tot
al
non
-Fin
anci
al
Co-o
pera
tive
s
Co
nstr
ucti
on
(%)
Shar
e of
tot
al
non
-Fin
anci
al
Co-o
pera
tive
s
Se
rvic
es
(%)
Shar
e of
tot
al
Co
-ope
rati
ves
Totals
Output 3,279,598 6.16 11,940,326 22.45 3,778,246 7.10 34,197,802 64.29 53,195,972
Intermediate consumption 2,680,133 5.92 9,812,077 21.68 3,200,396 7.07 29,555,296 65.32 45,247,902
Gross value added 599,465 7.54 2,128,249 26.77 577,851 7.28 4,642,506 58.41 7,948,070
Compensation of employees 478,621 7.71 1,606,647 25.87 453,436 7.29 3,672,188 59.12 6,210,892
Gross operating surplus 120,812 6.91 521,500 30.5 124,378 7.19 970,015 55.84 1,736,704
Saving, gross 96,413 7.87 365,981 30.00 - 40,510 - 3.36 797,967 65.41 1,219,851
Gross capital formation 42,162 8.77 74,690 15.66 64,301 13.36 297,601 62.21 478,755
Net lending (+) / net borrowing (-) 107,362 15.90 408,116 60.62 - 338,039 - 50.22 495,812 73.70 673,251
INDUSTRIES
Agriculture Manufacturing Construction Services Totals
Total % Total % Total % Total % Total %
Output 3,279,598 100 11,940,326 100 3,778,246 100 34,197,802 100 53,195,972 100
Intermediate consumption 2,680,133 81.73 9,812,077 82.18 3,200,396 84.70 29,555,296 86.42 45,247,902 85.06
Gross value added 599,465 18.27 2,128,249 17.82 577,851 15.30 4,642,506 13.58 7,948,070 14.94

THE SATELLITE ACCOUNTS OF THE CO-OPERATIVES AND MUTUAL SOCIETIES AND MUTUAL PROVIDENT SOCIETIES IN SPAIN. 2008
44
Gross value added breakdown of non financial co-operatives by industry Year 2008 (Thousands euros)
INDUSTRIES
RUBRICS
Agriculture Manufacturing Construction Services Totals
Total % Total % Total % Total % Total %
Gross value added 599,465 100 2,128,249 100 577,851 100 4,642,506 100 7,948,071 100
Compensation of employees 478,621 79.97 1,606,647 75.52 453,436 78.37 3,672,188 79.09 6,210,892 78.15
Operating surplus, gross 120,812 20.03 521,500 24.48 124,378 21.63 970,015 20.91 1,736,705 21.85

THE SATELLITE ACCOUNTS OF THE CO-OPERATIVES AND MUTUAL SOCIETIES AND
MUTUAL PROVIDENT SOCIETIES IN SPAIN. 2008
45
SATELLITE ACCOUNTS OF CO-OPERATIVES BY
INDUSTRY AGRICULTURE AND FISHING
Year 2008 (Thousands euros)
Current accounts
I. Production account
Uses Code Transactions and balancing items Resources
P.1 Output 3,279,598
P.11 Market output 3,273,095
P.12 Output for own final use 6,503
2,680,133 P.2 Intermediate consumption
599,465 B.1b Value added, gross
103,205 K.1 Consumption of fixed capital
496,260 B.1n Value added, net
II.1.1 Generation of income account
Uses Code Transactions and balancing items Resources
B.1b Value added, gross 599,465
478,621 D.1 Compensation of employees
373,325 D.11 Wages and salaries
105,297 D.12 Employers' social contributions
164 D.2 Taxes on production and imports
- 132 D.3 - Subsidies
120,812 B.2b Operating surplus, gross
17,607 B.2n Operating surplus, net
II.1.2 Allocation of primary income account
Uses Code Transactions and balancing items Resources
B.2b Operating surplus, gross 120,812
44,566 D.4 Property income 18,273
94,517 B.5b Balance of primary incomes, gross
- 8,688 B.5n balance of primary incomes, net

THE SATELLITE ACCOUNTS OF THE CO-OPERATIVES AND MUTUAL SOCIETIES AND MUTUAL PROVIDENT SOCIETIES IN SPAIN. 2008
46
II.2 Secondary distribution of income account
Uses Code Transactions and balancing items Resources
B.5b Balance of primary incomes, gross 94,517
3,521 D.5 Current taxes on income, wealth
D.61 Social contributions 11,793
6,376 D.62 Social benefits other than social transfers in kind
D.7 Other current transfers
96,413 B.6b Disposable income, gross
- 6,792 B .6n Disposable income, net
II.4.1 Use of disposable income account
Uses Code Transactions and balancing items Resources
B.6b Disposable income, gross 96,413
D.8 Adjustment for the change in net equity of households
in pension funds reserves
96,413 B.8b Saving, gross
- 6,792 B.8n Saving, net
Accumulation accounts
III.1.1. Change in net worth due to saving and capital transfers account
Changes in assets
Code Transactions and balancing items Changes in liabilities
and net worth
B.8n Saving, net - 6,792
D.9 Capital transfers, receivable 23,076
D.9 Capital transfers, payable
16,284 B.10.1 Changes in net worth due to saving and capital transfers

THE SATELLITE ACCOUNTS OF THE CO-OPERATIVES AND MUTUAL SOCIETIES AND
MUTUAL PROVIDENT SOCIETIES IN SPAIN. 2008
47
III.1.2. Acquisition of non-financial assets account
Changes in assets
Code Transactions and balancing items Changes in liabilities
and net worth
B.10.1 Changes in net worth due to saving and capital transfers 16,284
42,162 P.51 Gross fixed capital formation
-103,205 K.1 Consumption of fixed capital
- 30,035 P.52 Changes in inventories
K.2 Acquisitions less disposals of non-financial non-produced assets
107,362 B.9 Net lending(+) / net borrowing(-)
SATELLITE ACCOUNTS OF CO-OPERATIVES BY INDUSTRY
MANUFACTURING
Year 2008 (Thousands euros)
Current accounts
I. Production account
Uses Code Transactions and balancing items Resources
P.1 Output 11,940,326
P.11 Market output 11,914,838
P.12 Output for own final use 25,488
9,812,077 P.2 Intermediate consumption
2,128,249 B.1b Value added, gross
355,381 K.1 Consumption of fixed capital
1,772,868 B.1n Value added, net

THE SATELLITE ACCOUNTS OF THE CO-OPERATIVES AND MUTUAL SOCIETIES AND MUTUAL PROVIDENT SOCIETIES IN SPAIN. 2008
48
II.1.1. Generation of income account
Uses Code Transactions and balancing items Resources
B.1b Value added, gross 2,128,249
1,606,647 D.1 Compensation of employees
1,253,185 D.11 Wages and salaries
353,462 D.12 Employers' social contributions
598 D.2 Taxes on production and imports
- 496 D.3 - Subsidies
521,500 B.2b Operating surplus, gross
166,119 B.2n Operating surplus, net
II.1.2. Allocation of primary income account
Uses Code Transactions and balancing items Resources
B.2b Operating surplus, gross 521,500
250,730 D.4 Property income 115,153
385,923 B.5b Balance of primary incomes, gross
30,542 B.5n balance of primary incomes, net
II.2. Secondary distribution of income account
Uses Code Transactions and balancing items Resources
B.5b Balance of primary incomes, gross 385,923
25,816 D.5 Current taxes on income, wealth
D.61 Social contributions 39,588
33,714 D.62 Social benefits other than social transfers in kind
D.7 Other current transfers
365,981 B.6b Disposable income, gross
10,600 B .6n Disposable income, net

THE SATELLITE ACCOUNTS OF THE CO-OPERATIVES AND MUTUAL SOCIETIES AND
MUTUAL PROVIDENT SOCIETIES IN SPAIN. 2008
49
II.4.1. Use of disposable income account
Uses Code Transactions and balancing items Resources
B.6b Disposable income, gross 365,981
D.8 Adjustment for the change in net equity of households
in pension funds reserves
365,981 B.8b Gross saving
10,600 B.8n Net saving
Accumulation accounts
III.1.1 Change in net worth due to saving and capital transfers account
Changes in assets
Code Transactions and balancing items Changes in liabilities
and net worth
B.8n Net saving 10,600
D.9 Capital transfers, receivable 86,329
D.9 Capital transfers, payable
96,929 B.10.1 Changes in net worth due to saving and capital transfers
III.1.2. Acquisition of non-financial assets account
Changes in assets
Code Transactions and balancing items Changes in liabilities
and net worth
B.10.1 Changes in net worth due to saving and capital transfers 96,929
74,690 P.51 Gross fixed capital formation
- 355,381 K.1 Consumption of fixed capital
- 30,496 P.52/53 Changes in inventories
K.2 Acquisitions less disposals of non-financial non-produced
assets
408,116 B.9 Net lending(+) / net borrowing(-)

THE SATELLITE ACCOUNTS OF THE CO-OPERATIVES AND MUTUAL SOCIETIES AND MUTUAL PROVIDENT SOCIETIES IN SPAIN. 2008
50
SATELLITE ACCOUNTS OF CO-OPERATIVES BY INDUSTRY
CONSTRUCTION
Year 2008 (Thousands euros)
Current accounts
I. Production account
Uses Code Transactions and balancing items Resources
P.1 Output 3,778,246
P.11 Market output 3,769,754
P.12 Output for own final use 8,492
3,200,395 P.2 Intermediate consumption
577,851 B.1b Value added, gross
30,434 K.1 Consumption of fixed capital
547,417 B.1n Value added, net
II.1.1 Generation of income account
Uses Code Transactions and balancing items Resources
B.1b Value added, gross 577,851
453,436 D.1 Compensation of employees
353,680 D.11 Wages and salaries
99,756 D.12 Employers' social contributions
189 D.2 Taxes on production and imports
- 152 D.3 Subsidies
124,378 B.2b Operating surplus, gross
93,945 B.2n Operating surplus, net
II.1.2. Allocation of primary income account
Uses Code Transactions and balancing items Resources
B.2b Operating surplus, gross 124,378
191,039 D.4 Property income 31,162
-35,499 B.5b Balance of primary incomes, gross
- 65,932 B.5n balance of primary incomes, net

THE SATELLITE ACCOUNTS OF THE CO-OPERATIVES AND MUTUAL SOCIETIES AND
MUTUAL PROVIDENT SOCIETIES IN SPAIN. 2008
51
II.2 Secondary distribution of income account
Uses Code Transactions and balancing items Resources
B.5b Balance of primary incomes, gross - 35,499
7,555 D.5 Current taxes on income, wealth
D.61 Social contributions 11,173
8,629 D.62 Social benefits other than social transfers in kind
D.7 Other current transfers
- 40,510 B.6b Disposable income, gross
- 70,943 B .6n Disposable income, net
II.4.1 Use of disposable income account
Uses Code Transactions and balancing items Resources
B.6b Disposable income, gross - 40,510
D.8 Adjustment for the change in net equity of households
in pension funds reserves
- 40,510 B.8b Saving, gross
- 70,943 B.8n Saving, net

THE SATELLITE ACCOUNTS OF THE CO-OPERATIVES AND MUTUAL SOCIETIES AND MUTUAL PROVIDENT SOCIETIES IN SPAIN. 2008
52
Accumulation accounts
III.1.1 Change in net worth due to saving and capital transfers account
Changes in assets
Code Transactions and balancing items Changes in liabilities
and net worth
B.8n Saving, net - 70,943
D.9 Capital transfers, receivable - 44,219
D.9 Capital transfers, payable
- 115,163 B.10.1 Changes in net worth due to saving and capital transfers
III.1.2 Acquisition of non-financial assets account
Changes in assets
Code Transactions and balancing items Changes in liabilities
and net worth
B.10.1 Changes in net worth due to saving and capital transfers -115,163
64,301 P.51 Gross fixed capital formation
- 30,434 K.1 Consumption of fixed capital
189,009 P.52 Changes in inventories
K.2 Acquisitions less disposals of non-financial non-produced assets
- 338,039 B.9 Net lending(+) / net borrowing(-)

THE SATELLITE ACCOUNTS OF THE CO-OPERATIVES AND MUTUAL SOCIETIES AND
MUTUAL PROVIDENT SOCIETIES IN SPAIN. 2008
53
SATELLITE ACCOUNTS OF CO-OPERATIVES BY INDUSTRY
SERVICES
Year 2008 (Thousands euros)
Current accounts
1. Production account
Uses Code Transactions and balancing items Resources
P.1 Output 34,197,802
P.11 Market output 34,171,823
P.12 Output produced for own final use 25,979
29,555,296 P.2 Intermediate consumption
4,642,506 B.1b Value added, gross
530,876 K.1 Consumption of fixed capital
4,111,630 B.1n Net value added
II.1.1. Generation of income account
Uses Code Transactions and balancing items Resources
B.1b Value added, gross 4,642,506
3,672,188 D.1 Compensation of employees
2,864,306 D.11 Wages and salaries
807,881 D.12 Employers' social contributions
1,710 D.29 Taxes on production and imports
- 1,407 D.3 Subsidies
970,015 B.2b Operating surplus, gross
439,139 B.2n Operating surplus, net
II.1.2 Allocation of primary income account
Uses Code Transactions and balancing items Resources
B.2b Operating surplus, gross 970,015
476,358 D.4 Property income 330,122
823,779 B.5b Balance of primary incomes, gross
292,903 B.5n balance of primary incomes, net

THE SATELLITE ACCOUNTS OF THE CO-OPERATIVES AND MUTUAL SOCIETIES AND MUTUAL PROVIDENT SOCIETIES IN SPAIN. 2008
54
II.2 Secondary distribution of income account
Uses Code Transactions and balancing items Resources
B.5b Balance of primary incomes, gross 823,779
31,403 D.5 Current taxes on income, wealth
D.61 Social contributions 90,483
84,891 D.62 Social benefits other than social transfers in kind
D.7 Other current transfers
797,967 B.6b Disposable income, gross
267,091 B .6n Disposable income, net
II.4.1. Use of disposable income account
Uses Code Transactions and balancing items Resources
B.6b Disposable income, gross 797,967
D.8 Adjustment for the change in net equity of households
in pension funds reserves
797,967 B.8b Saving, gross
267,091 B.8n Saving, net
Accumulation accounts
III.1.1 Change in net worth due to saving and capital transfers account
Changes in assets
Code Transactions and balancing items Changes in liabilities
and net worth
B.8n Saving, net 267,091
D.9 Capital transfers, receivable 59,970
D.9 Capital transfers, payable
327,061 B.10.1 Changes in net worth due to saving and capital transfers

THE SATELLITE ACCOUNTS OF THE CO-OPERATIVES AND MUTUAL SOCIETIES AND
MUTUAL PROVIDENT SOCIETIES IN SPAIN. 2008
55
III.1.2. Acquisition of non-financial assets account
Changes in assets
Code Transactions and balancing items Changes in liabilities
and net worth
B.10.1 Changes in net worth due to saving and capital transfers 327,061
297,601 P.51 Gross fixed capital formation
- 530,876 K.1 Consumption of fixed capital
64,524 P.52 Changes in inventories
K.2 Acquisitions less disposals of non-financial non-produced
assets
495,812 B.9 Net lending (+) / net borrowing (-)
7. Other indicators of the non-monetary activity of co-operatives, mutual societies and mutual provident societies
7.1. Introduction
As indicated in section 4 of this Report, the Spanish Monitoring Centre of the Social Economy of CIRIEC-Spain has carried out a wide-ranging national survey of Co-operatives to obtain various data about them for 2008. Supplementary data and social indicators have also been obtained from different public and private registers and from company annual reports. The main results are shown below and have been obtained from the Report “Las
grandes cifras de la Economía Social en España. Año 2008” (The Large Figures of the Social Economy in Spain. 2008) of CIRIEC-Spain.

THE SATELLITE ACCOUNTS OF THE CO-OPERATIVES AND MUTUAL SOCIETIES AND MUTUAL PROVIDENT SOCIETIES IN SPAIN. 2008
56
7.2. Non-monetary data of the co-operatives in Spain in 2008
Table 1. Non-monetary data of active co-operatives in Spain* Year 2008
* Excluding Ceuta and Melilla. ** Including employment numbers for all companies affiliated with Grupo Eroski. Direct employments of the consumers’ co-operatives are 33,714. In the line of consumers’ and users’ co-operatives the aggregates of health co-operatives (SCIAS) are not included. *** Data belong to the health co-operatives SCIAS. The other health co-operatives are included in consumers’ and users’ co-operatives and Associated labour co-operatives. Source: Survey CIRIEC-2008, Companies’ Annual Reports and Directorate General of the Social Economy, Autonomous Work and Corporate Social Responsibility.
Type of Cooperative Co-operatives Number of members
Direct employment **
Agriculture co-operatives 3,757 1,264,013 90,308
Community farming co-operatives 428 4,887 3,835
Associated labour co-operatives 18,019 155,179 221,844
Consumers’ and users’ co-operatives ** 332 2,858,925 65,618
Service co-operatives 419 45,032 9,830
Transport co-operatives 546 23,057 17,038
Educational co-operatives 303 39,648 14,828
Health co-operatives*** 1 180,000 807
Housing co-operatives 626 84,900 2,981
Credit co-operatives 81 2,096,531 20,940
Other co-operatives 226 22,544 8,841
Total co-operatives 24,738 6,774,716 456,870

THE SATELLITE ACCOUNTS OF THE CO-OPERATIVES AND MUTUAL SOCIETIES AND
MUTUAL PROVIDENT SOCIETIES IN SPAIN. 2008
57
Table 2. Employment characteristics of active co-operatives in Spain *
Year 2008
Nª Employees Disabled persons Women
% Nº % Nº
Agriculture co-operatives 3,757 90,308 0.73 663 30.35 27,410
Community farming co-operatives 428 3,835 0.70 27 21.46 823
The associated labour co-operatives 18,019 221,844 1.961 3,3421 33.031 56,3511
Consumption co-operatives 332 33,714 0.16 53 46.80 15,771
Services co-operatives 419 9,830 0.75 74 29.72 2,921
Transport co-operatives 546 17,038 0.842 252 25.462 7612
Educational co-operatives 303 14,828 0.69 102 66.12 9,804
Housing co-operatives 626 2,981 0.133 23 10.633 1663
Another 5 227 9,648 2.84 274 34.95 3,372
Credit co-operatives 81 20,940 NA 46.88 9,817
Total co-operatives 24,738 424,9664 1.35 4,5627 35.518 127,196

THE SATELLITE ACCOUNTS OF THE CO-OPERATIVES AND MUTUAL SOCIETIES AND MUTUAL PROVIDENT SOCIETIES IN SPAIN. 2008
58
* Excluding Ceuta and Melilla. 1. Percentages and absolute value calculated over 170,582 employees in 8,868 CTA with at least one worker paying on General System of Social Security. 2. Percentages and absolute values calculated over 2,989 employees in 230 transport co-operatives with at least one worker paying on General System of Social Security. 3. Percentages and absolute values calculated over 1,562 employees in 153 Housing co-operatives with at least one worker paying on General System of Social Security. 4. 31,904 employees of non-cooperatives subsidiaries corporations of Grupo Eroski are not included. 5. Including the health co-operative SCIAS. 6. Excluding credit co-operatives. 7. Total number persons with disabilities working in cooperatives, excluding credit co-operatives and 9,940 co- operatives paying exclusively by self-employed. 8. Percentages calculated over 358.236 employees. N.A: Not available. Source: Survey CIRIEC-2008, Companies’ Annual Reports and Directorate General of the Social Economy, Autonomous Work and Corporate Social Responsibility.
Permanents Full time Members
% Nº % Nº Media Nº
Agriculture co-operatives 69.86 63,090 82.40 74,416 336,44 1,264,013
Community farming co-operatives 74.68 2,864 91.13 3,495 11,42 4,887
The associated labour co-operatives 83.70 185,691 87.81 194,812 8,61 155,179
Consumption co-operatives 89.80 30,268 77.44 26,108 8,611,22 2,858,925
Services co -operatives 87.71 8,622 90.00 8,846 107,47 45,032
Transport co -operatives 98.13 16,720 97.60 16,629 42,23 23,057
Educational co -operatives 79.54 11,794 83.04 12,313 130,85 39,648
Housing co -operatives 91.743 1,4333 85.163 1,3303 135,623 84,900
Another 5 82.10 7,921 79.34 7,655 892,26 202,544
Credit co -operatives NA NA 25,883,10 2,096,531
Total co-operatives 81.576 328,4036 85.866 345,6046 273,86 6,774,716

THE SATELLITE ACCOUNTS OF THE CO-OPERATIVES AND MUTUAL SOCIETIES AND
MUTUAL PROVIDENT SOCIETIES IN SPAIN. 2008
59
Table 3. Co-operatives and employment by autonomous community
Year 2008
CCAA Number co-operatives Employees
Andalucía 5,223 85.826
Aragón 879 9.722
Asturias 275 4.480
Baleares 212 3.493
Canarias 363 7.452
Cantabria 108 1.859
Castilla-la Mancha 1,518 20.635
Castilla y León 1,454 18.247
Cataluña 5,353 58.086
Com. Valenciana 3,032 70.977
Extremadura 706 7.876
Galicia 924 11.497
Madrid 1,115 18.650
Murcia 1,585 22.814
Navarra 320 7.566
País Vasco 1,513 74.311
Rioja (La) 158 1.445
Total 24,738 424.966 * There are 31,904 employees of non-cooperatives subsidiaries corporations of Grupo Eroski that are not included Survey: Source CIRIEC-2008, Companies’ Annual Reports y Directorate General of the Social Economy, Autonomous Work and Corporate Social Responsibility.
7.3. The associated labour co-operatives (CTA)
The associated labour co-operatives are the most important kind of co-operative in terms of number of enterprises and level of employment. Some 73% of the 24,738 Spanish co-operatives with workers employed are associated labour co-operatives, which give employment to 52% of all workers in co-operatives.
By industry, the associated labour co-operatives are the largest group in the services sector, in terms of number of enterprises (59%), volume of employment (62%) and of sales (43%). Tables 2 and 4 show some employment data by economic activities. Overall, the stability of

THE SATELLITE ACCOUNTS OF THE CO-OPERATIVES AND MUTUAL SOCIETIES AND MUTUAL PROVIDENT SOCIETIES IN SPAIN. 2008
60
employment in associated labour co-operatives stands out -83.7% of permanent employees-, as well as a significant presence of women (33% of total employees).
Table 5 shows the distribution of associated labour co-operatives by State governments, in which stands out the Basque Country followed by Andalusia.
Table 4. Associated Labour Co-operatives (CTA) in Spain. Year 2008
Employment characteristics by industry
[1] CTA with at least one worker paying on General System of Social Security Source: Survey CIRIEC-2008, Directorate General of the Social Economy, Autonomous Work and Corporate Social Responsibility.
Industry Full time Number CTA Employees Women
[1] Permanent
Agriculture 6,694
708
7,591
1,248
5,291
Manufacturing 45,915 3,114 50,498 10,821 42,964
Construction 26,481 3,603 27,012 1,012 22,250
Trade 31,504 2,118 35,268 8,121 31,138
Hotels and restaurants 8,447 740 10,082 4,220 7,942
Transport 14,877 1085 15,783 1,296 14000
Communication 404 40 530 92 385
Financials activities 454 52 584 185 510 Real estate and business services 24,680 3,789 27,168 5,149 25,039
Education 14,394 1,112 19,966 11,215 15,231
Health and social work 14,471 988 18,460 9,971 14,195
Artistic activities 6,491 670 8,902 3,021 6,746
Total services 115,722 10,594 136,743 43,270 115,186
Total 194,812 18,019 221,844 56,351 185,691

THE SATELLITE ACCOUNTS OF THE CO-OPERATIVES AND MUTUAL SOCIETIES AND
MUTUAL PROVIDENT SOCIETIES IN SPAIN. 2008
61
Table 5. CTA in Spain: Co-operatives and employees by Autonomous Community
CCAA Number CTA Employees Andalucía 3,949 38.998
Aragón 588 6.004
Asturias 202 3.357
Baleares 157 2.433
Canarias 228 3.151
Cantabria 80 1.445
Castilla-La Mancha 895 12.754
Castilla y León 703 11.388
Cataluña 4,466 37.186
Com. Valenciana 2,259 23.010
Extremadura 325 4.184
Galicia 578 8.512
Madrid 813 11.741
Murcia 1,324 11.714
Navarra 168 2.627
País Vasco 1,193 42.299
Rioja (La) 91 1.041
Total 18,019 221.844 Source: Survey CIRIEC-2008, Directorate General of the Social Economy, Autonomous Work and Corporate Social Responsibility.
7.4. Agro-alimentary co-operatives
Table 6 shows the distribution of agriculture co-operatives reflecting the number, employment figures and members for each Autonomous Community. Table 2 also provides data about the employment characteristics of these co-operatives, in which 82.4% of its workers are full-time employees, but they show the highest rate of temporary seasonal work (25%) among the different kinds of co-operatives.
The CIRIEC survey also provides some data about the 428 community farming co-operatives, with nearly 4,000 workers (Table 2).

THE SATELLITE ACCOUNTS OF THE CO-OPERATIVES AND MUTUAL SOCIETIES AND MUTUAL PROVIDENT SOCIETIES IN SPAIN. 2008
62
7.5. Consumers’ and users’ co-operatives
The consumers’ and users’ co-operatives have experienced important growth during the last decade, with turnover increasing threefold and employment more than doubling.
The CIRIEC survey of co-operatives has been limited to direct figures provided by these entities, without recording the employment figures for all the subsidiary companies that, in the case of the Grupo Eroski are truly remarkable. Table 7 provides the non-monetary data for the consumers’ co-operatives in Spain. The data for the health co-operative SCIAS are also included in this table.
Consumption co-operativism in Spain is highly concentrated in 4 co-operatives, Grupo
Eroski, Consum, Abacus and SCIAS, which together account for 87% of total turnover and 95% of all employees in this co-operative sector.
Table 8 shows the relevant data of the sector, drawn up from the data provided by the representative associations of consumers’ co-operatives, which essentially coincide with the data obtained in the CIRIEC-2008 survey. As previously mentioned, there could be small-scale co-operatives, with no paid employees, which have not fallen within the scope of the CIRIEC-2008 survey, therefore, it is logical that in Table 8 some co-operatives appear that were not included in the survey.

THE SATELLITE ACCOUNTS OF THE CO-OPERATIVES AND MUTUAL SOCIETIES AND
MUTUAL PROVIDENT SOCIETIES IN SPAIN. 2008
63
Table 6. Agriculture co-operatives distribution by Autonomous Community
CCAA Num. Co-operatives Employees Members
Andalucía 813 27,708 375,318
Aragón 212 1,840 54,280
Asturias 27 408 5,157
Baleares 35 296 8,962
Canarias 86 2,680 22,018
Cantabria 14 193 2,671
Castilla-la Mancha 459 5,061 116,515
Castilla y León 414 4,018 105,089
Cataluña 346 4,857 81,932
Com. Valenciana 415 26,229 291,779
Extremadura 304 2,925 77,836
Galicia 227 2,457 43,356
Madrid 31 264 1,434
Murcia 150 8,740 34,002
Navarra 105 1,632 20,056
País Vasco 68 494 10,553
Rioja (La) 51 506 13,055 Total 3,757 90,308 1,264,013
Source: Survey CIRIEC-2008 and Directorate General of the Social Economy, Autonomous Work and Corporate Social Responsibility.
Table 7. Consumers’ and Users’ Co-operatives. Year 2008*
* Including the health co-operatives SCIAS.. Source: Survey CIRIEC-2008.
Numbers Employees Members Women Permanent Full-time
employment 333 34,521 3,038,925 16,534 31,725 27,358

THE SATELLITE ACCOUNTS OF THE CO-OPERATIVES AND MUTUAL SOCIETIES AND MUTUAL PROVIDENT SOCIETIES IN SPAIN. 2008
64
Table 8. Aggregates of consumer co-operatives in Spain grouped by representative
associations. Year 2008
Aggregates HISPACOOP UNCCUE Grupo UNIDE Total
Value % Value % Value %
Entities 128 33.60 245 64.30 8 2.10 381
Consumer members 2,541,929 93.31 181,051 6.64 1,311 0.05 2,724,291
Worker members 23,403 100.0 - - - - 23,403
Employees 64,509 97.97 685 1.04 652 0.99 65,846
Point of sale 3,137 45.26 1,925 27.77 1,869 26.97 6,931
Turnover (million euros) 10,857 87.01 1,126 9.02 495 3.97 12,478
Source: Elaborated with the data provided by the associations.
7.6. Educational co-operatives
There has been a significant increase in the number of educational co-operatives in the period 2000-2008, with the number for the latter year estimated as 1,415 educational co-operatives, with nearly 35,000 workers. Table 9 shows the previously mentioned figures and the main employment data, in which stands out the high percentage (more than 60%) of women employees. Nearly 80% of educational co-operatives are of associated labour and the rest are of users-families- or mixed.
Table 9. Educational co-operatives (associated labour, users-families and mixed) entities,
employment and turnover in euros. Year 2008
Aggregates Associated labour co-
operatives User and mix co-
operatives Total
Co-operatives number 1,112 303 1,415
Employees 19,966 14,828 34,794
Women 11,215* 9,804 21,019
Permanent 15,231 11,794 27,025
Full-time employment 14,394 12,313 26,707
* Women working in the 314 associated labour co-operatives whose staff pays entirely to the Self-employed Social Security Schemes, are not included. Source: Survey CIRIEC-2008.

THE SATELLITE ACCOUNTS OF THE CO-OPERATIVES AND MUTUAL SOCIETIES AND
MUTUAL PROVIDENT SOCIETIES IN SPAIN. 2008
65
7.7. Credit co-operatives
These entities have remained outside the CIRIEC-2008 Survey with the corresponding data being obtained from the National Union of Credit Co-operatives (UNACC).
In 2008, 81 credit co-operatives were recorded, of which 77 were rural savings banks, 2 occupational credit unions and 2 credit unions. Their societal dimension reached 2 million members and nearly 10.5 million clients (Table 7.10)
Table 10. Main non-monetary aggregates credit co-operatives in Spain
Credit co-operatives Aggregates
Year 2000 Year 2005 Year 2008
1. Num. of entities 89 83 81 2. Total numbers of members 1,396,954 1,799,474 2,096,531 3. Total number of employees 14,466 18,335 20,940 4. Total number of men workers n,d n,d 11,123 5. Total number of women workers n,d n,d 9,817 6. Number of customers n,d 9,715,710 10,505,452 7. Number of offices 3,947 4,715 5,141
Source: UNACC.

THE SATELLITE ACCOUNTS OF THE CO-OPERATIVES AND MUTUAL SOCIETIES AND MUTUAL PROVIDENT SOCIETIES IN SPAIN. 2008
66
7.8. Non-monetary data of mutual companies and mutual provident societies in the year 2008*
Table 11. Non-monetary activity indicators of mutual insurance companies and mutual
provident societies* Year 2008
Entities number Employees Mutualist member Mutual insurance companies 35 6,091 5,000,000 Mutual provident societies 298 2,609 2,450,000
Total 333 8,700 7,450,000 *Unimportant regional mutual provident societies outside the Basque Country and Catalonia have not been counted. Source: Confederación Española de Mutualidades (CNEPS), Federación de Mutualidades de Cataluña, Federación de Entidades de Previsión Social Voluntaria de Euskadi, Dirección General de Seguros.


![[PPT]PowerPoint Presentation - World Banksiteresources.worldbank.org/.../Address_SabbirPatel.ppt · Web viewDynamics of the Cooperatives, Mutual Insurance & Takaful Mutual Insurance](https://img.pdfslide.us/doc/110x75/5ac929307f8b9aa1298cdc50/pptpowerpoint-presentation-world-viewdynamics-of-the-cooperatives-mutual-insurance.jpg)