Embed Size (px)
Citation preview
www.elsevier.com/locate/jss
The Journal of Systems and Software 80 (2007) 328–355
Requirements change: Fears dictate the must haves;desires the won’t haves
Johan F. Hoorn *, Elly A. Konijn, Hans van Vliet, Gerrit van der Veer
Vrije Universiteit, De Boelelaan 1081a, 1081 HV Amsterdam, The Netherlands
Received 14 December 2005; received in revised form 18 February 2006; accepted 20 February 2006Available online 19 June 2006
Abstract
We attempt to contribute to a general theory of requirements change from a goal-oriented and viewpoints-driven angle. To practi-tioners, this knowledge is relevant to anticipate changes in certain types of requirements, which may shorten the project’s timeline, reducecosts, and increase product quality. Initially, we followed the common assumptions that what should be on a system is demanded bygoals to achieve and what should not be on a system is demanded by goal states to avoid. However, requirements engineering of a diver-sity of systems (capacity and warehouse management, COTS PCs, and a Braille mouse) revealed that must requirements are predicted bygoals to avoid (!) and won’t requirements by goals to approach (!). Expectations about the positive or negative impact (valence) ofrequirements on goals played a moderating role. We unfold the gradual discovery of this ‘‘goals-to-requirements chiasm’’ (CHI-effector v-effect), claiming that variability in agreement to positive or negative requirements is predicted by goals of opposite polarity. Wefound that whether the v-effect occurred or not, depended on the alignment of stakeholder viewpoints on goals and requirements. Com-ments from practitioners are included.
Categories & Subject Descriptors: H.1.2 [Models and Principles]: User/Machine Systems–Human information processing; K.6.3 [Man-agement of Computing and Information Systems]: Software Management–Software development.
General Terms: Requirements Engineering, Human Factors, Theory.� 2006 Elsevier Inc. All rights reserved.
Keywords: Requirements validation; Goal-driven RE; Viewpoints; Requirements change; Empirical software engineering; Structured questionnaires
1. Introduction
While a number of new printers were put into service ata New York business company, the management insistedon installing anti virus software although those printersnever would communicate with the outside world. Jo Ger-aedts, head of the Industrial Design Department at Oce-Technologies, told us this story after being confronted withthe results of our studies (personal communication,November 11, 2004). This story exemplifies how a mustrequirement (i.e. protection) was predicated by a situation
0164-1212/$ - see front matter � 2006 Elsevier Inc. All rights reserved.
doi:10.1016/j.jss.2006.02.064
* Corresponding author. Tel.: +31 20 598 7614; fax: +31 20 598 7728.E-mail addresses: [email protected] (J.F. Hoorn), [email protected]
(E.A. Konijn), [email protected] (H. van Vliet), [email protected] (G. van derVeer).
that stakeholders feared most (here, virus infection). It isprecisely this relationship – goals to avoid direct thechanges in what must be on a system – which underliesone of the hypotheses that we defend in the present paper.
A statement of Arco van Nieuwland illustrates anotherhypothesis that we maintain. At that time chief executiveat Exact Software, Van Nieuwland said (personal commu-nication, November 17, 2004): ‘‘In Europe, we won’tmigrate e-Synergy [the software platform of Exact] toLinux because we want to keep that market, which is ded-icated to Microsoft.’’ The desired goal was to preserve theEuropean market for e-Synergy, which designated Linux asa won’t requirement – in spite of its technical advantages.
Yet, we started our investigations from the commonassumption that agreement to requirements that are a mustcan be predicted from goals to achieve with the system. In
J.F. Hoorn et al. / The Journal of Systems and Software 80 (2007) 328–355 329
this line, we also expected that agreement to won’t require-ments could be predicted by goal states that stakeholderswanted to avoid. We examined these relations because wewanted to get a grip on change requirements that pop upduring a software-development track. The idea was toknow the goals and concerns of the system’s stakeholdersin advance. When those goals were affected by, for exam-ple, a market event, we wanted to know how far agreementto the related requirements would change. Our researchquestion 1, therefore, was whether we could predict agree-ment to must requirements from goals stakeholders wantedto approach while controlling for the effects of won’trequirements and goals to avoid. Research question 2was whether goals stakeholders wanted to avoid predictedagreement to won’t requirements, while controlling for theinfluence of must requirements and goals to approach.
However, things turned out another way. We tested fourcases that rendered five data sets and only in one out of fivecould we establish the relationship of goals to achieve withmust requirements in coalition with goals to avoid withwon’t requirements. In the four other data sets, we foundthe reverse relationship, which led us to articulate thegoals-to-requirements chiasm (CHI-effect) or v-effect forshort. In brief, the v-effect predicts that requirements mostsusceptible to change during a software-development trackare governed by stakeholders’ goals that are inverselyrelated. That is, goals to avoid with a system regulatechanges in agreement to must requirements, whereas goalsto achieve regulate changes in agreement to won’trequirements.
This finding is important to practitioners because it mayprovide a different focus to the requirements analysis. First,the ‘negative side of things’ seems to count as well. Tounderstand a change request, won’t haves and goals toavoid are as important as must haves and goals to achieve.Second, when changes in the must requirements occur, onecould look at the goals to avoid for the reasons why. Viceversa, when a won’t requirement changes, the reasonsshould probably be sought in goals to achieve with a sys-tem. Third, due to the systematic and statistical approachin this paper, results have a certain degree of reliability(they could be repeated, even in small groups) and add toa general theory of requirements change. In practice, statis-tically less intensive approaches could be applied to explorethe proposed relationships in specific software-develop-ment cases.
2. Theory
2.1. The type of goals
In the area of goal-oriented requirements engineering(RE) (e.g., Van Lamsweerde, 2004), the cause of require-ments change, requirements evolution (Alves and Finkel-stein, 2002), or requirements development (Robinson andPawlowski, 1999) is sought in the goals that stakeholderswant to achieve with the system or the concerns they
may have with it. ‘‘Goals are . . . essential elements formanaging requirements evolution’’ (Letier and Lamswe-erde, 2001). Goals can range from high-level strategic mis-sion statements to low-level operational targets that shouldbe achieved with the system (Letier and Lamsweerde,2001). Goals are supposed to be more stable than therequirements that help reaching them (Van Lamsweerdeand Letier, 2000). Moreover, the higher-level a goal is(e.g., a strategic business goal), the more stable the respec-tive requirements will be (Anton et al., 1994; Alves andFinkelstein, 2002). Thus, the reasons for requirementschange should be sought in a change of lower level goals,such as improving a work process (e.g., higher efficiency,less costs), or advancing system performance, security,and reliability.
2.2. Valence
When stakeholders are involved in developing a system,they are – whether intentionally or not – also busy design-ing the future situation of their business or work environ-ment. Therefore, they make evaluations of how much arequirement, once implemented as a feature of the system,will impact their goals (cf. Lehman, 1996).
In goal-driven RE, system development is centered onthe stakeholders’ concerns (Anton et al., 2001; Alves andFinkelstein, 2003). Concerns are basic to emotions, whichin turn motivate people to undertake action (Frijda,1986). In this line, we assume that the requirements onthe new system are judged for their usefulness or relevanceto potentially satisfy or harm the stakeholder’s concerns,goals, or motives. Positive expectations about the futuresituation result from requirements that promise a match,the actual or expected satisfaction of concerns. Negativeexpectations result from requirements that promise a mis-match, the actual or expected obstruction of realizationof goals and concerns (Frijda, 1986, p. 277). Frijda (1986,p. 207) points out that valence refers to the implied out-come of the event: The intrinsic attractiveness or repulsive-ness. In other words, valence (also Sutcliffe, 2002) refers tothe expected match or mismatch between the potentialgratification for or obstruction of stakeholder concernsand the possibilities or impossibilities offered by the newsituation.
Stakeholders expect positive or negative consequencesof the system for achieving their goals (cf. TechnologyAcceptance Model Davis, 1989). Whether stakeholdersexpect that a proposed feature will support or obstructtheir goals may have an impact on the level of agreementor disagreement to a requirement. When the business envi-ronment changes, the direction of valence towards thefuture system may change accordingly, thus triggering achange of requirements.
We expected that valence could interfere with the agree-ment to requirements. A requirement may technically sat-isfy a goal. However, if people nevertheless expectnegative effects on their work situation, the agreement to
330 J.F. Hoorn et al. / The Journal of Systems and Software 80 (2007) 328–355
that requirement may be low. We assumed that the assess-ment of valence would be a necessary step to make a judg-ment about a requirement. In other words, we believed thatvalence would be a mediator of agreement in between goalson the one hand and requirements on the other.
2.3. Not only must haves
Although practitioners often work from a MuSCoWlist,1 the won’t requirements are often put aside as irrele-vant for further analysis. The focus is on the must haves,understandably, to help achieve the stakeholders’ goals.However, whereas goals specify desired situations, so-called ‘‘obstacles’’ designate goal states that are undesirablebut yet possible (Potts, 1995; Van Lamsweerde and Letier,2000). Apart from achieving goals, there is also an ‘‘avoid-mode’’ (Robinson and Pawlowski, 1999). Thus, must havesmay be important to achieve goals stakeholders want toapproach, yet, won’t haves are important to construe whatstakeholders want to avoid with the system (e.g., instabil-ity, complexity, or a Linux shell for the e-Synergy plat-form). When a business model changes, the won’trequirements may change just as well as the mustrequirements.
2.4. Variability in agreement
When business goals change and the requirementschange accordingly, the once agreed-upon requirementsare often disagreed-upon in the new situation. If we knowwhich goals have changed it should be possible to predictthe level of agreement to the related requirements fromthe level of agreement to the (changed) goals. We suspectedthat requirements that raise the most conflicts amongstakeholders are also most vulnerable to change. Suchrequirements should show more variability in the level ofagreement (from agree to disagree) than requirements thatraise no conflicts (a ceiling effect of either agree or dis-agree). Thus, we wished to investigate which type of goals(those to approach or those to avoid) best predicted thevariability in the level of agreement to must or won’trequirements. Our best guess was that
• (H1) goals to approach predict agreement to the mustrequirements through the mediation of positive outcomeexpectancies (valence support).In opposition, we assumed that
• (H2) goals to avoid predict (dis)agreement to won’trequirements, mediated through negative valence(valence obstruct).
We tested these hypotheses in four different businesscases that rendered five sets of data (one split file).
1 Requirements that Must be, Should be, Could be, or Won’t be on thesystem (eRA, 2002).
The remainder of this paper is organized as follows.Study 1 in Section 3 evaluates H1 and H2 from two differ-ent viewpoints. In the personal view, the straightforwardapproach-to-must and avoid-to-won’t relationships wereestablished. However, from a business viewpoint a differentconstellation occurred that countered H1 and H2. Thestudies in Sections 4–6 attempted to repeat the results ofthe personal view in Study 1 but we systematically encoun-tered another constellation (the v-effect), in line with thebusiness view. Therefore, we redefined our hypotheses intoa set of precise test predictions (Section 5) that should beconfirmed to speak of the v-effect. The Discussion in Sec-tion 7 offers post hoc explanations of why initially wefound the straight relationships and how those findingscan be brought in line with the results of the subsequentstudies. Section 7 closes with comments from and recom-mendations to practitioners in RE.
3. Study 1: Viewpoints on requirements and goals unaligned
We investigated the design of a Capacity ManagementSystem (CMS) at the Dutch police force. The corps man-agement set up the requirements on this system, meantfor scheduling police tasks and allocating personnel. Wehad 33 novice users, young officers, judge these manage-ment-viewpoint requirements (Sommerville and Sawyer,1997) from two perspectives: A personal and a businesspoint of view.
Our first research aim at that time was to test in how farthe future end-users agreed to the management-viewpointrequirements from a personal point of view. The secondresearch aim was to investigate the agreement to the man-agement-viewpoint requirements while the end-usersadopted a business point of view. The results forced us tosplit the data file into a set for the personal and a set forthe business view to test H1 and H2.
3.1. Method
3.1.1. Participants and experimental design
Dutch Police Academy students (N = 33; 22 males, 11females; age 19–45, M = 26.5, SD = 5.96; years in serviceM = 2, SD = 1)2 participated in a questionnaire study thatconcerned the redesign of the CMS. This system was meantto allocate workforce to a task, to plan actions, and toschedule holidays and shifts. These participants rangedfrom the same district and functions within the organiza-tion (officer or chief officer). They were already at workand studied at the academy for one day a week. Becausethese officers were novice users of the CMS, we wantedto know their wishes and demands to inform possible rede-sign of the system so to accommodate the future users.
2 Naming conventions followed: N = total sample size, n = sub samplesize, M = mean, SD = standard deviation.
J.F. Hoorn et al. / The Journal of Systems and Software 80 (2007) 328–355 331
The sample was split into two groups. One group of offi-cers worked from the perspective that the management-viewpoint requirements should satisfy Personal Goals(n = 16). The other group worked on the same list of man-agement-viewpoint requirements from the perspective thatBusiness Goals should be satisfied (n = 17). This was thebetween-subjects factor of Stakeholders’ View.
We also devised a within-subjects factor of Stakehold-ers’ Needs. This was a nested factor of Requirements (Mustvs. Won’t) vs. Valence (Support vs. Obstruct) vs. Goals(Approach vs. Avoid). Goals to Approach or Avoid variedwithin Stakeholders’ View and thus could be Personal orBusiness.
3.1.2. System
As is, the employees of the Dutch police force have to jus-tify the hours they work during their shifts. In each organi-zational police unit, there are planners who makeschedules for the personnel. This is a rather complex taskas there are a number of different shifts, for instance, themorning shift, the evening shift, and the nightshift. In addi-tion, there are weekend shifts and stand-by shifts. It is deter-mined by law how many hours and how many nightshiftsofficers are allowed to work within a certain timeframe.Police officers often work extra hours, for example, whenincidents and accidents happen or when colleagues areabsent. This results in an even more complex planning task.
There are several systems in the police organization thatsupport the process of planning and hour registration. Inthe early 1990s, a tool called Registration Planning andControl (RPC) was implemented in the majority of thepolice districts to support planning and registration. Todate, the schedules are registered with this tool by the plan-ner, updated/confirmed by the officers, and authorized bytheir chief. The system is linked to the salary system, sothat the registered working hours are directly related tothe salary. In other precincts, however, there is no centralsystem for planning and control.
In the district we investigated, the planner made theschedules on a stand-alone system and the officers regis-tered their hours in a spreadsheet. The follow-up of theRPC is the CMS basic tool. It has recently been imple-mented and is now used by a part of the officers. The offi-cers considered the hour registration as a necessary evil.Because the system related directly to the salary, the offi-cers were motivated to use it.
The old RPC system was character based and user-unfriendly. The stand-alone systems were not efficientand error prone. If a single mistake was made, it could hap-pen that salaries were not paid or that the wrong amountwas transferred. The CMS wanted to improve on thesematters and the current research was intended as a valida-tion of some of its claims.
3.1.3. Procedure
Working together with the functional analyst of theConcern Information Management Police (CIP), in-depth
ethnography established a list of requirements on theCMS as desired by the corps management. Moreover, a listof business goals of these managers was accumulated aswell as a list of personal goals of the officers on the beat(not the same people who participated in the questionnairestudy). Examples of personal goals were freedom to showinitiative, to serve society, or to help colleagues. Examplesof business goals were continuity, cost-effectiveness, and toserve and protect (see bulleted list). These goals were drawnfrom participatory observations, personal interviews, andpractical experience of the CIP analyst. With this informa-tion, a structured Requirements Engineering questionnairewas assembled, the CMS REquest. In all, it had 79 itemsand two open-ended questions (in Dutch) but we will focuson the Stakeholders’ Needs scale (24 items). Stakeholders’Needs systematically connected a goal to a requirementwhile attaching positive or negative valence to them. A sub-sequent block consisted of 7 socio-demographic items, suchage and function, followed by the two open-ended ques-tions on what they liked about their work or not. Itemswere pseudo-randomly distributed within blocks. For addi-tional information, please consult the technical report(Hoorn and Kok, 2005).
The police officers were randomly allocated to either thePersonal or Business version of the CMS REquest. In aclassroom setting, the officers received an introductionand completed the paper-and-pencil questionnaire. Officerswere in their second, third, or fourth (=final) year of study.Completing the questionnaire took between 15 and 20 minafter which the officers were debriefed.
Sample requirements in the CMS case
• Must (Business)– Registering work activities in advance– Digital registration of results of activities– Detailed work plans– Planning one year ahead– Planning based on skills of the personnel– Spending least possible amount of time on inputting
data– Fixed holidays, fixed schedules– Personal portfolio of courses and training taken
• Won’t (Business)– Work activities reported through face-to-face briefing– Results in written day reports– Global work plans– Planning one month ahead– Planning based on available personnel– Wasting time on data input– Schedules can be continuously changed– Flexible holiday planning– Courses and training remain unregistered
Sample goals in the CMS case
• Approach (Personal)– Intensive working relationship with my chief
332 J.F. Hoorn et al. / The Journal of Systems and Software 80 (2007) 328–355
– Being my chief of service– Being involved with colleagues– Have freedom to show initiative– Insight in what colleagues do– Spend most of my time on the streets (help civilians)– Time to help my colleagues– Maintain my scheduling privileges
• Avoid (Personal)– Less contact with the chief– Frustrate the chief– Being indifferent about the colleagues– Only do what was planned– What colleagues do goes unnoticed– Spend most time behind the desk (form filling)– Everybody solves their own problems– All scheduling privileges are dropped
• Approach (Business)– Minimize absences– Make professional impression– Keeping the performance contract with the
government– Save money on allocating personnel– Peace on the work floor– Keeping Internal Affairs out– Planning schedules on time– Cooperation between precincts
• Avoid (Business)– Stabilize absences– Make amateurish impression– Breaking the performance contract– Spend more money on personnel– Irritation on the work floor– Interference by Internal Affairs– Planning schedules late– Each precinct works on its own
3.1.4. Measurements3.1.4.1. Scale construction. For the uninformed reader, wewant to introduce the notions of structured questionnairedesign (Dillman, 1999), scales, indicative and contra-indic-ative items, and faceted scales (Guttman, 1954, 1965). InSection 3.1.4.2 we explain how our measurements weredone in practice.
Scales measure a concept or construct that is not imme-diately visible in the concrete world (e.g., stakeholdergoals). Scales consist of multiple items that more-or-lesscover a variety of aspects of ‘stakeholder goals’ (e.g., effi-ciency, cost-effectiveness, or fun). Together, the items coverthe abstract concept of stakeholder goals not only from thepositive side (‘‘E-mail is fast’’) but also from the negativeside (‘‘E-mail is slow’’). Such statements form the indicativeand contra-indicative items on the scale, respectively. Eachitem is scored for agreement on rating scales. Takentogether, the various items on a scale control differentinterpretations of what ‘stakeholder goals’ might mean.Faceted scales (Guttman, 1954, 1965) systematically com-
bine more single (sub) scales (e.g., requirements plusvalence plus goals). Thus, a statement from a faceted scalecan be formulated as a requirements statement (e.g.,‘‘Automated input helps me to do my work properly’’).‘‘Automatic input’’ is the must requirement, ‘‘helps me’’induces positive valence, and ‘‘work properly’’ is a goalto approach. Each item is part of a larger set of statementsthat systematically combine, for example, the positive andnegative aspects of the respective sub scales to see their dif-ferent impact on agreement.
Together, items on the faceted scale Stakeholders’ Needscombined a requirement with a certain valence to a goal.Items on the scale Stakeholders’ Needs followed thestructure:hRequirement(must or won’t have)i has hValence (sup-
ports or obstructs)i towards a hGoal (that you want toapproach or want to avoid)i
By systematically combining the three sub scales, weproduced eight categories of items. For each category,three variants were prepared, resulting in 24 items on thescale Stakeholders’ Needs.
1. Must requirement – supports – goal to approach (·3)2. Must requirement – supports – goal to avoid (·3)3. Must requirement – obstructs – goal to approach (·3)4. Must requirement – obstructs – goal to avoid (·3)5. Won’t requirement – supports – goal to approach (·3)6. Won’t requirement – supports – goal to avoid (·3)7. Won’t requirement – obstructs – goal to approach (·3)8. Won’t requirement – obstructs – goal to avoid (·3)
Each sub scale, then, (Requirements Must, Require-ments Won’t, Valence Support, Valence Obstruct, GoalsApproach, Goals Avoid) had 12 items (that is, 3 items com-ing from 4 item categories). Scale analysis (e.g., Section3.2.1) was performed on the 12 items per sub scale.
Take notice that all items were presented to the stake-holders in the various studies as affirmative statements toavoid answering biases and response confusion from usinglinguistic negations (Dillman, 1999). That is, the won’trequirements as well as the goals to avoid were put as desir-able things and the stakeholders were expected to disagreeto these won’t (put as must) requirements and the avoid(put as approach) goals.
For all the studies reported in this paper, the abovestructure and rationale was followed to create question-naire items on the various Stakeholders’ Needs scales.For different purposes, each Requirements Engineeringquestionnaire (REquest) featured more and other scalesthan the Stakeholders’ Needs scale alone. However, theseextra scales have less relevance to the hypotheses testedhere and will only be mentioned if necessary.
3.1.4.2. Scale construction in the CMS case. Stakeholders’Needs consisted of requirements statements that systemat-ically connected goals with the management-viewpointrequirements, while putting positive or negative valence
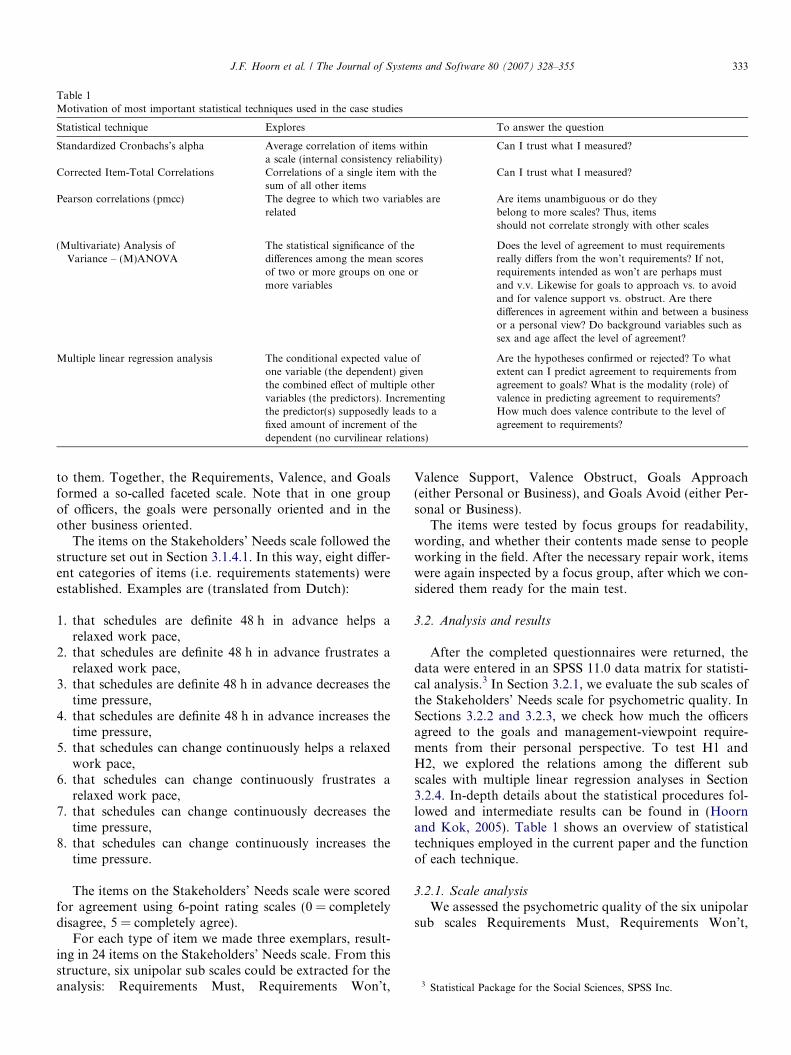
Table 1Motivation of most important statistical techniques used in the case studies
Statistical technique Explores To answer the question
Standardized Cronbachs’s alpha Average correlation of items withina scale (internal consistency reliability)
Can I trust what I measured?
Corrected Item-Total Correlations Correlations of a single item with thesum of all other items
Can I trust what I measured?
Pearson correlations (pmcc) The degree to which two variables arerelated
Are items unambiguous or do theybelong to more scales? Thus, itemsshould not correlate strongly with other scales
(Multivariate) Analysis ofVariance – (M)ANOVA
The statistical significance of thedifferences among the mean scoresof two or more groups on one ormore variables
Does the level of agreement to must requirementsreally differs from the won’t requirements? If not,requirements intended as won’t are perhaps mustand v.v. Likewise for goals to approach vs. to avoidand for valence support vs. obstruct. Are theredifferences in agreement within and between a businessor a personal view? Do background variables such assex and age affect the level of agreement?
Multiple linear regression analysis The conditional expected value ofone variable (the dependent) giventhe combined effect of multiple othervariables (the predictors). Incrementingthe predictor(s) supposedly leads to afixed amount of increment of thedependent (no curvilinear relations)
Are the hypotheses confirmed or rejected? To whatextent can I predict agreement to requirements fromagreement to goals? What is the modality (role) ofvalence in predicting agreement to requirements?How much does valence contribute to the level ofagreement to requirements?
3 Statistical Package for the Social Sciences, SPSS Inc.
J.F. Hoorn et al. / The Journal of Systems and Software 80 (2007) 328–355 333
to them. Together, the Requirements, Valence, and Goalsformed a so-called faceted scale. Note that in one groupof officers, the goals were personally oriented and in theother business oriented.
The items on the Stakeholders’ Needs scale followed thestructure set out in Section 3.1.4.1. In this way, eight differ-ent categories of items (i.e. requirements statements) wereestablished. Examples are (translated from Dutch):
1. that schedules are definite 48 h in advance helps arelaxed work pace,
2. that schedules are definite 48 h in advance frustrates arelaxed work pace,
3. that schedules are definite 48 h in advance decreases thetime pressure,
4. that schedules are definite 48 h in advance increases thetime pressure,
5. that schedules can change continuously helps a relaxedwork pace,
6. that schedules can change continuously frustrates arelaxed work pace,
7. that schedules can change continuously decreases thetime pressure,
8. that schedules can change continuously increases thetime pressure.
The items on the Stakeholders’ Needs scale were scoredfor agreement using 6-point rating scales (0 = completelydisagree, 5 = completely agree).
For each type of item we made three exemplars, result-ing in 24 items on the Stakeholders’ Needs scale. From thisstructure, six unipolar sub scales could be extracted for theanalysis: Requirements Must, Requirements Won’t,
Valence Support, Valence Obstruct, Goals Approach(either Personal or Business), and Goals Avoid (either Per-sonal or Business).
The items were tested by focus groups for readability,wording, and whether their contents made sense to peopleworking in the field. After the necessary repair work, itemswere again inspected by a focus group, after which we con-sidered them ready for the main test.
3.2. Analysis and results
After the completed questionnaires were returned, thedata were entered in an SPSS 11.0 data matrix for statisti-cal analysis.3 In Section 3.2.1, we evaluate the sub scales ofthe Stakeholders’ Needs scale for psychometric quality. InSections 3.2.2 and 3.2.3, we check how much the officersagreed to the goals and management-viewpoint require-ments from their personal perspective. To test H1 andH2, we explored the relations among the different subscales with multiple linear regression analyses in Section3.2.4. In-depth details about the statistical procedures fol-lowed and intermediate results can be found in (Hoornand Kok, 2005). Table 1 shows an overview of statisticaltechniques employed in the current paper and the functionof each technique.
3.2.1. Scale analysis
We assessed the psychometric quality of the six unipolarsub scales Requirements Must, Requirements Won’t,
Grand mean agreement
RequirementsMust
Business View (n = 17)
Personal View (n = 16)
2.53 (1.26)
|
5 -↑
4 -
3 -
2 -
1 -
0 -Requirements
Won’tValenceSupport
ValenceObstruct
GoalsApproach
GoalsAvoid
| || | |
2.06 (1.11)
2.47 (1.26)
2.32 (1.00)
3.12 (.91)
1.66 (1.08)
2.03 (1.19)
1.79 (1.04)
2.09 (1.05)
1.81 (1.05)
2.16 (1.04)
1.67 (.92)
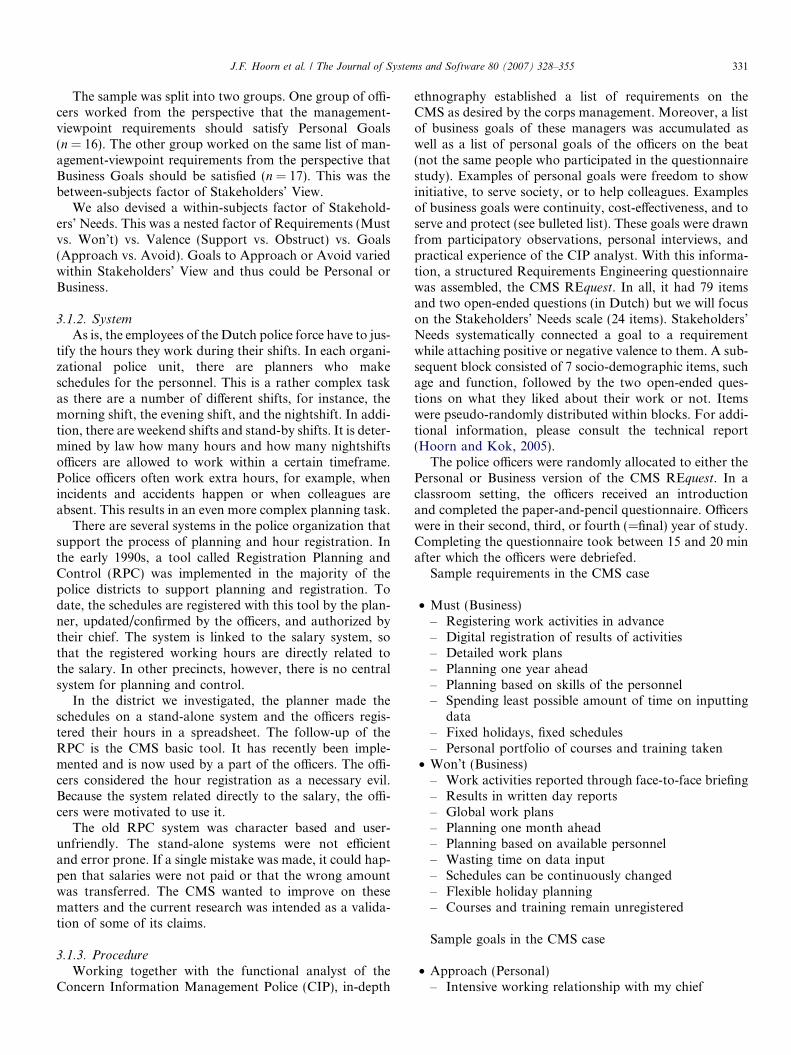
Fig. 1. Grand mean averages of agreement to Stakeholders’ Needs (Must,Won’t, Support, Obstruct, Approach, Avoid) from a Business and aPersonal View. Standard deviations are in parentheses (N = 33).
Agree a little
Business View|
3 -
2.5 -
2 -
1.5 -
1 -
Personal View|
Disagree
“I comply withthe business” “I oppose
the business”
MSAp2.58 (1.07)
MSAp1.84 (1.08)
WOAv1.92 (.98)
WOAv2.22 (1.24)
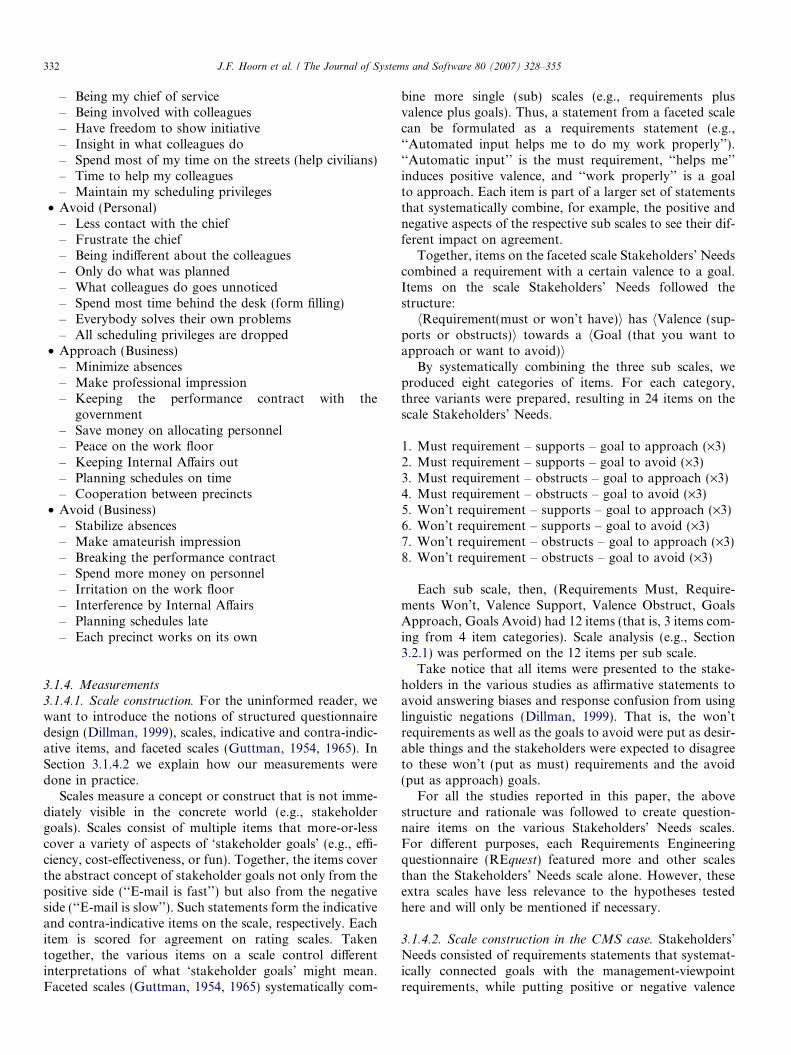
Fig. 2. Grand mean level of agreement to Must, Should, and Approach(MSAp) items vs. Won’t, Obstruct, and Avoid (WOAv) items for twodifferent views: Business and Personal. Standard deviations are inparentheses (N = 33).
6
334 J.F. Hoorn et al. / The Journal of Systems and Software 80 (2007) 328–355
Valence Support, Valence Obstruct, Goals Approach, andGoals Avoid (cf. Table 1, first row). Each sub scale had 12items each (see Section 3.1.4.1). We tested whether itemscorrelated sufficiently with their own scale by means ofCorrected Item-Total Correlations and StandardizedCronbach’s alpha (indicating reliability). The degree towhich items did not correlate with other scales was testedwith Pearson correlations.
Item selection was a trade-off among several criteria. Wewanted to establish as many items on a sub scale as possi-ble with a minimum of 2, provided that StandardizedCronbach’s alpha for a scale was at least >.60, preferably>.70, and that items showed the lowest correlations possi-ble with other scales. SD of items should be around 1. Wealso wanted the skewness of the scale <.70 and if present,we removed so-called leverage points.4
We correlated each item with its own sub scale (with theitem removed) and with the other sub scales. In manycases, items were more highly correlated with another subscale than with their own sub scale. Probably, this isbecause the items on the Stakeholders’ Needs scale explic-itly related requirements, valencies, and goals, which mayexplain the relatively strong interdependency of sub scales.Based on these results and additional item analyses, thepsychometrically weak items were eliminated from theirsub scales. Each item on the shortened scales was againcorrelated with its own sub scale (with the item removed)and with the other sub scales.
The thus revised sub scales in the Personal View had alength of 2–4 items and showed a Standardized Cronbach’salpha between .77 and .90, which is fine. The revised subscales in the Business View had a length of 2–4 items. Stan-dardized Cronbach’s alpha’s were between .62 and .91,which is acceptable to good.
3.2.2. Agreement to CMS requirements and goals
Before exploring the relations among requirements,valence, and goals, we checked to what degree the officersactually agreed to the management-viewpoint requirementsand to the personal and business goals we gathered (cf.Table 1, second row). Moreover, we wanted to see whethersocio-demographic variables such as age, sex, and functioninfluenced the results.
To do so, we treated the Stakeholders’ Needs scale as anested factorial design (within-subjects) of the 3-leveledfactor Scales (Requirements vs. Valence vs. Goals) andthe 2-leveled factor Item Type (Indicative vs. Contra-indic-ative). In view of this setting, 6 within-subjects (dependent)variables were calculated from the 2 or 3 items per subscale: The grand mean level of agreement to Requirements(Must vs. Won’t) vs. Valence (Support vs. Obstruct) vs.Goals (Approach vs. Avoid).5 This was done for the Per-sonal as well as the Business View. The results are in Fig. 1.
4 Leverage points are values extremely distant from the center of thesampled predictor values.
5 Grand means are averages across the individual means.
We then ran a 2 * 2 * 3 MANOVA of Stakeholders’View (Personal vs. Business) (between-subjects) by ItemType (Indicative vs. Contra-indicative) (within-subjects)and Scales (Requirements vs. Valence vs. Goals) (within-subjects) on the grand mean average level of agreement.6
Two significant interactions were established. Theinteraction depicted in Fig. 2 between Stakeholders’ View(Business vs. Personal) and Item Type (Indicative vs.Contra-indicative) (F(1,30) = 13.76, p = .001, g2
p ¼ :31,7
parameter coefficient = 1.58, t = 3.71, p < .001) showedthat in the case of the Business View, the level of agreement
Note that the GLM > Repeated measures option in the new releases ofSPSS is more-or-less similar to the MANOVA procedures availablethrough the syntax editor. The latter option was used in all our studies.
7 Partial eta squared ðg2pÞ indicates the effect size or the proportion of
variance explained by a (combination of) variable(s).
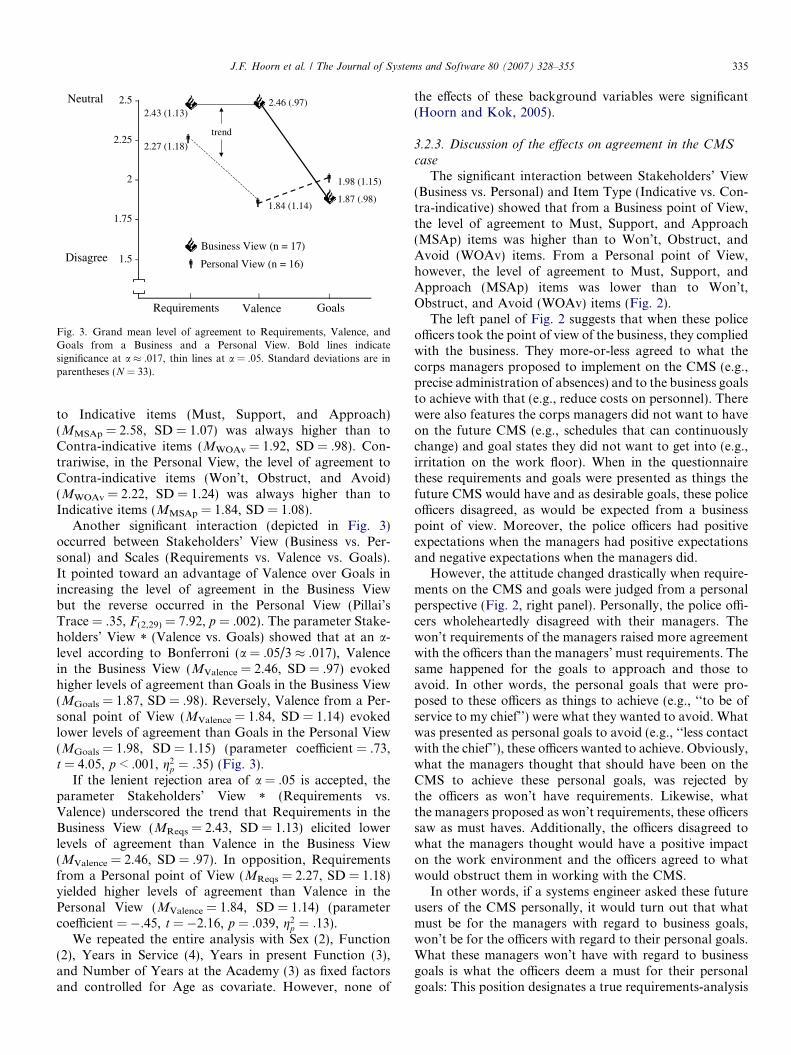
Neutral
Requirements|
2.5 -
2.25 -
2 -
1.75 -
1.5 -
Goals|
Disagree
2.46 (.97)
Valence|
1.84 (1.14)1.87 (.98)
1.98 (1.15)
2.43 (1.13)
2.27 (1.18)
trend
Business View (n = 17)
Personal View (n = 16)
Fig. 3. Grand mean level of agreement to Requirements, Valence, andGoals from a Business and a Personal View. Bold lines indicatesignificance at a � .017, thin lines at a = .05. Standard deviations are inparentheses (N = 33).
J.F. Hoorn et al. / The Journal of Systems and Software 80 (2007) 328–355 335
to Indicative items (Must, Support, and Approach)(MMSAp = 2.58, SD = 1.07) was always higher than toContra-indicative items (MWOAv = 1.92, SD = .98). Con-trariwise, in the Personal View, the level of agreement toContra-indicative items (Won’t, Obstruct, and Avoid)(MWOAv = 2.22, SD = 1.24) was always higher than toIndicative items (MMSAp = 1.84, SD = 1.08).
Another significant interaction (depicted in Fig. 3)occurred between Stakeholders’ View (Business vs. Per-sonal) and Scales (Requirements vs. Valence vs. Goals).It pointed toward an advantage of Valence over Goals inincreasing the level of agreement in the Business Viewbut the reverse occurred in the Personal View (Pillai’sTrace = .35, F(2,29) = 7.92, p = .002). The parameter Stake-holders’ View * (Valence vs. Goals) showed that at an a-level according to Bonferroni (a = .05/3 � .017), Valencein the Business View (MValence = 2.46, SD = .97) evokedhigher levels of agreement than Goals in the Business View(MGoals = 1.87, SD = .98). Reversely, Valence from a Per-sonal point of View (MValence = 1.84, SD = 1.14) evokedlower levels of agreement than Goals in the Personal View(MGoals = 1.98, SD = 1.15) (parameter coefficient = .73,t = 4.05, p < .001, g2
p ¼ :35) (Fig. 3).If the lenient rejection area of a = .05 is accepted, the
parameter Stakeholders’ View * (Requirements vs.Valence) underscored the trend that Requirements in theBusiness View (MReqs = 2.43, SD = 1.13) elicited lowerlevels of agreement than Valence in the Business View(MValence = 2.46, SD = .97). In opposition, Requirementsfrom a Personal point of View (MReqs = 2.27, SD = 1.18)yielded higher levels of agreement than Valence in thePersonal View (MValence = 1.84, SD = 1.14) (parametercoefficient = �.45, t = �2.16, p = .039, g2
p ¼ :13).We repeated the entire analysis with Sex (2), Function
(2), Years in Service (4), Years in present Function (3),and Number of Years at the Academy (3) as fixed factorsand controlled for Age as covariate. However, none of
the effects of these background variables were significant(Hoorn and Kok, 2005).
3.2.3. Discussion of the effects on agreement in the CMS
case
The significant interaction between Stakeholders’ View(Business vs. Personal) and Item Type (Indicative vs. Con-tra-indicative) showed that from a Business point of View,the level of agreement to Must, Support, and Approach(MSAp) items was higher than to Won’t, Obstruct, andAvoid (WOAv) items. From a Personal point of View,however, the level of agreement to Must, Support, andApproach (MSAp) items was lower than to Won’t,Obstruct, and Avoid (WOAv) items (Fig. 2).
The left panel of Fig. 2 suggests that when these policeofficers took the point of view of the business, they compliedwith the business. They more-or-less agreed to what thecorps managers proposed to implement on the CMS (e.g.,precise administration of absences) and to the business goalsto achieve with that (e.g., reduce costs on personnel). Therewere also features the corps managers did not want to haveon the future CMS (e.g., schedules that can continuouslychange) and goal states they did not want to get into (e.g.,irritation on the work floor). When in the questionnairethese requirements and goals were presented as things thefuture CMS would have and as desirable goals, these policeofficers disagreed, as would be expected from a businesspoint of view. Moreover, the police officers had positiveexpectations when the managers had positive expectationsand negative expectations when the managers did.
However, the attitude changed drastically when require-ments on the CMS and goals were judged from a personalperspective (Fig. 2, right panel). Personally, the police offi-cers wholeheartedly disagreed with their managers. Thewon’t requirements of the managers raised more agreementwith the officers than the managers’ must requirements. Thesame happened for the goals to approach and those toavoid. In other words, the personal goals that were pro-posed to these officers as things to achieve (e.g., ‘‘to be ofservice to my chief’’) were what they wanted to avoid. Whatwas presented as personal goals to avoid (e.g., ‘‘less contactwith the chief’’), these officers wanted to achieve. Obviously,what the managers thought that should have been on theCMS to achieve these personal goals, was rejected bythe officers as won’t have requirements. Likewise, whatthe managers proposed as won’t requirements, these officerssaw as must haves. Additionally, the officers disagreed towhat the managers thought would have a positive impacton the work environment and the officers agreed to whatwould obstruct them in working with the CMS.
In other words, if a systems engineer asked these futureusers of the CMS personally, it would turn out that whatmust be for the managers with regard to business goals,won’t be for the officers with regard to their personal goals.What these managers won’t have with regard to businessgoals is what the officers deem a must for their personalgoals: This position designates a true requirements-analysis
336 J.F. Hoorn et al. / The Journal of Systems and Software 80 (2007) 328–355
rift (Hoorn et al., in press). However, this rift would notcome to the fore if the engineer did not ask these officerspersonally, because then the officers would lawfully jointhe position of their corps.
The significant interaction between Stakeholders’ View(Business vs. Personal) and Scales (Requirements vs.Valence vs. Goals) showed that Valence (whether positiveor negative) in the Business View provoked more agree-ment than Valence from a Personal View (Fig. 3). Forgoals, it was the other way round. Personal Goals (whetherto Approach or Avoid) raised more agreement than Busi-ness Goals. As a trend, the Requirements (whether Mustor Won’t) proposed by the corps management evokedmore agreement from a Business (‘‘It’s their system’’) thanfrom a Personal View (‘‘What should I say about it?’’).
The significant interaction between Stakeholders’ View(Business vs. Personal) and Scales (Requirements vs.Valence vs. Goals) displayed in Fig. 3 illustrates that thesepolice officers disagreed more to the Business Goals of theirmanagers (MGoals = 1.87) than to the Personal Goals weobtained from our ethnography (MGoals = 1.98). This wasirrespective of whether these Business and Personal Goalswere desirable or not. However, from what these officersexpected of the CMS for their future work situation(Valence), they foresaw little impact on their Personal situ-ation (MValence = 1.84), for better or for worse. Yet, thefuture CMS was expected to impact strongly the futureBusiness situation with regard to planning and control(MValence = 2.46), whether this impact was positive or neg-ative. Finally, in agreeing to the requirements (whethermust or won’t), these officers followed the propositions ofthe corps (Business View: MReqs = 2.43), which was valuedhigher than their Personal View on the requirements(MReqs = 2.27).
These results seem like a clear-cut victory for the corpsmanagement. The future users of the CMS foresaw littlechange in their personal work situation (personal valencelow), the business was expected to undergo the necessarychange (business valence high), and the users were more-or-less neutral to what should be on or off the futureCMS (requirements neutral). However, the future usersdid not subscribe to the business goals that should beachieved or avoided with the future CMS and they valuedtheir personal goals higher (Price and Cybulski, 2004).Taking this result together with the results exhibited inFig. 2, it seems that these officers did not see the connectionbetween what they wanted and what the CMS was going tooffer. They did not see much impact on their own work, butdid agree that the business could benefit from the futureCMS. Again, the requirements-analysis rift (Hoorn et al.,in press) became visible: The requirements were consideredsomething of the business whereas goals were something ofthe person but the persons did not realize that their futureuse of the system would probably facilitate the business butfrustrate their personal goals at work.
We saw almost diametrically opposed levels of agree-ment between the Business and Personal View on the same
list of management-viewpoint requirements and the relatedgoals. We therefore decided to split up the data set to verifyour hypotheses H1 and H2 separately for the Personal andthe Business View. Section 3.2.4 scrutinizes the relationsbetween goals and requirements for the Personal View.Section 3.2.6 does the same for the Business View.
3.2.4. CMS: Management-viewpoint Requirements in
relation to Personal Goals
Originally, we advocated the common view that (H1)Goals Approach predicts agreement to RequirementsMust. We added the idea that Valence Support would serveas a mediator. In addition, we assumed (H2) that GoalsAvoid predicts agreement to Requirements Won’t and thatValence Obstruct would serve as the mediator. To testthese hypotheses, we performed several multiple linearregression analyses (method Enter) on the grand meanaverage agreement to the sub scales of Stakeholders’ Needs(cf. Table 1, third row).
3.2.4.1. Explaining Requirements Must. To verify H1, amultiple linear regression analysis (method Enter) was per-formed on the Personal View data set. Requirements Mustserved as the dependent variable with three ordered sets ofpredictors. Requirements Won’t was entered in the firststep, Valence Support and Valence Obstruct in the secondstep, and Personal Goals Approach and Personal GoalsAvoid in the third (Hoorn and Kok, 2005).
The third set of predictors, Personal Goals Approachand Personal Goals Avoid, accounted for a significantamount of the Requirements Must variability, R2 = .75,R2
adj ¼ :63, F(5,10) = 6.03, p = .008. On the basis of correla-tion–regression analyses, the relative importance of Per-sonal Goals Approach and Personal Goals Avoid inpredicting Requirements Must was assessed. It seemed thatPersonal Goals Approach was most strongly related toRequirements Must, standardized b = .86, t = 3.49,p = .006. Supporting this conclusion is the height of thestandardized Beta coefficient and the strength of the corre-lation between Personal Goals Approach and Require-ments Must partialling out the effects of all otherpredictors (rpartial = .74, rpart = .55). Personal Goals Avoidoffered little or no additional predictive power beyond thatcontributed by the Personal Goals Approach measure.
3.2.4.2. Explaining Requirements Won’t. With regard toH2, Requirements Won’t served as the dependent variablewith three ordered sets of predictors. Requirements Mustwas entered in the first step, Valence Support and ValenceObstruct in the second step, and Personal Goals Approachand Personal Goals Avoid in the third (Hoorn and Kok,2005).
The second set of predictors, Valence Support andValence Obstruct, accounted for a significant amount ofthe Requirements Won’t variability, R2 = .49, R2
adj ¼ :36,F(3,12) = 3.85, p = .038. The third set, Personal GoalsApproach and Personal Goals Avoid, however, predicted
J.F. Hoorn et al. / The Journal of Systems and Software 80 (2007) 328–355 337
significantly the percent of explained variance of Require-ments Won’t over and above the Valence measures,R2
adj ¼ :77, R2change ¼ :36, F(2,10) = 11.45, p = .003. On the
basis of correlation–regression analyses, the relative impor-tance of Personal Goals Approach and Personal GoalsAvoid in predicting Requirements Won’t was assessed. Itseemed that Personal Goals Avoid was most stronglyrelated to Requirements Won’t, standardized b = 1.07,t = 4.14, p = .002. Supporting this conclusion is the heightof the standardized Beta coefficient and the strength of thecorrelation between Personal Goals Avoid and Require-ments Won’t partialling out the effects of all other predic-tors (rpartial = .80, rpart = .52). Personal Goals Approachoffered little or no additional predictive power beyond thatcontributed by the Personal Goals Avoid measure.
In other words, Valence did contribute to the Require-ments Won’t variability but Personal Goals Avoid over-ruled Valence Support and Valence Obstruct in predictivepower.
3.2.5. Discussion of the relation between Management-
viewpoint Requirements and Personal GoalsThe results of the multiple regression analyses in the Per-
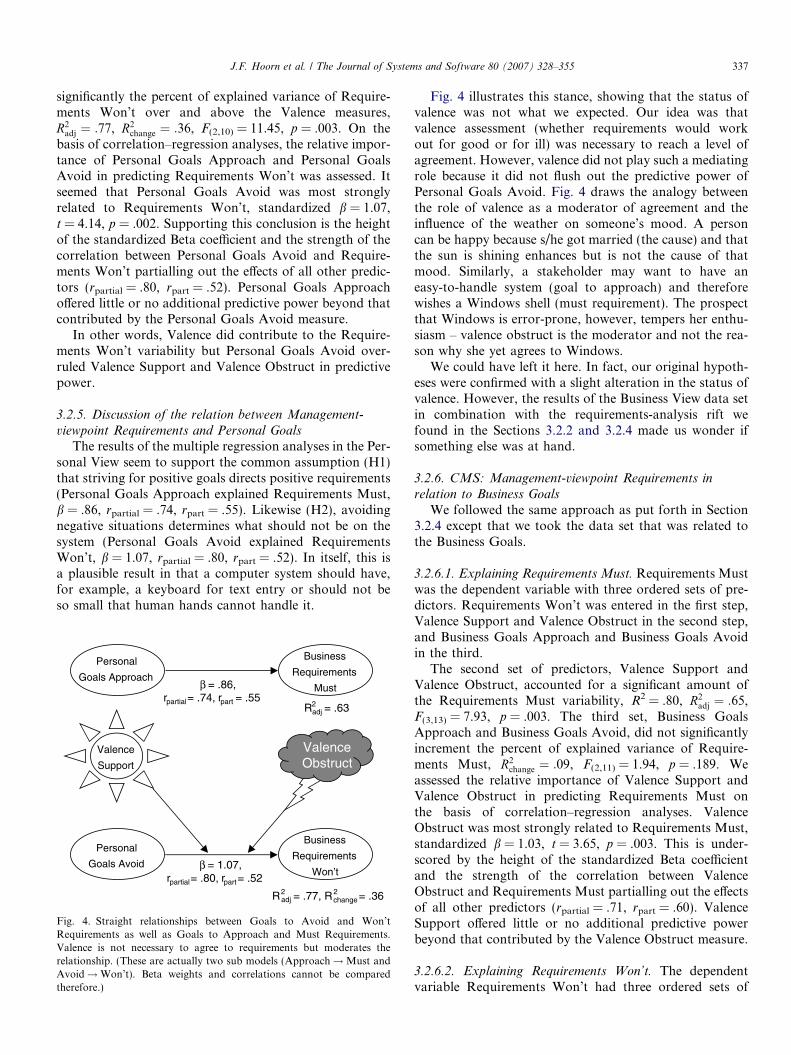
sonal View seem to support the common assumption (H1)that striving for positive goals directs positive requirements(Personal Goals Approach explained Requirements Must,b = .86, rpartial = .74, rpart = .55). Likewise (H2), avoidingnegative situations determines what should not be on thesystem (Personal Goals Avoid explained RequirementsWon’t, b = 1.07, rpartial = .80, rpart = .52). In itself, this isa plausible result in that a computer system should have,for example, a keyboard for text entry or should not beso small that human hands cannot handle it.
Personal
Goals Approach
Personal
Goals Avoid
Business
Requirements
Must
Business
Requirements
Won’t
ValenceObstruct
Valence
Support
R2adj = .63
β = .86,rpartial= .74, rpart = .55
R2adj = .77, R2
change = .36
β = 1.07,rpartial= .80, rpart= .52
Fig. 4. Straight relationships between Goals to Avoid and Won’tRequirements as well as Goals to Approach and Must Requirements.Valence is not necessary to agree to requirements but moderates therelationship. (These are actually two sub models (Approach!Must andAvoid!Won’t). Beta weights and correlations cannot be comparedtherefore.)
Fig. 4 illustrates this stance, showing that the status ofvalence was not what we expected. Our idea was thatvalence assessment (whether requirements would workout for good or for ill) was necessary to reach a level ofagreement. However, valence did not play such a mediatingrole because it did not flush out the predictive power ofPersonal Goals Avoid. Fig. 4 draws the analogy betweenthe role of valence as a moderator of agreement and theinfluence of the weather on someone’s mood. A personcan be happy because s/he got married (the cause) and thatthe sun is shining enhances but is not the cause of thatmood. Similarly, a stakeholder may want to have aneasy-to-handle system (goal to approach) and thereforewishes a Windows shell (must requirement). The prospectthat Windows is error-prone, however, tempers her enthu-siasm – valence obstruct is the moderator and not the rea-son why she yet agrees to Windows.
We could have left it here. In fact, our original hypoth-eses were confirmed with a slight alteration in the status ofvalence. However, the results of the Business View data setin combination with the requirements-analysis rift wefound in the Sections 3.2.2 and 3.2.4 made us wonder ifsomething else was at hand.
3.2.6. CMS: Management-viewpoint Requirements in
relation to Business Goals
We followed the same approach as put forth in Section3.2.4 except that we took the data set that was related tothe Business Goals.
3.2.6.1. Explaining Requirements Must. Requirements Mustwas the dependent variable with three ordered sets of pre-dictors. Requirements Won’t was entered in the first step,Valence Support and Valence Obstruct in the second step,and Business Goals Approach and Business Goals Avoidin the third.
The second set of predictors, Valence Support andValence Obstruct, accounted for a significant amount ofthe Requirements Must variability, R2 = .80, R2
adj ¼ :65,F(3,13) = 7.93, p = .003. The third set, Business GoalsApproach and Business Goals Avoid, did not significantlyincrement the percent of explained variance of Require-ments Must, R2
change ¼ :09, F(2,11) = 1.94, p = .189. Weassessed the relative importance of Valence Support andValence Obstruct in predicting Requirements Must onthe basis of correlation–regression analyses. ValenceObstruct was most strongly related to Requirements Must,standardized b = 1.03, t = 3.65, p = .003. This is under-scored by the height of the standardized Beta coefficientand the strength of the correlation between ValenceObstruct and Requirements Must partialling out the effectsof all other predictors (rpartial = .71, rpart = .60). ValenceSupport offered little or no additional predictive powerbeyond that contributed by the Valence Obstruct measure.
3.2.6.2. Explaining Requirements Won’t. The dependentvariable Requirements Won’t had three ordered sets of
338 J.F. Hoorn et al. / The Journal of Systems and Software 80 (2007) 328–355
predictors. Requirements Must was entered in the first step,Valence Support and Valence Obstruct in the second step,and Business Goals Approach and Business Goals Avoidin the third.
The second set of predictors, Valence Support andValence Obstruct, accounted for a significant amount ofthe Requirements Won’t variability, R2 = .77, R2
adj ¼ :71,F(3,13) = 14.22, p = .000. The third set, Business GoalsApproach and Business Goals Avoid, however, signifi-cantly incremented the percent of explained variance ofRequirements Won’t, R2
adj ¼ :89, R2change ¼ :16, F(2,11) =
11.88, p = .002. On the basis of correlation–regressionanalyses, the relative importance of Valence Support andBusiness Goals Approach in predicting RequirementsWon’t was assessed. It seemed that Business GoalsApproach was most strongly related to the RequirementsWon’t, standardized b = .69, t = 4.59, p = .001. Support-ing this conclusion is the height of the standardized Betacoefficient and the strength of the correlation between Busi-ness Goals Approach and Requirements Won’t partiallingout the effects of all other predictors (rpartial = .81,rpart = .38). Valence Support offered some additional pre-dictive power (standardized b = .28, t = 2.60, p = .025,rpartial = .62, rpart = .21) but not beyond that contributedby the Business Goals Approach measure.
3.2.6.3. The role of Valence. Requirements Must wasexplained by Valence Obstruct and Requirements Won’twas marginally explained by Valence Support. Thus, itmight be that in the Business View, valence was not a mod-erator but a mediator, in between goals on the one handand requirements on the other. To test whether valenceshould be conceived of as a mediator in the Business View,we followed the procedure suggested by Baron and Kenny(1986) for identifying mediating variables.
We ran a multiple linear regression analysis of BusinessGoals Approach and Valence Support on ValenceObstruct. Significant results were obtained, R2 = .57,R2
adj ¼ :51, F(2,14) = 9.15, p = .003, indicating that mainlythe correlated Business Goals Approach contributed toValence Obstruct, standardized b = 79, t = 4.23, p = .001,rpartial = .75, rpart = .74.
Yet, if Valence Obstruct indeed was a mediator, thenomitting it from the analysis should increase the predictivepower of Business Goals Approach and Business GoalsAvoid (Baron and Kenny, 1986). Therefore, we performedanother regression analysis on Requirements Must withBusiness Goals Approach and Business Goals Avoid asthe predictors. However, this analysis yielded insignificantresults, R2 = .18, R2
adj ¼ :06, F(2,14) = 1.53, p = .250.We also tested whether the Valence Support variability
could be explained by Business Goals Avoid and ValenceObstruct entered in the first step and Business GoalsApproach in the second step. However, no significanteffects were established (Hoorn and Kok, 2005). In all,valence cannot be regarded as a mediator between require-ments and goals in the Business View.
3.2.7. Discussion of the relation between Management-
viewpoint Requirements and Business Goals
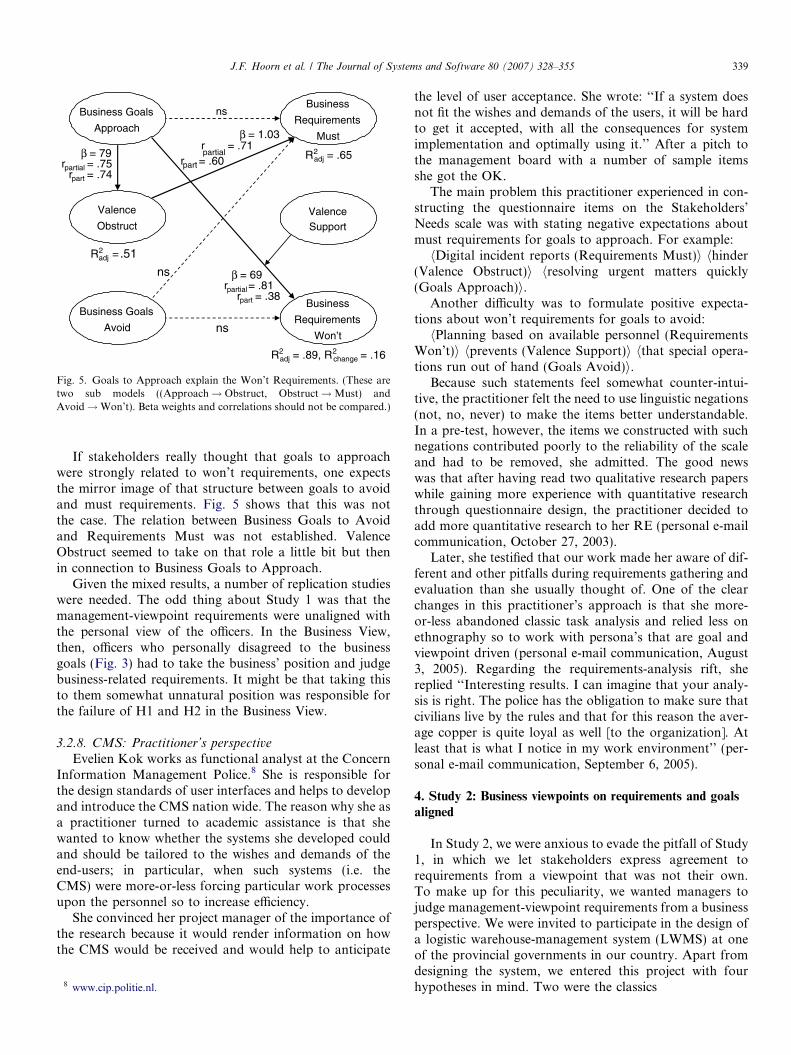
H1 stated that goals to approach explain must require-ments through the mediation of valence. Yet, the resultsof the regression of Valence Obstruct on RequirementsMust in the Business View caused the first crack in our con-viction. First, this analysis pointed out that Business GoalsApproach had no significant explanatory power for theMust variability and that Valence Obstruct seemed anindependent predictor instead of a mediator, explaining alarge portion of the variance in the agreement to Require-ments Must single-handedly (standardized b = 1.03, rpar-
tial = .71, rpart = .60).Valence Obstruct was not a mediator between Approach
and Must because Business Goals (either Avoid orApproach) could not explain the Requirements Must vari-ability if Valence Obstruct was removed from the analysis.On the other hand, Business Goals Approach did make asignificant contribution (standardized b = 79, rpartial = .75,rpart = .74) to Valence Obstruct.
So much for H1.H2 stated that goals to avoid predict won’t requirements
through the mediation of valence. However, we found thatthe opposite was the case. The multiple linear regression onRequirements Won’t showed that Business GoalsApproach (not Avoid) was the best predictor, explainingthe variability in the level of agreement to RequirementsWon’t above and beyond the Valence Support measure(b = .69, rpartial = .81, rpart = .38). Moreover, Valence Sup-port was not explained by Business Goals Approach (norAvoid), which canceled out the possibility that ValenceSupport was a mediator. Valence Support probably servedas a moderator.
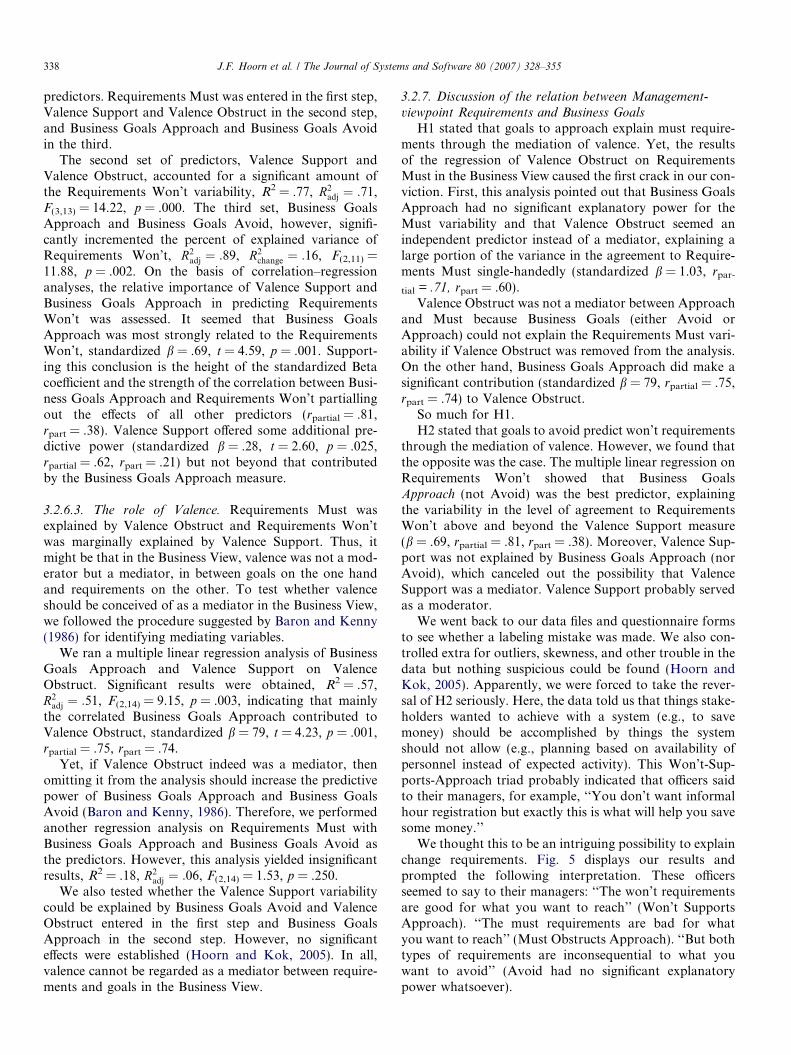
We went back to our data files and questionnaire formsto see whether a labeling mistake was made. We also con-trolled extra for outliers, skewness, and other trouble in thedata but nothing suspicious could be found (Hoorn andKok, 2005). Apparently, we were forced to take the rever-sal of H2 seriously. Here, the data told us that things stake-holders wanted to achieve with a system (e.g., to savemoney) should be accomplished by things the systemshould not allow (e.g., planning based on availability ofpersonnel instead of expected activity). This Won’t-Sup-ports-Approach triad probably indicated that officers saidto their managers, for example, ‘‘You don’t want informalhour registration but exactly this is what will help you savesome money.’’
We thought this to be an intriguing possibility to explainchange requirements. Fig. 5 displays our results andprompted the following interpretation. These officersseemed to say to their managers: ‘‘The won’t requirementsare good for what you want to reach’’ (Won’t SupportsApproach). ‘‘The must requirements are bad for whatyou want to reach’’ (Must Obstructs Approach). ‘‘But bothtypes of requirements are inconsequential to what youwant to avoid’’ (Avoid had no significant explanatorypower whatsoever).
Business Goals
Approach
Business Goals
Avoid
Business
Requirements
Must
Business
Requirements
Won’t
ValenceSupport
Valence
Obstruct
ns
ns
R2adj = .51
R2adj = .65
R2adj = .89, R2
change = .16
ns
β = 79rpartial = .75
rpart = .74
β = 1.03rpartial
= .71rpart = .60
β = 69rpartial= .81
rpart = .38
Fig. 5. Goals to Approach explain the Won’t Requirements. (These aretwo sub models ((Approach! Obstruct, Obstruct!Must) andAvoid!Won’t). Beta weights and correlations should not be compared.)
J.F. Hoorn et al. / The Journal of Systems and Software 80 (2007) 328–355 339
If stakeholders really thought that goals to approachwere strongly related to won’t requirements, one expectsthe mirror image of that structure between goals to avoidand must requirements. Fig. 5 shows that this was notthe case. The relation between Business Goals to Avoidand Requirements Must was not established. ValenceObstruct seemed to take on that role a little bit but thenin connection to Business Goals to Approach.
Given the mixed results, a number of replication studieswere needed. The odd thing about Study 1 was that themanagement-viewpoint requirements were unaligned withthe personal view of the officers. In the Business View,then, officers who personally disagreed to the businessgoals (Fig. 3) had to take the business’ position and judgebusiness-related requirements. It might be that taking thisto them somewhat unnatural position was responsible forthe failure of H1 and H2 in the Business View.
3.2.8. CMS: Practitioner’s perspective
Evelien Kok works as functional analyst at the ConcernInformation Management Police.8 She is responsible forthe design standards of user interfaces and helps to developand introduce the CMS nation wide. The reason why she asa practitioner turned to academic assistance is that shewanted to know whether the systems she developed couldand should be tailored to the wishes and demands of theend-users; in particular, when such systems (i.e. theCMS) were more-or-less forcing particular work processesupon the personnel so to increase efficiency.
She convinced her project manager of the importance ofthe research because it would render information on howthe CMS would be received and would help to anticipate
8 www.cip.politie.nl.
the level of user acceptance. She wrote: ‘‘If a system doesnot fit the wishes and demands of the users, it will be hardto get it accepted, with all the consequences for systemimplementation and optimally using it.’’ After a pitch tothe management board with a number of sample itemsshe got the OK.
The main problem this practitioner experienced in con-structing the questionnaire items on the Stakeholders’Needs scale was with stating negative expectations aboutmust requirements for goals to approach. For example:hDigital incident reports (Requirements Must)i hhinder
(Valence Obstruct)i hresolving urgent matters quickly(Goals Approach)i.
Another difficulty was to formulate positive expecta-tions about won’t requirements for goals to avoid:hPlanning based on available personnel (Requirements
Won’t)i hprevents (Valence Support)i hthat special opera-tions run out of hand (Goals Avoid)i.
Because such statements feel somewhat counter-intui-tive, the practitioner felt the need to use linguistic negations(not, no, never) to make the items better understandable.In a pre-test, however, the items we constructed with suchnegations contributed poorly to the reliability of the scaleand had to be removed, she admitted. The good newswas that after having read two qualitative research paperswhile gaining more experience with quantitative researchthrough questionnaire design, the practitioner decided toadd more quantitative research to her RE (personal e-mailcommunication, October 27, 2003).
Later, she testified that our work made her aware of dif-ferent and other pitfalls during requirements gathering andevaluation than she usually thought of. One of the clearchanges in this practitioner’s approach is that she more-or-less abandoned classic task analysis and relied less onethnography so to work with persona’s that are goal andviewpoint driven (personal e-mail communication, August3, 2005). Regarding the requirements-analysis rift, shereplied ‘‘Interesting results. I can imagine that your analy-sis is right. The police has the obligation to make sure thatcivilians live by the rules and that for this reason the aver-age copper is quite loyal as well [to the organization]. Atleast that is what I notice in my work environment’’ (per-sonal e-mail communication, September 6, 2005).
4. Study 2: Business viewpoints on requirements and goals
aligned
In Study 2, we were anxious to evade the pitfall of Study1, in which we let stakeholders express agreement torequirements from a viewpoint that was not their own.To make up for this peculiarity, we wanted managers tojudge management-viewpoint requirements from a businessperspective. We were invited to participate in the design ofa logistic warehouse-management system (LWMS) at oneof the provincial governments in our country. Apart fromdesigning the system, we entered this project with fourhypotheses in mind. Two were the classics
340 J.F. Hoorn et al. / The Journal of Systems and Software 80 (2007) 328–355
• (H1) Goals to approach predict agreement to the mustrequirements through the mediation of positive outcomeexpectancies (valence support).
• (H2) Goals to avoid predict (dis)agreement to won’trequirements, mediated through negative valence(valence obstruct).
whereas the other two hypotheses were their competitors
• (H3) Goals to approach predict agreement to the won’trequirements while being moderated by positive out-come expectancies (valence support).
• (H4) Goals to avoid predict agreement to must require-ments, moderated by negative expectations (valenceobstruct).
Although H4 was not derived from the empirical datadirectly, it was the logical counterpart of H3. The role ofvalence was also different from what we originally thought.In H1 and H2, we conceived of valence as a mediating var-iable necessary to predict the level of agreement to require-ments. In H3 and H4, we thought of valence in amoderating role, as a possible influence on agreement.
4.1. Method
4.1.1. Participants and experimental design
Managers (N = 18; 11 males, 7 females; age M = 46.4,SD = 10.9; years in service M = 14.4, SD = 11.7) from aprovincial governmental institution in The Netherlandsparticipated in a questionnaire study that concerned the(re)design of the LWMS. These participants ranged fromvarious services, sectors, and functions within theorganization.
The experimental design consisted of just one groupworking from one perspective, the Business View (within-subjects), while expressing their level of agreement to Mustand Won’t Requirements that could Support or ObstructGoals to Approach or to Avoid.
4.1.2. System
The state of the warehouse management system at thetime of measurement was a mainly manually and person-ally driven order and delivery system without intensiveautomation. Errors occurred regularly but were correctedeffectively although not fast. (Re)designing this systemwas directed at higher efficiency, cost-effectiveness, andfewer behavioral rules while maintaining the current flexi-bility. The future system aimed at introducing Intra-net and e-mail facilities to handle orders and deliverieswhile reducing the number of human transactions (Pronk,2004).
4.1.3. ProcedureAs part of an internship with the said provincial govern-
ment (Pronk, 2004), rapid ethnography (Jordan, 1996;Norman, 1998) in the early stages of design established a
list of features of the current system, a list of requirementson the future system as well as a list of goals of the man-agers of the organization (not necessarily the same peoplewho participated in the questionnaire study). Based uponthese observations, a structured questionnaire, the LWMSREquest (Hoorn, 2004), of 64 items was created (inDutch), divided into five blocks. Three blocks were cre-ated for the purposes of the IT practitioner who per-formed the internship, one block was created forhypothesis testing, and one block concerned socio-demo-graphic information of the managers. The block forhypothesis testing was put in between the practitioner’sblocks. The block of socio-demographic items was putin last. Items were pseudo-randomly distributed overblocks. Thirty-five participants were asked to print and fillout this paper-and-pencil questionnaire, which was sent tothem over the e-mail. After a few reminders, 18 question-naires were completed and returned, which took about afortnight.
Sample requirements in the LWMS case
• Must (Business)– Direct ordering at the warehouse– Direct access with personal computer– Inspecting status of order with personal computer– E-mail notification of order delivery– Reply e-mail for order acceptance/authorization– Warning e-mail that processing the order went wrong
• Won’t (Business)– Know exactly where to place an order (which organi-
zational unit handles what)– Follow the standard procedures (through several
units)– Asking different people what the order status is– Order delivery without notification– Written autograph on paper receipt– Find out yourself if something went wrong with the
order
Sample goals in the LWMS case
• Approach (Business)– Order-process control– Flexible procedures– Quick order handling– Accurate order handling– Proper planning– Work efficiently– Save money
• Avoid (Business)– Confused order process– Inflexible procedures– Slow order handling– Inaccurate order handling– Sloppy planning– Work inefficiently– Spend money
stems and Software 80 (2007) 328–355 341
4.1.4. Measurements
4
0
1
2
3
4
5↑
RequirementsMust
RequirementsWon't
ValenceSupport
ValenceObstruct
BusinessGoals
Approach
BusinessGoals Avoid
Grand mean agreement
2.41(.98) 1.8
(1.09)
2.19(1.44)
2.78(1.04)
2.5(.96)
3.67(1.14)
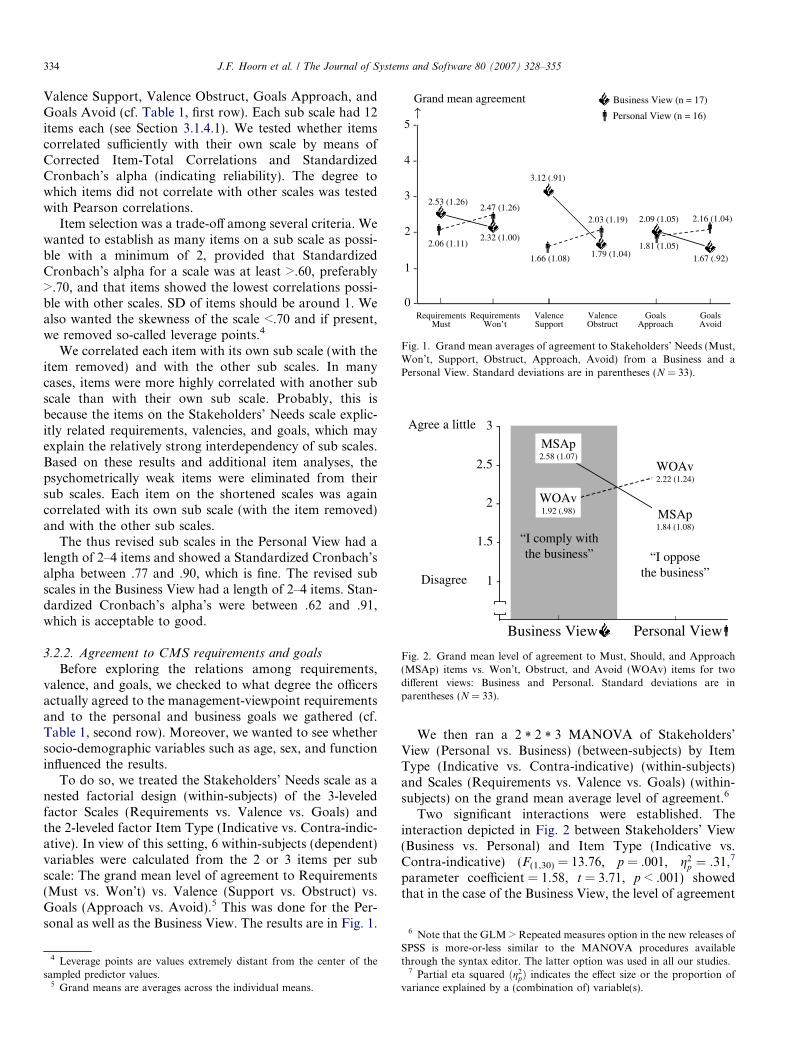
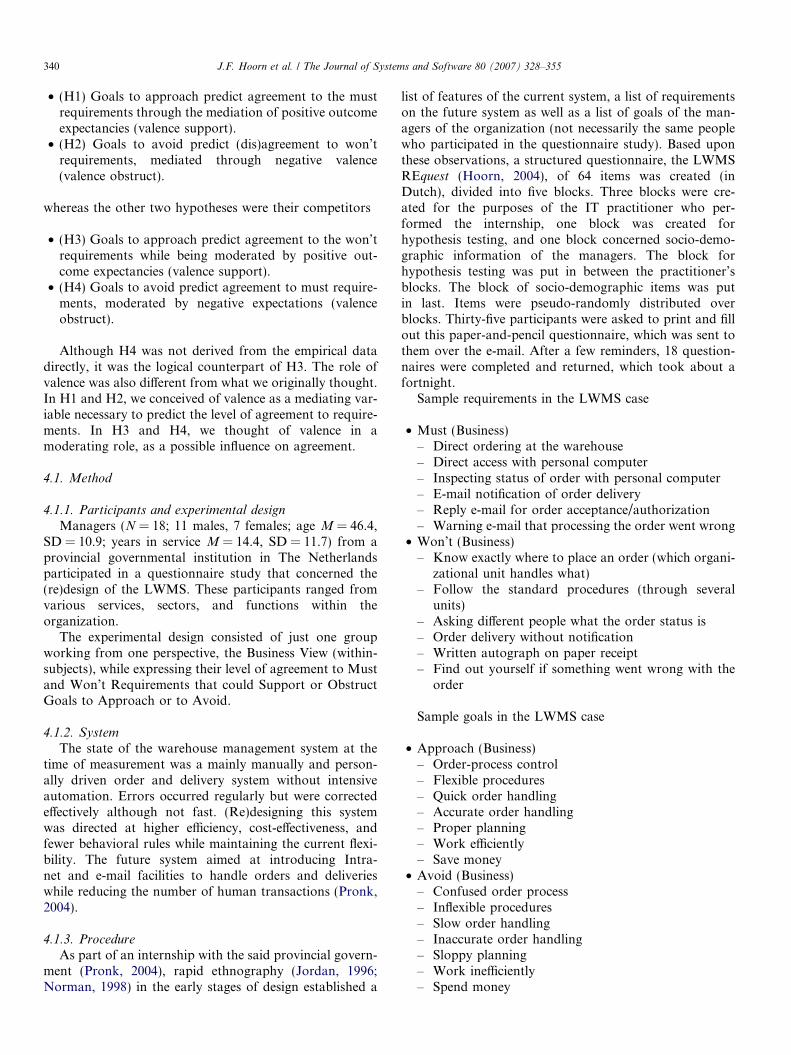
Fig. 6. Grand mean average agreement to the 6 sub scales of Stakehold-ers’ Needs (N = 18). Standard deviations are in parentheses.
4.1.4.1. Scale construction in the LWMS case. We created aStakeholders’ Needs scale (24 items plus 4 fillers) asexplained in Section 3.1.4.1. It consisted of three timestwo sub scales: Requirements (Must vs. Won’t), Valence(Support vs. Obstruct), and Business Goals (Approachvs. Avoid). Requirements were gathered during the intern-ship. Must requirements covered aspects of automationand digitalization of operations whereas Won’t require-ments keyed manual aspects and human interference thatwas typical for the old system. Business Goals were dividedinto goals to Approach or goals to Avoid. Goals related toaspects of time efficiency, error reduction, and cost-effec-tiveness. Valence was operationalized as keying Supportor Obstruction of goals by the specific requirement. Anexample of an item is ‘‘An e-mail warning that somethingis wrong with my order (a Must) enables (Support) work-ing efficiently (Approach).’’ For more example items, see(Hoorn et al., 2005). Items were followed by a 6-point rat-ing scale (0 = completely disagree, 5 = completely agree).Further, socio-demographic information was sampled,such as sex, age, service, sector, function, and number ofyears in function. Two staff members who were notinvolved in the actual test checked the items for readabilityand understandability.
4.2. Analysis and results
After the completed questionnaires were returned, thedata were entered in an SPSS 11.0 data matrix for statisti-cal analysis. Details about the statistical procedures andintermediate results can be found in Hoorn (2004).
4.2.1. Scale analysis
We checked the reliability of the 12 items on each subscale with Corrected Item-Total Correlations and Stan-dardized Cronbach’s alpha. The extent to which items wereindependent of other scales was verified with Pearson cor-relations. We followed the same procedures and criteria asdescribed in Section 3.2.1.
The thus revised sub scales had 3 items each. Standard-ized Cronbach’s alpha of four revised sub scales rangedfrom .61 to .78. However, Requirements Won’t (.48) andValence Obstruct (.50) were poor measurements and couldnot be improved. Results obtained with these sub scalesshould be taken with care and interpreted in the contextof subsequent replication studies. For more details, see(Hoorn et al., 2005).
4.2.2. Agreement to LWMS requirements and goals
We checked to what extent the managers of the provincialinstitution agreed with the management-viewpoint require-ments on the LWMS and whether they agreed with the busi-ness goals we obtained. We also inspected the effects ofsocio-demographic variables (e.g., age, sex, and function).
We treated the faceted scale of Stakeholders’ Needs as anested factorial design (within-subjects) of the 3-leveled
J.F. Hoorn et al. / The Journal of Sy
factor Scales (Requirements vs. Valence vs. BusinessGoals) and the 2-leveled factor Item Type (Indicative vs.Contra-indicative). Six within-subjects (dependent) vari-ables were calculated from the 3 items per sub scale: Thegrand mean average level of agreement to Requirements(Must vs. Won’t) vs. Valence (Support vs. Obstruct) vs.Business Goals (Approach vs. Avoid). As a preliminarytest, a One-Way MANOVA was run to check the potentialeffects of the fixed factors Service (4), Sector (7), and Sex(2) on the grand means of the 6 within-subjects (dependent)variables. The effects of Age (28–58) and Number of Yearsin Service (1–36) were controlled for by treating themas covariates. Function (14) was not analyzed becauseeach function had but one or two managers. Multivariatetests according to Pillai showed that none of the fixedor covariate factors were significant (.36 < F < 1.59;.479 6 p 6 .700) for either of the dependents.
In addition, the main test consisted of a 2 * 3 MAN-OVA of Item Type (Indicative vs. Contra-indicative)(within-subjects) and Scales (Requirements vs. Valencevs. Goals) (within-subjects) on the grand mean averageagreement to the six sub scales. Results can be found inFig. 6.
We found a significant interaction between Item Type(Indicative vs. Contra-indicative) and Scales (Require-ments vs. Valence vs. Business Goals) (Pillai’s Trace = .51,F(2,16) = 8.40, p = .003). To start with the strongest signifi-cant contrast, parameter estimates showed that Indicativeitems of Requirements (MMust = 2.41, SD = .98) evokedhigher levels of agreement than Contra-indicative items(MWon’t = 1.80, SD = 1.09), which may be expected. Thisdifference was larger, however, for Business Goals. Indica-tive items of Business Goals (MApproach = 3.67, SD = 1.14)evoked the highest level of agreement in this study, morethan contra-indicative items (MAvoid = 2.50, SD = .96)(parameter coefficient = �.56, t = �4.04, p = .001, g2
p ¼:49).
A less strong but also significant contrast was found forthe Indicative items of Valence (MSupport = 2.19), whichsurprisingly, elicited lower levels of agreement than theContra-indicative items (MObstruct = 2.78). As mentionedin the previous paragraph, the opposite happened for
342 J.F. Hoorn et al. / The Journal of Systems and Software 80 (2007) 328–355
Business Goals (parameter coefficient = �1.76, t = �3.25,p = .005, g2
p ¼ :38).The third contrast was only marginally significant
according to Bonferroni (a = .05/3 � .017) and should beconsidered merely a trend. Parameter estimates showedthat the level of agreement to Indicative and Contra-indic-ative items in Requirements had an inverse pattern as com-pared to Valence (parameter coefficient = 1.20, t = 2.51,p = .022, g2
p ¼ :27).These interactions were sustained by a significant main
effect of Scales (Pillai’s Trace = .44, F(2,16) = 6.40,p = .009), which was mainly based on the contrast betweenRequirements and Business Goals (parameter coeffi-cient = �1.96, t = �3.57, p = .002, g2
p ¼ :44). The differ-ence between Valence and Business Goals was muchsmaller and only marginally significant (parameter coeffi-cient = �1.20, t = �2.34, p = .032, g2
p ¼ :24) according toBonferroni (.05/3 � .017). In other words, the strongestinteractions and main effects were produced by BusinessGoals in combination with Requirements, whereas theweaker interactions and main effects were generated byValence in combination with Business Goals.
4.2.3. Discussion of the effects on agreement in the LWMS
case
We aligned the management-viewpoint requirementswith the goals in the Business View and found that themanagers agreed more to the Business Goals than to theRequirements. This may be expected because requirementsare but one instantiation of business goals. Other require-ments could do just as well or perhaps even better. Theratios went in the expected direction, though. Businessgoals to Approach raised more agreement than goals toAvoid and Must requirements more than Won’t require-ments. Although we gathered both requirements and goalsfrom colleague-managers, the managers in the test samplefelt that on the whole the requirements would frustratethe business goals (MObstruct = 2.78) rather than sustainthem (MSupport = 2.19). Whether this controversy amongthe managers affected the relations between requirementsand goals is inspected next.
4.2.4. LWMS: Management-viewpoint requirements in
relation to Business Goals
We formulated two competing sets of hypotheses. H1and H2 advocated the common sense approach to require-ments analysis. Must requirements are fed by goals toapproach and mediated by expectations of support (H1).Won’t requirements are fed by goals to avoid, mediatedby expectations of obstruction (H2).
H3 and H4 countered these assumptions, referring tothe Business View data of the CMS police case in Study1. H3 assumed that goals to approach directly explainwon’t requirements and is moderated by expectations ofsupport. H4 assumed that goals to avoid directly explainmust requirements, moderated by expectations ofobstruction.
4.2.4.1. Explaining Requirements Must. Requirements Mustserved as the dependent variable in a multiple regression(method Enter) with three ordered sets of predictors.Requirements Won’t was entered in the first step, ValenceObstruct and Business Goals Avoid in the second step, andValence Support and Business Goals Approach in the third(Hoorn, 2004).
Business Goals Avoid and Valence Obstruct togetheraccounted for a significant quantity of the RequirementsMust variability, R2 = .93, R2
adj ¼ :90, F(5,12) = 30.30, p =.000. Business Goals Approach and Valence Support didnot significantly increment the percent of explained vari-ance of Requirements Must, R2
change ¼ :01, F(2,10) = .33,p = .728. We also assessed the relative importance of Busi-ness Goals Avoid and Valence Obstruct in predictingRequirements Must. Business Goals Avoid was moststrongly related to Requirements Must (standardizedb = �.97, t = �9.48, p = .000). Supporting this conclusionis the height of the standardized Beta coefficient and thestrength of the correlation between Business Goals Avoidand Requirements Must, partialling out the effects of allother predictors (rpartial = �.94, rpart = �.74). ValenceObstruct offered little or no additional predictive powerbeyond that contributed by the Business Goals Avoidmeasure.
4.2.4.2. Explaining Requirements Won’t. Business GoalsApproach and Valence Support accounted for a significantamount of the Requirements Won’t variability, R2 = .79,R2
adj ¼ :70, F(5,12) = 9.01, p = .001. Business Goals Avoidand Valence Obstruct did not increase the percent ofexplained variance of Requirements Won’t, R2
change ¼ :07,F(2,10) = 2.28, p = .153. We also assessed the relativeimportance of Business Goals Approach and Valence Sup-port in predicting Requirements Won’t. It seemed thatBusiness Goals Approach was most strongly related toRequirements Won’t, standardized b = �.96, t = �5.31,p = .000. Supporting this conclusion is the height of thestandardized Beta coefficient and the strength of the corre-lation between Business Goals Approach and Require-ments Won’t, partialling out the effects of all otherpredictors (rpartial = �.84, rpart = �.70). Valence Supportoffered little or no additional predictive power beyond thatcontributed by the Business Goals Approach measure.
4.2.4.3. The role of Valence. H1 further predicted that Busi-ness Goals Approach measure explains Valence Support.H2 predicted that Business Goals Avoid measure explainsValence Obstruct. However, no significant results wereobtained in the respective regression analyses (Hoorn,2004).
4.2.5. Discussion of the relation between Management-
viewpoint Requirements and Business GoalsH1 expected that requirements the system must meet are
explained by a positive outcome valence of the proposedfeatures towards goals the stakeholder wants to achieve
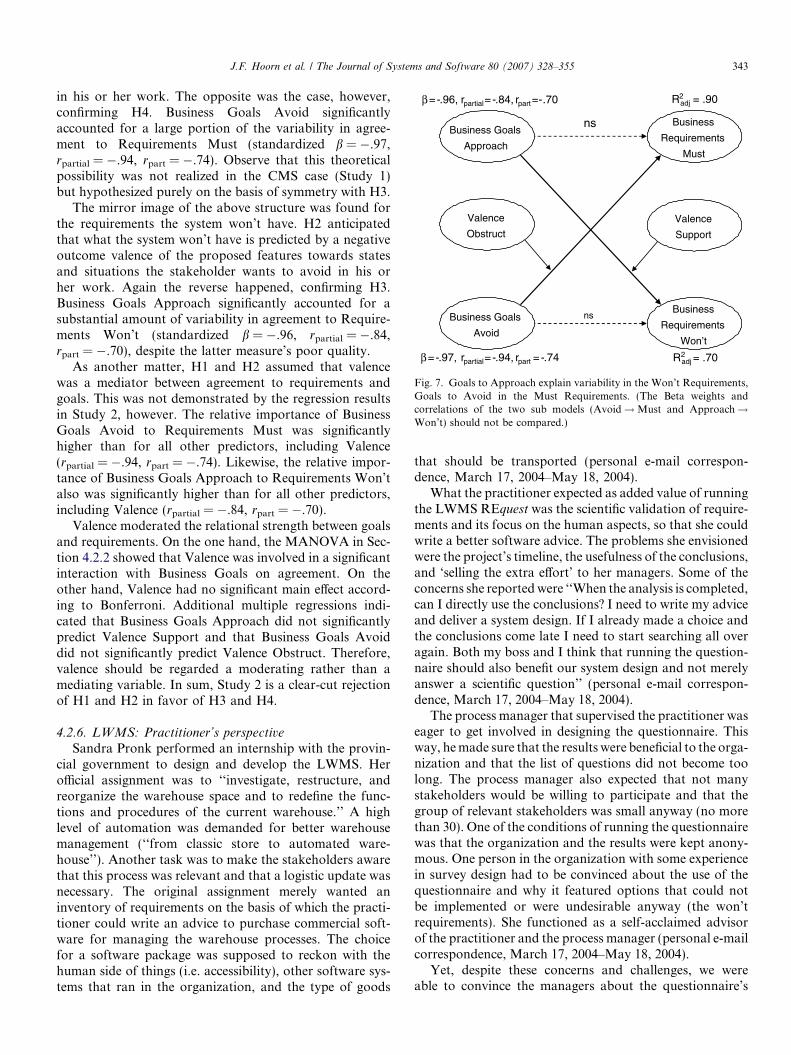
Business Goals
Approach
Business Goals
Avoid
Business
Requirements
Must
Business
Requirements
Won’t
Valence
Support
Valence
Obstruct
ns
ns
β= -.97, rpartial= -.94, rpart = -.74
β= -.96, rpartial= -.84, rpart= -.70 R2adj = .90
R2adj = .70
Fig. 7. Goals to Approach explain variability in the Won’t Requirements,Goals to Avoid in the Must Requirements. (The Beta weights andcorrelations of the two sub models (Avoid!Must and Approach!Won’t) should not be compared.)
J.F. Hoorn et al. / The Journal of Systems and Software 80 (2007) 328–355 343
in his or her work. The opposite was the case, however,confirming H4. Business Goals Avoid significantlyaccounted for a large portion of the variability in agree-ment to Requirements Must (standardized b = �.97,rpartial = �.94, rpart = �.74). Observe that this theoreticalpossibility was not realized in the CMS case (Study 1)but hypothesized purely on the basis of symmetry with H3.
The mirror image of the above structure was found forthe requirements the system won’t have. H2 anticipatedthat what the system won’t have is predicted by a negativeoutcome valence of the proposed features towards statesand situations the stakeholder wants to avoid in his orher work. Again the reverse happened, confirming H3.Business Goals Approach significantly accounted for asubstantial amount of variability in agreement to Require-ments Won’t (standardized b = �.96, rpartial = �.84,rpart = �.70), despite the latter measure’s poor quality.
As another matter, H1 and H2 assumed that valencewas a mediator between agreement to requirements andgoals. This was not demonstrated by the regression resultsin Study 2, however. The relative importance of BusinessGoals Avoid to Requirements Must was significantlyhigher than for all other predictors, including Valence(rpartial = �.94, rpart = �.74). Likewise, the relative impor-tance of Business Goals Approach to Requirements Won’talso was significantly higher than for all other predictors,including Valence (rpartial = �.84, rpart = �.70).
Valence moderated the relational strength between goalsand requirements. On the one hand, the MANOVA in Sec-tion 4.2.2 showed that Valence was involved in a significantinteraction with Business Goals on agreement. On theother hand, Valence had no significant main effect accord-ing to Bonferroni. Additional multiple regressions indi-cated that Business Goals Approach did not significantlypredict Valence Support and that Business Goals Avoiddid not significantly predict Valence Obstruct. Therefore,valence should be regarded a moderating rather than amediating variable. In sum, Study 2 is a clear-cut rejectionof H1 and H2 in favor of H3 and H4.
4.2.6. LWMS: Practitioner’s perspective
Sandra Pronk performed an internship with the provin-cial government to design and develop the LWMS. Herofficial assignment was to ‘‘investigate, restructure, andreorganize the warehouse space and to redefine the func-tions and procedures of the current warehouse.’’ A highlevel of automation was demanded for better warehousemanagement (‘‘from classic store to automated ware-house’’). Another task was to make the stakeholders awarethat this process was relevant and that a logistic update wasnecessary. The original assignment merely wanted aninventory of requirements on the basis of which the practi-tioner could write an advice to purchase commercial soft-ware for managing the warehouse processes. The choicefor a software package was supposed to reckon with thehuman side of things (i.e. accessibility), other software sys-tems that ran in the organization, and the type of goods
that should be transported (personal e-mail correspon-dence, March 17, 2004–May 18, 2004).
What the practitioner expected as added value of runningthe LWMS REquest was the scientific validation of require-ments and its focus on the human aspects, so that she couldwrite a better software advice. The problems she envisionedwere the project’s timeline, the usefulness of the conclusions,and ‘selling the extra effort’ to her managers. Some of theconcerns she reported were ‘‘When the analysis is completed,can I directly use the conclusions? I need to write my adviceand deliver a system design. If I already made a choice andthe conclusions come late I need to start searching all overagain. Both my boss and I think that running the question-naire should also benefit our system design and not merelyanswer a scientific question’’ (personal e-mail correspon-dence, March 17, 2004–May 18, 2004).
The process manager that supervised the practitioner waseager to get involved in designing the questionnaire. Thisway, he made sure that the results were beneficial to the orga-nization and that the list of questions did not become toolong. The process manager also expected that not manystakeholders would be willing to participate and that thegroup of relevant stakeholders was small anyway (no morethan 30). One of the conditions of running the questionnairewas that the organization and the results were kept anony-mous. One person in the organization with some experiencein survey design had to be convinced about the use of thequestionnaire and why it featured options that could notbe implemented or were undesirable anyway (the won’trequirements). She functioned as a self-acclaimed advisorof the practitioner and the process manager (personal e-mailcorrespondence, March 17, 2004–May 18, 2004).
Yet, despite these concerns and challenges, we wereable to convince the managers about the questionnaire’s
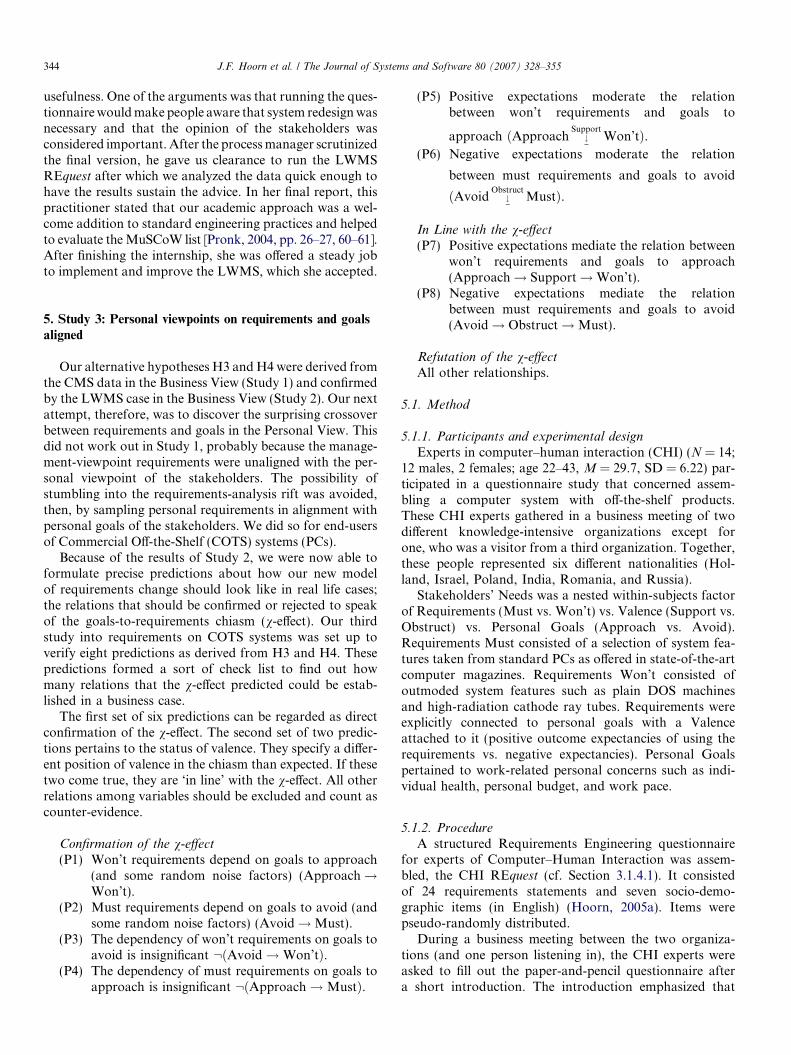
344 J.F. Hoorn et al. / The Journal of Systems and Software 80 (2007) 328–355
usefulness. One of the arguments was that running the ques-tionnaire would make people aware that system redesign wasnecessary and that the opinion of the stakeholders wasconsidered important. After the process manager scrutinizedthe final version, he gave us clearance to run the LWMSREquest after which we analyzed the data quick enough tohave the results sustain the advice. In her final report, thispractitioner stated that our academic approach was a wel-come addition to standard engineering practices and helpedto evaluate the MuSCoW list [Pronk, 2004, pp. 26–27, 60–61].After finishing the internship, she was offered a steady jobto implement and improve the LWMS, which she accepted.
5. Study 3: Personal viewpoints on requirements and goals
aligned
Our alternative hypotheses H3 and H4 were derived fromthe CMS data in the Business View (Study 1) and confirmedby the LWMS case in the Business View (Study 2). Our nextattempt, therefore, was to discover the surprising crossoverbetween requirements and goals in the Personal View. Thisdid not work out in Study 1, probably because the manage-ment-viewpoint requirements were unaligned with the per-sonal viewpoint of the stakeholders. The possibility ofstumbling into the requirements-analysis rift was avoided,then, by sampling personal requirements in alignment withpersonal goals of the stakeholders. We did so for end-usersof Commercial Off-the-Shelf (COTS) systems (PCs).
Because of the results of Study 2, we were now able toformulate precise predictions about how our new modelof requirements change should look like in real life cases;the relations that should be confirmed or rejected to speakof the goals-to-requirements chiasm (v-effect). Our thirdstudy into requirements on COTS systems was set up toverify eight predictions as derived from H3 and H4. Thesepredictions formed a sort of check list to find out howmany relations that the v-effect predicted could be estab-lished in a business case.
The first set of six predictions can be regarded as directconfirmation of the v-effect. The second set of two predic-tions pertains to the status of valence. They specify a differ-ent position of valence in the chiasm than expected. If thesetwo come true, they are ‘in line’ with the v-effect. All otherrelations among variables should be excluded and count ascounter-evidence.
Confirmation of the v-effect
(P1) Won’t requirements depend on goals to approach(and some random noise factors) (Approach!Won’t).
(P2) Must requirements depend on goals to avoid (andsome random noise factors) (Avoid!Must).
(P3) The dependency of won’t requirements on goals toavoid is insignificant :ðAvoid!Won’tÞ.
(P4) The dependency of must requirements on goals toapproach is insignificant :ðApproach!MustÞ.
(P5) Positive expectations moderate the relationbetween won’t requirements and goals to
approach ðApproach #Support
Won’tÞ.(P6) Negative expectations moderate the relation
between must requirements and goals to avoid
ðAvoid #Obstruct
MustÞ.
In Line with the v-effect
(P7) Positive expectations mediate the relation betweenwon’t requirements and goals to approach(Approach! Support!Won’t).
(P8) Negative expectations mediate the relationbetween must requirements and goals to avoid(Avoid! Obstruct!Must).
Refutation of the v-effect
All other relationships.
5.1. Method
5.1.1. Participants and experimental design
Experts in computer–human interaction (CHI) (N = 14;12 males, 2 females; age 22–43, M = 29.7, SD = 6.22) par-ticipated in a questionnaire study that concerned assem-bling a computer system with off-the-shelf products.These CHI experts gathered in a business meeting of twodifferent knowledge-intensive organizations except forone, who was a visitor from a third organization. Together,these people represented six different nationalities (Hol-land, Israel, Poland, India, Romania, and Russia).
Stakeholders’ Needs was a nested within-subjects factorof Requirements (Must vs. Won’t) vs. Valence (Support vs.Obstruct) vs. Personal Goals (Approach vs. Avoid).Requirements Must consisted of a selection of system fea-tures taken from standard PCs as offered in state-of-the-artcomputer magazines. Requirements Won’t consisted ofoutmoded system features such as plain DOS machinesand high-radiation cathode ray tubes. Requirements wereexplicitly connected to personal goals with a Valenceattached to it (positive outcome expectancies of using therequirements vs. negative expectancies). Personal Goalspertained to work-related personal concerns such as indi-vidual health, personal budget, and work pace.
5.1.2. Procedure
A structured Requirements Engineering questionnairefor experts of Computer–Human Interaction was assem-bled, the CHI REquest (cf. Section 3.1.4.1). It consistedof 24 requirements statements and seven socio-demo-graphic items (in English) (Hoorn, 2005a). Items werepseudo-randomly distributed.
During a business meeting between the two organiza-tions (and one person listening in), the CHI experts wereasked to fill out the paper-and-pencil questionnaire aftera short introduction. The introduction emphasized that
J.F. Hoorn et al. / The Journal of Systems and Software 80 (2007) 328–355 345
the requirements should be judged from a perspective ofpersonal goals (e.g., available budget, personal work pace,personal health, and individual effort). Completing thequestionnaire took between 10 and 15 min.
Sample requirements in the COTS PC case
• Must (Personal)– Anti virus software– 5 years pickup, repair, and return guarantee– Linux operating system– Latest AMD Athlon 64 processor– 350 GB hard– Mouse device– Internet connection– Well-designed interface– 63 in. Wide Screen Plasma Monitor– Outstanding firewall– TFT monitor
• Won’t (Personal)– Cathode ray tube monitor– Windows’95 operating system– Outdated browser software– 1 GB hard disk– Green-on-black display screen– Second hand DOS machine– Stand-alone computer– 5 1
4in. floppy drive
– Working from the prompt only– 486 DX processor
Sample goals in the COTS PC case
• Approach (Personal)– Cheap buy/save cash/no fees– Work quickly– Nice look-and-feel– International access/communication– Store all files– System usability– System stability– Good health
• Avoid (Personal)– Monthly license fee– System instability– Delete most files– Repetitive strain injury– High costs– Working in isolation– Work slowly– Hacker attack– Damage to eyes
Fig. 8. Grand mean average level of agreement to Stakeholders’ Needs(Must, Won’t, Support, Obstruct, Approach, Avoid). Standard deviationsare in parentheses (N = 14).
5.1.3. Measurements5.1.3.1. Scale construction in the COTS case. The facetedscale of Stakeholders’ Needs had 24 items, which werescored for agreement using 6-point rating scales (0 = com-
pletely disagree, 5 = completely agree). Stakeholders’Needs consisted of requirements statements that systemat-ically connected personal goals to requirements, while putt-ing positive or negative valence to them. Example items are‘‘I want the latest AMD Athlon 64 processor so that I canwork quickly’’ (Must–Supports–Approach), ‘‘To get a 63inch Wide Screen Plasma Monitor I am willing to drainmy budget’’ (Must–Obstructs–Approach).
The items were evaluated by ICT professionals (not theactual test group) for readability, wording, and whether thecontents made sense to people working in the field. Afterthe necessary repair work, items were considered fit forthe main test.
5.2. Analysis and results
Data were entered in an SPSS 11.0 data matrix for sta-tistical analysis. For a detailed analysis, see (Hoorn,2005a).
5.2.1. Scale analysis
In doing scale analysis, we followed the same proceduresand criteria as described in Section 3.2.1. We did reliabilityassessments and item selection of the 12-item sub scales withCorrected Item-Total Correlations and Standardized Cron-bach’s alpha. We calculated Pearson correlations to evaluatein how far items correlated with other scales than their own.
The revised sub scales each had 3 items. On the whole,scale reliabilities were acceptable (.65) to reasonable (.77).For more details, see (Hoorn, 2005a).
5.2.2. Agreement to COTS Requirements and Goals
A 2 * 3 MANOVA of 2 (Item Type: Indicative vs. Con-tra-indicative) (within-subjects) * 3 (Scales: Requirementsvs. Valence vs. Personal Goals) was run on the grand meanlevel of agreement to requirements statements (Fig. 8). Forthe complete analysis, see (Hoorn, 2005a).
346 J.F. Hoorn et al. / The Journal of Systems and Software 80 (2007) 328–355
The most important result was the significant interactionbetween Item Type (Indicative vs. Contra-indicative) andScales (Requirements vs. Valence vs. Personal Goals)(Pillai’s Trace = .78, F(2,12) = 21.06, p = .000). The interac-tion underscored the general pattern that sub scales con-sisting of Indicative items (MMust = 3.68, MSupport = 2.45,MApproach = 1.41) raised higher levels of agreementthan those with Contra-indicative items (MWon’t = .21,MObstruct = 1.79, MAvoid = 1.10). For Requirements Must(M = 3.68, SD = .93) vs. Requirements Won’t (M = .21,SD = .32) the difference was the largest. This was mani-fested in a strong significant contrast between Require-ments on the one hand and Valence on the other(parameter coefficient = 2.80, t = 5.78, p < .0001, g2
p ¼ :72)as well as between Requirements and Personal Goals(parameter coefficient = 3.15, t = 6.69, p < .0001, g2
p ¼ :78).Yet, the Indicative and Contra-indicative items of Valenceand Personal Goals differed in a similar way, making thecontrast within the interaction insignificant (parametercoefficient = .36, t = 1.13, p = .281). Instead, the significantmain effect of Scales (Pillai’s Trace = .65, F(2,12) = 11.09,p = .002) showed that on the whole, Valence (M = 2.12)evoked higher levels of agreement than Personal Goals(M = 1.26) did (parameter coefficient = 1.74, t = 4.29,p < .001, g2
p ¼ :59).The entire analysis was repeated with Sex (2), Function
(3), Organization (3), Department (3), Section (3), andCountry (6) as fixed factors and controlled for Age ascovariate. However, none of the effects of these back-ground variables were significant (Hoorn, 2005a).
5.2.3. Discussion of the effects on agreement in the COTS
case
The significant interaction between Item Type andScales underscored that the pattern of scores went intothe expected direction. The CHI experts expressed moreagreement to Must than Won’t, to Support than Obstruct,and more to Approach than to Avoid.
5.2.4. COTS PCs: Personal-viewpoint Requirements in
relation to Personal Goals
Next, we confronted the predictions P1–P8 with the dataobtained for the COTS PCs. We performed a number ofmultiple linear regressions to determine the predictivepower of Personal Goals Avoid for Must Requirementsand Personal Goals Approach for Won’t Requirements.
5.2.4.1. Explaining Requirements Must. A multiple linearregression analysis (method Enter) was performed in whichRequirements Must served as the dependent variable andPersonal Goals Avoid and Personal Goals Approachas the predictors (Hoorn, 2005a). It turned out that Per-sonal Goals Avoid accounted for a significant amount ofthe Requirements Must variability, R2 = .77, R2
adj ¼ :73,F(2,11) = 18.28, p = .000. Sustaining this conclusion is theheight of the standardized Beta coefficient, standardized
b = .86, t = 5.92, p = .000, and the strong correlation(rpartial = .87, rpart = .86) between Personal Goals Avoidand Requirements Must partialling out the effects ofPersonal Goals Approach.
In a second multiple linear regression analysis (methodEnter) Requirements Must was the dependent variablewith three ordered sets of predictors. Requirements Won’twas entered in the first step, Valence Support and ValenceObstruct in the second step, and Personal Goals Approachand Personal Goals Avoid in the third.
The second set of predictors, Valence Support andValence Obstruct, accounted for a significant amount ofthe Requirements Must variability, R2 = .84, R2
adj ¼ :79,F(3,10) = 17.74, p = .000. The third set, Personal GoalsApproach and Personal Goals Avoid, did not incrementthe percent of explained variance of Requirements Must,R2
change ¼ :06, F(2,8) = 2.49, p = .145. On the basis ofcorrelation–regression analyses, the relative importance ofValence Support and Valence Obstruct in predictingRequirements Must was assessed. It seemed that ValenceObstruct was most strongly related to Requirements Must,standardized b = .90, t = 6.21, p = .000, (rpartial = .89,rpart = .78). Valence Support offered little or no additionalpredictive power beyond that contributed by the ValenceObstruct measure.
To check whether Valence Obstruct mediated the rela-tion between Personal Goals Avoid and RequirementsMust, a third multiple linear regression analysis (methodEnter) was performed in which Valence Obstruct servedas the dependent variable and Personal Goals Avoid andPersonal Goals Approach served as the predictors. Itturned out that Personal Goals Avoid accounted for a sig-nificant amount of the Valence Obstruct variability,R2 = .87, R2
adj ¼ :85, F(2,11) = 38.35, p = .000, standardizedb = .94, t = 8.75, p = .000, rpartial = .94, rpart = .93 and thatPersonal Goals Approach had no additional predictivepower beyond Personal Goals Avoid.
5.2.4.2. Explaining Requirements Won’t. A multiple linearregression analysis (method Enter) was performed in whichRequirements Won’t served as the dependent variable withthree ordered sets of predictors. Requirements Must wasentered in the first step, Valence Support and ValenceObstruct in the second step, and Personal Goals Approachand Personal Goals Avoid in the third.
The third set of predictors, Personal Goals Approachand Personal Goals Avoid, accounted for a significant pro-portion of the Requirements Won’t variability, R2 = .79,R2
adj ¼ :65, F(5,8) = 5.84, p = .015. It seemed that PersonalGoals Approach was most strongly related to Require-ments Won’t, standardized b = .75, t = 4.11, p = .003.The correlation between Personal Goals Approach andRequirements Won’t was also high after partialling outthe effects of Personal Goals Avoid (rpartial = .82,rpart = .67). Personal Goals Avoid offered little or no addi-tional predictive power beyond that contributed by the Per-sonal Goals Approach measure.
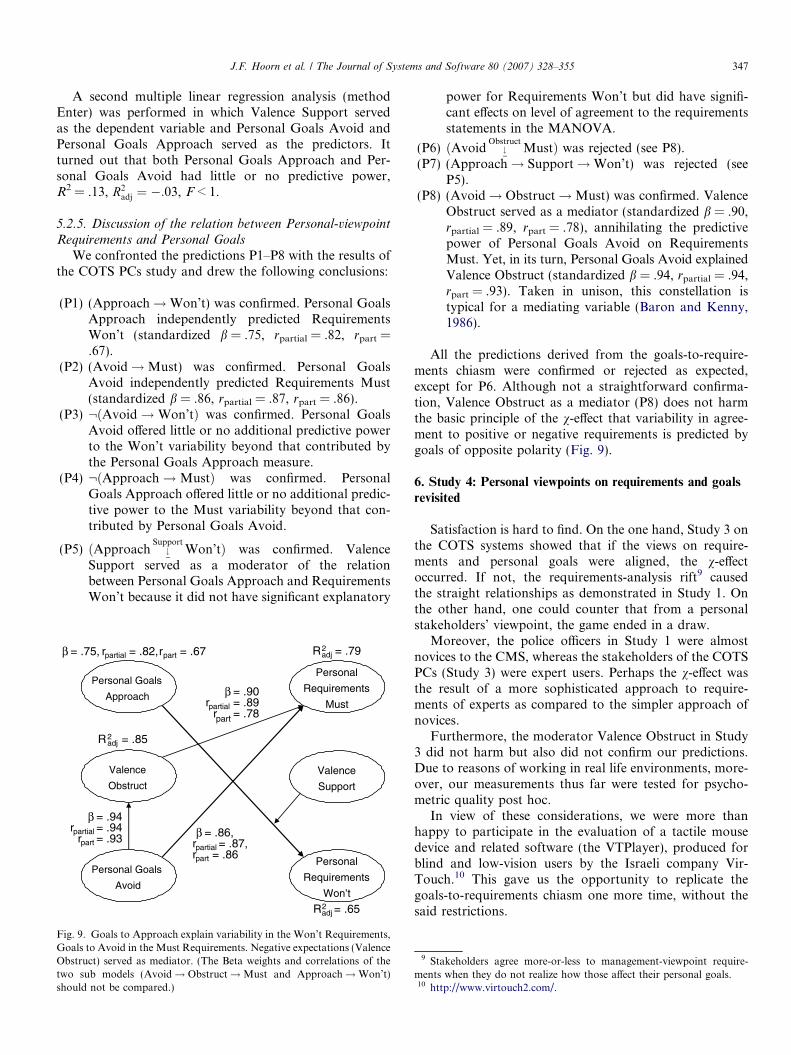
J.F. Hoorn et al. / The Journal of Systems and Software 80 (2007) 328–355 347
A second multiple linear regression analysis (methodEnter) was performed in which Valence Support servedas the dependent variable and Personal Goals Avoid andPersonal Goals Approach served as the predictors. Itturned out that both Personal Goals Approach and Per-sonal Goals Avoid had little or no predictive power,R2 = .13, R2
adj ¼ �:03, F < 1.
5.2.5. Discussion of the relation between Personal-viewpoint
Requirements and Personal Goals
We confronted the predictions P1–P8 with the results ofthe COTS PCs study and drew the following conclusions:
(P1) (Approach!Won’t) was confirmed. Personal GoalsApproach independently predicted RequirementsWon’t (standardized b = .75, rpartial = .82, rpart =.67).
(P2) (Avoid!Must) was confirmed. Personal GoalsAvoid independently predicted Requirements Must(standardized b = .86, rpartial = .87, rpart = .86).
(P3) :ðAvoid!Won’tÞ was confirmed. Personal GoalsAvoid offered little or no additional predictive powerto the Won’t variability beyond that contributed bythe Personal Goals Approach measure.
(P4) :ðApproach!MustÞ was confirmed. PersonalGoals Approach offered little or no additional predic-tive power to the Must variability beyond that con-tributed by Personal Goals Avoid.
(P5) ðApproach #Support
Won’tÞ was confirmed. ValenceSupport served as a moderator of the relationbetween Personal Goals Approach and RequirementsWon’t because it did not have significant explanatory
Personal Goals
Approach
Personal Goals
Avoid
Personal
Requirements
Must
Personal
Requirements
Won’t
Valence
Support
Valence
Obstruct
β = .75, rpartial = .82, rpart = .67
R2adj = .65
β = .86,rpartial = .87,rpart = .86
R2adj = .79
β = .94rpartial = .94
rpart = .93
R2adj = .85
β = .90rpartial = .89
rpart = .78
Fig. 9. Goals to Approach explain variability in the Won’t Requirements,Goals to Avoid in the Must Requirements. Negative expectations (ValenceObstruct) served as mediator. (The Beta weights and correlations of thetwo sub models (Avoid! Obstruct!Must and Approach!Won’t)should not be compared.)
power for Requirements Won’t but did have signifi-cant effects on level of agreement to the requirementsstatements in the MANOVA.
(P6) ðAvoid #Obstruct
MustÞ was rejected (see P8).(P7) (Approach! Support!Won’t) was rejected (see
P5).(P8) (Avoid! Obstruct!Must) was confirmed. Valence
Obstruct served as a mediator (standardized b = .90,rpartial = .89, rpart = .78), annihilating the predictivepower of Personal Goals Avoid on RequirementsMust. Yet, in its turn, Personal Goals Avoid explainedValence Obstruct (standardized b = .94, rpartial = .94,rpart = .93). Taken in unison, this constellation istypical for a mediating variable (Baron and Kenny,1986).
All the predictions derived from the goals-to-require-ments chiasm were confirmed or rejected as expected,except for P6. Although not a straightforward confirma-tion, Valence Obstruct as a mediator (P8) does not harmthe basic principle of the v-effect that variability in agree-ment to positive or negative requirements is predicted bygoals of opposite polarity (Fig. 9).
6. Study 4: Personal viewpoints on requirements and goals
revisited
Satisfaction is hard to find. On the one hand, Study 3 onthe COTS systems showed that if the views on require-ments and personal goals were aligned, the v-effectoccurred. If not, the requirements-analysis rift9 causedthe straight relationships as demonstrated in Study 1. Onthe other hand, one could counter that from a personalstakeholders’ viewpoint, the game ended in a draw.
Moreover, the police officers in Study 1 were almostnovices to the CMS, whereas the stakeholders of the COTSPCs (Study 3) were expert users. Perhaps the v-effect wasthe result of a more sophisticated approach to require-ments of experts as compared to the simpler approach ofnovices.
Furthermore, the moderator Valence Obstruct in Study3 did not harm but also did not confirm our predictions.Due to reasons of working in real life environments, more-over, our measurements thus far were tested for psycho-metric quality post hoc.
In view of these considerations, we were more thanhappy to participate in the evaluation of a tactile mousedevice and related software (the VTPlayer), produced forblind and low-vision users by the Israeli company Vir-Touch.10 This gave us the opportunity to replicate thegoals-to-requirements chiasm one more time, without thesaid restrictions.
9 Stakeholders agree more-or-less to management-viewpoint require-ments when they do not realize how those affect their personal goals.10 http://www.virtouch2.com/.
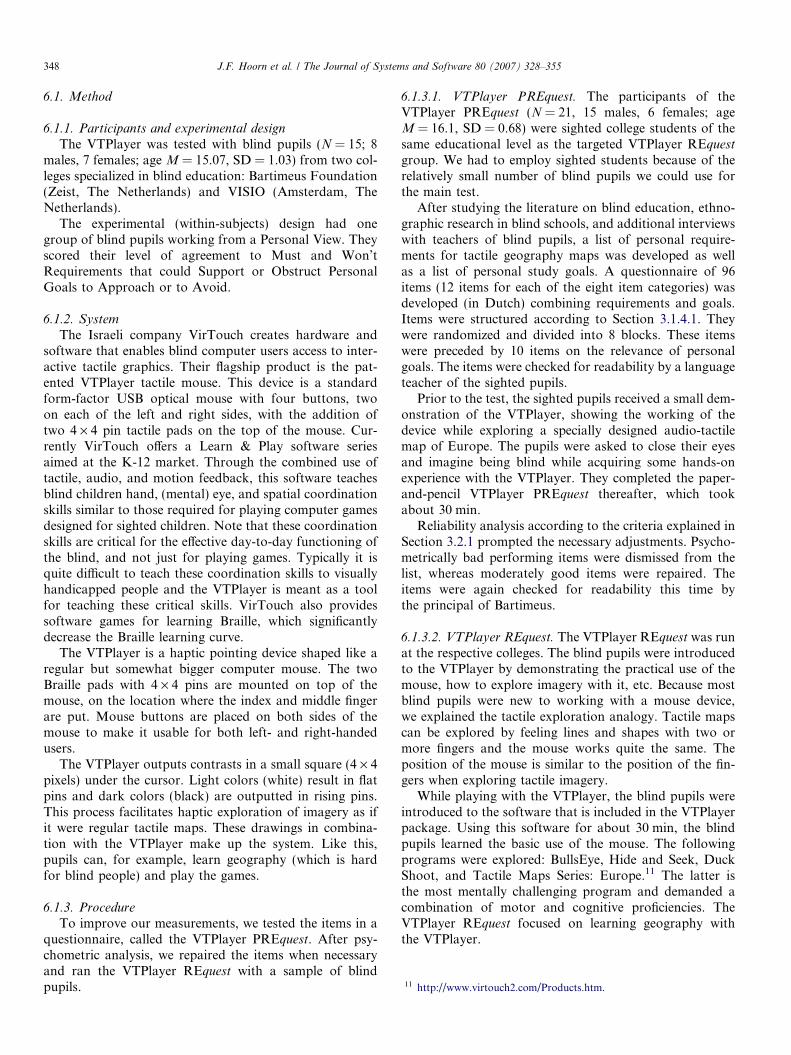
11 http://www.virtouch2.com/Products.htm.
348 J.F. Hoorn et al. / The Journal of Systems and Software 80 (2007) 328–355
6.1. Method
6.1.1. Participants and experimental design
The VTPlayer was tested with blind pupils (N = 15; 8males, 7 females; age M = 15.07, SD = 1.03) from two col-leges specialized in blind education: Bartimeus Foundation(Zeist, The Netherlands) and VISIO (Amsterdam, TheNetherlands).
The experimental (within-subjects) design had onegroup of blind pupils working from a Personal View. Theyscored their level of agreement to Must and Won’tRequirements that could Support or Obstruct PersonalGoals to Approach or to Avoid.
6.1.2. System
The Israeli company VirTouch creates hardware andsoftware that enables blind computer users access to inter-active tactile graphics. Their flagship product is the pat-ented VTPlayer tactile mouse. This device is a standardform-factor USB optical mouse with four buttons, twoon each of the left and right sides, with the addition oftwo 4 · 4 pin tactile pads on the top of the mouse. Cur-rently VirTouch offers a Learn & Play software seriesaimed at the K-12 market. Through the combined use oftactile, audio, and motion feedback, this software teachesblind children hand, (mental) eye, and spatial coordinationskills similar to those required for playing computer gamesdesigned for sighted children. Note that these coordinationskills are critical for the effective day-to-day functioning ofthe blind, and not just for playing games. Typically it isquite difficult to teach these coordination skills to visuallyhandicapped people and the VTPlayer is meant as a toolfor teaching these critical skills. VirTouch also providessoftware games for learning Braille, which significantlydecrease the Braille learning curve.
The VTPlayer is a haptic pointing device shaped like aregular but somewhat bigger computer mouse. The twoBraille pads with 4 · 4 pins are mounted on top of themouse, on the location where the index and middle fingerare put. Mouse buttons are placed on both sides of themouse to make it usable for both left- and right-handedusers.
The VTPlayer outputs contrasts in a small square (4 · 4pixels) under the cursor. Light colors (white) result in flatpins and dark colors (black) are outputted in rising pins.This process facilitates haptic exploration of imagery as ifit were regular tactile maps. These drawings in combina-tion with the VTPlayer make up the system. Like this,pupils can, for example, learn geography (which is hardfor blind people) and play the games.
6.1.3. Procedure
To improve our measurements, we tested the items in aquestionnaire, called the VTPlayer PREquest. After psy-chometric analysis, we repaired the items when necessaryand ran the VTPlayer REquest with a sample of blindpupils.
6.1.3.1. VTPlayer PREquest. The participants of theVTPlayer PREquest (N = 21, 15 males, 6 females; ageM = 16.1, SD = 0.68) were sighted college students of thesame educational level as the targeted VTPlayer REquest
group. We had to employ sighted students because of therelatively small number of blind pupils we could use forthe main test.
After studying the literature on blind education, ethno-graphic research in blind schools, and additional interviewswith teachers of blind pupils, a list of personal require-ments for tactile geography maps was developed as wellas a list of personal study goals. A questionnaire of 96items (12 items for each of the eight item categories) wasdeveloped (in Dutch) combining requirements and goals.Items were structured according to Section 3.1.4.1. Theywere randomized and divided into 8 blocks. These itemswere preceded by 10 items on the relevance of personalgoals. The items were checked for readability by a languageteacher of the sighted pupils.
Prior to the test, the sighted pupils received a small dem-onstration of the VTPlayer, showing the working of thedevice while exploring a specially designed audio-tactilemap of Europe. The pupils were asked to close their eyesand imagine being blind while acquiring some hands-onexperience with the VTPlayer. They completed the paper-and-pencil VTPlayer PREquest thereafter, which tookabout 30 min.
Reliability analysis according to the criteria explained inSection 3.2.1 prompted the necessary adjustments. Psycho-metrically bad performing items were dismissed from thelist, whereas moderately good items were repaired. Theitems were again checked for readability this time bythe principal of Bartimeus.
6.1.3.2. VTPlayer REquest. The VTPlayer REquest was runat the respective colleges. The blind pupils were introducedto the VTPlayer by demonstrating the practical use of themouse, how to explore imagery with it, etc. Because mostblind pupils were new to working with a mouse device,we explained the tactile exploration analogy. Tactile mapscan be explored by feeling lines and shapes with two ormore fingers and the mouse works quite the same. Theposition of the mouse is similar to the position of the fin-gers when exploring tactile imagery.
While playing with the VTPlayer, the blind pupils wereintroduced to the software that is included in the VTPlayerpackage. Using this software for about 30 min, the blindpupils learned the basic use of the mouse. The followingprograms were explored: BullsEye, Hide and Seek, DuckShoot, and Tactile Maps Series: Europe.11 The latter isthe most mentally challenging program and demanded acombination of motor and cognitive proficiencies. TheVTPlayer REquest focused on learning geography withthe VTPlayer.
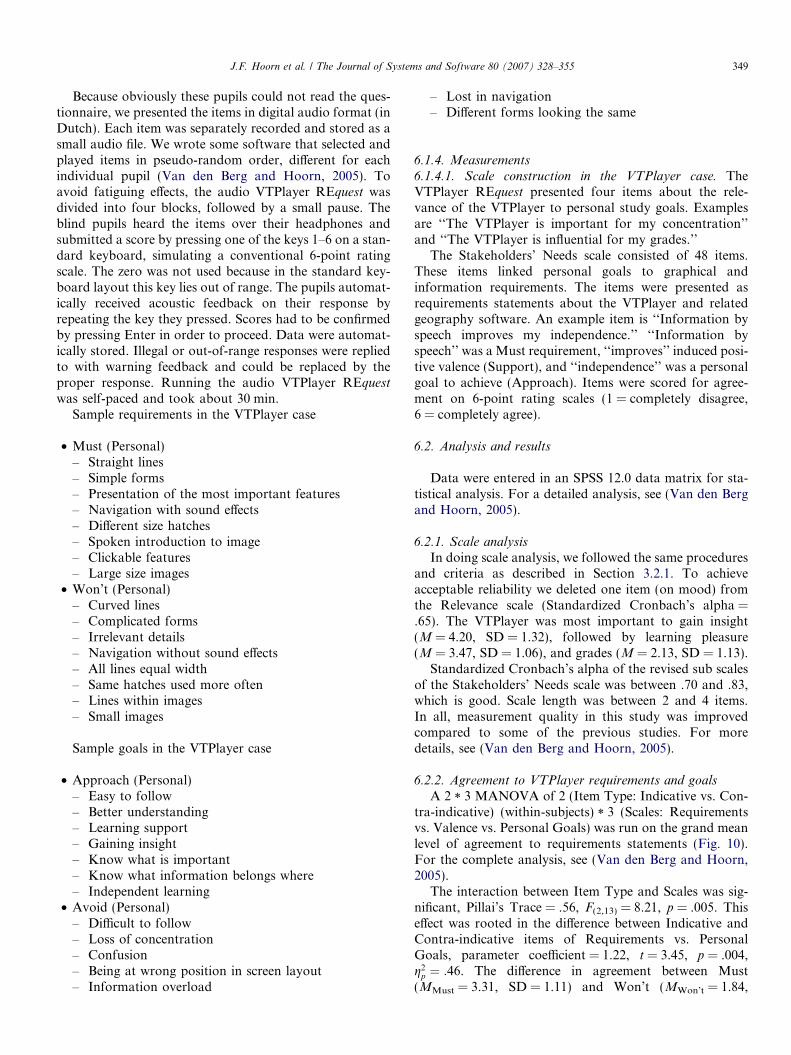
J.F. Hoorn et al. / The Journal of Systems and Software 80 (2007) 328–355 349
Because obviously these pupils could not read the ques-tionnaire, we presented the items in digital audio format (inDutch). Each item was separately recorded and stored as asmall audio file. We wrote some software that selected andplayed items in pseudo-random order, different for eachindividual pupil (Van den Berg and Hoorn, 2005). Toavoid fatiguing effects, the audio VTPlayer REquest wasdivided into four blocks, followed by a small pause. Theblind pupils heard the items over their headphones andsubmitted a score by pressing one of the keys 1–6 on a stan-dard keyboard, simulating a conventional 6-point ratingscale. The zero was not used because in the standard key-board layout this key lies out of range. The pupils automat-ically received acoustic feedback on their response byrepeating the key they pressed. Scores had to be confirmedby pressing Enter in order to proceed. Data were automat-ically stored. Illegal or out-of-range responses were repliedto with warning feedback and could be replaced by theproper response. Running the audio VTPlayer REquest
was self-paced and took about 30 min.Sample requirements in the VTPlayer case
• Must (Personal)– Straight lines– Simple forms– Presentation of the most important features– Navigation with sound effects– Different size hatches– Spoken introduction to image– Clickable features– Large size images
• Won’t (Personal)– Curved lines– Complicated forms– Irrelevant details– Navigation without sound effects– All lines equal width– Same hatches used more often– Lines within images– Small images
Sample goals in the VTPlayer case
• Approach (Personal)– Easy to follow– Better understanding– Learning support– Gaining insight– Know what is important– Know what information belongs where– Independent learning
• Avoid (Personal)– Difficult to follow– Loss of concentration– Confusion– Being at wrong position in screen layout– Information overload
– Lost in navigation– Different forms looking the same
6.1.4. Measurements
6.1.4.1. Scale construction in the VTPlayer case. TheVTPlayer REquest presented four items about the rele-vance of the VTPlayer to personal study goals. Examplesare ‘‘The VTPlayer is important for my concentration’’and ‘‘The VTPlayer is influential for my grades.’’
The Stakeholders’ Needs scale consisted of 48 items.These items linked personal goals to graphical andinformation requirements. The items were presented asrequirements statements about the VTPlayer and relatedgeography software. An example item is ‘‘Information byspeech improves my independence.’’ ‘‘Information byspeech’’ was a Must requirement, ‘‘improves’’ induced posi-tive valence (Support), and ‘‘independence’’ was a personalgoal to achieve (Approach). Items were scored for agree-ment on 6-point rating scales (1 = completely disagree,6 = completely agree).
6.2. Analysis and results
Data were entered in an SPSS 12.0 data matrix for sta-tistical analysis. For a detailed analysis, see (Van den Bergand Hoorn, 2005).
6.2.1. Scale analysis
In doing scale analysis, we followed the same proceduresand criteria as described in Section 3.2.1. To achieveacceptable reliability we deleted one item (on mood) fromthe Relevance scale (Standardized Cronbach’s alpha =.65). The VTPlayer was most important to gain insight(M = 4.20, SD = 1.32), followed by learning pleasure(M = 3.47, SD = 1.06), and grades (M = 2.13, SD = 1.13).
Standardized Cronbach’s alpha of the revised sub scalesof the Stakeholders’ Needs scale was between .70 and .83,which is good. Scale length was between 2 and 4 items.In all, measurement quality in this study was improvedcompared to some of the previous studies. For moredetails, see (Van den Berg and Hoorn, 2005).
6.2.2. Agreement to VTPlayer requirements and goals
A 2 * 3 MANOVA of 2 (Item Type: Indicative vs. Con-tra-indicative) (within-subjects) * 3 (Scales: Requirementsvs. Valence vs. Personal Goals) was run on the grand meanlevel of agreement to requirements statements (Fig. 10).For the complete analysis, see (Van den Berg and Hoorn,2005).
The interaction between Item Type and Scales was sig-nificant, Pillai’s Trace = .56, F(2,13) = 8.21, p = .005. Thiseffect was rooted in the difference between Indicative andContra-indicative items of Requirements vs. PersonalGoals, parameter coefficient = 1.22, t = 3.45, p = .004,g2
p ¼ :46. The difference in agreement between Must(MMust = 3.31, SD = 1.11) and Won’t (MWon’t = 1.84,
Fig. 10. Grand mean average agreement to the 6 sub scales ofStakeholders’ Needs (N = 15). Standard deviations are in parentheses.
Personal Goals
Approach
Personal Goals
Avoid
Personal
Requirements
Must
Personal
Requirements
Won’t
Valence
Support
Valence
Obstruct
R2adj = .31
ns
β = .66rpartial = .67
rpart = .67
R2adj = .35β = -.60
β = -.53
Fig. 11. Goals to Approach explain variability in the Won’t Require-ments, Goals to Avoid in the Must Requirements. Valence Obstructserved as predictor of Must variability. (The Beta weights and correlationsof the two sub models ((Avoid!Must, Obstruct!Must) andApproach!Won’t) should not be compared.)
350 J.F. Hoorn et al. / The Journal of Systems and Software 80 (2007) 328–355
SD = .62) requirements was larger than the differencebetween Personal Goals Approach (MApproach = 3.33,SD = 1.42) and Personal Goals Avoid (MAvoid = 3.09,SD = 1.26). Won’t requirements yielded the lowest levelsof agreement.
In addition, the main effect of Scales was also signifi-cant, Pillai’s Trace = .67, F(2,13) = 13.06, p = .001. Inparticular, the level of agreement to Requirements(MReqs = 2.58) was much lower than to Valence (MValence =3.62), parameter coefficient = �2.08, t = �5.24, p < .001,g2
p ¼ :66. As a trend, the level of agreement to Valence(MValence = 3.62) was higher than to Personal Goals(MGoals = 3.21), parameter coefficient = .81, t = 2.15,p < .049. However, this difference was not significantaccording to Bonferroni (a = .05/3 � .017).
Adding Sex as a control factor raised insignificanteffects. Yet, there was an effect of Age (13–17) as a covar-
iate of Valence Support, F(1,14) = 10.01, p = .007, indicat-ing that the higher the age, the less support was expected(r = �.66), which is understandable.
In conclusion, the sub scales were capable of raisingstrong significant effects, particularly when Requirementsand Personal Goals were involved.
6.2.3. Discussion of the effects on agreement in the VTPlayer
case
The significant interaction between Item Type andScales showed that the scores went into the expected direc-tion. The blind pupils indicated higher levels of agreementto Must than Won’t, to Support than Obstruct, and toApproach than Avoid. Valence was mainly active in com-bination with Requirements.
6.2.4. VTPlayer: Personal-viewpoint Requirements in
relation to Personal Goals revisited
In Study 4, we tested the predictions P1–P8, followingthe same procedures as in Study 3 (Section 5.2.4).
6.2.4.1. Explaining Requirements Must. Regression(method Enter) of Personal Goals Avoid on RequirementsMust revealed that Personal Goals Avoid indeed contrib-uted significantly to the Requirements Must variability,R2 = .29, R2
adj ¼ :23, F(1,13) = 5.18, p = .040, standardizedb = �.53.
As a control, multiple regression was performed(method Enter) of Support and Obstruct (entered in thefirst step) and Personal Goals Avoid and Personal GoalsApproach (in the second step) on the Requirements Mustmeasure.
Support and Obstruct could significantly explainRequirements Must, R2 = .44, R2
adj ¼ :35, F(2,12) = 4.78,p = .030. This was mainly due to Obstruct, standardizedb = .66, t = 3.09, p = .009, rpartial = .67, rpart = .67. Sup-port could not significantly surpass this contribution.Additionally, Personal Goals Avoid was not strong enough(Fchange(1,11) = 4.02, p = .07) to contribute above andbeyond Obstruct.
To test whether Obstruct could be considered a media-tor between Must and Avoid, we ran another regressionanalysis of Personal Goals Avoid on Obstruct. However,no significant contribution was found, F(1,13) = 1.03,p = .329. Thus, Valence Obstruct seemed to be an indepen-dent predictor of the Requirements Must variability.
6.2.4.2. Explaining Requirements Won’t. We performedregression analysis (method Enter) of Personal GoalsApproach on Requirements Won’t. We found that Per-sonal Goals Approach contributed significantly toRequirements Won’t, R2 = .36, R2
adj ¼ :31, F(1,13) = 7.30,p = .018, standardized b = �.60.
As a control, we performed multiple regression analysis(Enter) on Requirements Won’t with Valence Support andObstruct entered in the first step and Personal Goals Avoidand Personal Goals Approach in the second step.
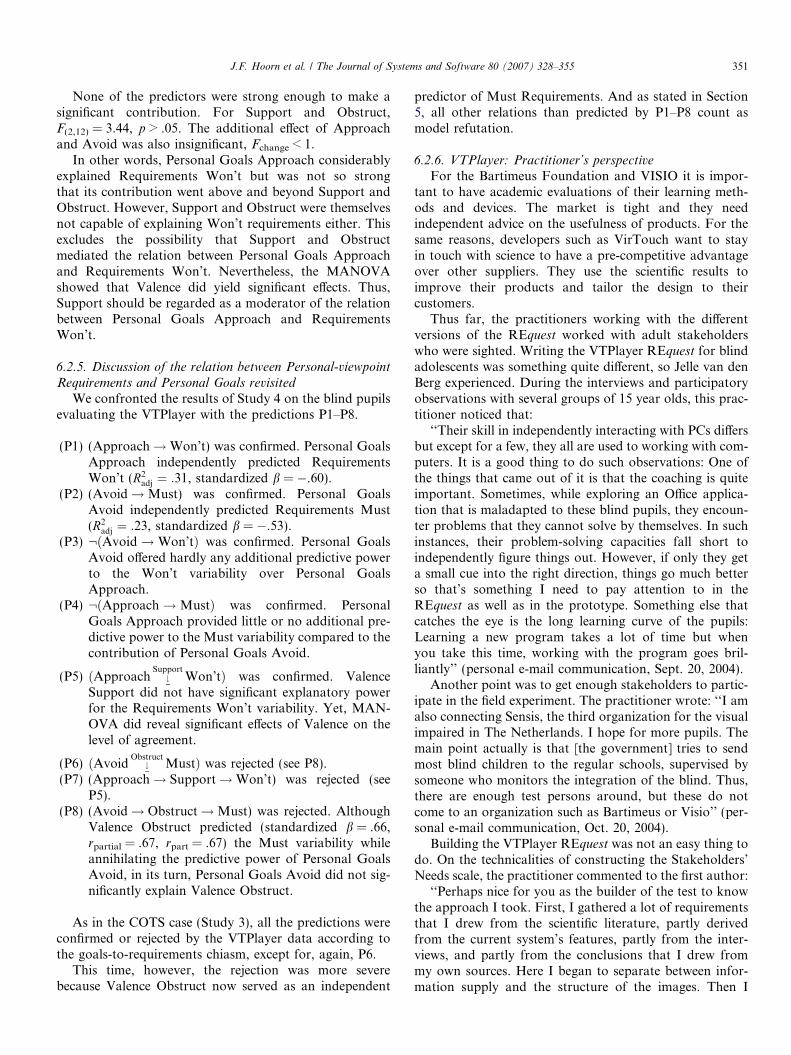
J.F. Hoorn et al. / The Journal of Systems and Software 80 (2007) 328–355 351
None of the predictors were strong enough to make asignificant contribution. For Support and Obstruct,F(2,12) = 3.44, p > .05. The additional effect of Approachand Avoid was also insignificant, Fchange < 1.
In other words, Personal Goals Approach considerablyexplained Requirements Won’t but was not so strongthat its contribution went above and beyond Support andObstruct. However, Support and Obstruct were themselvesnot capable of explaining Won’t requirements either. Thisexcludes the possibility that Support and Obstructmediated the relation between Personal Goals Approachand Requirements Won’t. Nevertheless, the MANOVAshowed that Valence did yield significant effects. Thus,Support should be regarded as a moderator of the relationbetween Personal Goals Approach and RequirementsWon’t.
6.2.5. Discussion of the relation between Personal-viewpoint
Requirements and Personal Goals revisited
We confronted the results of Study 4 on the blind pupilsevaluating the VTPlayer with the predictions P1–P8.
(P1) (Approach!Won’t) was confirmed. Personal GoalsApproach independently predicted RequirementsWon’t (R2
adj ¼ :31, standardized b = �.60).(P2) (Avoid!Must) was confirmed. Personal Goals
Avoid independently predicted Requirements Must(R2
adj ¼ :23, standardized b = �.53).(P3) :ðAvoid!Won’tÞ was confirmed. Personal Goals
Avoid offered hardly any additional predictive powerto the Won’t variability over Personal GoalsApproach.
(P4) :ðApproach!MustÞ was confirmed. PersonalGoals Approach provided little or no additional pre-dictive power to the Must variability compared to thecontribution of Personal Goals Avoid.
(P5) ðApproach #Support
Won’tÞ was confirmed. ValenceSupport did not have significant explanatory powerfor the Requirements Won’t variability. Yet, MAN-OVA did reveal significant effects of Valence on thelevel of agreement.
(P6) ðAvoid #Obstruct
MustÞ was rejected (see P8).(P7) (Approach! Support!Won’t) was rejected (see
P5).(P8) (Avoid! Obstruct!Must) was rejected. Although
Valence Obstruct predicted (standardized b = .66,rpartial = .67, rpart = .67) the Must variability whileannihilating the predictive power of Personal GoalsAvoid, in its turn, Personal Goals Avoid did not sig-nificantly explain Valence Obstruct.
As in the COTS case (Study 3), all the predictions wereconfirmed or rejected by the VTPlayer data according tothe goals-to-requirements chiasm, except for, again, P6.
This time, however, the rejection was more severebecause Valence Obstruct now served as an independent
predictor of Must Requirements. And as stated in Section5, all other relations than predicted by P1–P8 count asmodel refutation.
6.2.6. VTPlayer: Practitioner’s perspective
For the Bartimeus Foundation and VISIO it is impor-tant to have academic evaluations of their learning meth-ods and devices. The market is tight and they needindependent advice on the usefulness of products. For thesame reasons, developers such as VirTouch want to stayin touch with science to have a pre-competitive advantageover other suppliers. They use the scientific results toimprove their products and tailor the design to theircustomers.
Thus far, the practitioners working with the differentversions of the REquest worked with adult stakeholderswho were sighted. Writing the VTPlayer REquest for blindadolescents was something quite different, so Jelle van denBerg experienced. During the interviews and participatoryobservations with several groups of 15 year olds, this prac-titioner noticed that:
‘‘Their skill in independently interacting with PCs differsbut except for a few, they all are used to working with com-puters. It is a good thing to do such observations: One ofthe things that came out of it is that the coaching is quiteimportant. Sometimes, while exploring an Office applica-tion that is maladapted to these blind pupils, they encoun-ter problems that they cannot solve by themselves. In suchinstances, their problem-solving capacities fall short toindependently figure things out. However, if only they geta small cue into the right direction, things go much betterso that’s something I need to pay attention to in theREquest as well as in the prototype. Something else thatcatches the eye is the long learning curve of the pupils:Learning a new program takes a lot of time but whenyou take this time, working with the program goes bril-liantly’’ (personal e-mail communication, Sept. 20, 2004).
Another point was to get enough stakeholders to partic-ipate in the field experiment. The practitioner wrote: ‘‘I amalso connecting Sensis, the third organization for the visualimpaired in The Netherlands. I hope for more pupils. Themain point actually is that [the government] tries to sendmost blind children to the regular schools, supervised bysomeone who monitors the integration of the blind. Thus,there are enough test persons around, but these do notcome to an organization such as Bartimeus or Visio’’ (per-sonal e-mail communication, Oct. 20, 2004).
Building the VTPlayer REquest was not an easy thing todo. On the technicalities of constructing the Stakeholders’Needs scale, the practitioner commented to the first author:
‘‘Perhaps nice for you as the builder of the test to knowthe approach I took. First, I gathered a lot of requirementsthat I drew from the scientific literature, partly derivedfrom the current system’s features, partly from the inter-views, and partly from the conclusions that I drew frommy own sources. Here I began to separate between infor-mation supply and the structure of the images. Then I
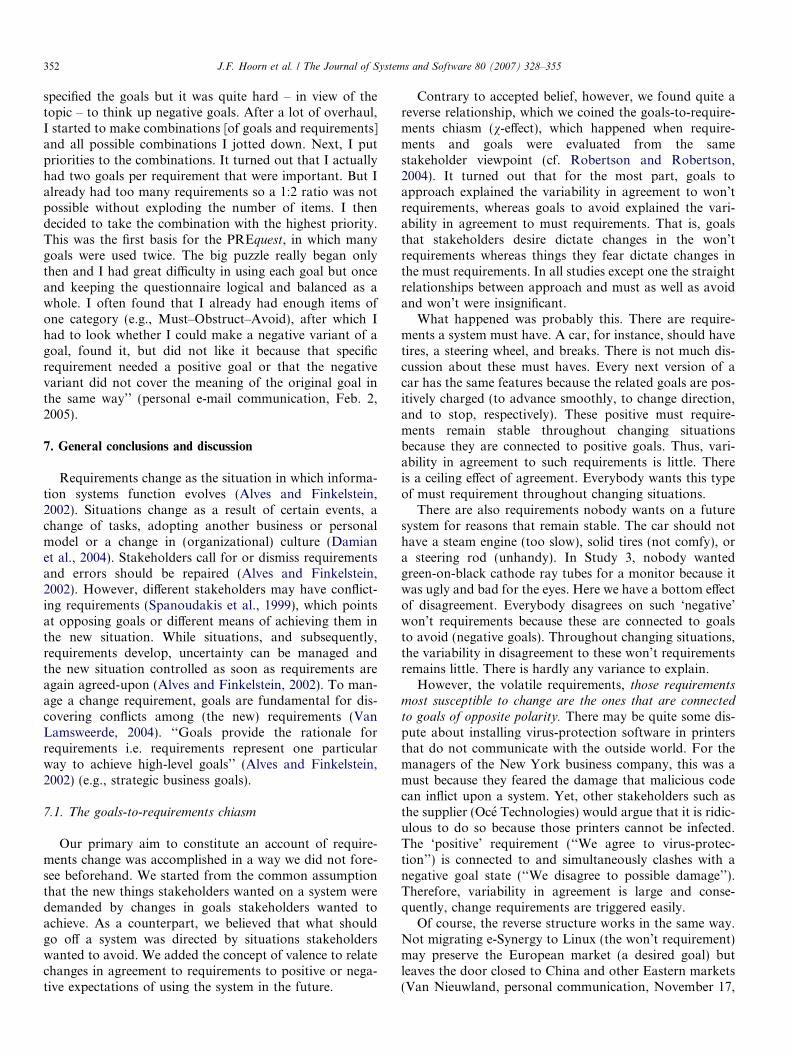
352 J.F. Hoorn et al. / The Journal of Systems and Software 80 (2007) 328–355
specified the goals but it was quite hard – in view of thetopic – to think up negative goals. After a lot of overhaul,I started to make combinations [of goals and requirements]and all possible combinations I jotted down. Next, I putpriorities to the combinations. It turned out that I actuallyhad two goals per requirement that were important. But Ialready had too many requirements so a 1:2 ratio was notpossible without exploding the number of items. I thendecided to take the combination with the highest priority.This was the first basis for the PREquest, in which manygoals were used twice. The big puzzle really began onlythen and I had great difficulty in using each goal but onceand keeping the questionnaire logical and balanced as awhole. I often found that I already had enough items ofone category (e.g., Must–Obstruct–Avoid), after which Ihad to look whether I could make a negative variant of agoal, found it, but did not like it because that specificrequirement needed a positive goal or that the negativevariant did not cover the meaning of the original goal inthe same way’’ (personal e-mail communication, Feb. 2,2005).
7. General conclusions and discussion
Requirements change as the situation in which informa-tion systems function evolves (Alves and Finkelstein,2002). Situations change as a result of certain events, achange of tasks, adopting another business or personalmodel or a change in (organizational) culture (Damianet al., 2004). Stakeholders call for or dismiss requirementsand errors should be repaired (Alves and Finkelstein,2002). However, different stakeholders may have conflict-ing requirements (Spanoudakis et al., 1999), which pointsat opposing goals or different means of achieving them inthe new situation. While situations, and subsequently,requirements develop, uncertainty can be managed andthe new situation controlled as soon as requirements areagain agreed-upon (Alves and Finkelstein, 2002). To man-age a change requirement, goals are fundamental for dis-covering conflicts among (the new) requirements (VanLamsweerde, 2004). ‘‘Goals provide the rationale forrequirements i.e. requirements represent one particularway to achieve high-level goals’’ (Alves and Finkelstein,2002) (e.g., strategic business goals).
7.1. The goals-to-requirements chiasm
Our primary aim to constitute an account of require-ments change was accomplished in a way we did not fore-see beforehand. We started from the common assumptionthat the new things stakeholders wanted on a system weredemanded by changes in goals stakeholders wanted toachieve. As a counterpart, we believed that what shouldgo off a system was directed by situations stakeholderswanted to avoid. We added the concept of valence to relatechanges in agreement to requirements to positive or nega-tive expectations of using the system in the future.
Contrary to accepted belief, however, we found quite areverse relationship, which we coined the goals-to-require-ments chiasm (v-effect), which happened when require-ments and goals were evaluated from the samestakeholder viewpoint (cf. Robertson and Robertson,2004). It turned out that for the most part, goals toapproach explained the variability in agreement to won’trequirements, whereas goals to avoid explained the vari-ability in agreement to must requirements. That is, goalsthat stakeholders desire dictate changes in the won’trequirements whereas things they fear dictate changes inthe must requirements. In all studies except one the straightrelationships between approach and must as well as avoidand won’t were insignificant.
What happened was probably this. There are require-ments a system must have. A car, for instance, should havetires, a steering wheel, and breaks. There is not much dis-cussion about these must haves. Every next version of acar has the same features because the related goals are pos-itively charged (to advance smoothly, to change direction,and to stop, respectively). These positive must require-ments remain stable throughout changing situationsbecause they are connected to positive goals. Thus, vari-ability in agreement to such requirements is little. Thereis a ceiling effect of agreement. Everybody wants this typeof must requirement throughout changing situations.
There are also requirements nobody wants on a futuresystem for reasons that remain stable. The car should nothave a steam engine (too slow), solid tires (not comfy), ora steering rod (unhandy). In Study 3, nobody wantedgreen-on-black cathode ray tubes for a monitor because itwas ugly and bad for the eyes. Here we have a bottom effectof disagreement. Everybody disagrees on such ‘negative’won’t requirements because these are connected to goalsto avoid (negative goals). Throughout changing situations,the variability in disagreement to these won’t requirementsremains little. There is hardly any variance to explain.
However, the volatile requirements, those requirementsmost susceptible to change are the ones that are connected
to goals of opposite polarity. There may be quite some dis-pute about installing virus-protection software in printersthat do not communicate with the outside world. For themanagers of the New York business company, this was amust because they feared the damage that malicious codecan inflict upon a system. Yet, other stakeholders such asthe supplier (Oce Technologies) would argue that it is ridic-ulous to do so because those printers cannot be infected.The ‘positive’ requirement (‘‘We agree to virus-protec-tion’’) is connected to and simultaneously clashes with anegative goal state (‘‘We disagree to possible damage’’).Therefore, variability in agreement is large and conse-quently, change requirements are triggered easily.
Of course, the reverse structure works in the same way.Not migrating e-Synergy to Linux (the won’t requirement)may preserve the European market (a desired goal) butleaves the door closed to China and other Eastern markets(Van Nieuwland, personal communication, November 17,
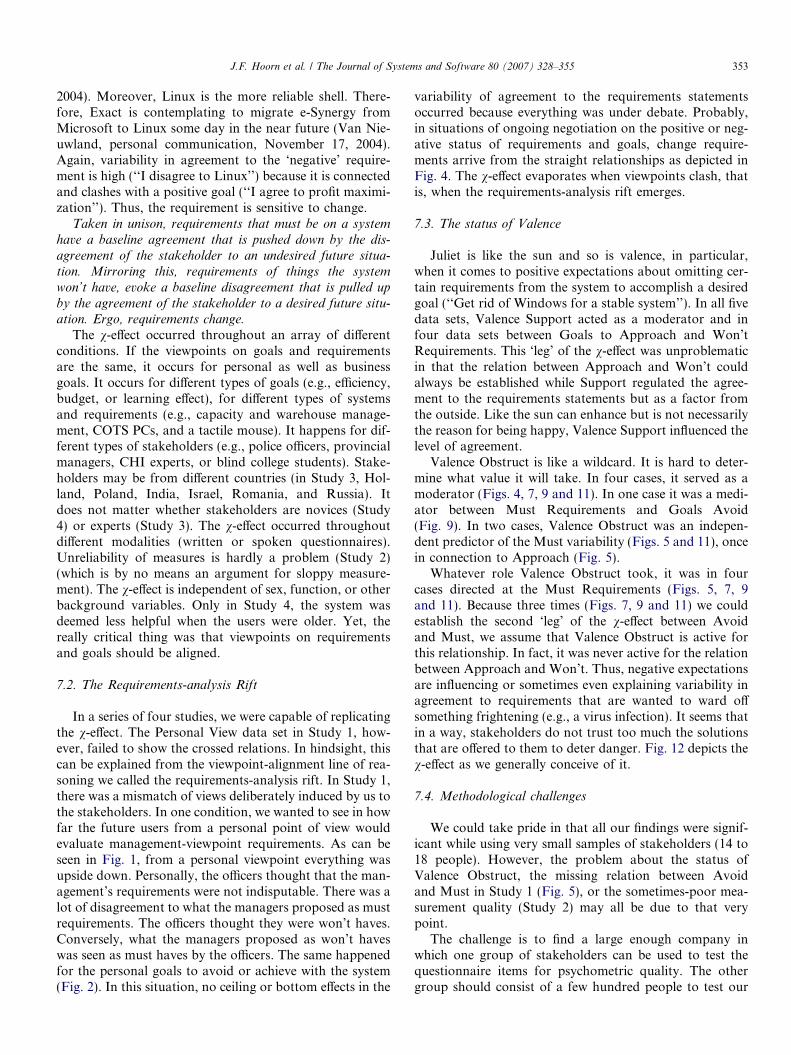
J.F. Hoorn et al. / The Journal of Systems and Software 80 (2007) 328–355 353
2004). Moreover, Linux is the more reliable shell. There-fore, Exact is contemplating to migrate e-Synergy fromMicrosoft to Linux some day in the near future (Van Nie-uwland, personal communication, November 17, 2004).Again, variability in agreement to the ‘negative’ require-ment is high (‘‘I disagree to Linux’’) because it is connectedand clashes with a positive goal (‘‘I agree to profit maximi-zation’’). Thus, the requirement is sensitive to change.
Taken in unison, requirements that must be on a system
have a baseline agreement that is pushed down by the dis-
agreement of the stakeholder to an undesired future situa-
tion. Mirroring this, requirements of things the system
won’t have, evoke a baseline disagreement that is pulled up
by the agreement of the stakeholder to a desired future situ-ation. Ergo, requirements change.
The v-effect occurred throughout an array of differentconditions. If the viewpoints on goals and requirementsare the same, it occurs for personal as well as businessgoals. It occurs for different types of goals (e.g., efficiency,budget, or learning effect), for different types of systemsand requirements (e.g., capacity and warehouse manage-ment, COTS PCs, and a tactile mouse). It happens for dif-ferent types of stakeholders (e.g., police officers, provincialmanagers, CHI experts, or blind college students). Stake-holders may be from different countries (in Study 3, Hol-land, Poland, India, Israel, Romania, and Russia). Itdoes not matter whether stakeholders are novices (Study4) or experts (Study 3). The v-effect occurred throughoutdifferent modalities (written or spoken questionnaires).Unreliability of measures is hardly a problem (Study 2)(which is by no means an argument for sloppy measure-ment). The v-effect is independent of sex, function, or otherbackground variables. Only in Study 4, the system wasdeemed less helpful when the users were older. Yet, thereally critical thing was that viewpoints on requirementsand goals should be aligned.
7.2. The Requirements-analysis Rift
In a series of four studies, we were capable of replicatingthe v-effect. The Personal View data set in Study 1, how-ever, failed to show the crossed relations. In hindsight, thiscan be explained from the viewpoint-alignment line of rea-soning we called the requirements-analysis rift. In Study 1,there was a mismatch of views deliberately induced by us tothe stakeholders. In one condition, we wanted to see in howfar the future users from a personal point of view wouldevaluate management-viewpoint requirements. As can beseen in Fig. 1, from a personal viewpoint everything wasupside down. Personally, the officers thought that the man-agement’s requirements were not indisputable. There was alot of disagreement to what the managers proposed as mustrequirements. The officers thought they were won’t haves.Conversely, what the managers proposed as won’t haveswas seen as must haves by the officers. The same happenedfor the personal goals to avoid or achieve with the system(Fig. 2). In this situation, no ceiling or bottom effects in the
variability of agreement to the requirements statementsoccurred because everything was under debate. Probably,in situations of ongoing negotiation on the positive or neg-ative status of requirements and goals, change require-ments arrive from the straight relationships as depicted inFig. 4. The v-effect evaporates when viewpoints clash, thatis, when the requirements-analysis rift emerges.
7.3. The status of Valence
Juliet is like the sun and so is valence, in particular,when it comes to positive expectations about omitting cer-tain requirements from the system to accomplish a desiredgoal (‘‘Get rid of Windows for a stable system’’). In all fivedata sets, Valence Support acted as a moderator and infour data sets between Goals to Approach and Won’tRequirements. This ‘leg’ of the v-effect was unproblematicin that the relation between Approach and Won’t couldalways be established while Support regulated the agree-ment to the requirements statements but as a factor fromthe outside. Like the sun can enhance but is not necessarilythe reason for being happy, Valence Support influenced thelevel of agreement.
Valence Obstruct is like a wildcard. It is hard to deter-mine what value it will take. In four cases, it served as amoderator (Figs. 4, 7, 9 and 11). In one case it was a medi-ator between Must Requirements and Goals Avoid(Fig. 9). In two cases, Valence Obstruct was an indepen-dent predictor of the Must variability (Figs. 5 and 11), oncein connection to Approach (Fig. 5).
Whatever role Valence Obstruct took, it was in fourcases directed at the Must Requirements (Figs. 5, 7, 9and 11). Because three times (Figs. 7, 9 and 11) we couldestablish the second ‘leg’ of the v-effect between Avoidand Must, we assume that Valence Obstruct is active forthis relationship. In fact, it was never active for the relationbetween Approach and Won’t. Thus, negative expectationsare influencing or sometimes even explaining variability inagreement to requirements that are wanted to ward offsomething frightening (e.g., a virus infection). It seems thatin a way, stakeholders do not trust too much the solutionsthat are offered to them to deter danger. Fig. 12 depicts thev-effect as we generally conceive of it.
7.4. Methodological challenges
We could take pride in that all our findings were signif-icant while using very small samples of stakeholders (14 to18 people). However, the problem about the status ofValence Obstruct, the missing relation between Avoidand Must in Study 1 (Fig. 5), or the sometimes-poor mea-surement quality (Study 2) may all be due to that verypoint.
The challenge is to find a large enough company inwhich one group of stakeholders can be used to test thequestionnaire items for psychometric quality. The othergroup should consist of a few hundred people to test our
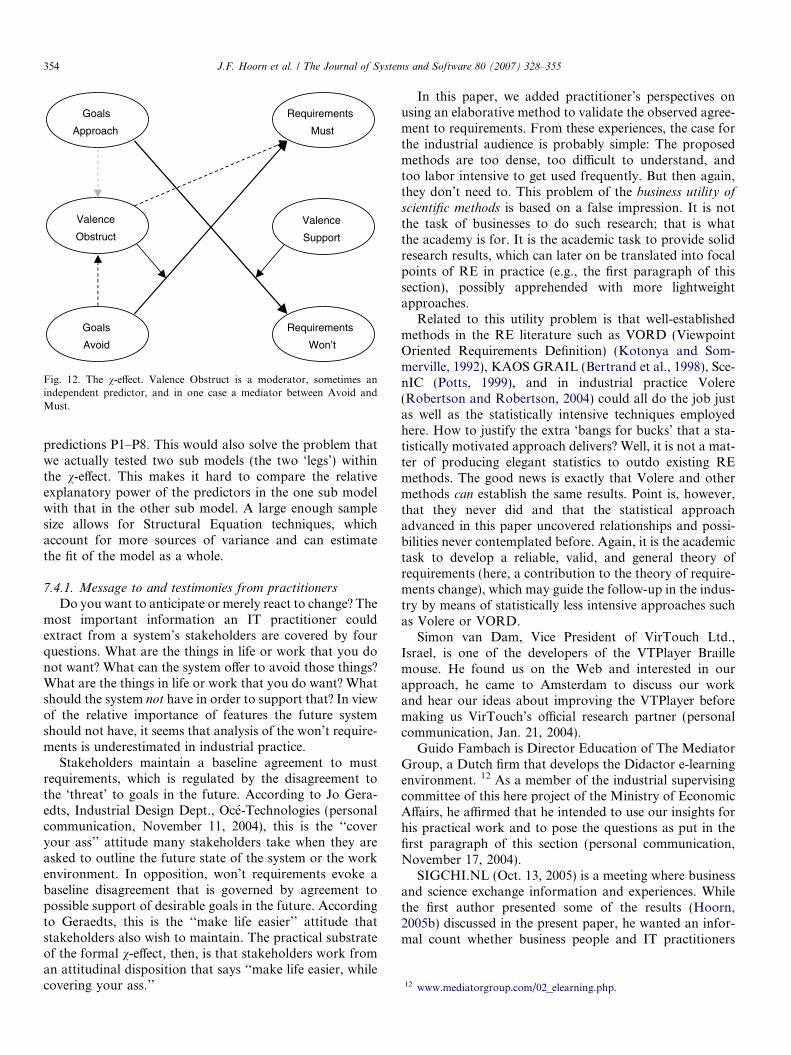
Goals
Approach
Goals
Avoid
Requirements
Must
Requirements
Won’t
Valence
Support
Valence
Obstruct
Fig. 12. The v-effect. Valence Obstruct is a moderator, sometimes anindependent predictor, and in one case a mediator between Avoid andMust.
12 www.mediatorgroup.com/02_elearning.php.
354 J.F. Hoorn et al. / The Journal of Systems and Software 80 (2007) 328–355
predictions P1–P8. This would also solve the problem thatwe actually tested two sub models (the two ‘legs’) withinthe v-effect. This makes it hard to compare the relativeexplanatory power of the predictors in the one sub modelwith that in the other sub model. A large enough samplesize allows for Structural Equation techniques, whichaccount for more sources of variance and can estimatethe fit of the model as a whole.
7.4.1. Message to and testimonies from practitioners
Do you want to anticipate or merely react to change? Themost important information an IT practitioner couldextract from a system’s stakeholders are covered by fourquestions. What are the things in life or work that you donot want? What can the system offer to avoid those things?What are the things in life or work that you do want? Whatshould the system not have in order to support that? In viewof the relative importance of features the future systemshould not have, it seems that analysis of the won’t require-ments is underestimated in industrial practice.
Stakeholders maintain a baseline agreement to mustrequirements, which is regulated by the disagreement tothe ‘threat’ to goals in the future. According to Jo Gera-edts, Industrial Design Dept., Oce-Technologies (personalcommunication, November 11, 2004), this is the ‘‘coveryour ass’’ attitude many stakeholders take when they areasked to outline the future state of the system or the workenvironment. In opposition, won’t requirements evoke abaseline disagreement that is governed by agreement topossible support of desirable goals in the future. Accordingto Geraedts, this is the ‘‘make life easier’’ attitude thatstakeholders also wish to maintain. The practical substrateof the formal v-effect, then, is that stakeholders work froman attitudinal disposition that says ‘‘make life easier, whilecovering your ass.’’
In this paper, we added practitioner’s perspectives onusing an elaborative method to validate the observed agree-ment to requirements. From these experiences, the case forthe industrial audience is probably simple: The proposedmethods are too dense, too difficult to understand, andtoo labor intensive to get used frequently. But then again,they don’t need to. This problem of the business utility of
scientific methods is based on a false impression. It is notthe task of businesses to do such research; that is whatthe academy is for. It is the academic task to provide solidresearch results, which can later on be translated into focalpoints of RE in practice (e.g., the first paragraph of thissection), possibly apprehended with more lightweightapproaches.
Related to this utility problem is that well-establishedmethods in the RE literature such as VORD (ViewpointOriented Requirements Definition) (Kotonya and Som-merville, 1992), KAOS GRAIL (Bertrand et al., 1998), Sce-nIC (Potts, 1999), and in industrial practice Volere(Robertson and Robertson, 2004) could all do the job justas well as the statistically intensive techniques employedhere. How to justify the extra ‘bangs for bucks’ that a sta-tistically motivated approach delivers? Well, it is not a mat-ter of producing elegant statistics to outdo existing REmethods. The good news is exactly that Volere and othermethods can establish the same results. Point is, however,that they never did and that the statistical approachadvanced in this paper uncovered relationships and possi-bilities never contemplated before. Again, it is the academictask to develop a reliable, valid, and general theory ofrequirements (here, a contribution to the theory of require-ments change), which may guide the follow-up in the indus-try by means of statistically less intensive approaches suchas Volere or VORD.
Simon van Dam, Vice President of VirTouch Ltd.,Israel, is one of the developers of the VTPlayer Braillemouse. He found us on the Web and interested in ourapproach, he came to Amsterdam to discuss our workand hear our ideas about improving the VTPlayer beforemaking us VirTouch’s official research partner (personalcommunication, Jan. 21, 2004).
Guido Fambach is Director Education of The MediatorGroup, a Dutch firm that develops the Didactor e-learningenvironment. 12 As a member of the industrial supervisingcommittee of this here project of the Ministry of EconomicAffairs, he affirmed that he intended to use our insights forhis practical work and to pose the questions as put in thefirst paragraph of this section (personal communication,November 17, 2004).
SIGCHI.NL (Oct. 13, 2005) is a meeting where businessand science exchange information and experiences. Whilethe first author presented some of the results (Hoorn,2005b) discussed in the present paper, he wanted an infor-mal count whether business people and IT practitioners
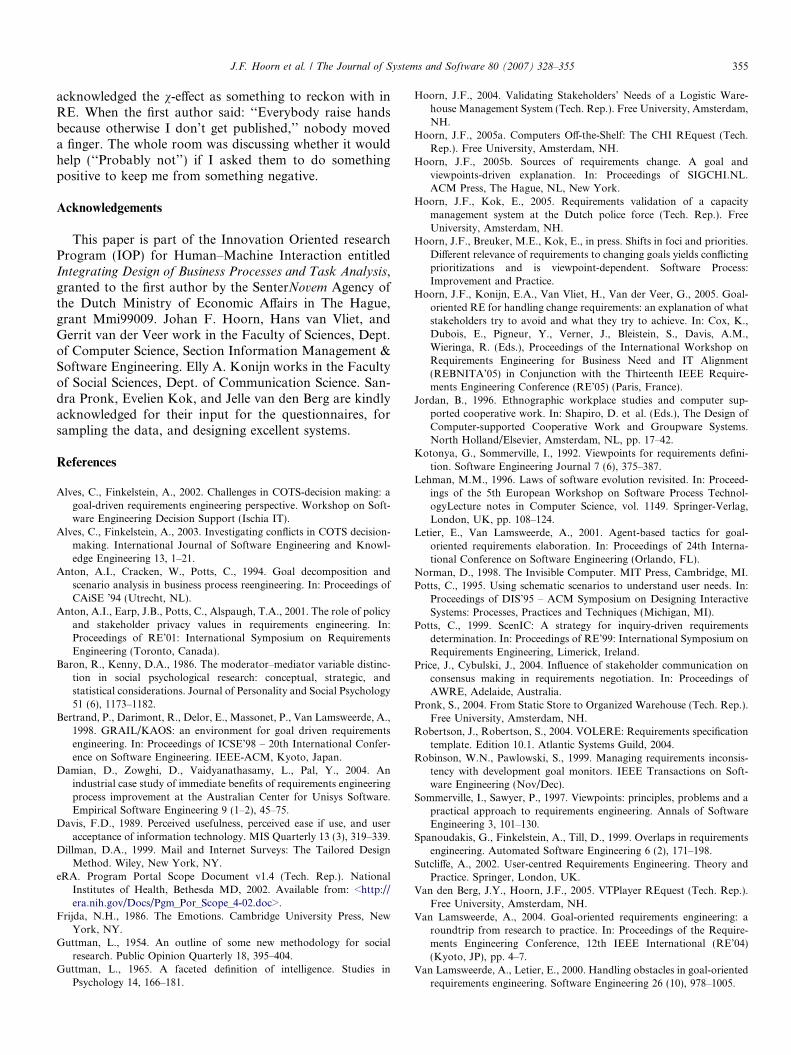
J.F. Hoorn et al. / The Journal of Systems and Software 80 (2007) 328–355 355
acknowledged the v-effect as something to reckon with inRE. When the first author said: ‘‘Everybody raise handsbecause otherwise I don’t get published,’’ nobody moveda finger. The whole room was discussing whether it wouldhelp (‘‘Probably not’’) if I asked them to do somethingpositive to keep me from something negative.
Acknowledgements
This paper is part of the Innovation Oriented researchProgram (IOP) for Human–Machine Interaction entitledIntegrating Design of Business Processes and Task Analysis,granted to the first author by the SenterNovem Agency ofthe Dutch Ministry of Economic Affairs in The Hague,grant Mmi99009. Johan F. Hoorn, Hans van Vliet, andGerrit van der Veer work in the Faculty of Sciences, Dept.of Computer Science, Section Information Management &Software Engineering. Elly A. Konijn works in the Facultyof Social Sciences, Dept. of Communication Science. San-dra Pronk, Evelien Kok, and Jelle van den Berg are kindlyacknowledged for their input for the questionnaires, forsampling the data, and designing excellent systems.
References
Alves, C., Finkelstein, A., 2002. Challenges in COTS-decision making: agoal-driven requirements engineering perspective. Workshop on Soft-ware Engineering Decision Support (Ischia IT).
Alves, C., Finkelstein, A., 2003. Investigating conflicts in COTS decision-making. International Journal of Software Engineering and Knowl-edge Engineering 13, 1–21.
Anton, A.I., Cracken, W., Potts, C., 1994. Goal decomposition andscenario analysis in business process reengineering. In: Proceedings ofCAiSE ’94 (Utrecht, NL).
Anton, A.I., Earp, J.B., Potts, C., Alspaugh, T.A., 2001. The role of policyand stakeholder privacy values in requirements engineering. In:Proceedings of RE’01: International Symposium on RequirementsEngineering (Toronto, Canada).
Baron, R., Kenny, D.A., 1986. The moderator–mediator variable distinc-tion in social psychological research: conceptual, strategic, andstatistical considerations. Journal of Personality and Social Psychology51 (6), 1173–1182.
Bertrand, P., Darimont, R., Delor, E., Massonet, P., Van Lamsweerde, A.,1998. GRAIL/KAOS: an environment for goal driven requirementsengineering. In: Proceedings of ICSE’98 – 20th International Confer-ence on Software Engineering. IEEE-ACM, Kyoto, Japan.
Damian, D., Zowghi, D., Vaidyanathasamy, L., Pal, Y., 2004. Anindustrial case study of immediate benefits of requirements engineeringprocess improvement at the Australian Center for Unisys Software.Empirical Software Engineering 9 (1–2), 45–75.
Davis, F.D., 1989. Perceived usefulness, perceived ease if use, and useracceptance of information technology. MIS Quarterly 13 (3), 319–339.
Dillman, D.A., 1999. Mail and Internet Surveys: The Tailored DesignMethod. Wiley, New York, NY.
eRA. Program Portal Scope Document v1.4 (Tech. Rep.). NationalInstitutes of Health, Bethesda MD, 2002. Available from: <http://era.nih.gov/Docs/Pgm_Por_Scope_4-02.doc>.
Frijda, N.H., 1986. The Emotions. Cambridge University Press, NewYork, NY.
Guttman, L., 1954. An outline of some new methodology for socialresearch. Public Opinion Quarterly 18, 395–404.
Guttman, L., 1965. A faceted definition of intelligence. Studies inPsychology 14, 166–181.
Hoorn, J.F., 2004. Validating Stakeholders’ Needs of a Logistic Ware-house Management System (Tech. Rep.). Free University, Amsterdam,NH.
Hoorn, J.F., 2005a. Computers Off-the-Shelf: The CHI REquest (Tech.Rep.). Free University, Amsterdam, NH.
Hoorn, J.F., 2005b. Sources of requirements change. A goal andviewpoints-driven explanation. In: Proceedings of SIGCHI.NL.ACM Press, The Hague, NL, New York.
Hoorn, J.F., Kok, E., 2005. Requirements validation of a capacitymanagement system at the Dutch police force (Tech. Rep.). FreeUniversity, Amsterdam, NH.
Hoorn, J.F., Breuker, M.E., Kok, E., in press. Shifts in foci and priorities.Different relevance of requirements to changing goals yields conflictingprioritizations and is viewpoint-dependent. Software Process:Improvement and Practice.
Hoorn, J.F., Konijn, E.A., Van Vliet, H., Van der Veer, G., 2005. Goal-oriented RE for handling change requirements: an explanation of whatstakeholders try to avoid and what they try to achieve. In: Cox, K.,Dubois, E., Pigneur, Y., Verner, J., Bleistein, S., Davis, A.M.,Wieringa, R. (Eds.), Proceedings of the International Workshop onRequirements Engineering for Business Need and IT Alignment(REBNITA’05) in Conjunction with the Thirteenth IEEE Require-ments Engineering Conference (RE’05) (Paris, France).
Jordan, B., 1996. Ethnographic workplace studies and computer sup-ported cooperative work. In: Shapiro, D. et al. (Eds.), The Design ofComputer-supported Cooperative Work and Groupware Systems.North Holland/Elsevier, Amsterdam, NL, pp. 17–42.
Kotonya, G., Sommerville, I., 1992. Viewpoints for requirements defini-tion. Software Engineering Journal 7 (6), 375–387.
Lehman, M.M., 1996. Laws of software evolution revisited. In: Proceed-ings of the 5th European Workshop on Software Process Technol-ogyLecture notes in Computer Science, vol. 1149. Springer-Verlag,London, UK, pp. 108–124.
Letier, E., Van Lamsweerde, A., 2001. Agent-based tactics for goal-oriented requirements elaboration. In: Proceedings of 24th Interna-tional Conference on Software Engineering (Orlando, FL).
Norman, D., 1998. The Invisible Computer. MIT Press, Cambridge, MI.Potts, C., 1995. Using schematic scenarios to understand user needs. In:
Proceedings of DIS’95 – ACM Symposium on Designing InteractiveSystems: Processes, Practices and Techniques (Michigan, MI).
Potts, C., 1999. ScenIC: A strategy for inquiry-driven requirementsdetermination. In: Proceedings of RE’99: International Symposium onRequirements Engineering, Limerick, Ireland.
Price, J., Cybulski, J., 2004. Influence of stakeholder communication onconsensus making in requirements negotiation. In: Proceedings ofAWRE, Adelaide, Australia.
Pronk, S., 2004. From Static Store to Organized Warehouse (Tech. Rep.).Free University, Amsterdam, NH.
Robertson, J., Robertson, S., 2004. VOLERE: Requirements specificationtemplate. Edition 10.1. Atlantic Systems Guild, 2004.
Robinson, W.N., Pawlowski, S., 1999. Managing requirements inconsis-tency with development goal monitors. IEEE Transactions on Soft-ware Engineering (Nov/Dec).
Sommerville, I., Sawyer, P., 1997. Viewpoints: principles, problems and apractical approach to requirements engineering. Annals of SoftwareEngineering 3, 101–130.
Spanoudakis, G., Finkelstein, A., Till, D., 1999. Overlaps in requirementsengineering. Automated Software Engineering 6 (2), 171–198.
Sutcliffe, A., 2002. User-centred Requirements Engineering. Theory andPractice. Springer, London, UK.
Van den Berg, J.Y., Hoorn, J.F., 2005. VTPlayer REquest (Tech. Rep.).Free University, Amsterdam, NH.
Van Lamsweerde, A., 2004. Goal-oriented requirements engineering: aroundtrip from research to practice. In: Proceedings of the Require-ments Engineering Conference, 12th IEEE International (RE’04)(Kyoto, JP), pp. 4–7.
Van Lamsweerde, A., Letier, E., 2000. Handling obstacles in goal-orientedrequirements engineering. Software Engineering 26 (10), 978–1005.