Embed Size (px)
Citation preview

Business Unit
Report No: ACS13036
Republic of India
Private Sector Commercial Financing
Framework for Renewable Energy
January 31, 2015
GFMDR
SOUTH ASIA
Pub
lic D
iscl
osur
e A
utho
rized
Pub
lic D
iscl
osur
e A
utho
rized
Pub
lic D
iscl
osur
e A
utho
rized
Pub
lic D
iscl
osur
e A
utho
rized

Business Unit
Standard Disclaimer:
This volume is a product of the staff of the International Bank for Reconstruction and Development/ The World Bank.
The findings, interpretations, and conclusions expressed in this paper do not necessarily reflect the views of the
Executive Directors of The World Bank or the governments they represent. The World Bank does not guarantee the
accuracy of the data included in this work. The boundaries, colors, denominations, and other information shown on any
map in this work do not imply any judgment on the part of The World Bank concerning the legal status of any territory
or the endorsement or acceptance of such boundaries.
Copyright Statement:
The material in this publication is copyrighted. Copying and/or transmitting portions or all of this work without
permission may be a violation of applicable law. The International Bank for Reconstruction and Development/ The
World Bank encourages dissemination of its work and will normally grant permission to reproduce portions of the work
promptly.
For permission to photocopy or reprint any part of this work, please send a request with complete information to the
Copyright Clearance Center, Inc., 222 Rosewood Drive, Danvers, MA 01923, USA, telephone 978-750-8400, fax 978-
750-4470, http://www.copyright.com/.
All other queries on rights and licenses, including subsidiary rights, should be addressed to the Office of the Publisher,
The World Bank, 1818 H Street NW, Washington, DC 20433, USA, fax 202-522-2422, e-mail [email protected].
Business Unit
Developing a PPP Model & Framework for Renewable Energy Projects Department of Economic Affairs, Ministry of Finance
January 2015

Table of contents
Table of contents
Table of contents
Table of contents 5
1. Introduction 8
1.1. Background 8
1.2. Purpose of the Study 8
1.3. Electrification scenario at rural and urban level 9
1.3.1. Rural Electrification Status 9
1.3.2. Urban Electrification status 10
1.4. Benefits of small scale projects over centralized applications for Rural Electrification 11
1.5. Renewable based decentralized application for Rural Electrification 11
1.6. Project Structuring of the Rural Electrification Projects- Case for PPP structuring 11
1.7. Structure of the report 12
2. Renewable Energy Sector Overview 13
2.1. Introduction 13
2.1.1. Overview of current status of electricity demand and supply in India 14
2.2. Major renewable energy policies and regulation in India 16
2.2.1. Electricity Act 2003 (EA 2003) 16
2.2.2. National Electricity Policy 2005 17
2.2.3. National Tariff Policy, 2006 17
2.2.4. National Action Plan for Climate Change (NAPCC) 17
2.2.5. Renewable Energy Certificate (REC) Mechanism 18
2.2.6. FOR policies on renewable energy 18
2.3. Wind power in India 19
2.3.1. Wind power development in India 19
2.3.2. Policy and Regulatory Landscape for wind energy in India 21
2.3.3. Thrust Areas in Wind Sector 25
2.3.4. Issues/Challenges associated with development of wind power projects 27
2.5. Solar power in India 28
2.5.1. Solar power development in India 28
2.5.2. Policy and Regulatory Landscape for solar energy in India 28
2.5.3. Thrust Areas for solar sector 34
2.5.4. Issues/Challenges associated with development of solar power projects 35
2.6. Rural Electrification: A Review of Policy and Regulatory Framework 36
2.6.1. Evolution of Rural Electrification in India 36

Table of contents
2.6.2. Enabling Regulatory Framework: Provisions under E-Act 2003 38
3. Challenges to development of Renewable Energy and RE based Rural Electrification in India 43
3.1.1. Challenges in development of Renewable Energy 43
3.1.2. Challenges in development of RE based Rural Electrification Initiatives 44
4. PPP case studies 46
4.1. Wind project at Curepipe Point, Mauritius 46
4.2. GAIL Wind Power Project in Karnataka and Tamil Nadu 47
4.3. Simran Wind Power Project 49
4.4. Charanka Solar Park, Gujarat 50
4.5. Gandhinagar Photovoltaic Rooftop Programme 53
4.6. The Maharashtra State Power Generation Company Limited (Mahagenco) 56
4.7. Roberto Santos Soccer Stadium, City of Salvador, State of Bahia, Brazil 57
5. Learnings from Case Studies and Determinants for PPP structuring in RE 59
5.1. Learnings from Case Studies 59
5.2. Determinants for PPP structuring in RE sector 59
5.2.1. Technical Issues in Renewable Sector: 60
5.2.2. Legal, Regulatory and Policy Frameworks: 60
5.2.3. Institutional structure established: 60
5.2.4. Commercial, Financial and Economic Issues: 62
6. Proposed Approach for Rural Electrification through PPP in Renewable Energy 63
6.1. Rural Electrification Sector Background 63
6.2. Key Model Element 64
6.3. Project Structuring of proposed Cluster level Grid Interactive RE projects for Rural Electrification 65
6.3.1. Adopting Transfer over Ownership model 65
6.3.2. Suitable Transfer variant for RE project development 65
6.3.3. Adopting DBFOT for RE based Rural Electrification based projects 66
6.3.4. Elements of the proposed implementation structure for Rural Electrification 70
6.3.5. Incorporating best bidding practices 74
7. Proposed financial model for a renewable energy based rural electrification PPP structure 76
7.1. Load estimation 76
7.2. Financial analysis 77
7.2.1. Sensitivity analysis 78
7.3. Support required for pilot projects 79
7.4. Replicable potential and funds required for scheme 83
7.5. Zero VGF case 84

Table of contents
8. Way Forward 86
Annexure: A few other case studies- PPP in Wind & Solar 88

Introduction
1. Introduction
1.1. Background
There has been substantial capacity addition over the last six decades and yet, demand has constantly been
outstripping supply. This can be attributed to the energy and peak shortages caused by the rapid economic
growth, urbanisation and a growing population. As per CEA estimates, diesel-based captive generation which
constitutes 20% of the present grid connected capacity bridges the deficit. In addition to peak shortage, the
electricity spread is an equally serious issue. About 40% of the population has little or no access to commercial
energy , while with the rest face insufficient and erratic power supply coupled with an increasing amount
unscheduled load shedding.
Despite low per capita GHG emissions, by virtue of its size and accelerating growth rates, India will majorly
influence global energy investments and carbon trajectories. Census 2011 reveals that 93% of the urban
population uses electricity for lighting. This population being relatively economically well off, even has access to
diesel-based generator sets as a back-up solution to the irregular grid based power supply. However, a majority
of the rural population still depends on kerosene for their lighting requirements. This greatly hampers
productivity and limits their scope of work, ultimately crippling overall development.
In summary, while India has a total power supply installed capacity of around 250 GW, only around 135 GW of
this actually caters to the demand due to a range of issues whether lack of fuel, stranded assets, inefficient old
assets, etc. Given that per capita power consumption in India is only at around 950 kilo watt-hour (kWh), and
would need to increase to global levels (China at 4000 kWh; western nations at 15,000 kWh), the actual
demand supply deficit in India is likely to be much higher than the current 4% peak electricity shortage. The
Planning Commission’s Working Group for the 12th Plan estimated a total fund requirement for the power
sector alone in the 2012-2017 period, to be around Rs 14 lakh crores. Further, given the major impact of a
growing power sector on the environment, there is a major need for a growth in renewable energy sources and
the Planning Commission estimated investments required (within the total fund requirement above) of Rs
135,100 crores for renewable energy (RE) sources. Finally, given the scale of investments needed, the
requirement for private sector to participate in a major way in development of such projects through modalities
such as public private partnerships (PPPs) becomes critical so as to better leverage funds and efficiencies
1.2. Purpose of the Study
While various initiatives such as RGGVY, aimed at expanding grid connectivity are underway, the actual supply
still remains highly unpredictable and limited. In remote areas with a low population density, off-grid energy
solutions seem most practical and economical. However, most off-grid solutions, due to their size will need to
drive energy from renewable sources such as biomass, solar, hydro or wind. There is also an element of
uncertainty attached to such off-grid solutions as once there is grid penetration in the area; consumers are
likely to procure the same power at a lower rate.
Given the above backdrop, the Department of Economic Affairs, Ministry of Finance (DEA) has been
supporting the Ministry of New and Renewable Energy (MNRE) in developing possible models and pilot
projects in the RE space utilizing the PPP modality, which can thus provide PPP models for replication in the
sector and thus help achieve the RE capacity development as envisaged.
This analysis has thus been undertaken with this objective, first to briefly analyse the current RE sector and the
learnings from RE schemes and projects underway, and then to develop a possible PPP model or pilot project
structure for a critical area within the RE sector, which would mitigate challenges being seen at present in any
part of the RE arena. The model developed would especially highlight key support required from the

Introduction
Government to make PPPs an attractive and bankable proposition. The model could then be tested through a
pilot project to be developed by the relevant state or central government authorities.
As per our initial analysis, development of affordable, accessible, and reliable energy supply in rural areas is one
of India’s biggest challenges. Despite a series of ambitious programmes such as the RGGVY which solely focus
on rural electrification, most PPP investments still tend to be largely limited to the urban consumer bases with a
better commercial bankability rationale. The actual impact of past government rural electrification programmes
has also been challenged by several aspects such as the definition of the term electrified or providing sufficient
incentives for PPP investments in rural areas. It has been noted in some studies that the actual per capita
consumption in villages in heavily electrified states such as Madhya Pradesh may indeed have gone down
despite the advancements in infrastructure.
While over 93% of urban India uses electricity as its primary source for lighting, only 55% of rural India does
the same leaving the remaining 45% dependent on other sources or with no access to any source at all. Over
25,000 villages are reportedly considered ‘un-electrified’; the actual numbers however, are much higher if
supply patterns are used as a criteria rather than the infrastructural development.
Rural electrification has thus been identified as a key impact area where an RE model undertaken under a PPP
modality and supported by adequate government funds, can lead to measureable, affordable and reliable
increases in electricity supply to the rural population; paving the way for inclusive development of the country.
1.3. Electrification scenario at rural and urban level
1.3.1. Rural Electrification Status
The Indian government considers rural electrification to be the prime mover for rural development. It is also the basic pre-requisite for all industrial activity and also contributes significantly towards increasing agricultural productivity, jobs and income generation activities. Several programmes have been initiated at the national level to promote electrification of remote villages and BPL households through the deployment of various renewable energy technologies that include family biogas plants, solar street lights, solar lanterns, solar PV systems, biomass gasifiers and micro-hydro plants. Several programmes and policies focused on development of rural energy, economy, and electrification to improve rural livelihood with the help of renewable energy have also been initiated. However, inspite of all said interventions, the real numbers are not too convincing.
Source: RGGVY Status, Oct 31 2014
0
20
40
60
80
100
120
AP
Aru
na
cha
l P
rad
esh
Ass
am
Bih
ar
Ch
att
isg
arh
Go
a
Gu
jara
t
Ha
rya
na
HP
J&
K
Jh
ark
ha
nd
Ka
rna
tak
a
Ker
ala
MP
Ma
ha
rash
tra
Ma
nip
ur
Me
gh
ala
ya
Miz
ora
m
Na
ga
lan
d
Od
ish
a
Pu
nja
b
Ra
jast
ha
n
Sik
kim TN
Tri
pu
ra UP
Utt
ara
kh
an
d
We
st B
eng
al
%
Villages electrified across states

Introduction
Source: Census 2011
1.3.2. Urban Electrification status
Currently, 93% urban households use electricity for lighting. Energy access in the urban areas has attained a
satisfactory level but peak power shortage mandates the employment of prudent grid management approaches.
Source: Census 2011
Further, due to wide disparity in electricity usage across households in urban and rural areas, it is important to
improve energy access in the far flung rural zones. In addition, the hamlets or other small settlements that
surround villages which have been electrified under the RGGVY have no access to grid electricity. This calls for
immediate contemplation regarding innovative approaches that can provide energy access in such areas. In
order to meet the energy requirement, it is necessary to understand the appropriate size of applications that can
be entrusted with the task of providing power.
0.00
20.00
40.00
60.00
80.00
100.00
120.00
%
Rural Households Electrified
0.00
20.00
40.00
60.00
80.00
100.00
120.00
%
Urban household electrified

Introduction
1.4. Benefits of small scale projects over centralized applications for Rural Electrification
Grid coverage in rural areas has considerably increased recently. However, the non-availability of power in
these grids has created a huge demand deficit resulting in severe power shortages. Power availability in grids
can be increased by inserting grid interaction generating assets. These can either be large megawatt plants or
small clustered assets and can assist in meeting the local load requirement.
The larger ones have a higher gestation period. Identifying an appropriate site and seeking the rights for the
site, environmental clearances and power transmissions are among the many challenges in this process.
Moreover, fuel supply for such plants another major impediment.
Small scale projects with reasonable capacity have an edge over such centralised plants. These can be connected
to the grid connected at various points and can energise the grid at the distinct load center. Site identification
and subsequently securing relevant clearances may not be an issue in rural areas. Also, they have a
comparatively low gestation period. Extremely small plants are not economically viable but if they are
reasonably sized and can supply power to a group of villages and hamlets, they are likely to be more sustainable.
This can also help in utilising the local talent, generating more economic activity in the process.
1.5. Renewable based decentralized application for Rural Electrification
Renewable technologies have substantial potential to provide a reliable and secure energy supply as an
alternative to grid extensions or as a supplement to grid power and are therefore suitable for electrification of
rural areas, especially the remote ones that still lack access to modern energy sources like electricity. In India,
locally available, renewable energy sources can go a long way in alleviating the electricity deficit and can play a
prominent role in enhancing energy access. Also, with the increasing thrust that the government is placing on
power from renewable energies, it will be prudent to employ renewable power in developing decentralised
generation assets to plug the rural energy deficit. The government has also promulgated various schemes to this
effect. The JNNSM, for example, encourages the employment of decentralised applications that are solar-based.
Typically, the kilowatt scale of generation assets based on renewable energy has been developed in the
decentralised mode to power villages across certain states. Organisations such as SARAN Power and HUSK
Power have installed biomass-based decentralised gasifier generation sets ranging from 30 to 40Kw. This has
been done across villages in Bihar, following the cluster approach. Even the flagship initiative of the
government of India to electrify villages not covered under RGVVY, typically range in a few kilowatts. The list of
such DDG projects has been provided in the annexure.
Currently operating decentralised plants are facing their own set of challenges. These projects are rendered
redundant once the grid penetrates as the same power supply then becomes available at cheaper rates.
However, grid penetration does not guarantee round the clock power availability. This makes it imperative to
design a plan wherein grid connected kilowatt scale generation assets with a cluster approach can be created in
order to electrify as well as power the rural households.
1.6. Project Structuring of the Rural Electrification Projects- Case for PPP structuring
Considering the fact that small scale renewable projects connected to the grid may prove to be a cornerstone in
rural electrification, it is essential to create a suitable framework under which these projects can be developed.
It is also important to understand that the development of such projects under a government ownership model
will invariably become a difficult proposition. This is because the government will not only be responsible for
the identification of suitable sites and provide necessary clearances, but will also have to create the necessary

Introduction
apparatus for project aggregation, implementation as well as development. This, apart from making the process
extremely complex, will make the monitoring of all these projects rather difficult.
In a PPP on the other hand, the responsibility of the government is only to identify the site, secure clearances
and procure power from generation assets. The private sector will have to employ its expertise in developing
renewable assets as well as contribute towards the overall implementation of the project. It is advisable for
small scale renewable energy based grid connected projects to be established under PPPs which will then sell
the power to local distribution utilities at retail tariffs. Government support through viability gap funding shall
also be provided to ensure its bankability. Certain such solar power projects at the rural level have already been
proposed.
1.7. Structure of the report
In order to achieve the aforementioned objective, a sound understanding of the policy regime which is currently
being pursued to develop solar and wind projects in the country is essential. Additionally, it is important to
comprehend the rural electrification status as well as the surrounding policies aimed at promoting rural
electrification initiatives. Gauging the existing structure of private participation will provide useful insight into
how the level of engagement in solar and wind related PPP models can be increased.

Renewable Energy Sector Overview
2. Renewable Energy Sector Overview
2.1. Introduction
The installed generation capacity in the country has increased from 1,363 MW during 1947 to around 2,54,649
MW by October 2014.
Growth of the Indian power sector
By the end of May 2014, power generation from coal accounted for approximately 60% of the total installed
capacity followed by hydro, gas, renewable and nuclear-based generation that accounted for approximately
16%, 8.84%, 12.82% and 1.87% of the total installed capacity, respectively.
Installed power capacity in India
Region and fuel-wise installed capacity (end of October, 2014)
Region Thermal (MW) Nuclear (MW)
Hydro (MW)
Renewable (MW)
Total(MW)
Coal Gas Diesel
Northern 39481.00 5331.26 12.99 1620 16598.11 5935.77 68979.13
Western 60119.51 10915.41 17.48 1840 7447.50 11271.07 91610.97
Southern 27382.50 4962.78 939.32 1320 11398.03 13784.67 59787.30
Eastern 26527.88 190 17.2 0 4113.12 432.86 31281.06
N. Eastern 60 1208.50 142.74 0 1242 256.67 2909.91
Islands 0 0 70.02 0 0 11.10 81.12
Coal 60.05%
Gas 8.84%
Diesel 0.47%
Nuclear 1.87% Hydro
15.95%
Wind 8.60%
SHP 1.51% Biomass
0.53%
Bagasse Cogen 1.04%
Waste to energy 0.04% SPV
1.08%
Other 12.82%
1897 1914 1947 October
2014 2017
1 MW
Sindanbong
Hydro station
commissioned in
Darjeeling, West
Bengal
50MW Khapoli
Hydro plant in
Maharashtra
Installed capacity:
1,316 MW
Installed capacity:
2,54,649 MW
Additional capacity
of 76,000MW
expected

Renewable Energy Sector Overview
All India 153570.89 22607.95 1199.75 4780 40798.76 31692.14 254649.69 Source: CEA
2.1.1. Overview of current status of electricity demand and supply in India
Despite increase in installed capacity by more than 110 times in 62 years, India is still not in a position to meet
its peak demand as well as energy requirement. The peak power deficit during FY 2001-02 was 12.2%
approximately 9252 MW, however, at the end of FY 2013-14, the peak power deficit decreased to the order of
4.5% and in absolute terms peak deficit clocked at 6103 MW. The figure below presents the status of peak
power required vis-à-vis peak power met during the various periods.
Peak demand status Source: CEA
Similarly, the shortage in terms of energy availability was around 7.5% at the end of FY 2001-02 (39,187 MU)
whereas at the end of FY 2011-12 it reduced to around 4.2%. However, in absolute terms it increased to
42,428MU. As fallout of this situation, the planned and un-planned load shedding measures were required to
be undertaken by most of the Utilities to bridge this demand-supply gap. The figure below presents status of the
year-wise variation of energy requirement and its availability-
0
20000
40000
60000
80000
100000
120000
140000
160000
2008-09 2009-10 2010-11 2011-12 2012-13 2013-14
Peak Demand (MW) Peak Met (MW)

Renewable Energy Sector Overview
Energy demand status Source: CEA
India’s energy usage has been rapidly increasing as a result of economic growth in the last decade; however
India still has one of the lowest per capita consumptions of energy and electricity in the world and many states
face an acute power shortage. Also, the growing energy supply deficit can be further verified and collaborated
with the fact that India has a low per capital energy consumption vis-à-vis China and other Western countries
Country Per Capita consumption (kWh/capita)
China 3298
USA 13246
Russia 6486
India 914
Germany 7081 Source: World Bank & CEA
The power supply position across different regions in the country during October 2014 is plotted below.
Power supply position Source: CEA
0
200000
400000
600000
800000
1000000
1200000
2008-09 2009-10 2010-11 2011-12 2012-13 2013-14
Energy Demand (MU) Energy available (MU)
0%
2%
4%
6%
8%
10%
-5000
0
5000
10000
15000
20000
25000
30000
35000
NR WR SR ER NER
De
fic
it (
%)
MU
Power supply position in October 2014
Energy Requirement (MU) Energy Available (MU)
Energy deficit/surplus (MU) Energy deficit/surplus (%)

Renewable Energy Sector Overview
It may be noted that shortage in both capacity (i.e., MW terms) as well as energy (i.e., in MU terms) is showing
ascending trend. The increasing power shortage may be attributed to the following factors:
Inadequate generation capacity addition
Poor financial position of the distribution utilities
High distribution losses
Transmission capacity constraint
Therefore, there is a growing emphasis to bridge the demand supply gap by supplementing the conventional
energy sources with alternate non-conventional energy sources as well as to decrease the carbon footprint in
energy intensive Indian economy by providing thrust on implementation of alternate energy sources. Next
section highlights major policy initiatives undertaken by the Government of India for promotion of renewable
energy in India.
2.2. Major renewable energy policies and regulation in India
2.2.1. Electricity Act 2003 (EA 2003)
The Electricity Act 2003 (EA 2003) has radically changed the legal and regulatory framework concerning the RE sector. EA 2003 was passed by both houses of the Parliament and made effective from 10 June 2003, making it the single most important piece of legislation for the sector and effectively nullifying all earlier enactments. EA 2003 provides for policy formulation by the Indian government and mandates SERCs to take steps for promoting renewable and non-conventional sources of energy within their area of jurisdiction. Further, it has explicitly stated the formulation of National Electricity Policy (NEP), the National Tariff Policy (NTP) and the plan thereof for development of power systems in order to ensure optimal utilisation of all resources including the renewable ones.
Extract from relevant sections of the EA 2003
Section 3 The central government shall, from time to time, prepare the NEP and NTP, in consultation with the state governments and the authority for development of the power system based on optimal utilisation of resources such as coal, natural gas, nuclear substances or materials, hydro and renewable sources of energy.
Section 4 The central government shall, after consultation with the state governments, prepare and notify a national policy, permitting stand alone systems (including those based on renewable sources of energy and non-conventional sources of energy) for rural areas.
Section 61(h)
The appropriate commission shall, subject to the provisions of this Act, specify the terms and conditions for the determination of tariff, and in doing so, shall be guided by the following, namely:
…
(h) the promotion of co-generation and generation of electricity from renewable sources of energy;
…
Section 86(1)(e)
The state commission shall discharge following functions, namely:
…
(e) promote co-generation and generation of electricity from renewable sources of energy by providing suitable measures for connectivity with grid and sale of electricity to any person, and also specify, for purchase of electricity from such sources, a percentage of total consumption of electricity in the area of distribution licensee
…

Renewable Energy Sector Overview
2.2.2. National Electricity Policy 2005
Significant regulatory developments have taken place since the notification of the NEP 2005 by the central
government. Its various provisions reinforce the need for harnessing RE generation.
NEP 2005 provisions
5.2.20 Feasible potential of non-conventional energy resources, mainly small hydro, wind and bio-mass would also need to be exploited fully to create additional power generation capacity. With a view to increase the overall share of nonconventional energy sources in the electricity mix, efforts will be made to encourage private sector participation through suitable promotional measures.
5.12.1 Non-conventional sources of energy being the most environment friendly, there is an urgent need to promote generation of electricity based on such sources of energy. For this purpose, efforts need to be made to reduce the capital cost of projects based on nonconventional and renewable sources of energy. Cost of energy can also be reduced by promoting competition within such projects. At the same time, adequate promotional measures would also have to be taken for development of technologies and a sustained growth of these sources.
5.12.2 The Electricity Act 2003 provides that co-generation and generation of electricity from non-conventional sources would be promoted by the SERCs by providing suitable measures for connectivity with grid and sale of electricity to any person and also by specifying, for purchase of electricity from such sources, a percentage of the total consumption of electricity in the area of a distribution licensee. Such percentage for purchase of power from non-conventional sources should be made applicable for the tariffs to be determined by the SERCs at the earliest. Progressively, the share of electricity from non-conventional sources would need to be increased as prescribed by SERCs. Such purchase by distribution companies shall be through competitive bidding process. Considering the fact that it will take some time before nonconventional technologies compete in terms of cost with conventional sources, the commission may determine an appropriate differential in prices to promote these technologies.
2.2.3. National Tariff Policy, 2006
As per the NTP 2006, it will take some time before the non-conventional technologies can compete with
conventional sources in terms of electricity cost. Therefore, procurement by the distribution companies can be
done at preferential tariffs determined by the appropriate state commission.
NTP 2006 provisions
6.4 (1) the appropriate commission shall fix a minimum percentage for purchase of energy from such sources taking into account availability of such resources in the region and its impact on retail tariffs....
6.4 (2) .... such procurement by distribution licensees for future requirement shall be done as far as possible through competitive bidding process under section 63 of the Act within the suppliers offering energy from same type of non conventional sources.
2.2.4. National Action Plan for Climate Change (NAPCC)
The NAPCC, announced by the prime minister of India on 30 June 2008, envisages several measures to address
global warming. One of the important measures identified involves increasing the share of RE in total electricity
consumption. It has set a target of 5% RE purchase for FY 2009-10, with an increase of 1% in target each year
for the next 10 years.

Renewable Energy Sector Overview
NAPCC provisions
4.2.2 The EA 2003 and the NTP 2006 provide for both the Central Electricity Regulatory Commission (CERC) and the State Electricity Regulatory Commission (SERC) to prescribe a certain percentage of total power purchase by the grid from renewable based sources. It also prescribes that a preferential tariff may be followed for renewables based power.
A dynamic minimum renewable purchase standard (DMRPS) may be set, with escalation each year till a pre-defined level is reached, at which time the requirements may be revisited. It is suggested that starting 2009-10, the national renewables standard (excluding hydropower with storage capacity in excess of daily peaking capacity, or based on agriculture based renewables sources that are used for human food) may be set at 5% of total grids purchase, to increase by 1% each year for 10 years. SERCs may set at higher percentages than this minimum at each point in time.
2.2.5. Renewable Energy Certificate (REC) Mechanism
The existing legal framework under EA 2003 makes the SERCs for promotion of renewable energy. As a result,
the SERCs set targets for distribution companies to purchase a certain percentage of their total power
requirement known as Renewable Purchase Obligation (RPO) from renewable energy sources. Scheduling
requirements and prohibitive long-term open access charges, however, pose major barriers for the RE abundant
states to undertake any inter-state sale of their surplus to states that do not have sufficient RE-based power.
Consequently, states with lower RE potential have to maintain a low RPO target. In addition, unit cost of the RE
based non-firm power is higher than the conventional power sources.
As a result, while the RE abundant states have no motivation to produce more than what is required to satisfy
their RPO mandate, states with lesser RE resources are unable to procure any from others. A mechanism that
will recognise and enable inter-state RE transactions is the need of the hour.
The REC mechanism seeks to address this mismatch. So far, the inter-state exchange of renewable energy has
been constrained as all such transactions are governed by inter-state open access regulations and the regional
energy accounting framework, which necessitates scheduling of power. Some RE sources such as biomass or
bagasse based co-generation can be scheduled and inter-state open access transactions based on such firm RE
sources have taken place in the past. However, the inter-state exchange of power based on non-firm RE sources
such as wind energy, solar power, small hydro power, etc, has been constrained. Besides, the cost of open access
wheeling under a long-term arrangement was prohibitive for such non-firm RE sources due to their inherent
lower capacity utilization. The REC mechanism addresses these constraints as the certificate is issued for
energy generated at the point of injection into the grid. It is envisaged that it shall facilitate the emergence of a
large number of cross-border RE transactions based on non-firm RE sources, while at the same time, enhancing
the volume of cross-border RE transactions based on firm RE sources as well.
2.2.6. FOR policies on renewable energy
The Forum of Regulators (FOR) constituted under section 166 of EA 2003, for harmonising the policies across
the regulatory commissions, has published a report titles ‘Policies on Renewables’ with the objective of evolving
a common approach to the promotion of renewable sources of energy in the country as a whole.
Excerpts from FOR renewable energy policies
Each state commission may specify a minimum RPO of 5% in line with the NAPCC. RPO should be
calibrated with regard to the energy input in the system, after adjustment of losses and not on
energy billed.
Need for a facilitative framework for grid connectivity and inter-state exchange of power generated
from RE sources.

Renewable Energy Sector Overview
Need to develop Renewable Energy Certificate (REC) mechanism for achieving the RPO targets.
Preferential tariff for renewable sources should be specified at least during their loan tenure,
subsequent to which, they should be encouraged to compete amongst themselves.
Generation based incentive (GBI) should be declared upfront to enable the regulatory commission
to factor it in the tariff determination process.
Each state commission may specify a minimum RPO of 5% in line with the NAPCC. RPO should be
calibrated with regard to the energy input in the system, after adjustment of losses and not on
energy billed.
2.3. Wind power in India
2.3.1. Wind power development in India
The growth of wind power sector in India can be grouped into three phases of development:
Period before 1994-95
Era between 1995 and 2003 (With Central Government policy support and prior to EA 2003)
Period after 2003 (Post enactment of Electricity Act 2003)
2.3.1.1. Period before 1994-95
This period can be described as the passive period in the Indian power sector. The control of the entire sector
was in the hands of public sector. During this period, the focus of the government was to make electricity
available for all but without private sector involvement, the sector remains dormant. The demand-supply gap
rose, losses in the sector were considerably high and the sector was becoming increasing unviable for public
utilities to operate. Renewable energy investments were considerably low during the period as the country. At
that time, the renewable energy sector was not aligned with global environment concerns.
There was huge pressure on government budget to increase investment in power sector. It was during this
period, that the country was moving from a closed to open (market based) economy and paradigm shift led to
opening up of power sector to accelerate investments and development in the sector.
2.3.1.2. Period between 1994-95 and 2003 (With Central Government policy support and prior to EA 2003)
During this period, the renewable energy sector in general and the wind power sector in particular, registered
significant growth in terms of capacity addition. The installed capacity of wind generation increased from 115
MW at the beginning of FY 1994-95 to 1,868 MW at the end of FY 2002-03.
During this phase, significant wind capacity addition took place in the State of Tamil Nadu, which had more
than 50% share (990 MW) in the total installed capacity of 1,868 MW, at the end of FY 2002-03. Most of the
wind turbines installed during this phase were of 225-500 KW capacity configuration and it was during this
growth phase that the manufacturing of wind turbines also started in India. Many multi-national players
including Vestas, NEG, and Enercon set up their manufacturing facilities in collaboration with local
manufacturers. This era also saw the birth of the largest domestic wind turbine manufacturing company, viz.,
Suzlon Energy Limited.
The growth during this phase was driven by the policy support provided by the central and state governments.
The Ministry of Non-Conventional Energy (re-christened as MNRE in 2006) of central government provided
various fiscal and financial incentives, viz., capital subsidy, tax holiday, buy-back rate, concessional
wheeling & banking charges, and accelerated depreciation.

Renewable Energy Sector Overview
The State Governments also encouraged wind capacity addition programs by providing support in the form of
concessional land allotment, electricity duty exemption and schemes for exemption or deferment of sales tax for
the industry. The wind resource development and R&D programs by Centre for Wind Energy Technology (C-
WET) laid down the foundation for growth of wind sector in the future years.
2.3.1.3. Period after 2003 (Post enactment of Electricity Act 2003)
This phase can be termed as golden phase in the history of wind sector. During the past 9 years, the installed
WTG capacity has increased from 1,868 MW at the beginning of FY 2003-04 to 21,134 MW at the end of March,
2014 registering a compounded annual growth rate (CAGR) of about 24%. The year-wise wind capacity addition
is shown in the following figure:
Growth of wind energy capacity in India Source: MNRE, March 2014
During this short span of 9 years, wind technology has emerged as a matured technology amongst various types
of renewable energy technologies. It contributes over 8% of total generation capacity while its share amongst
various renewable energy based installations constitutes over 70%. The legal clarity and certainty of regulatory
principles with formulation and enunciation of Electricity Act, 2003 together with conducive policy framework
has ensured continued interests by a number of developers in wind sector; which has ultimately resulted into
significant growth in harnessing wind energy across various States.
0.00
500.00
1000.00
1500.00
2000.00
2500.00
3000.00
3500.00
0
5000
10000
15000
20000
25000
20
01-
02
20
02
-03
20
03
-04
20
04
-05
20
05
-06
20
06
-07
20
07
-08
20
08
-09
20
09
-10
20
10-1
1
20
11-1
2
20
12-1
3
20
13-1
4
MW
MW
Cumulative Capacity & Y-O-Y Capacity Addition
Cum.Capacity (MW) Cap.Addition (MW)
Renewable Energy Sector Overview
2.3.2. Policy and Regulatory Landscape for wind energy in India
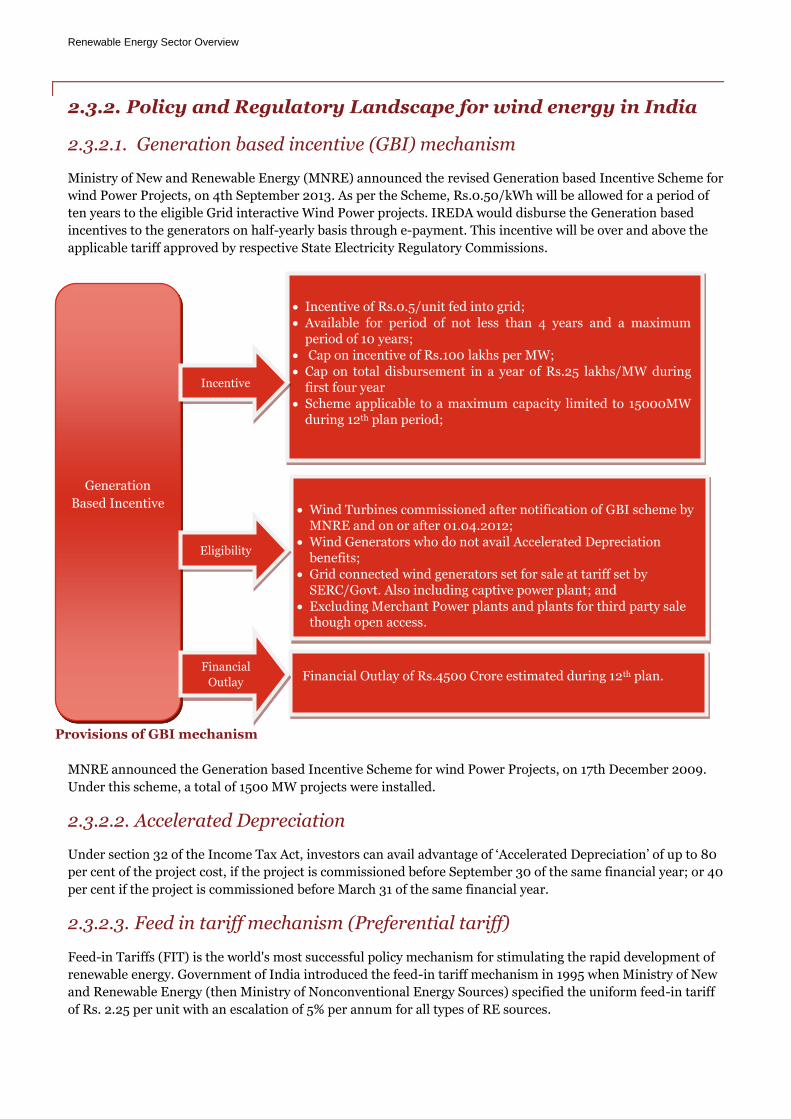
2.3.2.1. Generation based incentive (GBI) mechanism
Ministry of New and Renewable Energy (MNRE) announced the revised Generation based Incentive Scheme for
wind Power Projects, on 4th September 2013. As per the Scheme, Rs.0.50/kWh will be allowed for a period of
ten years to the eligible Grid interactive Wind Power projects. IREDA would disburse the Generation based
incentives to the generators on half-yearly basis through e-payment. This incentive will be over and above the
applicable tariff approved by respective State Electricity Regulatory Commissions.
MNRE announced the Generation based Incentive Scheme for wind Power Projects, on 17th December 2009.
Under this scheme, a total of 1500 MW projects were installed.
2.3.2.2. Accelerated Depreciation
Under section 32 of the Income Tax Act, investors can avail advantage of ‘Accelerated Depreciation’ of up to 80
per cent of the project cost, if the project is commissioned before September 30 of the same financial year; or 40
per cent if the project is commissioned before March 31 of the same financial year.
2.3.2.3. Feed in tariff mechanism (Preferential tariff)
Feed-in Tariffs (FIT) is the world's most successful policy mechanism for stimulating the rapid development of
renewable energy. Government of India introduced the feed-in tariff mechanism in 1995 when Ministry of New
and Renewable Energy (then Ministry of Nonconventional Energy Sources) specified the uniform feed-in tariff
of Rs. 2.25 per unit with an escalation of 5% per annum for all types of RE sources.
Generation
Based Incentive
Incentive of Rs.0.5/unit fed into grid;
Available for period of not less than 4 years and a maximum period of 10 years;
Cap on incentive of Rs.100 lakhs per MW;
Cap on total disbursement in a year of Rs.25 lakhs/MW during first four year
Scheme applicable to a maximum capacity limited to 15000MW during 12th plan period;
Wind Turbines commissioned after notification of GBI scheme by MNRE and on or after 01.04.2012;
Wind Generators who do not avail Accelerated Depreciation benefits;
Grid connected wind generators set for sale at tariff set by SERC/Govt. Also including captive power plant; and
Excluding Merchant Power plants and plants for third party sale though open access.
Financial Outlay of Rs.4500 Crore estimated during 12th plan.
Incentive
Eligibility
Financial
Outlay
Provisions of GBI mechanism

Renewable Energy Sector Overview
2.3.2.3.1. Preferential tariff for inter -state renewable projects
In the exercise of powers conferred under Section 61(h) and 178(2) of the Electricity Act, 2003, Central
Electricity Regulatory Commission has notified the “CERC (Terms and Conditions for Tariff determination
from Renewable Energy Sources) Regulation 2012”, which lays down the normative principles for
determination of preferential tariffs for renewable energy technology. CERC has classified wind power projects
into five categories based on wind zones and corresponding CUF has been allowed based on annual mean
power density, which is measured at 50 meter hub height.
The aforementioned regulation provides regulatory clarity and tariff certainty to the investors who have evinced
interest in developing renewable projects on inter-state basis. Also, these regulations serve as the guideline
for other State Electricity Regulatory Commissions (SERCs) to frame and establish renewable specific
regulations across their respective states. Further, these regulations act instrumental in deciding the tariff for
individual renewable energy technology.
The salient features of the regulations pertaining to wind energy are mentioned below.
Features of CERC RE Tariff Regulation 2012
Item Description Provision in the Regulation
General Principles
Eligibility Criteria Located at the wind sites having minimum annual mean Wind Power Density (WPD) of 200 Watt/m2 measured at hub height of 50 meters and using new wind turbine generators
Control Period Three (3) Years
Tariff Period 13 years
Tariff Structure Single part Tariff: Single part fixed charge shall have the following components:
(a) Return on equity;
(b) Interest on loan capital;
(c) Depreciation;
(d) Interest on working capital;
(e) Operation and maintenance expenses
Tariff Design The generic tariff shall be on levellised basis for the Tariff
Period
Financial Principles
Capital Cost 575 lakh/MW
Discount Factor Weighted Average Cost of Capital
Debt Equity ratio 70:30
Loan and Finance Charges
Loan Tenure-12 years
Interest rate a) Average long term prime lending rate (LTPLR) of SBI prevalent during the first six months of previous year plus 300 basis points
b) Repayment of loan shall be considered from the first year of COD
Return on Equity(RoE) 20% for the first ten years and 24% from eleventh year onward over the balance useful life of the asset
Depreciation a) Value base shall be Capital cost of asset
b) 5.83% for the first 12 years and the rate of depreciation from the

Renewable Energy Sector Overview
Item Description Provision in the Regulation
13th year onwards has been spread over the balance useful life of the asset
Interest on Working Capital
For Wind:
a) O&M for 1 month;
b) Receivables for 2 months of energy charge on normative CUF
c) Maintenance spare @ 15% of O&M expense
Operation and Maintenance Expense
9 lakh/MW for 2012-13 escalated at 5.72% per annum over the first year of control period
Rebate For payment of bills through letter of credit, a rebate of
2% allowed
Payments made other than through letter of credit within 1 month from the date of presentation of bills by the generating company, a rebate of 1% allowed.
Late payment surcharge Delay beyond a period of 60 days from the date of billing
attracts late payment surcharge of 1.25% per month
Sharing of CDM benefits 100% of the gross proceeds to be retained by the developer in the first year;
In the second year, the share of the beneficiaries shall be 10% which shall be progressively increased by 10% every year till it reaches 50%, where after the proceeds shall be shared in equal proportion, by the generating company
Subsidy or incentive Generation based incentive shall be factored in while determining tariff
Taxes and Duties Taxes and duties shall be pass through on actual incurred
basis
Source: CERC
2.3.2.3.2. CERC Tariff Order of Wind Power for 2014-15
Following the stipulation of the CERC RE Tariff Regulation 2012, CERC under its dispensation mandated the RE Tariff Order 2014-15 which defined the financial, operational and other technology specific norms for determining the tariff of wind power projects commissioned during 2014-15. The main defining parameters for wind power projects under the aforementioned tariff order are as follows:

Renewable Energy Sector Overview
CERC wind tariff assumptions 2014-15
Assumption Head Specification
Useful Life 25 years
Tariff Period 13 years
Capital Cost Rs.603 lakhs/MW
Debt: Equity 70:30
Interest Rate 12.70%
Return on Equity (pre-tax) Return on Equity for first 10 years: 20% Return on Equity 11th year onwards: 24%
Depreciation Depreciation Rate for first 12 years: 5.83% Depreciation Rate 13th year onwards: 1.54%
O&M Cost (Base year- FY 15) Rs.10.05 lakh/MW; Escalation: 5.72% YoY
CUF Wind zone - 1 (Upto 200 W/m2)- 20% Wind zone - 2 (201 - 250 W/m2)- 22% Wind zone - 3 (251 - 300 W/m2)- 25% Wind zone - 4 (301 - 400 W/m2)- 30% Wind zone - 5 (Above 400 W/m2)-32%
Applicable Tariff Wind Zone Tariff (Rs/ kWh)
Tariff with AD Benefit (Rs/ kWh)
1 6.34 6.01
2 5.77 5.47
3 5.08 4.81
4 4.23 4.01
5 3.97 3.76
2.3.2.3.3. Preferential tariff for intra -state renewable projects
The National Tariff Policy, enacted pursuant to Section 3 of Electricity Act, 2003 provided for preferential tariff
determination by the State Electricity Regulatory Commissions for different types of renewable energy after
taking into account the potential of RE sources and the impact on retail tariffs to be recovered from the retail
consumers. Since then, over a period of time, 18 SERCs, in order to encourage deployment of wind energy and
to provide certainty to the investors, have notified generic tariffs for wind energy resources available in their
respective States on normative basis. The existing wind energy tariffs prevalent across selected wind rich states
have been tabulated below:
Wind Energy Tariffs across states
State SERC Approved CUF Tariff (Rs./kWh)
Andhra Pradesh 23% 4.70
Gujarat 24% 4.15
Karnataka 26.5% 4.2
Maharashtra Wind Zone 1: 20% Wind Zone 2: 23% Wind Zone 3: 27% Wind Zone 4: 30%
Wind Zone 1: 5.81 Wind Zone 2: 5.05 Wind Zone 3: 4.31 Wind Zone 4: 3.88
Madhya Pradesh 22.5% 5.92
Rajasthan Zone 1: 21% Zone 2: 20%
5.46 (Barmer, Jaisalmer) 5.73 (Other Districts)
Tamil Nadu 27.15% 3.51 Source: Tariff Order of the states
2.3.2.4. Draft National Wind Mission
National Wind Mission proposes to create an enabling policy framework that minimizes the risk and cost of the
wind power deployment while sharing such reduced costs and risks appropriately amongst all the stakeholders

Renewable Energy Sector Overview
of the wind industry. The mission proposes to achieve 100,000 MW of utility scale wind installations in the
country and 1000MW of distributed wind power by the end of 13th five year plan (end of 2022). The planned
capacity addition targets under the proposed mission are as follows:
National wind mission targets
Wind power category Phase 1 (2012-17) Phase 2 (2017-22)
Utility scale on-shore wind 20,000 MW 50,000 MW
Off-shore wind 1000 MW 10,000 MW
Distributed power 100 MW 1000 MW
In order to achieve the above targets, the Mission will plan to implement specific policy interventions in a time
bound manner. The contours of the enabling policy framework would include:
Investment grade wind zone development and transmission planning by 2015.
Development of project/land allocation framework
GBI support to be provided during the Phase 1 of the mission over the existing tariffs proposed by SERCs. Following the review of capacity addition during this phase, this policy impetus would be withdrawn.
Provision of Accelerated Depreciation (AD) for repowering projects during phase I
Continuation of RPOs
High level planning for grid integration
Support to indigenous manufacturing particularly by providing interest subsidies on manufacturing of high grade turbines.
2.3.2.5. Tax benefits
The tax benefits offered by the central government for wind power can be classified under two categories-
Tax benefits under direct taxes; and
Tax benefits under indirect taxes.
Direct tax benefits include-.
Income Tax Holiday : Under section 80-IA, wind power project developers are exempted from income tax on all earnings generated from the wind power project for period of 10 consecutive assessment years, during the first 15 years of the project life. The book profit from such undertaking, however, would attract Minimum Alternate Tax at 18.5 per cent (excluding surcharge and education cess) of book profit.
Indirect tax benefits include-
Concessional Custom Duty on wind turbine components forming part of the project cost of wind project;
Exemption in Excise Duty on wind turbine components forming part of the project cost of wind project; and
Exemption in Central Sales Tax and General Sales Tax on sale of renewable energy components particularly component forming part wind turbines resulting in reduction of wind equipment and component cost;
2.3.3. Thrust Areas in Wind Sector
2.3.3.1. On-Shore Wind Projects
Investment in the On shore wind power projects will continue to have lions share among all the categories of
wind power generating installations. The growth of the on-shore wind market would be spearheaded by
investments in the Independent Power Producer (IPP) model and accelerated depreciation benefit driven/
captive power model.

Renewable Energy Sector Overview
2.3.3.1.1. Captive/Accelerated Depreciation benefit driven model
More investments would be committed by power-intensive manufacturing companies such as textile industrial
units, cement manufacturing entities, steel and automobile industrial units, in order to meet their captive
consumption and avail tax benefit through accelerated depreciation. Also small scale investors would be
committing investment in wind turbines to avail accelerated depreciation benefits to minimise their income tax
liabilities.
2.3.3.1.2. Independent Power Producer (IPP) Model
The major drivers for an IPP based investment will be the conducive regulatory and policy environment, policy
initiatives such as Generation Based Incentive (GBI) and regulatory initiatives, RPS/RPO, Feed-in tariff regime
and introduction of market instruments such as RECs etc. Besides, the increasing power demand and the
mounting pressure on account climate change imperatives, leads to a definite growth potential for the wind
energy sector and this shall attract IPPs to invest in wind power plants in India.
Indian wind energy market is a matured market in the world. Further, Indian market has access to proven
technology and skill-set. Thus, IPPs have a much less riskier investment option at ground. Further, IPPs are
today placed with choice of revenue models including options with multiple revenue streams. With the right
kind of strategy mix and with the choice of the right revenue model, impressive returns for the investments
could be ensured. Overall, the IPP model is looked at as an investment with a better investment economics.
2.3.3.2. Off-Shore Wind Power projects
Suzlon has preliminary estimates of India’s offshore wind potential at 25,000 MW. In November 2010, the
secretary of MNRE had announced that a study was being undertaken with the help of CWET to ascertain the
feasibility of setting up offshore wind farms in India, with 2 pilot projects in Tamil Nadu and Gujarat. MNRE’s
initial feasibility study is expected to take at least 2-3 years. C-WET has also invited technical inputs from
world’s leading wind energy companies. The data from the companies would help C-WET to understand the
soil conditions in the seabed and the different structural features required for offshore wind turbines. Recent
news reports have also claimed that Indian govt. may enlist the help of ONGC in surveying offshore wind
potential in India and setting up two wind farms at sea.
In a bid to address the issues emanating while development of off-shore wind power projects in India, the
Central issued the ‘Off-Shore wind policy, 2013’.
2.3.3.2.1. Draft Off-Shore Wind Policy, 2013
The salient features of the policy have been covered below:
Preliminary Resource Assessment and demarcation of blocks.
EIA study of proposed wind farms regarding aquatic life, fishing etc., studies relating to navigation, undersea mining and related exploration/exploitation activities and other users of the sea.
Oceanographic studies - to determine construction costs for special foundations, special ships for both operation and maintenance requirements.
Developing Sea Bed Lease Arrangement.
Providing Single Window Procedure for Statutory Approvals (NOWA).
Developing framework for Grid Connectivity and Evacuation of Power
Devising Fiscal and Monetary Incentives
Establishing Security & Confidentiality of data collected during studies and surveys

Renewable Energy Sector Overview
2.3.4. Issues/Challenges associated with development of wind power projects
The present stage of wind power development is a matter of trepidation. Being highly infirm with poor
predictability, states utilities are increasingly finding it difficult to absorb higher quantum of wind power
without any linkages from load demand, power evacuation planning and other host of issues. Prominent issues
regarding the development of wind power has been illustrated below:
Challenges with development of wind power projects
Item Description Description
Wind power evacuation
Wind resource rich states are finding it financially difficult to create power evacuation infrastructure for the existing and also for the future installations. They are already burdened with the high quantum of infirm wind power, which cannot be scheduled.
Expenditure on creating power evacuation facility is the additional investment that the wind resource rich States have to incur. Now instead of going for speedy deployment plans the States have started reducing or freezing their purchase obligations and request have started pouring in to MNRE to meet the cost on power evacuation infrastructure.
Another important issue associated with wind evacuation is ensuring the grid stability while inter-connecting wind power to the grid. Owing to the intermittent nature of the wind power, adoption of spinning reserves needs to be provided.
Land for wind power getting cartelised
Potential wind sites have been cornered in bulk by some developers/ manufactures. It is a form of cartelization and monopolistic behavior, where the buyer cannot exercise his/her choice in selecting design and make of wind machine that are compelled to go for the machine make that the land owner company has. It has resulted into sub-optimal market development and has decelerated the process of cost reduction
Re-powering wind installations have not come up
No encouraging policy framework for giving thrust to re-powering.
Off-shore wind installations have not been initiated
No clarity on the policy and regulatory framework in order to support off-shore wind installations.
High cost of debt High cost of debt is the major cause of concern. Owing to intermittent nature of the wind projects, the revenue streams from such projects are not guaranteed which makes the lenders uncomfortable.

Renewable Energy Sector Overview
2.5. Solar power in India
India lies in the high solar insolation region, endowed with huge
solar energy potential, with most of the country having about
300 sunny days per year with annual mean daily global solar
radiation in the range of 5-7 kWh/sq m/day. The government
has introduced enabling policy initiatives for the solar power
generation sector in order to fulfil the growing demand for
power generation in the country.
2.5.1. Solar power development in India
The grid interactive solar power as of December 2010 was
merely 10 MW. However, most of the capacity addition in India
has happened in last three years, driven by series of incentives
and support extended by state and federal governments.
Realising the presence of abundant solar potential in the
country, slew of policy and enabling regulatory measures were
promulgated and therefore, till date 2765 MW of grid interactive
solar capacity is commissioned in country.
Solar development in India
Recognizing the immense potential and taking measures for scaling up solar has eventually lead to identification of viable business opportunities that can be tapped by both public and private sector in the near and medium term future.
2.5.2. Policy and Regulatory Landscape for solar energy in India
2.5.2.1. Jawaharlal Nehru National Solar Mission (JNNSM)
Launched by the Government of India in January 2010, JNNSM is one of the major global initiatives in promotion of solar energy technologies. The mission has a twin objective - to contribute to India's long term energy security as well as its ecological security. The JNNSM would be implemented in 3 stages and aims to have an installed capacity of 20,000 MW by the end of the 13th Five Year Plan in 2022. It is envisaged that as a
0
500
1000
1500
2000
2500
3000
2007-08 2008-09 2009-10 2010-11 2011-12 2012-13 2013-14
Capacity (MW)
Promulgation of
JNNSM, CERC RE
Tariff Regulation,
Gujarat Solar Policy
Projects bid out
and allotment
under JNNSM Allotment
under
solar park
Capacity
addition
under state
policies
Solar map of India

Renewable Energy Sector Overview
result of rapid scale up as well as technological developments, the price of solar power will attain parity with grid power at the end of the Mission, enabling accelerated and large-scale expansion thereafter. The mission includes a major initiative for promoting solar photovoltaic (PV) applications. Under First Phase of JNNSM to be implemented between 1st April 2010 and 31st March 2013; 200MW capacity equivalent off grid solar PV systems and 7 million square meter solar thermal collector area to be installed in the country. The targets for JNNSM are shown below:
Targets of JNNSM
Application Segment Target for Phase I (2010-13)
Cumulative Target for Phase 2 (2013-17)
Cumulative Target for Phase 3 (2017-22)
Grid solar power (includes large plants, roof top & distribution grid plants)
1,000 MW 100 MW
Min 4,000 MW 20,000 MW
Off-grid solar applications 200 MW 1,000 MW 2,000 MW
Solar Thermal Collectors 7 million sq meters 15 Million sq meters 20 million sq meters
The National Solar Mission is a thus a major initiative of the Government of India and State Governments to
promote ecologically sustainable growth while addressing India’s energy security challenge.
2.5.2.1.1. NSM (Phase I)
In order to facilitate grid connected solar power generation in the first phase, a mechanism of “bundling” relatively expensive solar power with power from the unallocated quota of power generated at NTPC coal based stations, which is relatively cheaper, was proposed by the Mission. This “bundled power” would be sold to the Distribution Utilities to reduce the cost of procuring solar power.
The Bidding process under the first phase of the National Solar Mission was split into two batches with the understanding that this circumspect approach would leave enough room for rectification if some flaws or shortcomings that may emerge in the first batch of bidding. The following table gives a snapshot of the bidding outcome of both the batches of Phase-I:
Bidding outcome of Phase-I of JNNSM
Capacity Allocated Benchmark Tariff Tariff Range Average Tariff
Batch I
Solar PV- 140 MW Rs. 17.91/kWh Rs. 10.95-12.76/kWh Rs. 12.12/kWh
Solar Thermal- 470 MW Rs. 15.31/kWh Rs. 10.49-12.24/kWh Rs. 11.48/kWh
Batch II
Solar PV- 340 MW Rs. 15.39/kWh Rs. 7.49-9.44/kWh Rs. 8.77/kWh
Commissioning Status
1. Migration Projects Under Migration scheme, a total of 16 Solar Power Developers have been selected for 84 MW Solar Projects (54
MW for Solar PV and 30 MW solar thermal. The Scheduled Commission Date
Solar PV – 12 months from signing of PPA, i.e. mid October, 2011.
Solar Thermal – 28 months from signing of PPA, i.e. mid February, 2013. The commissioning status of Migration Solar PV projects (as on January 2013) is tabulated below:
Status of projects under migration scheme
State Solar PV capacity to be commissioned (MW)
PV Capacity actually commissioned (MW)

Renewable Energy Sector Overview
Rajasthan 36 35
Punjab 7 2
Maharashtra 11 11
Total 54 48
2. NSM Batch- I The commissioning status of new grid connected PV projects allotted under Batch I of NSM-Phase 1(as on
January 2014) is tabulated below:
Status of solar PV projects under JNNSM Phase I Batch-I
State Solar PV Capacity to be commissioned as per PPA (MW)
Solar PV Capacity actually commissioned (MW)
Rajasthan 100 100
Uttar Pradesh 5 5
Maharashtra 5 -
Andhra Pradesh 15 10
Karnataka 10 5
Tamil Nadu 5 5
Orissa 5 5
Total 145 130
The commissioning status of new grid connected solar thermal projects allotted under Batch I of NSM-Phase 1
(as on January 2014) is tabulated below:
Status of solar thermal projects under JNNSM Phase I Batch-I
State Solar Thermal Capacity to be commissioned as per PPA (MW)
Solar Thermal Capacity actually commissioned (MW)
Rajasthan 400 50
Andhra Pradesh 50
Gujarat 20
Total 470 50
3. NSM Batch II The commissioning status of new grid connected PV projects allotted under Batch II of NSM-Phase 1 (as on
January 2014) is tabulated below:
Status of solar PV projects under JNNSM Phase I Batch-II
State Solar PV Capacity to be commissioned as per PPA (MW)
Solar PV Capacity actually commissioned (MW)
Rajasthan 280 270
Maharashtra 40 40
Andhra Pradesh 20 20
Tamil Nadu 10
Total 350 330
2.5.2.1.2. NSM Phase II
Solar Energy Corporation of India (SECI), the governing body of the second phase of the National Solar
Mission, released the details of shortlisted project developers on February 25, 2014 for the first batch of this

Renewable Energy Sector Overview
phase, after opening the financial bids on February 21, 2014. The total capacity targeted under this phase is 750
MW and all of the projects will use photovoltaic technology. The winners were the project developers who
sought the minimum possible funds to make their projects viable to sell power to SECI at a tariff of INR
5.45/kWh (INR 4.75/kWh for projects claiming accelerated depreciation) for 25 years. With an objective to
promote local manufacturing, SECI invited bids in two separate categories, reserving half of the projects under
domestic content requirement (DCR) restrictions. INR 18.75 billion was earlier approved for viability gap
funding (VGF) of all the projects under National Solar Mission Phase2 Batch1.
Compared to the results of previous stages, the latest allocation results demonstrate evolution of the utility scale solar landscape in India which has been tabulated below:
Bidding results and mechanism of NSM Phase II Batch I
Particulars Resolution
Managed by SECI
Capacity Allocation PV-750 MW
CSP-Nil
Minimum and Maximum project capacity Min-10MW, Max-100MW
Domestic content requirement Separate bids for 375 MW capacity under DCR
category and remaining 375 MW under open category
Policy mechanism Funding support by the government (VGF) to make
projects viable at INR 5.45/kWh tariff (INR 4.75/kWh
for projects claiming accelerated depreciation)
Allocation method Reverse bidding for viability gap funding demand.
Maximum VGF: INR 25 million/MW
Commissioning period 13 months
No. of bids submitted 122
Total capacity of bids submitted 2170MW
No of projects selected 47
Range of winning bids DCR: INR 13.5 million/MW - INR 24.56 million/MW.
Open: INR 1.7 million/MW - INR 13.5 million/MW
Weighted average of the winning bid DCR: INR 20.19 million/MW, Open: INR 10.67
million/MW
2.5.2.2. Preferential tariff for inter -state renewable projects
The Central Electricity Regulatory Commission (CERC) exercising its power conferred under Section 61 and
section 178(2) of the Electricity Act, 2003 had notified the CERC (Terms and Conditions for Tariff
determination from Renewable Energy Sources), Regulations, 2012. Applicability of these regulations shall be
confined to Central Sector and Inter State Generation projects, however, under Section 61 of EA 2003; these
regulations would be guiding principles for State Electricity Regulatory Commissions while dealing with the
matters related to energy generation from RE sources. The salient features of the Tariff Regulations applicable
for the Solar Projects are as follows:
Renewable Energy Sector Overview
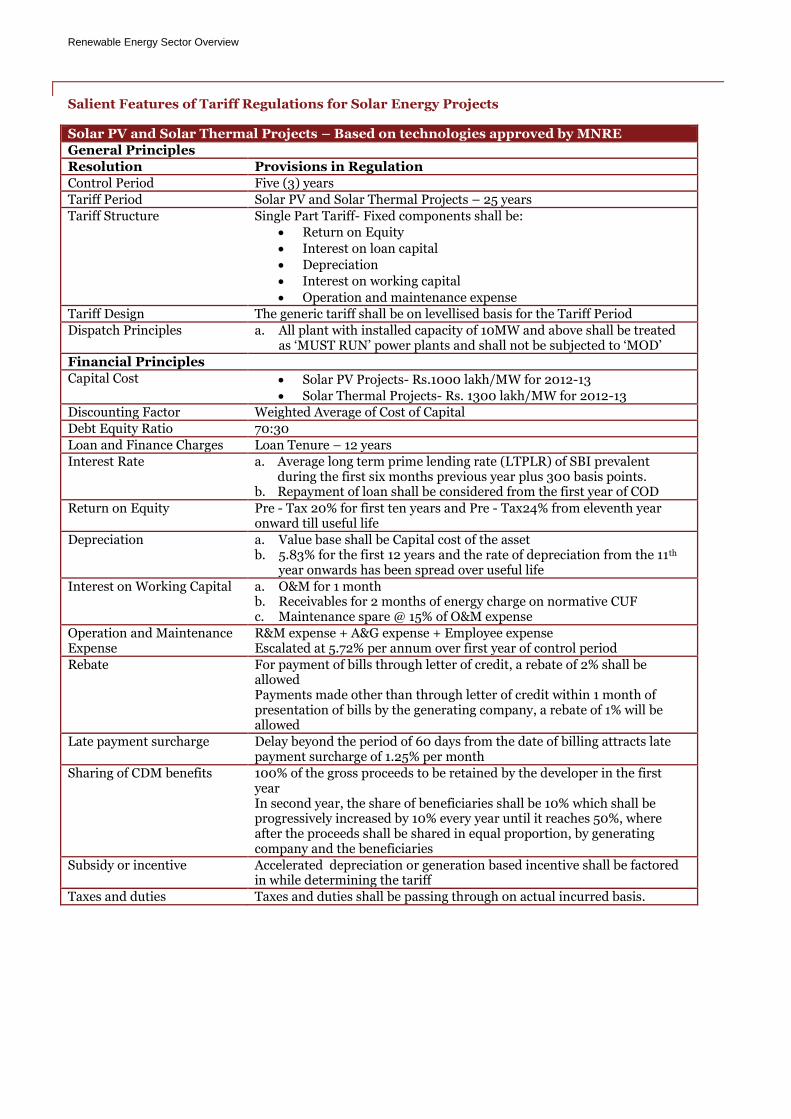
Salient Features of Tariff Regulations for Solar Energy Projects
Solar PV and Solar Thermal Projects – Based on technologies approved by MNRE
General Principles
Resolution Provisions in Regulation
Control Period Five (3) years
Tariff Period Solar PV and Solar Thermal Projects – 25 years
Tariff Structure Single Part Tariff- Fixed components shall be:
Return on Equity
Interest on loan capital
Depreciation
Interest on working capital
Operation and maintenance expense
Tariff Design The generic tariff shall be on levellised basis for the Tariff Period
Dispatch Principles a. All plant with installed capacity of 10MW and above shall be treated as ‘MUST RUN’ power plants and shall not be subjected to ‘MOD’
Financial Principles
Capital Cost Solar PV Projects- Rs.1000 lakh/MW for 2012-13
Solar Thermal Projects- Rs. 1300 lakh/MW for 2012-13
Discounting Factor Weighted Average of Cost of Capital
Debt Equity Ratio 70:30
Loan and Finance Charges Loan Tenure – 12 years
Interest Rate a. Average long term prime lending rate (LTPLR) of SBI prevalent during the first six months previous year plus 300 basis points.
b. Repayment of loan shall be considered from the first year of COD
Return on Equity Pre - Tax 20% for first ten years and Pre - Tax24% from eleventh year onward till useful life
Depreciation a. Value base shall be Capital cost of the asset b. 5.83% for the first 12 years and the rate of depreciation from the 11th
year onwards has been spread over useful life
Interest on Working Capital a. O&M for 1 month b. Receivables for 2 months of energy charge on normative CUF c. Maintenance spare @ 15% of O&M expense
Operation and Maintenance Expense
R&M expense + A&G expense + Employee expense Escalated at 5.72% per annum over first year of control period
Rebate For payment of bills through letter of credit, a rebate of 2% shall be allowed Payments made other than through letter of credit within 1 month of presentation of bills by the generating company, a rebate of 1% will be allowed
Late payment surcharge Delay beyond the period of 60 days from the date of billing attracts late payment surcharge of 1.25% per month
Sharing of CDM benefits 100% of the gross proceeds to be retained by the developer in the first year In second year, the share of beneficiaries shall be 10% which shall be progressively increased by 10% every year until it reaches 50%, where after the proceeds shall be shared in equal proportion, by generating company and the beneficiaries
Subsidy or incentive Accelerated depreciation or generation based incentive shall be factored in while determining the tariff
Taxes and duties Taxes and duties shall be passing through on actual incurred basis.

Renewable Energy Sector Overview
2.5.2.2.1. CERC Tariff Order of Solar Power for 2014-15
Following the stipulation of the CERC RE Tariff Regulation 2012, CERC under its dispensation mandated the RE Tariff Order 2014-15 which defined the financial, operational and other technology specific norms for determining the tariff of solar power projects commissioned during 2014-15. The defining parameters for solar PV power projects under the aforementioned tariff order are as follows:
Assumptions of CERC Tariff Order of Solar PV for 2014-15
Assumption Head Specification
Useful Life 25 years
Tariff Period 15 years
Capital Cost Rs.691 lakhs/MW
Debt: Equity 70:30
Interest Rate 12.70%
Return on Equity (pre-tax) Return on Equity for first 10 years: 20% Return on Equity 11th year onwards: 24%
Depreciation Depreciation Rate for first 12 years: 5.83% Depreciation Rate 13th year onwards: 1.54%
O&M Cost (Base year- FY 15) Rs.12.3 lakh/MW; Escalation: 5.72% YoY
CUF 19%
Applicable Tariff Without AD: Rs. 7.72/ kWh With AD: Rs. 6.95/ kWh
2.5.2.3. CERC IEGC Regulations, 2010 - Analysis of the specific provision
The Central Electricity Regulatory Commission (CERC) exercising its power conferred under Section 79(1) (h)
and section 178(2) (g) of the Electricity Act, 2003 had notified the CERC (Indian Electricity Grid Code),
Regulations, 2010. This code will be applicable to NLDC, RLDC/SLDCs, ISGS, and Distribution
Licensees/SEBs/STUs/regional entities, Power Exchanges and Wind and Solar Generating Stations.
In order to encourage the solar based generation into the electricity grid, the IEGC has given due consideration
for such segment. The Grid Code provides that in case the generation from solar power project deviates from
the schedule the financial burden shall be borne by all the users of the Inter-State Grid, instead of the
concerned solar project developer. The IEGC provides the methodology for rescheduling of solar energy on
three (3) hours and the methodology of compensating the solar energy rich state for dealing with variable
generation through Renewable Regulatory Charge. In pursuance of this, appropriate meters and data
acquisition systems facility shall be provided for accounting of UI charges and transfer of information to SLDC
and RLDC. The provisions of the IEGC shall be applicable from January 1, 2011, for new solar generating plants
with capacity of 5MW and above connected to 33kV and above who have not signed any PPA with States or
others. Some of the key and enabling provisions for solar energy in IEGC are as below,
Provision for Solar Energy under IEGC
Provisions in IEGC,2010 Description
Special conditions for solar (Reg 5.2(u):System security Aspects
System Operator (SLDC/RLDC) shall make all efforts to evaluate the solar and wind power and treat as a ‘Must Run’ Plant.
System Operator may instruct the solar generator to back down generation on consideration of grid security or safety of any equipment or personnel is endangered and solar generator shall comply with same.
For this, data acquisition system facility shall be provided for transfer of information to concerned SLDC and RLDC.
Scheduling of Solar Power (Reg. 6.5(23)(i))
Schedule of the Solar generation shall be given by generator based on the availability of the generator, weather forecasting, solar insolation, season and normal generation curve and shall be vetted by RLDC and incorporated in inter-state schedule.

Renewable Energy Sector Overview
If the RLDC is of opinion that the schedule is not realistic, it may ask the solar generator to modify the schedule
Implications of Scheduling In case of solar generation no UI shall be payable/receivable by the generator for any deviation in actual generation from schedule.
The host state shall bear the UI charges for deviation in the actual generation from schedule.
The net UI charges borne by the host state due to solar generation, shall be shared among all the states of the country in ration of their peak demands in previous month based on the data published by CEA, in form of regulatory charge known as Renewable Regulatory Charge operated through the Renewable Regulatory Fund.
The provision shall be applicable, with effect from 1.1.2011 for new solar generating plants with capacity of 5MW and above and connected at 33Kv level and above and who have not signed PPA with states or others as on date of coming into force of this IEGC.
2.5.2.4. CERC Initiative for Transmission/Evacuation of Solar Power
Under the mandate of statutory provisions of Section 61 of the Electricity Act, 2003 inter-alia para 5.3.4 and
para 7.2(1) of the National Electricity Policy and Tariff Policy respectively, Central Electricity Regulatory
Commission (CERC) has undertaken the exercise to frame regulations on sharing of transmission charges and
losses among the users.
The regulations facilitate the solar based generation by allowing zero transmission access charges for the use of
the Inter State Transmission System and allocating no transmission loss to the solar based generation. Solar
power generators shall be benefited in event of use of the ISTS. Since such generation would normally be
connected at 33 kV, the power generated by such generators would most likely be absorbed locally. This would
cause no / minimal use of 400 kV ISTS network and might also lead to reduction of losses in the 400 kV
network by doing away the need for power from distant generators. The cost of energy from solar based
generation is perceived to be costly as compared to other sources, including renewable energy sources, and
further application of ISTS charges and losses would further reduce the acceptability of power generated from
solar sources. This regulation thus encourages solar based generation and inter-state transactions based on
solar energy.
2.5.3. Thrust Areas for solar sector
The Government plans to scale up solar to a cumulative 100GW by 2020. This would involve large scale
deployment of rooftop projects under both net metering and feed in metering to achieve 40GW of capacity till
2020; increased pace of grid connected projects so as to achieve 60GW by 2020, for this Solar parks have been
set up in Charanka (Gujarat, 500 MW) and Bhadla (Rajasthan, 1500 MW) and others have been planned in
over 12 states which are as follows:
Gujarat – 750MW (Banaskantha)
Madhya Pradesh – 1500MW(Rewa)
Telangana- 1000MW(Mehboobnagar)
Andhra Pradesh- 2500MW(Anantpur, Kurnool and Kadapa)
Karnataka- 1000MW(Bijapur)
Uttar Pradesh- 250MW(Jalaun)
Meghalaya-50MW
Jammu and Kashmir- 7500MW (Leh and Kargil)
Punjab- 1000MW (Land identified)
Rajasthan- 700MW (Land identified)
Tamil Nadu- 500MW (Location not identified)
Odisha- 1000MW (Location not identified)

Renewable Energy Sector Overview
The targeted increase in rooftop solar from 285 MW to 40,000 MW over a period of about 6 years would
require enabling policies and favourable investment regimes on the part of the government. Successful
implementation of these targets would put India as one of the global leaders in terms of solar energy and
provide capacity to meet the much required demand growth in the country.
2.5.4. Issues/Challenges associated with development of solar power projects
As the India Solar program moves from policy to implementation, several issues and concerns have surfaced
proving to be major hurdles for serious solar power developers and lenders. In fact is several projects allotted
may not get deployed. Financing and bankability of solar projects under the JNNSM is emerging to be a major
concern, arising from several issues in the policy or inadequacies therein. Thus, despite an apparently
improved policy and support provided, solar power development remains expensive and risky for developers
and lenders. These issues of concern are discussed here:
Reliability of solar irradiation data: The biggest risk associated with solar projects lies with the
estimation of solar radiation. The returns of a solar project are highly sensitive to radiation levels. High
quality solar radiation data is a prerequisite for proper market assessment and project development.
Hence, solar radiation assessment is a very important activity and typically requires several months for
ground measurement of solar radiations. Any error in solar resource estimation adds an uncertainty to
expected outputs. According to Power Finance Corporation, as of now, on-ground solar radiation data
is sketchy and the simulation models are at best at a preliminary stage. The industry is relying on
suboptimal solutions in the absence of credible and adequate data. Non availability of standardised
information is leading to the developers opting different sources of information and hence bankers and
financers are finding it very difficult to rely on the provided data and proceed with investments.
MNRE has initiated steps in this direction, with the Centre for Wind Energy Technology being assigned
to set up 51 ground monitoring stations in association with the states. Probable sites have been
identified in states including Andhra Pradesh, Chhattisgarh, Gujarat, Jammu & Kashmir, Madhya
Pradesh, Maharashtra, Karnataka, Puducherry, Rajasthan and Tamil Nadu.
Financial Risk: Banks and financial institutions remain averse to the idea of lending to solar power
projects. While the general perception about solar technologies has improved over the years, the
technical risk perception remains high. As a result, there is a dearth of non-recourse or project
financing for solar projects. Most of the lenders insist on recourse to either the parent company’s
balance sheet or a performance bond for the project. Industry experience in the energy sector has
shown that capacity addition would not have been possible had financing been limited to only balance
sheets. Clearly, this could defeat the larger objectives of jump-starting capacity addition in solar power.
Domestic manufacturing: Government has stipulated local sourcing for cells, panels and other equipment for half of the available capacity under Phase II Batch I of JNNSM projects. If this continues, developers will have to procure higher cost equipment if they want to bid under the DCR category. Also, developers are apprehensive about the ability of domestic manufacturers to meet the required demand. Currently, there is a very limited manufacturing capacity in India and the Indian market requires large-scale manufacturing facilities to leverage pricing, supply and research capabilities.
Land acquisition risks: Procuring land is a major barrier facing solar project development. The process of land acquisition differed from state to state. While Gujarat gave a free hand to developers to choose based on the developers criteria (the type of land they needed), Rajasthan adopted a different path of first identifying government waste land for developing solar power projects and then allotting them to various developers. The lead time to acquire land in states could range anywhere between 6-12 months and in some cases more than a year.

Renewable Energy Sector Overview
Evacuation: Lack of Planning and sharing of information by the respective state transmission utilities with the developers is seen as one of the major concerns by most of the project developers in finalizing their project locations. Typically, state utilities do not publicize their present and future infrastructural plans of setting up of new transmission lines and evacuation infrastructure, it is a major threat as concerned and upcoming developers are not aware of any developments in the area thus posing a major risk involving bad planning and changing policies.
2.6. Rural Electrification: A Review of Policy and Regulatory Framework
The government of India has taken several initiatives for rural electrification from time to time. The Electricity
Act, 2003 and the Rural Electrification Policy, 2006, are two such milestone initiatives. This section provides a
brief overview and analysis of select schemes, policies and programmes as well as the key enabling provisions
under the prevailing regulatory framework for rural electrification in India as a basis for developing innovative
business models involving the private sector in rural electrification in future for effective large-scale
deployment of decentralised power generation.
2.6.1. Evolution of Rural Electrification in India
India’s rural electrification programme was initiated in the 1950s, and its evolution can be divided into five
distinctive stages.
With the emergence of renewable energy, MNRE also implemented several programmes to promote cleaner
and renewable energy technologies such as solar, biomass, and biogas for providing electricity to remote un-
electrified villages and hamlets to support rural electrification through grid extension. The major programmes
include VESP (which focused on biomass based technologies), RVEP (which shifted its focus with time to solar
home lighting), and the recently launched Jawaharlal Nehru National Solar Mission (JNNSM).
• 1950s: Providing electricity as a social amenity
Stage 1
• 1960s:Focus shifted to energisation of agriculture pumpset to enhance food security
Stage 2 • 1980s: Seen
as the tool for correctin regional inequalities
Stage 3
• 1990s: Setback due to deteriorating financial conditions of the State Electricity Boards; more emphasis on efficency than coverage
Stage 4 • 21 st Century:
Electrification of household become more important than village. Renewable energy started to gain attention because of energy security
Stage 5

Renewable Energy Sector Overview
Prior to October 1997: village was classified as electrified 'if electricity is being used within its revenue area for
any purpose whatsoever'
In 1997: modified to provide for use of electricity "electricity is used in inhabited locality within revenue
boundary for any purpose whatsoever"
In 2004: further modified & expanded Basic infrastructure such as
distribution transformer & lines are provided in inhabited locality as well as basti/hamlet where it exists also
provided in public places like schools, health centres, etc. 10% of total no. of
households must be electrified
Evolving definition of Village Electrification
Major Rural Electrification Programs
Minimum Needs Programme
Started in 5 th FYP (1974-79) with SEB as implementing agency
100% central assistance to states in the form of grants and loans for last mile connectivity Targeted states with village electrification lower than national average
Discontinued in 2004-05 because of lack of response from States Kutir Jyoti Programme
Initiated in 1988-89 with 100% grant with SEB as implementing agency Single point connection to BPL households (71.7 lacs BPL household connected in 16 years)
Merged with AREP in 2004 and later with RGGVY Pradhan Mantri Gramodaya Yojana (PMGY)
Launched in 2000-2001 with funding as additional central assistance (90% grant and 10% loans for special category states, 30% grant and 70% loan for other states)
Funding provided for minimum services in rural areas (health, education, drinking water and electrification etc) through implementing agencies viz SEBs, electricity departments, power utilities
Flexibility to states to decide on inter-allocation amongst basic services
Discontinued from 2005 Accelerated Rural Electrification Programme (AREP)
Launched in 2002 with 4% interest subsidy from financial institutions like REC,PFC, RIDF, NABARD, etc
Implementing agency: state government through electricity board and power utilities
Applicable on loans given through PFC/REC and NABARD Accelerated electrification of 1 lakh villages and 1 crore households
Launched in 2004 with 40% capital subsidy and 60% loan
AREP and Kutir Jyoti schemes merged with this and later with RGGVY Remote Village Electrification Programme (RVEP)
MNRE’s programme to electrify all remote census villages & hamlets through renewable energy sources
Aimed at bringing benefits of electricity to people living in most backward and deprived regions. Cumulative sanctions of villages and hamlets since its inception reached around 12,369 (31/12/2011)
Village Energy Security Programme (VESP)
Launched by MNRE with WB-TA in 2005 with pilot phase of about 80 test villages Objective to go beyond electrification, provide total energy security (lighting, cooking, & motive power)
Focus on exploitation of locally available renewable resource with involvement of local community by transforming locally available biomass energy use in rural remote areas in a sustainable manner.
However, after the closure of the pilot phase in 2009-10 most of the project became redundant, and therefore nonoperational, as soon as grid reached the village.
Guidelines for Off-Grid & Decentralized Solar Applications
JNNSM was launched in 2010 as one of eight national missions under NAPCC announced in 2008. Twin objectives: contributing to India's long-term energy security & its ecologically sustainable growth

Renewable Energy Sector Overview
2.6.2. Enabling Regulatory Framework: Provisions under E-Act 2003
Electricity Act, 2003 explicitly mentions the formulation of a national electricity policy (NEP), a national tariff
policy, and a plan for the development of power systems to ensure optimal utilization of all resources including
renewable sources of energy. The Act has also created several other enabling provisions to accelerate the
development of renewable-energy-based generation and also lays special emphasis on rural electrification. The
Act mandates the central government to formulate policies permitting stand-alone systems, including systems
based on renewable and non-conventional energy, for rural electrification. The key Sections of EA 2003 are
summarized below.
The proposed amendment to the Electricity Act 2003, also provide specific provisions for encouraging the usage
of renewable energy sources across the rural areas. Some of the amendments congruent to promoting rural
electrification through harnessing of renewable energy sources have been specified below:
Section 4(1): The Central Government shall, after consultation with the State Governments, prepare
and notify a national policy, permitting stand-alone systems (including those based on renewable
sources of energy and other non-conventional sources of energy) for rural areas within six months
from the date of coming into force of this Act.
Section 4(2): The Central Government and the concerned State Governments shall jointly create
necessary infrastructure in rural areas to harness solar power and other forms of renewable energy
to ensure access to electricity to every rural household by the year 2020.".

Renewable Energy Sector Overview
Section 6(1): The Central Government shall, in consultation with the State Governments, as soon as
possible but not later than six months from the date of coming into force of this Act, prepare and
notify a national policy aimed at encouraging the use of renewable sources of energy to
ensure electrification in rural and urban areas.
2.6.2.1. Rural Electrification Policy, 2006
Ministry of Power notified the Rural Electrification Policy in 2006 to comply with section 4 and 5 of the
Electricity Act, 2003. The goals of this policy are to provide electricity to all households by 2009, through
quality and reliable power supply at a reasonable price and achieve a minimum consumption of 1 unit of
electricity per household per day by 2012.
The policy aims to achieve rural electrification primarily by grid connectivity or by off grid solutions and stand-
alone systems where grid connectivity is not feasible or economical. In case of areas where even stand-alone
systems are not feasible, isolated systems like solar PV will be provided for basic lighting and electrification
needs.
To support this policy, the government launched the Rajiv Gandhi Gramin Vidyutikaran Yojana (RGGVY),
where capital subsidy up to 90% could be provided for village electrification. The Rural Electrification
Corporation under the Ministry of Power is the nodal agency of RGGVY.
2.6.2.2. Rajiv Gandhi Gramin Vidyutikaran Yojana (RGGVY)
RGGVY was launched in April 2005 by merging several existing rural electrification schemes with REC as the
nodal agency for the program. The main aims of this program are:
To electrify all villages and habitations in India
To provide access to electricity to all rural households
To provide electricity connection to below poverty line families free of charge The electricity will be provided either by grid connectivity, wherever possible and economically feasible or
through DDG systems powered by conventional or non-conventional sources of energy, where grid connectivity
is not feasible.
Under RGGVY, 90% grant is provided by the central government and 10% through loan from REC to the state
governments to implement rural electrification projects. For Below Poverty Line (BPL) households, RGGVY
provides 100% electricity connection subsidy of Rs. 2,200 per BPL household. The scheme estimated 125,000
un-electrified villages at its inception and estimated Rs. 8,125 crore with connectivity to 10% of the households.
For electrification of BPL households, an estimate of Rs. 3,510 crore was calculated. The cost estimation of the
scheme was also included augmentation in already electrified villages containing un-electrified inhabitations
with an estimate of Rs. 4,620 crore. The total outlay for RGGVY scheme was then computed to be Rs. 16,000
crore with the central government contribution to be Rs. 14,750 crore.
The RGGVY scheme was continued in the 11th Plan and Rs. 28,000 crore1 were sanctioned for this scheme in the
11th Plan. In this phase of RGGVY, 90% of the subsidy will be provided by the central government and the
additional 10% of the cost will be provided by the states through their own resources or through loans from
financial institutions.
For projects to be eligible under RGGVY, the state government of the village needs:
To guarantee a minimum daily supply of 6-8 hours of electricity with the assurance of meeting any deficit by supplying electricity at subsidized tariff
1 http://rggvy.gov.in/rggvy/rggvyportal/index.html

Renewable Energy Sector Overview
To deploy franchisees for the management of rural distribution in these projects and to undertake necessary steps to operationalize this scheme
2.6.2.3. Deendayal Upadhyaya Gram Jyoti Yojna
In rural areas of the country, the agricultural and non-agricultural load (domestic and non-domestic) is typically catered through common distribution network. Availability of power supply in rural areas is erratic in most parts of the country. Besides non-availability of adequate power, common distribution network for agricultural and non-agricultural load is also considered as one of the major constraints for supply of adequate reliable power to rural area. Distribution utilities, to mitigate the gap between supply and demand practise frequent load shedding in rural areas and in the process, non-agricultural consumers are also deprived of supply since they are fed from the same feeder. To overcome this situation various states have undertaken capital investment program to separate agricultural load from non-agricultural load in the rural areas. Feeder separation refers to supply of electricity to agricultural consumers and non-agricultural consumers (domestic and non-domestic) separately through dedicated feeders. This arrangement allows the distribution company to selectively control power supply to agricultural consumers as and when needed for effective Demand Side Management (DSM). The separation of feeders helps in flattening of the load curve by shifting the agricultural load to off-peak hours and thus helps in load management. Since the continual infusion of fund is required and considering the financial health of the government owned state utilities, Government of India is providing support to this initiative.
Government of India launched the Deendayal Upadhyaya Gram Jyoti Yojana on August 2014 with an objective
to :
To separate agriculture and non-agriculture feeders in rural areas;
To facilitate Discoms in the judicious rostering of supply to agricultural & nonagricultural consumers in rural areas;
Strengthening and Augmentation of Sub Transmission & Distribution infrastructure in rural areas. The proposed initiative is applicable for the remaining years of the 12th plan period and would be further continued during the 13th plan. Total cost of the scheme is Rs. 43033 Crore and requirement of Government Budgetary Support (GBS) from Govt. of India is Rs. 33453 Crore over the implementation period. REC has been appointed as the nodal agency for this initiative. Government of India would provide 90% and 75% of the total amount as the grant across the special category states and other states beyond the special category status.
2.6.2.4. Rural Electrification Corporation Decentralized Distributed Generation Scheme
The Indian Government launched a scheme in 2009 under RGGVY for village electrification through
Decentralized Distributed Generation in the 11th Plan with a sanctioned capital subsidy of Rs. 540 crore2 from
the Rs. 28,000 crore approved for RGGVY. REC was appointed the nodal agency of this scheme. This scheme
complements the RGGVY as it aims to electrify villages where grid connectivity is not feasible or economical.
The villages under the DDG scheme can be provided electricity through conventional sources of energy or
through renewable energy including small hydro, biomass, biogas, solar, etc.
The projects implemented under the DDG scheme will be owned by the state government with the state
renewable energy development agencies as the implementing agencies. The villages will be selected by the state
renewable energy development agency in consultation with MNRE. Villages or hamlets having a population of
less than 100 inhabitants will not be included in the DDG scheme and will be taken up in MNRE schemes of
rural electrification. The DDG scheme will be monitored by a committee with the Secretary (Power) as the head.
2 http://www.recindia.nic.in/ddg.html

Renewable Energy Sector Overview
For implementing these projects, services of the Central Public Sector Undertakings have been offered to the
states, with REC entering into MoUs with NTPC, NHPC, Power Grid Corporation and DVC.
Under the scheme, 90% of the total project cost will be provided as subsidy by the implementing agency and the
rest 10% will be arranged by the implementing agency or through loans from financial institutions or REC.
2.6.2.5. MNRE Remote Village Electrification Programme
The Ministry of New and Renewable Energy launched the Remote Village Lighting Programme in 2005 to
support the National Electricity Policy and the Rural Electricity Policy in their aim to achieve complete
electrification of India. This scheme is supplementing the efforts of the prevalent Indian Government schemes
and programs for electrification like RGGVY and REC DDG schemes and included villages where grid
connected electrification is not feasible and economical. The villages listed were the ones not under RGGVY
DDG programmes, and mandate was given to MNRE to electrify these villages by renewable energy sources. In
this scheme, MNRE provided a subsidy of up to 90% of the capital costs of the renewable energy systems.
This scheme was replaced by the Remote Village Electrification Programme of MNRE in 2009 with the same
objective of rural electrification through renewable energy technologies of un-electrified villages. The selection
of villages for this scheme is being done in a similar way with the important criteria of un-feasibility of grid
connectivity and the village not being covered under RGGVY. For selection of villages, the state governments
will send a list of short-listed villages to MNRE, which will be verified by REC. In this scheme also, renewable
energy plants or hybrid plants will be installed in the selected villages based on renewable energy technologies
including small hydro, biomass, bio fuels, wind, biogas, etc. Solar lighting will be used for households and
community establishments when no other renewable energy technology is feasible. However, it has been
observed by MNRE that solar PV lighting has been the preferred mode of electrification in this scheme.
MNRE will provide CFA of up to 90% of the renewable energy projects, including annual maintenance costs for
5 years for the approved projects. CFA for a SPV home lighting systems is provided for all BPL households in all
approved villages and hamlets for electrification under this scheme. The maximum CFA from MNRE for
electrification of a village or hamlet will be Rs. 18,000 per household.
This scheme received a total outlay of Rs. 95 crores in 2011-12, Rs. 80 crore each in 2010-11 and 2009-103. Out
of the total funding Rs. 25 crore were earmarked for the North- Eastern region as it is one of the most remote
regions in India with un-electrified and sparsely populated villages.4
2.6.2.6. MNRE Technology Specific Schemes
The Ministry of New and Renewable Energy has also been running technology specific schemes and programs
covering biomass, bio-gasification, small-hydro and solar technologies. These schemes are mainly to provide
capital subsidy for investors setting up power plants based on these technologies for off grid and industry
application including rural electrification. These salient features of this scheme for each technology are:
Technology Features of the Scheme
Biomass Gasifier Capital subsidy of Rs. 15,000/ KW for off grid power plants in rural areas limited to 250 kW installed capacity. The project can be set up following a cluster approach.
Biogas Capital subsidy upto 40% of capital cost or Rs. 40000/ KW (3-20 kW), Rs. 35,000/ kW (20-100 kW), Rs. 30,000/ kW (100-250 kW) whichever is less. Support towards DPR preparation is also provided.
Solar PV For solar mini grid projects, subsidy can be availed for upto 250 kW per site. Subsidy of Rs. 90/ Wp with battery backup is the benchmark subsidy.
3 http://www.mnre.gov.in/schemes/offgrid/remote-village-electrification/ 4 http://www.mnre.gov.in/file-manager/offgrid-remote-village-programme/rve-adm-2011-12.pdf

Renewable Energy Sector Overview
Wind Subsidy is for aero-generators of 10 kW capacity. Subsidy is Rs. 1.5 lakh per kW for govt, public, charitable, academic and NGOs; for private subsidy is Rs. 1 lakh/ kW.
Small Hydro (micro) Subsidy of Rs. 40,000/ kW is provided for upto 100 kW system

Challenges to development of Renewable Energy and RE based Rural Electrification in India
3. Challenges to development of Renewable Energy and RE based Rural Electrification in India
3.1.1. Challenges in development of Renewable Energy
Challenges to the renewable energy sector in the country can be classified into the following:
Policy barriers
• Absence of comprehensive RE law: The EA, 2003, has some enabling provisions to promote grid-
connected RE sources. However, there are no legally binding targets facilitating the creation,
transmission and deployment of renewable energy or provision for accelerating all-round development
of renewable energy. Hence, India needs to enact a comprehensive law to facilitate renewable energy
development.
• Cohesion of state targets with national objectives: It is observed that the state planning board does not
specify RE capacity-addition targets while planning the energy/power sector activities. It does not event
take cognisance of the envisaged targets at the national level to set up the state targtes. The dynamic RE
target setting by the state planning board will have a positive impact on the RE sector.
• According single-window clearance to RE projects: Project proponents are required to take number of
permissions or approvals from the various state government departments and agencies prior to the
commissioning of an RE project, resulting in delayed implementation and commissioning. All states
may be persuaded to create empowered committees to accord single-window clearance for setting RE
projects at the state level.
Regulatory barriers
• Lack of enforcement of RPOs: Although the RPO levels have been specified by the regulator at the state
level, their concrete enforcement is still to be seen. There have been few cases where penalty has been
imposed by the regulator, but it is yet to be enforced uniformly across all states.
• Transmission planning for RE development: Non-availability of evacuation infrastructure and grid
integration challenges are among the biggest problems affecting RE project development. As per the
EA, 2003, development of evacuation infrastructure and providing grid connectivity for RE sources is
considered as the responsibility of the transmission utility. However, in practice, in many states, it is
the RE developer who has to first construct such infrastructure.
• Homogeneity in interconnectivity norms: Interconnection of the RE projects with the grid is another
important aspect where there is no consistency in the definition of ‘interconnection point’ across the
state. The interconnection point is often left to the whims of the local utility.
• Uncertainty of REC price certainty after 2017: The CERC has announced floor prices and forbearance
prices for RECs only until 2017. This has led to uncertainty regarding revenues from RECs beyond this
time frame. This makes it difficult for FIs to lend to projects based on RECs because such loans
normally extend beyond 10 years.

Challenges to development of Renewable Energy and RE based Rural Electrification in India
• Open access: Third-party power sales by RE projects are charged an open access levy, which includes a
cross subsidy surcharge and an electricity duty (except in states where these have been exempted). The
levy of these charges makes third party sales more expensive.
Financial barriers
• No priority sector lending for RE: At present, the priority sector broadly comprises agriculture, small-
scale industries, and other activities/borrowers. The inclusion of RE in the priority sector will increase
the availability of credit to this sector and lead to larger participation by commercial banks in this
sector.
• Feed-in tariffs (FiTs): FiTs are one of the most successful and effective policy instruments globally for
promoting RE generation. However, FiTs have to be designed carefully, keeping in view the prevailing
market conditions, state of technology development and availability of resources. If the FiT is too high,
it leads to unwarranted profits for developers, and if set too low, the FiT can lead to very low financial
returns leading to low investments in the sector.
Experience shows that the FiTs designed by certain SERCs have been unable to attract investments. There is a
need for adoption of more robust processes and methodologies for determining FiTs that include detailed due
diligence on costs and performance parameters of various technologies, so as to make these attractive for both
debt and equity investors.
• Accelerated depreciation: Given that accelerated depreciation can only be utilised by profit-making
entities with appreciable tax liabilities and cannot be transferred, it effectively excludes most IPPs and
investors who plan on using a SPV route for project development. This limits the impact of the
instrument and constrains the level of investment entering the sector.
Market barriers
• Off-taker risk: The creditworthiness of the off-taker (the state distribution companies in the case of
sales to the state) plays a key role in determining the bankability of a PPA. Very few discoms, such as
those in Gujarat and Maharashtra, are in good financial health. In other states, discoms have poor
financial health; the risk of off-taker default and delayed payments is high.
• Evacuation risk: Evacuation is a generic problem afflicting wind, solar and the small-hydro sector. Lack
of adequate evacuation facilities has led to scaling back the commissioning and partial commissioning
of new generation and the reduction of generation during peak periods. This issue is constraining the
development of small-hydro projects across the northern and northeastern states (HP, Uttarakhand,
and north-eastern states), solar development in the remote areas of Rajasthan and wind in Tamil Nadu.
3.1.2. Challenges in development of RE based Rural Electrification Initiatives
The extension of the electricity grid is one of the prominent and obvious solutions to effective rural
electrification. However, such a mechanism entails significant investment in building the necessary
infrastructure. The alternate solution for effective rural electrification is through deployment of off-
grid/decentralised generation systems that exploit resources available locally. However, encouraging rural
electrification through installation of off-grid systems based on renewable energy sources will require
identification of specific issues and finding suitable technical and commercial solution with adequate support of
regulatory measures. Some of the challenges limiting the development of RE-based rural electrification projects
are as follows:

Challenges to development of Renewable Energy and RE based Rural Electrification in India
The major barrier for large scale deployment of renewable and its utilisation for rural electrification is
large capital investment, and therefore, higher cost of electricity generation, making it unviable in
comparison to subsidised grid tariff.
Further, the investors also vary about the tariff for the purchase of the power generated from such
plants by the distribution utility once the grid comes in the picture.

PPP case studies
4. PPP case studies
Snapshots of cases from India and overseas have been included below to provide an overview of some key
projects while not intending to be an exhaustive list or amount of detail.
4.1. Wind project at Curepipe Point, Mauritius
The Mauritius government, as part of its long-term strategy of sourcing 35% of its electricity from renewables
by 2025, selected the Curepipe Point site for the development of a 30 MW wind power project on PPP basis. A
consortium of Padgreen Co. & Valum Holding BV (74%) and Suzlon Energy (26%) was selected as the preferred
bidder for undertaking this project. After the selection of this consortium, the Energy Supply and Purchase
Agreement (ESPA) was signed on 3 August 2012 between the consortium and the Central Electricity Board
(CEB), Government of Republic of Mauritius, for a period of 20 years. The tariff was quoted in both US dollars
(USD) and Mauritian rupee (MUR), to be paid in MUR to reduce the foreign exchange risk for the developer.
Obtaining clearances and approvals including land were the responsibility of the project developer, with
assistance from the CEB. Among the main issues faced by the developer was identification of suitable and
adequate land for the project. The initially identified site had to be changed as land available was inadequate for
a 30 MW project. The new location had its own problems including proximity to a lake (largest lake in
Mauritius) and in line with the flight landing path. After consultations and minor changes, the project got all
the clearances and approvals and was set to commence generation in 2014.
Name of the project Development of wind power project at Curepipe Point,
Mauritius
Capacity and project details 29.4 MW wind farm of 14 wind turbines with a capacity of 2.1 MW each
plus the setting up of all 33 kV transmission lines inside the wind farm up-
to the interconnectivity point of the CEB substation
Land 433,000 m2 acquired by consortium (developer)
Power off-taker Central Electricity Board(CEB), Government of Republic of Mauritius through am Energy Supply and Purchase Agreement (EPSA)
Tariff Confidential to contract
Bid variable Offtake-tariff
Project cost 41.7 million USD
Project financing Government- USD 0; Private sector- USD 41.7 (break-up into debt and equity is confidential and not in public domain)
Entities
involved
Project
proponent
Central Electricity Board(CEB), Government of Republic of Mauritius
Service
provider
Consortium of Padgreen Co. & Valum Holding BV (74%) and Suzlon
Energy (26%)
PPP structuring variant Design Build Finance Own and Operate
Roles and
responsibilities
Project
proponent
Selection of the OEM provider through bidding process, assisting in getting all approvals and clearances, signing of PPA
Payment of tariff (off take of power)
Service
provider
Achievement of financial closure
Getting all approvals and clearances
O&M work, bearing the risk of inflation, interest rate fluctuation

PPP case studies
Project construction
Risks Project
proponent Exchange rate risk as developer quoted 80% of tariff in USD and
rest in MUR (Mauritian rupee)
Service
provider
Risk of cost over-run and construction within the timelines
Operational risk
Concession period 20 year
Dates Transaction commenced May 2009; ESPA signed August 2012; operations
expected to commence 2015
Termination clause At the end of the useful life , depending upon the choice of the owner, the
assets will be sold
4.2. GAIL Wind Power Project in Karnataka and Tamil Nadu
GAIL as an IPP and an investor undertook an open and competitive bidding process to select an Engineering,
procurement and construction contractor (EPC) in order to set up the proposed project (an approximately 24
MW wind project) and also provide O&M services for an initial period of 10 years. Towards this, the bidder will
also need to allocate a suitable area of land for the project and obtain all the requisite clearances and approvals.
Under this project, a 10.5 MW plant was set up in Tirunelveli, Tamil Nadu and a 12.6 MW wind project in
Sidhenpur, Karnataka. The power purchase agreement (PPA) was signed with the utilities at the applicable
feed-in tariff. The applicable tariffs were 3.39 INR per kWh and 3.70 INR per kWh for Tamil Nadu and
Karnataka respectively.
This transaction commenced September 2011, and the EPC contract was awarded to Suzlon in November 2011,
and the project was commissioned in 2012.
Name of the project GAIL Wind Power Project in Tamil Nadu and Karnataka
Capacity and project details Installed capacity: 23.1 MW, capacity for bidding 24 MW +/- 15%; final
installation of 10.5 MW in Tirunelveli, Tamil Nadu and 12.6 MW wind
project in Sidhenpur, Karnataka for a total of 23.1 MW
Land Amount of land unknown; but responsibility of EPC
Power Off-taker TANGEDCO (Tamil Nadu); BESCOM (Karnataka)
Tariff Twenty-five years, tariff of 3.39 INR per kWh for Tamil Nadu and 3.70
INR per kWh for Karnataka
Key points
Site identification for remote areas and without wind power development should be done by the
power procurer to aid the prospective developers and reduce project uncertainty and risk
The government agency (power procurer) should ideally get all clearances and approvals before
the bidding process to instill confidence and reduce project implementation time and risks
Government utility (CEB) has partially mitigated exchange rate risk by procuring 80% of the
power in USD

PPP case studies
Bid Variable Shortlisting based on detailed technical evaluation followed by selection based on IRR calculated on parameters provided by bidders.
Project Cost Approximately Rs. 140 crores.
Project Financing 100% Private funding- Funding from equity and debt in the ratio of 40:60 (exact details not available)
Entities
involved
Investor or
owner of the
project
GAIL
OEM provider Suzlon
Power off-taker Host utilities of Tamil Nadu and Karnataka
PPP structuring variant IPP Mode
Roles and
Responsibilities
Investor or
owner of the
project
Selection of the OEM provider through bidding process, signing of the PPA
Achievement of financial closure
OEM provider Acquiring suitable land and carrying out the wind assessment process
Procuring all the requisite approvals and clearances
Executing the PPA with the utility
Project construction: Supply of materials, erection and commissioning of the project
O&M service
Power off-taker Assured off-take of power
Risks Investor or
owner of the
project
All the overall project financials, operations and risks are to be borne by GAIL.
Investor or owner to bear the risk of inflation and interest rate fluctuation.
To bear the credit risk of the PPA.
OEM provider To bear the risk of cost over-run
Concession Period 25 years
Dates Transaction commenced September 2011, EPC contract awarded to Suzlon in November 2011, commissioned in 2012
Termination clause At the end of the useful life , depending upon the choice of the owner, the
assets will be sold
Key points
Under this model, GAIL outsourced its major roles and responsibilities of acquiring land,
procuring approvals and clearances as well as the designing process to an EPC or OEM and
transferred its risks to these entities.

PPP case studies
4.3. Simran Wind Power Project
Simran Wind Project Ltd (Simran) is a wind power generator and a subsidiary of the Techno Electric and
Engineering Company (TEEC). TEEC acquired Simran from Suzlon in 2009. It currently has an installed
capacity of 162.35 MW with projects located in Tamil Nadu and Karnataka. Going forward, it plans to have an
installed wind power capacity of 800 MW by FY 2018.
In FY 2012, Simran set up a 111.9 MW project in Tamil Nadu in the regions of Rasta, Muthiampatti and
Amuthapuram. The project is located in a high-wind density area with a projected average CUF of 27.5%. The
project signed a 20-year PPA with the Tamil Nadu Generation and Distribution Corporation Limited
(TANGEDCO ) in order to supply power at an average power purchase cost (APPC) tariff of 2.37 INR per kWh
which was revised to 2.54 INR per kWh. The project is eligible for RECs and is registered with the GBI scheme.
It has also registered itself with the Clean Development Mechanism (CDM) mechanism of the United Nations
Framework Convention on Climate Change (UNFCCC).
Simran has tied up with the International Financial Corporation Post-2012 Carbon Facility which will forward
the purchase of 1.75 million certified emission reduction (CERs) generated through 2020. This facility will off-
set some of the risk that arises from price uncertainty in the carbon market. IFC also provided funding to the
subsidiary for this project as well as for other pipeline projects. It infused an equity of 15 million USD and has
provided a loan of 40 million USD loan to this particular project. It has also committed to lend another 40
million USD for future projects.
Name of the project Simran Wind Project in Tamil Nadu
Capacity and project details 111.9 MW of wind power
Land Amount of land unknown; but responsibility of project developer
Power Off-taker TANGEDCO (Tamil Nadu)
Tariff Twenty-five years, PPA signed with the TANGEDCO at an APPC of 2.37
INR per kWh, now revised to INR 2.54 per kWh
Bid Variable Project based on APPC, therefore no bidding
Project Cost Around 672 crore INR ( 6 crore INR per MW)
Project Financing 100% Private funding including equity from Simran and the IFC (IFC invested 15 million USD in Simran); debt from IFC (40 million USD at 8.4% incl hedging with a 12 year repayment) and balance from other sources including Standard Chartered Bank and DBS. Quantum of funds raised as owner’s equity and from these other FI’s is unknown.
Entities
involved
Project
developer
Simran Wind Project Ltd.
Off-taker TANGEDCO
OEM Suzlon
Other entities IFC (equity and debt funding along with carbon credit purchase)
PPP structuring variant IPP mode
Roles and
responsibilities
Project
developer
Selection of the OEM provider, signing of the PPA
Achievement of financial closure
Procuring all the requisite approvals and clearances
Off-taker Power off-take
OEM Project construction

PPP case studies
O&M work
IFC Funding and CER purchase
Risks Project
developer
Bearing the risk of inflation, interest rate as well as exchange rate risk
Bearing the risk of cost over-run
Operational risks
Off-taker default risk
OEM Operational risk arising from low power generation
Bearing the risk of cost over-run
IFC As an equity investor, the IFC faces risks applicable to the project developer along with the credit risk.
Concession Period Twenty-five years
Dates Financial closure and selection of OEM was completed by March 2011 and project commissioned in 2012.
Termination clause At the end of the useful life , depending upon the choice of the owner, the
assets will sold
4.4. Charanka Solar Park, Gujarat
To promote solar development in Gujarat, the Gujarat government has developed a solar park in Charanka, Patan District, Gujarat with an area of 3,000 acres, sufficient for a solar PV generation capacity of 590 MW. Towards this initiative, the Gujarat Power Corporation Limited (GPCL) was appointed as the nodal agency for the Gujarat Solar Park and is primarily responsible for the development of the park and leasing the land to project developers, while the Gujarat Energy Transmission Corporation Limited (GETCO) is mandated to develop the transmission evacuation from the identified interconnection points. Twenty0-two solar projects were allocated land at the Charanka Solar Park, and till date projects with a capacity of around 224 MW have been commissioned.
Once the idea of the solar power park was set, independent power producers were invited to help build it.
Government subsidies, fixed tariff for solar power and clever marketing, in tandem with ADB’s solid backing,
eventually convinced 84 private companies—21 of which were for the Charanka site—to invest in the Gujarat.
The list of IPPs operating in the Charanka Solar Park along with their capacities is:
Developer Capacity (MWp)
AES Solar Energy Gujarat Pvt. Ltd. 15
Alex Asatral Power Pvt. Ltd. 25
Key points
Foreign funding from the IFC gave the project a ‘stamp of approval’ thereby helping the
company raise cheaper loans.
Foreign loan from the IFC improved its profitability since the landed interest cost was only
8.4%.
Diversification of revenue streams reduces the default risk of utilities but increases
uncertainty of cash flows.
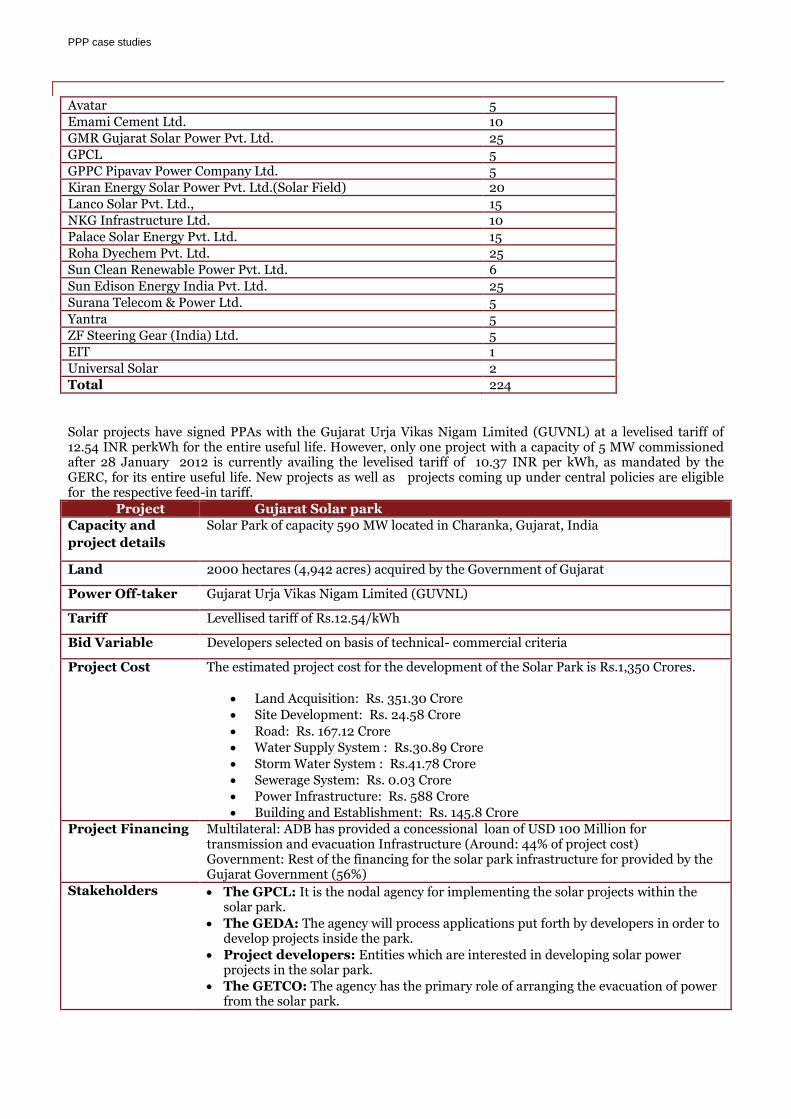
PPP case studies
Avatar 5
Emami Cement Ltd. 10
GMR Gujarat Solar Power Pvt. Ltd. 25
GPCL 5
GPPC Pipavav Power Company Ltd. 5
Kiran Energy Solar Power Pvt. Ltd.(Solar Field) 20
Lanco Solar Pvt. Ltd., 15
NKG Infrastructure Ltd. 10
Palace Solar Energy Pvt. Ltd. 15
Roha Dyechem Pvt. Ltd. 25
Sun Clean Renewable Power Pvt. Ltd. 6
Sun Edison Energy India Pvt. Ltd. 25
Surana Telecom & Power Ltd. 5
Yantra 5
ZF Steering Gear (India) Ltd. 5
EIT 1
Universal Solar 2
Total 224
Solar projects have signed PPAs with the Gujarat Urja Vikas Nigam Limited (GUVNL) at a levelised tariff of 12.54 INR perkWh for the entire useful life. However, only one project with a capacity of 5 MW commissioned after 28 January 2012 is currently availing the levelised tariff of 10.37 INR per kWh, as mandated by the GERC, for its entire useful life. New projects as well as projects coming up under central policies are eligible for the respective feed-in tariff.
Project Gujarat Solar park
Capacity and
project details
Solar Park of capacity 590 MW located in Charanka, Gujarat, India
Land 2000 hectares (4,942 acres) acquired by the Government of Gujarat
Power Off-taker Gujarat Urja Vikas Nigam Limited (GUVNL)
Tariff Levellised tariff of Rs.12.54/kWh
Bid Variable Developers selected on basis of technical- commercial criteria
Project Cost The estimated project cost for the development of the Solar Park is Rs.1,350 Crores.
Land Acquisition: Rs. 351.30 Crore
Site Development: Rs. 24.58 Crore
Road: Rs. 167.12 Crore
Water Supply System : Rs.30.89 Crore
Storm Water System : Rs.41.78 Crore
Sewerage System: Rs. 0.03 Crore
Power Infrastructure: Rs. 588 Crore
Building and Establishment: Rs. 145.8 Crore
Project Financing Multilateral: ADB has provided a concessional loan of USD 100 Million for transmission and evacuation Infrastructure (Around: 44% of project cost) Government: Rest of the financing for the solar park infrastructure for provided by the Gujarat Government (56%)
Stakeholders The GPCL: It is the nodal agency for implementing the solar projects within the solar park.
The GEDA: The agency will process applications put forth by developers in order to develop projects inside the park.
Project developers: Entities which are interested in developing solar power projects in the solar park.
The GETCO: The agency has the primary role of arranging the evacuation of power from the solar park.
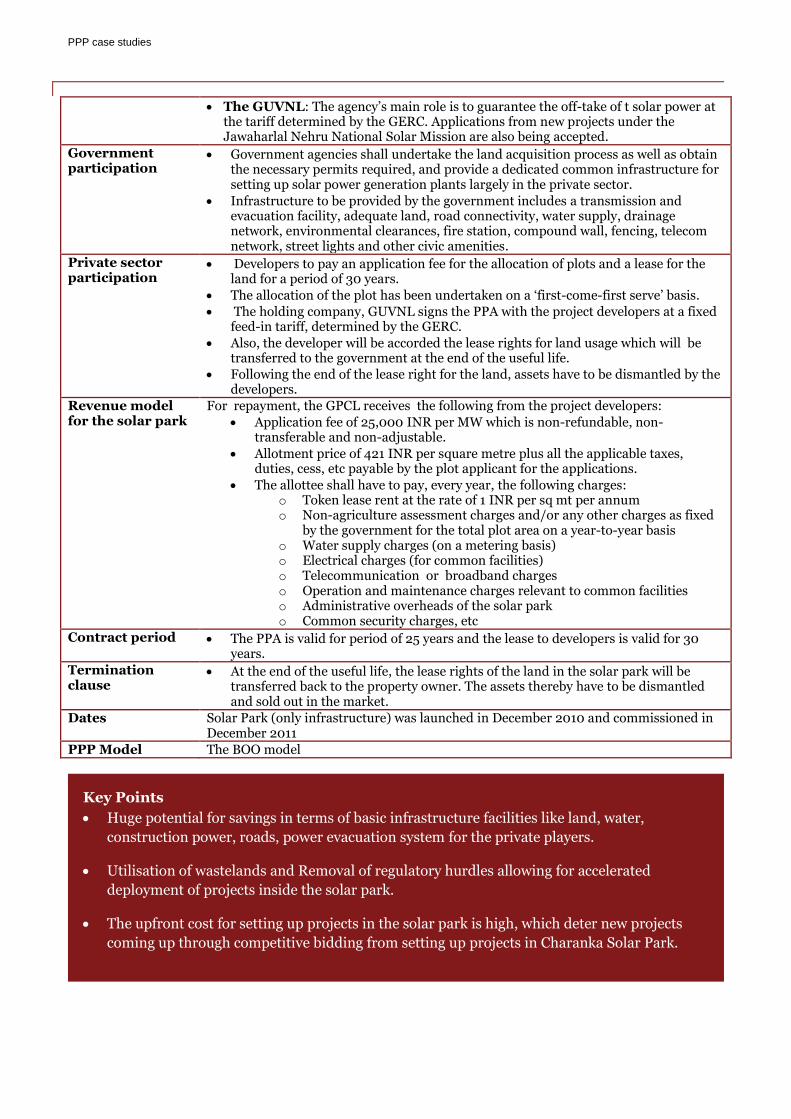
PPP case studies
The GUVNL: The agency’s main role is to guarantee the off-take of t solar power at the tariff determined by the GERC. Applications from new projects under the Jawaharlal Nehru National Solar Mission are also being accepted.
Government participation
Government agencies shall undertake the land acquisition process as well as obtain the necessary permits required, and provide a dedicated common infrastructure for setting up solar power generation plants largely in the private sector.
Infrastructure to be provided by the government includes a transmission and evacuation facility, adequate land, road connectivity, water supply, drainage network, environmental clearances, fire station, compound wall, fencing, telecom network, street lights and other civic amenities.
Private sector participation
Developers to pay an application fee for the allocation of plots and a lease for the land for a period of 30 years.
The allocation of the plot has been undertaken on a ‘first-come-first serve’ basis.
The holding company, GUVNL signs the PPA with the project developers at a fixed feed-in tariff, determined by the GERC.
Also, the developer will be accorded the lease rights for land usage which will be transferred to the government at the end of the useful life.
Following the end of the lease right for the land, assets have to be dismantled by the developers.
Revenue model for the solar park
For repayment, the GPCL receives the following from the project developers:
Application fee of 25,000 INR per MW which is non-refundable, non-transferable and non-adjustable.
Allotment price of 421 INR per square metre plus all the applicable taxes, duties, cess, etc payable by the plot applicant for the applications.
The allottee shall have to pay, every year, the following charges: o Token lease rent at the rate of 1 INR per sq mt per annum o Non-agriculture assessment charges and/or any other charges as fixed
by the government for the total plot area on a year-to-year basis o Water supply charges (on a metering basis) o Electrical charges (for common facilities) o Telecommunication or broadband charges o Operation and maintenance charges relevant to common facilities o Administrative overheads of the solar park o Common security charges, etc
Contract period The PPA is valid for period of 25 years and the lease to developers is valid for 30 years.
Termination clause
At the end of the useful life, the lease rights of the land in the solar park will be transferred back to the property owner. The assets thereby have to be dismantled and sold out in the market.
Dates Solar Park (only infrastructure) was launched in December 2010 and commissioned in December 2011
PPP Model The BOO model
Key Points
Huge potential for savings in terms of basic infrastructure facilities like land, water,
construction power, roads, power evacuation system for the private players.
Utilisation of wastelands and Removal of regulatory hurdles allowing for accelerated
deployment of projects inside the solar park.
The upfront cost for setting up projects in the solar park is high, which deter new projects
coming up through competitive bidding from setting up projects in Charanka Solar Park.

PPP case studies
4.5. Gandhinagar Photovoltaic Rooftop Programme
In order to promote clean energy and self-sustainability, the government of Gujarat has promoted the
Gandhinagar Photovoltaic Rooftop Programme. The objective of this programme is to maximise installations of
solar PV systems on rooftops and terraces of private homes, commercial and institutional buildings, and
government buildings. These SPV systems, installed on rooftops and terraces, will convert sunlight directly into
electricity and feed into the electrical grid. The programme is the first of its kind in India and aims to be a
benchmark for green energy generation at the household-level. Under this programme, the government of
Gujarat (GoG) will select a limited number of solar project Developers through a transparent competitive
bidding process.
Each developer will install photovoltaic systems on various buildings and houses. They will invest in the capital
for photovoltaic systems, further; they will own and maintain these photovoltaic systems. They will earn their
revenue by generating solar electricity from these systems and selling it back into the electricity grid to the local
distribution licensee.
Project Gandhinagar Photovoltaic Rooftop Programme
Capacity and
project details
5MW solar rooftop with 4 MW on government/ commercial rooftops and 1 MW on residential rooftops in Gandhinagar, Gujarat, India
Land Rooftop space of government/ commercial and residential buildings
Power Off-taker
Torrent Power
Tariff Azure Sun Energy Pvt Ltd signed the PPA at a tariff of 11.21 INR per unit while SunEdison entered into PPA with the utility at a tariff of 11.79 INR per unit.
The developer pays a green incentive of 3 INR per KWh to the rooftop owner as the part of rental for utilising the rooftop.
Bid Variable Competitive bidding on tariff
Project Cost The total project cost is estimated to be 15 million USD, all of which will be provided by Azure power and SunEdison.
Project Financing
Private funding: 100% from Azure Power and SunEdison (break-up into debt and equity is confidential to contract)
Stakeholders • Gujarat Energy Development Authority (GEDA) is the nodal agency for renewable energy projects in Gujarat. It provides financial support to this programme by making necessary funds available for this programme.
• The Gujarat Power Corporation Limited is declared as one of the nodal agencies for setting up solar power projects in Gujarat under the Gujarat Solar Power Policy. For the rooftop solar, the GPCL will act as project implementing agency (PIA). As a PIA, the GPCL will act as a facilitator for the rooftop solar power project developer, rooftop owner and off-taker as well other government agencies.
• Gujarat Energy Research and Management Institute (GERMI) will act as bid process co-ordinator wherein it will invite bid for the selection of the rooftop solar power project developer.
• Solar rooftop project developer, who will be selected by the competitive bidding process by GERMI, will build, finance, own, operate as well as maintain the rooftop solar units. The rooftop solar project developer will provide green incentive to the rooftop owner for the utilisation of roofs.
• Solar rooftop owner are potential rooftop owners in Gandhinagar who will provide their roofs to the rooftop solar project developer for setting up a solar power unit on long-term basis and will earn a green incentive per unit generated from the solar power unit.
• Torrent Power Limited is a distribution private company which is the distribution licencee in Gandhinagar. The company will act as off-taker in this programme and will purchase the clean power generated from this project.

PPP case studies
Government participation
The government of Gujarat will provide access to roofs of buildings it owns, facilitate purchase of agreements with the power procurer for the electricity generated at the regulated tariff, and guarantee a subsidy if required. Most of the roofs will be on public buildings, such as schools, hospitals and offices. The remaining panels will be placed on private residences, which will receive a rental income for hosting these panels.
Private sector participation
The developer will be responsible for identifying private buildings that will participate in the project, producing solar power and delivering it to the grid. Also, the developer will be accorded the lease rights for roof usage which will be transferred at the end of the useful life Project developers will pay a green incentive to the property owner.
Business model for Gandhinagar Rooftop Programme
Towards this, Azure Power and SunEdison each won 25-year concessions for 2.5 MW solar rooftop projects
Contract period
The PPA will be for 25 years
Termination At the end of the useful life, the lease rights of the roof will be transferred back to the property owner. The assets thereby have to be dismantled and sold out in the market.
Dates In-principle approval from government in July 2011, selection of bidder in March 2012, commissioning of all projects in March 2014
PPP Model The BOO model
Roof-top
owners
Screening
out potential
roof top
Allotment of
roof tops
Distribution
utility
Project
developers
GPCL
(implementing
agency)
Government
agencies GERMI
Bid processing & selection of
bidder
Off taking facility
Green
incentives

PPP case studies
Key points
Project developers bid for the project and earn revenue by feeding power into the
electricity grid to the local distribution licensee.
Utilisation of vacant rooftops and revenue stream (generation based) for rooftop owners,
who are now stakeholders in the project.
This PPP project had a high tariff of more than 11 INR per kWh (included a charge for
rooftop owners of 3 INR per kWh) - higher than ground mounted- which could be due to
small size of individual projects.

PPP case studies
4.6. The Maharashtra State Power Generation Company Limited (Mahagenco)
Currently, the state of Maharashtra does not have a dedicated solar policy to promote solar projects and provide
visibility to projects developers. However, the state-owned power generation utility, Mahagenco, on its own
initiative has awarded the contract for a solar power project near Baramati in Pune district, to Welspun Energy.
This solar project is a classic example of a joint venture (JV) mode of project development wherein project
promoters provide equity to the project and have a suitable revenue sharing mechanism.
Project Mahagenco : Welspun solar project in Maharashtra
Capacity and
project details
50 MW solar project located at Shirsuphal, Baramati, Maharashtra, India
Land Mahagenco acquired 74.74 hectares of Government land for the first phase of project to install 36 MW solar PV; 30 hectares will be acquired for the 2nd phase of the project
Power Off-taker
Maharashtra State Electricity Distribution Company Limited (MSEDCL)
Tariff 8.98 INR per kWh set by MERC
Bid Variable Project awarded on a competitive bidding basis with the letter of agreement issued to the highest revenue sharing bidder.
Project Cost The project cost is approximately400 crore INR
Project Financing
Government funding: Rs. 150 crores (37.5%) from Mahagenco
Multilateral: KfW provided soft loan (amount not known)
Private funding: Welspun funded the balance with both debt and equity (amount not known)
Stakeholders Mahagenco : will be the equity owner of the project and will provide land to the projects.
Welspun: The private project developer selected through the competitive bidding process will design, finance, engineer, supply, erect, perform testing and commissioning. Operation and maintenance will also be undertaken by Welspun.
MSEDCL: The agency will be responsible for off-take of the power at a fixed feed-in tariff.
KfW: The agency will provide finance to the project.
Government participation
Mahagenco acquired land for the first phase of the project (36 MW)
Mahagenco will also extend the leverage of soft loans from KFW
MSEDCL will procure power at a regulated tariff determined by the MERC.
Private participation
Welspun Energy will be fully responsible for part finance, design, engineering, manufacturing, supply, erection, testing as well as commissioning of this grid interactive solar power plant, including operation and maintenance for a period of 25 years.
It has offered 38.75% revenue share over a period of 25 years with a guaranteed revenue from the project at 19% capacity utilisation factor (CUF) annually.
Contract period
The PPA is valid for the period of 25 years
Dates Welspun was selected in March 2014, and project is expected to be commissioned by March 2015
Termination clause
Not available
PPP Model JV case of the PPP mode

PPP case studies
4.7. Roberto Santos Soccer Stadium, City of Salvador, State of Bahia, Brazil
A solar photovoltaic generator with approximate power of 400 kW (peak) will be installed at the rooftop of the Roberto Santos Soccer Stadium and connected to the state of Bahia’s power grid.
The electricity generated by the solar plant on the stadium’s rooftop will be used by its own facilities during the day and surplus power will be used by SETRE (Labour, Employment, Income and Sports Department of Bahia) through Coelba’s distribution network. The solar energy generation will provide the stadium with savings of 630MWhper year.
For the Brazilian energy sector this project may not only hold significant scientific and technological value, but also economic and social interests. Solar photovoltaic generation should, in the near future, be readily integrated into the energy matrix.
Project Roberto Santos Soccer Stadium, City of Salvador, State of Bahia, Brazil
Capacity and
project details
400 kW solar project located in City of Salvador, State of Bahia, Brazil
Land Rooftop of Roberto Santos Soccer Stadium
Power off-taker Captive use of stadium, with rest used by SETRE
Tariff Tariff not known
Bid variable Project awarded to technically qualified vendor through the competitive bidding process
Project cost Total investment: 5,557,510.70 BRL
Project financing In this partnership Coelba, the State of Bahia and GIZ are responsible for financing the initiative, according to the following scheme: • Private Sector: Coelba (66%): 3,683,717.83 BRL • Government Sector: Estado da Bahia (32%): 1,753,792.87 BRL • Bilateral Agency: GIZ (2%): 120,000.00 BRL
Stakeholders Public sector • Eletrobrás • Government of the State of Bahia • Universidade Federal de Santa Catarina – UFSC (Federal University of Santa Catarina) Private sector • Coelba / Neoenergia • Gehrlicher Ecoluz Solar do Brasil, a joint venture between the German photovoltaics
company Gehrlicher Solar AG and Brazilian Ecoluz Participações S.A. • GIZ
Government participation
The Government of Bahia will invest in the reinforcement of the stadium’s infrastructure in accordance with Decree 7.319, which stipulates special forms of taxation to support construction, expansion, renovation or upgrading of football stadiums with intended use in official matches of the 2013 FIFA Confederations Cup
Key points
Project developers bid for a share in the revenue from the power project, rather than
on total power capacity.
This solar project is a classic example of a JV mode where the developer puts in
equity and is also benefitted by the financing extended to the public company.
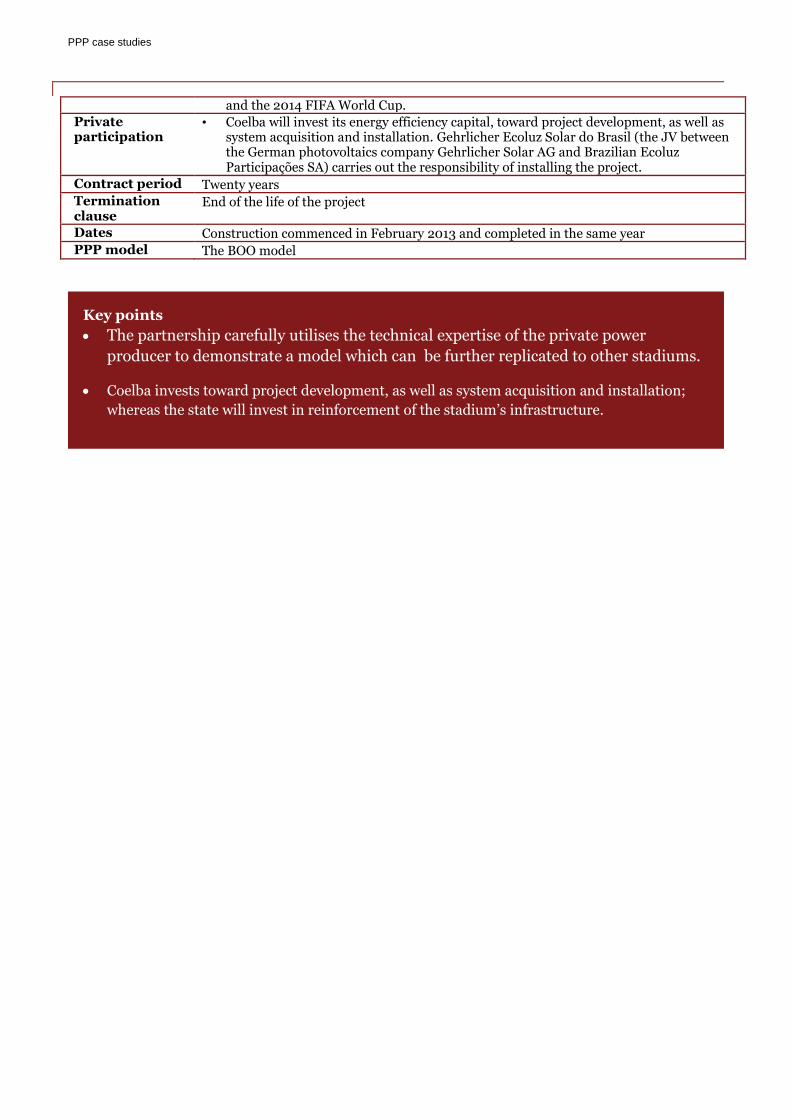
PPP case studies
and the 2014 FIFA World Cup.
Private participation
• Coelba will invest its energy efficiency capital, toward project development, as well as system acquisition and installation. Gehrlicher Ecoluz Solar do Brasil (the JV between the German photovoltaics company Gehrlicher Solar AG and Brazilian Ecoluz Participações SA) carries out the responsibility of installing the project.
Contract period Twenty years
Termination clause
End of the life of the project
Dates Construction commenced in February 2013 and completed in the same year
PPP model The BOO model
Key points
The partnership carefully utilises the technical expertise of the private power
producer to demonstrate a model which can be further replicated to other stadiums.
Coelba invests toward project development, as well as system acquisition and installation;
whereas the state will invest in reinforcement of the stadium’s infrastructure.

Learnings from Case Studies and Determinants for PPP structuring in RE
5. Learnings from Case Studies and Determinants for PPP structuring in RE
5.1. Learnings from Case Studies
The wind and solar PPP case studies prepared in section 4 help in assessing the benefits of different PPP
structures that can help accelerate deployment of renewable energy in India. Some of the important learnings
from the case studies are:
Particulars Learnings
Responsibility of Site and land identification Project developers of the RE projects in the present scenario owes the responsibility of land and site which results in the chances of implementation risk and time over-run
Accordance of clearance to projects Project developers in the current scenario owes the responsibility of seeking all level of clearances which results in the chances of implementation risk and time over-run
Structuring of incentives for RE sector Incentives such as GBI and AD a major reason for pushing investments in RE but despite this tariffs have tended to remain high and a focus on different incentives such as lowering cost of loans during operations rather than grants for capital investment might be better
Electrification in rural areas being provided but no power in the grid
Schemes such as RGGVY have been good in focusing on infrastructure development for rural areas but with no power in the grid, it has tended to ignore the output impact such as actual increase in per capita consumption. Additionally the present PPP structuring does not comfort the developers to participate in the scheme
The absence of aforementioned assertions in the current implementation models leads to apprehensions among
the lender community to finance the project. Structuring projects under a suitable mode PPP mode is
imperative. The PPP variant should provide the one stop show wherein the responsibility of executing the
competent authority (which is the utility) provides the clearances and approvals for the project. Also, it is
desired that the land identification along with getting the clearances is undertaken by the competent authority
which shields the developer from getting into the hassles of seeking land clearances. Additionally, it is expected
that the financial support needs to be extended by the government to the bidders which could be used to
leverage to secure loans from lenders at a cheaper rate.
5.2. Determinants for PPP structuring in RE sector
For successful culmination of a PPP model, it is desirable to present a clear perspective on the issues associated with the operating sector. Specifically, the sector diagnostics will entail the following:
Technical issues
Legal, regulatory, and policy frameworks
Institutional and capacity status; and
Commercial, financial, and economic issues As a result of the sector diagnostic,the government is able to determine to what degree an enabling environment exists for a PPP and the activities required in advance of a PPP in order to create such an environment. The diagnostic is important to achieve the following:
Learnings from Case Studies and Determinants for PPP structuring in RE
Bring a perspective on the strengths and weaknesses of the sector and the most promising areas for efficiency increases
Regularly gauge and report on the progress of reform
Tweak the reform program as and when needed Therefore, it is imperative to understand the involvement of the aforementioned factors in the solar and wind space.
5.2.1. Technical Issues in Renewable Sector:
It is important to assess the technical constraints in the sector where the PPP model will be applied. All operational issues owing to technical limitations need to be catalogued, to the degree that such information is relevant to the reform and can be obtained in a cost-effective manner. Infirm nature of wind and solar power causes perturbation in the local grids. Low capacity utilisation factors (CUF) for these renewable power technologies compounds the issue since it causes network stability challenges and also increases the cost. Higher quantum of renewable power requires a corresponding power evacuation facility and therefore states have to incur an additional cost for creation of transmission infrastructure. Renewable energy being in-firm, states have to create a spinning reserve. Although with proper planning and integration and availability of other sources, spinning reserves requirements can be reduced, it still results in additional costs.
5.2.2. Legal, Regulatory and Policy Frameworks:
Enabling legal, regulatory, and policy environments are critical in order to build a sustainable PPP model. It is important to have a legal environment that can support private sector involvement in critical services. To the degree that the legal and judicial environment is not defined, investors and project participants will see the project as unpredictable and highly risky.
The Electricity Act 2003 provided the first comprehensive framework for the development of renewable power in India at the national level. It included essential elements of a preferential tariff for renewable-based electricity and a mandatory renewable purchase obligation (RPO) for power utility companies, especially at the state level. This led to the introduction of the renewable energy certificate (REC) scheme in 2010 in order to enable state electricity distribution companies to fulfil their RPO by trading RECs. Other national power policies that were mandated by the 2003 Act also incorporated important features for renewables. The National Electricity Policy 2005 stipulated the progressive increase of RPO and mandated a competitive bidding process for their purchase by power distribution companies. The National Tariff Policy 2006 required SERCs to fix the minimum percentage of state RPO and to set a preferential rate for renewable power in their states.
5.2.3. Institutional structure established:
PPPs require a range of stakeholders within and outside the government in order to take on new roles or perform existing roles in improved ways. Often, new entities are created, such as regulators or PPP units, to manage the process. Institutional roles must be clarified at the latest by the time the PPP process is complete. However, greater the degree of uncertainty about institutional roles during the PPP process, higher the level of perceptive risk is likely for potential investors. However, the present institutional set-up for developing renewable energy is well established. It has linkages and synergies with all the relevant stakeholders both at the central and state level to bring desired scaling of renewable energy technologies.

Learnings from Case Studies and Determinants for PPP structuring in RE
Stakeholders in the renewable energy Sector in India
Ministry of New and Renewable Energy (MNRE): The MNRE is the leading ministry for all matters related to new and renewable energy, including planning national policies and promoting the development and deployment of new and renewable energy. It also undertakes initiatives harnessing renewable power and renewable energy in rural areas for lighting, cooking and motive power that is, engines and vehicles. There are a number of R&D institutes under the MNRE, including the Solar Energy Centre (SEC) and the Centre for Wind Energy Technology (C-WET) which validates sites for wind projects. The MNRE also co-ordinates with state nodal agencies.
The Indian Renewable Energy Development Agency (IREDA): Under the administrative control of the MNRE, the IREDA was established in 1987 as a non-banking financial institution in order to provide financial assistance for renewable energy and energy conservation projects. It selects projects for financial assistance and implements government incentive programmes, including the Grid Based Incentive (GBI). Recently, it has launched its refinance scheme for promoting solar projects in the grid and off-grid space.
Regulatory commissions (CERC and SERCs):As per the CERC Regulation, ‘Terms and Conditions for Tariff Determination for Renewable Energy Sources’ of 2012, the CERC has the authority to set the generic tariff rates for renewable-based electricity from the following categories: wind, small hydro, biomass, solar PV, and thermal and non-fossil fuel-based co-generation. This tariff serves as a benchmark for specific renewable power projects. At the state level, SERCs have rights to decide on state RPOs and renewable tariffs, in consideration of the CERC guideline
State governments: The role of renewable energy varies among states. Generally, state governments approve all projects within their states, including land acquisition and especially, water allocation for solar thermal projects. The state energy agencies run their own renewable programmes. Some states, including Gujarat and Karnataka, have their own independent solar policies and generation-based tariffs that are applicable upon signing a PPA with the state discoms. Some states offer incentives in order to increase investment. For example, Maharashtra provides a single window clearance process for land acquisition. Private companies:There are a large and growing number of private renewable companies in India and some are already globally established. Their core competencies, in terms of manufacturing capacity, technological advancement and operational experience, will play a key role in developing India’s renewable sector into a world-class level. Various international institutions also actively engage in India’s renewable sector. As aforementioned, following the understanding of the roles of different stakeholders, it is imperative to understand the concurring commercial issues associated with the RE sector.

Learnings from Case Studies and Determinants for PPP structuring in RE
5.2.4. Commercial, Financial and Economic Issues:
The current commercial, financial, and economic arrangements and outcomes of the sector need to be understood as well as assessed. The understanding of the current scenario influences decisions about the desired sector outcomes and how these might be achieved. Commercial considerations relate to the business orientation of the infrastructure service provider who may become a partner in the PPP structure. In preparation to a PPP, preliminary improvements to the customer base, the status of receivables, and funding arrangements may be necessary. These may be needed in order to fully understand or to improve the financial position of the service provider prior to entering into a PPP. Financial considerations relate to the design of the detailed and realistic pricing (including customer tariffs, off-take agreements, etc.) strategies. The objective is to provide affordable services, encouraging use, while providing the private partner with revenue sufficient for commercially viable operations. Sometimes, the government’s provision of financial support through investment contributions or other forms of ‘viability gap’ support or even ongoing subsidies can achieve this balance.
With regards to commercial issues afflicting the renewable sector, it is at the risk of default in the payment from the distribution licensees across the states. The financial health of licensees is not sound leading to loss of revenue realisation for the generator. In the context of the potential as well as the emerging interest in the renewable energy sector, it is likely that banks desirous of financing renewable energy projects may be unable to do so, by virtue of having exhausted their sectoral exposure limit for the infrastructure or power sector. It will be necessary to ensure that the otherwise bankable RE projects are not deprived of bank finance merely on account of the fact that they belong to a relatively new sector, which is clubbed with an existing sector for which the exposure limit may have already been exhausted. It will therefore be desirable for banks to consider fixing separate exposure limits for financing the RE sector. These limits can be fixed, taking into account the risk factors relevant to the RE sector, and can either be fixed as independent limits for the sector, or can be carved out as sub-limits within the overall exposure limits for the infrastructure or power sector.
Roadmap for PPP structuring in renewable

Proposed Approach for Rural Electrification through PPP in Renewable Energy
6. Proposed Approach for Rural Electrification through PPP in Renewable Energy
6.1. Rural Electrification Sector Background
Expanding electrification is critical to the economic and social development of the country. Despite the implementation of large-scale programmes over the years, India’s achievement in providing access to electricity leaves much to be desired. According to the recent Census 2011 data, only 67% of the total households use electricity as a source of lighting, while remaining section of the population still have to resort to other sources such as kerosene. It is discouraging to note that in the last 10 years, electricity coverage has increased by only 11 percentage points. The fundamental reason for this appalling scenario comes from the rural segment. In urban areas, almost 93% of households use electricity as the primary source of lighting, while the corresponding proportion in the rural segment is only 55%. However, the current rural electrification as of October 2014 stands out at 95% throughout the country. So it can be inferred that although the RGGVY had managed to extend grid infrastructure to most of the census villages by the end of the 11th Five-Year Plan (2007–2012), adequate and reliable power supply remains a distant dream.
Source: Census 2011, Household Amenities
Under the RGGVY, most of the census villages were covered and grid infrastructure extended to these villages
in the 11th Five-Year Plan. This coverage, however, makes it difficult to find sizeable numbers of ‘unelectrified’
census villages for future implementation, making a cluster of contiguous unelectrified villages even rarer. At
the same time, hamlets or other small settlements variously referred to as ‘padas or bastis’, that surround
these census villages have no access to grid electricity.
Further, on review of current number of unelectrified villages across various states, it is observed that the state
of Odisha has highest number of unelectrified villages. However, the village electrification rate is pegged at
81.6%. (Source- CEA)
State Number of unelectrified villages
Odisha 8,756
55.31
92.68
67.25
43.15
6.48
31.43
0.55 0.22 0.44 0.46 0.29 0.4
0
10
20
30
40
50
60
70
80
90
100
Rural Urban Total
%
Household by main source of lighting in 2011
Electricity Kerosene Solar Others

Proposed Approach for Rural Electrification through PPP in Renewable Energy
Rajasthan 4,212
Jharkhand 2,,279
Bihar 1757
Arunachal Pradesh 1,613
Source: Rural Electrification Corporation
6.2. Key Model Element
In light of the prevailing gap in rural
electrification and keeping a view the status
of rural household electricity consumption,
expanding the horizon of village
electrification is being contemplated. The
entire gamut for rural electrification must
include unelectrified village, under-electrified
village (grid available but absence of power
supply) and cluster of electrified,
unelectrified and under-electrified villages.
Therefore, plans are being chalked out to
design and structure rural electrification
projects which feeds power to loads across a
cluster of villages which encompass
electrified, unelectrified and under-
electrified villages. In a bid to achieve this
objective, it is imperative to exploit the
available renewable potential, particularly
solar power and create generation assets
which are grid interactive and hence powering the unserved and under-served areas becomes possible.
Towards this, the host state utility in coordination with the state nodal agencies will identify such areas and
conduct a pre-feasibility analysis of setting up such projects. The pre-feasibility analysis shall entail
identification of the site and its solar resource assessment. Once it is established that results of the resource
assessment process are encouraging and that the conditions are conducive, then the host utility needs to
endeavour creating the grid network across the identified area by bringing such an area under its grid
augmentation plan. Following this, the utility in coordination with the state government will secure all the
clearances. Thereafter, these sites will be available for bidding to the private developer by adopting a suitable
project structure.
Since these projects are grid interactive, the procuring state power utilities will provide them a fixed tariff
which may be equivalent to the retail residential. The tariff taken for the sample analysis for this scheme is 4.50
INR kWh which is much below the prevailing solar tariffs discovered across various state bidding. In order to
make such projects financially viable, the central government will provide financial support in form of VGF
through capital subsidy. Adopting cluster approach for developing grid connected projects for rural
electrification has its own set of advantages which includes the following:
On the technology side, small plants adequate for a single village lower the economic viability of the
business. If the plants are made larger so that they can supply power to a few villages and hamlets, the
projects are likely to be sustainable.
Operation of economies of scale and it becomes financially viable to undertake a cluster level approach
vis-a-vis setting up smaller projects of higher costs.
Clustering of electrified,
underelectrified and unelectrified
villages
Under-electrified
Unelectrified

Proposed Approach for Rural Electrification through PPP in Renewable Energy
With the increased size of such projects, the grid compatibility issue subsides in comparison to small
scale projects which are not grid compatible. Also, technical standards for synchronisation of small
systems with the grid at 400V are yet to be issued by the central electricity authority, hence posing a
challenge for operation of small projects once they become grid interactive.
These proposed solar projects will also help the distribution utility fulfil its solar RPO mandate.
Monitoring and overseeing of cluster projects becomes easy and an inexpensive process.
6.3. Project Structuring of proposed Cluster level Grid Interactive RE projects for Rural Electrification
6.3.1. Adopting Transfer over Ownership model
Under the existing framework, for setting up of renewable energy power projects, the location gets notified and
specified by the SNA. However, the identification of sites for setting up the project is the responsibility of the
developer. The developer has the primary responsibility to of identify and secure clearances of the land. It will
be pertinent to mention that for setting solar and wind based projects, identification of the site and getting
prior clearance holds lot of importance. Hence this needs to be undertaken by a competent government
authority who will identify the site and secure all the necessary clearances. Under the transfer mode of the
project structuring, such nuances are being taken care by the government authority.
Under the ownership mode of the project operation for renewable energy, there is a common apprehension
among the lender community regarding the bankability of projects. In such cases, asset financing becomes a
predominant mode of financing while number of project financing cases are low. On other side, it has been
observed that if the legal ownership of renewable projects rests with the government, lenders are inclined to
finance such projects. In the transfer mode of project structuring, legal ownership of the project lies with the
government throughout the project life, before and after the concession period. Additionally, it will be
noteworthy to mention that under the ownership mode of project structuring, the onus of obtaining the
approvals of land and site clearance rests with the developer, and any delay in this regard might lead to a cost
over-run, thereby making the projects unbankable. On the other hand, if the responsibility of securing all
clearances lies with the government, then it will only increase the bankability of the project.
Further, since the objective of renewable projects is towards promoting an ecological sensitive as well as
sustainable development, these projects need to receive financial incentives from the government. Once these
projects are structured to be developed under the transfer mode, it becomes tenable to receive government
support vis-a-vis an ownership structured project which cannot receive any government support.
Therefore, it is suggested that renewable projects need to be developed through the transfer-based project
structuring.
6.3.2. Suitable Transfer variant for RE project development
Essentially, there are three different variants of the transfer model which are currently underway in the power
sector. This includes the build-own-operate-transfer (BOOT), build-own-maintain-transfer (BOMT) and
design-build-finance-operate-transfer (DBFOT). The BOMT model is being adopted in developing rural
electrification projects based on renewable energy projects. While BOMT, BOOT and DBFOT have their own
set of advantages, project structuring under the DBFOT mode has an edge over the others due to some of its
inherent aspects.
The BOOT or BOMT model offers government grants a private entity to finance, design, build and operate a
facility for a specific period of time before the transfer. In both of these models, the ownership of assets rest
with the private party during the period of contract. However, after the end of contract period these assets are

Proposed Approach for Rural Electrification through PPP in Renewable Energy
transferred back to the government department or agency generally at the residual value. However, projects
which have been implemented under the BOOT or BOMT mode, particularly large hydropower projects, have
reportedly faced the lending risk since the ownership during the concession period rests with the developer who
has to procure the land as well as seek clearances from relevant authorities. However, under the DBFOT mode,
the government agency identifies the land and seeks clearances which make the projects more bankable from a
lender’s perspective. Lenders closely evaluate as well as appraise the projects based on RE technology, so a
suitable project structure is imperative. DBFOT is one such project structuring model which might evade the
financial risks surmounted to the project.
The BOMT or BOOT model suffers from another lacuna, specifically on their technical requirement which is
only limited to meet the desired output level at the procurer’s premises. Under the DBFOT model, the technical
requirements of the project specifically are granularly laid out and developer has to abide with it. In order to
keep a check over the technical specifications of the project, institutionalising an ‘independent engineer’ is a
requisite. Non-abidance of the desired technical specification leads to penalty on the developer. This feature is
desirable in context of developing RE projects since it has been frequently observed that developers are not
focussed towards the maintenance of the project leading to a high degree of deterioration of the plant.
In addition, invoking liquidity damages against projects is simpler in the case of DBFOT models, wherein the
government takes control of the assets in case of delay in implementation of the projects. However, experience
of the projects under the BOOT or BOMT model suggests that only monetary penalty can be imposed following
the delay in implementation of the project. In such a scenario, the developer might become uninterested in
completing the project on time.
Additionally, standardised practices under the DBFOT mode incentivises the project developer in
implementing the project before the scheduled date of commissioning. Developers get the unitary charges on
early commissioning and in some cases, an increase in the concession period.
Line items Description for BOOT or BOMT
Description for DBFOT
Ownership • During the contract period ownership is with the private entity.
• After the concession period, ownership rests with the government.
Legal ownership rests with the public utility.
Lender’s comfort Lower Higher
Technical conformity Emphasis more on output Adhering to a specific design and emphasis on improving the reliability of plant with increased output
Clause for invoking of liquidity damage
Available but its occurrence is low Stringent clauses applicable and to be adhered by both the parties
Arbitration No standardised procedure Standardised procedure alike to other infrastructure projects
Incentive for early commissioning
No Yes
6.3.3. Adopting DBFOT for RE based Rural Electrification based projects
6.3.3.1. Learnings from PPP structuring in conventional power ecosystem
Developing a conventional power ecosystem on the PPP basis has been a common and mature practice in
India. Projects spanning from generation- thermal, hydro to the distribution sector have been developed on the
basis of different PPP models. It will be imperative to understand the transformation of different PPP

Proposed Approach for Rural Electrification through PPP in Renewable Energy
structures that have been adopted for optimising resources to the fullest in case of thermal power projects.
With the advent of the Electricity Act,2003, the power generation business became a delicensed activity.
Different modes of developing power generation evolved and one such mode was the case-2 bidding route. The
envisaged development of the ultra mega power plant (UMPPs) is also being undertaken on the case-2 bidding
route. However, since the idea was conceived, there has been a transition in the PPP structuring of UMPPs.
The UMPP projects particularly at Sasan(MP), Mundra(Gujarat), Krishnapatnam(AP) and Tilaya(Jharkhand)
have been developed on the BOO basis. In case of these projects, the Power Finance Corporation (PFC), the
nodal agency for the UMPPs , formed the Special Purpose Vehicle (SPV) with host state governments and
executed certain responsibilities of securing the necessary approvals and clearances such as the identification
and acquisition of land, pollution clearances, water linkage, level 1 environment clearance , securing fuel
linkage, etc. The SPV was eventually transferred to the successful bidder. Off-late, it has been observed that this
mode of project structuring suffered from a principal deficiency since this provided perpetual ownership to the
project developer. Further, acquisition of land, forest clearances by the private entity delayed the project
development.
In light of this consideration, the structuring of coal-based thermal power plants underwent a change when it
was contemplated that the development of upcoming projects will be undertaken based on the DBFOT mode.
Under this structuring option, the onus of securing land as well as obtaining all necessary clearances, including
environment, forest, section 164 etc will be obtained by the utility. Right of use of land for the purpose of
development, operation as well as maintenance of the project are licensed to the developer. At the end of the
concession period, the land along with project assets are transferred back to the utility in order to protect the
public resources such as fuel, land and water which will also revert to the utility.
Adopting the DBFOT variant in the renewable energy space will also provide an obligation to the host utility to
arrange the land for setting up of the project and provide immunity to the developer from the difficulties of
obtaining all the necessary clearances. However, it needs to be considered that under the DBFOT model,
assets transferred at the end of concession period will no longer render usefulness in operation, leading to
owning up of dysfunctional asset by the utility.
6.3.3.2. Removing deficiencies through DBFOT in RE based Rural Electrification Initiatives
In the present context, the renewable energy-based rural electrification initiative in the country is largely been
undertaken through decentralised distributed generation (DDG) projects in areas where the possibility of grid
penetration is not taking place over the next five years. Villages and hamlets not covered under the DDG
scheme is covered under the MNRE initiated through the Remote Village Electrification Programme. The
structures of both these initiatives are similar, with extension of the capital subsidy benefit to developers
under the enrolled initiative being the bedrock.
Project identification and seeking clearance
Under the DDG scheme, the project developer has to submit a Detailed Project Report (DPR) while
seeking the approval. For this purpose, the developer has to undertake a detailed survey of the
proposed village or villages to choose the right technology and to assess the overall viability of the
project. Although the guidelines allow the cost of preparing a DPR as part of the project cost while
seeking financial assistance, developers maintain that it is a difficult process, even impractical, to
expect a project developer to invest in conducting an in-depth field survey, an expensive proposition in
terms of time and money, without any assurance that the project will be approved and in time.
Also, the guidelines are vague on the role and responsibility for social engineering and obtaining the
required clearances for the project site. This lack of clarity not only delays a project but also increases
its costs and affects the cost-sharing mechanism.

Proposed Approach for Rural Electrification through PPP in Renewable Energy
Although the guidelines lay down elaborate procedures for approving DDG projects and for
implementing them, they are silent on the need to adhere to strict timelines in executing those
procedures and taking decisions, and on fallback options in the event of delays. Such disregard for
time-bound action results in delays in approving projects and in implementing them, leading to cost
overruns.
Under the DDG scheme, DPRs are channelled through the project implementing agency (PIA) to the
REC and then to the implementation support group (ISG) for final approval, it takes a long time to get
the approval. By that time the validity period of the tenders or bids floated on the basis of a preliminary
DPR is usually over, leading to further revisions of time and costs.
Tariff setting and project financing
Decentralised distributed generation is more of a government-driven and an operated mechanism. A
90% capital subsidy, although intended to attract the private sector, actually limits the investment
potential for the private sector developer significantly. Raising the remaining 10% as the state
government’s share or as loan from the Rural Electrification Corporation (REC), the implementing
agency, or financial institutions limits the role of the private sector even further, thereby reducing it to
that of a technology supplier.
The DDG guidelines stipulate that the charges for providing power will be paid annually to the project
developer by the implementing agency. The amount is expected to be paid out of the service charges or
fees received by the implementing agency, which is fixed at 8% of the project cost for a state agency
and 9% for CPSUs. The cap on service charges or fees to the state implementing agencies (8% of the
project cost for state agencies and 9% for CPSUs) is likely to be inadequate in bridging the viability gap
between the cost of providing power and revenue collection at the pre-determined tariff from users.
At present, it is almost impossible for any RE-based DDG power plant to survive once grid power
reaches the project site, mainly because tariffs for grid-supplied power are low. For consumers with low
power consumption (in the case of multi-layered tariffs), for BPL households, and for categories such
as agriculture, the tariffs are even lower. As a result, as soon as grid-supplied power is available,
consumers prefer to switch to the grid and abandon the DDG project.
If it is assumed that grid extension is inevitable in most parts of the country, the question that arises is
that at what rate should a DDG project supply electricity to consumers and then to the grid once it is
available? In order to ensure that the DDG project is viable, the guidelines recommend a fixed tariff
based on the number of electric points or for each month, rather than that based on metered
consumption. The guidelines also leave it to the implementing agency to devise ways for fixing these
tariffs. However, once a plant is connected to the grid, these tariffs no longer apply and are replaced by
those fixed by the state electricity regulatory commission, as is mandatory.
Guidelines maintain that the viability gap needs to be bridged by using some amount from the service
charges or fees paid to the implementing agency. However, whether such an arrangement will be
honoured by the implementing agency, and honoured in time, is a moot question, which jeopardises
profitable operation of a DDG plant.
DBFOT provides a one-stop show for identification and securing clearance
The power procuring utility identifies the site and secures all clearances required for the project. This provides visibility to project developer and gives him or her freedom from the difficulties of getting the clearance.
The government conducts the pre-feasibility of the site to the extent of the nature of the project to be implemented and technology to be adopted.

Proposed Approach for Rural Electrification through PPP in Renewable Energy
Transfer issue
According to the guidelines, DDG projects are to be owned by the state government and implemented
on a BOMT basis. This model requires the project developer to maintain the power plant for five years
and then transfer it to the state government, which means that the project developer runs the plant in
the initial five years during which a plant usually experiences maximum problems, once its operation
stabilises, the plant is transferred. This condition offers little motivation to the developer to resolve the
teething problems adequately because that investment will bring in no returns. The same condition also
prevents the developer from earning a profit after streamlining plant operations.
6.3.3.3. Other Perceived advantages
The DBFOT model offers another strategic advantage to the project developer and more specifically to the
project as whole. This can be corroborated from the fact that a developer gets incentivised for providing a
higher generation than the prescribed threshold level in the DBFOT model.
It would be noteworthy to mention that in the Indian conventional power eco-system and particularly in the
case-2 bidding for thermal power projects, the project developer is required to provide and seek approval for a
specific project design from the power procurer. Additionally, the developer is comforted by providing incentive
for attaining higher plant availability factor (PLF) over and above the prescribed threshold limit. This motivates
the developer to commission a highly efficient system in place which invariably meets the technical
specification and also helps in incentivising by achieving the higher PLF.
A counter view to this argument can also be presented wherein the installation of a highly efficient system
might lead to provisioning of higher capital cost leading to increase in tariff in order to meet a desired level of
return. However, this hypothesis gets discounted with the fact that with a higher generation in place, the cost of
generation will not increase leading to achievement of desired level of return without increase in tariff.
This also hold true for the renewable power projects where installation of the efficient designs needs to be
encouraged leading to higher optimisation of the resources and system. It will also lead to requirement of lower
support from the government, and thereby the developer becomes competitive in the bidding phase.
The DBFOT provides clarity to developers on the financing aspects of the project and
provides concrete tariff setting mechanism.
The financing terms are clear and as per the normative principles of grid connected projects prescribed by the regulator.
Tariff setting principles are as per the directives of the regulator and the applicable tariff for the retail consumer in taken into consideration.
In order to make the projects viable, the financial support is extended in the form of VGF through capital subsidy.
The DBFOT provides clarity to the developers on the ownership of the project before and
after the transfer of the asset.
The developers are provided with the clarity that legal ownership of the project will rest with the government. Under the DBFOT model, the concession period is for the useful life wherein the project will be providing comfort to the lenders.

Proposed Approach for Rural Electrification through PPP in Renewable Energy
6.3.4. Elements of the proposed implementation structure for Rural Electrification
6.3.4.1. Roles and Responsibilities of the involved entities
In order to implement the proposed project for carrying out rural electrification, the DBFOT model has been
proposed. Three entities or parties are involved in the project which include the state utility (procurer of the
power), private developer developing the grid connected project for a cluster of villages and the central
government who in turn is providing
financial support to the project so as to
make it more viable. The selected project
developer receives a concession to
finance, build, control, and operate a
facility for a limited period of time, after
which the responsibility for the facility is
transferred to the government. The
private party typically assumes primary
responsibility for constructing the
project, arranging financing, performing
maintenance, and collecting revenue,
while the public sector retains legal
ownership.
Under the proposed model, the roles and responsibilities of the stakeholders, the project developer, utility
procuring the power as well as the government providing the financial support has to be clearly stated out.
Role of the project developer
Procure appropriate proprietary rights, licences, agreements and permissions for materials, methods,
processes, know-how and systems used for installing the power station.
Perform and fulfil its obligations under the financing agreements.
Increased generation
Cost of generation
remains wihin prescribed
limits
Benefits of having
optimal and efficient plant
design
Financial support from government is
low
Involved entities in
the proposed DBFOT model
Government of India
Prospective private
developer
Host state utility

Proposed Approach for Rural Electrification through PPP in Renewable Energy
Ensure and procure that its contractors comply with all applicable permits and applicable laws in the
performance by them of any of the project developer’s obligations.
Comply with the provisions of applicable laws, particularly the respective state grid code with regard to
metering of supply of electricity.
Transfer the project assets to the utility upon termination of the concession agreement.
Role of the host utility
Support the project developer in providing inter-connectivity to the project.
Procurement of the power generated from the generating unit at a specified tariff level.
Conduct the pre-feasibility of the site in coordination with the state nodal agency(SNA) with an
objective to estimate the resource availability.
Provide reasonable support and assistance to the project developer in procuring applicable permits,
including site clearances, required from the government agency for implementation and operation of
the project.
Procure the assets at the end of the useful life.
Role of the government
Providing financial support to the identified project in the form of VGF so that the SPD is able to
achieve financial closure for the full amount if required at the time of signing of PPA.
Conducting the bid process management process.
Monitoring the operation of the awarded projects.
6.3.4.2. Perceived risks
The risks associated with PPP projects include pre-construction, construction, traffic and revenue, currency,
force majeure, political and financial. These must be addressed in a manner satisfactory to debt and equity
investors, before they commit to funding the project.
Pre-construction risk: Ensuring environmental compliance and other project requirements in the
pre-construction period may cause delays and cost overruns during project development. The private
sector usually bears the risk of such delays that crop up in the pre-construction stage. The public
sector, however, often takes responsibility for acquiring the right-of-way, environmental clearance, and
any delay in getting these sanctions, may delay implementation.
Construction risk: During the construction phase, design changes, unforeseen geological and
weather conditions and the unavailability of materials and labour, can prompt delays and cost
overruns. The private sector typically takes primary responsibility for cost overruns and delays during
this period. However, renewable projects (projects undertaken in high-risk terrains such as mountains
and rivers) that face substantial uncertainties during construction, may require the public sector to
share the construction period risks to attract private partners.
Power generation and revenue realisation risk: Power generation from renewable energy
depends on the vagaries of nature and therefore its output cannot be accurately predicted. Solar
resource data, computed from a 12-year solar cycle and projected over 25 years, is required to estimate
the electricity generation potential of the site and to determine the economic feasibility of the project.

Proposed Approach for Rural Electrification through PPP in Renewable Energy
The time spent in procuring the requisite certified data from technology providers, to accurately assess
project feasibility and to secure performance guarantee, can cause project delays. Despite employing
sophisticated techniques to forecast hourly solar irradiation using typical meteorological year (TMY),
solar resource data may vary by 15% on a year-to-year basis. Consequently, any approach by the utility
to penalise lower generation of electricity may be considered contrary to the principles of power
generation through renewable sources and the generation or operation risk may come into play. This
risk is essentially borne by the private developer.
Additionally, during the generation periods of the solar projects, if the distribution utility is unable to
draw power for any reason, owing to non-availability of an evacuation line, there is no provision for the
deemed generation. Most commercial documents, particularly concerning PPA, recommends the
delivery point at the state transmission ytility (STU) substation’s commercial metering point.
Accordingly, the losses up to the metering point as well as the risk of curtailment due to non-availability
of an evacuation line will have to be borne by the solar project developer. This risk is also borne by the
private developer.
I The responsibility of the final payment rests on the distribution utility. If the utility fails to make the
payment, the risk of the default on the payment increases for the project developer. This makes the
project un-bankable too.
Political risk: Political risk involves government actions that could impair a private developer’s ability
to generate earnings. Such actions include terminating concessions or imposing taxes or regulations on
the project. This fall-out severely damages its value to investors; disallows private partners to charge
and collect revenue as specified under the concession agreement; prevents investors from transferring
earnings out of the country or prevents contract disputes to be settled fairly under a neutral
jurisdiction.
Financial risk: Financial risk is the risk that project cash flows may be insufficient to pay an adequate
return on the private debt and equity invested in the project. This occurs due to the limited availability
of the resource assessment data, which forms the basis for projecting future revenues. The second is the
strength of public power purchasing agreements (PPAs) due to the weak financial health of the host
utilities. The private sector bears the financial risk.
Pre-
construction
risk
Construction Power
generation
and
Revenue
Realisation
Force
Majeure
Political Financial
6.3.4.3. Risk Mitigation Measures
As aforementioned, major types of risks associated with the development of projects under the proposed
DBFOT model and mitigation strategies are provided below:
Major risk to private
sector Risk shared Major risk to
public sector

Proposed Approach for Rural Electrification through PPP in Renewable Energy
Risk Mitigation Matrix
Risks Sources Mitigation strategies
Pre-construction risk Delay in sit identification
Delay in getting the land clearance
in state
Advancement in the date for
signing the PPA
Single window clearance for the
renewable project to be
institutionalized at the state level
Institutionalizing of a clearance
desk for renewable project at
central level
Construction Risk Contractual issues with equipment
supplier, EPC contractor
Lack of capacity to pre-identify
financially viable projects under an
EPC approach
Inferior and inefficient
components
Miscalculation of construction costs
Wrong selection of third party as a sub-contractor for implementation of project
On-site work delays, affecting the financing costs
Focus on selecting EPC contractor
with rich technical experience and
sound financial strength with high
energy costs
Put penalty clauses to mitigate time
and cost overrun in project
execution.
Clauses of the agreement to be
customized in order to evince
payment after the supply of the
material/equipment in the
developers premises
Back to back guarantee with the equipment manufacturer and EPC provider
Include penalty clauses in contract with EPC provider in case of inferior component
Obtain firm bids from contractors for EPC selection
Maintain contingencies
Evaluate site expenses
Include a clause for reimbursement in case of delays
Power Generation Risk Ground solar data is sketchy
Absence of credible and adequate data
Develop competencies in house for ensuring the validity of solar data
Include a clause in the contract with equipment suppliers for adjustment in case of misinformation on resource availability
Apply adequate contingencies in contract with regards to fluctuations in resource availability
Revenue Realisation risk Financial health of the utilities and Use proper ESCROW/LC

Proposed Approach for Rural Electrification through PPP in Renewable Energy
other obligated entities
Past track record of the power procurer
Absence of adequate payment security cover
mechanism to secure payment
Backing by State/Central government Guarantee
Well defined contractual agreement conditions between project developer and power off-taker
Financial Risk Unable to achieve project finance due to low DSCR
Certainty of power off-take by utility by offering attractive tariff through a guaranteed long term PPA.
Ensuring support from MNRE through VGF mechanism in order to leverage bilateral/multilateral and commercial borrowings.
Sovereign guarantee from GOI for loans from multilateral/ bilateral will reduce financing risk,
6.3.5. Incorporating best bidding practices
Section 10 of the Electricity Act, 2003, states that a generating company may supply electricity to any licensee
in accordance with the Act and rules and regulations made thereunder and may, subject to the regulations
made under sub-section (2) of section 42, supply electricity to any consumer. The National Tariff Policy (NTP),
formulated by the Ministry of Power, outlines specific guidelines for the purchase of tariff for power generated
from renewable energy sources.
Section 6.4 “…. It will take some time before non-conventional technologies can compete with conventional
sources in terms of cost of electricity. Therefore, procurement by distribution companies shall be done at
preferential tariffs determined by the appropriate commission.
Such procurement by distribution licensees for future requirements shall be done, as far as possible, through a
competitive bidding process under section 63 of the Act within suppliers offering energy from the same type of
non-conventional sources. In the long term, these technologies will need to compete with other sources in
terms of full costs.”
The MNRE issued the standard bidding guidelines for renewable power under the provisions of section 63 of
the Electricity Act, 2003, for the procurement of electricity by distribution licensees (procurer):
Long-term procurement of electricity for a period of seven years and above
Medium-term procurement for a period of up to seven years but exceeding one year
The standard bidding guidelines for the procurement of power through competitive bidding from renewable
power projects at a particular location has been classified as Case-2 bidding. Case-2 bidding route is a single-
staged process, wherein the request for proposal (RFP) is issued to the prospective bidder and responses of the
bidder are evaluated against the specified technical specifications and lowest cost of providing the power. The
time taken for completing the entire process from issuance of RFP to signing the PPA has been prescribed for
150 days.
The bidding of the solar projects under both phases of the JNNSM also culminated on a single-stage level. The
evaluation process of the bidding stage comprised the following two steps:
Techno-commercial evaluation

Proposed Approach for Rural Electrification through PPP in Renewable Energy
Financial bid (VGF requirement) evaluation
Based on the understanding that the total capacity of such projects will be in the range of 3-4MW, the single-
stage bidding process is adjudged as the most suitable. The government-appointed implementing agency issues
the request for selection (RFS) and calls for techno-commercial and financial bids from the prospective
developers. Evaluation of the techno-commercial bids takes place in compliance with the technical specification
provided in the RFS, while the financial bid is evaluated against the minimum financial support required from
the government. In this regard, the implementing agency will issue the standard PPA, site-specific project pre-
feasibility report and VGF securitisation agreement.
Illustrative bidding process timeline
The PPA earmarks the standard roles and responsibilities of the parties involved. It also mentions ways to
incentivise the developer to pursue a higher availability of the plant. VGF securitisation agreement will lead to
creating security by way of charge in favour of the government on the assets of the proposed project.
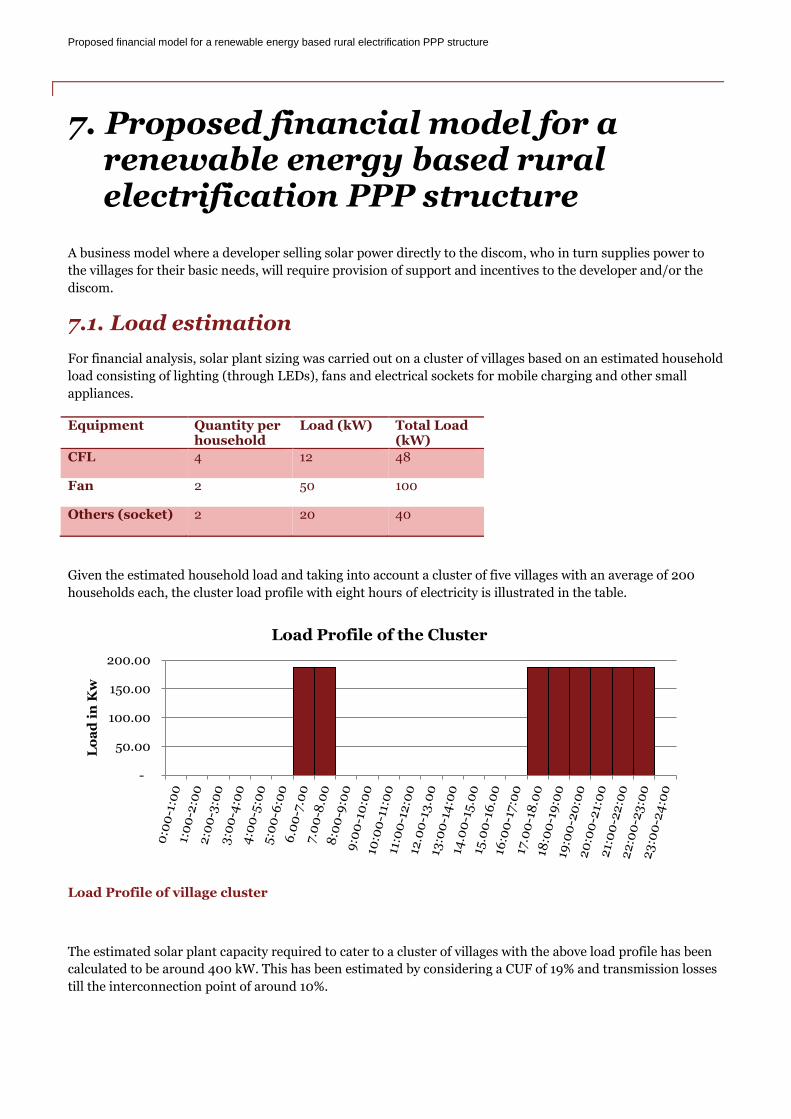
Proposed financial model for a renewable energy based rural electrification PPP structure
7. Proposed financial model for a renewable energy based rural electrification PPP structure
A business model where a developer selling solar power directly to the discom, who in turn supplies power to
the villages for their basic needs, will require provision of support and incentives to the developer and/or the
discom.
7.1. Load estimation
For financial analysis, solar plant sizing was carried out on a cluster of villages based on an estimated household
load consisting of lighting (through LEDs), fans and electrical sockets for mobile charging and other small
appliances.
Equipment Quantity per household
Load (kW) Total Load (kW)
CFL 4 12 48
Fan 2 50 100
Others (socket) 2 20 40
Given the estimated household load and taking into account a cluster of five villages with an average of 200
households each, the cluster load profile with eight hours of electricity is illustrated in the table.
Load Profile of village cluster
The estimated solar plant capacity required to cater to a cluster of villages with the above load profile has been
calculated to be around 400 kW. This has been estimated by considering a CUF of 19% and transmission losses
till the interconnection point of around 10%.
-
50.00
100.00
150.00
200.00
Lo
ad
in
Kw
Load Profile of the Cluster

Proposed financial model for a renewable energy based rural electrification PPP structure
For the base case viability assessment, viability gap funding requirement has been estimated by keeping a
constant equity internal rate of return (IRR) at 16%. The model is based on a cost plus approach based on
assumptions with a support component in the form of VGF for an expected rate of return on the project. Other
support options including concessional loan, longer tenure loan, etc. will also be analysed to arrive at an
acceptable VGF requirement.
7.2. Financial analysis
The individual solar PV power project assumptions have been summarised in the table. They are in the drafting
stage, are indicative and can be modified as per different business models off-take and support arrangements.
Currently, financing for base case calculations have been done by taking a loan at an interest rate of 12% and
tenure of 12 years with a one-year moratorium.
Base case assumptions for solar PV projects
Assumption head Sub-head Unit Value
Installed power generation capacity
Project capacity kW 400
Generation Capacity utilisation factor % 19.0%
Deration % 0.50%
Time-lines Life of the project Years 25
Construction period Months 6
Project capital cost Total power plant cost Mn INR 27.88
Total hard costs Mn INR 24.74
Total soft costs Mn INR 3.14
Financing assumptions
Debt % 70%
Equity % 30%
Interest rates
Debt % 12.0% (domestic)
8% (multilateral through GoI)
Loan tenure (repayment + moratorium)
Debt Years 12+1 (domestic)
15+5 (multilateral through GoI)
Cost of equity and capital Return on equity post-tax % p.a 15.5%
WACC % 9.6%
Taxes and depreciation Income tax % 33.99%
MAT rate % 20.96%
Depreciation rate-first 12 years
% 5.83%
Depreciation rate-remaining years
% 1.54%
Salvage value % 10%
Depreciation as per Income Tax Act
15%
IT depreciation rate 15%
Additional depreciation benefit
20%
Operation and Maintenance
O&M charges Mn INR 0.40
O & M expenses escalation % 5.72%

Proposed financial model for a renewable energy based rural electrification PPP structure
Working capital O&M charges Months 1
Receivables for debtors Months 2
Maintenance % of O&M expenses
15%
Interest on working capital
% 12.75%
Tariff and revenue Levellised tariff (for VGF scenario)
INR per kWh 4.50
Return expectation Equity IRR % 16%
The capital cost also includes the cost of storage through batteries. The expected return for the investor or
project developer has been fixed at an equity IRR of 16% to first calculate the required levelised tariff to achieve
the expected return.
With the current assumptions and expected return, the required tariff for the solar PV rural electrification
project without VGF is 7.80 INR per kWh. Since this is higher than the tariffs discovered in state solar policy
allocations, the VGF scenario has been developed with a fixed tariff of 4.50 INR per kWh (fixed to reduce the
burden on discoms). With this tariff and the above assumptions, at an equity IRR of 16% the required VGF is
13.18 million INR which is 47.3% of the total capital cost. The salvage value of the power plant after 25 years of
operation under the VGF option is Rs. 3.20 million INR. This value is the accounting salvage value of 10% of
fixed assets reduced by the amount of VGF paid and is given to the developer to sell.
7.2.1. Sensitivity analysis
Sensitivities have been run on the proposed solar PV rural electrification project, by changing the main inputs
including CUF, tariff, capital cost, storage and expected IRR. Tariff required for zero VGF has also been
estimated.
Analysis of different scenarios for the proposed solar PV project
Tariff
(INR/kWh)
Expected
equity IRR (%)
CUF (%) Capex (mn INR) VGF required
Mn INR % of capex
4.50 16% 19.0% 27.88 13.18 47.3%
4.50 16% 18.0% 27.86 14.13 50.70%
4.50 16% 20.0% 27.91 12.19 43.70%
5.00 16% 19.0% 27.94 11.21 40.00%
4.50 14% 19.0% 27.90 12.33 44.20%
5.50 16% 19.0% 28.00 9.22 32.90%
7.80 16% 19.0% 28.26 0 0%
4.50 16% 19.0% 25.38 (10% reduction)
10.70 42.10%
The capital cost varies due to change in interest during construction (IDC) as the level of VGF changes along
with amount of debt required. The first calculation row is the base case output. Based on the sensitivity
analysis, at a tariff of 7.80 INR per kWh, the VGF requirement is 0, to achieve an equity IRR of 16%. The VGF
requirement at a tariff of 5.5 INR per kWh is 9.22 million INR (32.90% of capex) with respect to the base case,
and is within the limit of 40% VGF. Therefore, tariff is a sensitive factor in the viability of solar PV projects.

Proposed financial model for a renewable energy based rural electrification PPP structure
Sensitivities have also been done on the interest rate to assess its sensitivity and terms of loan on VGF
requirement.
Analysis of different scenarios of financing terms for the proposed solar PV project
Interest
rate
Tenure
(excluding
moratorium in
years)
Moratorium
in years
Capex (Mn INR) VGF required
Mn INR % of capex
12% 12 1 27.88 13.18 47.3%
12% 15 3 27.90 12.50 44.8%
8% 12 1 27.81 11.26 40.05%
8% 15 3 27.83 9.81 35.20%
Interest rate is a highly sensitive factor impacting the equity IRR and with a lower interest rate, the quantum of
VGF required decreases. With a 8% interest rate, a loan tenure of 15 years and a three-year moratorium period,
the VGF required is 35.20%.
7.3. Support required for pilot projects
In view of the high level of VGF required for the base case scenario, other incentives have been proposed to
reduce the amount of VGF required to make the project feasible. Some of the incentives assessed to calculate
the VGF include low-cost concessional loan, longer tenure loan and moratorium period, higher debt-equity
ratio or a combination of these incentives and support mechanisms.

Proposed financial model for a renewable energy based rural electrification PPP structure
The following table lists the possible options to supplement the VGF and to get it to acceptable levels,
Summary of different scenarios with VGF requirements
Option no.
Scenario description VGF Required (mn INR) per project
VGF as a % of capex
Mode of financing
Government financing
Private sector financing
Multilateral/ bilateral through GOI financing
Base Case
Base case with only VGF as an incentive 13.18 47.30% Debt: 0.00% 36.89% 0.00%
Equity/ VGF: 47.30% 15.81% 0.00%
Total: 47.30% 52.70% 0.00%
I VGF as an incentive along with a debt equity ratio of 80:20, 100% and domestic private debt at 12% interest a tenure of 15 years and a moratorium of three years
11.81 42.24% Debt: 0.00% 46.21% 0.00%
Equity/ VGF: 42.24% 11.55% 0.00%
Total: 42.24% 57.76% 0.00%
II VGF as an incentive along with a debt equity ratio of 70:30, 50% debt from private domestic FIs at 12% interest rate and tenure of 12 years and a one year moratorium and rest 50% from multilaterals at 8% with 15 years tenure and a moratorium of five years
11.36 40.78% Debt: 0.00% 20.73% 20.73%
Equity/ VGF: 40.78% 17.77% 0.00%
Total: 40.78% 38.50% 20.73%
III VGF as an incentive along with a debt equity ratio of 80:20, 50% debt from private domestic FIs at 12% interest rate and tenure of 12 years and a one year moratorium and rest 50% from multilaterals at 8% with 15 years tenure and a moratorium of five years
10.38 37.16% Debt: 0.00% 25.14% 25.14%
Equity/ VGF: 37.16% 12.57% 0.00%
Total: 37.16% 37.71% 25.14%
IV VGF as an incentive along with a debt equity ratio of 70:30, 100% debt from multilaterals at 8% interest rate and tenure of 15 years and a
9.03 32.44% Debt: 0.00% 0.00% 47.29%
Equity/ VGF: 32.44% 20.27% 0.00%

Proposed financial model for a renewable energy based rural electrification PPP structure
moratorium of five years Total: 32.44% 20.27% 47.29%
V VGF as an incentive along with a debt equity ratio of 80:20, 40% debt from private domestic FIs at 12% interest rate and tenure of 12 years and a moratorium of one year and rest 60% from multilaterals at 8% with 15 years tenure and a moratorium of five years
9.82 35.18% Debt: 0.00% 20.74% 31.11%
Equity/ VGF: 35.18% 12.96% 0.00%
Total: 35.18% 33.71% 31.11%
VI VGF as an incentive along with a debt equity ratio of 70:30, 30% debt from private domestic FIs at 12% interest rate and tenure of 12 years and a moratorium of one year and rest 70% from multilaterals at 8% with 15 years tenure and a moratorium of five years
10.53 37.81% Debt: 0.00% 13.06% 30.47%
Equity/ VGF: 37.81% 18.66% 0.00%
Total: 37.81% 31.72% 30.47%
VII VGF as an incentive along with a debt equity ratio of 80:20 and debt at 8% interest rate, a tenure of 15 years and a moratorium of five years
7.38 26.39% Debt: 0.00% 0.00% 58.89%
Equity/ VGF: 26.39% 14.72% 0.00%
Total: 26.39% 14.72% 58.89%
VIII VGF as an incentive along with a debt equity ratio of 80:20, 40% debt from private domestic FIs at 12% interest rate and tenure of 12 years and a moratorium of two years and rest 60% from multilaterals at 8% with 15 years tenure and a moratorium of five years
9.68 34.68% Debt: 0.00% 20.90% 31.35%
Equity/ VGF: 34.68% 13.06% 0.00%
Total: 34.68% 33.97% 31.35%
IX VGF as incentive along with a debt equity ratio of 80:20, 30% debt from private domestic FIs at 12% interest rate and tenure of 12 years and a moratorium of one year and rest 70% from multilaterals at 8% with 15 years tenure and a moratorium of five years
9.28 33.24% Debt: 0.00% 16.02% 37.39%
Equity/ VGF: 33.24% 13.35% 0.00%
Total: 33.24% 29.37% 37.39%

Proposed financial model for a renewable energy based rural electrification PPP structure
Based on the VGF and financial analysis of the above cases, the VGF required as a percentage of capex is below
40% for the following cases-
VGF as an incentive along with a debt equity ratio of 80:20, 50% debt from private domestic FIs at 12% interest rate and tenure of 12 years and a one year moratorium and rest 50% from multilaterals at 8% with 15 years tenure and a moratorium of five years
VGF as an incentive along with a debt equity ratio of 70:30, 100% debt from multilaterals at 8% interest rate and tenure of 15 years and a moratorium of five years
VGF as an incentive along with a debt equity ratio of 80:20, 40% debt from private domestic FIs at 12% interest rate and tenure of 12 years and a moratorium of one year and rest 60% from multilaterals at 8% with 15 years tenure and a moratorium of five years
VGF as an incentive along with a debt equity ratio of 70:30, 30% debt from private domestic FIs at 12% interest rate and tenure of 12 years and a moratorium of one year and rest 70% from multilaterals at 8% with 15 years tenure and a moratorium of five years
VGF as an incentive along with a debt equity ratio of 80:20 and debt at 8% interest rate, a tenure of 15 years and a moratorium of five years
VGF as an incentive along with a debt equity ratio of 80:20, 40% debt from private domestic FIs at 12% interest rate and tenure of 12 years and a moratorium of two years and rest 60% from multilaterals at 8% with 15 years tenure and a moratorium of five years
VGF as incentive along with a debt equity ratio of 80:20, 30% debt from private domestic FIs at 12% interest rate and tenure of 12 years and a moratorium of one year and rest 70% from multilaterals at 8% with 15 years tenure and a moratorium of five years
The lowest direct outflow for the government is in the scenario with VGF and a concessional multilateral or
bilateral loan facilitated by the government of 8% with 15 years of tenure and five years of additional
moratorium and a debt-equity ratio of 80:20 with a VGF of 7.38 million INR per project of 400 kW, i.e. 26.39%
of total project cost. This scenario, however limits the direct exposure of the developer to only 14.72% of the
total capital cost.
To increase the responsibility of financing for the developer and increase the developer’s commitment, the
scenario selected is with VGF as incentive with a D: E ratio of 80:20 and 40% debt from private domestic FIs at
12% interest rate and tenure of 12 years and two years moratorium and rest 60% from multilaterals at 8% with
15 years tenure and five years moratorium. This scenario requires a VGF of 34.68% of capex, i.e. 9.68 million
INR per project. The other sources of finance are private sector (33.97% of capex- 13.06% equity and 20.90%
debt) and 31.35% debt from multilateral or bilateral agencies facilitated by the government.
This level of VGF support is in line with the government constraints and can be achieved if part of the debt
funding can be raised by concessional loans from multilateral/ bilateral agencies at attractive terms including
8% interest rate, 15 year loan tenure and a moratorium of five years. To provide such a lower cost and long term
debt, the government along with foreign multilateral and bilateral agencies will need to leverage their funds to
create a pool of funds to lend to such projects.

Proposed financial model for a renewable energy based rural electrification PPP structure
Therefore, the suggested option that reduces the government outflow is scenario VIII. The main assumptions of
the suggested scenario are as follows:
7.4. Replicable potential and funds required for scheme
Rural electrification and its augmentation are important to bridge the rural-urban divide and improve the
quality of life in villages. Even now, more than 25,000 villages in India remain un-electrified. There are several
under-electrified and underserved villages without electricity or with insufficient electricity, even though a grid
is available. Electricity is now a basic necessity and is important to increase the level of economic activity across
such villages.
A clustered-village approach provides ample potential for developing renewable projects for rural electrification
and minimises the funds required from the government. This model also promotes private participation, which
helps tap vast private funds for this purpose.
This model should first be done on a pilot basis, covering the most un-electrified regions in India, and then
ramped up. The table captures the top five states—Odisha, Rajasthan, Jharkhand, Bihar and Arunachal
Pradesh—as per the number of un-electrified villages (source CEA).
State No. of un-electrified villages
Odisha 8756
Rajasthan 4212
Capacity of sample project: 400 kW (solar PV technology)
Villages covered: 5
Households covered: 1000
Capital cost: 27.92 million INR
Tariff: 4.50 INR per kWh (fixed for entire project life)
VGF required per 400 kW project: 9.68 million INR (34.68% of capital cost)
Post VGF Debt: Equity Ratio: 80:20
Post VGF funding sources:
Equity (from developer) required per project: 3.65 million INR (20.0% of Post-VGF capital cost)
Debt (from developer) required per project: 5.84 million INR (32.0% of Post VGF capital cost)
Debt (from multilateral/ bilateral) required per project: 8.75 million INR (48.0% of Post VGF
capital cost)
Terms of domestic (developer) loan: interest rate- 12%, 12 years with additional two years of
moratorium on principle
Terms of multilateral/ bilateral loan: interest rate- 8%, 15 years with additional five years of
moratorium on principle
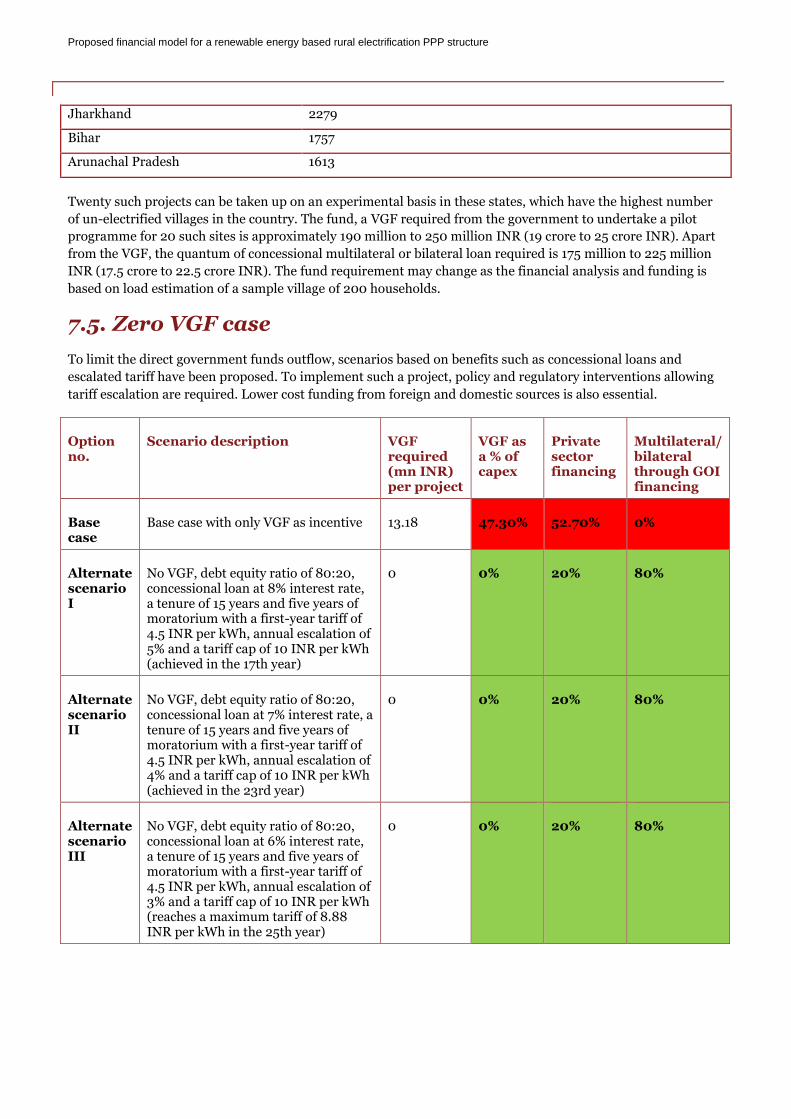
Proposed financial model for a renewable energy based rural electrification PPP structure
Jharkhand 2279
Bihar 1757
Arunachal Pradesh 1613
Twenty such projects can be taken up on an experimental basis in these states, which have the highest number
of un-electrified villages in the country. The fund, a VGF required from the government to undertake a pilot
programme for 20 such sites is approximately 190 million to 250 million INR (19 crore to 25 crore INR). Apart
from the VGF, the quantum of concessional multilateral or bilateral loan required is 175 million to 225 million
INR (17.5 crore to 22.5 crore INR). The fund requirement may change as the financial analysis and funding is
based on load estimation of a sample village of 200 households.
7.5. Zero VGF case
To limit the direct government funds outflow, scenarios based on benefits such as concessional loans and
escalated tariff have been proposed. To implement such a project, policy and regulatory interventions allowing
tariff escalation are required. Lower cost funding from foreign and domestic sources is also essential.
Option no.
Scenario description VGF required (mn INR) per project
VGF as a % of capex
Private sector financing
Multilateral/ bilateral through GOI financing
Base case
Base case with only VGF as incentive 13.18 47.30% 52.70% 0%
Alternate scenario I
No VGF, debt equity ratio of 80:20, concessional loan at 8% interest rate, a tenure of 15 years and five years of moratorium with a first-year tariff of 4.5 INR per kWh, annual escalation of 5% and a tariff cap of 10 INR per kWh (achieved in the 17th year)
0 0% 20% 80%
Alternate scenario II
No VGF, debt equity ratio of 80:20, concessional loan at 7% interest rate, a tenure of 15 years and five years of moratorium with a first-year tariff of 4.5 INR per kWh, annual escalation of 4% and a tariff cap of 10 INR per kWh (achieved in the 23rd year)
0 0% 20% 80%
Alternate scenario III
No VGF, debt equity ratio of 80:20, concessional loan at 6% interest rate, a tenure of 15 years and five years of moratorium with a first-year tariff of 4.5 INR per kWh, annual escalation of 3% and a tariff cap of 10 INR per kWh (reaches a maximum tariff of 8.88 INR per kWh in the 25th year)
0 0% 20% 80%

Proposed financial model for a renewable energy based rural electrification PPP structure
These scenarios require no VGF or subsidy support, but require a tariff escalation structure along with a low-
cost funding option. However, such a structure may not be suitable at the village level and may cause discoms to
renege on such higher tariffs and increase project risk.

Way Forward
8. Way Forward
8.1. Recommendations
It has been endeavored to put across certain recommendations for government interventions to support and
promote renewable projects on such approach.:
Functional Recommendations:
To date, over 25000 villages remain un-electrified in the country along with the presence of plenty under-electrified villages where grid is available but there is no power. Also, with the increase in the electrified villages, economic activity across such villages increases which creates the demand for additional power. This structure provides an ample potential for developing renewable projects on the clustering approach by adopting suitable project structure. Government should pronounce a policy apparatus considering these un-electrified areas which could be energized by renewable energy projects- particularly solar.
The annual energy supply position in FY 14 revealed a deficit of 4.2%. This shows that there is shortage of electricity in the country which can be plugged by augmenting generation assets. Encouraging small scale grid interactive renewable projects would be one such step towards mitigating the energy gap. Also, this will lead to reduction of the line losses once it becomes grid connected following the transfer of assets since the power generating assets would be near to the load center.
Operational Recommendations:
With regards to transfer of the assets at the end of the useful life to the utility under the proposed
model, it is recommended that the transfer of the assets should be done to state government. It should
be the sole discretion of the state government to decide the end state government owned entity of the
transferred assets.
o Owing to the fact that the assets gets transferred back at the end of the useful life i.e. normally
the concession period, the host distribution utility should be equipped with the skill set to
operate the generating assets. The best illustration in this regard would be learning to operate
the DDG assets which have come up for rural electrification. This may enable the distribution
utility to handle the transferred assets at the end of concession period.
o Generation companies owe the expertise to handle the power projects but face the limitation
on handling small scale distributed generation assets. However, impetus on capacity building
for generating projects should be provided in order to enable them in handling projects of such
nature.
Following the transfer of the assets at the end of the concession period, it must be endeavored need to
take on distribution on behalf of DISCOMs instead of confining themselves to generating power .
Therefore, we believe that project developer may also undertake metering, billing, and collection
(MBC) on behalf of the DISCOM within a given cluster under the franchisee mode. This would keep the
commercial interest of the developer intact.
In order to ensure that deterioration of project does not take place and plant gets transferred at the end
of concession period with high operational capability, an ‘Independent Engineer’ must be instituted
who inspects the operation of the plant at regular interval .

Way Forward
Technical and Regulatory Requirements
Strong contractual arrangement for both generation and distribution with appropriate regulatory
oversight under 8th Proviso of Section 14 of Electricity Act should be provided.
Proper inter- connectivity standards should be pronounced by CEA to formalize the smooth operation
of such projects
Financial Recommendations:
In order to attract investors for developing projects under this model, transparent bidding process
needs to be adopted in order to discover the suitable ‘cost’. All such discovered cost should be project
specific wherein developer should be provided with the comfort by providing the government
incentives.
Bidding of the projects could be in form of minimum tariff or the minimum capital cost subsidy
required from government.
Longer tenure loans should be extended to such projects to reduce the requirement of government
fund and for increase replication.
Multilateral/Bilateral institutions should be evinced to provide financial support to such projects
wherein low cost loans could be provided in order to enhance the financial viability of the project.
Possible avenues for securing the support includes:
o Viability Gap Funding o Re-finance scheme initiated by IREDA o REC-DDG scheme

Annexure: A few other case studies- PPP in Wind & Solar
Annexure: A few other case studies- PPP in Wind & Solar
1. Cabeolica Wind Power Project of 25.5MW
Title Cabeolica Wind Power Project of 25.5MW
Location Cape Verde
Stakeholders Cabeólica, S.A. is a Cape Verdean company created in 2009. It is based on a Public-Private-Partnership (PPP) established in 2008 between InfraCo Limited, a privately managed donor-funded infrastructure development company, the Government of Cape Verde (Ministry of Tourism, Industry and Energy) and Electra, S.A.R.L., the local utility company. The PPP administers the development, financing, construction, ownership and operation of four wind farms in Cape Verde, with a total installed capacity of 25.5 MW, distributed throughout the islands of Santiago (9.35 MW), São Vicente (5.95 MW), Sal (7.65 MW) and Boa Vista (2.55 MW).
Structure Infra Co developed the project under the BOO mode and signed PPA with Electra. The operation and maintenance contract was provided to Vestas .
Financing
Cabeólica’s investments are based on the Project Financing scheme with 30%-70% equity-debt ratio. The PPP had a key role in establishing the financing by facilitating the long-term PPA with Electra, and by providing the supporting guarantees and tax exemptions.
InfraCo Limited, as the main developer of the project, created the dynamics behind the financial project by identifying investors to take the risk of investment and assuming a shareholding position, as well as, identifying international financial institutions to assume the financing.
The main investors (Africa Finance Corporation; Finnish Fund for Industrial Cooperation and InfraCo Limited) invested roughly € 20 million.
The main lenders were the European Investment Bank and the African Development Bank. They provided loans of roughly € 45 million in total.
2. UTE wind farm project
Title UTE wind farm project
Location Uruguay
Stakeholders Public Sector: ƒ Administración Nacional de Usinas y Transmisiones Eléctricas, UTE Private Sector: ƒ Selected through bidding process
Structure Uruguayan government, through its public utility UTE, has decided to award the construction of 450 MW of wind power capacity. After commissioning, UTE will lease the wind farms. The private partners will assume the responsibilities of services and maintenance. After five years, the public utility has the option to buy the farms. It illustrates the typical case of Design-Build-Finance-Operate-Transfer(DBFOT) . Also, the public utility can extend the leasing for a further 15 years, at the same time extending the service contracts for a maximum of nine years.
Financing
The wind farms will be financed by the private partners. No special options will be offered for financing the projects, as market conditions are deemed sufficiently attractive.
However, tax exemptions for project developers do exist.
Moreover, incentives for early commissioning of the wind farms will be available.
3. Wind power complexes in Brazil
Title Development of wind power complexes in Brazil

Annexure: A few other case studies- PPP in Wind & Solar
Location Brazil
Stakeholders Public Sector:
Eletrobrás – A major Brazilian power utility, it’s also Latin America’s biggest power utility company, tenth largest in the world and also the fourth-largest clean energy company in the world. The Brazilian federal government owns 52% of the stock of Eletrobrás.
ANEEL (Brazilian Electricity Regulatory Agency)
Energy Research Enterprise (EPE) Private Sector:
Companies that participated in the bidding process
Structure The entire project development process was performed on the PPP mode wherein the structure of the PPP was Build-Own-Operate.
Financing The public entity provided financial assurance through the PPA for the period necessary to finance the project.
The regulatory agency provided a framework that guaranties stable and predictable cash flow from the PPAs.
Energy purchase guarantees were provided under the Brazilian Government’s PROINFA (Programme of Incentives for Alternative Energy Sources) incentive program. PROINFA, administered by the national power utility Eletrobrás, encourages the development of renewables
4. San Cristóbal – Galápagos 2.4-MW wind power project
Title San Cristóbal – Galápagos 2.4-MW wind power project
Location Ecuador
Stakeholders Public Sector: • The Ministry of Electricity and Renewable Energy of the Republic of Ecuador • Elegalapagos EP, the government-owned electricity utility for the Galápagos islands Private Sector: • Eólica San Cristóbal S.A. – EOLICSA: the owner and operator of the San Cristóbal Wind Power Project (selected through bidding process)
Structure The entire project development process was performed on the PPP mode wherein the structure of the PPP was Build-Own-Operate.
Financing Funds from the e8 companies with complementary financial support from United Nations Foundation (UNF) were provided as grants.
A commercial trust was structured to administer and manage the project funds. A private Ecuadorian financial agency was designated as the Trustee.
The Ecuadoran government contributed with financial resources from the FERUM Fund.
Ecuadoran law allowed the project to receive a percentage of income tax as voluntary donations from Ecuadoran taxpayers.
Interests earned by funds were also a component of the financial structure.
A small financial gap was filled with a short-term loan provided with UNF funds through UNDP.
5. 1000MW wind power project
Title Development of 1000MW wind power project
Location Portugal
Stakeholders Public Sector: • Directorate General of Energy and Geology (DGEG) • Energy Services Regulatory Authority- Regulatory Body looking after the renewable
sector regulations Private Sector: • ENEOP: the owner and operator of the 1000MW Wind Power Project (selected through bidding process)

Annexure: A few other case studies- PPP in Wind & Solar
Structure The entire project development process was performed on the PPP mode wherein the structure of the PPP was Build-Own-Operate.
Financing PPAs based on feed-in-tariff mechanism are in place to support the financing of the project.
6. 25MW wind energy project in the state of Rajasthan
Title Setting up commercial 25MW wind energy project in the state of Rajasthan
Location India
Stakeholders Railway Electricity Management Company (REMC)- JV between RITES and Indian Railways; Original Equipment Manufacturer(OEM) supplier selected through bidding
Structure The Original Equipment Supplier selected through the bidding process would own the land in the identified state and perform the EPC work. The O&M contract was executed between GAIL and the selected OEM provider.
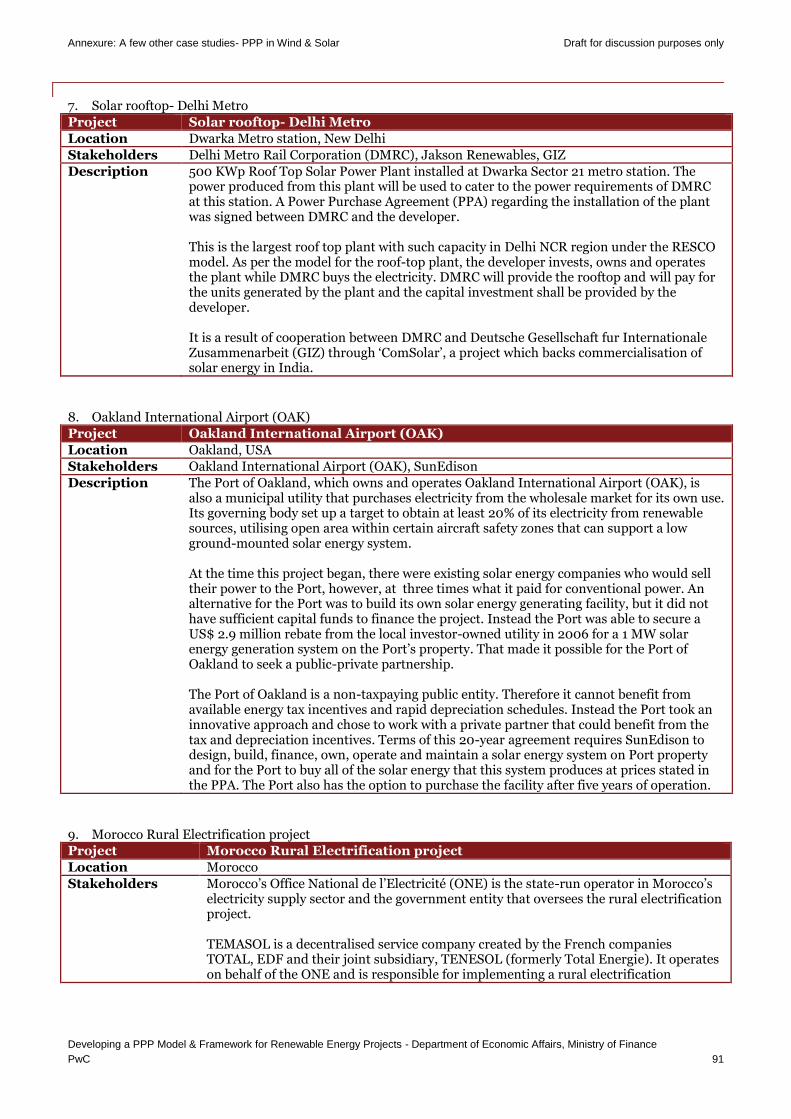
Annexure: A few other case studies- PPP in Wind & Solar Draft for discussion purposes only
Developing a PPP Model & Framework for Renewable Energy Projects - Department of Economic Affairs, Ministry of Finance
PwC 91
7. Solar rooftop- Delhi Metro
Project Solar rooftop- Delhi Metro
Location Dwarka Metro station, New Delhi
Stakeholders Delhi Metro Rail Corporation (DMRC), Jakson Renewables, GIZ
Description 500 KWp Roof Top Solar Power Plant installed at Dwarka Sector 21 metro station. The power produced from this plant will be used to cater to the power requirements of DMRC at this station. A Power Purchase Agreement (PPA) regarding the installation of the plant was signed between DMRC and the developer. This is the largest roof top plant with such capacity in Delhi NCR region under the RESCO model. As per the model for the roof-top plant, the developer invests, owns and operates the plant while DMRC buys the electricity. DMRC will provide the rooftop and will pay for the units generated by the plant and the capital investment shall be provided by the developer. It is a result of cooperation between DMRC and Deutsche Gesellschaft fur Internationale Zusammenarbeit (GIZ) through ‘ComSolar’, a project which backs commercialisation of solar energy in India.
8. Oakland International Airport (OAK)
Project Oakland International Airport (OAK)
Location Oakland, USA
Stakeholders Oakland International Airport (OAK), SunEdison
Description The Port of Oakland, which owns and operates Oakland International Airport (OAK), is also a municipal utility that purchases electricity from the wholesale market for its own use. Its governing body set up a target to obtain at least 20% of its electricity from renewable sources, utilising open area within certain aircraft safety zones that can support a low ground-mounted solar energy system. At the time this project began, there were existing solar energy companies who would sell their power to the Port, however, at three times what it paid for conventional power. An alternative for the Port was to build its own solar energy generating facility, but it did not have sufficient capital funds to finance the project. Instead the Port was able to secure a US$ 2.9 million rebate from the local investor-owned utility in 2006 for a 1 MW solar energy generation system on the Port’s property. That made it possible for the Port of Oakland to seek a public-private partnership. The Port of Oakland is a non-taxpaying public entity. Therefore it cannot benefit from available energy tax incentives and rapid depreciation schedules. Instead the Port took an innovative approach and chose to work with a private partner that could benefit from the tax and depreciation incentives. Terms of this 20-year agreement requires SunEdison to design, build, finance, own, operate and maintain a solar energy system on Port property and for the Port to buy all of the solar energy that this system produces at prices stated in the PPA. The Port also has the option to purchase the facility after five years of operation.
9. Morocco Rural Electrification project
Project Morocco Rural Electrification project
Location Morocco
Stakeholders Morocco’s Office National de l’Electricité (ONE) is the state-run operator in Morocco’s electricity supply sector and the government entity that oversees the rural electrification project. TEMASOL is a decentralised service company created by the French companies TOTAL, EDF and their joint subsidiary, TENESOL (formerly Total Energie). It operates on behalf of the ONE and is responsible for implementing a rural electrification

Annexure: A few other case studies- PPP in Wind & Solar Draft for discussion purposes only
Developing a PPP Model & Framework for Renewable Energy Projects - Department of Economic Affairs, Ministry of Finance
PwC 92
program in 24 Moroccan provinces. TEMASOL sells domestic energy services based on photovoltaic kits to the rural populations.
Description Morocco’s Office National de l’Electricité (ONE) is the state-run operator in Morocco’s electricity supply sector and the government entity that oversees the rural electrification project.
The private operator is a Renewable Energy Service Company (RESCO), responsible for the installation and maintenance of solar equipment as well as the collection of users’ fees in twenty-four of Morocco’s 62 prefectures and provinces. In order to ensure the viability and sustainability of the project, the government and the operator agreed to a fee-for-service business model. The customers pay an initial connection fee and a monthly service fee determined by the type of service that they receive. ONE provides an equipment subsidy that enables the partnership to offer electrical service at affordable rates, by offsetting the high installation and maintenance costs associated with solar home systems
10. Sheikh Mohammed bin Rashid Al Maktoum Solar Park
Project Sheikh Mohammed bin Rashid Al Maktoum Solar Park
Location Dubai
Stakeholders The Supreme Council of Energy, Dubai Electricity and Water Authority (DEWA), First solar
Description The Dubai Integrated Energy Strategy 2030 includes a plan to diversify energy sources, so that renewable sources of energy provide 1% of Dubai’s total energy output by 2020. By 2030, this will increase to 5%, with 12% coming from nuclear energy, 12% from clean coal and the remaining percentage from gas.
The solar park was implemented by Dubai’s Supreme Council of Energy and is managed and operated by the DEWA, the state-owned power company. First Solar was also selected to provide Operations and Maintenance (O&M) services until 2015.
The Government of Dubai will partner with a private company to invest AED 700 million (USD 190 million) for the development of Phase 2 of the solar park. The local government will form a partnership with a private company. The Dubai government will own a 51% stake in the solar park project.
Design Basis Report for 1000 MW Development of Solar Power Park and the Project is jointly Funded by the members of The Supreme Council of Energy.
11. Marawi City Solar Photovoltaic Power Park
Project Marawi City Solar Photovoltaic Power Park
Location Philippines
Stakeholders Marawi local government, Lim Solar Philippines, subsidiary of Mendoza Solar Company
Description The local government provided the 30 hectares of land and another 50 hectares that will be transformed into the Marawi City Solar PV Park in the rolling hills of Barangays Malimono and Matampay-Cormatan, which will get 40% of the earning.
Cheap electricity rate is possible under the Feed-in Tariff (FIT) payments from the national government under the Renewable Energy Law. Consumers in Marawi City will be exempted from paying the purchased power component – a reduction in the electricity rate from the present PhP 6 per kilowatt hour to only PhP 3 per kilowatt hour.
The government will be the one paying Mendoza Company while guaranteeing that Marawi City government will get its share. Upon the full commercial operation of the 35MW solar PV power plants, the people of Marawi City will be paying the lowest electric rates in the entire Philippines.
The Islamic City of Marawi (ICOM) Solar PV Power Park is estimated to provide income

Annexure: A few other case studies- PPP in Wind & Solar Draft for discussion purposes only
Developing a PPP Model & Framework for Renewable Energy Projects - Department of Economic Affairs, Ministry of Finance
PwC 93
to the Marawi Local Government of around P50 million per year for 20 years, which would supplement the Internal Revenue Allotment (IRA) the ICOM is receiving from the national government.
12. NED Solar farm
Project NED Solar farm
Location Thailand
Stakeholders The facility is located in central Thailand and is being developed and operated by Natural Energy Development Co., Ltd. (NED). NED is in a joint venture between Electricity Generating Public Company Limited (EGCO) of Thailand, the Thai division of Hong Kong-based China Light and Power (CLP) and Mitsubishi. Black & Veatch is the owner’s Engineer. The consortium of SHARP, Ital Thai Development and Ital Thai Engineering was contracted to provide engineering, procurement and construction services within an 18-month long construction schedule.
Description NED is the project sponsor with financing from ADB and Thai banks for the 84 MW solar farm. Power off-taker is Provincial Electricity Authority via a 5-year automatically renewable PPA, structured under the Thai Government’s Small Power Producer (“SPP”) Program. Over THB5 billion of project debt was funded by Asia Development Bank, Bangkok Bank, Siam Commercial Bank and Kasikorn Bank under a non-recourse project financing facility. The financing package has been recognized by project finance and Alpha magazine as project finance of the year. The plant has signed long-term power purchasing agreements to sell power to the Electricity Generating Authority of Thailand and an additional 5 MW to the Provincial Electricity Authority at a fixed rate of B8 per kWh in addition to the wholesale tariff for the first 10 years of operations.
Government is not an owner of the Project Company and thus is not directly involved in Project governance or management However, Government plays a critical role in acting as Offtaker, administering the SPP Program, and providing tax concessions and incentives(through the Thai Board of Investment).

Annexure: A few other case studies- PPP in Wind & Solar Draft for discussion purposes only
Developing a PPP Model & Framework for Renewable Energy Projects - Department of Economic Affairs, Ministry of Finance
PwC 94
Awarded
Projects
Commissio nod
out a awarded
NIT issued
but yet to
be awarded
NIT yet to
be issued
1 APEPDCL Andhra Pradesh SPV 57 1 365 57 2225 2225 1694.2 1660.58 1660.58 57 57 0 0 1195
2 APNPDCL Andhra Pradesh SPV 39 2 202 78 1275 1275 960.69 925.88 925.88 39 31 0 0 250
3 BSHPC Bihar41
projects
are
48 2 1558 175 16138 10143 3784.64 0 3784.64 0 0 48 0 1095
4 CREDA Chhattisgarh SPV 19 2 232 50 1440 1440 1052.67 0 1052.67 10 10 9 0 279
5 MPUVNL Madhya Pradesh SPV 44 4 762 155 3802 3157 2882.92 3987.53 3987.53 44 0 0 0 0
6 UPNEDA Uttar Pradesh SPV 7 2 79 7 500 351 323.72 0 323.72 0 0 7 0 0
7 UPNEDA Uttar Pradesh SPV 14 2 973 55 6491 3050 3733.93 0 3733.93 0 0 14 0 0
8 UPNEDA Uttar Pradesh SPV 41 1 588 41 3758 1420 2351.97 0 2351.97 0 0 41 0 0
9 UREDA Uttarakhand Small 2 2 300 10 460 293 480.91 484.7 484.7 2 0 0 0 127
10 APCPDCL Andhra Pradesh SPV 9 2 72 9 298 298 240.64 315.77 315.77 9 0 0 0 011 APSPDCL Andhra Pradesh SPV 11 1 143.5 11 1035 1035 469.44 0 469.44 0 0 11 0 012 DVC Jharkhand SPV 43 3 518 89 2367 1510 2090.91 0 2090.91 0 0 0 43 013 AVVNL Rajasthan SPV 10 2 140 10 503 370 428.11 0 428.11 0 0 10 0 014 MeECL Meghalaya SPV 3 1 154 3 751 248 389.4 0 389.4 0 0 0 3 0
15HESCOM
(14),Karnataka SPV 16 3 261.5 65 1019 970 880.54 0 880.54 0 0 14 2 0
16 CESC Karnataka SPV 25 3 390 30 1716 1598 1229.24 0 1229.24 0 0 25 0 017 APEPDCL Andhra Pradesh SPV 194 2 894 194 5592 5592 3381.68 4448.69 4448.69 194 0 0 0 018 KSEB Kerala SPV 15 1 131.5 15 731 730 531.83 0 531.83 0 0 15 0 019 MESCOM Karnataka SPV 42 4 225.5 98 1453 1453 868.08 0 868.08 0 0 0 42 0
20 CESCL Karnataka Wind &
Solar PV10 2 138.2 11 828 818 612 0 612 0 0 10 0 0
21 MPUVNL Madhya Pradesh SPV 7 1 120 7 373 357 278 0 278 0 0 0 7 0
22 AVVNL Rajasthan SPV 31 1 400.5 31 1313 1069 1412 0 1412 0 0 31 0 023 JVVNL Rajasthan SPV 1 1 14.5 1 61 56 51 0 51 0 0 0 1 024 CREDA Chhattisgarh SPV 80 3 523 81 3923 3923 2431 0 2431 80 76 0 0 1422.1425 OREDA Odisha SPV 7 1 65.5 7 268 43 197 0 197 0 0 0 7 0
504 31 4191.7 662 22231 20070 15490.87 4764.46 16633.01 283 76 116 105 1422.14
26 775 49 9251 1290 58320 43424 32756.52 11823 34938.6 435 174 235 105 4368
XII PLAN PROJECTS
Total (XII Plan Projects)
Grand Total (XI + XII
Plan)
DDG: Status of Sanctioned DDG projects (As on 31.08.2014)
Effective
project
cost
Status of Implementation (No. of Projects) Fund
Released
(Rs. In
Lakh)
XI PLAN PROJECTS
Total (XI Plan Projects) 271 18 5059 628 36089 23354 17265.65 7058.69 18305.62 152 98 119 0 2946
Capaci
ty
(KW)
Villages/
Ham
lets
covered
No.of
Household
s
covered
(Incl.
BPL)
No.of BPL
Househol
ds
covered
Sanctioned
Project Cost
(Rs.in
Lakhs)
Revised
Project
Cost (Rs.in
Lakhs)
S.NoImplmenting
AgencyState
Technolo
gy
No. of
projects
No.of
Distri
cts